Article

Advancing the Role of Gamma-Tocotrienol as Proteasomes Inhibitor: A Quantitative Proteomic Analysis of MDA-MB-231 Human Breast Cancer Cells

by
Premdass Ramdas
1,2,
Ammu Kutty Radhakrishnan
3,
Asmahani Azira Abdu Sani
4,
Mangala Kumari
5,
Jeya Seela Anandha Rao
6 and
Puteri Shafinaz Abdul-Rahman
1,7,*
1
Department of Molecular Medicine, Faculty of Medicine, University of Malaya, 50603 Kuala Lumpur, Malaysia
2
Department of Medical Biotechnology, School of Health Sciences, International Medical University, 57000 Kuala Lumpur, Malaysia
3
Jeffrey Cheah School of Medicine and Health Sciences, Monash University Malaysia, Bandar Sunway, 47500 Selangor, Malaysia
4
Malaysian Genome Institute, National Institute of Biotechnology, 43000 Bangi, Malaysia
5
Division of Human Biology, International Medical University, 57000 Kuala Lumpur, Malaysia
6
Division of Pathology, International Medical University, 57000 Kuala Lumpur, Malaysia
7
University of Malaya Centre of Proteomics Research (UMCPR), University of Malaya, 50603 Kuala Lumpur, Malaysia
*
Author to whom correspondence should be addressed.
Submission received: 27 November 2019 / Revised: 12 December 2019 / Accepted: 14 December 2019 / Published: 21 December 2019
(This article belongs to the Special Issue Antitumor Agents from Natural Sources)

Abstract

:
Tocotrienol, an analogue of vitamin E has been known for its numerous health benefits and anti-cancer effects. Of the four isoforms of tocotrienols, gamma-tocotrienol (γT3) has been frequently reported for their superior anti-tumorigenic activity in both in vitro and in vivo studies, when compared to its counterparts. In this study, the effect of γT3 treatment in the cytoplasmic and nuclear fraction of MDA-MB-231 human breast cancer cells were assessed using the label-free quantitative proteomics analysis. The cytoplasmic proteome results revealed the ability of γT3 to inhibit a group of proteasome proteins such as PSMA, PSMB, PSMD, and PSME. The inhibition of proteasome proteins is known to induce apoptosis in cancer cells. As such, the findings from this study suggest γT3 as a potential proteasome inhibitor that can overcome deficiencies in growth-inhibitory or pro-apoptotic molecules in breast cancer cells. The nuclear proteome results revealed the involvement of important nuclear protein complexes which hardwire the anti-tumorigenesis mechanism in breast cancer following γT3 treatment. In conclusion, this study uncovered the advancing roles of γT3 as potential proteasomes inhibitor that can be used for the treatment of breast cancer.

1. Introduction

Breast cancer (BC) is the most common malignancy in women around the world. According to GLOBOCAN 2018, breast cancer is the most common cancer in women; accounting for 11.6% of all cancers [1]. In 2018, about 2.1 million newly diagnosed female breast cancer cases were reported worldwide, which accounts for about 1 in 4 breast cancer cases among women [1]. The same authors reported that there were 626,679 (6.6%) cases of deaths due to breast cancer worldwide [1]. Hence, the incidence of breast cancer in women worldwide was reported to be 24.2%, while the mortality rate was estimated to be 15% [1]. A similar trend was observed in the United States of America (USA) where the incidence rate of cancer was reported to have increased over the last decade. In 2018, there was a total of 1,735,350 new cancer cases and 609,640 cancer-related deaths in the USA [2]. These global breast cancer data confirmed that this malignancy is a leading concern across the globe and pose serious threats to the well-being of women worldwide. The rise in the incidences of breast cancer in these countries could be due to adverse life style changes, which increase the risk for this disease. The mortality of breast cancer in these regions is increasing, with a lack of proper diagnosis and therapy being the main reason [3]. The treatment options for a breast cancer patient can vary from one patient to another, depending on the tumor biology and sub-types (e.g., triple negative or HER2-positive). Surgery is still the mainstay of treatment in early breast cancer [4]. Cancer treatment modalities such as chemotherapy, radiotherapy, hormonal therapy, and surgery often cause major side-effects in the patients [5]. Some of the side-effects associated with breast cancer treatment can affect the quality of life of these patients, which can affect every part of their bodies. Furthermore, triple-negative breast cancers do not respond to hormonal therapy [6]. Traditional chemotherapy and radiotherapy can also kill normal healthy cells along with the cancer cells, which causes severe systemic syndrome such as nausea, pain, and lethargy [7]. These situations urge the researchers to find alternative strategies that can be used to effectively prevent and treat breast cancer with negligible side effects. One such a strategy is the use of bioactive natural compounds to combat carcinogenesis, especially those that selectively kill cancer cells while having beneficial effects for sustaining health.
Tocotrienols (T3), a member of the vitamin E family, consist of four naturally occurring isoforms, namely α-, β-, δ-, and γ-tocotrienols. Numerous evidences suggest that tocotrienols are effective anti-cancer bioactive compounds and its selectivity against cancer cells was demonstrated profoundly in both cell-based and animal studies. Studies have shown that tocotrienols were able to induce apoptosis in malignant cells, but not in non-malignant cells [8,9]. This selectivity could be largely due to the reduced antioxidant defense expressed by these malignant cells when compared to non-malignant cells [10] or might involve many other unknown factors. The selectivity of T3 for cancer cells might be dependent on the ability of the former to specifically target and downregulate proteins, which are abnormally upregulated in carcinogenic but not in normal cells. Research on tocotrienols offers a promising discovery as this compound has been reported to combat oncogenesis by targeting multiple cell signaling pathways [11].
One such important pathways that was explored in this study is the ubiquitin–proteasome pathway, which is one of the major regulatory system for intracellular protein degradation [12]. The ubiquitin–proteasome pathway plays a key role in cancer therapy. Proteasome inhibition was also reported to potentiate the anti-cancer efficacy of other chemotherapeutic drugs by decreasing the expression of anti-apoptotic proteins and increasing the levels of pro-apoptotic proteins [13]. Identification of novel compounds that can block the proteolytic activities in cancer cells by inhibiting the proteasomes is a potent strategy for cancer prevention and treatment [14]. As such, this research was embarked to identify differentially expressed proteins in MDA-MB-231 cells exposed to gamma-tocotrienol (γT3) treatment, using label-free quantitative proteomics and functional bioinformatics strategies to get into the novel insights of anti-cancer mechanisms of γT3 and its potential therapeutic strategies for breast cancer.

2. Materials and Methods

2.1. Cell Line and Treatment Conditions

The MDA-MB-231 cells were grown in T75 flasks in Dulbecco’s Modified Eagle Medium (DMEM) supplemented with 10% Fetal Bovine Serum (FBS) in a humidified atmosphere of 5% carbon dioxide in air at 37 °C, until it reaches 70–90% confluency. A total of 5 × 10⁵ cells were seeded in T75 flask containing 10 mL of complete media. Following cell adherence, the cells were treated with IC50 concentration, 5.8 µg × mL−1 of γT3, as established previously [15]. Following 24 h of γT3 treatment, the cells were washed with 1× PBS solution. A cell scrapper was used to dislodge the attached cells. The cells were collected in 5 mL PBS and washed with two volumes of ice-cold PBS and centrifuged at 250 × g for 5 min at 4 °C. The supernatant was discarded, and the pellets were resuspended in 40 mL of ice-cold PBS and centrifuged as before. The washing step was repeated twice. The pellet was subjected to two separate processing steps to extract (i) cytoplasmic proteins and (ii) nuclear proteins.

2.2. Extraction of Protein Fractions

2.2.1. Isolation of Cytoplasmic Fraction

The cytoplasmic protein fractions were extracted using the CHEMICON®’s cytosol protein fraction extraction kit (USA-Catalog No. 2900), according to the manufacturers protocol [16]. In brief, five times the pellet volume of ice-cold 1x cytoplasmic lysis buffer containing 0.5 mM DTT and 1/1,000 dilution of inhibitor cocktail were added to the pellet. The cell pellet was resuspended by gently inverting the tube and was incubated on ice, for 15 min. Following this step, the cell pellet suspension was centrifuged at 250 × g for 5 min at 4 °C. The supernatant was discarded, and the cell pellet was resuspended in two volumes of ice-cold 1x cytoplasmic lysis buffer. Using a syringe with a small gauge needle (27 G), the prepared cell suspension was drawn from a sample tube and the contents were ejected back into the sample tube. These steps (drawing and ejecting) were repeated approximately five times. The disrupted cell suspension was centrifuged (8,000 × g for 20 min at 4 °C) and the supernatant, which contains the cytosolic portion of the cell lysate was transferred to a fresh tube and was used for cytoplasmic proteome analysis.

2.2.2. Isolation of Nuclear Fraction

The nuclear pellet from the cytoplasmic protein extraction step was resuspended in 2/3 of the original cell pellet volume of ice-cold nuclear extraction buffer containing 0.5 mM DTT and 1/1,000 protease inhibitor cocktail. Using a fresh syringe, with a 27-gauge needle, the pellet was drawn and ejected into the tube to disrupt the nuclei. Using a rotator or orbital shaker (low speed), the nuclear suspension was gently agitated at 4 °C for 30–60 min. The nuclear suspension was then centrifuged at 16,000 × g for 5 min at 4 °C. The resulting supernatant, which contained the nuclear proteins, was transferred to a fresh tube and used for nuclear proteomic analysis.

2.3. Determination of Protein Concentration and Trypsin Digestion

The concentration of the extracted protein was determined by a bicinchoninic acid (BCA) assay and bovine serum albumin (BSA) was used as a protein standard for the calibration curve. Approximately 100 µg of total protein was suspended in 100 ul of 50 mM ammonium bicarbonate (pH 8.0) containing 0.05% RapiGest (Waters Corporation, Milford, MA). The solution was incubated at 80 °C for 15 min. Protein was reduced in the presence of 5 mM dithiothreitol (DTT) at 60 °C for 30 min. The protein was alkylated in the dark in the presence of 10 mM iodoacetamide at room temperature, for 45 min. Proteolytic digestion was initiated by adding a trypsin gold at a concentration of 100:0.25 (protein to trypsin) and was incubated at 37 °C overnight. Tryptic digestion and RapiGest activity were terminated by adding a 1 µL concentrated trifluoroacetic acid (TFA) incubated at 37 °C for 20 min. The tryptic peptide solution was centrifuged at 14,000 rpm for 20 min and the supernatant was transferred into a clean microcentrifuge tube and kept at −80 °C until further analysis.

2.4. Liquid Chromatography and Mass Spectrometry Analysis

Digested peptides were analyzed by The DionexTM UltimateTM 3000 RSLCnano from Thermo ScientificTM. The peptides were desalted and concentrated in a trapping column C18 PepMapTM 100, 5µm, 100Å and were separated by Easy-SprayTM LC Column Acclaim PepMapTM C18 75µm id × 25 cm, with a 40% acetonitrile gradient over 120 min, at a flow rate of 300 nL/min. Each sample was injected in triplicates. All spectra were acquired on an Orbitrap Fusion (Thermo ScientificTM) in data-dependent mode, with positive ionization. Full scan spectra were collected at a resolution of 120,000, with an automated gain control (AGC) target of 400,000, and the maximum injection time was 50 ms. The method consisted of a 3 s Top Speed Mode where the precursors were selected for a maximum 3 s cycle. Only precursors with an assigned monoisotopic m/z and a charge state of 2–7 were further analyzed for MS/MS. All precursors were filtered using a 20 s dynamic exclusion window and an intensity threshold of 5,000. The MS2 spectra were analyzed at a resolution of 60,000, with an AGC target of 100 and a maximum injection time of 250 ms. Precursors were fragmented by high-energy collision dissociation (HCD) and collision-induced dissociation (CID) at a normalized collision energy (NCE) of 28% and 30%.

2.5. Protein Identification and Label-Free Quantification

Data generated were processed using the Thermo ScientificTM Proteome DiscovererTM Software v2.1 with the SEQUEST® HT search engine. The MS ion intensities were calculated based on the accurate mass and time tag strategy. The accurate alignment of the detected LC retention time and the m/z value across different analyses and the area under the chromatographic elution profiles of the identified peptides could be compared among different samples. For protein identification, data were searched against a Uniprot® human (homo sapiens) database with a 1% FDR criteria using a Percolator®. Search parameters were set up to two missed cleavage with fixed modification of carbamidomethylation and variable modification of methionine oxidation, asparagine, and glutamine deamidation. A fragment tolerance of 0.6 Da and a precursor tolerance of 10 ppm were used with trypsin as a digestion enzyme. Identified protein with a SEQUEST® HT score more than 200 or an above 25% sequence coverage or one that had at least two unique peptides, implied a greater confidence in protein identity.

2.6. Data Acquisition and Statistical Analysis

Statistical analyses were performed using a Perseus Software v1.5.3.1 (Max Planck Institute of Biochemistry). Each control and treatment samples consisted of three biological replicates and each biological replicate were injected three times to the LC–MS/MS. Protein file with three technical replicates in text format (.txt) from Proteome DiscovererTM were uploaded to the Perseus. The data were log2-transformed to stabilize the variance and scale normalized to the same mean intensity across the technical replicates. The mean for the three biological replicates from the same samples were grouped together in the same matrix and filtered for the valid values of at least two, to eliminate the protein that only presented in one biological replicate. Finally, all biological replicates from all samples were grouped under the same matrix and the missing values in the data were imputed with the random number that are drawn from a normal distribution. Normally the missing values represent a low abundance measurement. The histogram was plotted to get an impression of whether the ratio distributions are similar for all samples or not. Differently expressed protein between control and treatment were detected using a t-test. The p-value was adjusted for multiple-testing using the Benjamin–Hochberg false discovery rate. The Benjamin–Hochberg test was used as it is one of the powerful procedures that decreases the false discovery rate. Proteins were considered significant and differentially expressed between the two conditions, with an adjusted p-value < 0.05 and a t-test difference ≤ −1 or ≥ 1 (= 2-fold change).

2.7. Bioinformatics and Functional Analysis

2.7.1. Venn Diagram Analysis

The cytoplasmic and nuclear protein data sets were further analyzed using the Venn diagram analysis [17] to identify unique and overlapping proteins between the differentially expressed cytoplasmic and nuclear proteins, following exposure to γT3. The unique and overlapping differentially expressed cytoplasmic and nuclear proteins of γT3-treated MDA-MB-231 cells generated from this analysis were used to explicate related information that could be associated with the biological significance of these proteins.

2.7.2. Protein Set Enrichment Analysis

The DAVID (Database for Annotation, Visualization, and Integrated Discovery) bioinformatics resources [18,19] were used to perform enrichment analysis for the differentially expressed proteins. The Uniprot ID of differentially expressed proteins were uploaded into the DAVID bioinformatics resources. Enrichment terms were associated with the differential protein list and the total number of proteins involved in each term were generated along with the percentage of protein involved. Modified Fisher Exact p-value (EASE score) were generated for enrichment analysis. The output from the analysis were used to mine biologically meaningful information, based on their molecular functions and disease bio-pathways curated from KEGG [20,21] databases. The KEGG is an encyclopedia of genes and genomes used to assign functional meanings to gene/protein elements, both at the molecular and higher levels. The differentially expressed cytoplasmic and nuclear proteins were matched with KEGG pathway databases to generate predicted pathways.

2.7.3. STRING Protein–Protein Interaction Analysis

The functional classification and pathway analysis of significantly different proteins obtained for supernatant, nuclear, and cytoplasmic proteome were performed using the STRING (Search Tool for the Retrieval of INteracting Genes/Proteins) functional protein association network database [22]. The STRING database and its online resources were used to predict functional interactions between differentially expressed proteins, based on its physical binding and regulatory interactions. The protein–protein interactions were analyzed by uploading the uniprot IDs into the multiple protein analysis with Homo Sapiens selected from the organism drop-down option. The protein–protein interactions were assessed using network edges of evidence, confidence, and molecular action. The interactions were generated based on sources from text mining, experiments, databases, co-expression, neighborhood, gene fusion, and co-occurrence. The interaction score was set to high confidence (0.700) and the K-mean clustering were applied to the analysis to populate protein groups with similar interactions.

3. Results

3.1. Label-Free Mass Spectrometry Quantification of Cytoplasmic and Nuclear Proteins Isolated from MDA-MB-231 Cells following Treatment with γT3

Label-free quantification using the Orbitrap Fusion LC–MS/MS (Thermo ScientificTM) was able to identify cytoplasmic and nuclear proteins that are differentially expressed between γT3-treated and untreated conditions. The resulting proteomic dataset that constituted about 600 proteins were further filtered by fold-change differences, significant p-value and false discovery rate (FDR) adjusted p-value. From the MDA-MB-231 cells cytoplasmic fractions, a total of 112 proteins were identified to be differentially expressed in response to the γT3 treatment, when compared with the untreated control (Table 1). Among these differentially expressed cytoplasmic proteins, 60 proteins were up-regulated, and 52 proteins were down-regulated. As from the MDA-MB-231 cell nuclear fractions, a total of 79 proteins were identified to be differentially expressed in response to the γT3 treatment, when compared with the untreated control (Table 2). Among these differentially expressed nuclear proteins, 52 were upregulated and 27 were down-regulated by the treatment.

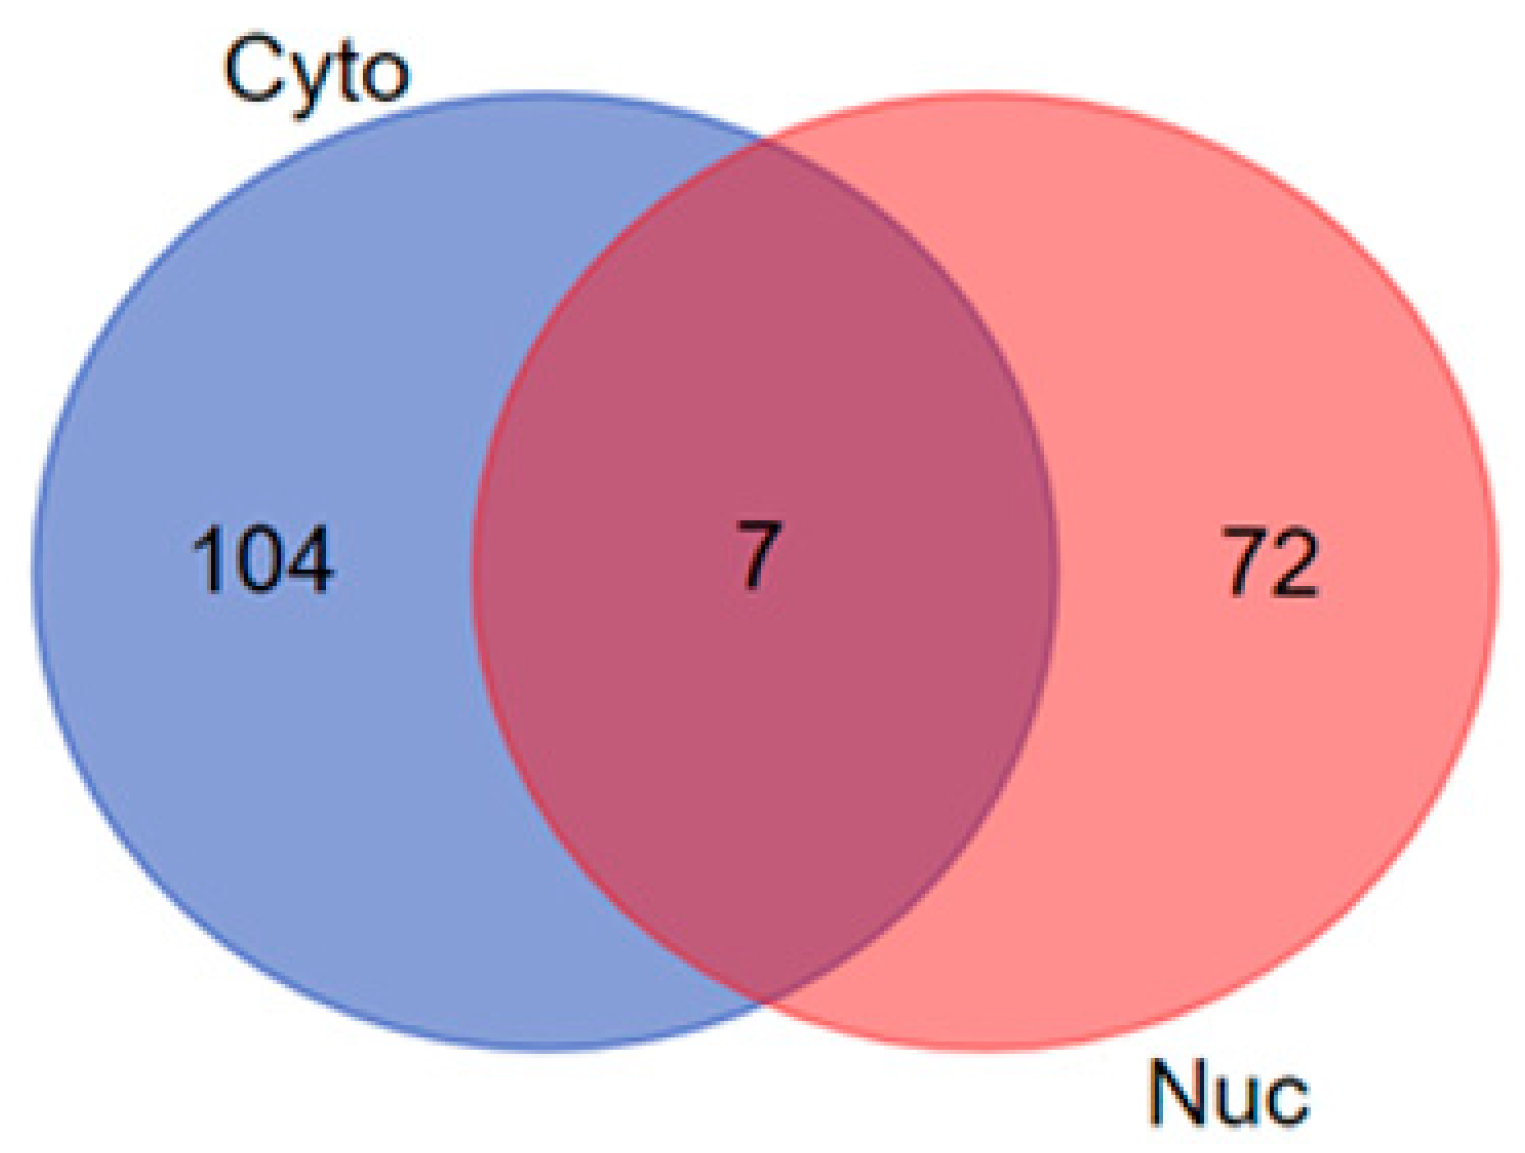
3.2. Venn Diagram Analysis

The cytoplasmic and nuclear protein data sets were further analyzed using Venn diagram analysis to identify unique and overlapping proteins between the differentially expressed nuclear and cytoplasmic proteins, following exposure to the γT3. This analysis identified the overlapping regions that illustrates the relations among the differentially expressed cytoplasmic and nuclear protein sets to define the areas of commonality among these two compartments. The Venn diagram analysis revealed a total 104 differentially expressed cytoplasmic and 72 differentially expressed nuclear proteins, respectively. There was a total of seven differentially expressed proteins that were common to both cytoplasmic and nuclear compartments (Figure 1). The list of the unique differentially expressed proteins in the union and intersections between different cytoplasmic and nuclear compartments of MDA-MB-231 information might be associated with the biological significance of these proteins and are shown in Table 3.

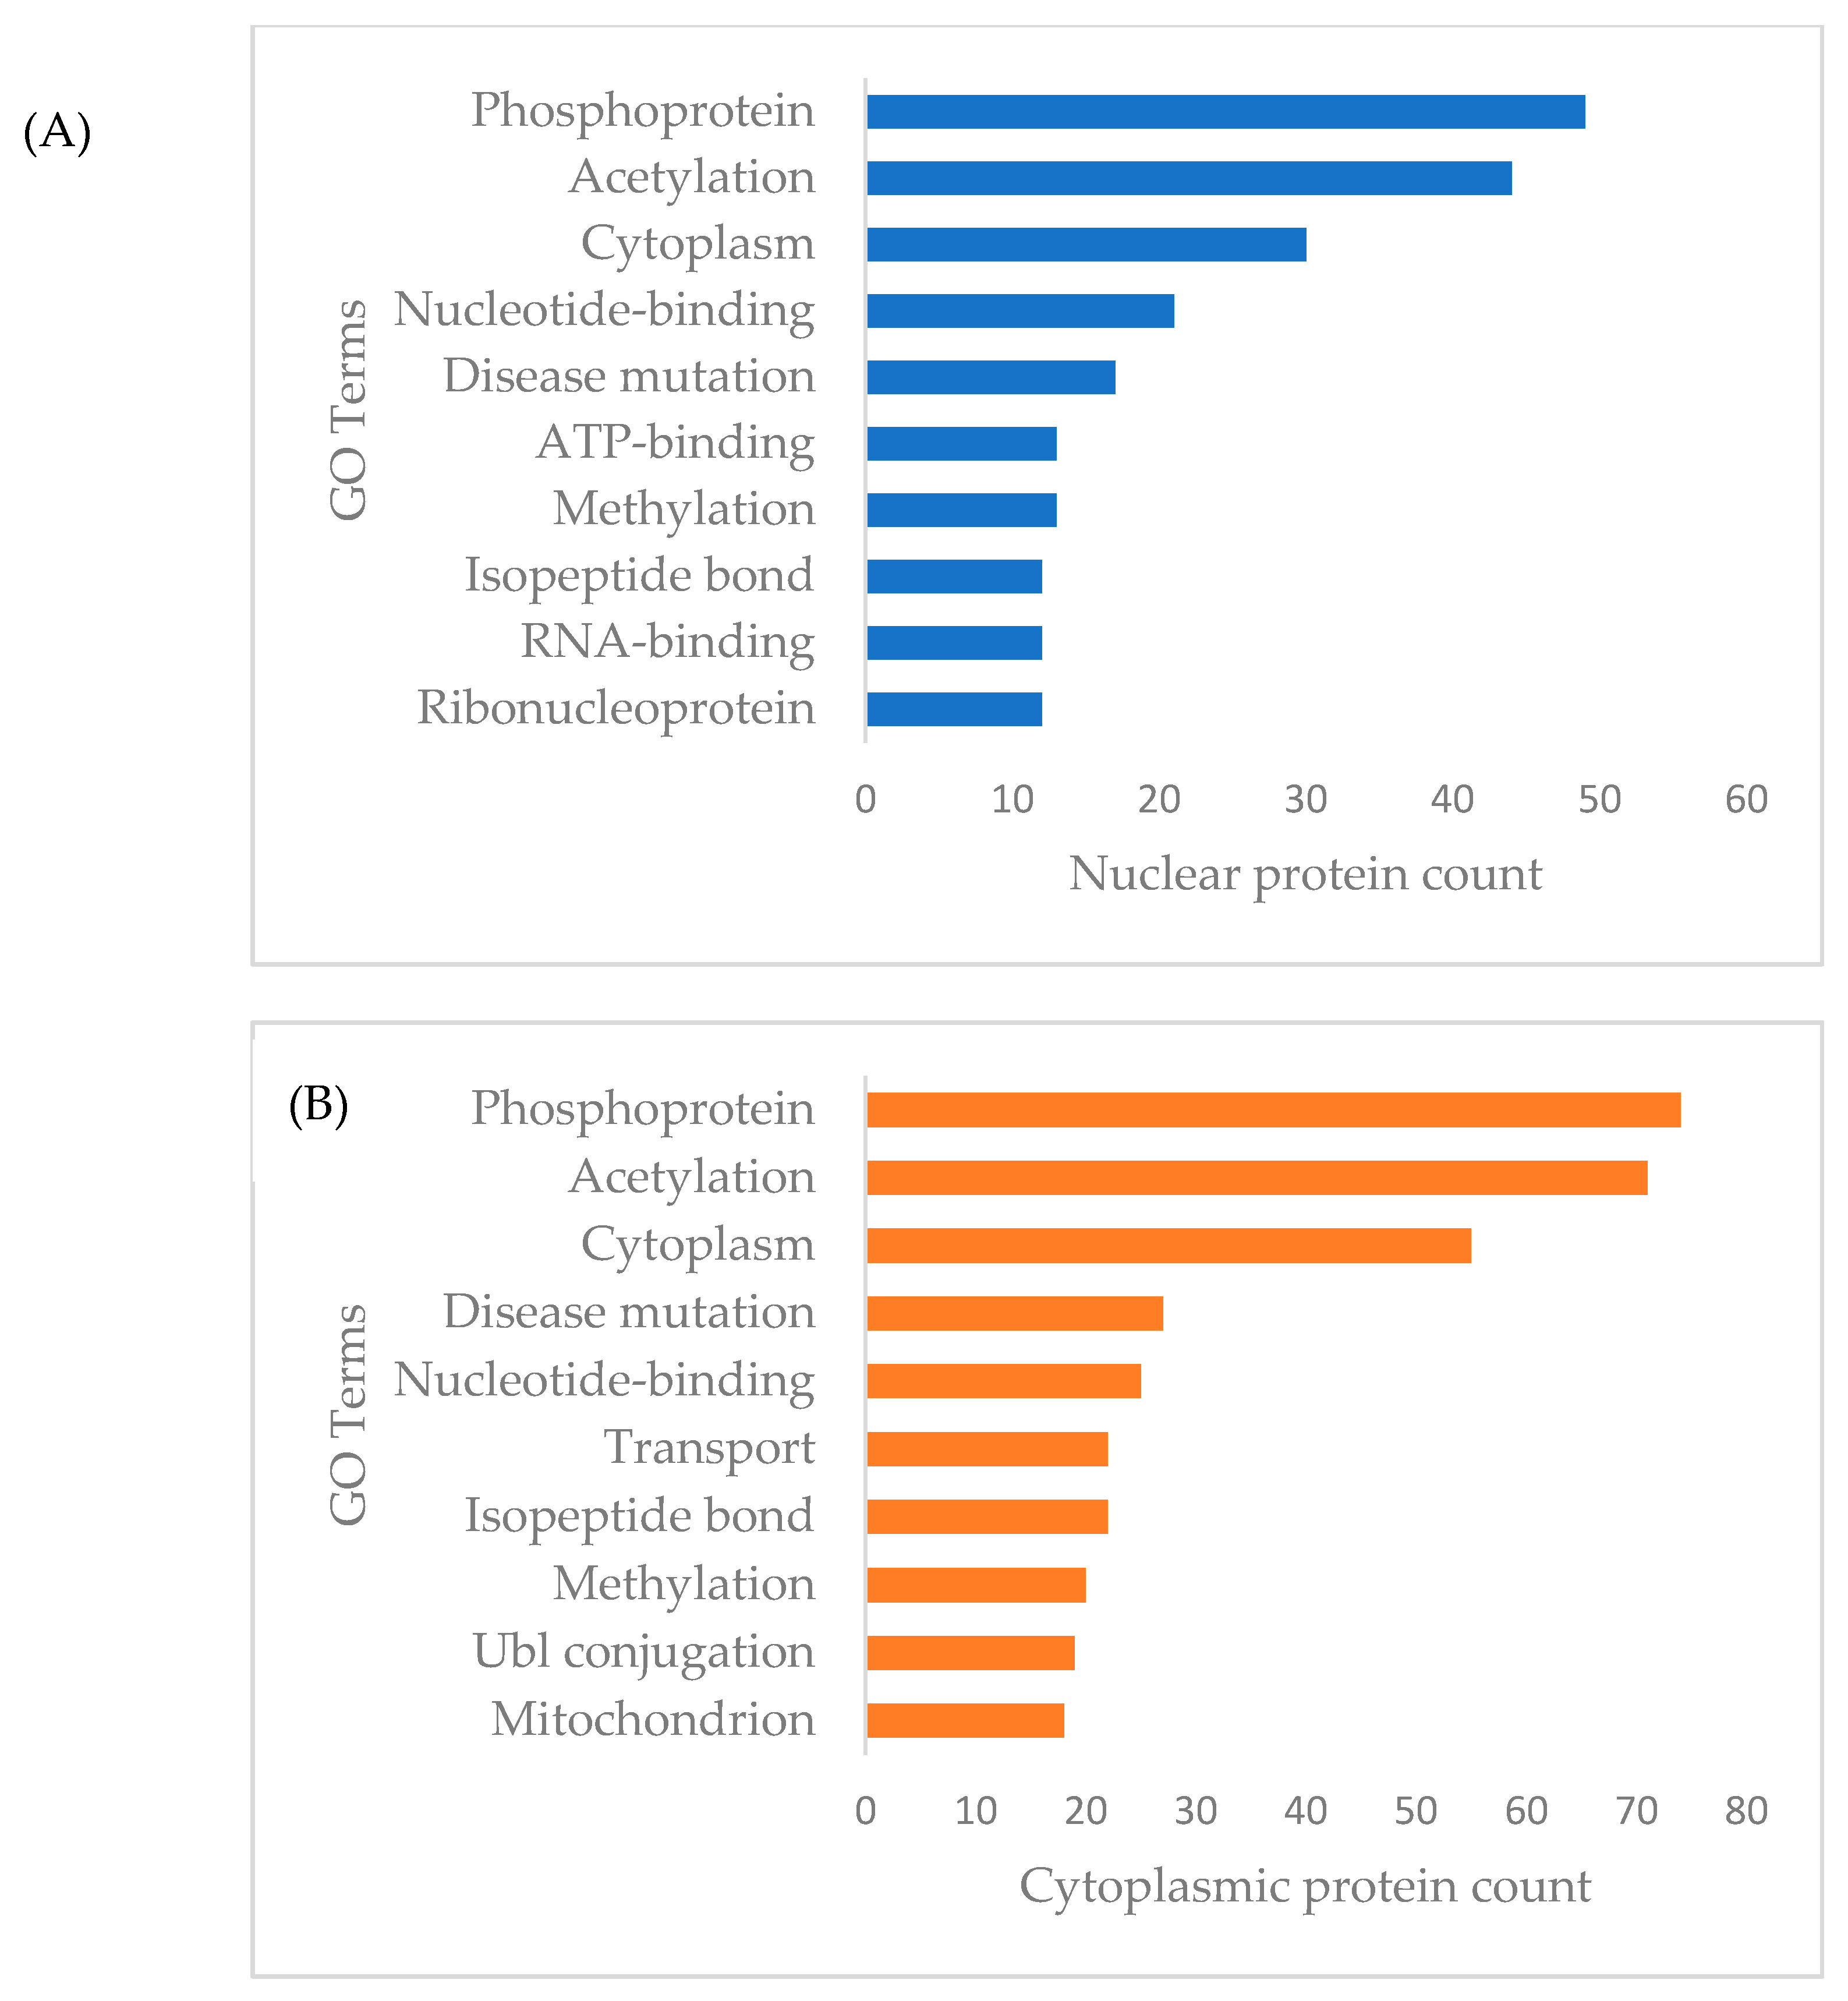
3.3. Functional Annotation and Pathway Enrichment of Differentially Expressed Proteins of Cytoplasmic and Nuclear Compartment

For the functional categories of differentially expressed cytoplasmic and nuclear proteins of MDA-MB-231 cells in response to γT3 treatment, the analysis revealed that most of these proteins were grouped under phosphoprotein, acetylation, and cytoplasm (Figure 2). Interestingly, there were a total of 74 differently expressed cytoplasmic proteins of MDA-MB-231 categorized as phosphoproteins, based on the DAVID analysis and these proteins might mediate γT3 induced post-translational modification. As for the functional categories of differentially expressed MDA-MB-231 nuclear proteins in response to the γT3 treatment, the analysis showed that most of these proteins are grouped under acetylation, nucleotide binding, ribonucleic, and transport proteins, which confirmed the nature of nuclear fraction used in this study (Figure 3). Interestingly, there were a total of 49 differentially expressed nuclear proteins of MDA-MB-231 categorized as phosphoproteins, based on the DAVID analysis and these proteins might mediate γT3 induced post-translational modification.

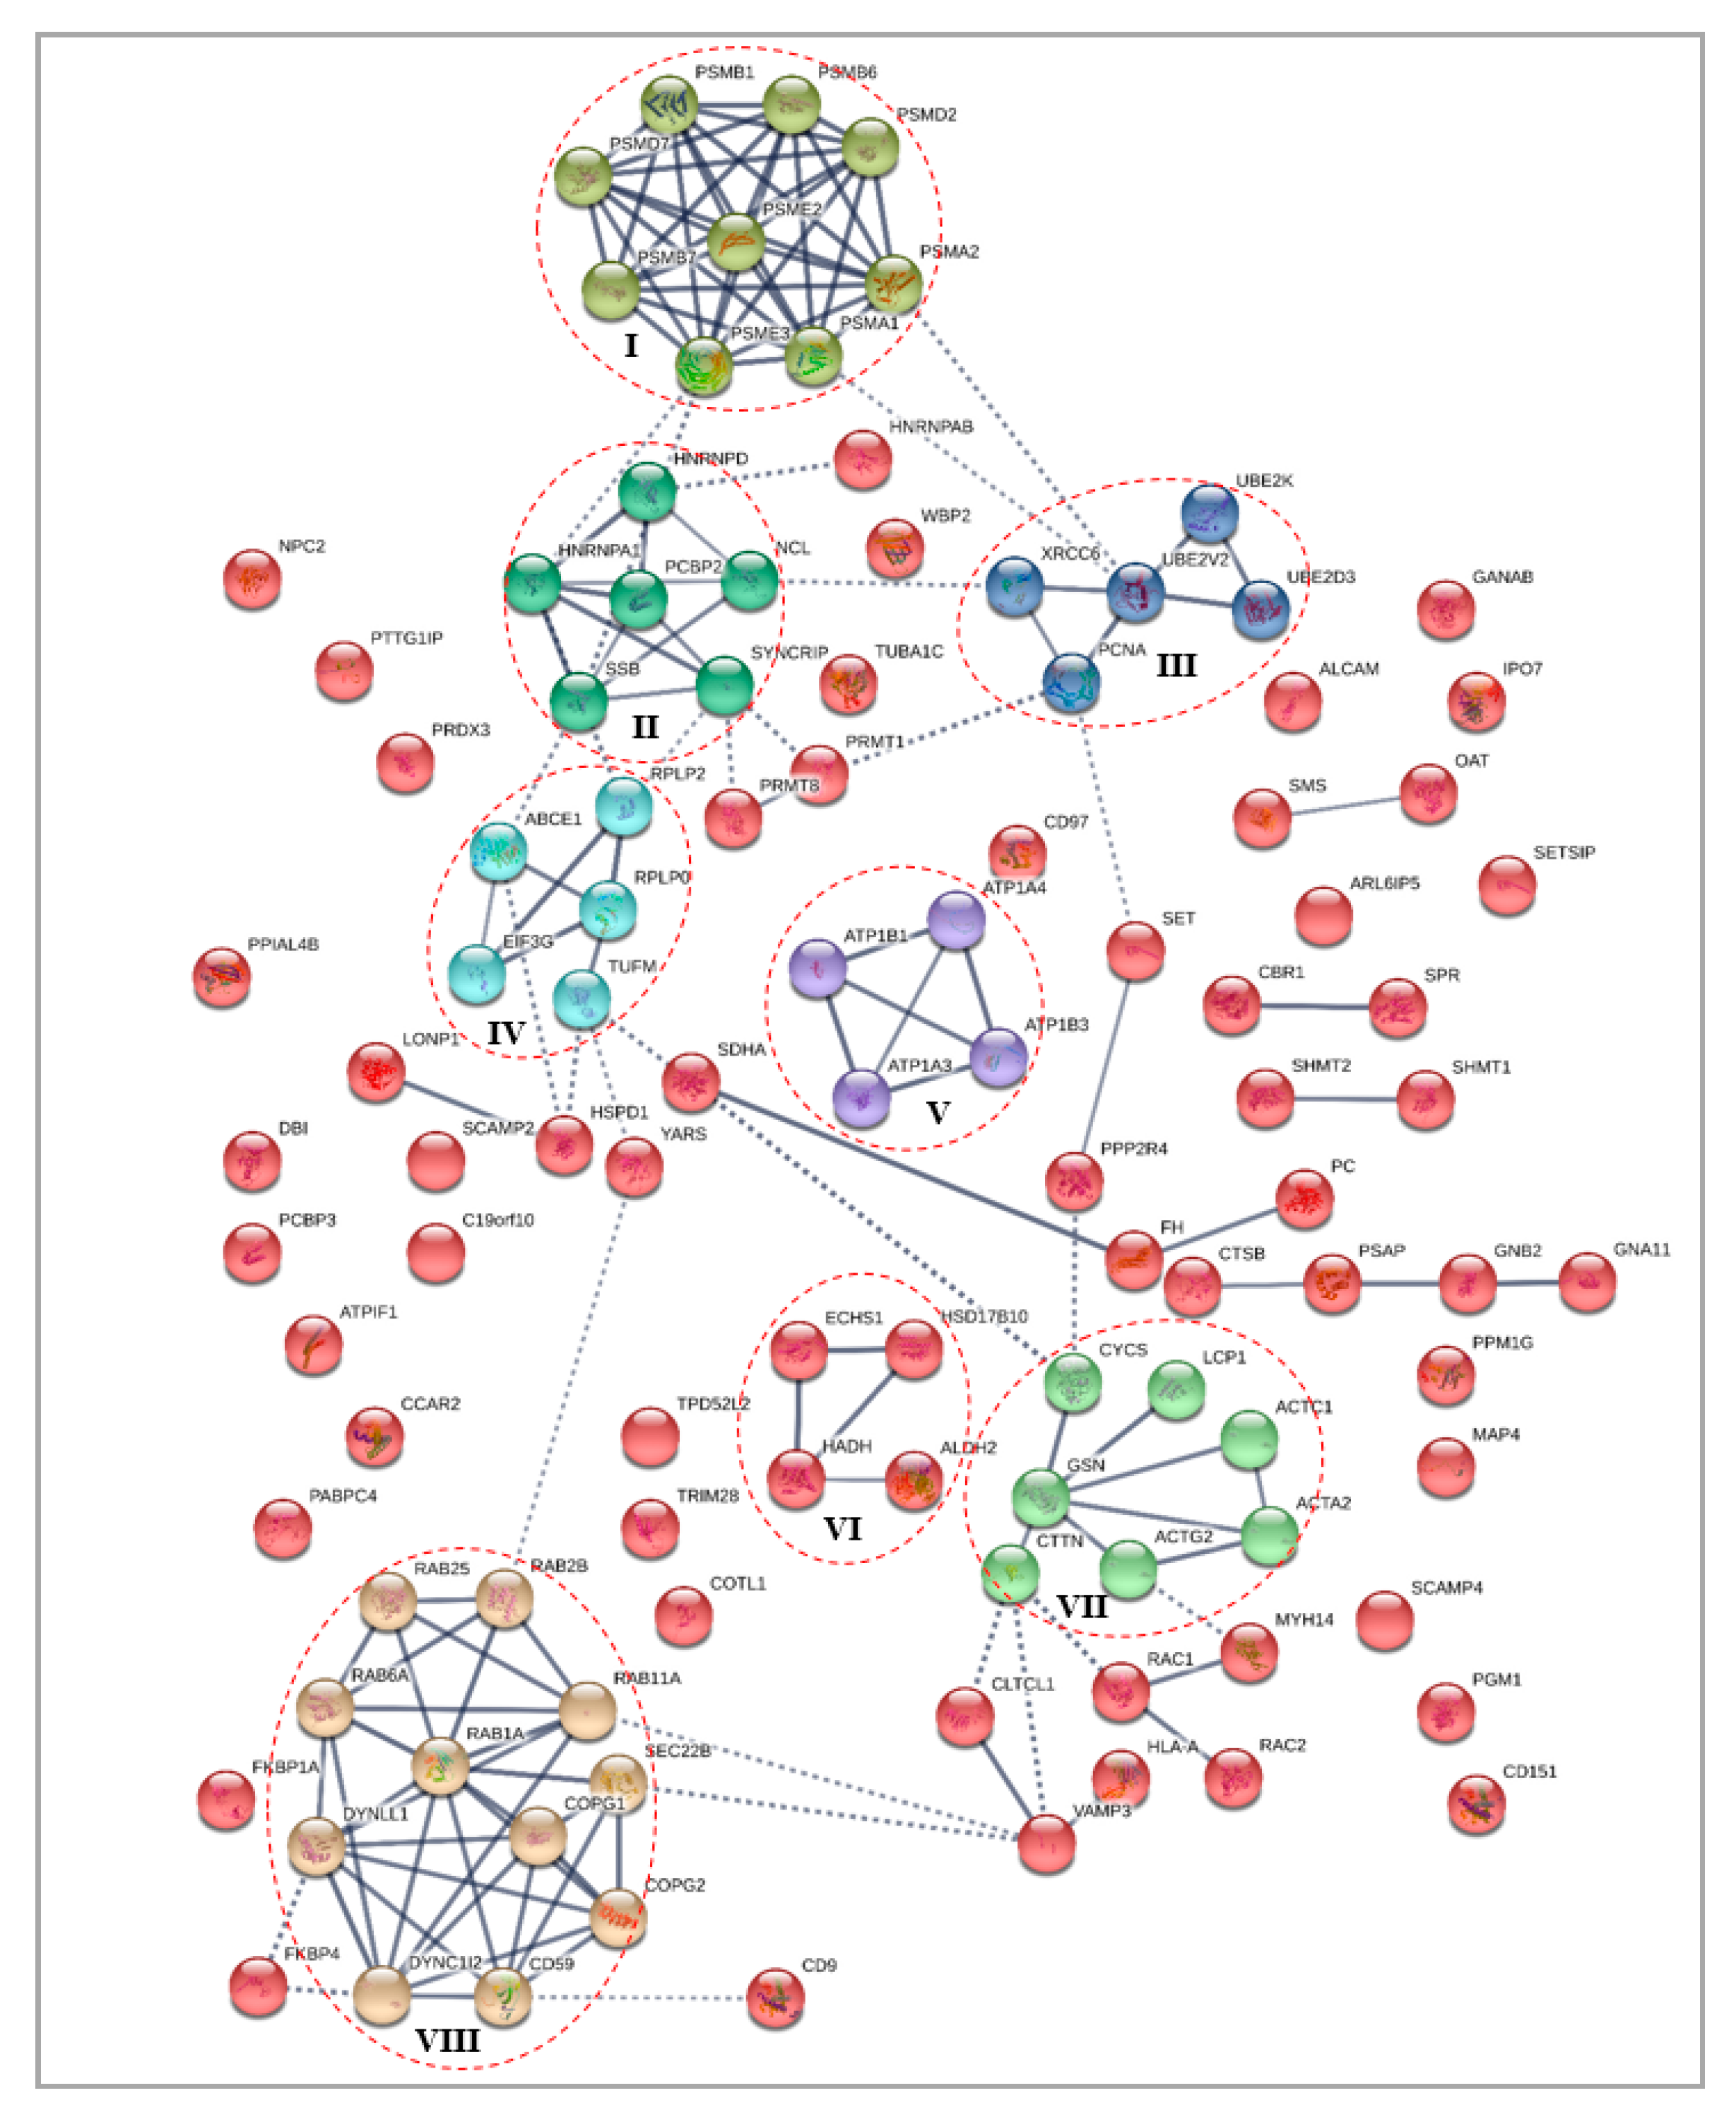
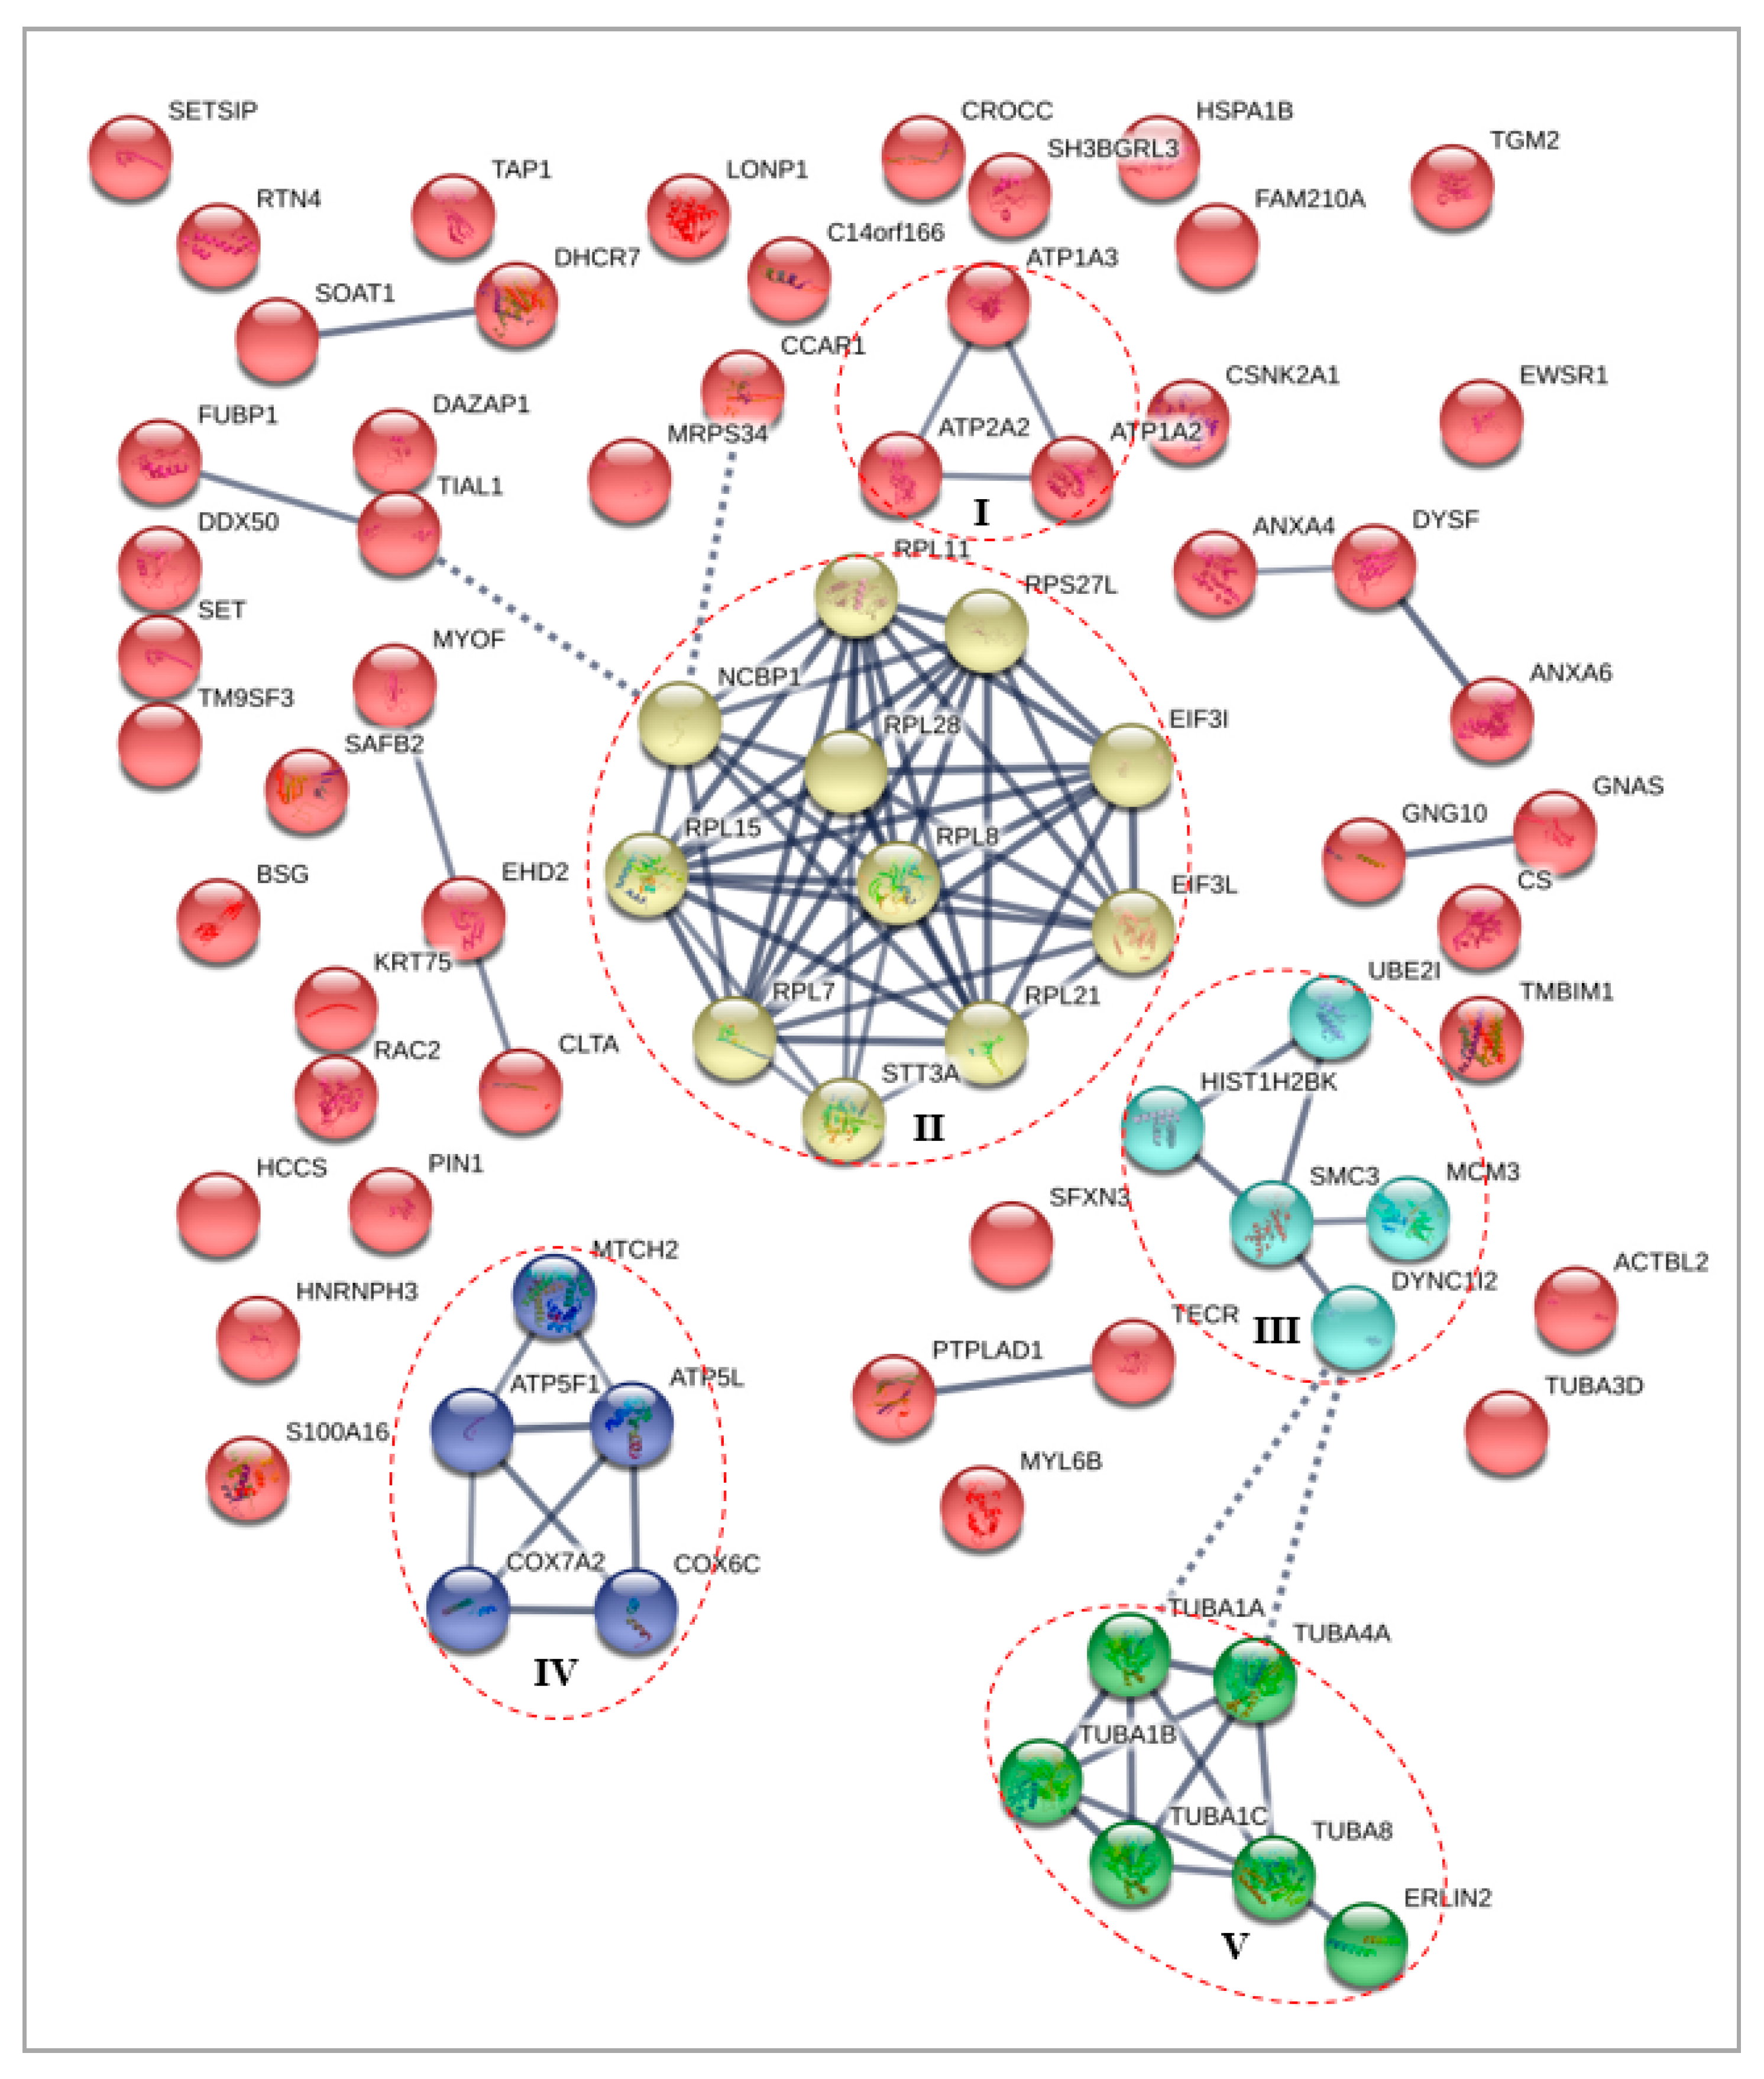
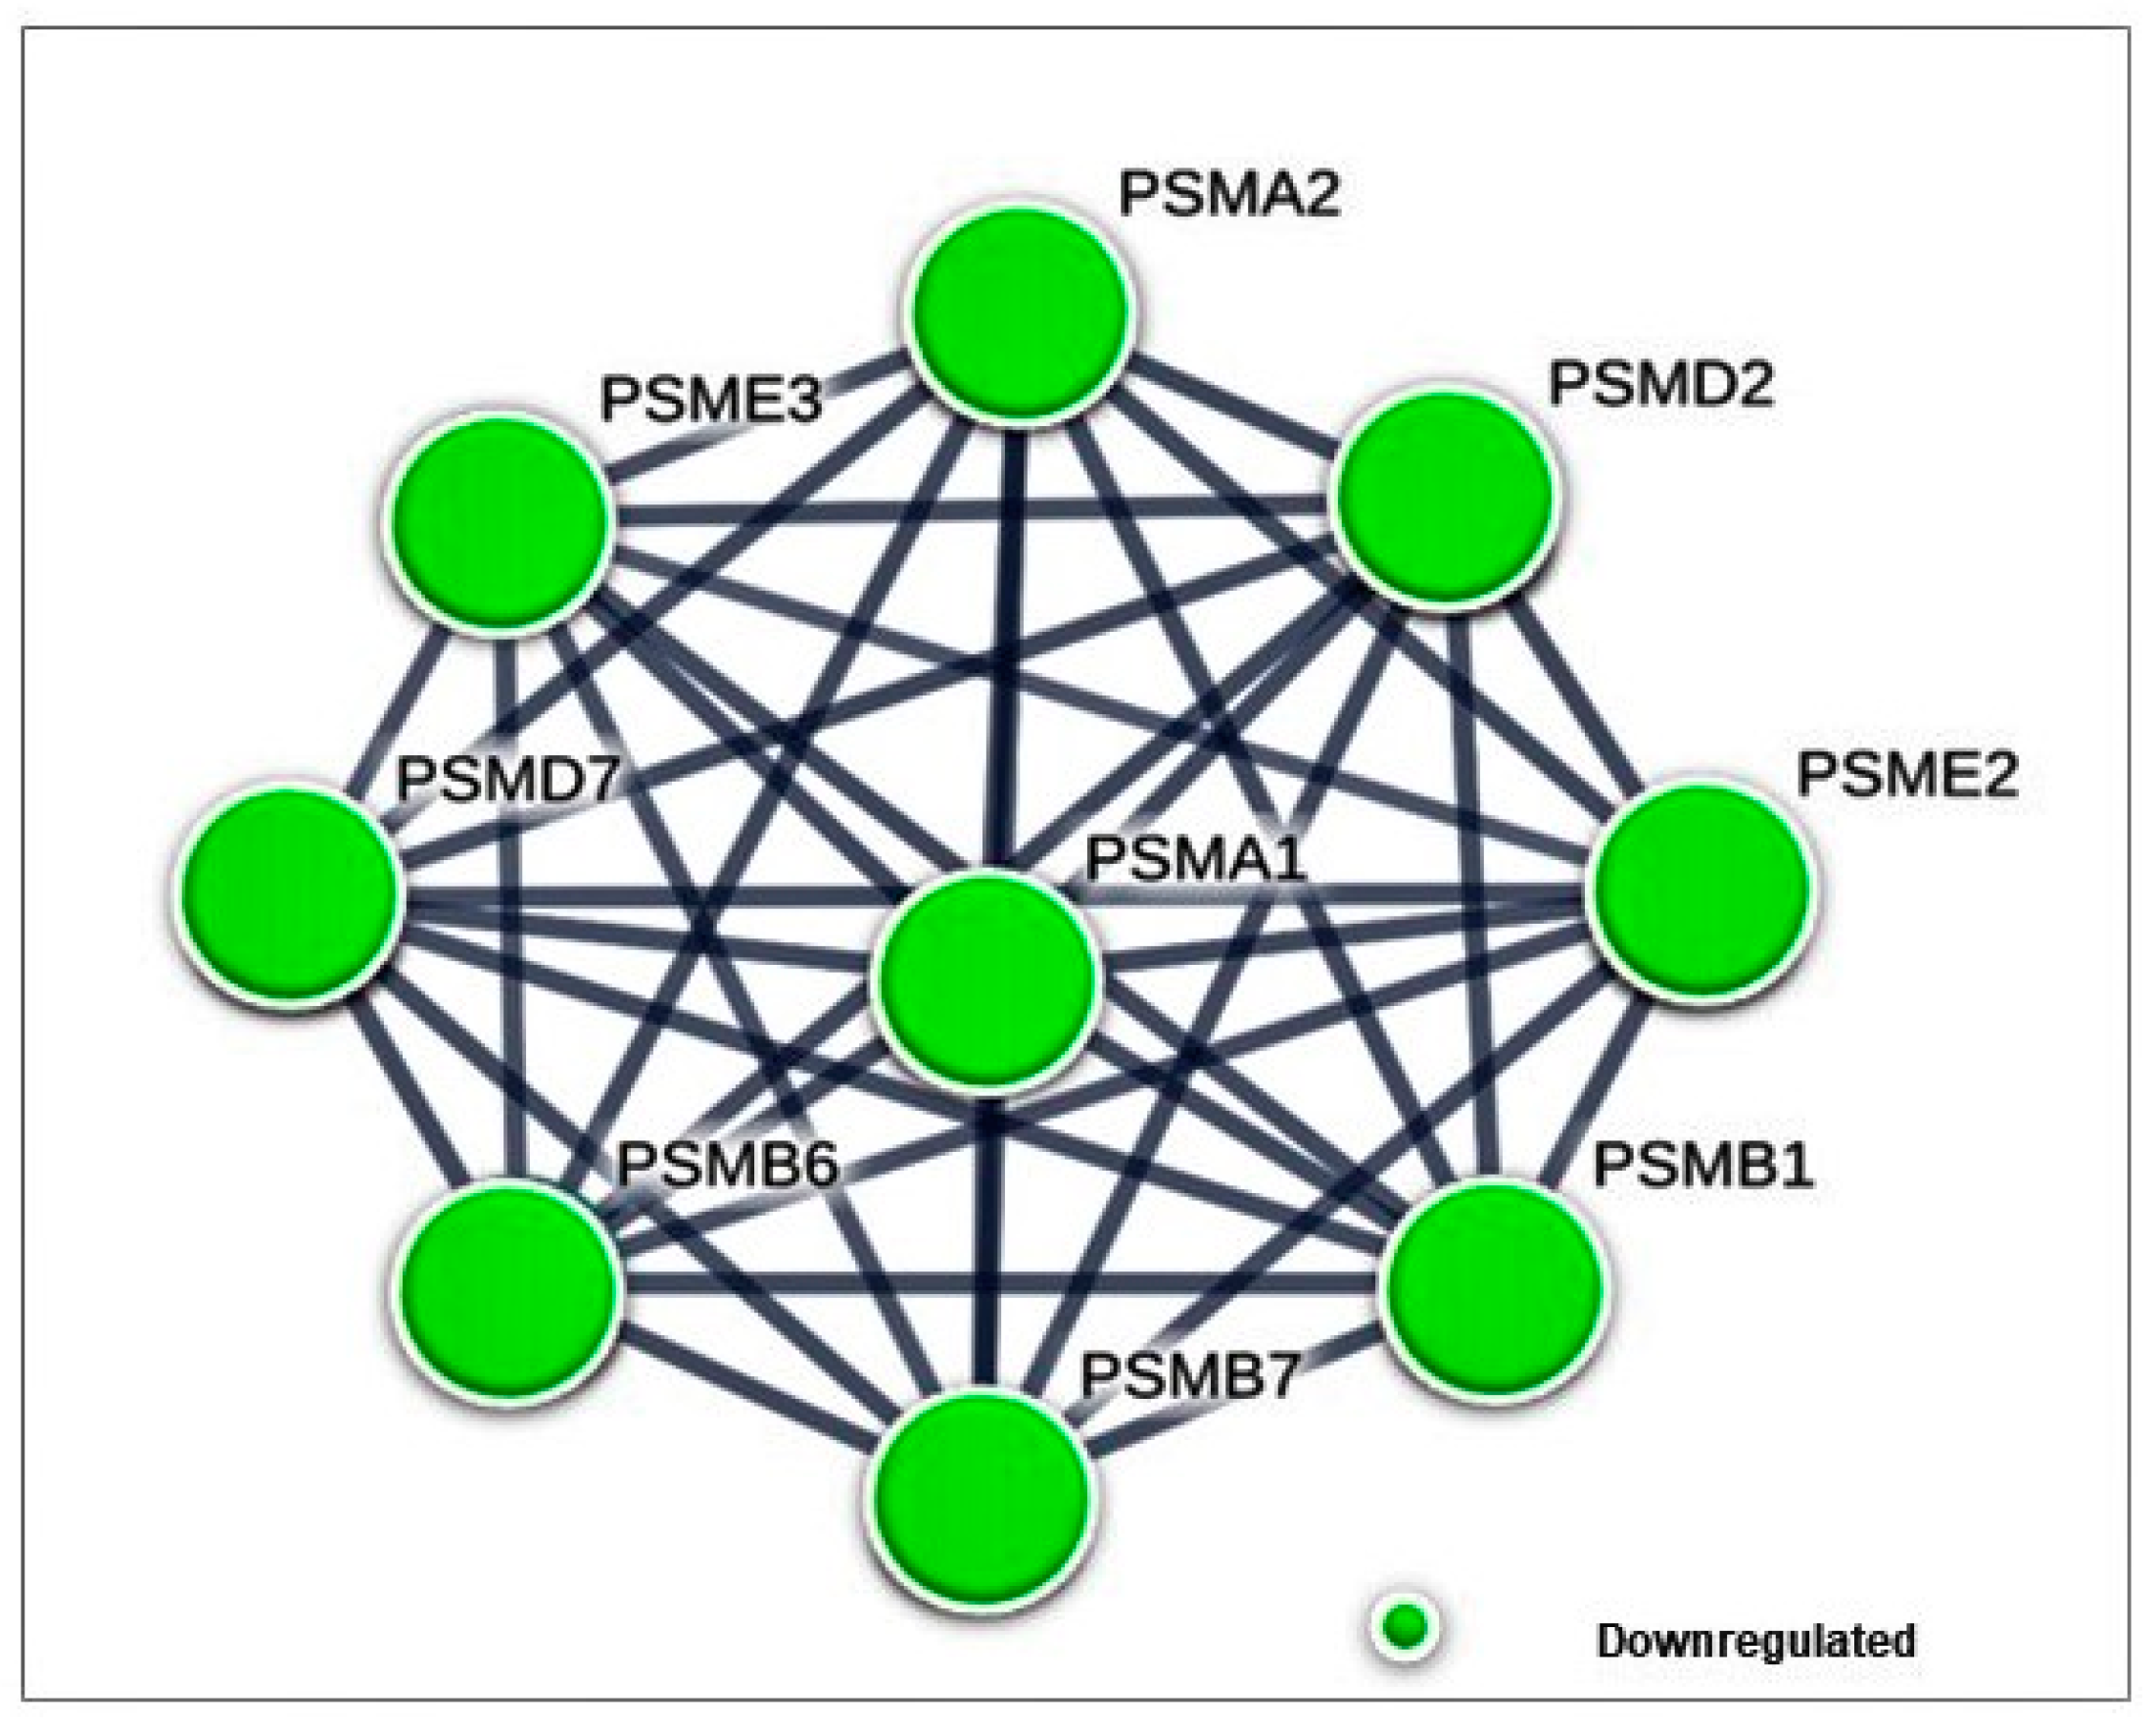
3.4. Protein–Protein Interaction Analysis

Protein–protein interaction (PPI) analysis were performed to understand the interactions between the key proteins of the differentially expressed cytoplasmic and nuclear fractions, in response to treatment with γT3 in MDA-MB-231 cell lines. The STRING database (http://www.string-db.org/) was utilized to select the interacting protein clusters. In this network, the nodes represent proteins, and the edges represent the interactions between the two proteins, whereby the line thickness between two nodes indicates the strength of data support. The PPI analysis for all protein datasets generated networks with significant interactions than expected, which meant that the differentially expressed proteins had more interactions among themselves than what would be expected for a random set of proteins of similar size, drawn from the genome. Such an enrichment indicated that the proteins are biologically connected as a group/cluster. For all PPI networks, the minimum required interaction score was set at high confidence (0.700) and the K-means clustering were performed to cluster the network to a specified number of clusters, to identify significant protein–protein interaction clusters formed among differentially expressed proteins.

3.4.1. Differentially Expressed Cytoplasmic Proteins STRING Analysis

For differentially expressed cytoplasmic proteins of MDA-MB-231 cells in response to γT3 treatment, the PPI network generated a total of 154 edges, among which 98 edges with high confidence generated a significant (p < 9.84 × 10⁻⁸) PPI enrichment clusters with a local clustering coefficient of 0.466 (Figure 3). A total of eight clusters were generated using K-means clustering, in which prominent interactions of cluster I was formed with PSMB1, PSMB6, PSMD2, PSMA2, PSMA1, PSME3, PSMB7, PSMD7, and PSME3; cluster II with HNRNPD, HNRNPA1, SSB, SYNCRIP, NCL, and PCBP2; cluster III with XRCC6, PCNA, UBE2V2, UBE2K, and UBE2D3; cluster IV with EIF3G, TUFM, RPLP0, RPLP2, and ABCE1; cluster V with ATP1B1, ATP1A3, ATP1B3, and ATP1B3; cluster VI with ECHS1, HSD17B10, HADH, and ALDH2; cluster VII with CYCS, LCP1, ACTC1, ACTA2, ACTG2, CTTN, and GSN; and cluster VIII with RAB25, RAB2B, RAB11A, SEC22B, COPG1, COPG2, CD59, DYNC1I2, DYNLL1, RAB1A, and RAB6A.

3.4.2. Differentially Expressed Nuclear Proteins STRING Analysis

For differentially expressed nuclear proteins in MDA-MB-231 cells in response to the γT3 treatment, the PPI network generated a total of 87 edges, among which 36 edges with high confidence were generated as significant (p < 2.3 × 10⁻¹³) PPI enrichment clusters with a local clustering coefficient of 0.494 (Figure 4). A total of five clusters were generated using K-means clustering, in which prominent interactions of cluster I was formed with ATP1A3, ATP1A2, and ATP2A2; cluster II with RPL11, RPS27L, EIF3I, EIF3L, RPL21, STT3A, RPL7, RPL15, NCBP1, RPL28, and RPL8; cluster III with UBE2I, MCM3, DYNC1I2, TECR, HIST1H2BK, and SMC3; cluster IV with MTCH2, ATP5L, COX6C, COX7A2, and ATP5F1; and cluster V with TUBA1A, TUBA4A, TUBA1B, TUBA1C, TUBA8, and ERLIN2.

4. Discussion

In this study, differentially expressed cytoplasmic and nuclear proteins of MDA-MB-231 in response to the γT3 treatment were assessed to identify the molecular mechanism through which this isoform of tocotrienol modulates anti-cancer effects. According to the protein–protein interaction (PPI), a total of nine proteasome complex proteins (PSMA1, PSMA2, PSMB1, PSMB6, PSMB7, PSMD2, PSMD7, PSME2, and PSME3) were found to form the most prominent network cluster of differentially expressed proteins in the cytoplasm of the γT3 treated MDA-MB-231 cells (Figure 2). All nine proteins were found to be downregulated by the γT3 treatment. This network of proteins might mediate the proteasome pathway through which γT3 inhibits the proliferation of cancer cells. It has been shown that both transformed and normal cells depend on the function of the proteasome to control the expression of proteins linked to cell survival and proliferation [23]. The proteasome is known to be involved in many distinct regulatory mechanisms in central cellular systems, such as proliferation and apoptosis, and serves as the machinery of proteolysis. Previous study has reported high levels of proteasome activity in breast cancer [24]. This elevated level of proteasome activity is crucial for the survival of cancer cells, as it allows them to escape from the apoptosis mechanism and degrade pro-apoptotic molecules. Cancer cells are more sensitive to proteasome inhibition than normal cells as a reduction in proteasome activity induces apoptosis in these cells [25]. Proteasome activator subunit-3 (PSME3), a protein encoded by the PSME3 gene, was reported to be upregulated in breast cancer and it promotes protein proteolysis (Figure 5). Knockdown of the PSME3 gene in human breast cancer cells, suppressed the proliferation of these cells and induced apoptosis [26]. In an experimental model, it was shown that a knockdown of the PSME3 gene reduced subcutaneous tumor growth rate and increased the number of CD8+ T-cells [27]. The PSME protein could also stimulate epithelial mesenchymal transition (EMT) by inducing the expression of cancer stem cell markers, as well as influencing the tumor immune microenvironment by regulating the cell cycle and proliferation of breast cancer cells [27]. In addition, abnormally high expression of PSME3 protein was reported in breast cancer metastatic lymph nodes [28]. It should also be noted that a higher expression of PSME3 had been observed in several types of human cancers and this was found to be a marker of prognosis in breast cancer [29].
Another key protein from this network is the 26S proteasome non-ATPase regulatory subunit-2 (PSMD2). This is a multi-protein complex that is involved in the ATP-dependent degradation of ubiquitinated proteins. Previous study have showed that PSMD2 regulated the cell proliferation and the cell cycle progression in breast cancer via modulation of p21 and p27 proteasomal degradation, which suggest that this protein might be a potential therapeutic target [30]. Analysis using the MALDI-TOF mass spectrophotometry (MS) based on two-dimensional polyacrylamide gel electrophoresis (2-DE) of breast cancer tissues showed over-expression of these proteasomes subunit proteins, including PSMD2 and PSMA1, when compared to normal adjacent tissue, which enhanced the action of ubiquitin–proteasome pathway in breast cancer tissues [31]. Analysis of thousands of tumor samples from The Cancer Genome Atlas (TCGA) reported an increased expression of proteasomes such as PSMB6, PSMB7 [32], and PSMD2 [30] in most cancer types. Other members of the proteasomal protein of this network such as the PSMB7 was reported to be over-expressed in colorectal cancer [33], whilst PSME2 along with PSME3 were reported to be significantly enriched in several biological processes and pathways including cell adhesion, adherent junction organization, regulation of autophagy, cellular protein localization, the cell cycle, and the apoptosis pathway [34]. The ability of the γT3 to downregulate the expression of these proteins delineate tocotrienols as a promising proteasome inhibitor. The crosstalk between these proteins were further investigated using the Kyoto Encyclopedia of Genes and Genomes (KEGG) pathway enrichment analysis. The pathway enrichment predicted the proteasome, as well as inflammation mediated by chemokine and cytokine signaling pathways. In the KEGG proteasome pathway, all nine downregulated proteasome proteins in response to γT3 were seen to be involved in regulating the cellular functions in this pathway (Figure 6). Down-regulation of the proteasome proteins by γT3 in this study shows the ability of this compound to inhibit proteasomes-mediated proteolysis in breast cancer cells. In this pathway, a total of five proteins from the PPI network (Figure 3) are seen to be part of the 20S proteasome core particle, such as α2/PSMA2, α6/PSMA1, β1/PSMB6, β2/PSMB7, and β6/PSMB1, which might regulate their activities in various ways. The immunoproteasome protein Pa28β/PSME2 from the PPI network were represented as one of the two 11S regulatory particles besides PA28α. Other proteins from the PPI network represented as the regulatory particles in the KEGG proteasome pathway are PA28γ/PSME3 and PA700 regulatory particles, RPN1/PSMD2 and RPN8/PSMD7. While proteasome inhibition might have therapeutic benefits to breast cancer therapy, these results represent a novel approach to delineate γT3 as a proteasome inhibitor, which might lead to the development of a new treatment strategy of tocotrienols for breast cancer, as well as others cancer types.
Numerous differentially expressed nuclear proteins were identified in response to the γT3 treatment and were found to be related to important biological processes, such as binding, molecular function regulators, catalytic activities, and translation regulator activities. It is noteworthy that some proteins were known to play important roles in impairing the carcinogenesis. Two upregulated proteins, such as annexin a6 (ANXA6) and scaffold attachment factor B2 (SAFB2), and two downregulated proteins, such as glutamine gamma-glutamyltransferase 2 (TGM2) and S100 calcium binding protein A16 (S100a16), were chosen for discussion, because they were found to be involved directly in the development of carcinogenesis while being found to be dysregulated in response to the γT3 treatment in this study.
Previous studies have showed a low expression of annexin a6 in many cancer types. Low expressions of AXNA6 was reported in melanoma malignancy [36] and epithelial carcinoma, whereby, the overexpression of ANXA6 leads to tumor suppression effects in A431 cells [37]. In breast cancer, low expression of AXNA6 were detected in invasive ductal carcinoma and mucous adenocarcinoma tissues [38] and was predicted to be an important patient survival marker. The AXNA6 also reported to play a potential tumor suppressor role in gastric cancer and have been shown to be down-regulated via promoter methylation in gastric cancer [39]. Recent studies reported the detection of the ANX6 that was found to be enriched in the circulating extracellular vesicles of breast cancer patients undergoing neoadjuvant chemotherapy [40]. Another study also reported that lapatinib, an anti-cancer drug developed by GlaxoSmithKline (GSK), which is used as a treatment for solid tumors such as breast and lung cancer was found to induce ANXA6 expression [41]. In this study, the AXNA6 was upregulated by γT3, implicating the ability of this isoform to mimic the activity of lapatinib.
Previous study suggested the scaffold attachment factor B2 (SAFB2) protein as a tumor suppressor involved in breast cancer development [42]. SAFB2 have also been implicated in breast tumorigenesis and have been reported to be frequently lost in breast cancer due to mutation, while its overexpression results in breast cancer growth inhibition. The same study also reported that in breast cancer patients, low SAFB2 levels are associated with worse outcome in breast cancer patients [43]. Interestingly, in this study the expression of this protein was upregulated by γT3 treatment, which implies that this compound has potential clinical importance in improving the outcome in breast cancer patients.
The protein, glutamine gamma-glutamyltransferase 2 (TGM2) was reported to be downregulated, following treatment with T3 in this study. A higher proportion of mammary tumors showed to express transglutaminase 2 in the chemoprevention group, while its upregulated expression is suggestive of an increased aggressiveness of tumors [44]. Recent studies showed that the TGM2 causes depletion of the P53 tumor suppressor through autophagy in renal cell carcinoma [45] and induces epithelial-to-mesenchymal transition (EMT) in various tumors [46]. Another study on gastric cancer (GC) also suggest that TGM2 might provide a new target for the diagnosis and treatment of GC [47]. Interestingly, the TGM2 protein and mRNA levels were both reported to be elevated in metastases from breast and melanoma cancers [48]. In a nutshell, TGM2 might provide a new target for the diagnosis and treatment of breast cancer, as substantial evidence have shown that down-regulated TGM2 expression can decrease the invasive ability and metastatic potential of breast cancer. The ability of γT3 to downregulate this protein showed a potential therapeutic advantage as a promising natural anti-cancer drug agent in cancer.
Another important down-regulated protein, S100 calcium binding protein a16 (S100A16) has been linked to cancer types including breast cancer with substantial supporting evidences showing its involvement in carcinogenesis. The co-expression of S100A14 and S100A16 was associated with a poor prognosis in human breast cancer as it was reported to promote cancer cell invasion via an interaction with cytoskeletal dynamics [49]. A recent evidence showed that the expression of S100A16 was negatively correlated with the overall survival of bladder cancer patients [50]. Besides breast cancer, S100A16 was identified as an important prognostic marker for colorectal cancer [51] and was shown to be significantly overexpressed in both prostate cancer tissues and cells lines, compared to normal controls [52]. The S100A16 was also upregulated in various types of cancer, including bladder, lung, and pancreatic [53]. While in this study the expression of this protein was significantly down-regulated, previous study have shown that the upregulation of S100A16 expression promotes epithelial mesenchymal transition via the Notch1 pathway in breast cancer [49]. This indicates that γT3 has a potential effect on S100A16, which might negatively regulate some embryonic transcription factors that promotes EMT in breast cancer cells, which are known to be an important target site for the therapy of breast cancer.

5. Conclusions

In summary, our data indicates that gamma-tocotrienol (γT3) is a novel proteasome inhibitor adding to its anti-cancer properties. This was the first label-free quantitative proteomics-based study demonstrating the cytoplasmic and nuclear proteins signaling events that were altered in response to the γT3 treatment in MDA-MB-231 cells. This study showed the importance of γT3 as an anti-cancer agent that could be used to replace or support current chemotherapeutic treatment regimes. It might even be useful in devising chemoprevention measures. However, this study had some potential limitations. From the present study, an over-whelming number of differentially expressed proteins in nuclear and cytoplasmic compartments of the MDA-MB-231 human breast cancer cells were identified in response to the γT3 treatment. The roles of all these proteins were inexplicable as it required supporting evidences for further interpretation. Interestingly, some of these proteins have not been previously reported to be modulated by γT3. As such, there is room for further and more in-depth analysis of these data, to elucidate how tocotrienols impair carcinogenesis through dysregulation of various other proteins.

Author Contributions

P.R., A.K.R., and P.S.A.-R. designed the project and acquired the funding, P.R., A.A.A.S., M.K., and J.S.A.R. performed bioinformatics analysis, P.R. and A.A.A.S. conducted the research investigation, A.R. and P.S.A.R. supervised the project. All authors significantly contributed to the writing and review of this research article. All authors have read and agreed to the published version of the manuscript.

Funding

This work was supported with research grants from the Fundamental Research Grant Scheme (FRGS, FP016–2013B) from the Ministry of Higher Education, Malaysia, Frontier Research Grant UM (FRG, FG018–17AFR) and UM Research Grant (RG082/09AFR) from University Malaya, Malaysia.

Acknowledgments

The authors thank the Malaysian Genome Institute (MGI) for providing the proteomics facilities and services and DAVOS Pvt. Ltd. (Singapore) for providing the γT3 isoform.

Conflicts of Interest

The authors declare no conflict of interest.

References

  1. Bray, F.; Ferlay, J.; Soerjomataram, I.; Siegel, R.L.; Torre, L.A.; Jemal, A. Global cancer statistics 2018: GLOBOCAN estimates of incidence and mortality worldwide for 36 cancers in 185 countries. CA Cancer J. Clin. 2018, 68, 394–424. [Google Scholar] [CrossRef] [PubMed] [Green Version]
  2. Siegel, R.L.; Miller, K.D.; Jemal, A. Cancer statistics, 2019. CA Cancer J. Clin. 2019, 69, 7–34. [Google Scholar] [CrossRef] [PubMed] [Green Version]
  3. Torre, L.A.; Bray, F.; Siegel, R.L.; Ferlay, J.; Lortet-Tieulent, J.; Jemal, A. Global cancer statistics, 2012. CA Cancer J. Clin. 2015, 65, 87–108. [Google Scholar] [CrossRef] [PubMed] [Green Version]
  4. McLaughlin, S.A. Surgical management of the breast: Breast conservation therapy and mastectomy. Surg. Clin. 2013, 93, 411–428. [Google Scholar] [CrossRef] [PubMed]
  5. Cleeland, C.S.; Allen, J.D.; Roberts, S.A.; Brell, J.M.; Giralt, S.A.; Khakoo, A.Y.; Kirch, R.A.; Kwitkowski, V.E.; Liao, Z.; Skillings, J. Reducing the toxicity of cancer therapy: Recognizing needs, taking action. Nat. Rev. Clin. Oncol. 2012, 9, 471. [Google Scholar] [CrossRef] [PubMed]
  6. Reddy, K.B. Triple-negative breast cancers: An updated review on treatment options. Curr. Oncol. 2011, 18, e173. [Google Scholar] [CrossRef] [Green Version]
  7. Dantzer, R.; Meagher, M.W.; Cleeland, C.S. Translational approaches to treatment-induced symptoms in cancer patients. Nat. Rev. Clin. Oncol. 2012, 9, 414–426. [Google Scholar] [CrossRef] [Green Version]
  8. Yap, W.N.; Chang, P.N.; Han, H.Y.; Lee, D.T.W.; Ling, M.T.; Wong, Y.C.; Yap, Y.L. Gamma-tocotrienol suppresses prostate cancer cell proliferation and invasion through multiple-signalling pathways. Br. J. Cancer 2008, 99, 1832–1841. [Google Scholar] [CrossRef]
  9. Yap, W.N.; Zaiden, N.; Tan, Y.L.; Ngoh, C.P.; Zhang, X.W.; Wong, Y.C.; Ling, M.T.; Yap, Y.L. Id1, inhibitor of differentiation, is a key protein mediating anti-tumor responses of gamma-tocotrienol in breast cancer cells. Cancer Lett. 2010, 291, 187–199. [Google Scholar] [CrossRef]
  10. Sznarkowska, A.; Kostecka, A.; Meller, K.; Bielawski, K.P. Inhibition of cancer antioxidant defense by natural compounds. Oncotarget 2016, 8, 15996–16016. [Google Scholar] [CrossRef] [Green Version]
  11. Kannappan, R.; Gupta, S.C.; Kim, J.H.; Aggarwal, B.B. Tocotrienols fight cancer by targeting multiple cell signaling pathways. Genes Nutr. 2012, 7, 43–52. [Google Scholar]
  12. Nedelsky, N.B.; Todd, P.K.; Taylor, J.P. Autophagy and the ubiquitin-proteasome system: Collaborators in neuroprotection. Biochim. Biophys. Acta Mol. Basis Dis. 2008, 1782, 691–699. [Google Scholar] [CrossRef] [PubMed] [Green Version]
  13. Narayanan, S.; Cai, C.-Y.; Assaraf, Y.G.; Guo, H.-Q.; Cui, Q.; Wei, L.; Huang, J.-J.; Ashby, C.R.; Chen, Z.-S. Targeting the ubiquitin-proteasome pathway to overcome anti-cancer drug resistance. Drug Resist. Updat. 2020, 48, 100663. [Google Scholar] [CrossRef] [PubMed]
  14. Yang, H.; Landis-Piwowar, K.R.; Chen, D.; Milacic, V.; Dou, Q.P. Natural compounds with proteasome inhibitory activity for cancer prevention and treatment. Curr. Protein Pept. Sci. 2008, 9, 227–239. [Google Scholar] [CrossRef] [PubMed] [Green Version]
  15. Ramdas, P.; Radhakrishnan, A.K.; Abdu Sani, A.A.; Abdul-Rahman, P.S. Tocotrienols Modulate Breast Cancer Secretomes and Affect Cancer-Signaling Pathways in MDA-MB-231 Cells: A Label-Free Quantitative Proteomic Analysis. Nutr. Cancer 2019, 1–9. [Google Scholar] [CrossRef]
  16. Ay, C. Nuclear Extraction Kit. Culture 2003, 6642, 4–7. [Google Scholar]
  17. Draw Venn Diagram. Available online: http://bioinformatics.psb.ugent.be/webtools/Venn/ (accessed on 27 November 2019).
  18. Dennis, G.; Sherman, B.T.; Hosack, D.A.; Yang, J.; Gao, W.; Lane, H.C.; Lempicki, R.A. DAVID: Database for Annotation, Visualization, and Integrated Discovery. Genome Biol. 2003, 4. [Google Scholar]
  19. Huang, D.W.; Sherman, B.T.; Zheng, X.; Yang, J.; Imamichi, T.; Stephens, R.; Lempicki, R.A. Extracting Biological Meaning from Large Gene Lists with DAVID. Curr. Protoc. Bioinforma. 2009, 27, 13.11.1–13.11.13. [Google Scholar] [CrossRef]
  20. Kanehisa, M.; Furumichi, M.; Tanabe, M.; Sato, Y.; Morishima, K. KEGG: New perspectives on genomes, pathways, diseases and drugs. Nucleic Acids Res. 2017, 45, D353–D361. [Google Scholar] [CrossRef] [Green Version]
  21. KEGG: Kyoto Encyclopedia of Genes and Genomes. Available online: https://www.genome.jp/kegg/ (accessed on 27 November 2019).
  22. STRING: Functional Protein Association Networks. Available online: https://string-db.org/ (accessed on 27 November 2019).
  23. Manasanch, E.E.; Orlowski, R.Z. Proteasome inhibitors in cancer therapy. Nat. Rev. Clin. Oncol. 2017, 14, 417–433. [Google Scholar] [CrossRef]
  24. Chen, L.; Madura, K. Increased proteasome activity, ubiquitin-conjugating enzymes, and eEF1A translation factor detected in breast cancer tissue. Cancer Res. 2005, 65, 5599–5606. [Google Scholar] [CrossRef] [Green Version]
  25. Adams, J. The proteasome: Structure, function, and role in the cell. Cancer Treat. Rev. 2003, 29, 3–9. [Google Scholar] [CrossRef]
  26. Shi, Y.; Luo, X.; Li, P.; Tan, J.; Wang, X.; Xiang, T.; Ren, G. miR-7-5p suppresses cell proliferation and induces apoptosis of breast cancer cells mainly by targeting REGγ. Cancer Lett. 2015, 358, 27–36. [Google Scholar] [CrossRef] [PubMed]
  27. Yi, Z.; Yang, D.; Liao, X.; Guo, F.; Wang, Y.; Wang, X. PSME3 induces epithelial–mesenchymal transition with inducing the expression of CSC markers and immunosuppression in breast cancer. Exp. Cell Res. 2017, 358, 87–93. [Google Scholar] [CrossRef] [PubMed]
  28. Wang, X.; Tu, S.; Tan, J.; Tian, T.; Ran, L.; Rodier, J.-F.; Ren, G. REG gamma: A potential marker in breast cancer and effect on cell cycle and proliferation of breast cancer cell. Med. Oncol. 2011, 28, 31–41. [Google Scholar] [CrossRef]
  29. Chai, F.; Liang, Y.; Bi, J.; Chen, L.; Zhang, F.; Cui, Y.; Bian, X.; Jiang, J. High expression of REGγ is associated with metastasis and poor prognosis of patients with breast cancer. Int. J. Clin. Exp. Pathol. 2014, 7, 7834–7843. [Google Scholar]
  30. Li, Y.; Huang, J.; Zeng, B.; Yang, D.; Sun, J.; Yin, X.; Lu, M.; Qiu, Z.; Peng, W.; Xiang, T.; et al. PSMD2 regulates breast cancer cell proliferation and cell cycle progression by modulating p21 and p27 proteasomal degradation. Cancer Lett. 2018, 430, 109–122. [Google Scholar] [CrossRef]
  31. Deng, S.; Zhou, H.; Xiong, R.; Lu, Y.; Yan, D.; Xing, T.; Dong, L.; Tang, E.; Yang, H. Over-expression of genes and proteins of ubiquitin specific peptidases (USPs) and proteasome subunits (PSs) in breast cancer tissue observed by the methods of RFDD-PCR and proteomics. Breast Cancer Res. Treat. 2007, 104, 21–30. [Google Scholar] [CrossRef]
  32. Rouette, A.; Trofimov, A.; Haberl, D.; Boucher, G.; Lavallée, V.-P.; D’Angelo, G.; Hébert, J.; Sauvageau, G.; Lemieux, S.; Perreault, C. Expression of immunoproteasome genes is regulated by cell-intrinsic and –extrinsic factors in human cancers. Sci. Rep. 2016, 6. [Google Scholar] [CrossRef] [Green Version]
  33. Rho, J.; Qin, S.; Wang, J.Y.; Roehrl, M.H.A. Proteomic Expression Analysis of Surgical Human Colorectal Cancer Tissues: Up-Regulation of PSB7, PRDX1, and SRP9 and Hypoxic Adaptation in Cancer. J. Proteome Res. 2008, 7, 2959–2972. [Google Scholar] [CrossRef] [Green Version]
  34. Wang, Q.; Pan, F.; Li, S.; Huang, R.; Wang, X.; Wang, S.; Liao, X.; Li, D.; Zhang, L. The prognostic value of the proteasome activator subunit gene family in skin cutaneous melanoma. J. Cancer 2019, 10, 2205–2219. [Google Scholar] [CrossRef]
  35. Kanehisa, M. KEGG: Kyoto Encyclopedia of Genes and Genomes. Nucleic Acids Res. 2000, 28, 27–30. [Google Scholar] [CrossRef] [PubMed]
  36. Francia, G.; Mitchell, S.D.; Moss, S.E.; Hanby, A.M.; Marshall, J.F.; Hart, I.R. Identification by differential display of annexin-VI, a gene differentially expressed during melanoma progression. Cancer Res. 1996, 56, 3855–3858. [Google Scholar] [PubMed]
  37. Koese, M.; Rentero, C.; Kota, B.P.; Hoque, M.; Cairns, R.; Wood, P.; Vilà de Muga, S.; Reverter, M.; Alvarez-Guaita, A.; Monastyrskaya, K.; et al. Annexin A6 is a scaffold for PKCα to promote EGFR inactivation. Oncogene 2013, 32, 2858–2872. [Google Scholar] [CrossRef] [PubMed] [Green Version]
  38. Koumangoye, R.B.; Nangami, G.N.; Thompson, P.D.; Agboto, V.K.; Ochieng, J.; Sakwe, A.M. Reduced annexin A6 expression promotes the degradation of activated epidermal growth factor receptor and sensitizes invasive breast cancer cells to EGFR-targeted tyrosine kinase inhibitors. Mol. Cancer 2013, 12, 167. [Google Scholar] [CrossRef] [Green Version]
  39. Wang, X.; Zhang, S.; Zhang, J.; Lam, E.; Liu, X.; Sun, J.; Feng, L.; Lu, H.; Yu, J.; Jin, H. Annexin A6 is down-regulated through promoter methylation in gastric cancer. Am. J. Transl. Res. 2013, 5, 555–562. [Google Scholar]
  40. Keklikoglou, I.; Cianciaruso, C.; Güç, E.; Squadrito, M.L.; Spring, L.M.; Tazzyman, S.; Lambein, L.; Poissonnier, A.; Ferraro, G.B.; Baer, C.; et al. Chemotherapy elicits pro-metastatic extracellular vesicles in breast cancer models. Nat. Cell Biol. 2019, 21, 190–202. [Google Scholar] [CrossRef] [Green Version]
  41. Widatalla, S.E.; Korolkova, O.Y.; Whalen, D.S.; Goodwin, J.S.; Williams, K.P.; Ochieng, J.; Sakwe, A.M. Lapatinib induced Annexin A6 up-regulation as an adaptive response of triple negative breast cancer cells to EGFR tyrosine kinase inhibitors. Carcinogenesis 2018. [Google Scholar]
  42. Bergman, A.; Abel, F.; Behboudi, A.; Yhr, M.; Mattsson, J.; Svensson, J.H.; Karlsson, P.; Nordling, M. No germline mutations in supposed tumour suppressor genes SAFB1 and SAFB2in familial breast cancer with linkage to 19p. BMC Med. Genet. 2008, 9, 108. [Google Scholar] [CrossRef] [Green Version]
  43. Hammerich-Hille, S.; Bardout, V.J.; Hilsenbeck, S.G.; Osborne, C.K.; Oesterreich, S. Low SAFB levels are associated with worse outcome in breast cancer patients. Breast Cancer Res. Treat. 2010, 121, 503–509. [Google Scholar] [CrossRef]
  44. Martins, F.C.; Teixeira, F.; Reis, I.; Geraldes, N.; Cabrita, A.M.S.; Dias, M.F. Increased transglutaminase 2 and GLUT-1 expression in breast tumors not susceptible to chemoprevention with antioxidants. Tumori 2009, 95, 227–232. [Google Scholar] [CrossRef]
  45. Kang, J.H.; Lee, S.-H.; Cheong, H.; Lee, C.H.; Kim, S.-Y. Transglutaminase 2 Promotes Autophagy by LC3 Induction through p53 Depletion in Cancer Cell. Biomol. Ther. (Seoul) 2019, 27, 34–40. [Google Scholar] [CrossRef] [PubMed]
  46. Seo, S.; Moon, Y.; Choi, J.; Yoon, S.; Jung, K.H.; Cheon, J.; Kim, W.; Kim, D.; Lee, C.H.; Kim, S.-W.; et al. The GTP binding activity of transglutaminase 2 promotes bone metastasis of breast cancer cells by downregulating microRNA-205. Am. J. Cancer Res. 2019, 9, 597–607. [Google Scholar] [PubMed]
  47. Lei, Z.; Chai, N.; Tian, M.; Zhang, Y.; Wang, G.; Liu, J.; Tian, Z.; Yi, X.; Chen, D.; Li, X.; et al. Novel peptide GX1 inhibits angiogenesis by specifically binding to transglutaminase-2 in the tumorous endothelial cells of gastric cancer. Cell Death Dis. 2018, 9, 579. [Google Scholar] [CrossRef] [PubMed] [Green Version]
  48. Chen, F.; Zhang, Y.; Varambally, S.; Creighton, C.J. Molecular Correlates of Metastasis by Systematic Pan-Cancer Analysis Across The Cancer Genome Atlas. Mol. Cancer Res. 2019, 17, 476–487. [Google Scholar] [CrossRef] [PubMed] [Green Version]
  49. Tanaka, M.; Ichikawa-Tomikawa, N.; Shishito, N.; Nishiura, K.; Miura, T.; Hozumi, A.; Chiba, H.; Yoshida, S.; Ohtake, T.; Sugino, T. Co-expression of S100A14 and S100A16 correlates with a poor prognosis in human breast cancer and promotes cancer cell invasion. BMC Cancer 2015, 15, 53. [Google Scholar] [CrossRef] [PubMed] [Green Version]
  50. Wang, C.; Zhu, X.; Li, A.; Yang, S.; Qiao, R.; Zhang, J. S100A16 regulated by Snail promotes the chemoresistance of nonmuscle invasive bladder cancer through the AKT/Bcl-2 pathway. Cancer Manag. Res. 2019, 11, 2449–2456. [Google Scholar] [CrossRef] [PubMed] [Green Version]
  51. Sun, X.; Wang, T.; Zhang, C.; Ning, K.; Guan, Z.-R.; Chen, S.-X.; Hong, T.-T.; Hua, D. S100A16 is a prognostic marker for colorectal cancer. J. Surg. Oncol. 2018, 117, 275–283. [Google Scholar] [CrossRef]
  52. Zhu, W.; Xue, Y.; Liang, C.; Zhang, R.; Zhang, Z.; Li, H.; Su, D.; Liang, X.; Zhang, Y.; Huang, Q.; et al. S100A16 promotes cell proliferation and metastasis via AKT and ERK cell signaling pathways in human prostate cancer. Tumor Biol. 2016, 37, 12241–12250. [Google Scholar] [CrossRef]
  53. Tomiyama, N.; Ikeda, R.; Nishizawa, Y.; Masuda, S.; Tajitsu, Y.; Takeda, Y. S100A16 up-regulates Oct4 and Nanog expression in cancer stem-like cells of Yumoto human cervical carcinoma cells. Oncol. Lett. 2018, 15, 9929–9933. [Google Scholar] [CrossRef] [Green Version]
Figure 1. The Venn diagrams shows the intersection of differentially expressed cytoplasmic and nuclear proteins of the γT3-treated MDA-MB-231 cells (cytoplasmic and nuclear compartment). * Cyto: Cytoplasmic; Nuc: Nuclear.
Biomolecules 10 00019 g001
Figure 2. List of differentially expressed (A) nuclear and (B) cytoplasmic proteins by the γT3-treated MDA-MB-231 cells matched with the functional categories using DAVID analysis. The data showing the top 10 Gene ontology terms for the proteins.
Biomolecules 10 00019 g002
Figure 3. Interaction network for differentially expressed cytoplasmic proteins of MDA-MB-231 cells in response to the γT3 treatment generated using the STRING database. Note: Red dotted circle shows protein clusters with high confidence interactions for each cluster (line thickness indicates the strength of data support).
Biomolecules 10 00019 g003
Figure 4. Interaction network for differentially expressed nuclear proteins of MDA-MB-231 cells in response to γT3 treatment generated using the STRING database. Note: Red dotted circle shows protein clusters with high confidence interactions for each cluster (line thickness indicates the strength of data support).
Biomolecules 10 00019 g004
Figure 5. The down-regulated proteasome proteins formed the most prominent network based on the protein–protein interaction populated using the STRING database for differentially expressed cytoplasmic proteins in response to the γT3 in MDA-MB-231 cells.
Biomolecules 10 00019 g005
Figure 6. The KEGG proteasome pathway shows involvement of downregulated cytoplasmic. proteins in response to γT3 (green colored boxes) in MDA-MB-231 cells linking the functional role of these proteins to negatively regulate cell proliferation and invasion. (20S proteasome: α2/PSMA2, α6/PSMA1, β1/Psmb6, β2/PSMB7, and β6/PSMB1; regulatory particles: PA28β/PSME2, PA28γ/PSME3; 19S regulatory complex PA700: RPN8/PSMD7, RPN1/PSMD2. (Adapted from KEGG Proteasome Pathway-ko03050 [35]).
Biomolecules 10 00019 g006
Table 1. Differentially expressed cytoplasmic proteins (p < 0.05) in γT3-treated MDA-MB-231 cells compared with the untreated control.
(A) Up-Regulated Cytoplasmic Proteins
AccessionProtein DescriptionGene Symbol* Fold-Change
P1080960 kDa heat shock protein, mitochondrial proteinHSPD11.45
Q9BQE3Tubulin alpha-1C chainTUBA1C2.98
P68032Actin, alpha cardiac muscle 1ACTC11.81
P63267Actin, gamma-enteric smooth muscleACTG21.81
P62736Actin, aortic smooth muscleACTA21.81
P62820Ras-related protein Rab-1ARAB1A1.71
P30048Thioredoxin-dependent peroxide reductasePRDX31.64
P30084Enoyl-CoA hydratase, mitochondrialECHS12.15
P34897Serine hydroxymethyltransferase, mitochondrialSHMT21.36
Q997143-hydroxyacyl-CoA dehydrogenase type-2HSD17B101.42
P48960CD97 antigenCD971.36
P13637Sodium/potassium-transporting ATPase subunit α-3ATP1A31.2
P62879Guanine nucleotide-binding protein G(I)/G(S)/G(T) subunit beta-2GNB22.16
P04181Ornithine aminotransferase, mitochondrialOAT2.47
P36776Lon protease homolog, mitochondrialLONP11.45
P05091Aldehyde dehydrogenase, mitochondrialALDH21.97
Q15366Poly(rC)-binding protein 2PCBP22.13
Q14697Neutral alpha-glucosidase ABGANAB2.27
P16152Carbonyl reductase [NADPH] 1CBR11.43
P06396GelsolinGSN1.18
P07954Fumarate hydratase, mitochondrialFH1.46
P31040Succinate dehydrogenase [ubiquinone] flavoprotein subunitSDHA1.49
P11498Pyruvate carboxylase, mitochondrialPC1.12
P07602ProsaposinPSAP1.85
P49411Elongation factor Tu, mitochondrialTUFM1.7
Q09160HLA class I histocompatibility antigenHLA-A3.62
P62942Peptidyl-prolyl cis-trans isomeraseFKBP1A3.02
Q13733Sodium/potassium-transporting ATPase subunit α-4ATP1A42.58
P04439HLA class I histocompatibility antigenHLA-A3.36
O43399Tumor protein D54TPD52L21.68
O75396Vesicle-trafficking protein SEC22bSEC22B1.12
Q8WUD1Ras-related protein Rab-2BRAB2B2.17
P57721Poly(rC)-binding protein 3PCBP32.31
Q14247Src substrate cortactinCTTN1.61
P20340Ras-related protein Rab-6ARAB6A1.92
Q15836Vesicle-associated membrane protein 3VAMP32.19
Q7Z406Myosin-14MYH142.33
P21926CD9 antigenCD93.74
P05026Sodium/potassium-transporting ATPase subunit β-1ATP1B11.74
Q14019Coactosin-like proteinCOTL13.35
P62491Ras-related protein Rab-11ARAB11A3.44
Q13740CD166 antigenALCAM1.26
P63000Ras-related C3 botulinum toxin substrate 1RAC11.62
P15153Ras-related C3 botulinum toxin substrate 2RAC22.41
P53801Pituitary tumor-transforming gene 1 protein-interacting proteinPTTG1IP3.76
Q9Y536Peptidyl-prolyl cis-trans isomerase A-like 4APPIAL4A1.15
P61916NPC intracellular cholesterol transporter 2NPC22.8
P54709Sodium/potassium-transporting ATPase subunit β-3ATP1B32.65
Q969H8Myeloid-derived growth factorMYDGF2.75
P63167Dynein light chain 1, cytoplasmicDYNLL11.85
O15127Secretory carrier-associated membrane protein 2SCAMP21.78
Q15819Ubiquitin-conjugating enzyme E2 variant 2UBE2V21.72
P13987CD59 glycoproteinCD591.84
P07108Acyl-CoA-binding proteinDBI2.14
Q5JXB2Putative ubiquitin-conjugating enzyme E2 N-likeUBE2NL1.96
P34896Serine hydroxymethyltransferase, cytosolicSHMT12.59
Q969E2Secretory carrier-associated membrane protein 4SCAMP41.68
P48509CD151 antigenCD1511.78
P57735Ras-related protein Rab-25RAB252.33
P99999Cytochrome cCYCS1.79
(B) Down-Regulated Cytoplasmic Proteins
AccessionProtein DescriptionGene Symbol* Fold-Change
Q99873Protein arginine N-methyltransferase 1PRMT1-1.23
P12956X-ray repair cross-complementing protein 6XRCC6-1.57
Q01105Protein SETSET-1.62
P12004Proliferating cell nuclear antigenPCNA-1.46
P19338NucleolinNCL-1.51
Q1320026S proteasome non-ATPase regulatory subunit 2PSMD2-1.08
Q9Y678Coatomer subunit gamma-1COPG1-2.17
Q9UL46Proteasome activator complex subunit 2PSME2-1.63
Q13263Transcription intermediary factor 1-βTRIM28-1.82
P0538760S acidic ribosomal protein P2RPLP2-1.06
P20618Proteasome subunit beta type-1PSMB1-1.02
P25787Proteasome subunit alpha type-2PSMA2-2.04
P05455Lupus La proteinSSB-1.65
P0538860S acidic ribosomal protein P0RPLP0-1.46
P0DME0Protein SETSIPSETSIP-1.49
P36871Phosphoglucomutase-1PGM1-2.65
Q16836Hydroxyacyl-coenzyme A dehydrogenase, mitochondrialHADH-1.55
Q8NHW560S acidic ribosomal protein P0-likeRPLP0P6-1.43
Q02790Peptidyl-prolyl cis-trans isomeraseFKBP4-2.2
P35270Sepiapterin reductaseSPR-2.13
P25786Proteasome subunit alpha type-1PSMA1-1.23
Q8N163Cell cycle and apoptosis regulator protein 2CCAR2-2.38
P13796Plastin-2LCP1-4.72
P27816Microtubule-associated protein 4MAP4-1.21
P52788Spermine synthaseSMS-1.8
P61289Proteasome activator complex subunit 3PSME3-3.47
P61077Ubiquitin-conjugating enzyme E2 D3UBE2D3-2.15
Q14103Heterogeneous nuclear ribonucleoprotein D0HNRNPD-1.64
Q99436Proteasome subunit beta type-7PSMB7-3.68
P53675Clathrin heavy chain 2CLTCL1-2.3
Q13310Polyadenylate-binding protein 4PABPC4-1.39
P54577Tyrosine-tRNA ligase, cytoplasmicYARS-2.15
Q15257Serine/threonine-protein phosphatase 2A activatorPTPA-3.18
O60506Heterogeneous nuclear ribonucleoprotein QSYNCRIP-1.69
O75915PRA1 family protein 3ARL6IP5-3.35
O95373Importin-7IPO7-2.37
P5166526S proteasome non-ATPase regulatory subunit 7PSMD7-1.22
Q99729Heterogeneous nuclear ribonucleoprotein A/BHNRNPAB-1.48
O15355Protein phosphatase 1GPPM1G-3.2
P28072Proteasome subunit beta type-6PSMB6-1.31
P29992Guanine nucleotide-binding protein subunit alpha-11GNA11-2.59
Q9UBF2Coatomer subunit gamma-2COPG2-2.84
O75821Eukaryotic translation initiation factor 3 subunit GEIF3G-2.04
P61086Ubiquitin-conjugating enzyme E2 KUBE2K-2.08
P09651Heterogeneous nuclear ribonucleoprotein A1HNRNPA1-1.52
O14602Eukaryotic translation initiation factor 1AEIF1AY-1.42
P61221ATP-binding cassette sub-family E member 1ABCE1-2.82
Q13409Cytoplasmic dynein 1 intermediate chain 2DYNC1I2-2.05
Q9UII2ATPase inhibitor, mitochondrialATP5IF1-3.86
Q969T9WW domain-binding protein 2WBP2-1.7
Q9NR22Protein arginine N-methyltransferase 8PRMT8-1.57
P07858Cathepsin BCTSB-1.76
* p < 0.05.
Table 2. Differentially expressed nuclear proteins (p < 0.05) in the γT3-treated MDA-MB-231 cells compared with the untreated control.
(A) Upregulated Nuclear Proteins
AccessionProtein DescriptionGene Symbol* Fold-change
P08133Annexin A6ANXA62.24
Q9NZM1MyoferlinMYOF1.08
Q562R1Beta-actin-like protein 2ACTBL27.96
P16615Sarcoplasmic/endoplasmic reticulum calcium ATPase 2ATP2A21.2
P68363Tubulin alpha-1B chainTUBA1B3.83
Q9BQE3Tubulin alpha-1C chainTUBA1C2.37
Q71U36Tubulin alpha-1A chainTUBA1A2.82
P09525Annexin A4ANXA42.31
P68366Tubulin alpha-4A chainTUBA4A2.43
Q13748Tubulin alpha-3C/D chainTUBA3C1.79
P46977Dolichyl-diphosphooligosaccharide-protein glycosyltransferase subunit STT3ASTT3A2.44
P35610Sterol O-acyltransferase 1SOAT12.79
O94905Erlin-2ERLIN21.25
Q9NY65Tubulin alpha-8 chainTUBA81.2
P50993Sodium/potassium-transporting ATPase subunit alpha-2ATP1A21.74
P13637Sodium/potassium-transporting ATPase subunit alpha-3ATP1A31.6
Q9Y6C9Mitochondrial carrier homolog 2MTCH21.33
Q9BWM7Sideroflexin-3SFXN31.17
Q9P035Very-long-chain (3R)-3-hydroxyacyl-CoA dehydratase 3HACD32.34
Q5JWF2Guanine nucleotide-binding protein G(s) subunit alpha isoforms XLasGNAS2.31
Q14151Scaffold attachment factor B2SAFB23.14
Q9NZ01Very-long-chain enoyl-CoA reductaseTECR2.12
Q9HD45Transmembrane 9 superfamily member 3TM9SF32.38
Q9NQC3Reticulon-4RTN42.81
P14406Cytochrome c oxidase subunit 7A2, mitochondrialCOX7A24.23
P1812460S ribosomal protein L7RPL73.08
P6291760S ribosomal protein L8RPL83.71
P4677860S ribosomal protein L21RPL213.6
P15153Ras-related C3 botulinum toxin substrate 2RAC22.78
P50151Guanine nucleotide-binding protein G(I)/G(S)/G(O) subunit gamma-10GNG101.52
P2209040S ribosomal protein S4, Y isoform 1RPS4Y12.29
P6291360S ribosomal protein L11RPL113.31
Q9UBM77-dehydrocholesterol reductaseDHCR72.51
Q9BQ39ATP-dependent RNA helicase DDX50DDX502.11
P35613BasiginBSG1.28
Q9H299SH3 domain-binding glutamic acid-rich-like protein 3SH3BGRL31.62
P09669Cytochrome c oxidase subunit 6CCOX6C4.24
P4677960S ribosomal protein L28RPL281.39
P09496Clathrin light chain ACLTA2.84
Q5TZA2RootletinCROCC3.44
Q13409Cytoplasmic dynein 1 intermediate chain 2DYNC1I21.47
Q13526Peptidyl-prolyl cis-trans isomerase NIMA-interacting 1PIN11.25
Q969 × 1Protein lifeguard 3TMBIM11.14
Q8TD4740S ribosomal protein S4, Y isoform 2RPS4Y22.3
O75964ATP synthase subunit g, mitochondrialATP5L2
P6131360S ribosomal protein L15RPL153.87
Q6NVV1Putative 60S ribosomal protein L13a protein RPL13AP3RPL13AP33.53
P14649Myosin light chain 6BMYL6B2.51
Q96EP5DAZ-associated protein 1DAZAP13.1
Q71UM540S ribosomal protein S27-likeRPS27L3.3
O95678Keratin, type II cytoskeletal 75KRT751.78
P24539ATP synthase F(0) complex subunit B1, mitochondrialATP5F12.78
(B) Down-Regulated Nuclear Proteins
AccessionProtein DescriptionGene Symbol* Fold-change
P31942Heterogeneous nuclear ribonucleoprotein H3HNRNPH3-1.03
Q09161Nuclear cap-binding protein subunit 1NCBP1-1.62
Q9NZN4EH domain-containing protein 2EHD2-1.06
Q9Y262Eukaryotic translation initiation factor 3 subunit LEIF3L-1.21
Q01105Protein SETSET-1.36
P0DMV9Heat shock 70 kDa protein 1BHSPA1B-1.89
Q9Y224UPF0568 protein C14orf166RTRAF-1.09
O75390Citrate synthase, mitochondrialCS-1.73
Q01844RNA-binding protein EWSEWSR1-1.29
P68400Casein kinase II subunit alphaCSNK2A1-1.23
P36776Lon protease homolog, mitochondrialLONP1-1.44
Q13347Eukaryotic translation initiation factor 3 subunit IEIF3I-1.32
Q96AE4Far upstream element-binding protein 1FUBP1-1.29
P0DME0Protein SETSIPSETSIP-1.45
Q9UQE7Structural maintenance of chromosomes protein 3SMC3-1.11
P63279SUMO-conjugating enzyme UBC9UBE2I-2.08
Q96FQ6Protein S100-A16S100A16-1.06
P25205DNA replication licensing factor MCM3MCM3-1.51
Q03518Antigen peptide transporter 1TAP1-1.81
Q8IX12Cell division cycle and apoptosis regulator protein 1CCAR1-1.38
P53701Cytochrome c-type heme lyaseHCCS-1.82
P8293028S ribosomal protein S34, mitochondrialMRPS34-1.28
O60814Histone H2B type 1-KHIST1H2BK-1.88
Q01085Nucleolysin TIARTIAL1-1.89
O75923DysferlinDYSF-1.23
Q96ND0Protein FAM210AFAM210A-3.82
M2P21980Protein-glutamine gamma-glutamyltransferase 2TGM2-1.54
* p < 0.05.
Table 3. List of the unique proteins in the union and intersections between the cytoplasmic and nuclear protein compartment of MDA-MB-231 cells in response to γT3 treatment.
CompartmentTotalElements
Cytoplasmic and Nuclear7ATP1A3, TUBA1C, LONP1, DYNC1I2, SET, RAC2 and SETSIP
Cytoplasmic Proteins104SMS, HSPD1, PSMA2, PSMB1, MAP4, CCAR2, FH, PRMT1, UBE2V2, DBI, ACTA2, CLTCL1, ATP1A4, ECHS1, CD151, PTTG1IP, CD9, PSMB6, HSD17B10, PPIAL4A, COPG1, RAC1, UBE2NL, ALCAM, ACTG2, EIF1AY, CYCS, PABPC4, SSB, HADH, ARL6IP5, CTSB, UBE2K, PRDX3, PSME3, COPG2, XRCC6, DYNLL1, RAB25, GANAB, PCBP3, HNRNPD, RPLP0, PSME2, SEC22B, HNRNPAB, YARS, COTL1, RPLP0P6, GSN, SYNCRIP, MYH14, TUFM, PTPA, IPO7, TPD52L2, GNA11, RAB11A, CD59, PRMT8, GNB2, PGM1, ACTC1, ATP1B3, RPLP2, PSAP, SPR, PCNA, MYDGF, ABCE1, HLA-A, WBP2, LCP1, SCAMP4, PSMA1, NCL, PC, HNRNPA1, SCAMP2, VAMP3, ATP5IF1, FKBP1A, CTTN, EIF3G, PSMB7, SHMT1, PPM1G, RAB1A, TRIM28, UBE2D3, SHMT2, PSMD7, SDHA, FKBP4, RAB2B, PCBP2, NPC2, RAB6A, CD97, PSMD2, CBR1, ALDH2, ATP1B1 and OAT
Nuclear Proteins72RPL13AP3, PIN1, CCAR1, STT3A, MCM3, EIF3I, RTN4, ACTBL2, ATP5F1, MYL6B, TM9SF3, ANXA6, TUBA4A, EWSR1, DAZAP1, ERLIN2, RTRAF, RPL28, RPL7, MYOF, SH3BGRL3, DHCR7, GNG10, TMBIM1, RPS27L, COX6C, ANXA4, TUBA3C, RPS4Y1, ATP2A2, MTCH2, TUBA1A, S100A16, HSPA1B, TAP1, NCBP1, COX7A2, CS, ATP5L, ATP1A2, SOAT1, CROCC, CSNK2A1, TGM2, HNRNPH3, TECR, RPL21, HACD3, CLTA, SMC3, RPL11, SFXN3, RPL8, DDX50, MRPS34, EHD2, GNAS, EIF3L, DYSF, TUBA8, FUBP1, HIST1H2BK, FAM210A, TUBA1B, KRT75, HCCS, UBE2I, BSG, SAFB2, TIAL1, RPS4Y2 and RPL15

