
Proton Detected Solid-State NMR of Membrane Proteins at 28 Tesla (1.2 GHz) and 100 kHz Magic-Angle Spinning

 , ,
, , 
Abstract
:1. Introduction
2. Materials and Methods
2.1. NMR Spectroscopy
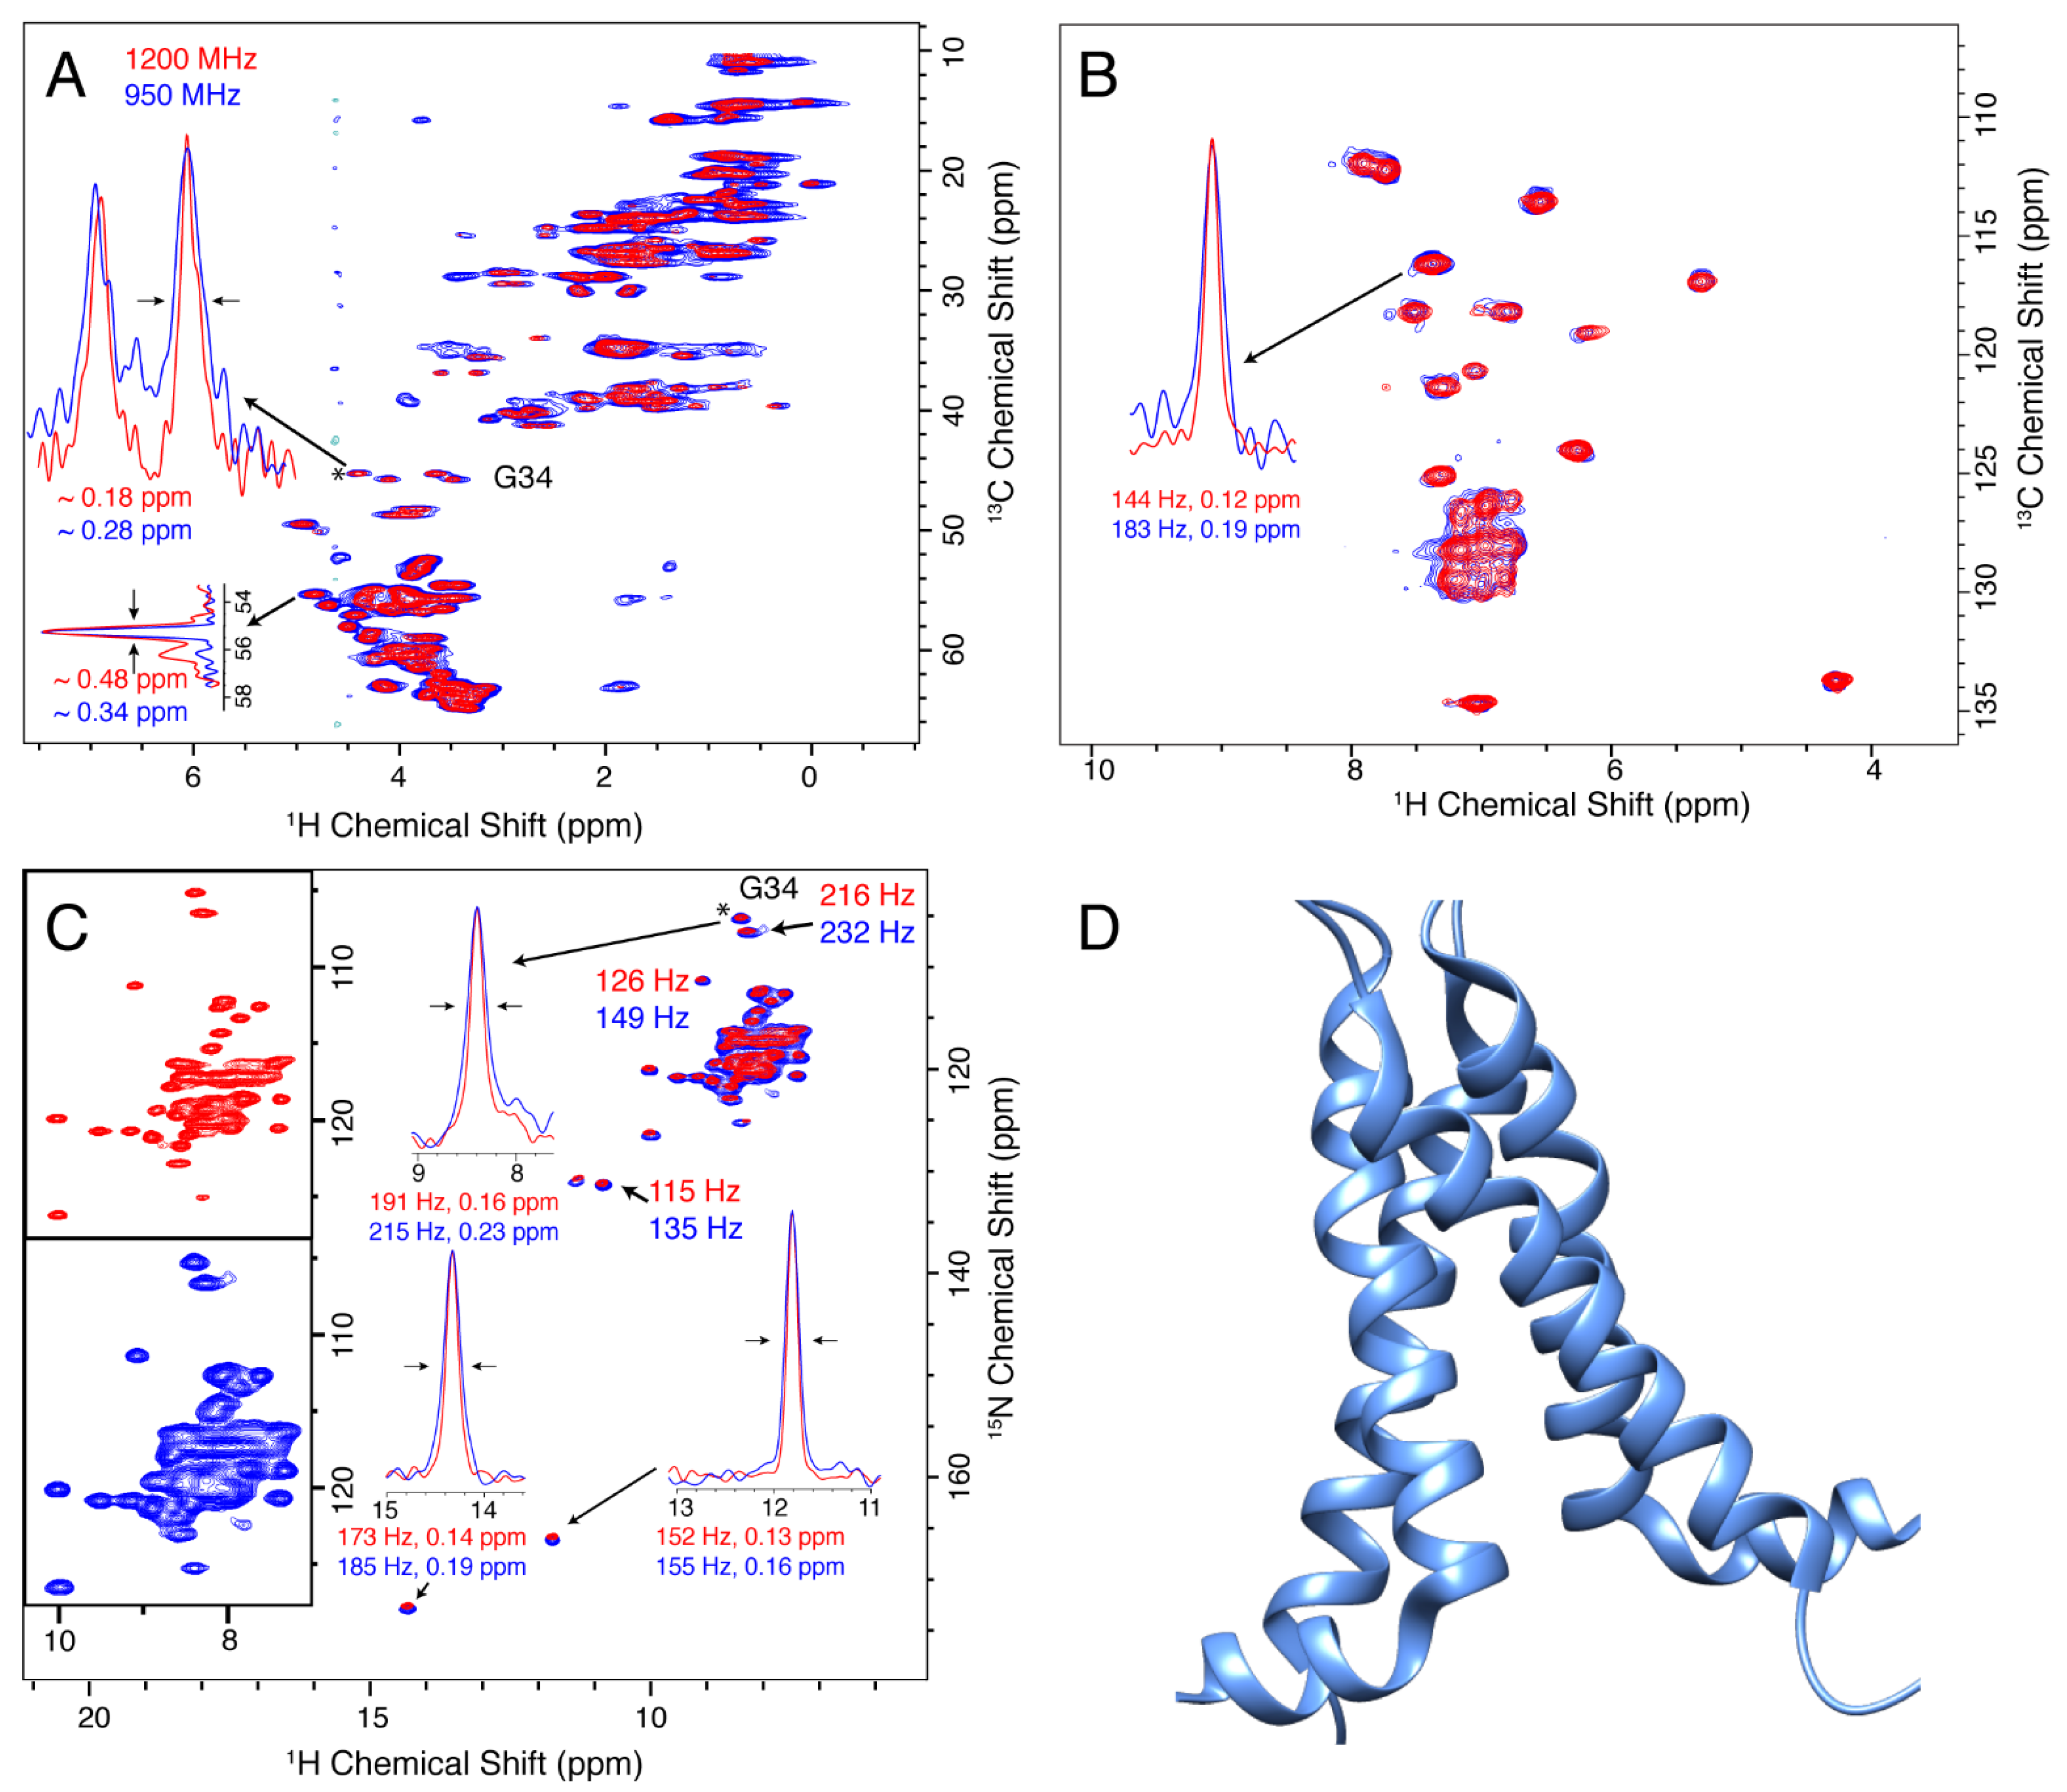
2.2. M2
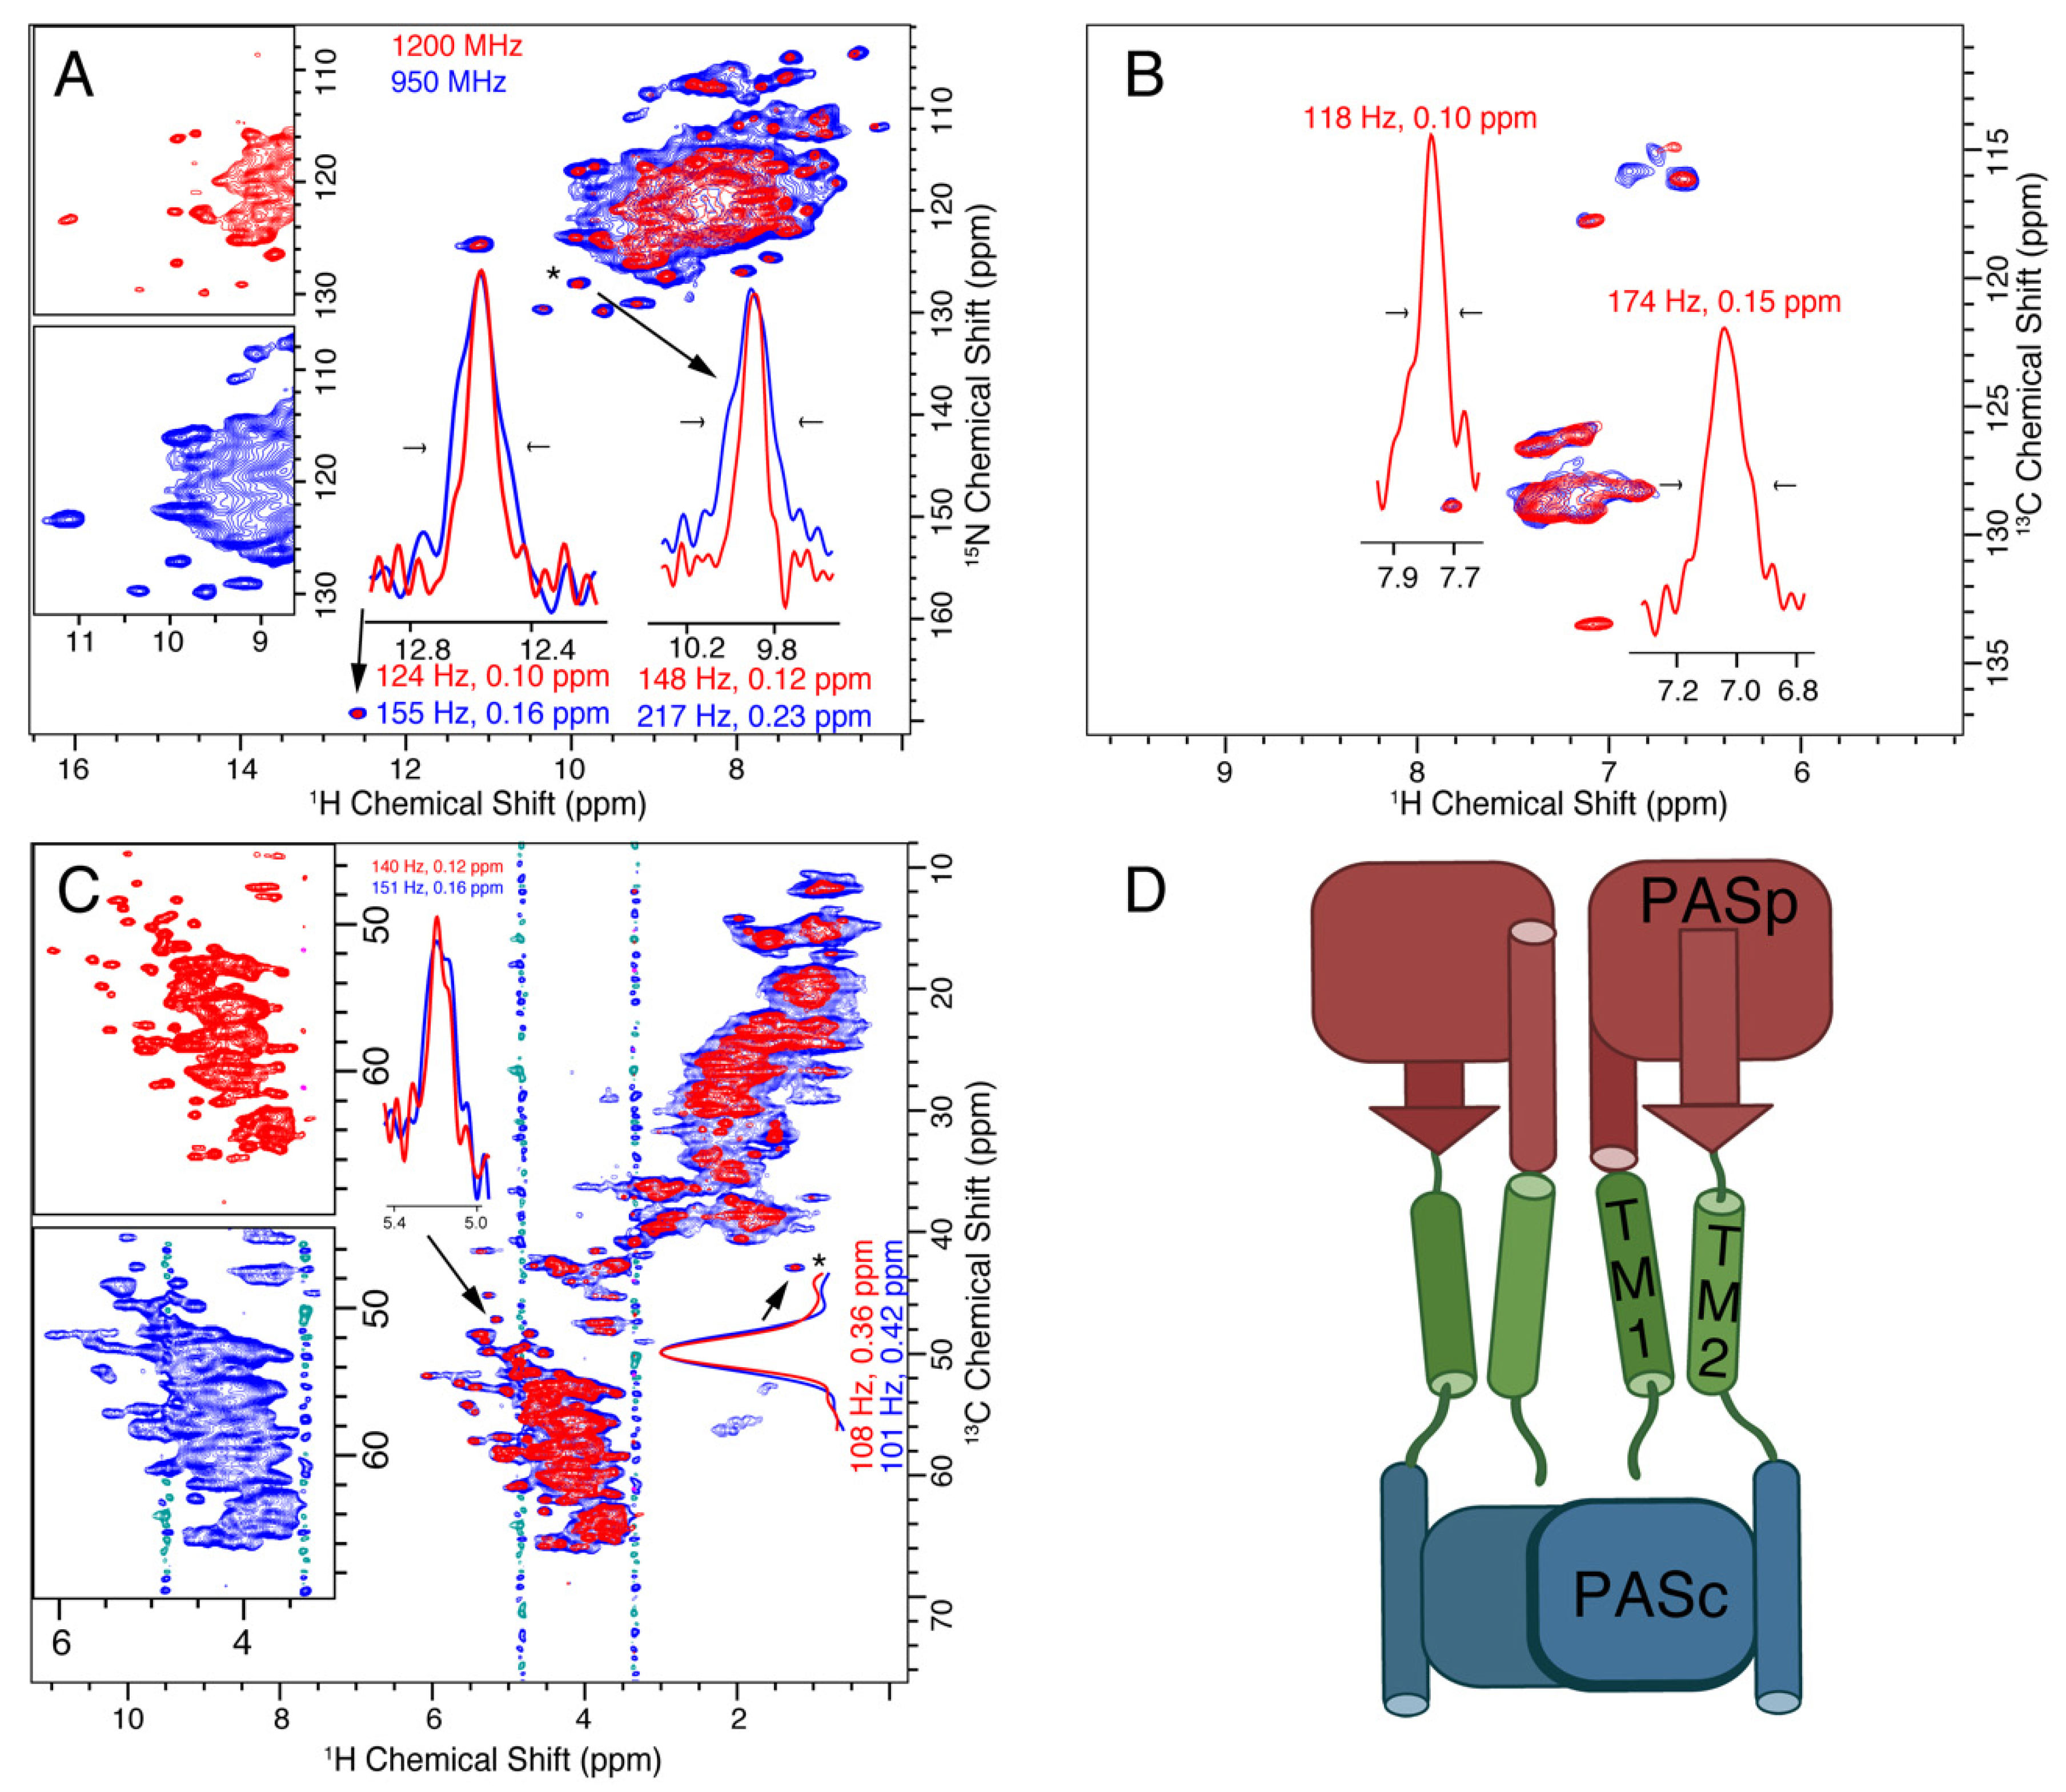
2.3. CitA
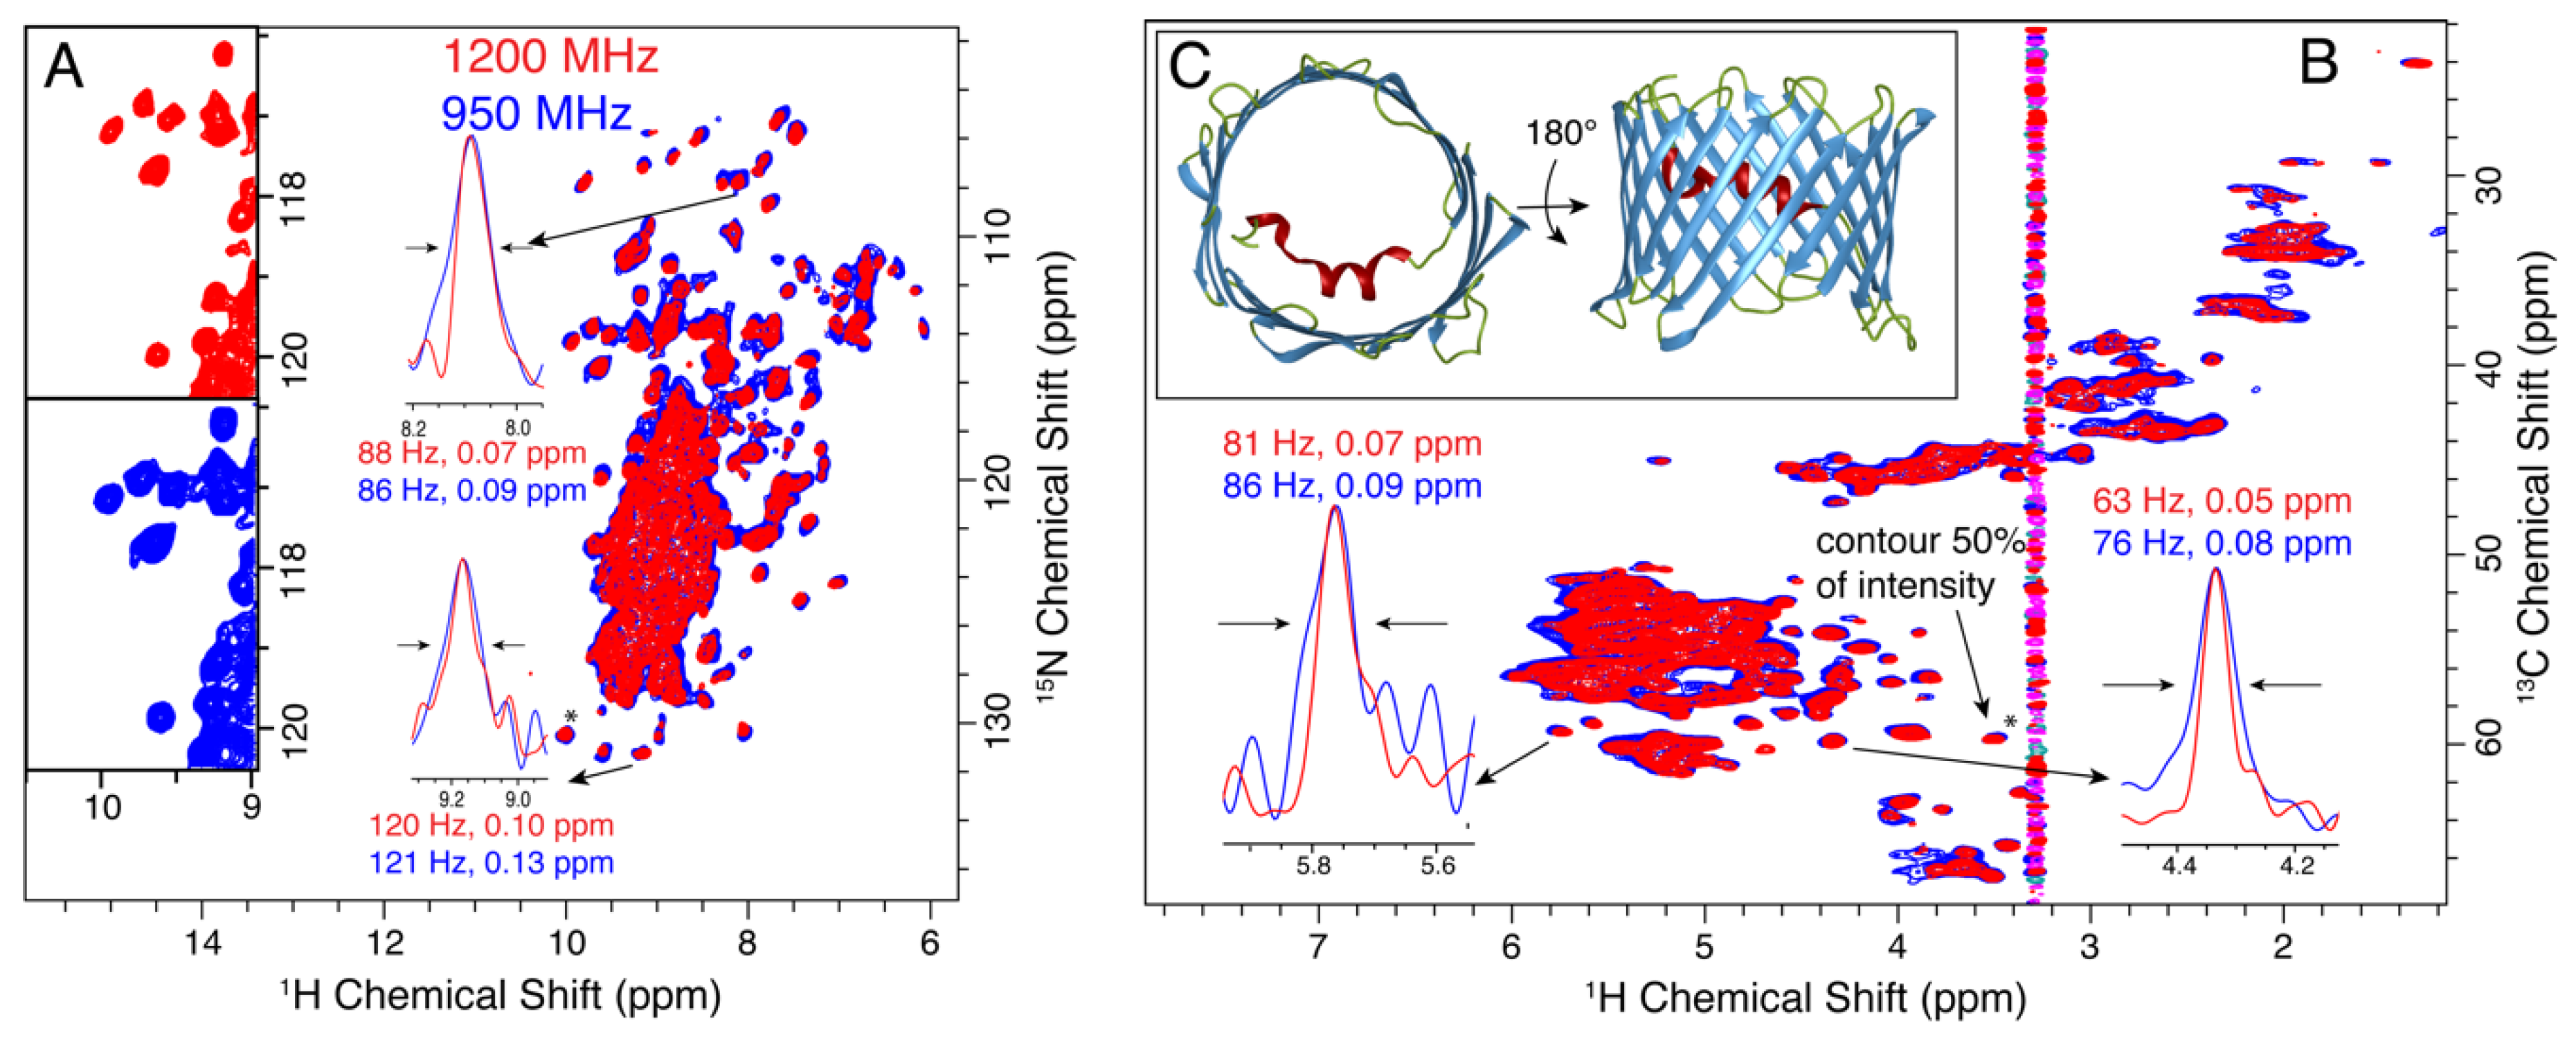
2.4. VDAC
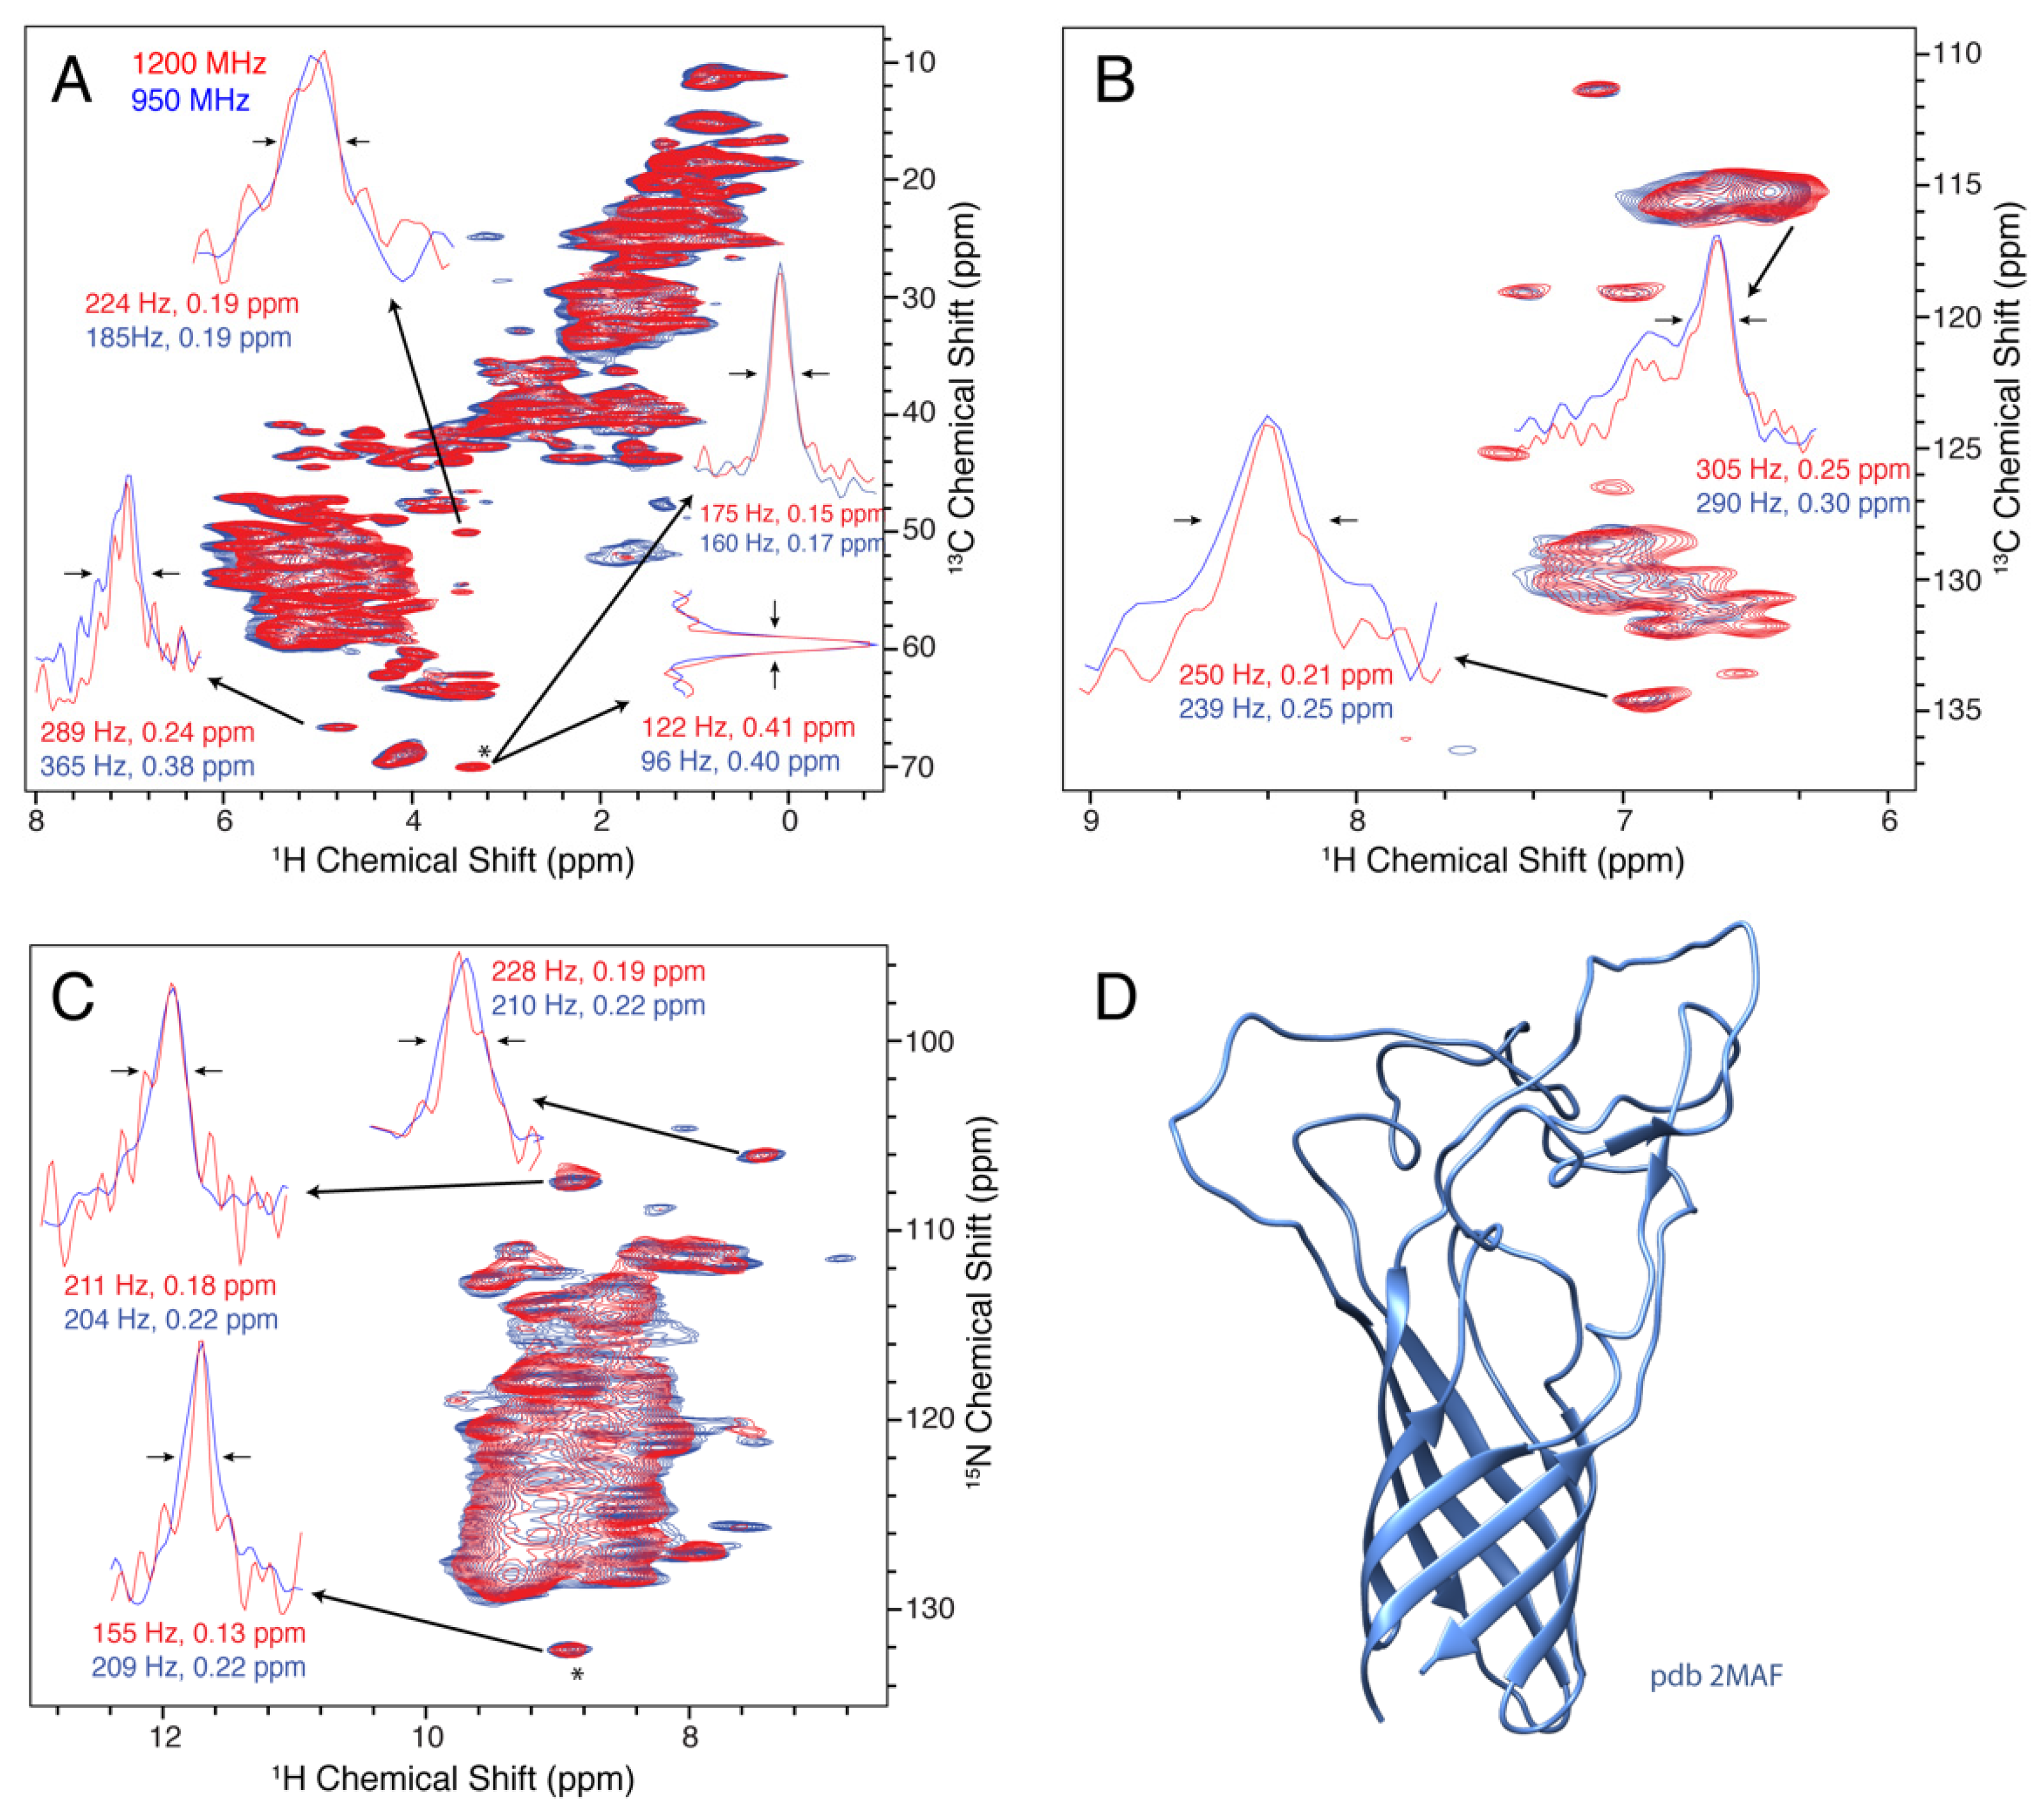
2.5. Opa60
2.6. Simulations
2.7. Structural Refinement and NMR Chemical Shift Calculations with DFT
3. Results and Discussion
3.1. M2

3.2. CitA

3.3. VDAC

3.4. Opa60


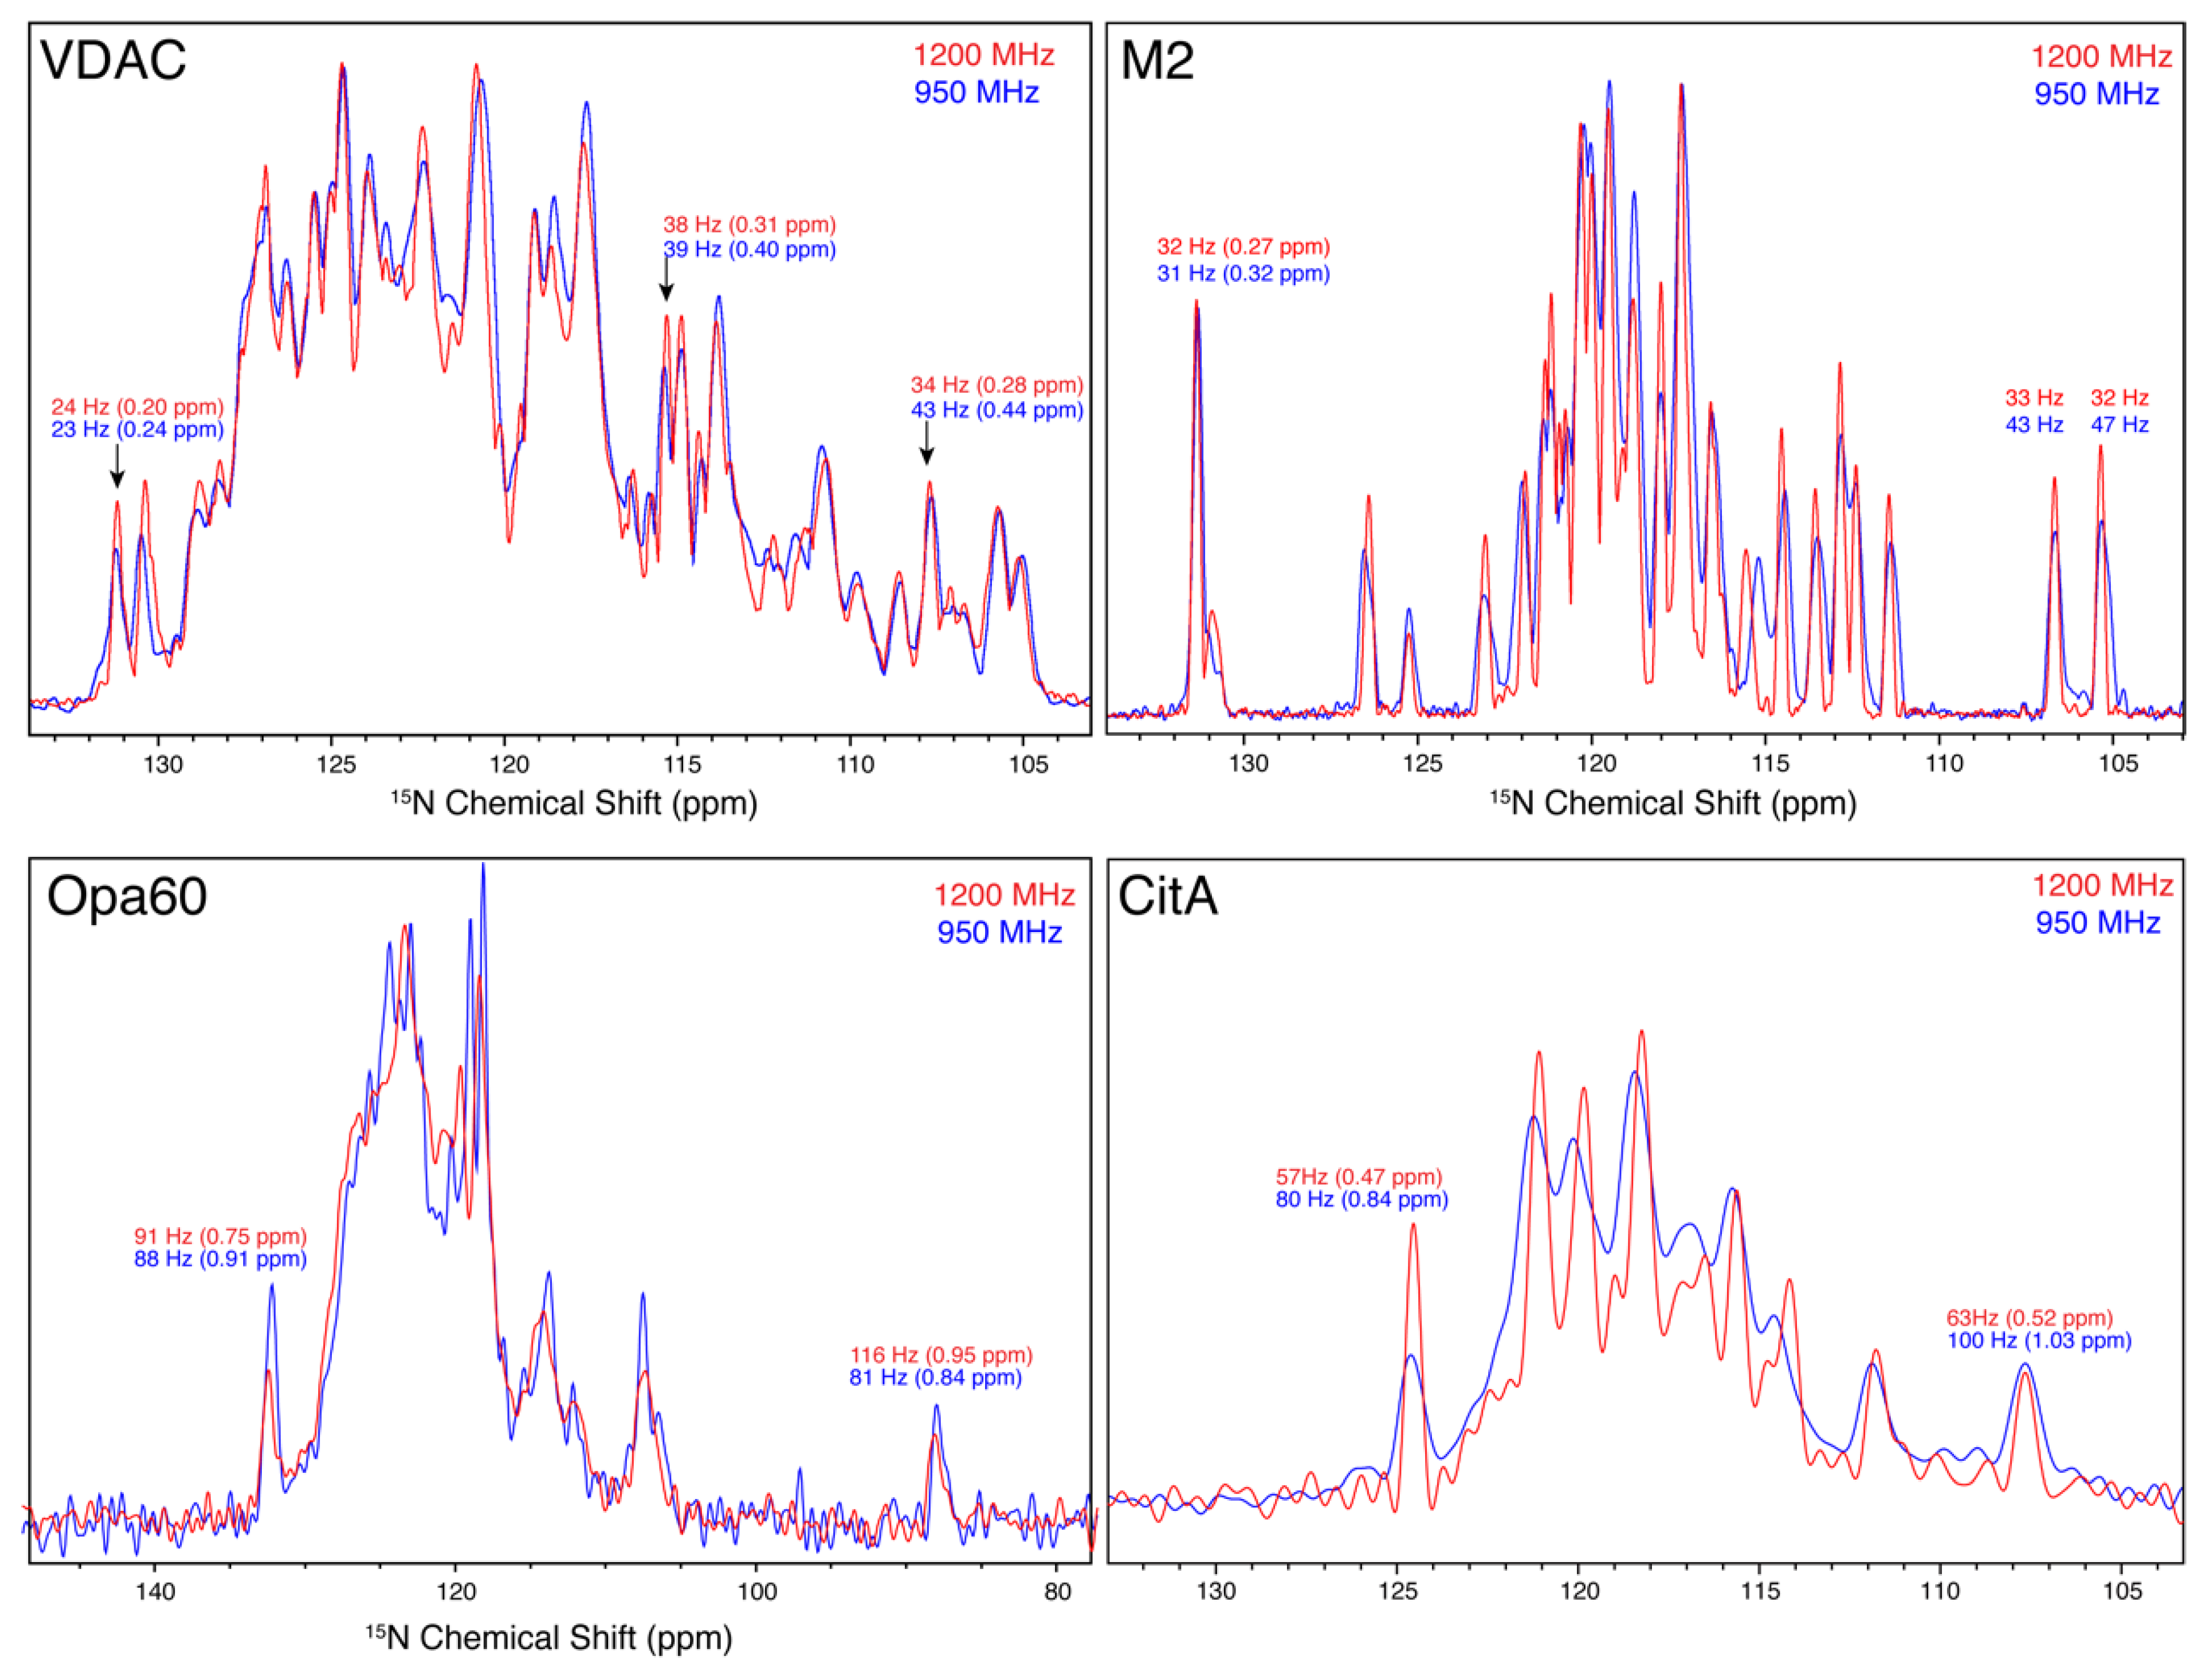
3.5. 15N Linewidths

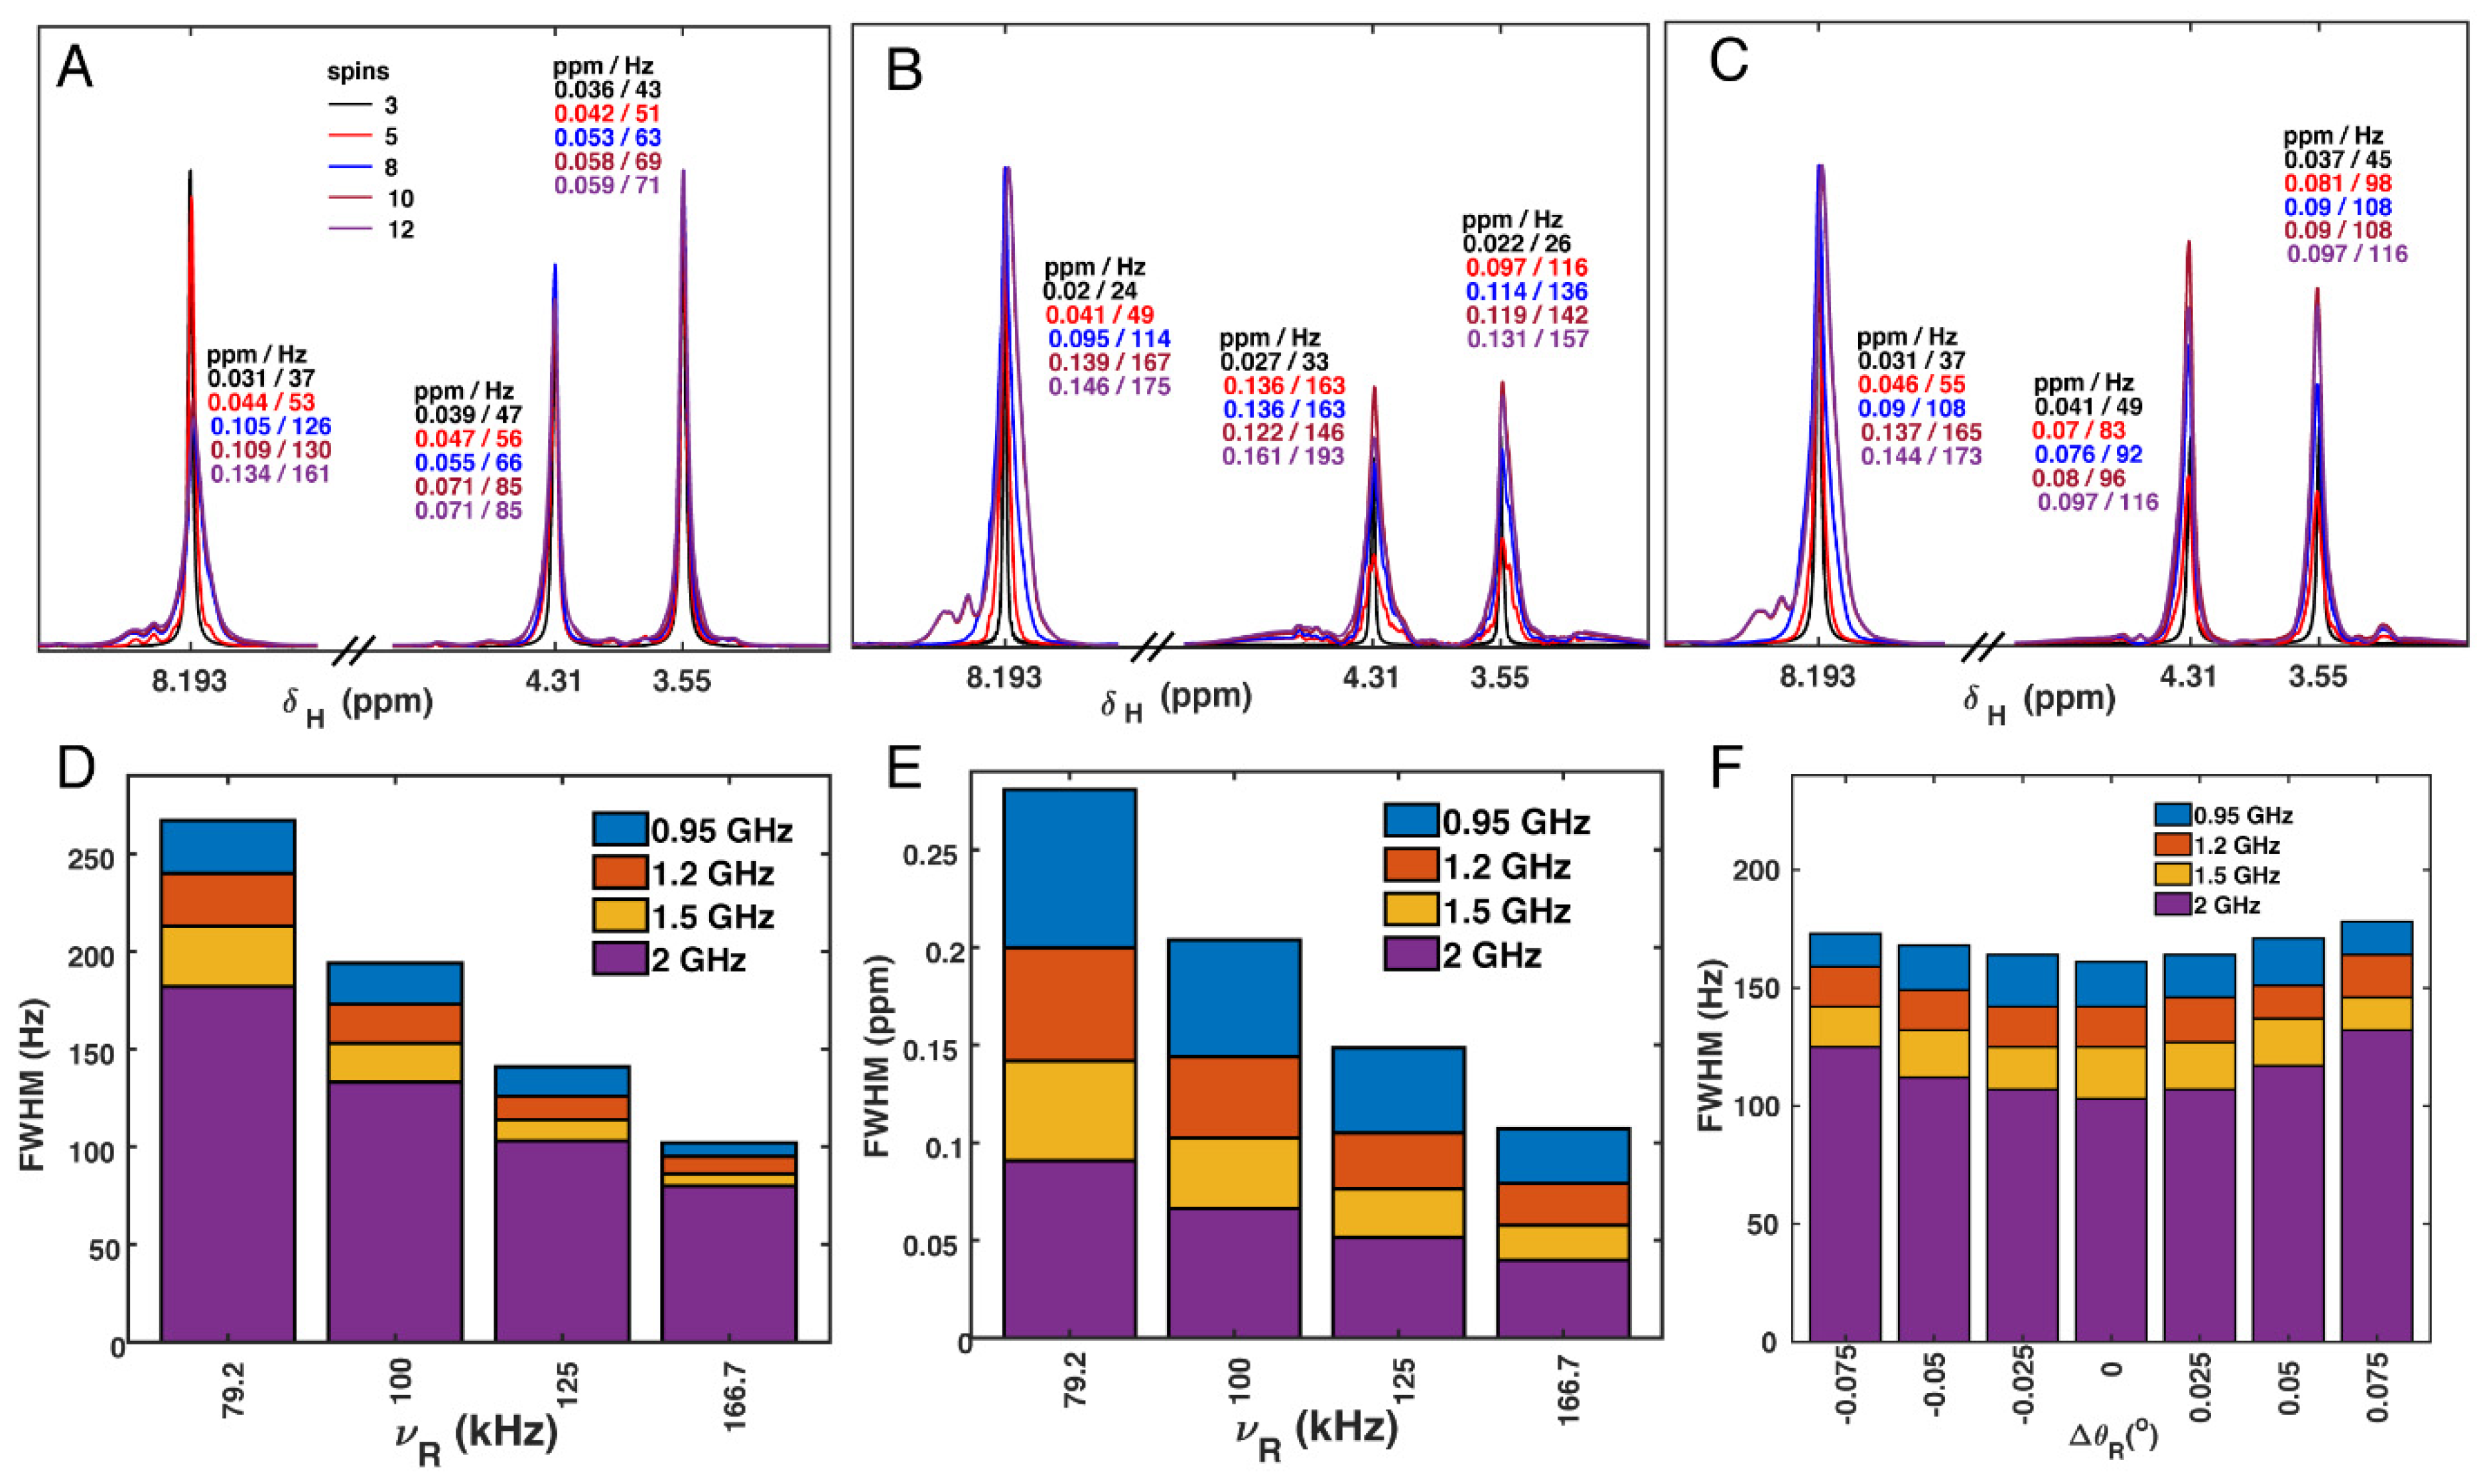
3.6. Proton Linewidth Simulations

4. Conclusions
Supplementary Materials
Author Contributions
Funding
Institutional Review Board Statement
Informed Consent Statement
Data Availability Statement
Acknowledgments
Conflicts of Interest
References
- Bodenhausen, G.; Ruben, D.J. Natural abundance nitrogen-15 NMR by enhanced heteronuclear spectroscopy. Chem. Phys. Lett. 1980, 69, 185–189. [Google Scholar] [CrossRef] [Green Version]
- Ishii, Y.; Yesinowski, J.P.; Tycko, R. Sensitivity enhancement in solid-state (13)C NMR of synthetic polymers and biopolymers by (1)H NMR detection with high-speed magic angle spinning. J. Am. Chem. Soc. 2001, 123, 2921–2922. [Google Scholar] [CrossRef]
- Maricq, M.M.; Waugh, J.S. NMR in rotating solids. J. Chem. Phys. 1979, 70, 3300–3316. [Google Scholar] [CrossRef]
- Chevelkov, V.; Rehbein, K.; Diehl, A.; Reif, B. Ultrahigh resolution in proton solid-state NMR spectroscopy at high levels of deuteration. Angew. Chem. Int. Ed. Engl. 2006, 45, 3878–3881. [Google Scholar] [CrossRef] [PubMed]
- Chevelkov, V.; van Rossum, B.J.; Castellani, F.; Rehbein, K.; Diehl, A.; Hohwy, M.; Steuernagel, S.; Engelke, F.; Oschkinat, H.; Reif, B. 1H detection in MAS solid-state NMR spectroscopy of biomacromolecules employing pulsed field gradients for residual solvent suppression. J. Am. Chem. Soc. 2003, 125, 7788–7789. [Google Scholar] [CrossRef] [PubMed]
- McDermott, A.E.; Creuzet, F.J.; Kolbert, A.C.; Griffin, R.G. High-resolution magic-angle-spinning NMR spectra of protons in deuterated solids. J. Magn. Reson. 1992, 98, 408–413. [Google Scholar] [CrossRef]
- Paulson, E.K.; Morcombe, C.R.; Gaponenko, V.; Dancheck, B.; Byrd, R.A.; Zilm, K.W. Sensitive high resolution inverse detection NMR spectroscopy of proteins in the solid state. J. Am. Chem. Soc. 2003, 125, 15831–15836. [Google Scholar] [CrossRef]
- Reif, B.; Jaroniec, C.P.; Rienstra, C.M.; Hohwy, M.; Griffin, R.G. 1H–1H MAS correlation spectroscopy and distance measurements in a deuterated peptide. J. Magn. Reson. 2001, 151, 320–327. [Google Scholar] [CrossRef] [Green Version]
- Zheng, L.; Fishbein, K.W.; Griffin, R.G.; Herzfeld, J. Two-dimensional solid-state proton NMR and proton exchange. J. Am. Chem. Soc. 1993, 115, 6254–6261. [Google Scholar] [CrossRef]
- Medeiros-Silva, J.; Mance, D.; Daniëls, M.; Jekhmane, S.; Houben, K.; Baldus, M.; Weingarth, M. 1H-detected solid-state NMR studies of water-inaccessible proteins in vitro and in situ. Angew. Chem. Int. Ed. Engl. 2016, 55, 13606–13610. [Google Scholar] [CrossRef] [Green Version]
- Ward, M.E.; Shi, L.; Lake, E.; Krishnamurthy, S.; Hutchins, H.; Brown, L.S.; Ladizhansky, V. Proton-detected solid-state NMR reveals intramembrane polar networks in a seven-helical transmembrane protein proteorhodopsin. J. Am. Chem. Soc. 2011, 133, 17434–17443. [Google Scholar] [CrossRef]
- Akbey, U.; Lange, S.; Trent Franks, W.; Linser, R.; Rehbein, K.; Diehl, A.; van Rossum, B.J.; Reif, B.; Oschkinat, H. Optimum levels of exchangeable protons in perdeuterated proteins for proton detection in MAS solid-state NMR spectroscopy. J. Biomol. NMR 2010, 46, 67–73. [Google Scholar] [CrossRef] [Green Version]
- Zhou, D.H.; Graesser, D.T.; Franks, W.T.; Rienstra, C.M. Sensitivity and resolution in proton solid-state NMR at intermediate deuteration levels: Quantitative linewidth characterization and applications to correlation spectroscopy. J. Magn. Reson. 2006, 178, 297–307. [Google Scholar] [CrossRef] [PubMed]
- Samoson, A.; Tuherm, T.; Gan, Z. High-field high-speed MAS resolution enhancement in 1H NMR spectroscopy of solids. Solid State Nucl. Magn. Reson. 2001, 20, 130–136. [Google Scholar] [CrossRef]
- Böckmann, A.; Ernst, M.; Meier, B.H. Spinning proteins, the faster, the better? J. Magn. Reson. 2015, 253, 71–79. [Google Scholar] [CrossRef] [Green Version]
- Xue, K.; Sarkar, R.; Tosner, Z.; Lalli, D.; Motz, C.; Koch, B.; Pintacuda, G.; Reif, B. MAS dependent sensitivity of different isotopomers in selectively methyl protonated protein samples in solid state NMR. J. Biomol. NMR 2019, 73, 625–631. [Google Scholar] [CrossRef] [Green Version]
- Knight, M.J.; Webber, A.L.; Pell, A.J.; Guerry, P.; Barbet-Massin, E.; Bertini, I.; Felli, I.C.; Gonnelli, L.; Pierattelli, R.; Emsley, L.; et al. Fast resonance assignment and fold determination of human superoxide dismutase by high-resolution proton-detected solid-state MAS NMR spectroscopy. Angew. Chem. Int. Ed. Engl. 2011, 50, 11697–11701. [Google Scholar] [CrossRef]
- Lewandowski, J.R.; Dumez, J.-N.; Akbey, Ü.; Lange, S.; Emsley, L.; Oschkinat, H. Enhanced resolution and coherence lifetimes in the solid-state NMR spectroscopy of perdeuterated proteins under ultrafast magic-angle spinning. J. Phys. Chem. Lett. 2011, 2, 2205–2211. [Google Scholar] [CrossRef]
- Agarwal, V.; Penzel, S.; Szekely, K.; Cadalbert, R.; Testori, E.; Oss, A.; Past, J.; Samoson, A.; Ernst, M.; Böckmann, A.; et al. De novo 3D structure determination from sub-milligram protein samples by solid-state 100 kHz MAS NMR spectroscopy. Angew. Chem. Int. Ed. Engl. 2014, 53, 12253–12256. [Google Scholar] [CrossRef]
- Barbet-Massin, E.; Pell, A.J.; Retel, J.S.; Andreas, L.B.; Jaudzems, K.; Franks, W.T.; Nieuwkoop, A.J.; Hiller, M.; Higman, V.; Guerry, P.; et al. Rapid proton-detected NMR assignment for proteins with fast magic angle spinning. J. Am. Chem. Soc. 2014, 136, 12489–12497. [Google Scholar] [CrossRef] [Green Version]
- Linser, R.; Dasari, M.; Hiller, M.; Higman, V.; Fink, U.; Lopez del Amo, J.-M.; Markovic, S.; Handel, L.; Kessler, B.; Schmieder, P.; et al. Proton-detected solid-state NMR spectroscopy of fibrillar and membrane proteins. Angew. Chem. Int. Ed. Engl. 2011, 50, 4508–4512. [Google Scholar] [CrossRef] [PubMed] [Green Version]
- Nieuwkoop, A.J.; Franks, W.T.; Rehbein, K.; Diehl, A.; Akbey, Ü.; Engelke, F.; Emsley, L.; Pintacuda, G.; Oschkinat, H. Sensitivity and resolution of proton detected spectra of a deuterated protein at 40 and 60 kHz magic-angle-spinning. J. Biomol. NMR 2015, 61, 161–171. [Google Scholar] [CrossRef]
- Andreas, L.B.; Le Marchand, T.; Jaudzems, K.; Pintacuda, G. High-resolution proton-detected NMR of proteins at very fast MAS. J. Magn. Reson. 2015, 253, 36–49. [Google Scholar] [CrossRef] [PubMed]
- Penzel, S.; Oss, A.; Org, M.-L.; Samoson, A.; Böckmann, A.; Ernst, M.; Meier, B.H. Spinning faster: Protein NMR at MAS frequencies up to 126 kHz. J. Biomol. NMR 2019, 73, 19–29. [Google Scholar] [CrossRef] [Green Version]
- Schledorn, M.; Malär, A.A.; Torosyan, A.; Penzel, S.; Klose, D.; Oss, A.; Org, M.-L.; Wang, S.; Lecoq, L.; Cadalbert, R.; et al. Protein NMR spectroscopy at 150 kHz magic-angle spinning continues to improve resolution and mass sensitivity. ChemBioChem 2020, 21, 2540–2548. [Google Scholar] [CrossRef]
- Agarwal, V.; Reif, B. Residual methyl protonation in perdeuterated proteins for multi-dimensional correlation experiments in MAS solid-state NMR spectroscopy. J. Magn. Reson. 2008, 194, 16–24. [Google Scholar] [CrossRef] [PubMed]
- Agarwal, V.; Diehl, A.; Skrynnikov, N.; Reif, B. High resolution 1H detected 1H,13C correlation spectra in MAS solid-state NMR using deuterated proteins with selective 1H,2H isotopic labeling of methyl groups. J. Am. Chem. Soc. 2006, 128, 12620–12621. [Google Scholar] [CrossRef]
- Asami, S.; Schmieder, P.; Reif, B. High resolution 1H-detected solid-state NMR spectroscopy of protein aliphatic resonances: Access to tertiary structure information. J. Am. Chem. Soc. 2010, 132, 15133–15135. [Google Scholar] [CrossRef] [PubMed]
- Asami, S.; Szekely, K.; Schanda, P.; Meier, B.H.; Reif, B. Optimal degree of protonation for 1H detection of aliphatic sites in randomly deuterated proteins as a function of the MAS frequency. J. Biomol. NMR 2012, 54, 155–168. [Google Scholar] [CrossRef]
- Asami, S.; Porter, J.R.; Lange, O.F.; Reif, B. Access to Cα backbone dynamics of biological solids by 13C T1 relaxation and molecular dynamics simulation. J. Am. Chem. Soc. 2015, 137, 1094–1100. [Google Scholar] [CrossRef]
- Mance, D.; Sinnige, T.; Kaplan, M.; Narasimhan, S.; Daniëls, M.; Houben, K.; Baldus, M.; Weingarth, M. An efficient labelling approach to harness backbone and side-chain protons in 1H-detected solid-state NMR spectroscopy. Angew. Chem. Int. Ed. Engl. 2015, 54, 15799–15803. [Google Scholar] [CrossRef] [Green Version]
- Cala-De Paepe, D.; Stanek, J.; Jaudzems, K.; Tars, K.; Andreas, L.B.; Pintacuda, G. Is protein deuteration beneficial for proton detected solid-state NMR at and above 100 kHz magic-angle spinning? Solid State Nucl. Magn. Reson. 2017, 87, 126–136. [Google Scholar] [CrossRef]
- Gardner, K.H.; Rosen, M.K.; Kay, L.E. Global folds of highly deuterated, methyl-protonated proteins by multidimensional NMR. Biochemistry 1997, 36, 1389–1401. [Google Scholar] [CrossRef]
- Goto, N.K.; Gardner, K.H.; Mueller, G.A.; Willis, R.C.; Kay, L.E. A robust and cost-effective method for the production of Val, Leu, Ile (delta 1) methyl-protonated 15N-, 13C-, 2H-labeled proteins. J. Biomol. NMR 1999, 13, 369–374. [Google Scholar] [CrossRef]
- Gans, P.; Hamelin, O.; Sounier, R.; Ayala, I.; Durá, M.A.; Amero, C.D.; Noirclerc-Savoye, M.; Franzetti, B.; Plevin, M.J.; Boisbouvier, J. Stereospecific isotopic labeling of methyl groups for NMR spectroscopic studies of high-molecular-weight proteins. Angew. Chem. Int. Ed. Engl. 2010, 49, 1958–1962. [Google Scholar] [CrossRef]
- Huber, M.; Hiller, S.; Schanda, P.; Ernst, M.; Böckmann, A.; Verel, R.; Meier, B.H. A proton-detected 4D solid-state NMR experiment for protein structure determination. ChemPhysChem 2011, 12, 915–918. [Google Scholar] [CrossRef]
- Kurauskas, V.; Crublet, E.; Macek, P.; Kerfah, R.; Gauto, D.F.; Boisbouvier, J.; Schanda, P. Sensitive proton-detected solid-state NMR spectroscopy of large proteins with selective CH3 labelling: Application to the 50S ribosome subunit. Chem. Commun. 2016, 52, 9558–9561. [Google Scholar] [CrossRef] [Green Version]
- Linser, R.; Bardiaux, B.; Higman, V.; Fink, U.; Reif, B. Structure calculation from unambiguous long-range amide and methyl 1H-1H distance restraints for a microcrystalline protein with MAS solid-state NMR spectroscopy. J. Am. Chem. Soc. 2011, 133, 5905–5912. [Google Scholar] [CrossRef] [Green Version]
- Takahashi, H.; Kainosho, M.; Akutsu, H.; Fujiwara, T. 1H-detected 1H-1H correlation spectroscopy of a stereo-array isotope labeled amino acid under fast magic-angle spinning. J. Magn. Reson. 2010, 203, 253–256. [Google Scholar] [CrossRef]
- Wang, S.; Parthasarathy, S.; Nishiyama, Y.; Endo, Y.; Nemoto, T.; Yamauchi, K.; Asakura, T.; Takeda, M.; Terauchi, T.; Kainosho, M.; et al. Nano-mole scale side-chain signal assignment by 1H-detected protein solid-state NMR by ultra-fast magic-angle spinning and stereo-array isotope labeling. PLoS ONE 2015, 10, e0122714. [Google Scholar] [CrossRef] [Green Version]
- Movellan, K.T.; Najbauer, E.E.; Pratihar, S.; Salvi, M.; Giller, K.; Becker, S.; Andreas, L.B. Alpha protons as NMR probes in deuterated proteins. J. Biomol. NMR 2019, 73, 81–91. [Google Scholar] [CrossRef]
- Saxena, K.; Dutta, A.; Klein-Seetharaman, J.; Schwalbe, H. Isotope labeling in insect cells. Methods Mol. Biol. 2012, 831, 37–54. [Google Scholar] [CrossRef] [PubMed] [Green Version]
- Franke, B.; Opitz, C.; Isogai, S.; Grahl, A.; Delgado, L.; Gossert, A.D.; Grzesiek, S. Production of isotope-labeled proteins in insect cells for NMR. J. Biomol. NMR 2018, 71, 173–184. [Google Scholar] [CrossRef] [PubMed] [Green Version]
- Sastry, M.; Bewley, C.A.; Kwong, P.D. Mammalian expression of isotopically labeled proteins for NMR spectroscopy. Adv. Exp. Med. Biol. 2012, 992, 197–211. [Google Scholar] [CrossRef]
- Zhou, D.H.; Shah, G.; Cormos, M.; Mullen, C.; Sandoz, D.; Rienstra, C.M. Proton-detected solid-state NMR spectroscopy of fully protonated proteins at 40 kHz magic-angle spinning. J. Am. Chem. Soc. 2007, 129, 11791–11801. [Google Scholar] [CrossRef] [PubMed]
- Marchetti, A.; Jehle, S.; Felletti, M.; Knight, M.J.; Wang, Y.; Xu, Z.-Q.; Park, A.Y.; Otting, G.; Lesage, A.; Emsley, L.; et al. Backbone assignment of fully protonated solid proteins by 1H detection and ultrafast magic-angle-spinning NMR spectroscopy. Angew. Chem. Int. Ed. Engl. 2012, 51, 10756–10759. [Google Scholar] [CrossRef]
- Vasa, S.K.; Rovó, P.; Giller, K.; Becker, S.; Linser, R. Access to aliphatic protons as reporters in non-deuterated proteins by solid-state NMR. Phys. Chem. Chem. Phys. 2016, 18, 8359–8363. [Google Scholar] [CrossRef]
- Mroue, K.H.; Nishiyama, Y.; Kumar Pandey, M.; Gong, B.; McNerny, E.; Kohn, D.H.; Morris, M.D.; Ramamoorthy, A. Proton-detected solid-state NMR spectroscopy of bone with ultrafast magic angle spinning. Sci. Rep. 2015, 5, 11991. [Google Scholar] [CrossRef] [Green Version]
- Nishiyama, Y. Fast magic-angle sample spinning solid-state NMR at 60–100 kHz for natural abundance samples. Solid State Nucl. Magn. Reson. 2016, 78, 24–36. [Google Scholar] [CrossRef]
- Pandey, M.K.; Nishiyama, Y. Determination of NH proton chemical shift anisotropy with 14N–1H heteronuclear decoupling using ultrafast magic angle spinning solid-state NMR. J. Magn. Reson. 2015, 261, 133–140. [Google Scholar] [CrossRef]
- Andreas, L.B.; Jaudzems, K.; Stanek, J.; Lalli, D.; Bertarello, A.; Le Marchand, T.; Cala-De Paepe, D.; Kotelovica, S.; Akopjana, I.; Knott, B.; et al. Structure of fully protonated proteins by proton-detected magic-angle spinning NMR. Proc. Natl. Acad. Sci. USA 2016, 113, 9187. [Google Scholar] [CrossRef] [Green Version]
- Xue, K.; Sarkar, R.; Lalli, D.; Koch, B.; Pintacuda, G.; Tosner, Z.; Reif, B. Impact of magnetic field strength on resolution and sensitivity of proton resonances in biological solids. J. Phys. Chem. C 2020, 124, 22631–22637. [Google Scholar] [CrossRef]
- Malär, A.A.; Smith-Penzel, S.; Camenisch, G.-M.; Wiegand, T.; Samoson, A.; Böckmann, A.; Ernst, M.; Meier, B.H. Quantifying proton NMR coherent linewidth in proteins under fast MAS conditions: A second moment approach. Phys. Chem. Chem. Phys. 2019, 21, 18850–18865. [Google Scholar] [CrossRef] [Green Version]
- Butler, M.C.; Dumez, J.-N.; Emsley, L. Dynamics of large nuclear-spin systems from low-order correlations in Liouville space. Chem. Phys. Lett. 2009, 477, 377–381. [Google Scholar] [CrossRef]
- Kuprov, I.; Wagner-Rundell, N.; Hore, P.J. Polynomially scaling spin dynamics simulation algorithm based on adaptive state-space restriction. J. Magn. Reson. 2007, 189, 241–250. [Google Scholar] [CrossRef] [PubMed] [Green Version]
- Marion, D.; Gauto, D.F.; Ayala, I.; Giandoreggio-Barranco, K.; Schanda, P. Microsecond protein dynamics from combined Bloch-McConnell and near-rotary-resonance R1p relaxation-dispersion MAS NMR. ChemPhysChem 2019, 20, 276–284. [Google Scholar] [CrossRef]
- Liang, B.; Tamm, L.K. NMR as a tool to investigate the structure, dynamics and function of membrane proteins. Nat. Struct. Mol. Biol. 2016, 23, 468–474. [Google Scholar] [CrossRef] [Green Version]
- Callon, M.; Malär, A.A.; Pfister, S.; Rímal, V.; Weber, M.E.; Wiegand, T.; Zehnder, J.; Chávez, M.; Deb, R.; Cadalbert, R.; et al. Biomolecular solid-state NMR spectroscopy at highest field: The gain in resolution at 1200 MHz. bioRxiv 2021. [Google Scholar] [CrossRef]
- Thurber, K.R.; Tycko, R. Measurement of sample temperatures under magic-angle spinning from the chemical shift and spin-lattice relaxation rate of 79Br in KBr powder. J. Magn. Reson. 2009, 196, 84–87. [Google Scholar] [CrossRef] [Green Version]
- Zhou, D.H.; Rienstra, C.M. High-performance solvent suppression for proton detected solid-state NMR. J. Magn. Reson. 2008, 192, 167–172. [Google Scholar] [CrossRef] [Green Version]
- Lee, W.; Tonelli, M.; Markley, J.L. NMRFAM-SPARKY: Enhanced software for biomolecular NMR spectroscopy. Bioinformatics 2014, 31, 1325–1327. [Google Scholar] [CrossRef] [PubMed] [Green Version]
- Najbauer, E.E.; Andreas, L.B. Correcting for magnetic field drift in magic-angle spinning NMR datasets. J. Magn. Reson. 2019, 305, 1–4. [Google Scholar] [CrossRef] [PubMed]
- Gassner, M.; Jardetzky, O.; Conover, W. Comparison of convolution and pulse methods for line narrowing in protein NMR spectra. J. Magn. Reson. 1978, 30, 141–146. [Google Scholar] [CrossRef]
- Guéron, M. Line narrowing and line broadening using trigonometric functions. J. Magn. Reson. 1978, 30, 515–520. [Google Scholar] [CrossRef]
- Andreas, L.B.; Eddy, M.T.; Pielak, R.M.; Chou, J.; Griffin, R.G. Magic angle spinning NMR investigation of influenza A M218−60: Support for an allosteric mechanism of inhibition. J. Am. Chem. Soc. 2010, 132, 10958–10960. [Google Scholar] [CrossRef] [Green Version]
- Salvi, M.; Schomburg, B.; Giller, K.; Graf, S.; Unden, G.; Becker, S.; Lange, A.; Griesinger, C. Sensory domain contraction in histidine kinase CitA triggers transmembrane signaling in the membrane-bound sensor. Proc. Natl. Acad. Sci. USA 2017, 114, 3115. [Google Scholar] [CrossRef] [Green Version]
- Eddy, M.T.; Andreas, L.; Teijido, O.; Su, Y.; Clark, L.; Noskov, S.Y.; Wagner, G.; Rostovtseva, T.K.; Griffin, R.G. Magic angle spinning nuclear magnetic resonance characterization of voltage-dependent anion channel gating in two-dimensional lipid crystalline bilayers. Biochemistry 2015, 54, 994–1005. [Google Scholar] [CrossRef] [Green Version]
- Fox, D.A.; Larsson, P.; Lo, R.H.; Kroncke, B.M.; Kasson, P.M.; Columbus, L. Structure of the neisserial outer membrane protein Opa60: Loop flexibility essential to receptor recognition and bacterial engulfment. J. Am. Chem. Soc. 2014, 136, 9938–9946. [Google Scholar] [CrossRef] [Green Version]
- Zhang, X.C.; Forster, M.C.; Nimerovsky, E.; Movellan, K.T.; Andreas, L.B. Transferred-rotational-echo double resonance. J. Phys. Chem. A 2021, 125, 754–769. [Google Scholar] [CrossRef]
- Ernst, R.R.; Bodenhausen, G.; Wokaun, A. Principles of Nuclear Magnetic Resonance in One and Two Dimensions; Clarendon Press: Oxford, UK, 1987. [Google Scholar]
- Nimerovsky, E.; Goldbourt, A. Insights into the spin dynamics of a large anisotropy spin subjected to long-pulse irradiation under a modified REDOR experiment. J. Magn. Reson. 2012, 225, 130–141. [Google Scholar] [CrossRef]
- Hou, G.; Byeon, I.-J.L.; Ahn, J.; Gronenborn, A.M.; Polenova, T. 1H–13C/1H–15N heteronuclear dipolar recoupling by R-symmetry sequences under fast magic angle spinning for dynamics analysis of biological and organic solids. J. Am. Chem. Soc. 2011, 133, 18646–18655. [Google Scholar] [CrossRef] [Green Version]
- Frisch, M.J.; Trucks, G.W.; Schlegel, H.B.; Scuseria, G.E.; Robb, M.A.; Cheeseman, J.R.; Scalmani, G.; Barone, V.; Petersson, G.A.; Nakatsuji, H.; et al. Gaussian 16 Rev. C.01; Gaussian, Inc.: Wallingford, CT, USA, 2016. [Google Scholar]
- Pettersen, E.F.; Goddard, T.D.; Huang, C.C.; Couch, G.S.; Greenblatt, D.M.; Meng, E.C.; Ferrin, T.E. UCSF Chimera—A visualization system for exploratory research and analysis. J. Comput. Chem. 2004, 25, 1605–1612. [Google Scholar] [CrossRef] [Green Version]
- Gauss, J. Effects of electron correlation in the calculation of nuclear magnetic resonance chemical shifts. J. Chem. Phys. 1993, 99, 3629–3643. [Google Scholar] [CrossRef]
- Stewart, J.J.P. Optimization of parameters for semiempirical methods V: Modification of NDDO approximations and application to 70 elements. J. Mol. Model. 2007, 13, 1173–1213. [Google Scholar] [CrossRef] [Green Version]
- Becke, A.D. Density--functional thermochemistry. III. The role of exact exchange. J. Chem. Phys. 1993, 98, 5648–5652. [Google Scholar] [CrossRef] [Green Version]
- Wang, C.; Takeuchi, K.; Pinto, L.H.; Lamb, R.A. Ion channel activity of influenza A virus M2 protein: Characterization of the amantadine block. J. Virol. 1993, 67, 5585–5594. [Google Scholar] [CrossRef] [Green Version]
- Bright, R.A.; Shay, D.K.; Shu, B.; Cox, N.J.; Klimov, A.I. Adamantane resistance among influenza a viruses isolated early during the 2005–2006 influenza season in the United States. JAMA 2006, 295, 891–894. [Google Scholar] [CrossRef] [PubMed] [Green Version]
- Eddy, M.T.; Su, Y.; Silvers, R.; Andreas, L.; Clark, L.; Wagner, G.; Pintacuda, G.; Emsley, L.; Griffin, R.G. Lipid bilayer-bound conformation of an integral membrane beta barrel protein by multidimensional MAS NMR. J. Biomol. NMR 2015, 61, 299–310. [Google Scholar] [CrossRef] [Green Version]
- Malorny, B.; Morelli, G.; Kusecek, B.; Kolberg, J.; Achtman, M. Sequence diversity, predicted two-dimensional protein structure, and epitope mapping of neisserial Opa proteins. J. Bacteriol. 1998, 180, 1323–1330. [Google Scholar] [CrossRef] [Green Version]
- Hauck, C.R.; Meyer, T.F. ‘Small’ talk: Opa proteins as mediators of Neisseria–host-cell communication. Curr. Opin. Microbiol. 2003, 6, 43–49. [Google Scholar] [CrossRef] [Green Version]
- Bos, M.P.; Kao, D.; Hogan, D.M.; Grant, C.C.R.; Belland, R.J. Carcinoembryonic antigen family receptor recognition by gonococcal Opa proteins requires distinct combinations of hypervariable Opa protein domains. Infect. Immun. 2002, 70, 1715–1723. [Google Scholar] [CrossRef] [Green Version]
- Van Vleck, J.H. The dipolar broadening of magnetic resonance lines in crystals. Phys. Rev. 1948, 74, 1168–1183. [Google Scholar] [CrossRef]
- Zorin, V.E.; Brown, S.P.; Hodgkinson, P. Origins of linewidth in H1 magic-angle spinning NMR. J. Chem. Phys. 2006, 125, 144508. [Google Scholar] [CrossRef] [Green Version]
- Brunner, E. Limitations of resolution in the 1H magic-angle-spinning nuclear magnetic resonance spectroscopy of zeolites. J. Chem. Soc. Faraday Trans. 1990, 86, 3957–3960. [Google Scholar] [CrossRef]
- Brunner, E.; Freude, D.; Gerstein, B.C.; Pfeifer, H. Residual linewidths of NMR spectra of spin-12 systems under magic-angle spinning. J. Magn. Reson. 1990, 90, 90–99. [Google Scholar] [CrossRef]
- Brunner, E. Limitations of resolution in the 1H magic angle spinning nuclear magnetic resonance spectroscopy of zeolite. Further results. J. Chem. Soc. Faraday Trans. 1993, 89, 165–169. [Google Scholar] [CrossRef]
- Schnell, I.; Spiess, H.W. High-resolution 1H NMR spectroscopy in the solid state: Very fast sample rotation and multiple-quantum coherences. J. Magn. Reson. 2001, 151, 153–227. [Google Scholar] [CrossRef]
- Xue, K.; Sarkar, R.; Motz, C.; Asami, S.; Decker, V.; Wegner, S.; Tosner, Z.; Reif, B. Magic-angle spinning frequencies beyond 300 kHz are necessary to yield maximum sensitivity in selectively methyl protonated protein samples in solid-state NMR. J. Phys. Chem. C 2018, 122, 16437–16442. [Google Scholar] [CrossRef]
- Sarkar, R.; Rodriguez Camargo, D.C.; Pintacuda, G.; Reif, B. Restoring resolution in biological solid-state NMR under conditions of off-magic-angle spinning. J. Phys. Chem. Lett. 2015, 6, 5040–5044. [Google Scholar] [CrossRef]
- Frye, J.S.; Maciel, G.E. Setting the magic angle using a quadrupolar nuclide. J. Magn. Reson. (1969) 1982, 48, 125–131. [Google Scholar] [CrossRef]
- Xue, K.; Mühlbauer, M.; Mamone, S.; Sarkar, R.; Reif, B. Accurate determination of 1H-15N dipolar couplings using inaccurate settings of the magic angle in solid-state NMR spectroscopy. Angew. Chem. Int. Ed. Engl. 2019, 58, 4286–4290. [Google Scholar] [CrossRef]
- Xue, K.; Mamone, S.; Koch, B.; Sarkar, R.; Reif, B. Determination of methyl order parameters using solid state NMR under off magic angle spinning. J. Biomol. NMR 2019, 73, 471–475. [Google Scholar] [CrossRef] [PubMed]
- Pileio, G.; Guo, Y.; Pham, T.N.; Griffin, J.M.; Levitt, M.H.; Brown, S.P. Residual dipolar couplings by off-magic-angle spinning in solid-state nuclear magnetic resonance spectroscopy. J. Am. Chem. Soc. 2007, 129, 10972–10973. [Google Scholar] [CrossRef]
- Penzel, S.; Smith, A.A.; Ernst, M.; Meier, B.H. Setting the magic angle for fast magic-angle spinning probes. J. Magn. Reson. 2018, 293, 115–122. [Google Scholar] [CrossRef] [PubMed]
Publisher’s Note: MDPI stays neutral with regard to jurisdictional claims in published maps and institutional affiliations. |
© 2021 by the authors. Licensee MDPI, Basel, Switzerland. This article is an open access article distributed under the terms and conditions of the Creative Commons Attribution (CC BY) license (https://creativecommons.org/licenses/by/4.0/).
Share and Cite
Nimerovsky, E.; Movellan, K.T.; Zhang, X.C.; Forster, M.C.; Najbauer, E.; Xue, K.; Dervişoǧlu, R.; Giller, K.; Griesinger, C.; Becker, S.; et al. Proton Detected Solid-State NMR of Membrane Proteins at 28 Tesla (1.2 GHz) and 100 kHz Magic-Angle Spinning. Biomolecules 2021, 11, 752. https://0-doi-org.brum.beds.ac.uk/10.3390/biom11050752
Nimerovsky E, Movellan KT, Zhang XC, Forster MC, Najbauer E, Xue K, Dervişoǧlu R, Giller K, Griesinger C, Becker S, et al. Proton Detected Solid-State NMR of Membrane Proteins at 28 Tesla (1.2 GHz) and 100 kHz Magic-Angle Spinning. Biomolecules. 2021; 11(5):752. https://0-doi-org.brum.beds.ac.uk/10.3390/biom11050752
Chicago/Turabian StyleNimerovsky, Evgeny, Kumar Tekwani Movellan, Xizhou Cecily Zhang, Marcel C. Forster, Eszter Najbauer, Kai Xue, Rıza Dervişoǧlu, Karin Giller, Christian Griesinger, Stefan Becker, and et al. 2021. "Proton Detected Solid-State NMR of Membrane Proteins at 28 Tesla (1.2 GHz) and 100 kHz Magic-Angle Spinning" Biomolecules 11, no. 5: 752. https://0-doi-org.brum.beds.ac.uk/10.3390/biom11050752