
Inflammation Promotes Oxidative and Nitrosative Stress in Chronic Myelogenous Leukemia

 , , , , and
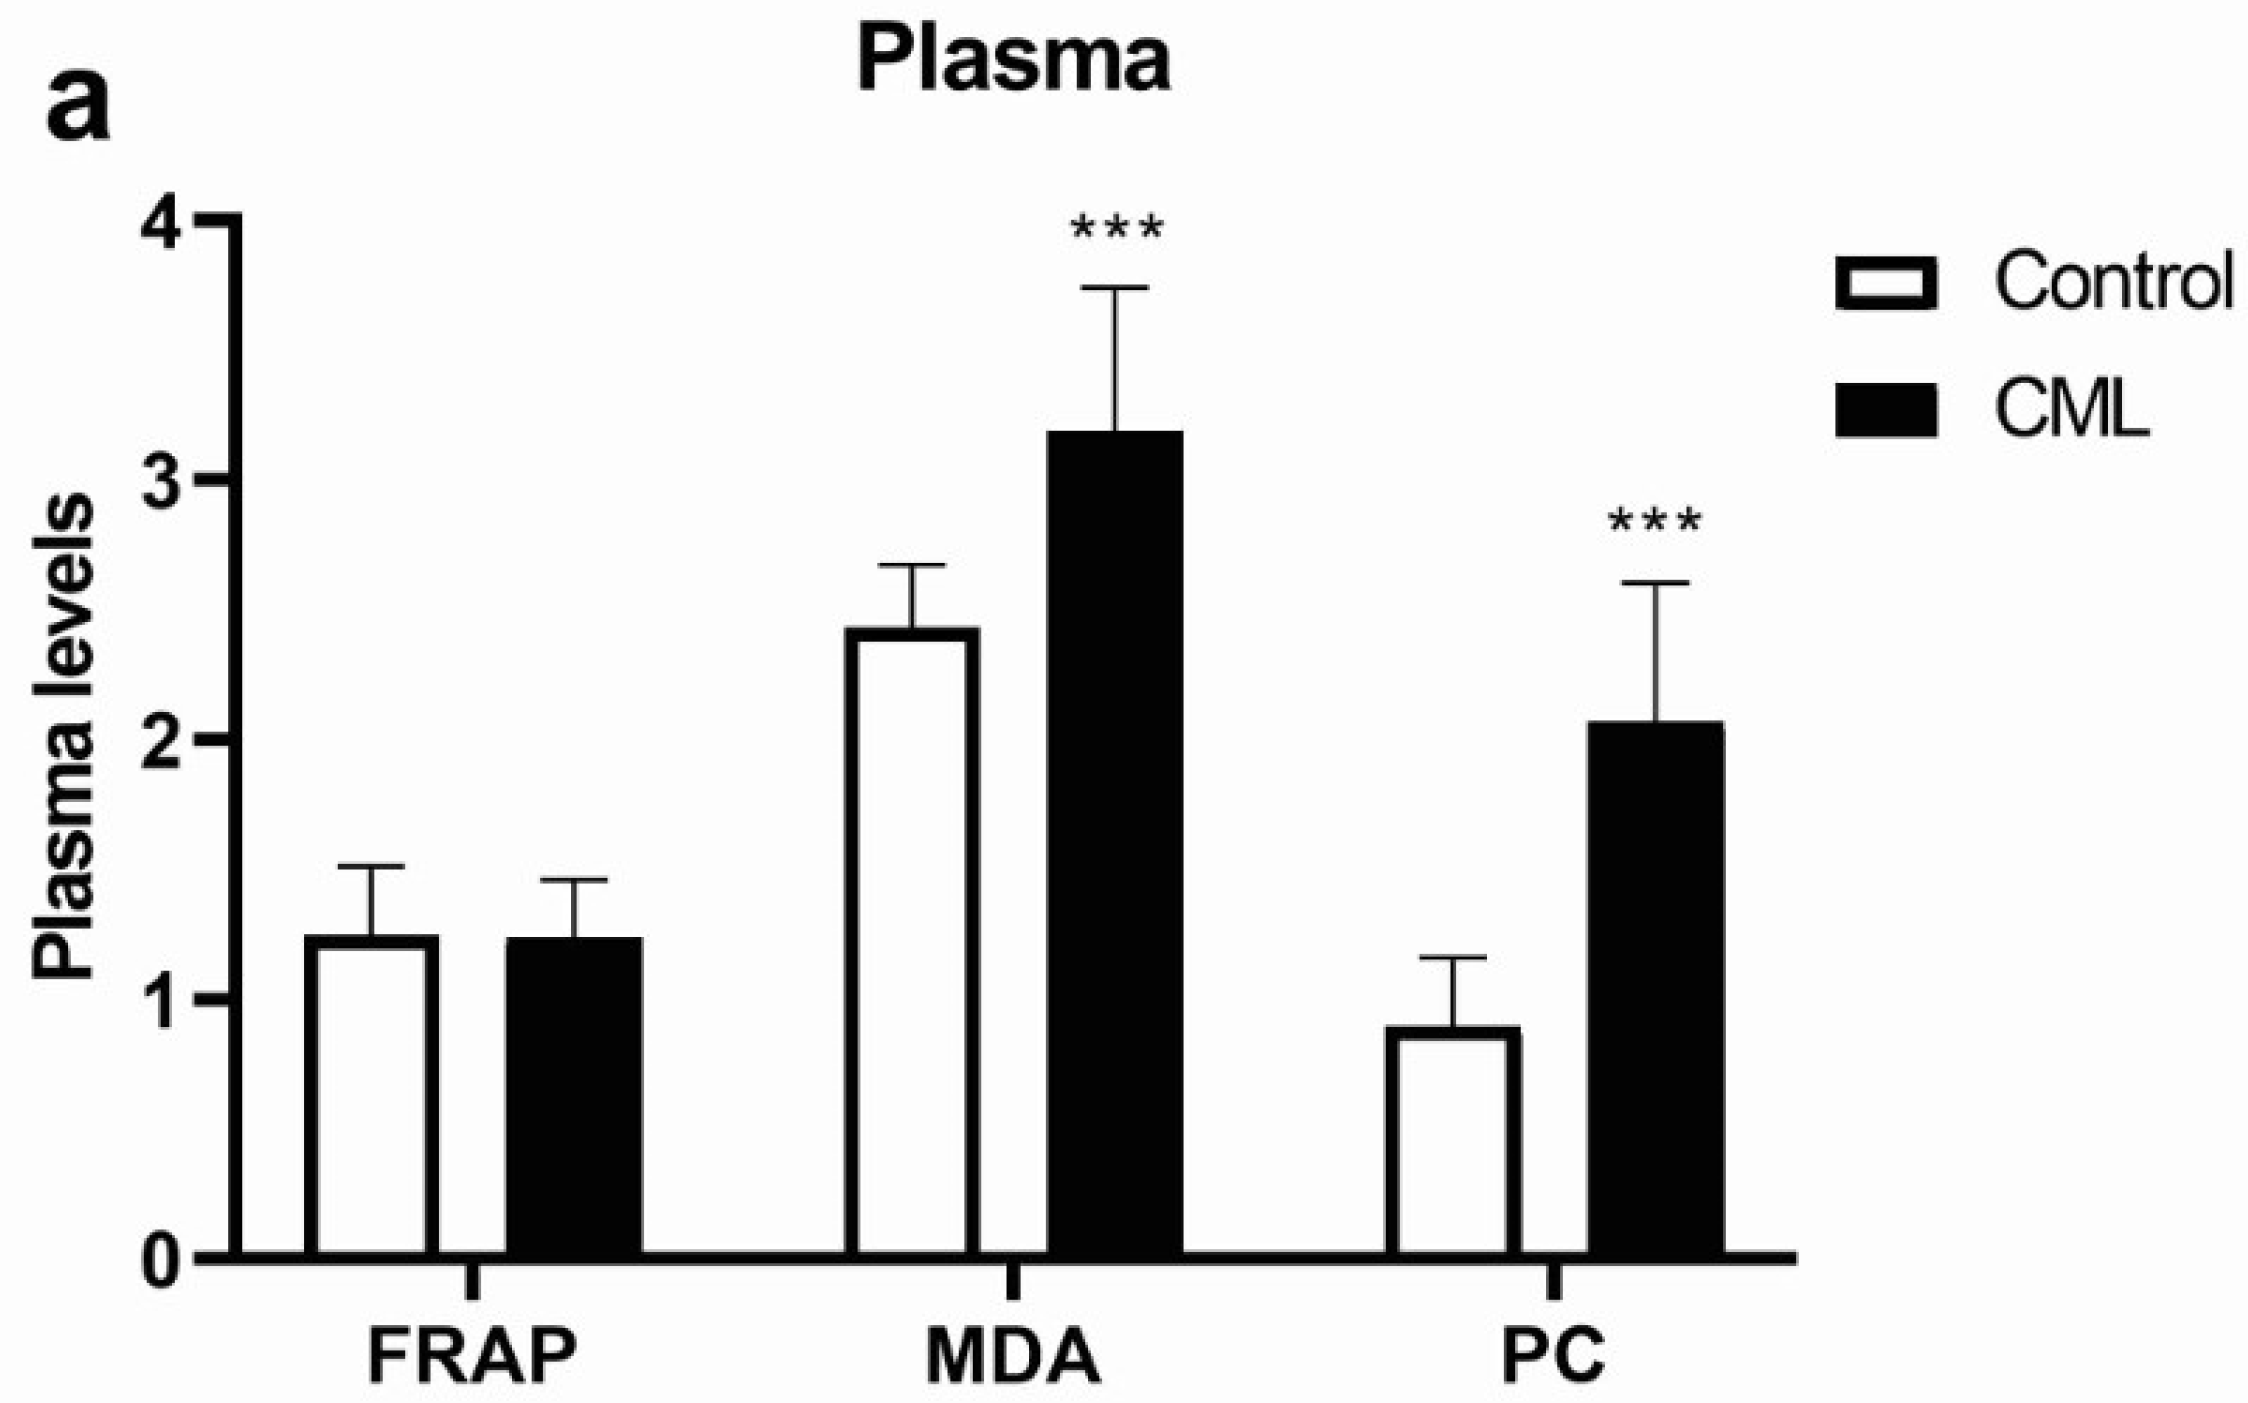
Abstract
:1. Introduction
2. Materials and Methods
2.1. Patients and Healthy Donors
2.2. Plasma Collection and Separation of Erythrocytes
2.3. Biochemical Assays
2.4. ELISA Assay
2.5. Immunocytochemistry
2.6. Tetrazolium Salt Reduction Test, MTT
2.7. In Vitro Study
2.8. Protein Isolation and Immunoblotting
2.9. Statistical Analysis
3. Results
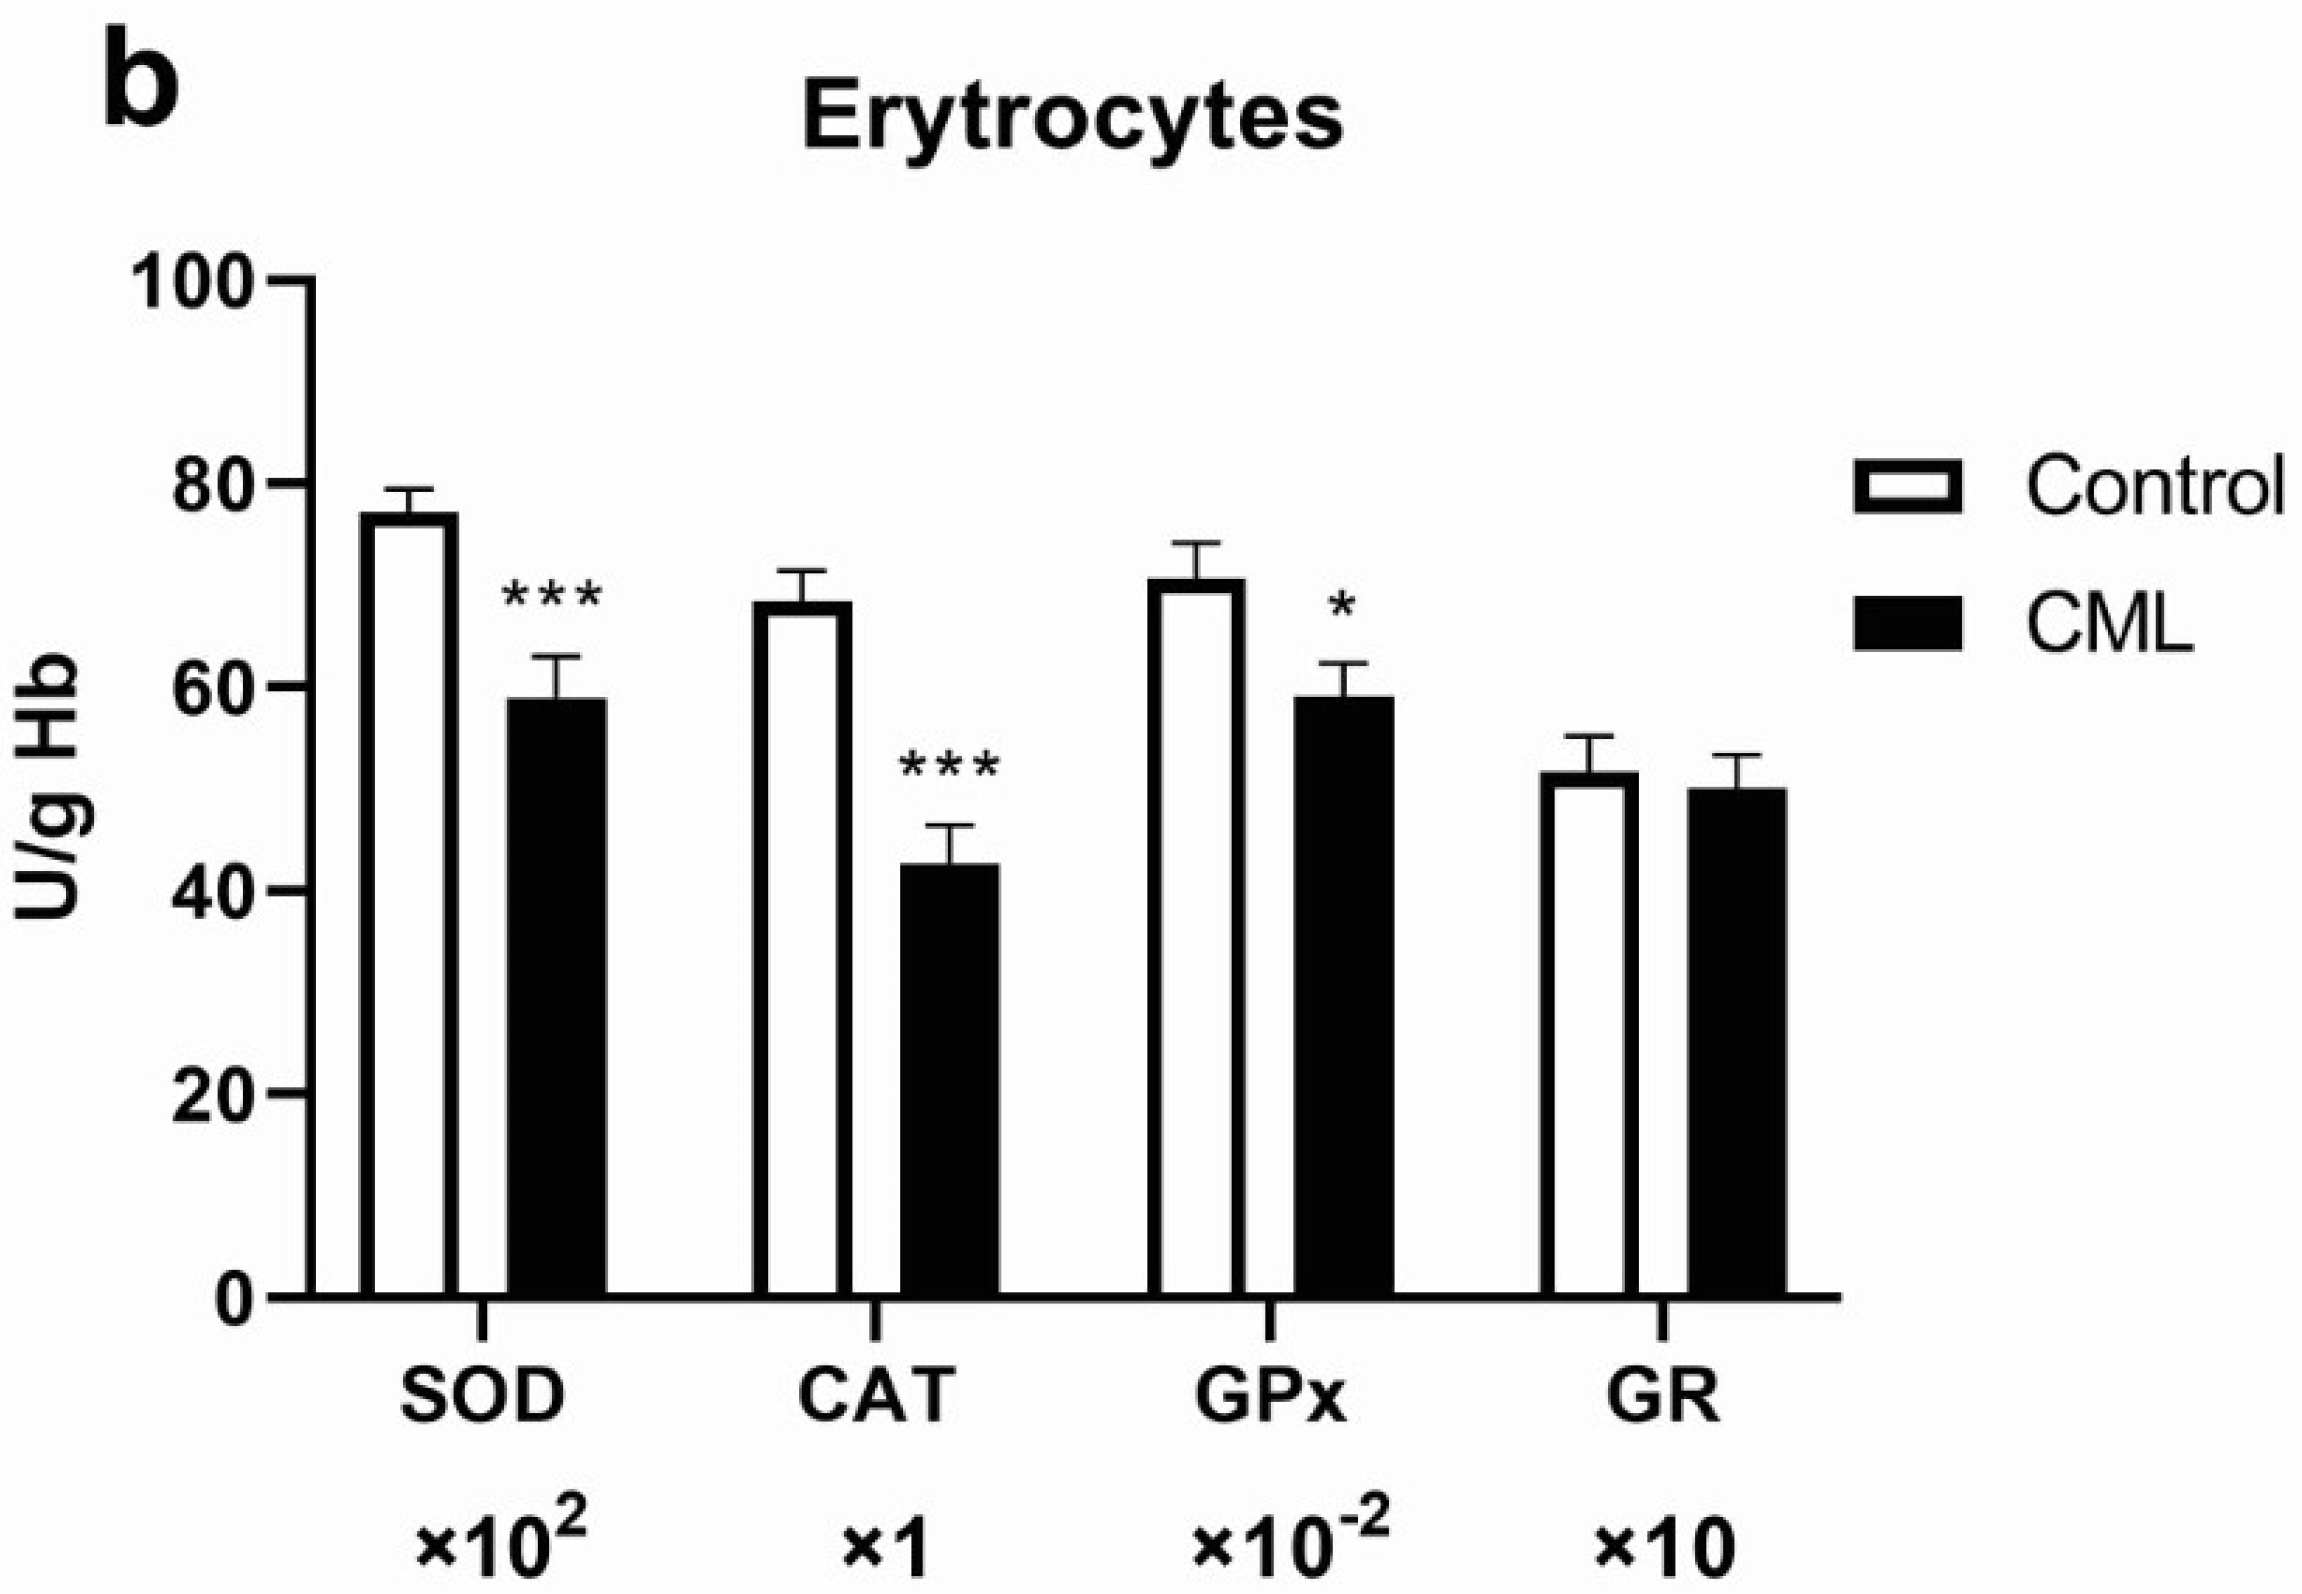
3.1. Oxidative Stress in Chronic Myeloid Leukemia
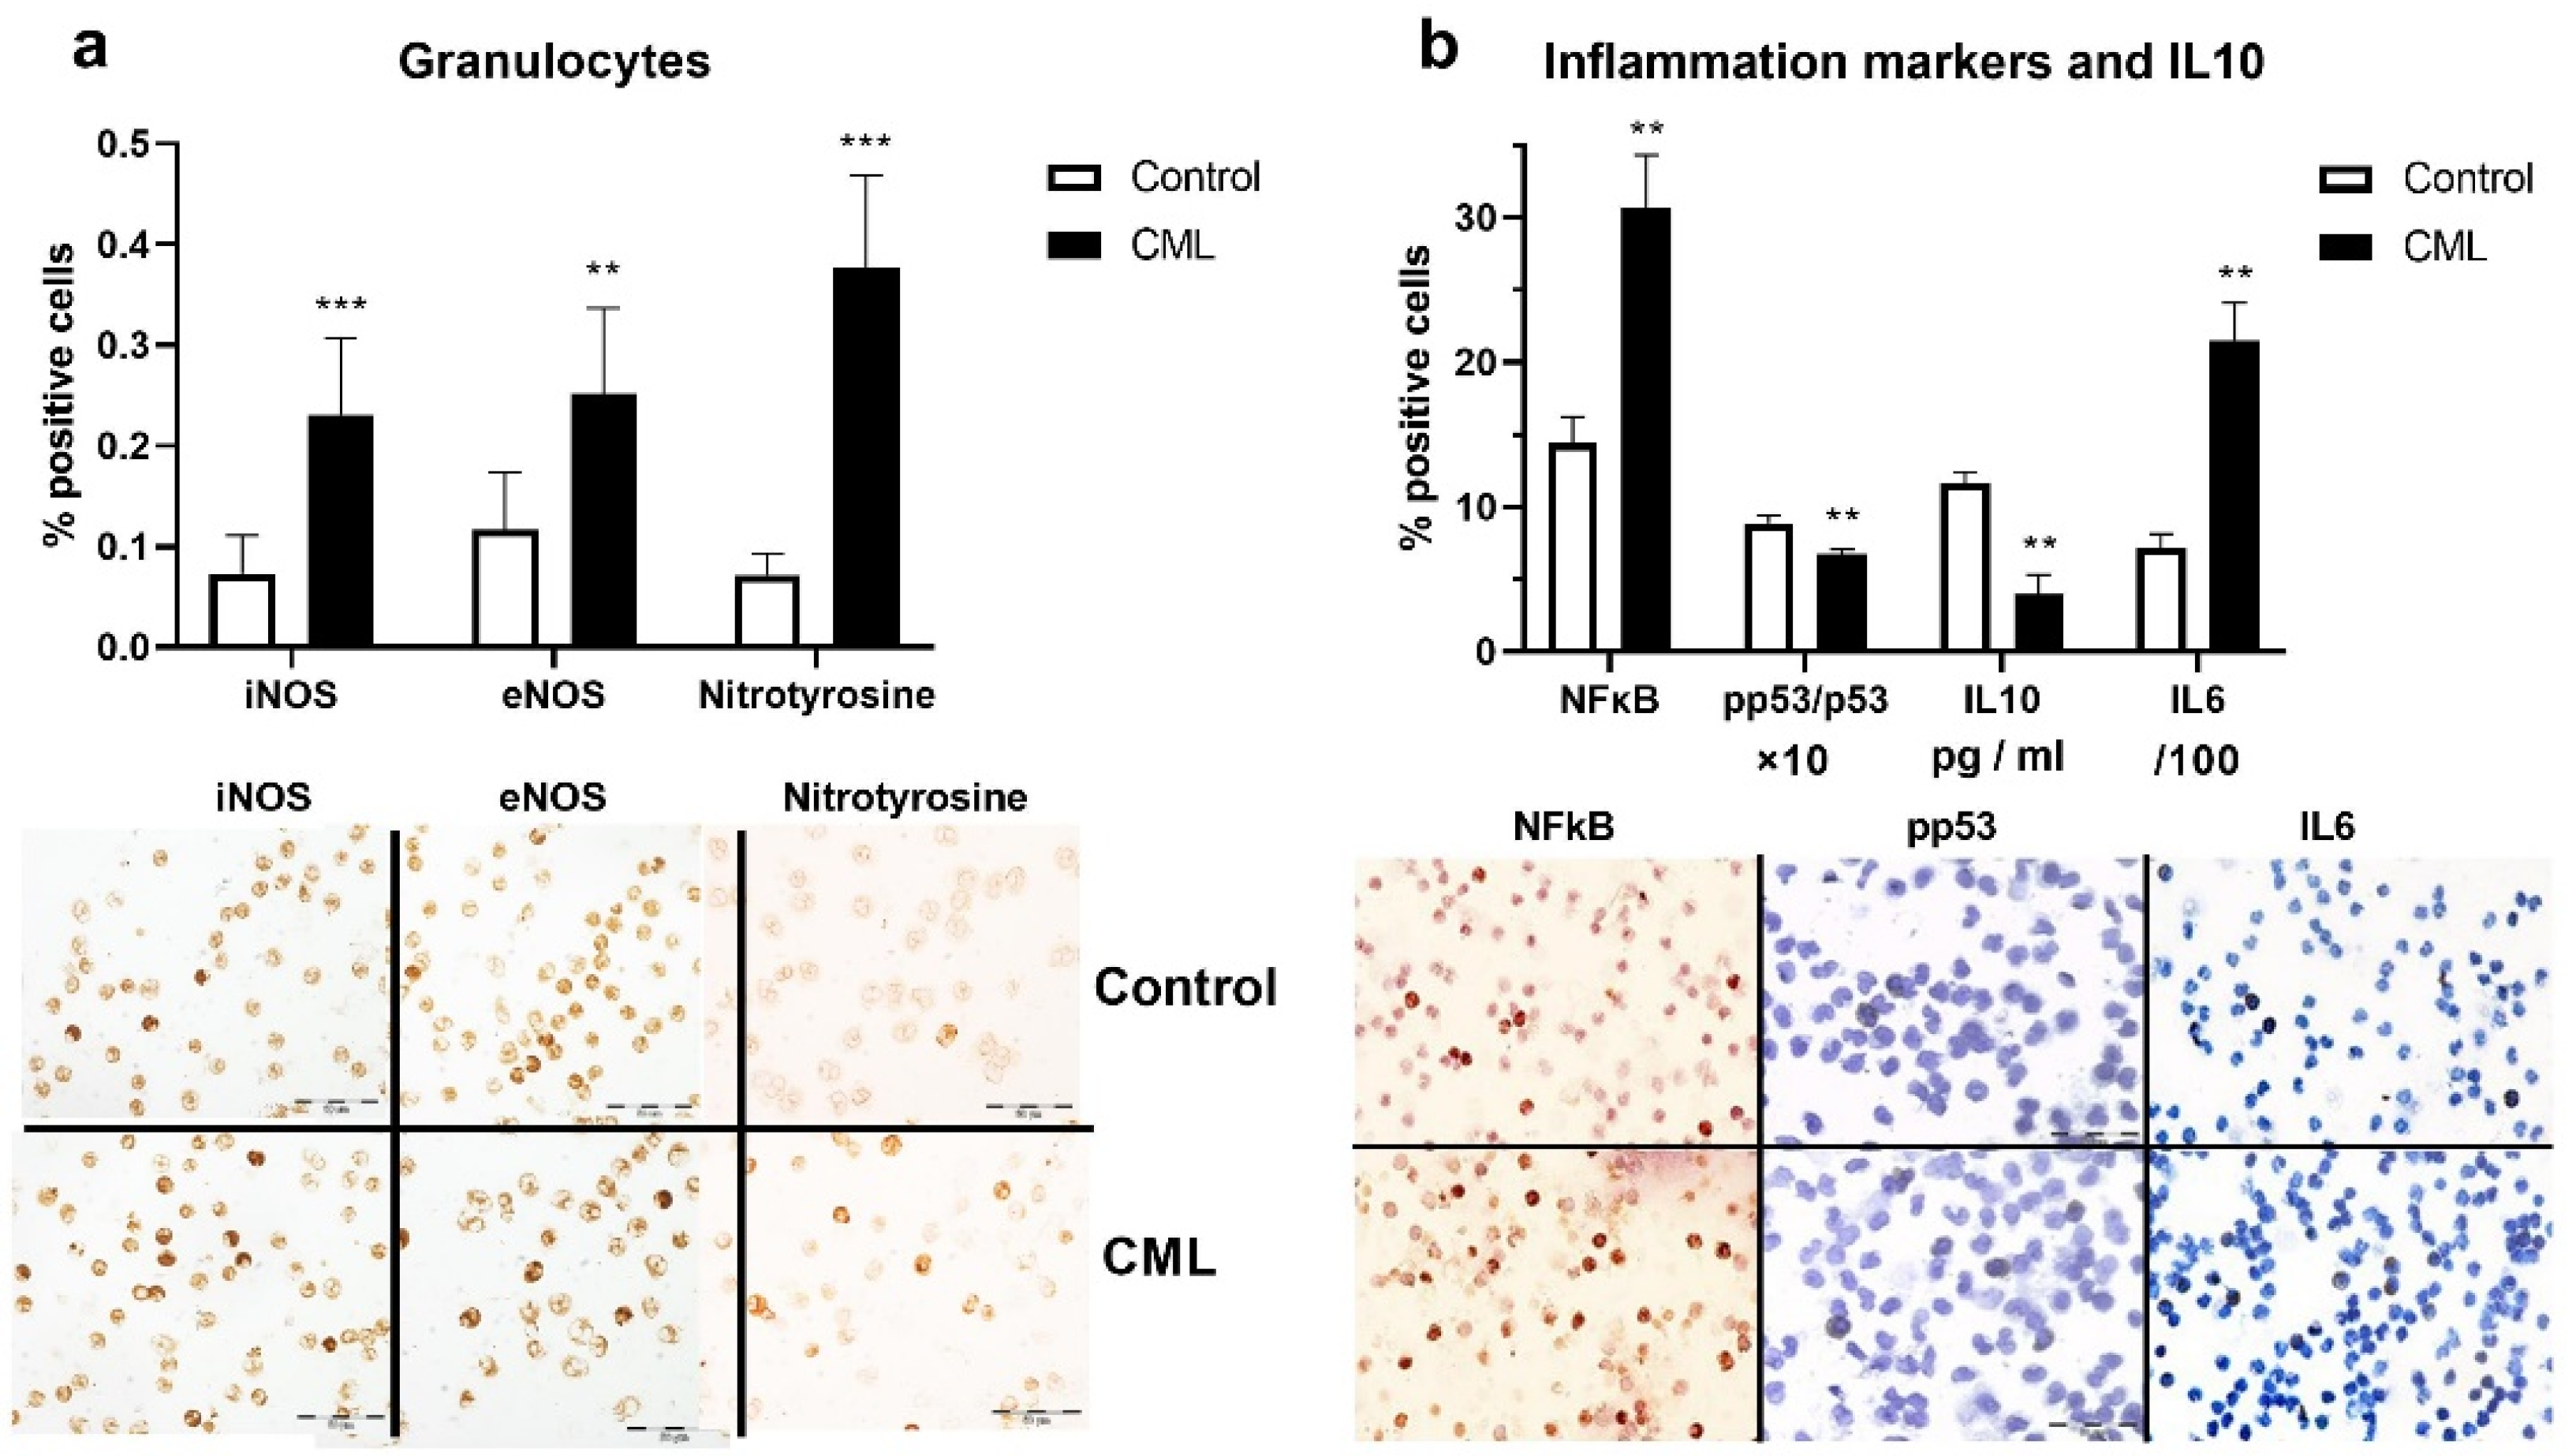
3.2. Nitrosative Stress and Inflammation in Chronic Myeloid Leukemia
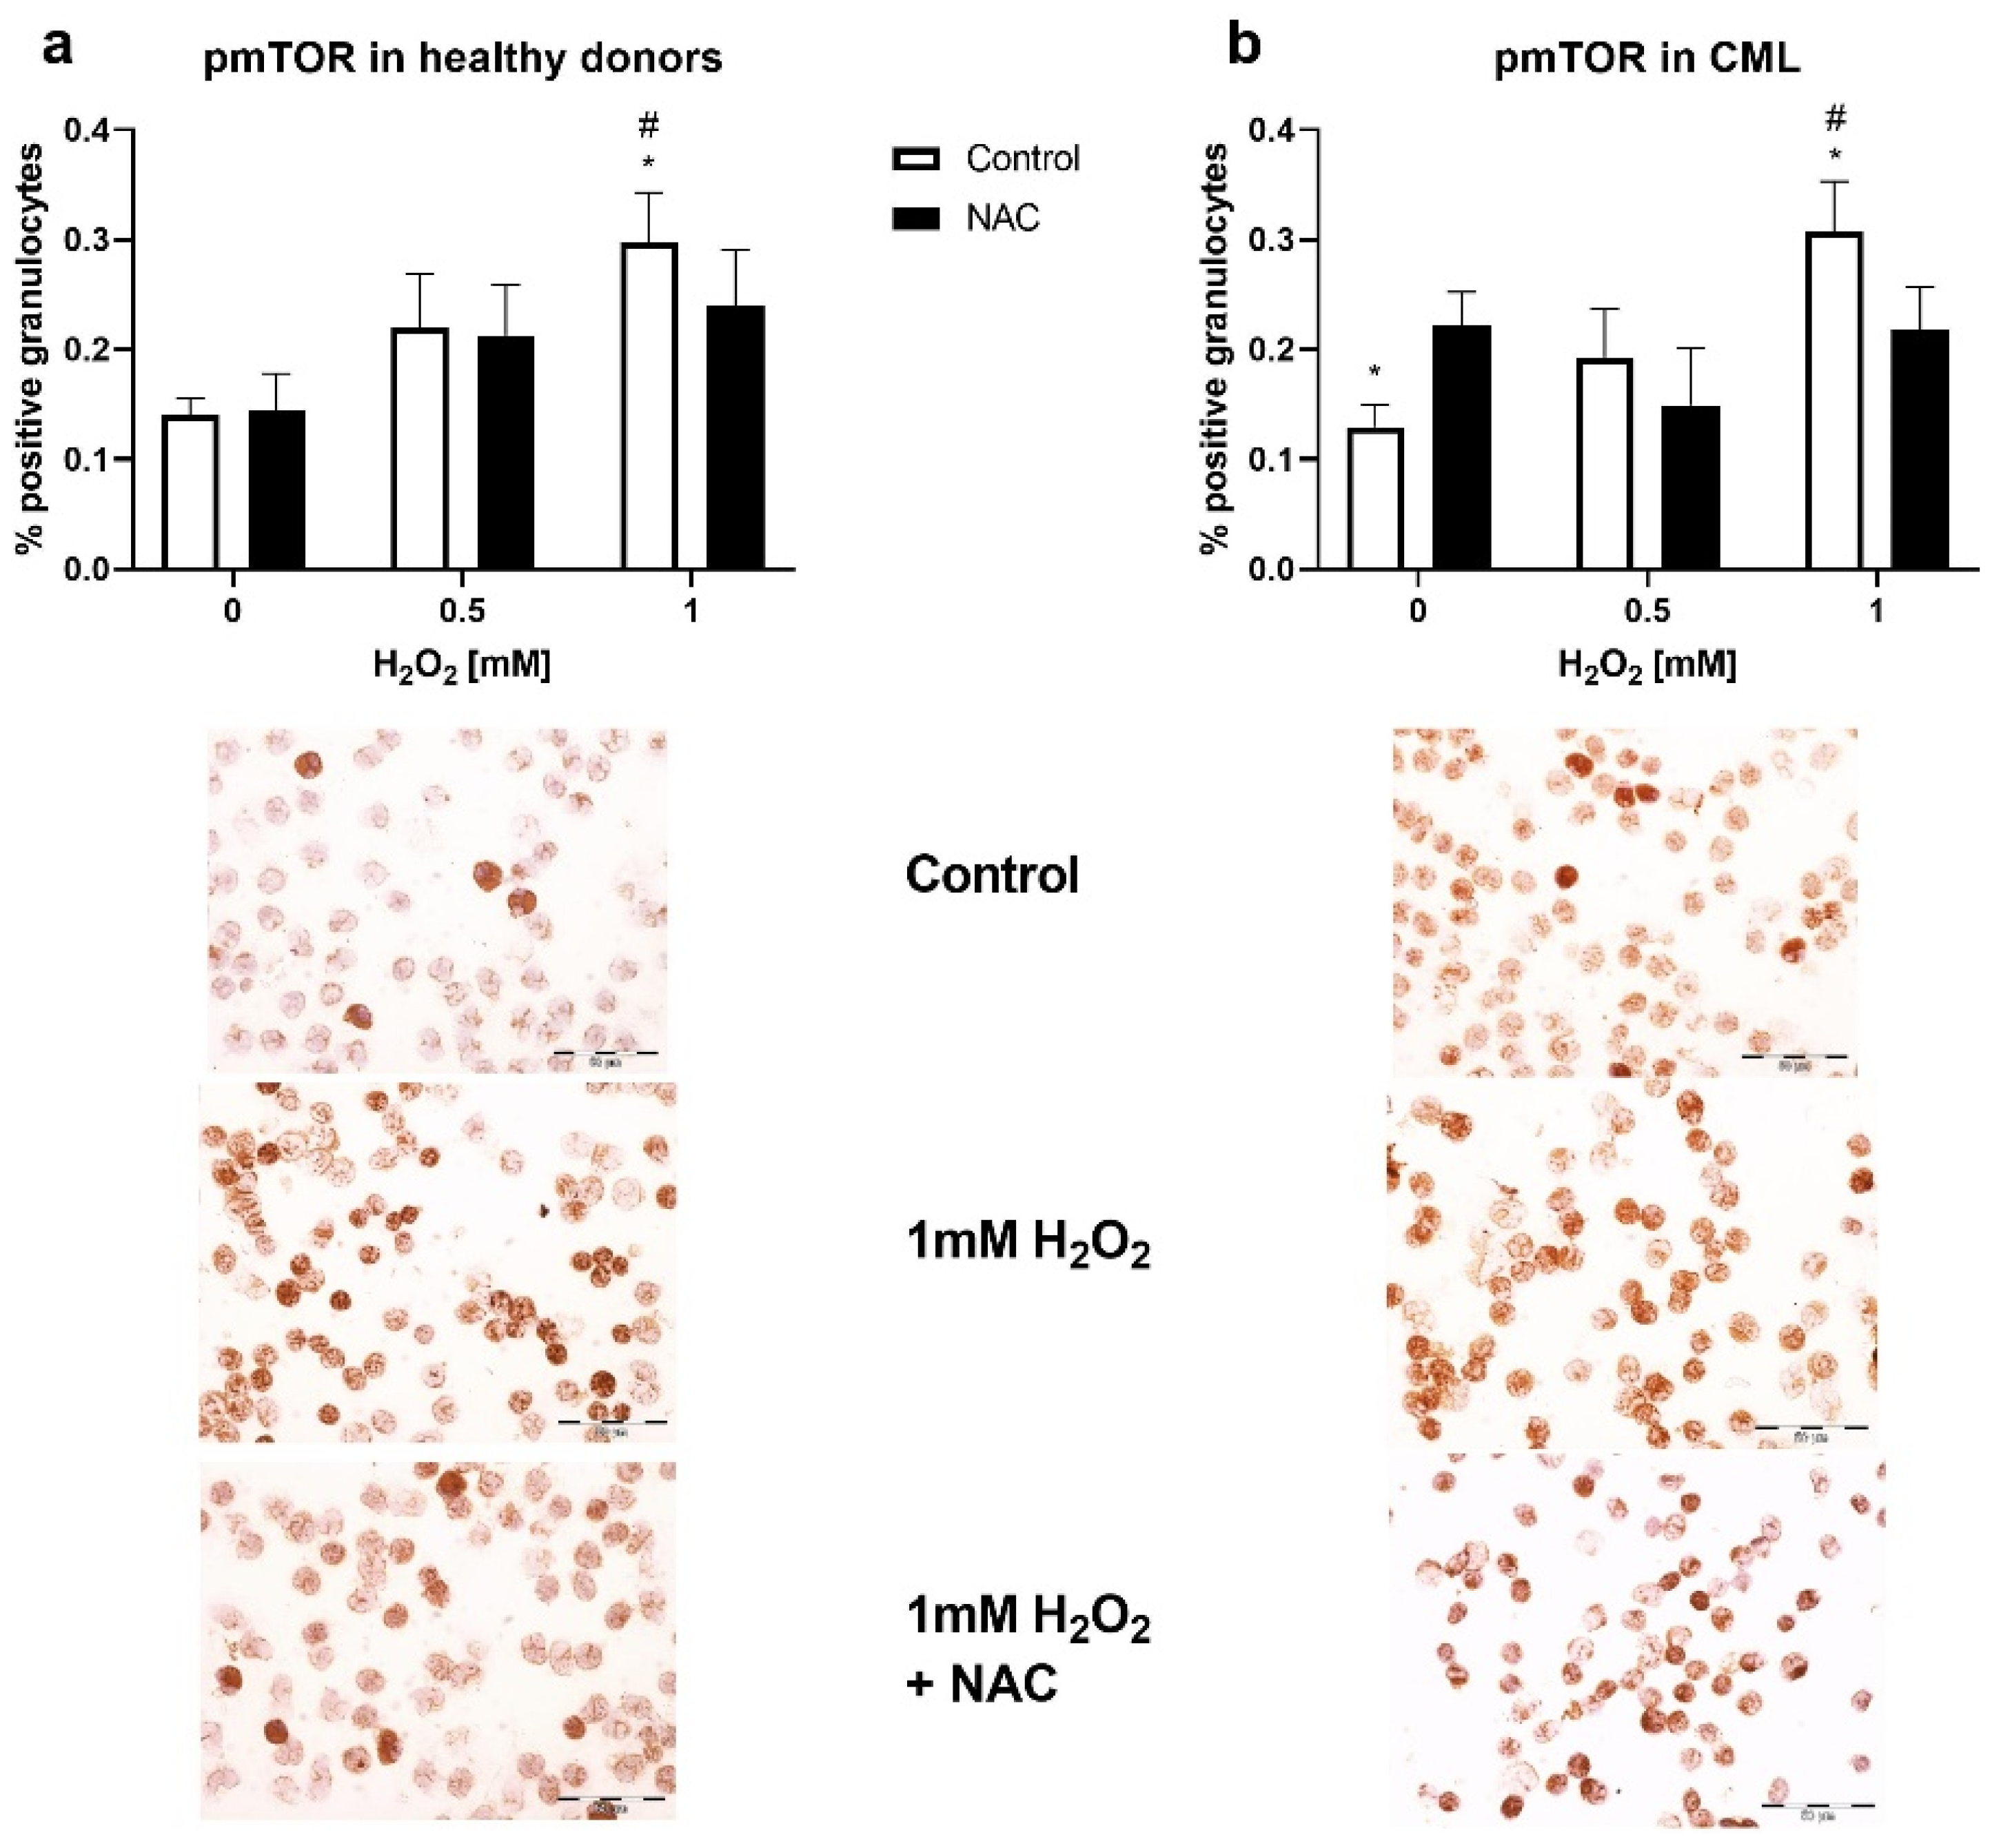
3.3. Sensitivity of Granulocytes to Oxidative Stress and Induction of the Akt/mTOR Signaling Pathway
3.4. Induction of the mTOR Signaling Pathway by Oxidative Stress in Granulocytes
3.5. Induction of the Akt/mTOR Signaling Pathway by Oxidative Stress in K562 Cells
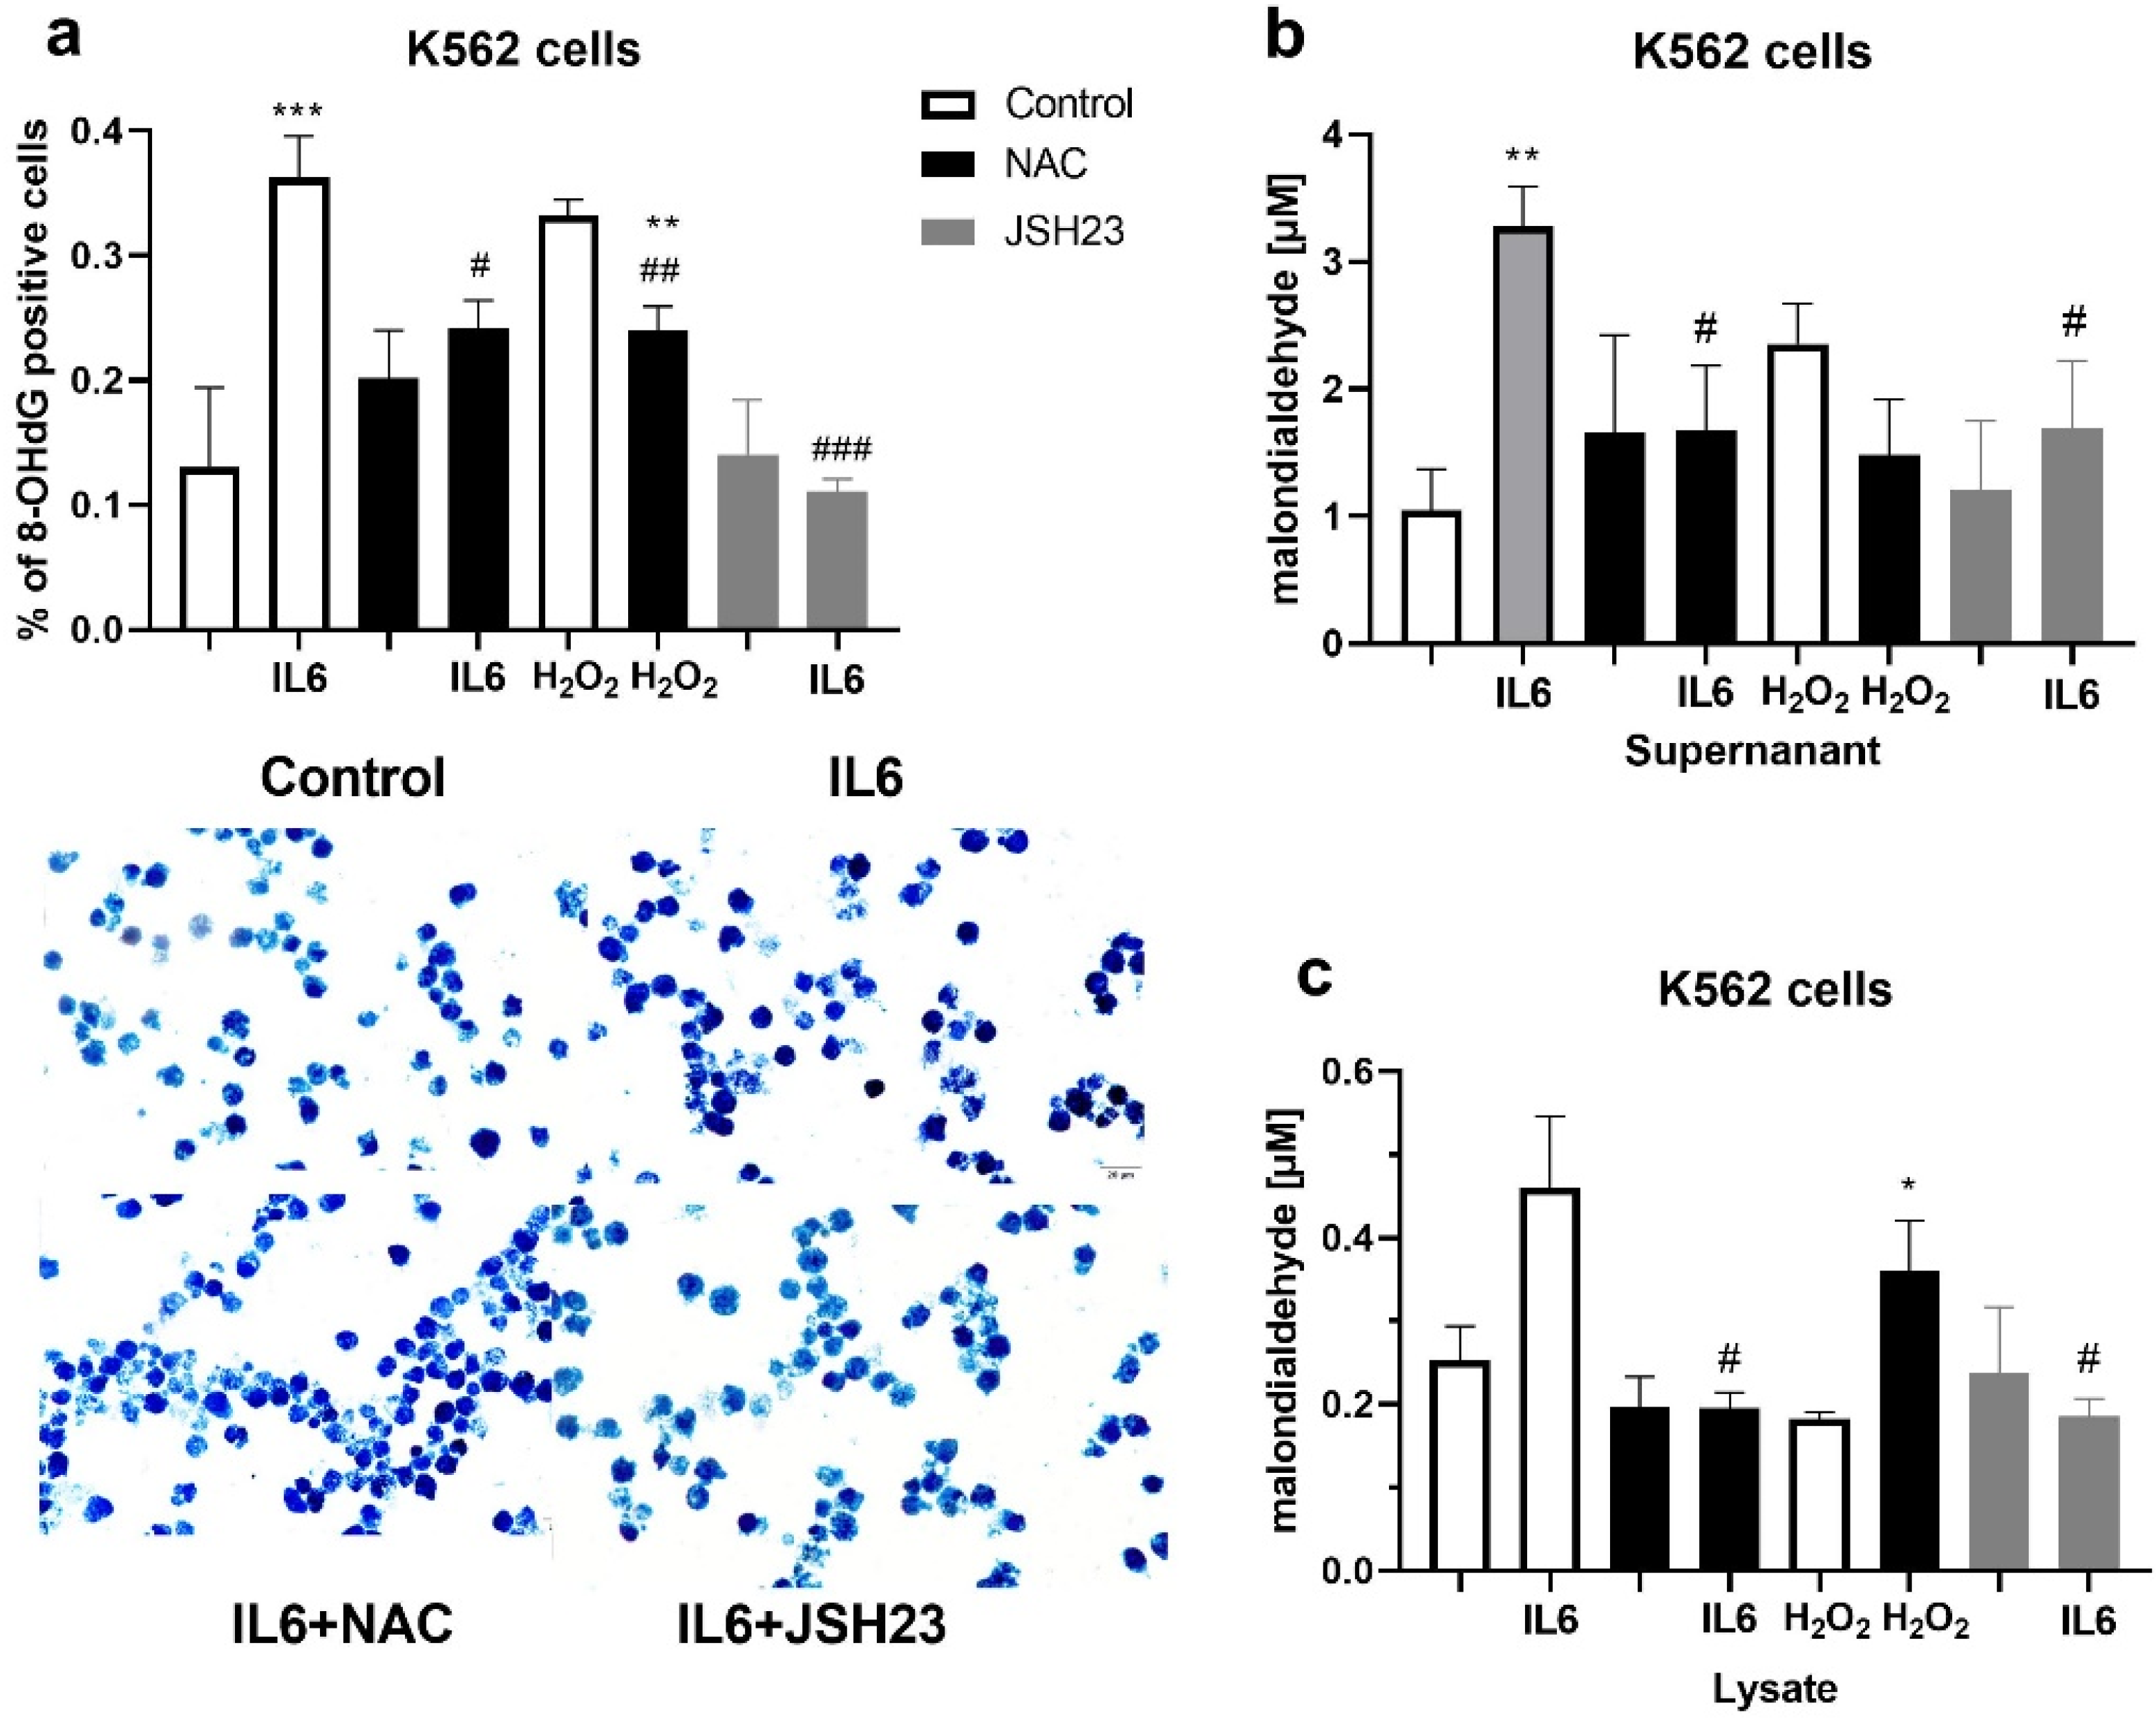
3.6. Markers of Oxidative Stress in K562 Cell Culture after Treatment with Hydrogen Peroxide and Interleukin 6
4. Discussion
5. Conclusions
Author Contributions
Funding
Institutional Review Board Statement
Informed Consent Statement
Acknowledgments
Conflicts of Interest
References
- Flis, S.; Chojnacki, T. Chronic myelogenous leukemia, a still unsolved problem: Pitfalls and new therapeutic possibilities. Drug Des. Dev. Ther. 2019, 13, 825–843. [Google Scholar] [CrossRef] [PubMed] [Green Version]
- Smith, K.M.; Yacobi, R.; Van Etten, R.A. Autoinhibition of Bcr-Abl through its SH3 domain. Mol. Cell 2003, 12, 27–37. [Google Scholar] [CrossRef] [Green Version]
- Huang, M.; Dorsey, J.F.; Epling-Burnette, P.K.; Nimmanapalli, R.; Landowski, T.H.; Mora, L.B.; Niu, G.; Sinibaldi, D.; Bai, F.; Kraker, A.; et al. Inhibition of Bcr-Abl kinase activity by PD180970 blocks constitutive activation of Stat5 and growth of CML cells. Oncogene 2002, 21, 8804–8816. [Google Scholar] [CrossRef] [Green Version]
- Skorski, T.; Bellacosa, A.; Nieborowska-Skorska, M.; Majewski, M.; Martinez, R.; Choi, J.K.; Trotta, R.; Wlodarski, P.; Perrotti, D.; Chan, T.O.; et al. Transformation of hematopoietic cells by BCR/ABL requires activation of PI-3k/Akt-dependent pathway. EMBO J. 1997, 16, 6151–6161. [Google Scholar] [CrossRef] [PubMed] [Green Version]
- Guertin, D.; Sabatini, D.M. An expanding role for mTOR in cancer. Trends Mol. Med. 2005, 11, 353–361. [Google Scholar] [CrossRef] [PubMed]
- Djikic, D.; Markovic, D.; Bogdanovic, A.; Mitrovic-Ajtic, O.; Suboticki, T.; Diklic, M.; Beleslin-Cokic, B.; Bjelica, S.; Kovacic, M.; Cokic, V.P. Oxidative and nitrosative stress in myeloproliferative neoplasms: The impact on the AKT/mTOR signaling pathway. JBUON 2018, 23, 1481–1491. [Google Scholar] [PubMed]
- Inoki, K.; Ouyang, H.; Li, Y.; Guan, K.-L. Signaling by target of Rapamycin proteins in cell growth control. Microbiol. Mol. Biol. Rev. 2005, 69, 79–100. [Google Scholar] [CrossRef] [Green Version]
- Finkel, T. Oxidant signals and oxidative stress. Curr. Opin. Cell Biol. 2003, 15, 247–254. [Google Scholar] [CrossRef]
- Schieber, M.; Chandel, N.S. ROS function in redox signaling and oxidative stress. Curr. Biol. 2014, 24, R453–R462. [Google Scholar] [CrossRef] [Green Version]
- Valko, M.; Leibfritz, D.; Moncol, J.; Cronin, M.T.; Mazur, M.; Telser, J. Free radicals and antioxidants in normal physiological functions and human disease. Int. J. Biochem. Cell Biol. 2007, 39, 44–84. [Google Scholar] [CrossRef]
- Amin, A.R. The metabolomics of nitric oxide and reactive nitrogen species in immune editing tumor milieu: Influence of nitric oxide-modulating therapies. J. Drug Metab. Toxicol. 2012, S8, 002. [Google Scholar] [CrossRef] [Green Version]
- Benzie, I.F.; Strain, J.J. The ferric reducing ability of plasma (FRAP) as a measure of “antioxidant power”: The FRAP assay. Anal. Biochem. 1996, 239, 70–76. [Google Scholar] [CrossRef] [PubMed] [Green Version]
- Baskic, D.; Radosavljevic, G.; Cokanovic, V.; Jeftic, I.; Zelen, I.; Popovic, S.; Pavlovic, S.; Arsenijevic, N. Serum levels of NO, IL-18 and MDA in patients with breast carcinoma. Medicus 2005, 6, 62–65. [Google Scholar]
- Levine, R.L.; Garland, D.; Oliver, C.N.; Amici, A.; Climent, I.; Lenz, A.G.; Ahn, B.W.; Shaltiel, S.; Stadtman, E.R. Determination of carbonyl content in oxidatively modified proteins. Methods Enzymol. 1990, 186, 464–478. [Google Scholar] [PubMed]
- Misra, H.P.; Fridovich, I. The role of superoxide anion in the autoxidation of epinephrine and a simple assay for superoxide dismutase. J. Biol. Chem. 1972, 247, 3170–3175. [Google Scholar] [CrossRef]
- Aebi, H. Catalase in vitro. Methods Enzymol. 1984, 105, 121–126. [Google Scholar]
- Glatzle, D.; Vuillennir, Y.P.; Weber, F.; Decker, K. Glutathione reductase test with whole blood—A connvenient procedure for the assesment of riboflavine status in humans. Experimentia 1974, 30, 565–638. [Google Scholar] [CrossRef]
- Mosmann, T. Rapid colorimetric assay for cellular growth and survival: Application to proliferation and cytotoxicity assays. J. Immunol. Methods 1983, 65, 55–63. [Google Scholar] [CrossRef]
- Fialkow, L.; Wang, Y.; Downey, G.P. Reactive oxygen and nitrogen species as signaling molecules regulating neutrophil function. Free Radic. Biol. Med. 2007, 42, 153–164. [Google Scholar] [CrossRef]
- Levine, A.J. Inflammation and p53. Genes Cancer 2011, 2, 503–516. [Google Scholar]
- Williams, L.; Bradley, L.; Smith, A.; Foxwell, B. Signal transducer and activator of transcription 3 is the dominant mediator of the anti-inflammatory effects of IL-10 in human macrophages. J. Immunol. 2004, 172, 567–576. [Google Scholar] [CrossRef] [Green Version]
- Li, B.; Xi, P.; Wang, Z.; Han, X.; Xu, Y.; Zhang, Y.; Miao, J. PI3K/Akt/mTOR signaling pathway participates in Streptococcus uberis-induced inflammation in mammary epithelial cells in concert with the classical TLRs/NFkB pathway. JVET Microbiol. 2018, 227, 103–111. [Google Scholar] [CrossRef] [PubMed]
- Čokić, V.P.; Mossuz, P.; Han, J.; Socoro, N.; Beleslin-Čokić, B.; Mitrović, M.; Subotički, T.; Diklić, M.; Leković, D.; Gotić, M.; et al. Microarray and Proteomic Analyses of Myeloproliferative Neoplasms with a Highlight on the mTOR Signaling Pathway. PLoS ONE 2015, 10, e0135463. [Google Scholar] [CrossRef] [PubMed] [Green Version]
- Marty, C.; Lacout, C.; Droin, N.; Le Couédic, J.-P.; Ribrag, V.; Solary, E.; Vainchenker, W.; Villeval, J.-L.; Plo, I. A role for reactive oxygen species in JAK2V617F myeloproliferative neoplasm progression. Leukemia 2013, 27, 2187–2195. [Google Scholar] [CrossRef] [PubMed] [Green Version]
- Craver, B.M.; Ramanathan, G.; Hoang, S.; Chang, X.; Mendez Luque, L.F.; Brooks, S.; Lai, H.Y.; Fleschman, A.G. N-acetylcysteine inhibits thrombosis in murine model of myeloproliferative neoplasm. Blood Adv. 2020, 4, 312–321. [Google Scholar] [CrossRef]
- Ahmad, R.; Tripathi, A.K.; Tripathi, P.; Singh, S.; Singh, R.; Singh, R.K. Malondialdehyde and protein carbonyl as biomarkers for oxidative stress and desease progression in patients with chronic myeloid leukemia. In Vivo 2008, 22, 525–528. [Google Scholar]
- Rajeshwari, U.; Shobha, I.; Raghunatha, R.; Andallu, B. Oxidative Stress and Antioxidant Status in Acute and Chronic Myeloid Leukemia Patients. Open J. Blood Dis. 2013, 3, 17–22. [Google Scholar] [CrossRef] [Green Version]
- Ahmad, R.; Tripathi, A.K.; Tripathi, P.; Singh, R.; Singh, S.; Singh, R.K. Studies on lipid peroxidation and non-enzymatic antioxidant status as indices of oxidative stress in patients with chronic myeloid leukaemia. Singap. Med. J. 2010, 51, 110–115. [Google Scholar]
- Bourgeais, J.; Ishac, N.; Medrzycki, M.; Branchet-Boteineau, M.; Desbourdes, L.; Gouilles-Gruart, V.; Pecnard, E.; Rouleux-Bonnin, F.; Gyan, E.; Domenech, J.; et al. Oncogenic STAT5 signaling promotes oxidative stress in chronic myeloid leukemia cells by repressing antioxidant defences. Oncotarget 2017, 8, 41876–41889. [Google Scholar] [CrossRef] [Green Version]
- Warsch, W.; Grundchober, E.; Berger, A.; Gille, L.; Cerny-Reiterer, S.; Tigan, A.S.; Hoelbl Kovacic, A.; Valent, P.; Moriggl, R.; Sexl, V. STAT5 trigger BCR/ABL1 mutation by mediating ROS production in chronic myeloid leukemia. Oncotarget 2012, 3, 1669–1687. [Google Scholar] [CrossRef] [Green Version]
- Lopez-Rivera, E.; Jayaraman, P.; Parikh, F.; Davies, M.A.; Ekmekcioglu, S.; Izadmehr, S.; Milton, D.R.; Chipuk, J.E.; Grimm, E.A.; Estrada, Y.; et al. Inducible nitric oxide synthase drives mTOR pathway activation and proliferation of human melanoma by reversible nitrosylation of TSC2. Cancer Res. 2014, 74, 1067–1078. [Google Scholar] [CrossRef] [PubMed] [Green Version]
- Drew, B.; Leeuwenburgh, C. Aging and the role of reactive nitrogen species. Ann. N. Y. Acad. Sci. 2002, 959, 66–81. [Google Scholar] [CrossRef]
- Wink, D.A.; Hines, H.B.; Cheng, R.Y.; Switzer, C.H.; Flores-Santana, W.; Vitek, M.P.; Ridnour, L.A.; Colton, C.A. Nitric oxide and redox mechanisms in the immune response. J. Leukoc. Biol. 2011, 89, 873–891. [Google Scholar] [CrossRef] [PubMed] [Green Version]
- Sablina, A.A.; Budanov, V.; Ilyinskaya, G.V.; Agapova, L.S.; Kravchenko, J.E.; Chumakov, P.M. The antioxidant function of the p53 tumor suppressor. Nat. Med. 2005, 11, 1306–1313. [Google Scholar] [CrossRef] [Green Version]
- Li, T.; Kon, N.; Jiang, L.; Tan, M.; Ludwig, T.; Zhao, Y.; Baer, R.; Gu, W. Tumor suppression in the absence of p53-mediated cell-cycle arrest, apoptosis, and senescence. Cell 2012, 149, 1269–1283. [Google Scholar] [CrossRef] [Green Version]
- Loughery, J.; Cox, M.; Smith, L.M.; Meek, D.W. Critical role for p53-serine 15 phosphorylation in stimulating transactivation at responsive promoters. Nucleic Acids Res. 2014, 42, 7666–7680. [Google Scholar] [CrossRef] [PubMed] [Green Version]
- Velu, C.S.; Niture, S.K.; Doneanu, C.E.; Pattabiraman, N.; Srivenugopal, K.S. Human p53 is inhibited by glutathionylation of cysteines present in the proximal DNA-binding domain during oxidative stress. Biochemistry 2007, 46, 7765–7780. [Google Scholar] [CrossRef] [Green Version]
- Hasselbalch, H.C. Chronic inflammation as a promotor of mutagenesis in essential thrombocythemia, polycythemia vera and myelofibrosis. A human inflammation model for cancer development? Leuk. Res. 2013, 37, 214–220. [Google Scholar] [CrossRef] [PubMed]
- Reynaud, D.; Pietras, E.; Barry-Holson, K.; Mir, A.; Binnewies, M.; Jeannel, M.; Sala-Torra, O.; Radich, P.J.; Pasegué, E. IL-6 controls leukemic multipotent progenitor cell fate and contributes to chronic myelogenous leukemia development. Cancer Cell 2011, 20, 661–673. [Google Scholar] [CrossRef] [Green Version]
- Horacek, J.M.; Kupsa, T.; Vasatova, M.; Jebavy, L.; Zak, P. Biochip array technology and evaluation of serum levels of multiple cytokines and adhesion molecules in patients with newly diagnosed acute myeloid leukemia. Exp. Oncol. 2014, 36, 50–51. [Google Scholar]
- Ben-Neriah, Y.; Karin, M. Inflammation meets cancer, with NFkB the matchmaker. Nat. Immunol. 2011, 12, 715–723. [Google Scholar]
- Brasier, A.R. The nuclear factor-kappaB-interleukin 6 signalling pathway mediating vascular inflammation. Cardiovasc. Res. 2010, 86, 211–218. [Google Scholar] [CrossRef] [PubMed] [Green Version]
- McFarland, B.C.; Hong, S.W.; Rajbhandari, R.; Twitty, G.B., Jr.; Gray, G.K.; Yu, H.; Benveniste, E.N.; Nozell, S.E. NF-kB-induced IL-6 ensures STAT3 activation and tumor aggressiveness in glioblastoma. PLoS ONE 2013, 8, e78728. [Google Scholar] [CrossRef] [PubMed]
- Libermann, T.A.; Baltimore, D. Activation of Interleukin-6 Gene Expression through the NF-kB Transcription Factor. Mol. Cell Biol. 1990, 10, 2327–2334. [Google Scholar]
- Brenner, A.; Bruserud, O. S100 proteins in Acute Myeloid Leukemia. Neoplasia 2018, 20, 1175–1186. [Google Scholar] [CrossRef]
- Bartalucci, N.; Tozzi, L.; Bogani, C.; Martinelli, S.; Rotunno, G.; Villeval, J.-L.; Vannucchi, A.M. Co-targeting the PI3K/mTOR and JAK2 signalling pathways produces synergistic activity against myeloproliferative neoplasms. J. Cell. Mol. Med. 2013, 17, 1385–1396. [Google Scholar] [CrossRef]
- Geest, C.R.; Zwartkruis, F.J.; Vellenga, E.; Coffer, P.J.; Buitenhuis, M. Mammalian target of rapamycin activity is required for expansion of CD34+ hematopoietic progenitor cells. Haematologica 2009, 94, 901–910. [Google Scholar] [CrossRef] [Green Version]
- Ly, C.; Arechiga, A.F.; Melo, J.V.; Walsh, C.M.; Ong, S.T. Bcr-Abl kinase modulates the translation regulators ribosomal protein S6 and 4E-BP1 in chronic myelogenous leukemia cells via the mammalian target of rapamycin. Cancer Res. 2003, 63, 5716–5722. [Google Scholar]
- Kim, J.H.; Chu, S.C.; Gramlich, J.L.; Pride, Y.B.; Babendreier, E.; Chauhan, D.; Salgia, R.; Podar, K.; Griffin, J.D.; Sattler, M. Activation of the PI3K/mTOR pathway by BCR-ABL contributes to increased production of reactive oxygen species. Blood 2005, 105, 1717–1723. [Google Scholar] [CrossRef]
- Sarbassov, D.D.; Sabatini, D.M. Redox regulation of the nutrient-sensitive raptor-mTOR pathway and complex. J. Biol. Chem. 2005, 280, 39505–39509. [Google Scholar] [CrossRef] [Green Version]
- Yoshida, S.; Hong, S.; Suzuki, T.; Nada, S.; Mannan, A.M.; Wang, J.; Okada, M.; Guan, K.L.; Inoki, K. Redox regulates mammalian target of rapamycin complex 1 (mTORC1) activity by modulating the TSC1/TSC2-Rheb GTPase pathway. J. Biol. Chem. 2011, 286, 32651–32660. [Google Scholar] [CrossRef] [PubMed] [Green Version]
- Clerkin, J.S.; Naughton, R.; Quiney, C.; Cotter, T.G. Mechanisms of ROS modulated cell survival during carcinogenesis. Cancer Lett. 2008, 266, 30–36. [Google Scholar] [CrossRef]
- Leslie, N.; Bennet, D.; Lindsay, Y.E.; Stewart, H.; Gray, A.; Downes, C.P. Redox regulation of PI 3-kinase signalling via inactivation of PTEN. EMBO J. 2003, 22, 5501–5510. [Google Scholar] [CrossRef]
- Kirlin, W.G.; Cai, J.; Thompson, S.A.; Diaz, D.; Kavanagh, T.J.; Jones, D.P. Glutathione redox potential in response to differentiation and enzyme inducers. Free Radic. Biol. Med. 1999, 27, 1208–1218. [Google Scholar] [CrossRef]
- Oka, S.I.; Hirata, T.; Suzuki, W.; Naito, D.; Chen, Y.; Chin, A.; Yaginuma, H.; Saito, T.; Nagarajan, N.; Zai, P.; et al. Thioredoxin-1 maintains mechanistic target of rapamycin (mTOR) function during oxidative stress in cardiomyocytes. J. Biol. Chem. 2017, 292, 18988–19000. [Google Scholar] [CrossRef] [PubMed] [Green Version]
- Bjørn, M.E.; Hasselbalch, H.C. The Role of Reactive Oxygen Species in Myelofibrosis and Related Neoplasms. Mediat. Inflamm. 2015, 2015, 648090. [Google Scholar] [CrossRef] [Green Version]
- Devi, G.S.; Prasad, M.H.; Saraswathi, I.; Raghu, D.; Rao, D.N.; Reddy, P.P. Free radicals antioxidant enzymes and lipid peroxidation in different types of leukemias. Clin. Chim. Acta 2000, 293, 53–62. [Google Scholar] [CrossRef]


Publisher’s Note: MDPI stays neutral with regard to jurisdictional claims in published maps and institutional affiliations. |
© 2022 by the authors. Licensee MDPI, Basel, Switzerland. This article is an open access article distributed under the terms and conditions of the Creative Commons Attribution (CC BY) license (https://creativecommons.org/licenses/by/4.0/).
Share and Cite
Đikić, D.; Bogdanović, A.; Marković, D.; Mitrović-Ajtić, O.; Subotički, T.; Diklić, M.; Vukotić, M.; Dragojević, T.; Živković, E.; Santibanez, J.F.; et al. Inflammation Promotes Oxidative and Nitrosative Stress in Chronic Myelogenous Leukemia. Biomolecules 2022, 12, 247. https://0-doi-org.brum.beds.ac.uk/10.3390/biom12020247
Đikić D, Bogdanović A, Marković D, Mitrović-Ajtić O, Subotički T, Diklić M, Vukotić M, Dragojević T, Živković E, Santibanez JF, et al. Inflammation Promotes Oxidative and Nitrosative Stress in Chronic Myelogenous Leukemia. Biomolecules. 2022; 12(2):247. https://0-doi-org.brum.beds.ac.uk/10.3390/biom12020247
Chicago/Turabian StyleĐikić, Dragoslava, Andrija Bogdanović, Dragana Marković, Olivera Mitrović-Ajtić, Tijana Subotički, Miloš Diklić, Milica Vukotić, Teodora Dragojević, Emilija Živković, Juan F. Santibanez, and et al. 2022. "Inflammation Promotes Oxidative and Nitrosative Stress in Chronic Myelogenous Leukemia" Biomolecules 12, no. 2: 247. https://0-doi-org.brum.beds.ac.uk/10.3390/biom12020247