Article

Attitudes towards Social Robots in Education: Enthusiast, Practical, Troubled, Sceptic, and Mindfully Positive

1
Department of Communication Science, VU University Amsterdam, De Boelelaan 1105, 1081 HV Amsterdam, The Netherlands
2
Institute for Information Communication and Technology, HU University of Applied Sciences Utrecht, Heidelberglaan 15, 3584 CS Utrecht, The Netherlands
3
Department of Cognitive Science and Artificial Intelligence, Tilburg School of Humanities and Digital Sciences, Tilburg University, Warandelaan 2, 5037 AB Tilburg, The Netherlands
*
Author to whom correspondence should be addressed.
Submission received: 8 December 2020 / Revised: 19 January 2021 / Accepted: 20 January 2021 / Published: 26 January 2021
(This article belongs to the Special Issue Advances and Challenges in Educational Robotics)

Abstract

:
While social robots bring new opportunities for education, they also come with moral challenges. Therefore, there is a need for moral guidelines for the responsible implementation of these robots. When developing such guidelines, it is important to include different stakeholder perspectives. Existing (qualitative) studies regarding these perspectives however mainly focus on single stakeholders. In this exploratory study, we examine and compare the attitudes of multiple stakeholders on the use of social robots in primary education, using a novel questionnaire that covers various aspects of moral issues mentioned in earlier studies. Furthermore, we also group the stakeholders based on similarities in attitudes and examine which socio-demographic characteristics influence these attitude types. Based on the results, we identify five distinct attitude profiles and show that the probability of belonging to a specific profile is affected by such characteristics as stakeholder type, age, education and income. Our results also indicate that social robots have the potential to be implemented in education in a morally responsible way that takes into account the attitudes of various stakeholders, although there are multiple moral issues that need to be addressed first. Finally, we present seven (practical) implications for a responsible application of social robots in education following from our results. These implications provide valuable insights into how social robots should be implemented.

1. Introduction

The use of social robots in education has been subject to extensive moral debate. Their use in early education in particular (e.g., kindergarten and primary school) has raised several ethical issues, ranging from the impact of robots on the role of caregivers and teachers, to issues related to dehumanization, privacy and accountability [1,2,3].
Despite such moral concerns, social robots are increasingly introduced in primary education in the role of a tutor or teacher, and as a peer or a novice [4]. The aspect that sets social robots apart from other physical (educational) robots is that social robots are following social norms and have some form of autonomy [5]. These unique features and elements, combined with their physical embodiment, enable social robots to have the ability to improve cognitive (e.g., knowledge, comprehension, application, analysis, synthesis, and evaluation) and affective (e.g., the learner being attentive, receptive, responsive, reflective, or inquisitive) outcomes of children [4]. More specifically, the use of robots to teach children a broad range of topics is currently being trialed. These topics include first and second language [6,7,8,9,10], sign language [11,12], imitation-specific tasks for children with autism spectrum disorder (ASD) [13], times tables [14], and dance [15,16].
As social robots are increasingly finding their way into regular education, it is important to critically examine the moral issues raised by an increasing number of scholars [1,2,3,4,17]. This is of particular importance given the fact that children are a vulnerable group and that primary education is currently facing a number of challenges, such as shrinking budgets, more diverse classrooms, and (as a consequence) increased teacher workload. Furthermore, according to a recent literature review, ethics in Child-Computer Interaction is an understudied field that should be given more attention [18]. The development of moral guidelines regarding the construction and implementation of social robots in primary education could ensure that the potential of social robots is being realized, while (moral) values in education are not undermined.
When developing such guidelines, it is important to include different stakeholder perspectives, as robots can impact both direct and indirect stakeholders, and the moral considerations of these groups can differ and even conflict [19,20]. Direct stakeholders are parties who directly interact with a system (in this case the social robot). Indirect stakeholders are those who are affected by the use of the social robots but are not in direct contact with it [21], such as, for example parents and government policymakers. A systematic literature review [22] showed that stakeholders other than teachers and children are largely overlooked in the existing literature. An exploratory qualitative study, which relied on focus group discussions with five different stakeholder groups, found both similar as well as conflicting views on how social robots should be used in education across the various stakeholder groups. It is worthwhile mentioning though that, due to its exploratory nature, a rather limited number of participants per stakeholder group took part in the discussions. Therefore, in this study, we conducted a large-scale quantitative analysis that allows us to more systematically examine stakeholder-driven differences and similarities in moral considerations about the use of social robots in education. In addition, we investigated whether differences could be further explained by varying socio-demographic characteristics, such as age, previous experience with robots, or education level.
This study contributes to the existing body of knowledge by focusing on and empirically examining a wide range of moral issues and values related to the use of robots in education that have been identified in existing literature. To this end, we developed a questionnaire that concerns moral issues regarding the use of social robots in education that are relevant for both direct and indirect stakeholders. Using this questionnaire, we aimed to answer the following three research questions: RQ (1) what are the attitudes of stakeholders on the moral issues related to social robots in education? RQ (2) how can the attitudes related to the moral issues be categorized? And RQ (3) what socio-demographic characteristics influence the attitudes of stakeholders on the moral issues related to social robots in education? The results of our study can be used to get a better understanding of the various perspectives on moral considerations related to the use of robots in education. This can provide a solid basis for the development of moral guidelines that respect and take into account the concerns of different stakeholders.
The remainder of the paper is structured as follows. The second section provides a brief overview of the existing literature on stakeholder attitudes regarding the use of social robots in education. Then, the third section describes the methodology used in our study and the fourth section summarizes the results obtained from the different analyses. Finally, the fifth section provides an in-depth discussion of the results, which includes an overview of the implications of the findings, and provides concluding remarks.

2. Theoretical Background
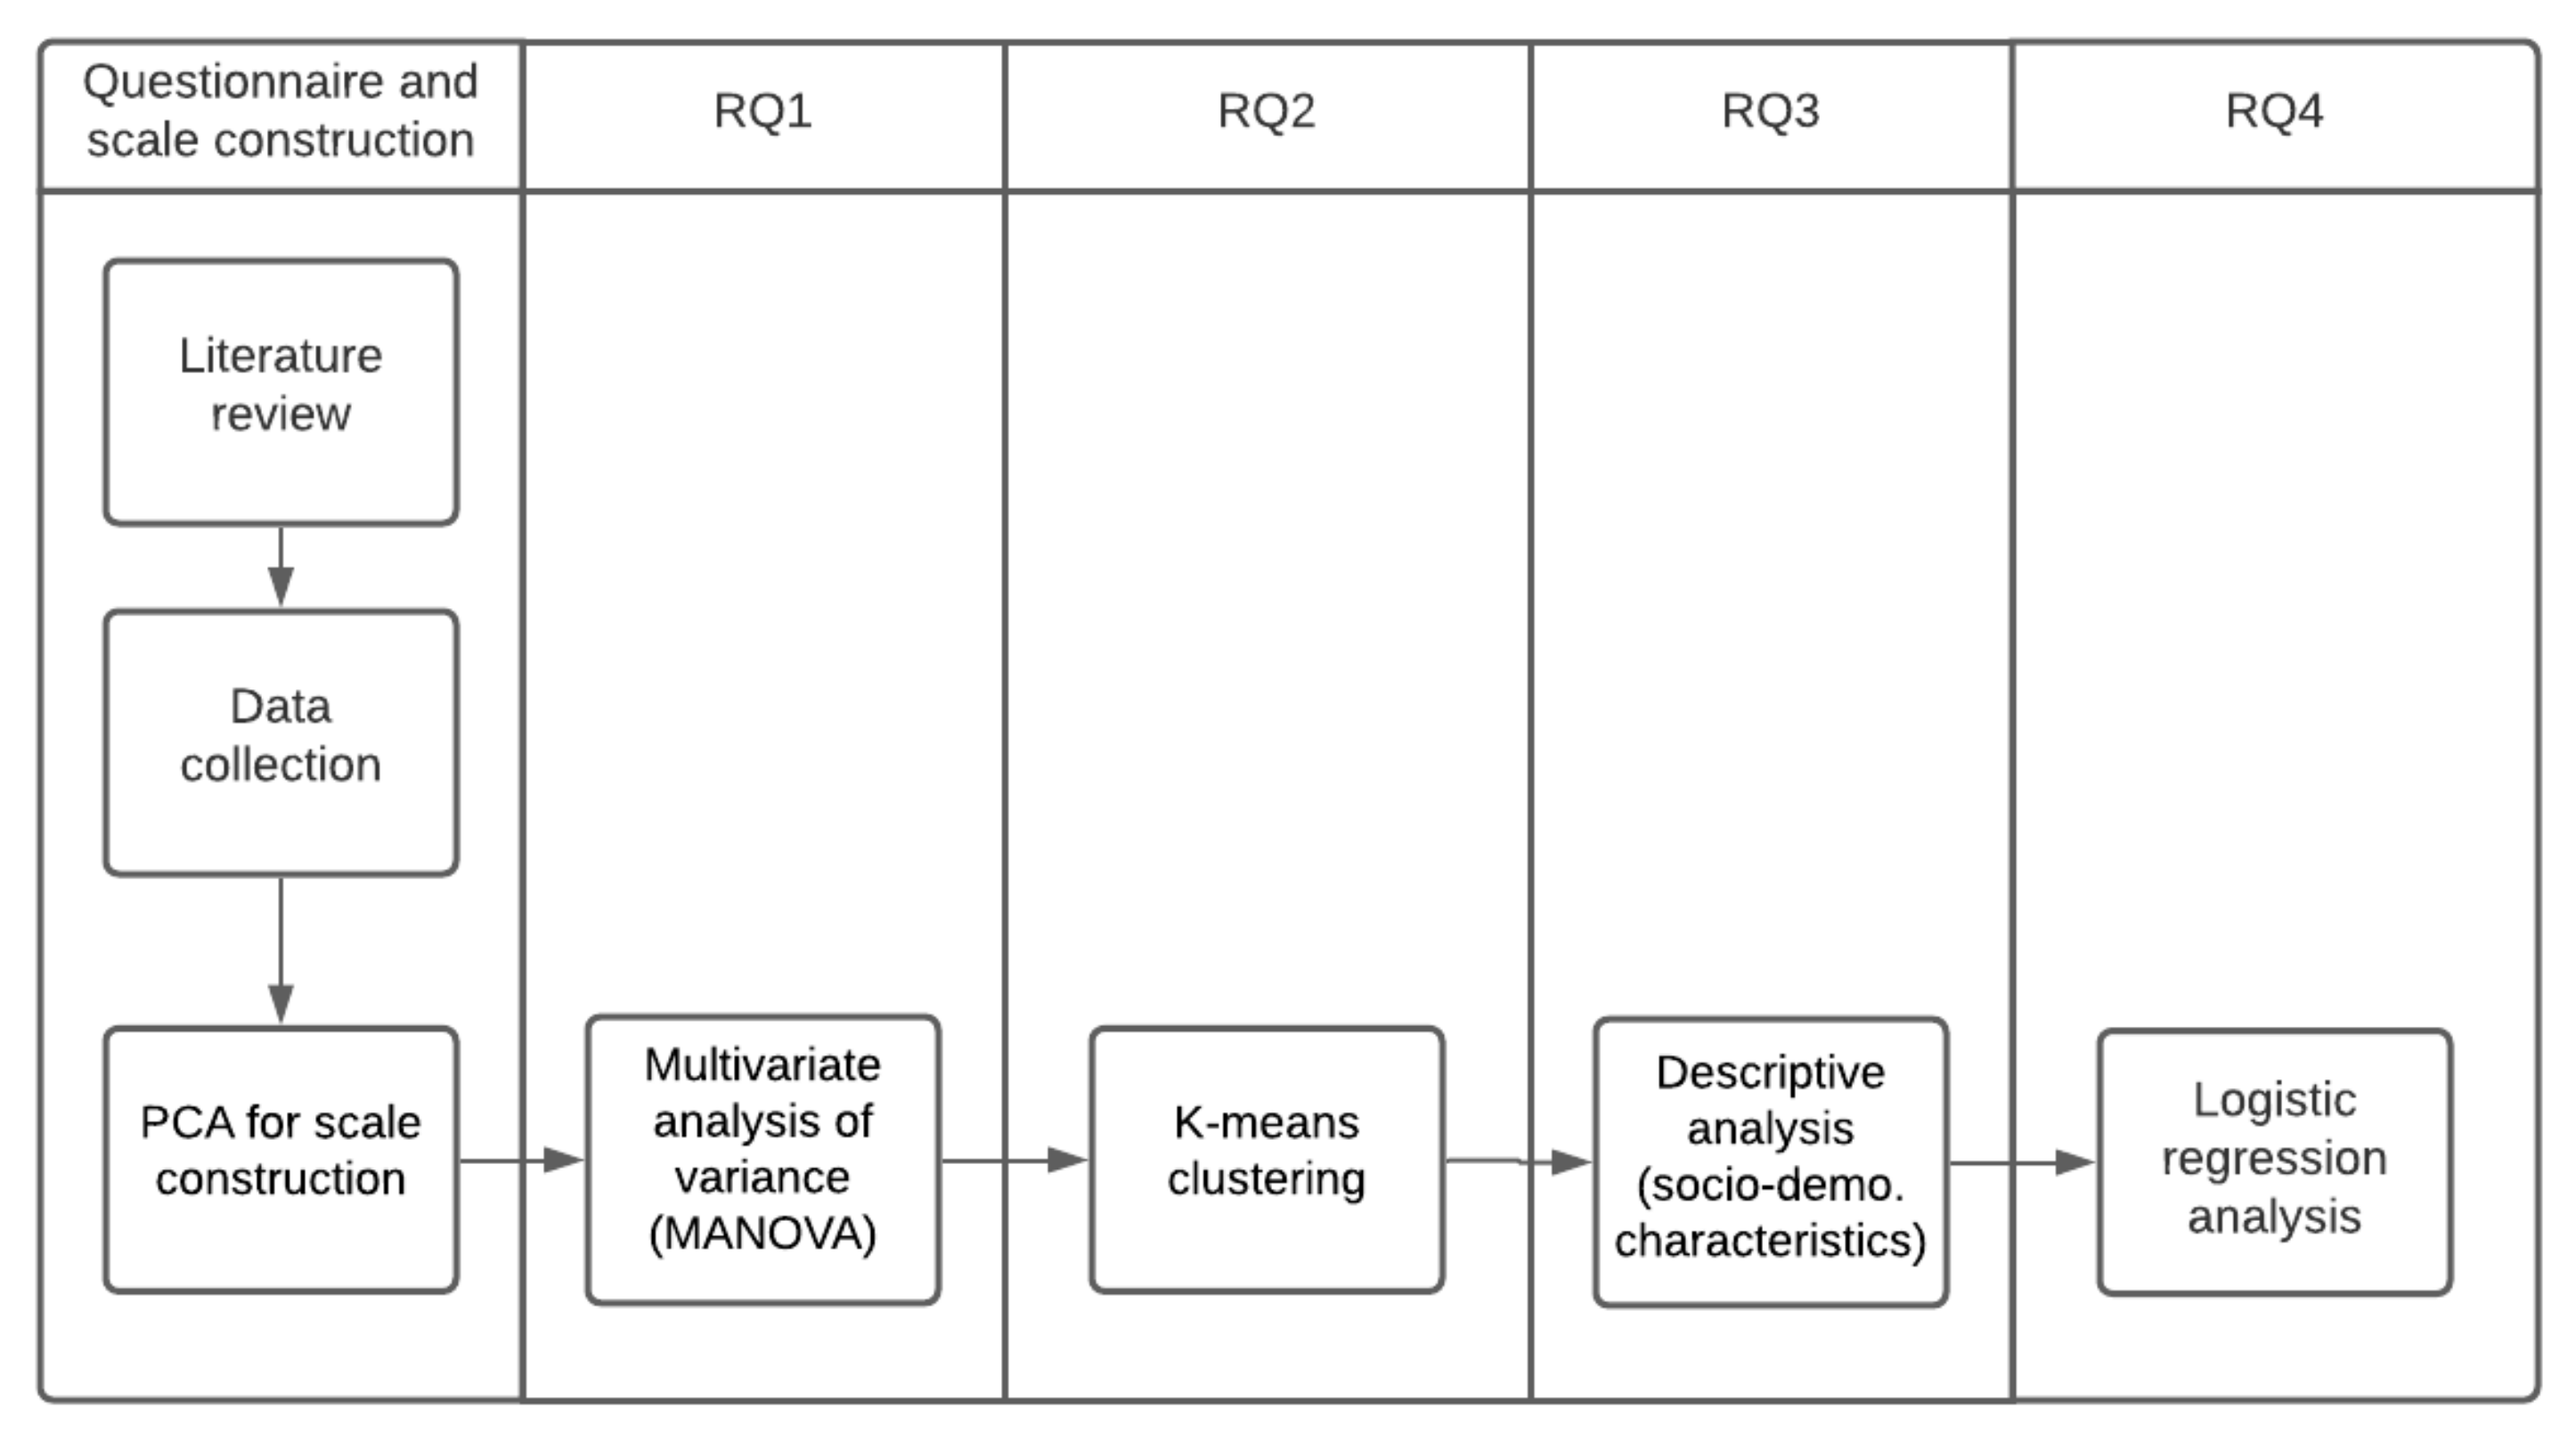
The literature available to date that relates to the attitudes of stakeholders on the moral impact of social robots in education is rather scarce. However, there is a considerable number of studies that focused on perceptions related to (social) robots both in general and in education specifically. One of the largest surveys conducted that is related to attitudes towards the impact of robotics is the Special Eurobarometer 460 [23]. The survey was conducted in 2017 and the sample included a total of 27,901 EU citizens from 28 member states. The results show that overall robots are considered desirable for jobs that are too hard or too dangerous for people to perform. Furthermore, robots that help people to do their jobs and carry out daily tasks at home are also considered beneficial for society.
Although these results paint a promising picture regarding the acceptance of robots in society, some concerns related to the impact on jobs and the work performed were also mentioned. In particular, people indicated that they feel uncomfortable about the use of robots in specific situations (rather than in general), such as when providing services and companionship. Almost nine out of ten respondents considered careful management as a necessary requirement for the implementation of robots and artificial intelligence in society [23].
The results of the survey also show that various demographic characteristics, such as gender, age, education level, and social economic status (SES), influence individuals’ attitudes towards robots. Specifically, women, older people, individuals with lower education, and those experiencing financial stress, overall seem less likely to be positive about the use of robots [23].
While the Eurobarometer results reflect the attitudes of EU citizens in general, the literature on the impact of social robots in education to-date has mainly focused on the attitudes and perceptions of teachers and school children [22]. Multiple studies, conducted in different countries and cultures, found that overall children, including those with special needs (e.g., ASD), have a positive attitude towards social robots [6,24,25,26,27]. The stance of teachers seems somewhat more cautious than that of the pupils. Specifically, the idea of social robots being widely adopted in education was not met with enthusiasm by all teachers interviewed/surveyed.
Teachers in special education specifically have been shown to be highly skeptical towards the use of social robots in education; they considered the potential role of robots to be mainly mechanical and repetitive [28]. Furthermore, teachers in several countries voiced concerns related to the implications that the use of social robots can have on children’s development [1,29,30]. According to some, robots could have a dehumanizing effect on children [1], and children could become more socially isolated if they were to develop a social bond with a robot [29]. Some teachers also voiced concerns related to privacy, the role of the robot, the effects on children, and responsibility issues [1]. Furthermore, teachers were also concerned with the ability of the robot to properly recognize emotions through facial expressions, which they considered an important skill required for teaching [31]. Finally, they also expressed their concern about not having the necessary skills to control the robot, which could result in it not being used [31].
On the other hand though, some teachers have foreseen multiple roles for robots in education, such as the robot being a buddy, a friend, an assistant or a helper [31]. Other teachers have reported to see a potential in the robot’s ability to enhance and facilitate the educational process [32], promote learning beyond the classroom (e.g., learning at home) [33], reduce the anxiety of low-achieving students [34], and help and motivate students when learning complex or difficult topics [35,36].The limited and often small-scale qualitative studies on the attitudes of other stakeholders, such as parents, government policymakers, and the robot industry, also do not give a consistent view on how social robots should be used in education. For example, according to a study conducted in Spain, parents appear to accept educational robots as mechanical tools, whereas Korean and Japanese parents have been reported to see robots as a potential friend for their children [37].
Given these mixed results and findings about the attitudes towards the use of social robots in education, and the reported need for moral considerations and guidelines, the current study took a more systematic approach. In addition to a quantitative analysis of a relatively large group of different stakeholder groups on their attitudes regarding moral issues related to social robots in education, we also examined how these attitudes can be categorized, and how various socio-demographic factors may influence them.

3. Method

In this section, we discuss the data collection and sampling method, which includes a description of the questionnaire design. This is followed by the data analysis plan that provides an overview of the methods and models used in the statistical analyses.

3.1. Participants and Design

The data for the analysis were collected in Spring 2020 using the online survey software Qualtrics. Through purposeful sampling (a method in which participants are sampled based on certain traits or qualities that they possess [38]), we approached six stakeholder groups: (1) primary school teachers, (2) university students of education, (3) parents with primary school children, (4) educational policymakers/advisors working for the government, (5) primary school directors/management, and (6) employees of the robotic industry. These groups were approached via multiple online channels and were provided a link to the online questionnaire. The channels used included direct e-mails, messages on online forums and social media, as well as messages in newsletters of schools and professional organizations.
A total of 810 respondents started the questionnaire; however, following the data cleaning and preparation phase, 515 respondents were retained and included in the analyses. All collected data are available via the Open Science Framework (https://osf.io/a3jsv/). The data collected were cleaned, prepared, and analyzed using IBM SPSS Statistics (v24).
When cleaning the data and preparing them for analysis, we first dropped all respondents who did not complete the questionnaire, i.e., those who missed multiple items or stopped halfway (n = 266). Respondents who completed it in less than five minutes were also discarded (n = 14), given that it is not feasible to read the introduction and answer 69 statements in only 5 min. Furthermore, where possible, we also manually recoded the ‘Other’ stakeholder category into one of the remaining five categories, based on the respondents’ written text. An overview of the socio-demographic characteristics of the sample used for the analyses is shown in Table 1.

3.2. Materials and Methods

A schematic overview of the study’s methodology per research question is presented in Figure 1. The construction of the questionnaire and the scales is discussed below. The methods used to answer each of the research questions are discussed in more detail in the results section.

Construction of the Questionnaire

To develop our questionnaire, we first reviewed the literature and transcripts of a previous study, in which focus group sessions were held with various stakeholder groups about the moral considerations regarding social robots in education [39], to identify the relevant moral values and the underlying issues. As there are many definitions of morality in the literature, for this study, we take a broad notion of the concept. We define moral issues as any consideration about what is good or bad regarding social robots in education, thereby including considerations of what robots should and should not do, as well as perceived benefits and harms. On a higher level, these moral issues can be linked to moral values, which refer to “what a person or group of people consider important in life” [40].
In total, 294 passages from the literature [22,39] were coded and could be mapped to a list of 17 relevant moral values (shown in Table 2, below). For each value, multiple issues were formulated and each represented a key issue as reported in the literature and the focus group discussions. Based on these issues, we constructed multiple statements for each value. The statements, as a basis for the questionnaire, were drafted and reviewed by four researchers, after which they were reviewed by three independent experts. Finally, all initial items were pre-tested on clarity and reliability by distributing the preliminary questionnaire to 50 IT bachelor students. Based on the results of the pre-test, some of the questionnaire items were edited or omitted. The final questionnaire can be found in Table S1 online (https://osf.io/a3jsv/).
In total, 69 items were derived that represent the issues of all 17 moral values. These 69 items were included in the final questionnaire as statements. Participants were asked to indicate their level of agreement with each statement on a six-point scale: strongly disagree (1), disagree (2), slightly disagree (3), slightly agree (4), agree (5), and strongly agree (6). A 6-point scale was chosen because it lacks a neutral point, therefore forcing people to decide their level of agreement with the statement [41]. The questionnaire items were balanced in positive and negative wording to prevent acquiescence bias. In the questionnaire, after answering all questions related to a specific moral value, respondents were given the possibility to further elaborate on their opinion in an open textbox.
The questionnaire started with a neutral introduction about robots in education to provide context to the participants. This was followed by a brief active consent procedure to participate in this study. Upon approval, the participants were first asked to answer several socio-demographic questions related to gender, age, income, educational level, years of working experience, number of children, number of children in primary education, experience with robots, and province of residence. Additionally, they were asked which stakeholder group they belong to, out of the following seven groups: (1) primary school teachers, (2) university students of education, (3) parents with primary school children, (4) educational policymakers/advisors working for the government, (5) primary school directors/management, and (6) employees of the robotic industry and (7) other, namely: (which was followed by an open text field).

3.3. Psychometric Analyses of the Scales

To analyse the results of the questionnaire, we first reversed the items, for which the statements had a negative (rather than a positive) formulation. Secondly, we ran a principal component analysis (PCA) to examine to which extent the 69 items measure the constructs/values regarding the use of social robots in education as intended. The Keiser-Meyer-Olkin measure of sampling adequacy (0.864) and the Bertlett’s test of sphericity (p < 0.000) marked the data as suitable for PCA. To determine the valid number of constructs, we made use of the scree-test [42]. Additionally, to obtain clearer and more interpretable constructs, we rotated the solution using the Varimax rotation method. Then, we examined the obtained item loadings per extracted factor and removed items that were considered non-discriminatory. That is, items that loaded on multiple components and when the difference between at least two of these loadings was smaller than 0.2 were removed. Furthermore, we removed items that loaded less than 0.3 on all components. This was an iterative process. That is, each time weakly and cross-loading items were removed, we ran the PCA again (on the remaining items), using the Varimax rotation. We then selected the optimal number of components based on the scree-plot, inspected the item loadings once more, and removed non-discriminatory and weakly loading items. This process was repeated five times and eventually, we extracted six clear and interpretable components based on a total of 46 items representing 15 out of the 17 values (the items representing freedom from bias and responsibility were dropped during the process). It is worthwhile mentioning that, while one of the components (number 6) only contained two items, we decided to keep this component due to the specific content of these items and the fact that they represent a unique and interesting aspect of moral values with regards to the use of social robots in schools.
Next, we constructed six scales based on the PCA results. More specifically, for each scale we calculated the mean of all the items that loaded on the corresponding component. We also checked for the internal consistency (i.e., reliability) of the scales using Cronbach’s α and obtained satisfactory results (ranging from α = 0.679 to α = 0.907). The specific Cronbach’s α per scale and loadings of the items included in the derived subscales, are summarized in Table S2 online (https://osf.io/a3jsv/).
Out of the six extracted scales, the first was labelled Social interaction and bonding, because items that related to attachment, friendship and psychological well-being were grouped under this component, and to a slightly lower degree also, human contact, and sincerity. The second component reflected happiness, availability and usability, and was therefore named Usefulness, availability and fun. The third component included relatively high loadings of accountability and also somewhat of IT safety and was therefore labelled Stable accountability and IT safety. Component four was labelled Sincerity and flexibility as items related to sincerity and flexibility loaded relatively high on this component. The fifth component included items that reflected trust, physical safety, and data privacy and was therefore labelled Trust, data also to parents without a teacher as the gatekeeper. Finally, the sixth component included highly loading items on data privacy related to sharing data with third parties and was therefore labelled Data share with third parties. Table 3 provides a summary of the six scales.

4. Results

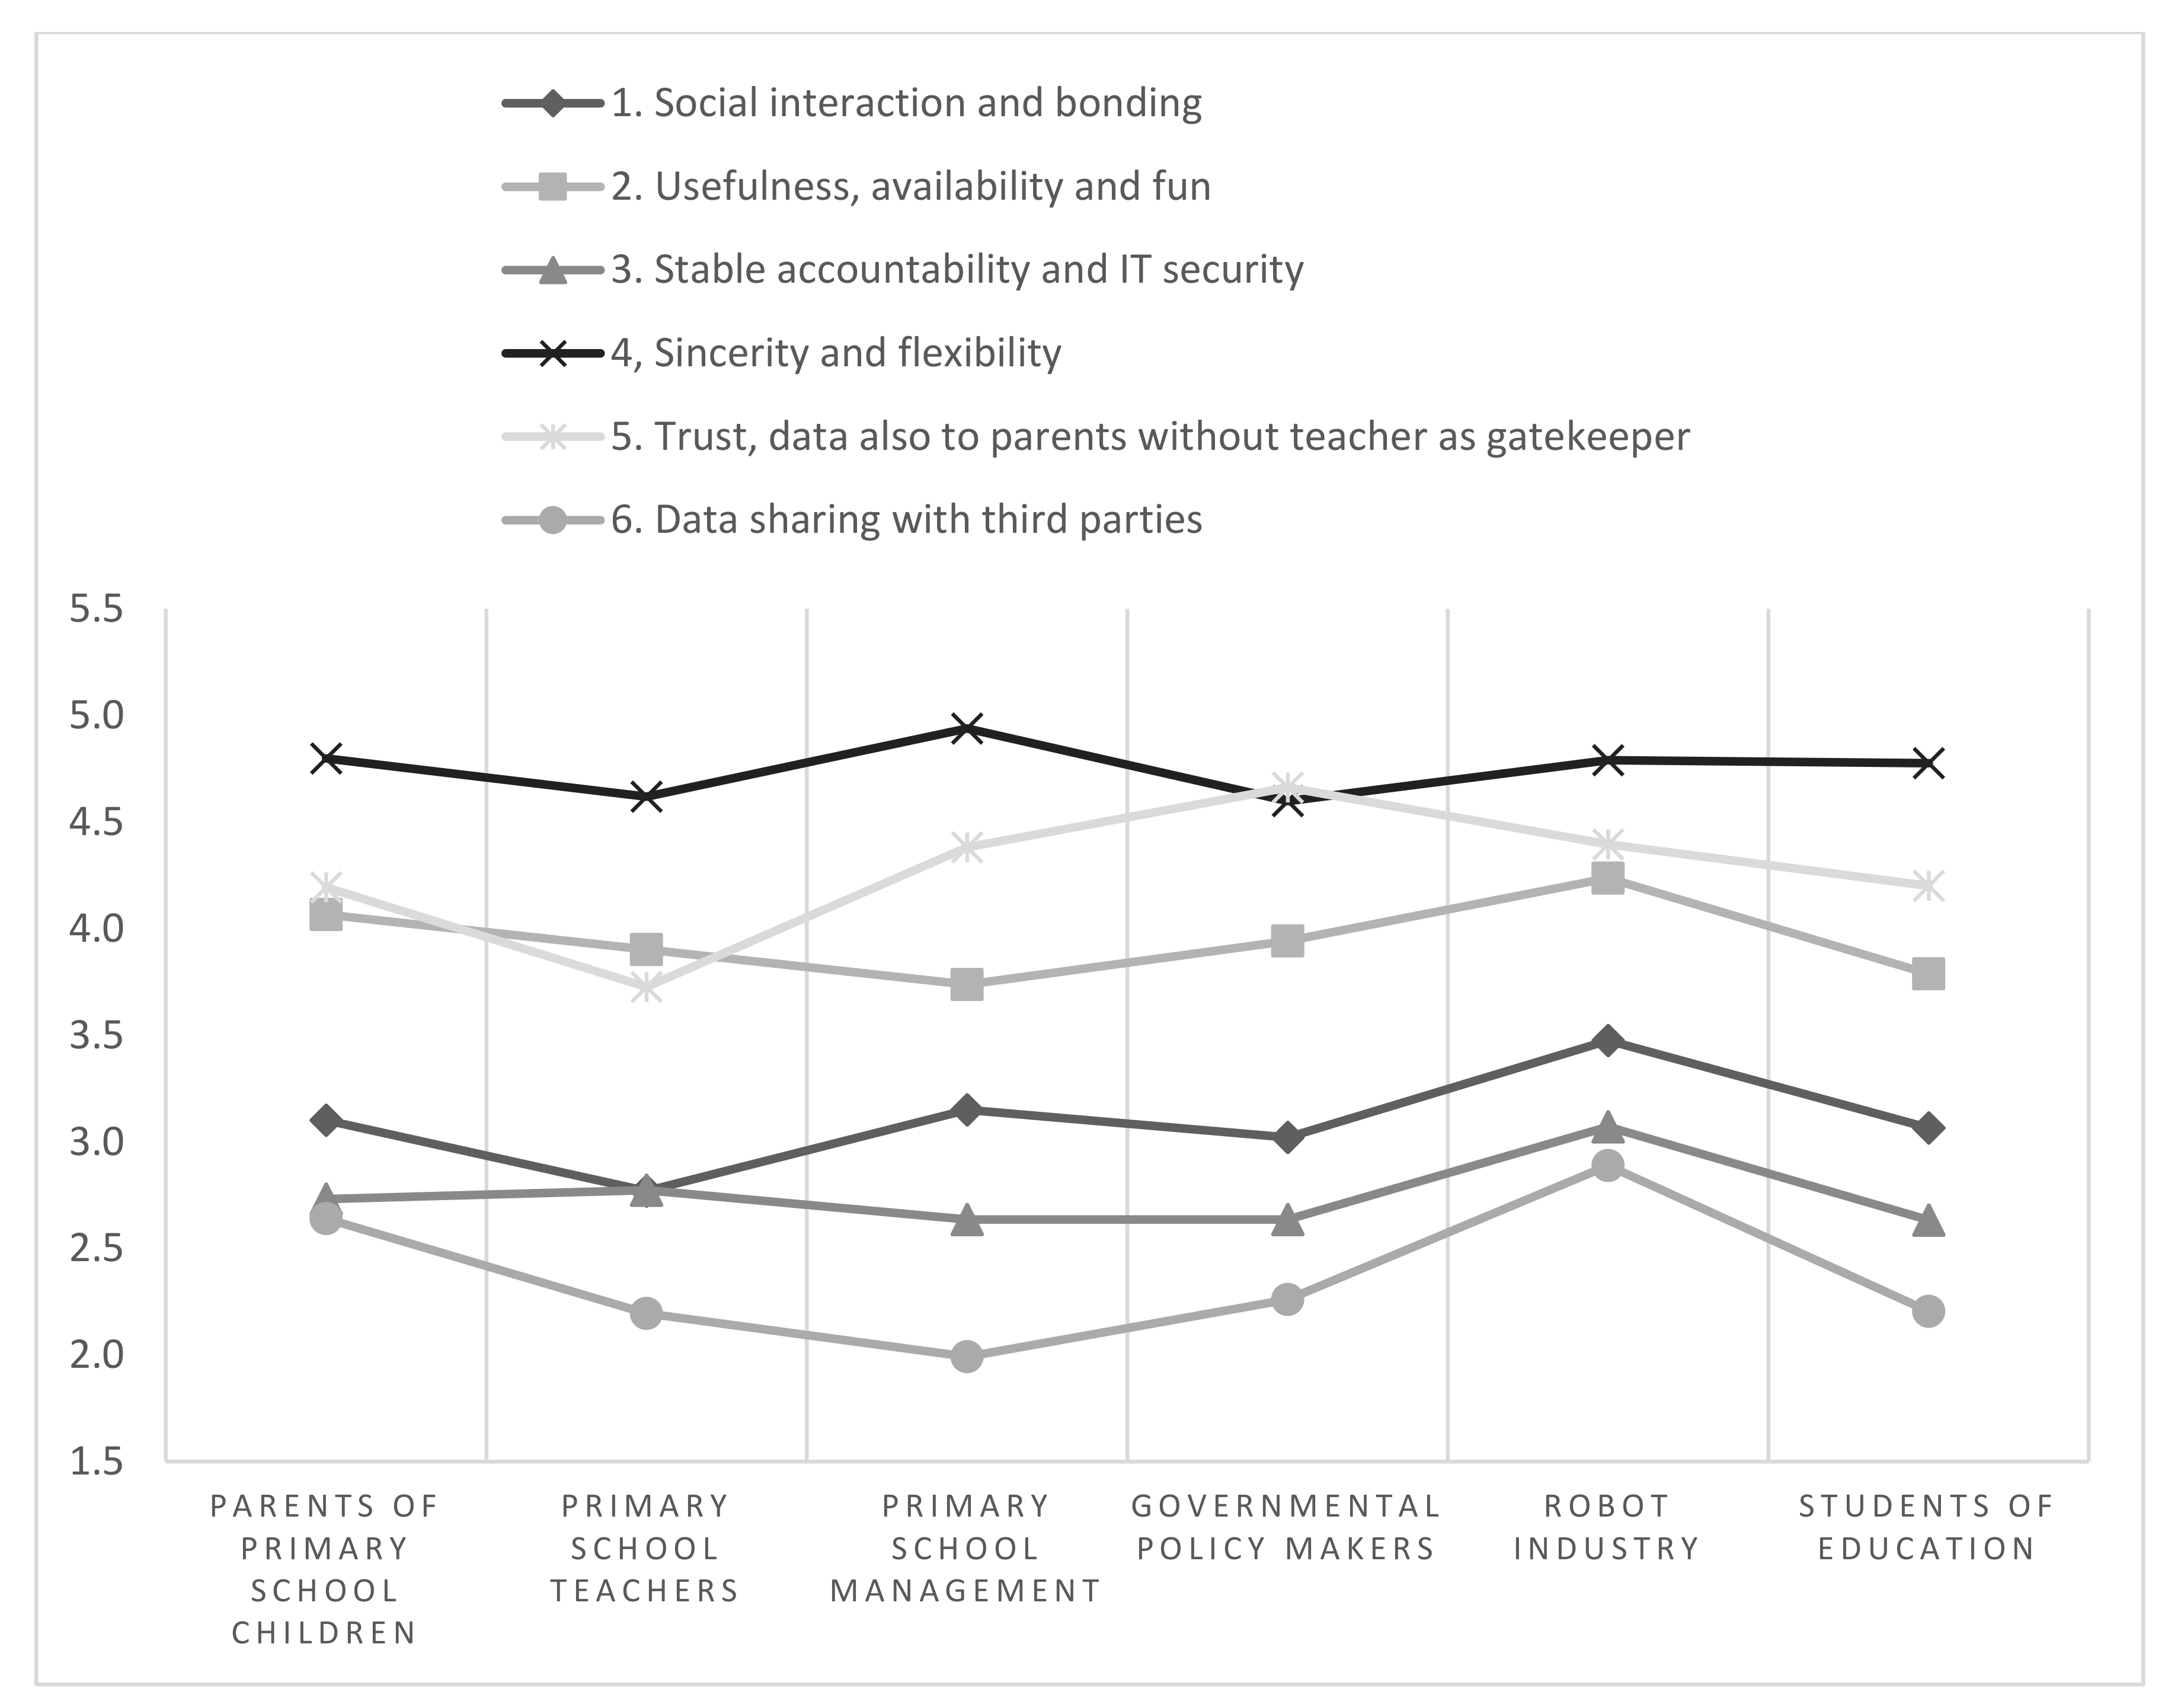
4.1. Stakeholder Perspectives

To answer RQ 1 (what are the attitudes of stakeholders on the moral issues related to social robots in education?), we ran a multivariate analysis of variance (MANOVA) to investigate whether attitudes and perceptions of moral issues regarding the use of social robots in education (estimated using the six scales) differ by stakeholder group.
The results of the MANOVA analysis confirmed that there is a statistically significant difference in the attitudes regarding the use of social robots in schools based on stakeholder group ( p < 0.05 ). Furthermore, as can be seen in Table 4, the results also show that the effect of stakeholder group was significant for all six scales, with the one exception of scale number 4 (‘Sincerity and Flexibility’), for which there were no significant differences. The per group means for all six scales are illustrated in Figure 2 below and the results of the post-hoc tests can be found in Table S3 online (https://osf.io/a3jsv/).
As can be seen in Figure 2, the scores for most scales differ among the six stakeholder groups. More specifically, on average, all stakeholder groups rank lowest on scale 6, reflecting ‘Data sharing with third parties’. Then, they also score low on scale 3 (i.e., Stable accountability and IT safety), except for teachers. Finally, they score in the middle on scale 1 (i.e., ‘Social interaction and bonding’). Compared to the aforementioned three scales, all stakeholder groups score higher on scale 2 (i.e., ‘Usefulness, availability and fun’), scale 5 (i.e., ‘Trust, data also to parents without a teacher as the gatekeeper’), and on scale 4 (i.e., ‘Sincerity and flexibility’).
With regards to specific differences, the results of the post-hoc test confirm that:
  • For scale 1 (Social interaction and bonding), the employees of the robotics industry score significantly higher than teachers and government policymakers.
  • For, scale 2 (Usefulness, availability and fun), the employees of the robotics industry score significantly higher than primary school directors/management and students of education.
  • For scale 3 (Stable accountability and IT security), the employees of the robotics industry score significantly higher than government policymakers and students of education.
  • For scale 4 (Sincerity and flexibility), there are no significant differences by group.
  • For scale 5 (Trust, data also to parents without a teacher as the gatekeeper), teachers score significantly lower on this scale than all other groups. Additionally, government policymakers score significantly higher than parents with children in primary education, and students of education.
  • For scale 6 (Data sharing with third parties), the robotics industry shows a significantly higher mean than primary school teachers, primary school directors, and students of education. Additionally, parents with children in primary education have a significantly higher mean than primary school director/management.
In summary, in relation to RQ1, there are significant differences with regards to the attitudes of stakeholders on the moral issues related to social robots in education. However, some similarities can also be found. Overall, the stakeholders seem most concerned about issues related to data sharing with third parties, the effect robots could have on the accountability system in schools, IT safety, and social interaction and bonding. What is more, the stakeholders also considered robots useful, fun, and objects that should be made widely available. They also considered it important that the robots are trustworthy and sincere towards children, and that the robot is flexible (movable).

4.2. Cluster Analysis

To answer RQ2 (How can the attitudes related to the moral issues be categorized?), we performed a cluster analysis on the six constructed scales (shown in Table 3) to identify groups among the respondents with regards to attitudes on moral issues related to the use of social robots in schools. Initially, we applied hierarchical clustering to the data using Ward’s method [43]. The agglomeration schedule, the dendrogram, and the icicle plot suggested a solution with two or four clusters. However, in both cases, one of the clusters contained almost all observations (504 and 510 respectively) and the remaining cluster(s) contained 5 observations or fewer. As clusters with such small sizes are very difficult (or even impossible) to work with, we decided to switch to a partition-based clustering, specifically k-means clustering [44]. In doing so, we considered multiple solutions with the number of clusters ranging from two to ten. Based on the plot of the within-cluster sum of squares against the number of clusters, we decided that the solutions with five and six clusters fit the data best. We then decided to only keep the solution with five clusters as this provided more clearly distinguishable and evenly sized clusters.
The results of the k-means cluster analysis with k   =   5 are shown in Table 5. In the table, a higher positive score indicates a positive or favourable attitude towards the construct that the scale represents or measures, while a higher negative score indicates a negative, unfavourable attitude towards it. For example, the relatively high score on scale 1 (Social interaction and bonding) of respondents belonging to cluster one, indicates that these respondents have a positive attitude towards robots having social interaction and allow for the robot to bond with children. The relatively high negative score on scale 4 (Sincerity and Flexibility), indicates that participants in this cluster consider robots inappropriate for social interaction and bonding.
Based on their respective scores on the six scales considered (shown in Table 5), we named the identified clusters as follows: (1) Enthusiast, (2) Practical, (3) Troubled, (4) Sceptic, and (5) Mindfully Positive. The description of each cluster is provided below.

4.2.1. Enthusiast (Cluster 1)

Enthusiast (n = 135) show relatively positive attitudes towards the use of social robots in education. They consider the robots’ capacity for social interaction and bonding with children to be useful and safe. The results also indicate that they believe robots should be universally usable and fun. They have no strong opinions on the impact of social robots on IT security and accountability. In general, the Enthusiast also have no strong views on whether robots should be trustworthy and sincere to children, or flexible (movable). Finally, they consider data sharing with third parties (e.g., the government and robot industry) relatively non-problematic.

4.2.2. Practical (Cluster 2)

The Practical (n = 87) are shown to have no strong views about robots being universally usable or fun, or on the impact they might have on IT security and accountability. Similarly to the Enthusiast, they also consider data sharing with third parties to be non-problematic, although to a lesser extent. However, unlike those in cluster 1, they do consider social interaction and bonding with robots undesirable. This could imply that this group sees robots more as a technological tool, rather than as social actors. This could also explain why this group does not deem it necessary for robots to be trustworthy and sincere to children.

4.2.3. Troubled (Cluster 3)

The Troubled (n = 143) group refers to individuals with strong views against sharing data with third parties. Furthermore, respondents belonging to this cluster believe that robots should not be used for social interaction and they should not bond with children. They consider the robot disruptive to the stability of the schools’ accountability and IT security systems. With regards to sincerity and flexibility, they find it important that the robot is sincere to children and easy to move.

4.2.4. Sceptic (Cluster 4)

The Sceptic (n = 33) are the group with the least positive attitudes towards the use of social robots in education. They consider the robots’ capacity for social interaction and bonding with children inappropriate and potentially dangerous. Furthermore, they believe that robots should not be universally usable or fun. They also consider the impact of robots on IT security and the stability of the schools’ current accountability system worrisome. According to them, social robots should be trustworthy and should not pass on secrets told by children to others (e.g., teachers). Lastly, they consider it problematic to share data collected by the robot with third parties.

4.2.5. Mindfully Positive (Cluster 5)

The Mindfully Positive (n = 117), like the Enthusiast, are characterized by relatively positive attitudes towards robots. They consider social interaction and bonding to be non-problematic, they think robots are fun and should be made widely available, and they consider the impact on accountability and IT safety to be low. However, they are also cautious about and disapproving of the sharing of data with third parties. Finally, they think robots should be honest to children and not keep information away from them, and they also believe that secrets told by children to the robot should not be passed on.
In summary, in relation to RQ2, the attitudes related to moral issues regarding social robots in education can be categorized into five clusters. One cluster has strong positive attitudes (Enthusiast), while another cluster has strong negative attitudes towards social robots in education (Sceptic). The remaining three clusters do not have a strongly dismissive attitude toward the use of social robots in education, although they each have their own moral issues they consider relevant and important.

4.3. Descriptive Analysis of the Socio-Demographic Characteristics of Each Cluster

To answer RQ3 (which socio-demographic characteristics influence the attitudes of stakeholders on the moral issues related to social robots in education?), we first examined the distribution of stakeholders and socio-demographic characteristics across the five clusters and then conducted a logistic regression analysis (which is described in the following section).
The distributions of stakeholder group, age, gender, income, education, and experience with robots across the five clusters are summarized in Table 6; for each of the characteristics, the highest value across the five clusters is presented in bold and the lowest are italicized.
With regards to the distribution of stakeholder groups, primary school teachers are underrepresented in the clusters Enthusiast, Mindfully Positive, and Sceptic, whereas they are overrepresented in the cluster Practical. However, in the Practical cluster, the school directors/management and the employees of the robotics industry are underrepresented. The employees of the robotics industry are also less present in cluster Troubled and the cluster Sceptic. Finally, the respondents belonging to the government policymakers/advisors are clearly more represented in the cluster Sceptic, compared to the other clusters.
Concerning age, we found that older people (>55) are underrepresented in the cluster Enthusiast, compared to the other age categories. Furthermore, there is a relatively large group of people aged older than 46 in the cluster Sceptic, compared to the younger age-groups. Those above 46 years of age are also underrepresented in the cluster Practical.
Regarding experience with robots, respondents with a little to no experience seem to be overrepresented in the clusters Practical, Troubled, and Sceptic, compared to the other two clusters.
For gender, clusters Enthusiast, Sceptic, and Mindfully Positive have a good gender balance. However, in cluster Practical and Troubled, there are more female than male respondents.
Concerning income, no major differences were found except for two: people with a high income are more represented in the cluster Mindfully Positive and people with medium income are more represented in the cluster Troubled.
Regarding education level, there are fewer respondents with low or medium education (secondary school or vocational education) in the cluster Mindfully Positive compared to respondents with a university education.
In summary, answering RQ3, the descriptive analysis provided some insights into the distribution of socio-demographic characteristics within each of the five clusters considered. Most importantly, parents with primary school children and employees of the robotics industry were more often represented in the Enthusiast group, primary school teachers in the Practical group, students of education in the Troubled group, and government policymakers/advisors were more often in the Sceptic group.

4.4. Logistic Regression Analysis

To determine which of the socio-demographic characteristics significantly predict group membership, we conducted a logistic regression analysis. The regressions used cluster assignment as the dependent variable and assessed the effect of aforementioned socio-demographic characteristics on the probability of belonging to a certain cluster. More specifically, in this final step, we made use of five binary logistic regression models, wherein for each of the regressions the dependent variable was defined as belonging to a specific cluster, as opposed to belonging to any of the four remaining clusters. Table 7 provides an overview of the regression analysis results (where the logit regression coefficients were transformed to odds ratios, for further details see [45]).

4.4.1. Cluster 1, Enthusiast

The results of the first regression analysis (DV: belonging to cluster one), suggest that teachers are significantly less likely to belong to cluster one (Enthusiast) compared to the other stakeholder groups O R = 0.305   p < 0.05 . Furthermore, people who had experience with robots have a significantly higher likelihood of belonging to the Enthusiast cluster, compared to those with little to no experience ( O R = 0.574   p < 0.05 ) .

4.4.2. Cluster 2, Practical

The results of the second regression (DV: belonging to cluster two), suggest that being a teacher (as opposed to belonging to the ‘other’ stakeholder group) and having little to no experience with robots (compared to having experience) significantly increases the likelihood of belonging to cluster 2 ( O R = 6.525   p < 0.01   and   O R = 4.143   p < 0.01 ) . Furthermore, having Secondary school or Vocational education (MBO) as highest level of completed education, significantly increases the likelihood of belonging to this group of Practicals compared to having a degree of a University of Science (WO) ( O R = 3.667   p < 0.05   and   O R = 2.792   p < 0.05 ) .

4.4.3. Cluster 3, Troubled

For cluster three, Troubled, the regression analysis showed that being a student of education (as opposed to belonging to the ‘other’ stakeholder), and having a medium (rather than high) income both increase the likelihood of belonging to the Troubled cluster   ( O R = 0.720   p < 0.05   and   O R = 2.624   p < 0.05 ) .

4.4.4. Cluster 4, Sceptic

The probability of belonging to cluster four is shown to be significantly, positively affected by having a low income (as opposed to high) ( O R = 27.864   p < 0.01 ) . Additionally, being under 35 significantly decreases the likelihood of belonging to this cluster, compared to being older than 55 (age: 18–25 ( O R = 0.079   p < 0.05 ) and age: 26–35 ( O R = 0.107   p < 0.05 ) ). The results further suggest a trend, wherein government policymakers (rather than the ‘other’ stakeholder groups), individuals with an education at the level of University of Applied Sciences (HBO) (as opposed to those with a University of Science degree (WO)) and those with a medium income (compared to high income) are more likely to belong to the Sceptic cluster ( O R = 7.627   p < 0.1   and   O R = 2.877   p < 0.1   and   O R = 4.174   p 0.1 ) .

4.4.5. Cluster 5, Mindfully Positive

The regression analysis revealed five significant results for cluster 5. Being 18–25 years of age (as opposed to older) significantly increased the likelihood of belonging to this cluster ( O R = 3.353   p < 0.05 ) . The probability of belonging to this cluster is shown to be significantly negatively affected by being a student of education ( O R = 0.322   p < 0.05 ) , having a vocational education (MBO) or university of Applied Sciences (HBO) education as highest education (compared to University of Science-WO) ( O R = 0.343   p < 0.05   and   O R = 0.569   p < 0.05 ) . Lastly, having a medium income also had a negative effect on the likelihood of belonging to the Mindfully Positive cluster (compared to low or high income) O R = 0.475   p < 0.05 ) .
In summary, answering RQ3, the logistic regression analysis showed which socio-demographic characteristics influence the attitudes of stakeholders. With regards to stakeholder groups, teachers were significantly less likely to belong to the Enthusiast group, and significantly more likely to belong to the Practical group. Government policymakers/advisors show a trend for belonging to the Sceptic group. Other socio-demographic characteristics that significantly affected the probabilities of belonging to a specific cluster included age, experience with robots, education level, and income.

5. Discussion and Conclusions

This study aimed to examine and categorize the moral issues of stakeholders related to the use of social robots in primary education, and to examine the influence of various socio-demographic characteristics. To this end, we constructed a questionnaire that included items representing a comprehensive list of moral issues based on the relevant literature and earlier focus group sessions. Our results indicate that, although there are multiple issues that need to be addressed first, social robots have the potential to be implemented in education in a morally responsible way, while keeping in mind the attitudes of direct and indirect stakeholder on moral issues related to social robots in education.
Using psychometric analyses, we constructed six scales that measure attitudes regarding moral issues related to robots in education. Based on the content of the items, we labelled the scales as follows: (1) Social interaction and bonding, (2) Usefulness, availability and fun, (3) Stable accountability and IT safety, (4) Sincerity and flexibility, (5) Trust, data also to parents without a teacher as a gatekeeper, and (6) Data sharing with third parties. These scales cover 15 out of the 17 values that were extracted from the literature and focus group sessions (shown in Table 2). The construction of the six scales was based on the results of a Principle Component Analysis (PCA), which was conducted using the questionnaire responses regarding attitudes and opinions about social robots and their use in education. It is important to note that, given the exploratory nature of our study, our results do not provide a comprehensive overview of all the moral issues surrounding the topic, especially given the complex and multi-layered nature of these issues, that often also depend on specific wording. Nevertheless, our results do provide valuable insights into numerous moral issues related to social robots in education and they serve as a starting point for future research that aims to further investigate the moral issues related to implementing robots in education.
The scales constructed were used to measure the attitudes of the following six stakeholder groups: (1) parents with primary school children; (2) primary school teachers; (3) school directors/management; (4) government policymakers/advisors; (5) employees of the robotics industry, and (6) students of education. In this study, stakeholders were grouped based on their role (e.g., teacher, parent, or policymaker) and further based on their interactions with the robots (i.e., direct vs. in-direct). Alternatively, the stakeholders could also be divided based on their priorities and/or underlying interests. However, given the lack of literature on these aspects, we chose a division based on role and robot interaction. It is important to note that our division could result in a situation wherein stakeholders who belong to the same group have different opinions related to moral issues regarding the use of social robots in education. Therefore, further research focusing on these moral issues should also include an analysis of the interests and priorities of stakeholders, which could potentially lead to a more detailed and disaggregated division of stakeholders. Finally, as this is an exploratory study, future research should also test and assess the validity of the questionnaire used and the scales constructed.
In the following section, we will first discuss the results of our analysis in relation to the three research questions of this study: RQ (1) what are the attitudes of stakeholders on the moral issues related to social robots in education, RQ (2) how can the attitudes related to the moral issues be categorized, and RQ (3) what socio-demographic characteristics influence the attitudes of stakeholders on the moral issues related to social robots in education? Then, we will elaborate on the (practical) implications of our study for the application of social robots in primary education.

5.1. RQ1, Stakeholder Attitudes

In answering RQ1, we found both similarities and (significant) differences among stakeholder groups in terms of their attitudes regarding moral issues related to robots in education. Overall, stakeholders considered robots useful and fun, and expressed that robots should be made widely available for schools. Usefulness is shown to be strongly correlated with usage behavior [46]; therefore, the relatively high overall score on the scale that included usefulness appears promising for the actual use of social robots.
The stakeholders also showed relatively positive attitudes regarding the need for robots to be trustworthy and sincere towards children and keep promises made to children; they also acknowledged the need for the robot to be flexible (movable). The moral issues stakeholders seemed most concerned about were data sharing with third parties, the effect robots could have on the schools’ accountability systems and IT safety, and lastly, the social interaction and bonding of children with robots.
It is worthwhile mentioning that the employees of the robotics industry were relatively cautious about the data sharing aspect, although they were significantly less negative than primary school teachers, school directors/management, and students of education. Earlier research [47] reported that employees of the robotics industry believe that such data is valuable for the improvement of their products and services. Our results add to this literature by showing that, although the data can be seen as valuable, even the employees of the robots’ industry consider the sharing of data with third parties as potentially problematic. Teachers had significantly more negative attitudes related to the ideas of the robot being trustworthy, and the data being shared with parents without a teacher as gatekeeper than all other stakeholder groups. This could be explained by the finding that teachers view themselves as the gatekeepers of children’s data, as has been reported in previous studies [48].
All stakeholders consider social robots potentially disruptive for the schools’ accountability structures and are concerned about the impact of robots on IT security. Interestingly, stakeholders from the robot industry, representing the manufacturers of robots, were the group that considered robots to be the least disruptive for the schools’ accountability structure or IT security (significant difference compared to government policymakers, and students of education). This might be explained by the experience that employees of the robot industry have with robots as well as their technological knowledge. However, the difference could also be explained by a potential lack of insights about the school systems. With regards to social interaction and the bonding of children with robots, no strong positive or negative attitudes were found among the stakeholder groups. This could indicate a cautious, but not dismissive, attitude towards the idea of children socially interacting and bonding with robots.

5.2. RQ2, Five Types of Moral Attitudes towards Social Robots in Education

When answering RQ2, we found five types of attitudes on moral issues related to the use of social robots in education, which we labelled as follows: Enthusiast, Practical, Troubled, Sceptic, and Mindfully Positive.
The Enthusiast group represents the most positive attitude towards social robots, whilst the Sceptic group represents the most negative one. These two groups can also be found in the literature, where some stakeholders are strongly in favor of social robots [36], while others have highly negative associations [1,29,30].
The other three clusters show no strong dismissive attitudes towards social robots in education, although they each have their own moral issues that they consider relevant. The Practical group considers robots to be useful, but not for social interaction and bonding. The Troubled group has strong negative attitudes towards the sharing of data with third parties. Furthermore, the Troubled believe that robots should not be used for social interaction. They consider robots to be disruptive to the stability of the school’s accountability systems and their IT security. With regards to sincerity and flexibility, individuals belonging to the Troubled group deem it important that the robots be sincere to children and easy to move. In contrast, the Mindfully Positive consider social interaction and bonding with robots to be non-problematic, they think robots are fun and should be made widely available; they also consider the robots’ impact on accountability systems and IT safety to be low. However, they are skeptical about the sharing of data with third parties. Finally, they think robots should be honest to children and they should not keep information from them; they also believe that secrets told to the robot by the children should not be passed on.

5.3. RQ3, Which Socio-Demographic Characteristics Influence the Attitudes of Stakeholders

In answering RQ3, we found that several socio-demographic characteristics significantly predict the attitudes of respondents on the moral issues related to social robots in education.
With regards to the stakeholder groups, teachers were significantly less likely to belong to the Enthusiast group, while they were significantly more likely to belong to the Practical group. This finding seems to be in line with previous research, which indicates that some teachers consider robots more as tools than social actors [28]. This could be explained by the lack of experience with robots as 92% of all individuals in the Practical group, which was dominated by teachers, had no to little experience with robots. These attitudes have the potential to change once teachers become more exposed to robots; to illustrate, a study has shown that having been introduced to robots and informed about their abilities, teachers viewed them as harmless tools, much like hand puppets [48]. It might therefore be advisable, when deciding to use social robots in education, to first familiarize teachers with this technology and initially use robots only as tools. Then, once teachers are experienced with the use of robots as tools, these robots can potentially be used for social interaction as well. Another potential explanation could be related to the teachers’ lack of self-confidence regarding the basic knowledge needed to use social robots. These confidence issues are likely a result of the fact that the ICT proficiency of teachers appears to not keep up with rapid technological change and the opportunities it brings about in education [49]. Increasing familiarity with these new technologies, during workshops and/or small-scale lectures, can provide teachers with the necessary (basic) knowledge and consequently improve their self-confidence [50]. To ensure that the implementation of social robots in education is successful, it is also crucial to allow teachers to commit a significant amount of time to the integration of educational technologies in their teaching. The importance of this aspect stems from the fact that teachers who are early adopters of technology and who are given sufficient time to incorporate the technology in their teaching are shown to be more likely to adopt new technologies, even when they are complex [51].
Our analysis also revealed that government policymakers were most likely to belong to the Sceptic group. The members of this group find it problematic that data about children can easily be shared via the robots with third parties, such as the government. This is an interesting finding as earlier research [52] suggests that government policymakers have considered such data sharing to be a potential benefit of the use of social robots in education. The Sceptic cluster also had the least favorable attitude towards making robots widely available. This could be explained by the ability of policymakers to foresee the consequences of such a policy on a broader (national/regional) scale, compared to the other stakeholders.
Moreover, this group of government policymakers also contained the largest proportion of people aged 46 and above. Young people (18–35 years of age) were significantly less likely to belong to this Sceptic group. This is consistent with earlier research results showing that younger people are more accepting of robots than older people [23]. In contrast, students of education, despite being young, were significantly more likely to belong to the Troubled group and significantly less likely to belong to the Mindfully positive group, whereas in general, the youngest group (18–25 years of age) shows a trend towards belonging to the Mindfully positive group.
In line with previous research [23], we found that having experience with robots had a significant effect on the likelihood of belonging to the most positive group, the Enthusiast cluster. Other significant results were found for education level and income. Namely, people with low income were significantly more likely to belong to the Sceptic group, while people with medium income were more likely to belong to the Troubled group and less likely to belong to the Mindfully positive group. The negative attitude of people with low income is also found in the literature [23] and can be explained by concerns related to the robots not being universally accessible, as had been reported by parents [53]. Individuals with a University of Applied Science degree showed a trend of belonging to the Sceptic group and were significantly less likely to belong to the Mindfully positive group. This finding seems to contradict earlier research that reports a more positive attitude towards robots by those with higher education [23]. This could potentially be explained by the suggestion that respondents with higher education might be potentially more knowledgeable about the impact of social robots in education.

5.4. Implications for the Design and Implementation of Social Robots in (Primary) Education

Based on the results of our study, we can derive seven implications for future research and practice. Please note that this study was solely conducted in The Netherlands and that attitudes might differ among countries and cultures [37]. For worldwide implications, future research should explore the attitudes of stakeholders in different countries and cultures and examine how they differ depending on the country or cultural context considered.
A first implication of our results is that robots should be honest to children and keep promises made to them. In line with this, robots should keep secrets told to them by the child, and not share these with parents or teachers. A second implication is that social robots are overall considered useful and fun and should be made widely available for schools. Only a small group of sceptics have negative attitudes related to this. The skepticism might be explained by the implications this would have on a national or regional policy level, such as cost implications. If so, the attitudes of government policymakers (who are more likely to belong to this group of skeptics), might change when robots would first be made available at schools for experimental use only. Third, robots should not share data with third parties, such as the government or robotics companies and manufacturers that could use the data to improve their policies or products. Fourth, future research should examine the IT security risks and the impact on schools’ accountability systems of the use of social robots in schools, as this is a concern raised by many of the stakeholders. A fifth implication of our results is that the utilization of robots that socially interact with children and form social bonds with them should be approached with caution as many stakeholders, including teachers, have relatively negative attitudes towards this. Given that experience with robots increases the likelihood to have a more positive attitude to this issue, it is advisable to first familiarize stakeholders with social robots. This could be done by first using robots as tools rather than as social actors, which the vast majority of the survey participants is not opposed to. Sixth, schools in areas with lower economic status might expect more skeptical stakeholders, given that low income is a strong predictor of belonging to the Sceptic group. A seventh and last implication is that schools might turn to their younger employees first for the adoption of social robots, as they are less likely to belong to the Sceptic group.
The implications mentioned above provide valuable insights into how social robots should be implemented, while keeping in mind the considerations related to moral issues of direct and indirect stakeholders. This can be seen as a first step towards the creation of moral guidelines for the use of social robots. Future research should focus on translating these insights into more robust design and implementation requirements for the robotics industry and for schools, thereby ensuring they have the right tools to responsibly design and implement this new promising educational technology.

Supplementary Materials

The following are available online at https://osf.io/a3jsv/, Raw dataset, Table S1: Questionnaire items, Table S2: Loadings of the items per scale, Table S3: Post-hoc tests results MANOVA.

Author Contributions

Conceptualization, E.A.K., P.V. and M.H.J.S.; methodology, E.A.K., M.H.J.S., P.P., and P.V.; software, M.H.J.S. and P.P.; validation, E.A.K., M.H.J.S., P.P., and P.V.; formal analysis, E.A.K., M.H.J.S., and P.P.; investigation, E.A.K., M.H.J.S., P.P., and P.V.; resources, E.A.K., M.H.J.S., P.P., and P.V.; writing—original draft preparation, M.H.J.S.; writing—review and editing, E.A.K., M.H.J.S., P.P., and P.V.; visualization, M.H.J.S.; supervision, E.A.K. and P.V.; project administration, E.A.K. and M.H.J.S.; funding acquisition, E.A.K. and M.H.J.S. All authors have read and agreed to the published version of the manuscript.

Funding

Research supported by The Dutch Research Council (NWO), project number 023.010.066.

Institutional Review Board Statement

The study was conducted according to the guidelines of the Declaration of Helsinki. The ethics review self-check provided by the FSW Research Ethics Review Committee (RERC) concluded that this study did not require further evaluation by the FSW RERC, because: in this study participants are asked for informed consent, the study poses no risks to participants, will not work with participants who are vulnerable, participants are not exposed to material, social or psychological recruitment incentives that are stronger than usual, participants will not be exposed to research material that is distressing, offensive, or age-inappropriate, this study poses no risks to the researchers, this study does not deceive research participants, or will properly debrief them afterwards, and respondents in your research will be fully anonymous.

Informed Consent Statement

Informed consent was obtained from all subjects involved in the study.

Data Availability Statement

Data can be made available by the corresponding author, or accessed via https://osf.io/a3jsv/.

Acknowledgments

We are extremely grateful to all participants in our study. We thank our students Robin de Jong, John van Meerten, and Coen Schoof for their indispensable help in data collection. We also would like to thank the expert scholars who reviewed the initial questionnaire for their valuable feedback.

Conflicts of Interest

The authors declare no conflict of interest.

References

  1. Serholt, S.; Barendregt, W.; Vasalou, A.; Alves-Oliveira, P.; Jones, A.; Petisca, S.; Paiva, A. The case of classroom robots: Teachers’ deliberations on the ethical tensions. AI Soc. 2017, 32, 613–631. [Google Scholar] [CrossRef] [Green Version]
  2. Sharkey, A.J.C. Should we welcome robot teachers? Ethics Inf. Technol. 2016, 18, 283–297. [Google Scholar] [CrossRef] [Green Version]
  3. Tolksdorf, N.F.; Siebert, S.; Zorn, I.; Horwath, I.; Rohlfing, K.J. Ethical Considerations of Applying Robots in Kindergarten Settings: Towards an Approach from a Macroperspective. Int. J. Soc. Robot. 2020, 1–12. [Google Scholar] [CrossRef] [Green Version]
  4. Belpaeme, T.; Kennedy, J.; Ramachandran, A.; Scassellati, B.; Tanaka, F. Social robots for education: A review. Sci. Robot. 2018, 3. [Google Scholar] [CrossRef] [PubMed] [Green Version]
  5. Bartneck, C.; Forlizzi, J. A design-centred framework for social human-robot interaction. In Proceedings of the RO-MAN 2004 13th IEEE International Workshop on Robot and Human Interactive Communication (IEEE Catalog No.04TH8759), Kurashiki, Japan, 20–22 September 2004; pp. 591–594. [Google Scholar] [CrossRef] [Green Version]
  6. Alemi, M.; Meghdari, A.; Basiri, N.M.; Taheri, A. The Effect of Applying Humanoid Robots as Teacher Assistants to Help Iranian Autistic Pupils Learn English as a Foreign Language. In Social Robotics; Tapus, A., André, E., Martin, J.-C., Ferland, F., Ammi, M., Eds.; Springer International Publishing: Berlin/Heidelberg, Germany, 2015; Volume 9388, pp. 1–10. [Google Scholar] [CrossRef]
  7. Gordon, G.; Breazeal, C.; Engel, S. Can Children Catch Curiosity from a Social Robot? In Proceedings of the Tenth Annual ACM/IEEE International Conference on Human-Robot Interaction, Portland, OR, USA, 2–5 March 2015; pp. 91–98. [Google Scholar] [CrossRef]
  8. Kwok, V.H.Y. Robot vs. Human Teacher: Instruction in the Digital Age for ESL Learners. Engl. Lang. Teach. 2015, 8. [Google Scholar] [CrossRef] [Green Version]
  9. van den Berghe, R.; Verhagen, J.; Oudgenoeg-Paz, O.; Van der Ven, S.; Leseman, P. Social Robots for Language Learning: A Review. Rev. Educ. Res. 2019, 89, 259–295. [Google Scholar] [CrossRef] [Green Version]
  10. Wang, Y.H.; Young, S.S.-C.; Jang, J.-S.R. Using Tangible Companions for Enhancing Learning English Conversation. J. Educ. Technol. Soc. 2013, 16, 296–309. [Google Scholar]
  11. Kose, H.; Yorganci, R. Tale of a robot: Humanoid robot assisted sign language tutoring. In Proceedings of the 2011 11th IEEE-RAS International Conference on Humanoid Robots, Bled, Slovenia, 26–28 October 2011; pp. 105–111. [Google Scholar] [CrossRef]
  12. Uluer, P.; Akalın, N.; Köse, H. A New Robotic Platform for Sign Language Tutoring: Humanoid Robots as Assistive Game Companions for Teaching Sign Language. Int. J. Soc. Robot. 2015, 7, 571–585. [Google Scholar] [CrossRef]
  13. Aresti-Bartolome, N.; Garcia-Zapirain, B. Technologies as Support Tools for Persons with Autistic Spectrum Disorder: A Systematic Review. Int. J. Environ. Res. Public Health 2014, 11, 7767–7802. [Google Scholar] [CrossRef]
  14. Konijn, E.A.; Hoorn, J.F. Robot tutor and pupils’ educational ability: Teaching the times tables. Comput. Educ. 2020, 157, 103970. [Google Scholar] [CrossRef]
  15. Ros, R.; Baroni, I.; Demiris, Y. Adaptive human–robot interaction in sensorimotor task instruction: From human to robot dance tutors. Robot. Auton. Syst. 2014, 62, 707–720. [Google Scholar] [CrossRef] [Green Version]
  16. Ros, R.; Demiris, Y. Creative Dance: An Approach for Social Interaction between Robots and Children. In Human Behavior Understanding; Salah, A.A., Hung, H., Aran, O., Gunes, H., Eds.; Springer International Publishing: Berlin/Heidelberg, Germany, 2013; Volume 8212, pp. 40–51. [Google Scholar] [CrossRef]
  17. Pandey, A.K.; Gelin, R. Humanoid Robots in Education: A Short Review. In Humanoid Robotics: A Reference; Goswami, A., Vadakkepat, P., Eds.; Springer: Berlin/Heidelberg, Germany, 2017; pp. 1–16. [Google Scholar] [CrossRef]
  18. Mechelen, M.V.; Baykal, G.E.; Dindler, C.; Eriksson, E.; Iversen, O.S. 18 Years of Ethics in Child-Computer Interaction Research: A Systematic Literature Review. In Proceedings of the Interaction Design and Children Conference, London, UK, 17–24 June 2020; pp. 161–183. [Google Scholar] [CrossRef]
  19. Friedman, B.; Kahn, P.H.; Borning, A.; Huldtgren, A. Value Sensitive Design and Information Systems. In Early Engagement and New Technologies: Opening up the Laboratory; Doorn, N., Schuurbiers, D., van de Poel, I., Gorman, M.E., Eds.; Springer: Berlin/Heidelberg, Germany, 2013; pp. 55–95. [Google Scholar] [CrossRef]
  20. Ligtvoet, A.; Van de Kaa, G.; Fens, T.; Van Beers, C.; Herder, P.; van den Hoven, J. Value Sensitive Design of Complex Product Systems. In Policy Practice and Digital Science: Integrating Complex Systems, Social Simulation and Public Administration in Policy Research; Janssen, M., Wimmer, M.A., Deljoo, A., Eds.; Springer International Publishing: Berlin/Heidelberg, Germany, 2015; pp. 157–176. [Google Scholar] [CrossRef]
  21. Friedman, B. (Ed.) Human Values and the Design of Computer Technology; Center for the Study of Language and Information; Cambridge University Press: Cambridge, UK, 1997. [Google Scholar]
  22. Smakman, M.; Konijn, E.A. Robot Tutors: Welcome or Ethically Questionable? In Robotics in Education-Current Research and Innovations; Merdan, M., Lepuschitz, W., Koppensteiner, G., Balogh, R., Obdržálek, D., Eds.; Springer: Cham, Switzerland, 2020; Volume 1023, pp. 376–386. [Google Scholar] [CrossRef]
  23. European Commission, Directorate-General for Communication. Special Eurobarometer 460: Attitudes towards the Impact of Digitization and Automation on Daily Life; (460 Wave EB87.1); European Commission: Brussels, Belgium, 2017; Available online: https://ec.europa.eu/commfrontoffice/publicopinion/archives/ebs/ebs_382_en.pdf (accessed on 8 December 2020).
  24. Hood, D.; Lemaignan, S.; Dillenbourg, P. When Children Teach a Robot to Write: An Autonomous Teachable Humanoid Which Uses Simulated Handwriting. In Proceedings of the Tenth Annual ACM/IEEE International Conference on Human-Robot Interaction, Portland, OR, USA, 2–5 March 2015; pp. 83–90. [Google Scholar] [CrossRef] [Green Version]
  25. Jones, A.; Castellano, G. Adaptive Robotic Tutors that Support Self-Regulated Learning: A Longer-Term Investigation with Primary School Children. Int. J. Soc. Robot. 2018, 10, 357–370. [Google Scholar] [CrossRef] [Green Version]
  26. Shin, N.; Kim, S. Learning about, from, and with Robots: Students’ Perspectives. In Proceedings of the 16th IEEE International Conference on Robot & Human Interactive Communication 2007, Jeju Island, Korea, 26–29 August 2007; pp. 1040–1045. [Google Scholar] [CrossRef]
  27. Wei, C.-W.; Hung, I.-C.; Lee, L.; Chen, N.-S. A Joyful Classroom Learning System with Robot Learning Companion for Children to Learn Mathematics Multiplication. Turk. Online J. Educ. Technol. 2011, 10, 11–23. [Google Scholar]
  28. Diep, L.; Cabibihan, J.-J.; Wolbring, G. Social Robots: Views of special education teachers. In Proceedings of the 3rd 2015 Workshop on ICTs for Improving Patients Rehabilitation Research Techniques, Lisbon, Portugal, 1–2 October 2015; pp. 160–163. [Google Scholar] [CrossRef]
  29. Kennedy, J.; Lemaignan, S.; Belpaeme, T. Cautious Attitude of Teachers towards Social Robots in Schools. In Proceedings of the Robots 4 Learning Workshop at IEEE RO-MAN, New York, NY, USA, 12 February 2016; p. 6. [Google Scholar]
  30. Reich-Stiebert, N.; Eyssel, F. Robots in the Classroom: What Teachers Think About Teaching and Learning with Education Robots. Soc. Robot. 2016, 671–680. [Google Scholar] [CrossRef]
  31. Ahmad, I.M.; Mubin, O.; Orlando, J. Understanding Behaviours and Roles for Social and Adaptive Robots in Education: Teacher’s Perspective. In Proceedings of the Fourth International Conference on Human Agent Interaction, Biopolis, Singapore, 4–7 October 2016; pp. 297–304. [Google Scholar] [CrossRef]
  32. Fridin, M.; Belokopytov, M. Acceptance of socially assistive humanoid robot by preschool and elementary school teachers. Comput. Hum. Behav. 2014, 33, 23–31. [Google Scholar] [CrossRef]
  33. Kory Westlund, J.M.; Gordon, G.; Spaulding, S.; Lee, J.J.; Plummer, L.; Martinez, M.; Das, M.; Breazeal, C. Lessons from teachers on performing HRI studies with young children in schools. In Proceedings of the 2016 11th ACM/IEEE International Conference on Human-Robot Interaction (HRI), Christchurch, New Zealand, 7–10 March 2016; pp. 383–390. [Google Scholar] [CrossRef] [Green Version]
  34. Chang, C.-W.; Lee, J.-H.; Chao, P.-Y.; Wang, C.-Y.; Chen, G.-D. Exploring the Possibility of Using Humanoid Robots as Instructional Tools for Teaching a Second Language in Primary School. Educ. Technol. Soc. 2010, 13, 13–24. [Google Scholar]
  35. Shih, C.-F.; Chang, C.-W.; Chen, G.-D. Robot as a Storytelling Partner in the English Classroom—Preliminary Discussion. In Proceedings of the Seventh IEEE International Conference on Advanced Learning Technologies (ICALT 2007), Niigata, Japan, 18–20 July 2007; pp. 678–682. [Google Scholar] [CrossRef]
  36. Sumioka, H.; Yoshikawa, Y.; Wada, Y.; Ishiguro, H. Teachers’ Impressions on Robots for Therapeutic Applications. In New Frontiers in Artificial Intelligence; Otake, M., Kurahashi, S., Ota, Y., Satoh, K., Bekki, D., Eds.; Springer International Publishing: Berlin/Heidelberg, Germany, 2017; Volume 10091, pp. 462–469. [Google Scholar] [CrossRef]
  37. Choi, J.-H.; Lee, J.-Y.; Han, J.-H. Comparison of Cultural Acceptability for Educational Robots between Europe and Korea. J. Inf. Process. Syst. 2008, 4, 97–102. [Google Scholar] [CrossRef] [Green Version]
  38. Koerber, A.; McMichael, L. Qualitative Sampling Methods: A Primer for Technical Communicator. J. Bus. Tech. Commun. 2008, 22, 454–473. [Google Scholar] [CrossRef]
  39. Smakman, M.; Konijn, E.; Vogt, P. Moral Considerations on Social Robots in Education: A Multi-stakeholder Perspective. 2020. submitted. [Google Scholar]
  40. Friedman, B.; Kahn, P.H.; Borning, A. Value sensitive design and information systems. In The Handbook of Information and Computer Ethics; Himma, K.E., Tavani, H.T., Eds.; John Wiley & Sons, Inc.: Hoboken, NJ, USA, 2008; pp. 69–101. [Google Scholar]
  41. Presser, S.; Schuman, H. The Measurement of a Middle Position in Attitude Surveys. Public Opin. Q. 1980, 44, 70–85. [Google Scholar] [CrossRef]
  42. Cattell, R.B. The Scree Test for the Number of Factors. Multivar. Behav. Res. 1966, 1, 245–276. [Google Scholar] [CrossRef] [PubMed]
  43. Ward, J.H. Hierarchical Grouping to Optimize an Objective Function. J. Am. Stat. Assoc. 1963, 58, 236–244. [Google Scholar] [CrossRef]
  44. Lloyd, S. Least squares quantization in PCM. IEEE Trans. Inf. Theory 1982, 28, 129–137. [Google Scholar] [CrossRef]
  45. Field, A. Discovering Statistics Using IBM SPSS Statistics, 5th ed.; Sage Publications Ltd.: New York, NY, USA, 2018. [Google Scholar]
  46. Davis, F.D. Perceived Usefulness, Perceived Ease of Use, and User Acceptance of Information Technology. MIS Q. 1989, 13, 319–340. [Google Scholar] [CrossRef] [Green Version]
  47. Goudzwaard, M.; Smakman, M.; Konijn, E.A. Robots are Good for Profit: A Business Perspective on Robots in Education. In Proceedings of the 2019 Joint IEEE 9th International Conference on Development and Learning and Epigenetic Robotics (ICDL-EpiRob), Oslo, Norway, 19–22 August 2019; pp. 54–60. [Google Scholar] [CrossRef] [Green Version]
  48. Van Ewijk, G.; Smakman, M.; Konijn, E.A. Teachers’ perspectives on social robots in education. In Proceedings of the Interaction Design and Children Conference, London, UK, 17–24 June 2020; pp. 273–280. [Google Scholar] [CrossRef]
  49. Hsu, S. Developing and validating a scale for measuring changes in teachers’ ICT integration proficiency over time. Comput. Educ. 2017, 111, 18–30. [Google Scholar] [CrossRef]
  50. Scaradozzi, D.; Screpanti, L.; Cesaretti, L.; Storti, M.; Mazzieri, E. Implementation and Assessment Methodologies of Teachers’ Training Courses for STEM Activities. Technol. Knowl. Learn. 2019, 24, 247–268. [Google Scholar] [CrossRef] [Green Version]
  51. Aldunate, R.; Nussbaum, M. Teacher adoption of technology. Comput. Hum. Behav. 2013, 29, 519–524. [Google Scholar] [CrossRef]
  52. Smakman, M.; Berket, J.; Konijn, E.A. The Impact of Social Robots in Education: Moral Considerations of Dutch Educational Policymakers. In Proceedings of the 2020 29th IEEE International Symposium on Robot and Human Interactive Communication (RO-MAN), Napels, Italy, 31 August–4 September 2020. [Google Scholar]
  53. Smakman, M.; Jansen, B.; Leunen, J.; Konijn, E.A. Acceptable Social Robots in Education: A Value Sensitive Parent Perspective. In Proceedings of the INTED2020 Conference 2020, Valencia, Spain, 2–4 March 2020; pp. 7946–7953. [Google Scholar] [CrossRef] [Green Version]
Figure 1. Study methodology per research question (RQ).
Robotics 10 00024 g001
Figure 2. Stakeholder means for all six scales; based on 1–6 point scales (ranging from 1= totally not agree to 6 = totally agree).
Robotics 10 00024 g002
Table 1. Overview of the socio-demographic characteristics of the participants (n = 515).
Socio-Demographic Characteristics%
Age18–26 years 19%
26–35 years20%
36–45 years23%
46–55 years19%
>55 years18%
Experience with robotsNo77%
Yes23%
GenderMale42%
Female58%
Gross Income Low (<€2.816 p/m)21%
Middle (€2.816–€5.632 p/m)51%
High (>€5.632 p/m)15%
No answer12%
Highest finished education level Secondary school11%
Vocational education (MBO)11%
University of Applied Sciences (HBO)45%
University of Science (WO)33%
Stakeholder groupParents with primary school children18%
Primary school teachers 12%
Primary school directors/management12%
Government educational policymakers/advisors17%
Employees of the robotics industry10%
Students of education 17%
Other12%
Table 2. Relevant moral values for social robots in education derived from previous research (see text).
Values/Constructs Explanation/Example Issue
AccountabilityThis value/construct is related to the effect robots have on who is accountable for the actions of robots and their effects. Someone accountable is obliged to accept the consequences of something.
ApplicabilityThis value/construct is related to how useful and versatile a robot is in education.
AttachmentThis value/construct is related to the possibility that the child will get attached to the robot, and whether this is permitted/ desirable.
AutonomyThis value/construct is related to the effect that the robot has on a teacher’s autonomy. Autonomy refers to the freedom of a teacher to make independent decisions.
Deception/SincerityThis value/construct is related to the robot’s ability to make children believe something that is not true, such as pretend that the robot cares about a child or keeping information from children.
FlexibilityThis value/construct is related to how easy it is to move and transport the robot.
Freedom from biasThis value/construct is related to the possible bias of the robot, such as gender or racial biases.
FriendshipThis value/construct is related to the friendship that can develop between a child and a robot, and whether this is permitted/ desirable.
HappinessThis value/construct is related to the extent to which a robot provides pleasure/fun.
Human contactThis value/construct is related to the effects of a robot on human contact.
PrivacyThis value/construct is related to the effect of the robot’s ability to collect personal data on children, and if this data may be shared with others.
Psychological welfareThis value/construct is related to the influence of the robot on psychological/social aspects, such as a robot may act as a person of trust, or may comfort a child.
ResponsibilityThis value/construct is related to the effect on teachers’ responsibility for the robot. Someone responsible is obliged to take care of something.
SafetyThis value/construct is related to the physical safety of children when interacting with robots.
SecurityThis value/construct is related to the IT security of the data that the robot collects.
TrustThis value/construct is related to the trust that a child has in a robot, and whether this can be violated.
UsabilityThis value/construct is related to the availability of the robot. Availability indicates the extent to which a robot is accessible to users.
Table 3. Summary of the six scales.
ScaleLabelDescriptionItems
1Social interaction and bondingSocial robots may socially interact and form social bonds with children, such as friendship bonds. They may be used to aid the psychological wellbeing of children, and for learning social skills.16
2Usefulness, availability and funSocial robots are useful and fun for children and parents and improve the job satisfaction of teachers. They should be made widely available for schools. 11
3Stable accountability and IT securitySocial robots do not jeopardize the accountability structure in schools and can be used without an IT security certificate. 6
4Sincerity and flexibilityA robot must be honest to children and keep promises made to children. Additionally, the robots need to be flexible (movable). 5
5Trust, data also to parents without a teacher as the gatekeeperA robot must keep secrets told to by a child, and not share them with the parents of teachers. Teachers are not gatekeepers of data, parents should have access to data. It is safe to let children interact with robots without supervision. 6
6Data share with third partiesData collected by the robot may be shared with third parties, such as government and robot companies to improve policies and products. 2
Table 4. The effects per scale including the significance level.
Dependent VariableType III Sum of SquaresdfMean SquareFp
Social interaction and bonding18.67063.1124.417<0.001
Usefulness, availability and fun11.63261.9393.4820.002
Stable accountability and IT safety8.65361.4422.1800.044
Sincerity and flexibility5.84560.9741.6410.134
Trust, data also to parents
without teacher as gatekeeper
36.95666.1599.806<0.001
Data sharing with third parties37.81166.3024.0320.001
Table 5. Final cluster centres per scales, including cluster size.
Clusters
ScalesMean
Cl 1
Enthusiast
(n = 135)
Mean
Cl 2
Practical
(n = 87)
Mean
Cl 3
Troubled
(n = 143)
Mean
Cl 4
Sceptic
(n = 33)
Mean
Cl 5
Mindfully Positive
(n = 117)
Overall Mean
(N = 515)
1 Social interaction and bonding 3.70
(SD 0.66)
2.60
(SD 0.67)
2.71
(SD 0.54)
1.73
(SD 0.52)
3.69
(SD 0.56)
3.11
(SD 0.86)
2 Usefulness, availability and fun4.37
(SD 0.52)
3.86
(SD 0.54)
3.69
(SD 0.56)
2.31
(SD 0.70)
4.31
(SD 0.54)
3.95
(SD 0.76)
3 Stable accountability and IT safety2.97
(SD 0.72)
2.85
(SD 0.67)
2.26
(SD 0.54)
2.39
(SD 1.54)
3.02
(SD 0.73)
2.73
(SD 0.82)
4 Sincerity and flexibility 4.89
(SD 0.55
4.43
(SD 0.69)
5.07
(SD 0.44)
3.43
(SD 1.42)
4.82
(SD 0.65)
4.75
(SD 0.77)
5 Trust, data also to parents without teacher as gatekeeper4.33
(SD 0.67)
3.43
(SD 0.65)
4.34
(SD 0.78)
5.11
(SD 0.89)
4.60
(SD 0.65)
4.29
(SD 0.83)
6 Data sharing with third parties3.93
(SD 0.70)
3.13
(SD 0.74)
1.41
(SD 0.55)
1.11
(SD 0.30)
1.57
(SD 0.57)
2.38
(SD 1.27)
Table 6. Distribution of socio-demographic characteristics per cluster.
Socio-Demographic CharacteristicsCluster (CL)
Cl 1
Enthusiast
Cl 2
Practical
Cl 3
Troubled
Cl 4
Sceptic
Cl 5
Mindfully Positive
Stakeholder groupParents with primary school children22%20%11%18%20%
Primary school teachers 7%28%14%9%7%
School directors/management10%3%18%15%14%
Government policymakers/advisors
Employees of robotics industry
Students of education
Other
15%14%17%30%20%
20%
14%
12%
6%
18%
11%
5%
24%
10%
6%
18%
3%
12%
12%
16%
Experience with robotsNo
Yes
67%
33%
92%
8%
82%
18%
88%
13%
69%
31%
GenderMale45%36%34%48%51%
Female55%63%66%52%49%
IncomeLow (<€2.816 p/m)20%31%24%35%22%
Middle (€2.816–€5.632 p/m)59%55%66%57%52%
High (>€5.632 gross p/m)18%14%10%9%26%
Highest finished education level Secondary school9%17%12%13%9%
Vocational education (MBO)11%18%8%13%9%
University of Applied Sciences (HBO)47%43%47%53%39%
University of Science (WO)32%23%32%22%44%
Note. Bold print indicates the highest value across the five clusters, the lowest are italicized.
Table 7. Effect of socio-demographic characteristics on the probability of belonging to a specific cluster.
Socio-Demographic Characteristics Odds Ratio (OR)
Cl 1
Enthusiast
Cl 2
Practical
Cl 3
Troubled
Cl 4
Sceptic
Cl 5
Mindfully Positive
Stakeholder: Parents with children in primary school1.0231.4780.4564.5621.228
Stakeholder: Primary school teacher0.305 **6.525 ***1.0761.4160.497
Stakeholder: Primary school
director/management
0.5810.4231.8653.0921.210
Stakeholder: Government
policymakers
0.7141.1161.1517.627 *0.878
Stakeholder: Robot industry1.8500.9370.4824.5230.634
Stakeholder: Student of education0.8461.1822.720 **3.0130.322 **
Age: 18–250.9281.5600.5350.079 **3.353 *
Age: 26–35 years0.9801.6270.8990.107 **1.467
Age: 36–45 years0.9881.3310.9630.5021.001
Age: 46–55 years1.6391.0700.7480.5700.810
Experience with robots: Yes1.742 **0.241 ***1.0400.6821.253
Gender: Male0.7701.0761.0261.4311.155
Highest finished education: Secondary school0.9533.667 **0.8782.5520.433
Highest finished education: Vocational education (MBO)1.1662.792 **1.0241.9470.343 **
Highest finished education: University of Applied Sciences (HBO)1.1031.3931.0572.877 *0.569 **
Income: low0.8530.5381.62727.864 ***0.512
Income: medium0.9590.5282.624 **4.174 *0.475 **
Notes. (*** = Sig. < 0.01; ** Sig. < 0.05; * Sig. < 0.10). Ref. categories: Stakeholder group: Other, Age: >55; Experience with robots: No; Gender: Female; Highest finished education: University of Science (WO); Income: high.
Publisher’s Note: MDPI stays neutral with regard to jurisdictional claims in published maps and institutional affiliations.

