1. Introduction
Adverse events leading to potentially preventable harm to patients prolong hospital stays and increase healthcare costs [
1,
2]. Many of the adverse events in the hospital setting are associated with surgery [
1]. Many factors can create safety concerns during minimally invasive surgery. One of the primary sources of human errors in minimally invasive surgery is associated with the accidental movements of surgical tools. In robotic surgery, the surgeon operates in a master–slave mode and controls the robot’s arms using hand controllers [
1,
3]. Unlike open surgery, robotic and laparoscopic surgery lack full haptic feedback and depth information. This indirect and haptically disconnected form of surgery (via small surgical ports) can lead to unintended or dangerous and abrupt movements of instruments. In addition, sometimes it is difficult to accurately adjust the level of force acting on the steering arms. This lack of control can lead to sudden movements of the surgical instruments. Risky movement of surgical instruments near to critical tissues can result in unexpected bleeding and tissue damage during surgery. This has motivated us to create a warning system to alert surgeons about risky movements for both robotic and laparoscopic surgery. We view this as an important step towards a visually intelligent surgical assistant that will mitigate the risks associated with surgery.
Spontaneous bleeding and tissue damage can be prevented by linking the risky movement of surgical instruments as part of a routine procedure (excluding suturing, which requires rapid movement of tools) with the potential for unexpected bleeding and tissue damage. This information can help surgeons to reduce risky movements of the surgical tools. Currently, there are no systems that can provide the surgeon with real-time information about how he or she is using surgical instruments.
Current surgical practice and the commercial market are focused on managing complications caused by human factors and improper use of instruments (such as tissue damage or alteration) after they occur. With this approach, potentially life-threatening situations cannot be proactively avoided and can lead to higher costs for the health care system. Instead, our proposed system uses images and algorithms to prevent unsafe movements before damage occurs. Although simple motion tremor filtering is available on clinical robotic systems, as far as we know, there are currently no methods that can help the surgeon to avoid and mitigate risky movements (e.g., that may lead to bleeding) of surgical instruments.
Evaluating the skill of the surgeon has the potential to be used in real-time. There is an increased interest in creating quantitative methods for the evaluation of surgical skills. Recently, new prospects for objective and automated evaluation systems have emerged with technical advancements such as robotic-assisted minimally invasive surgery (RMIS) [
2]. With the advent of new technologies such as robotic surgical systems and medical simulators, researchers have developed tools for analyzing surgical movements to differentiate surgeons’ level of technical skill [
4]. Most approaches to tracking surgical movements fall into one of three methods: (1) structured classification of people, (2) descriptive statistics, or (3) statistical language modeling of surgical movement [
4]. In general, the techniques currently used to control the movement of surgical instruments include measuring the surgeon’s kinematics and hand strength [
5,
6] and virtual and physical simulators [
7,
8]. Our approach uses available videos of undesirable events (bleeding in our case) to determine and predict the tool movements that may have caused this event.
Skills analysis creates descriptive statistics using recorded system movements or forces acting on the operating environment. Standard metrics include instrument kinematics [
9,
10], the economy of motion, maximum forces and torques [
6,
11], tissue damage, repetition of movement, and path following [
9,
12,
13,
14,
15]. Most systems also use time metrics such as completion time or time spent in various surgical workspaces [
16,
17,
18].
Researchers are also building competency analysis models that apply hidden Markov models (HMM) to simulate routes and predict skill levels [
19]. In this paper, the instrument tip movement was monitored with a Polaris six-DOF infrared tracker while performing a minimally invasive surgery view rotation task. In their work, Nagy and her colleagues tried to recognize gestures using optical character recognition and HMM in a technique called demo programming [
20]. By analyzing specialists who perform a task several times, the system calculates the optimal path from these demonstrations. The University of Washington performed hierarchical problem decomposition [
16]. Another approach to automatic motion detection is the HMM-support vector machine hybrid model for segmenting the control task into a wedge inside and outside the network [
21]. A hybrid classifier was used to segment the capture task using force and torque data in four states.
The Imperial College Surgical Assessment Device uses an A.C. electromagnetic system with passive receivers connected to the back of the arm at the middle axis of the third metacarpal bone [
22]. When the hand moves, a current is generated in the trackers. This current is used to determine the position of the hand/translator. Forester et al. employed continuous kinematic data decomposition into a series of superimposed gestures represented by strings (a bag of words). They measured comparative numerical statistics, allowing them to detect discriminatory gestures by their relative frequency of occurrence [
23]. Based on the SAX-VSM algorithm, the proposed approach treats the surgical movement as a continuous multidimensional time series. It begins with sampling the data into a sequence of letters (i.e., strings) using the symbolic aggregate (SAX) approach. In turn, SAX sequences are split into several consecutive letters through a sliding window. The relative frequencies of these subsequences, i.e., the number of cases in a particular sequence or set of sequences, are then used to identify discriminatory patterns that characterize a specific surgical movement.
Several promising new areas of research have emerged for tool tracking, including tracking methods for devices with visible, color-coded markers based on crosshairs [
24] and patterns of appearance [
25]. Speidel et al. proposed a computer vision approach for instrument screening in minimally invasive surgery based on endoscopic sequences [
26]. In the proposed method, the instruments were not modified, and the validation was performed on the sequences obtained during the actual intervention. The paths generated by the tools provide information that can then be used to interpret surgical gestures.
A recent review paper [
26] compared computer vision approaches for tool segmentation. Most of these techniques are based on utilizing the video frame’s textural features to identify the surgical tools within the surgical scene. Different approaches were compared in that paper for performing texture analysis, including the transform methods, model-based methods, statistical techniques, and structural methods. In the common types of transform methods, the image’s texture properties are extracted based on the Fourier [
27], Gabor [
28], or Wavelet transforms [
29]. In model-based approaches, sophisticated mathematical models (such as fractal or stochastic models) represent the texture in an image [
26]. The statistical methods are based on representations of texture employing properties driving the distribution and dependency of grey-level values in the image [
30].
In [
31,
32], the authors reviewed several different bleeding detection approaches, including color techniques, texture techniques, pixel-level analysis, contour extraction, edge detection, and segmentation. The complexity of these algorithms makes them usable only for static non-real-time analysis. These techniques were only applied to capsule endoscopy. Most of these techniques are computationally very expensive and cannot be employed simultaneously for both tool and bleed detection. Our entropy-based segmentation technique [
32] builds on the structural methods where mathematical morphology is utilized as the core tool for analysis [
30]. This method is computationally efficient and can simultaneously be used for both tool detection and bleeding detection/prediction. The detection algorithm is also not dependent on the color or distinct markers on the tool for segmenting and tracking the tool. This method makes it more resilient to lighting conditions.
There are different morphological methods proposed to extract texture features from an image. For simple segmentation of an image into textured and non-textured regions, Dinstein et al. suggested using the difference between maximum and minimum intensities in a pixel neighborhood [
33]. Karu et al. also suggested a similar concept of counting the number of local extremes (texture primitives) to identify texture regions [
34]. Since this method does not consider the contrast of texture primitives, it can be susceptible to noise. Other approaches use standard deviation to characterize the smoothness of textures [
35]. A local binary patterns approach was developed as a texture extraction technique by Ojala et al. They proposed adding a descriptor based on variation for texture classification purposes [
36]. In [
37], they proposed an amplitude modulation function that can capture texture contrast locally. Although each of the above techniques can be used to discern between textured and non-texture areas, individual characteristics cannot be differentiated from the texture information.
Several feature extractors were suggested to allow texture characteristics to be differentiated. Verbeek et al. proposed a method that uses the difference between the closing and opening of textured regions to differentiate individual step and ramp edges from texture edges [
38]. A common drawback of these types of techniques is that they extend or blur the boundaries of texture regions, thereby preventing accurate localization of the edges of the texture. Zingman et al. introduced a morphological texture contrast descriptor that does not suffer from the above disadvantages [
39].
Our paper proposes a new approach to detecting a surgical instrument’s sharp movement during surgery based on local entropy. Here, the ultimate goal is to detect the abrupt movement in surgical tools. This is performed through deriving the kinematic information of the instrument by analyzing the video data of the surgery. Our algorithm tracks surgical instruments by detecting a homogeneous area formed by surgical instruments, calculates the dynamics of these areas as a classification parameter for detecting sudden movements of surgical instruments, and uses it as a prediction parameter to predict bleeding due to the adverse movement of surgical instruments. Measuring the homogeneity of different areas of a video frame is the core function of our algorithm and is based on entropy. The entropy filter is a morphological technique used to create and render the texture distribution of images. Morphological methods modify each pixel in the image based on the value of other pixels in its neighborhood. Morphological methods rely only on the relative ordering of pixel values, not on their numerical values. As a result, the morphological methodology is more robust to noise than traditional differential methods [
40]. Detection accuracy is also improved by using the information in different frames. Here, we present the design of the algorithm as well as the method used to evaluate its accuracy.
2. Materials and Methods
In this paper, we developed an entropy-based real-time texture segmentation algorithm for monitoring and extracting the uniform texture of a surgical scene in order to analyze the surgical tools’ movement and potentially warn the surgeons about abrupt movements that may lead to unintentional bleeding during the surgery. The algorithm measures the local entropy of the video image [
32]. Local entropy is used as a quantitative parameter to determine the uniformity of the sub-section of an image and measures uniformity near each pixel. It is calculated using Shannon’s entropy [
41]. Any video captured from a video camera (controlled by a robot or a human) can be used with this prediction algorithm. In general, the surgical instrument’s texture tends to be uniform and forms a more uniform visual area in the surgical scene than the surrounding tissue. This distinctive factor is used in this article to segment the surgical scene according to the homogeneity of different regions. It tracks the change in entropy over time to detect sudden movements of surgical instruments and their location in the 2D surgical video. The inputs for this algorithm are video frames from the surgical scene. The output is the video frame number in which there is a sudden movement of the surgical instrument within a video segment that may lead to future bleeding. The algorithm tracks the scene of the operation, detects sudden movement of surgical instruments, and finds and flags instruments exhibiting sudden movements that could lead to bleeding based on past observation of these types of events.
2.1. Entropy-Based Algorithm
The algorithm consists of the following six steps:
Step 1: First, a new frame is read from the surgical video source and converted from RGB to grayscale to remove the hue and saturation components while preserving the light element.
Step 2: A two-dimensional K × K moving window is applied to the grayscale image. The entropy of the local image in the window is calculated to generate an entropy map of this frame in grayscale.
Step 3: The grayscale entropy map is binarized by giving a zero value (black) to heterogeneous areas.
Step 4: The original RGB video frame is segmented by masking it with a binary image to highlight uniform color areas.
Step 5: Then, this masked RGB image is binarized by employing Otsu thresholding [
42].
Step 6: After differentiating between heterogenous and homogenous regions through thresholding, the relative changes in the number of white pixels among certain numbers of consecutive binarized masked RGB images are computed.
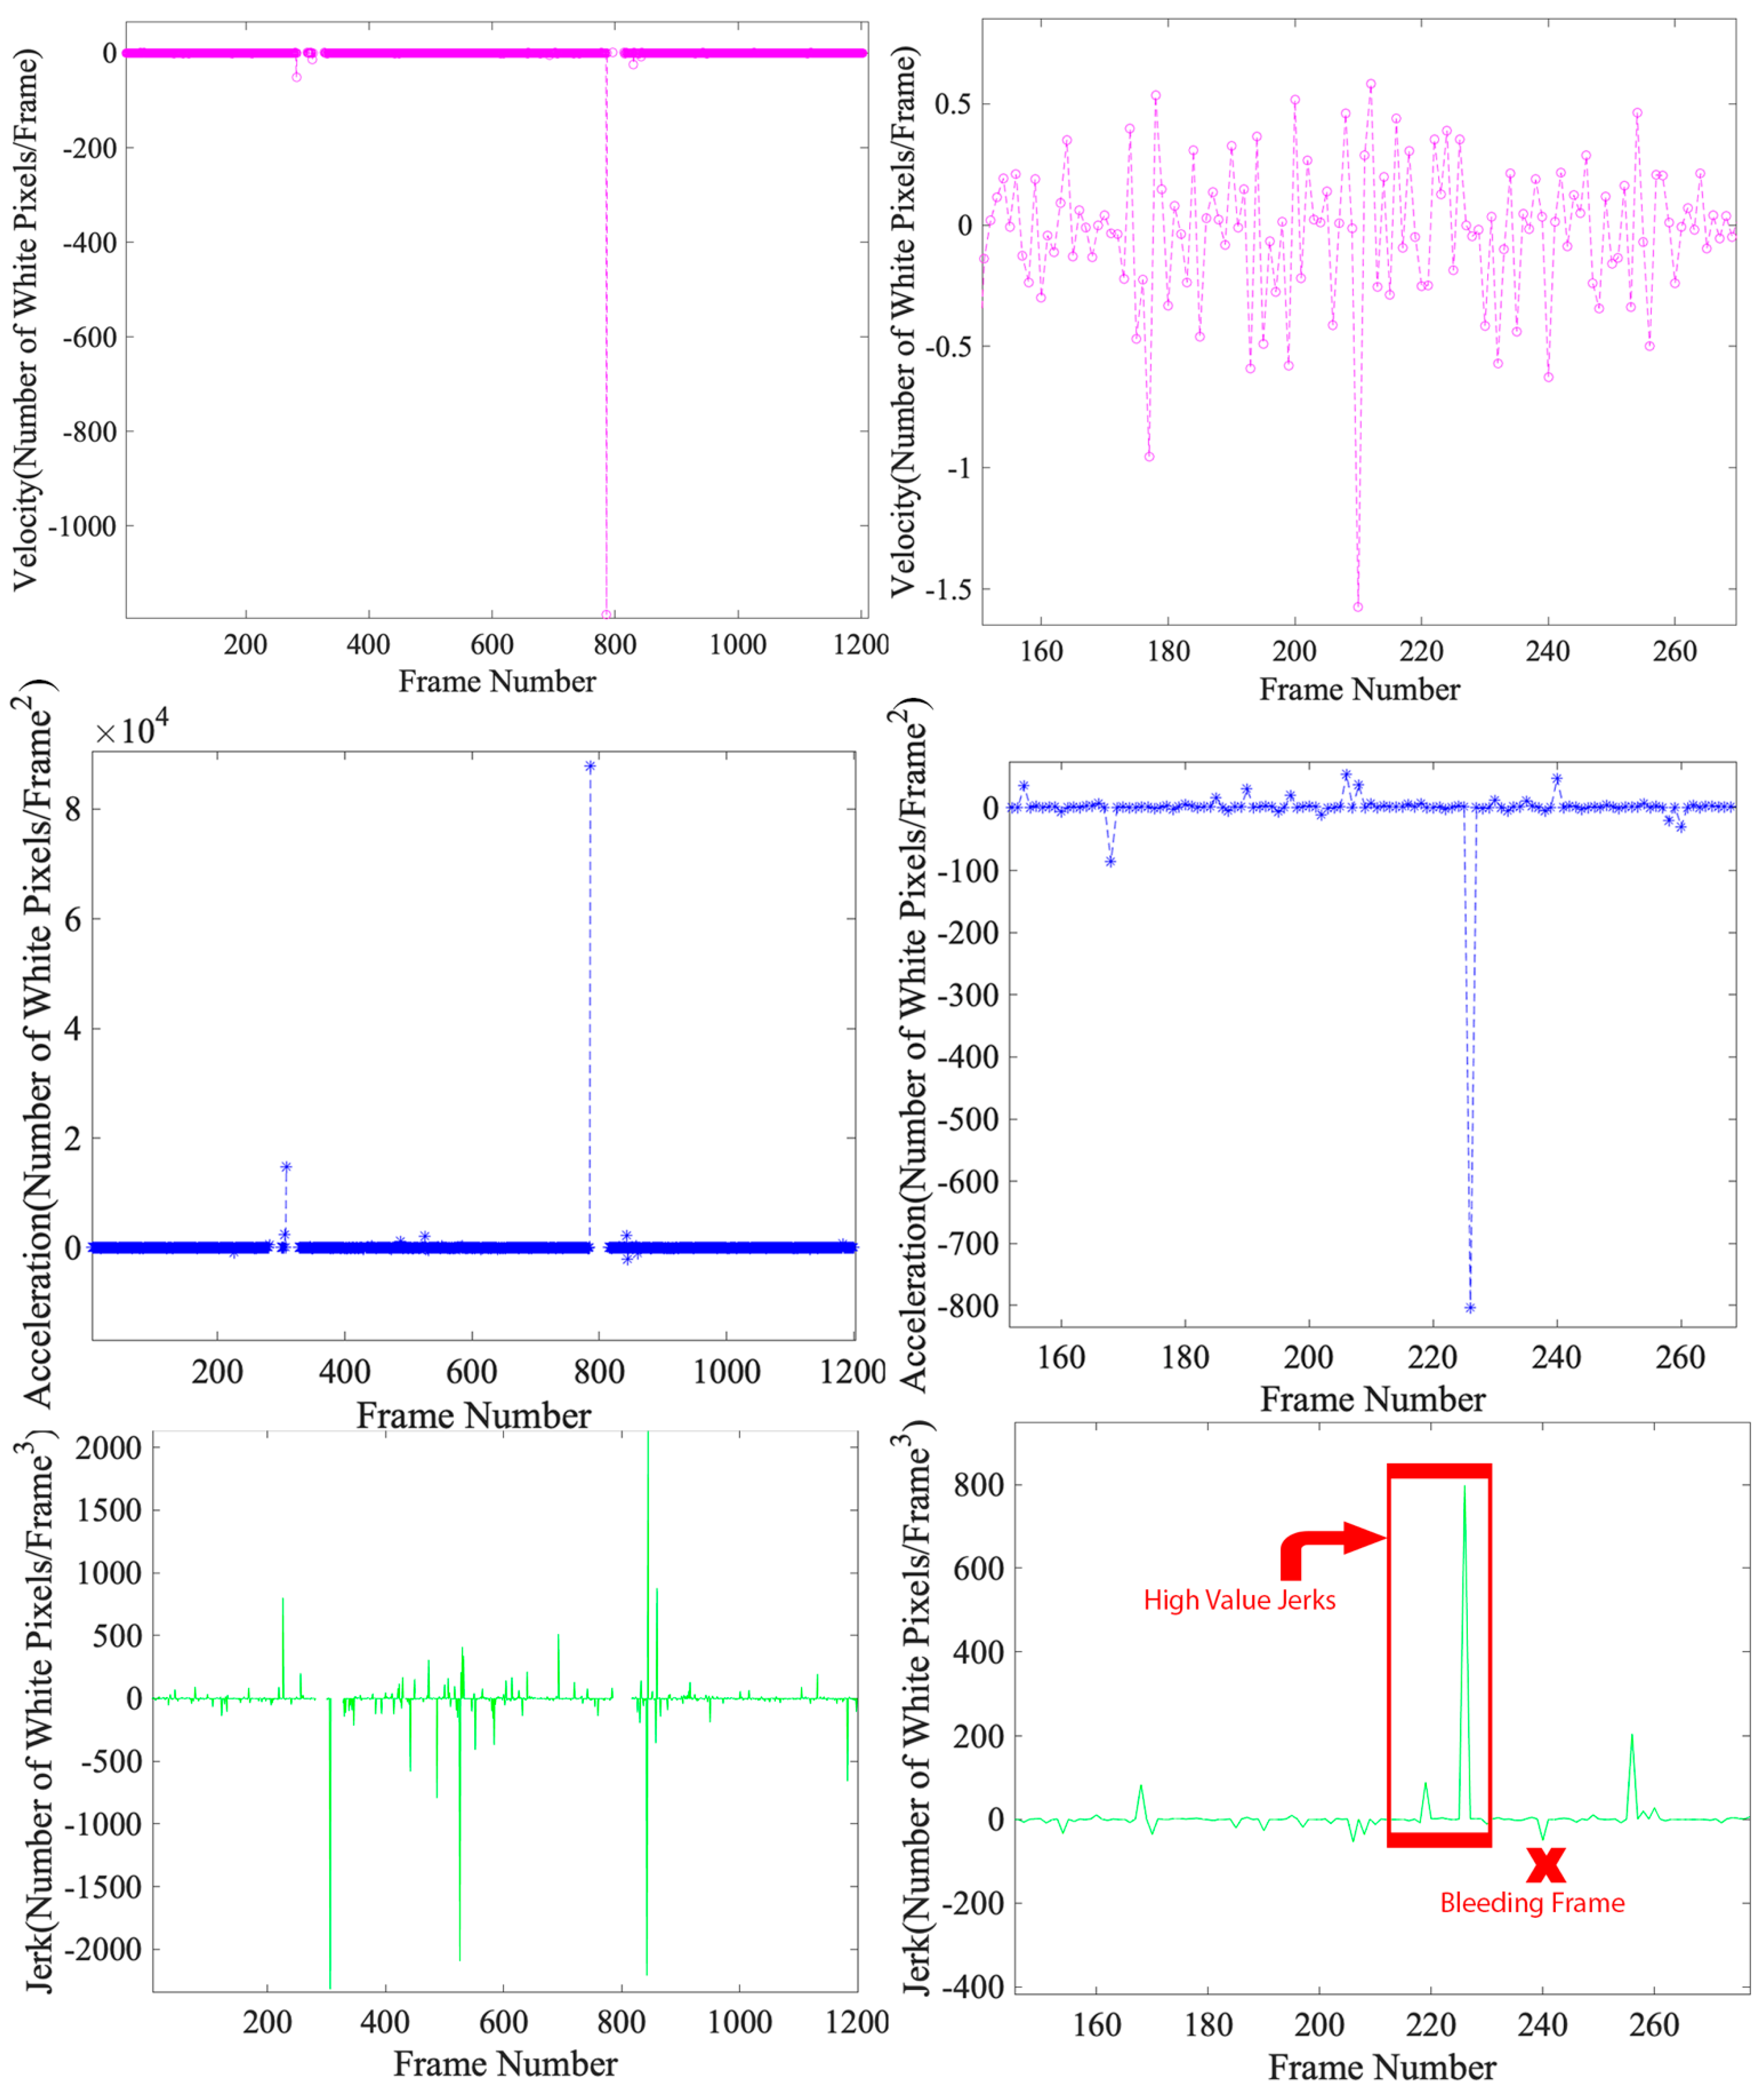
The total number of white pixels in the current frame is determined and compared to the previous frame. This information is used to locate surgical instruments and derive kinematic characteristics (such as speed, acceleration, and jerk) of non-red homogeneous areas. Here, speed means a change in the number of non-red pixels in two successive frames. Acceleration is defined as a change in speed, and the jerk is defined as a change in acceleration. The increase in the number of white pixels in this binarized image correlates with lower entropy areas belonging to surgical tools. After tracking the surgical instruments using local entropy, the jerk of non-red areas is used to detect the abrupt movement of the surgical instruments, which can cause bleeding. If this jitter change exceeds a specified threshold, the frame is marked as “abrupt”.
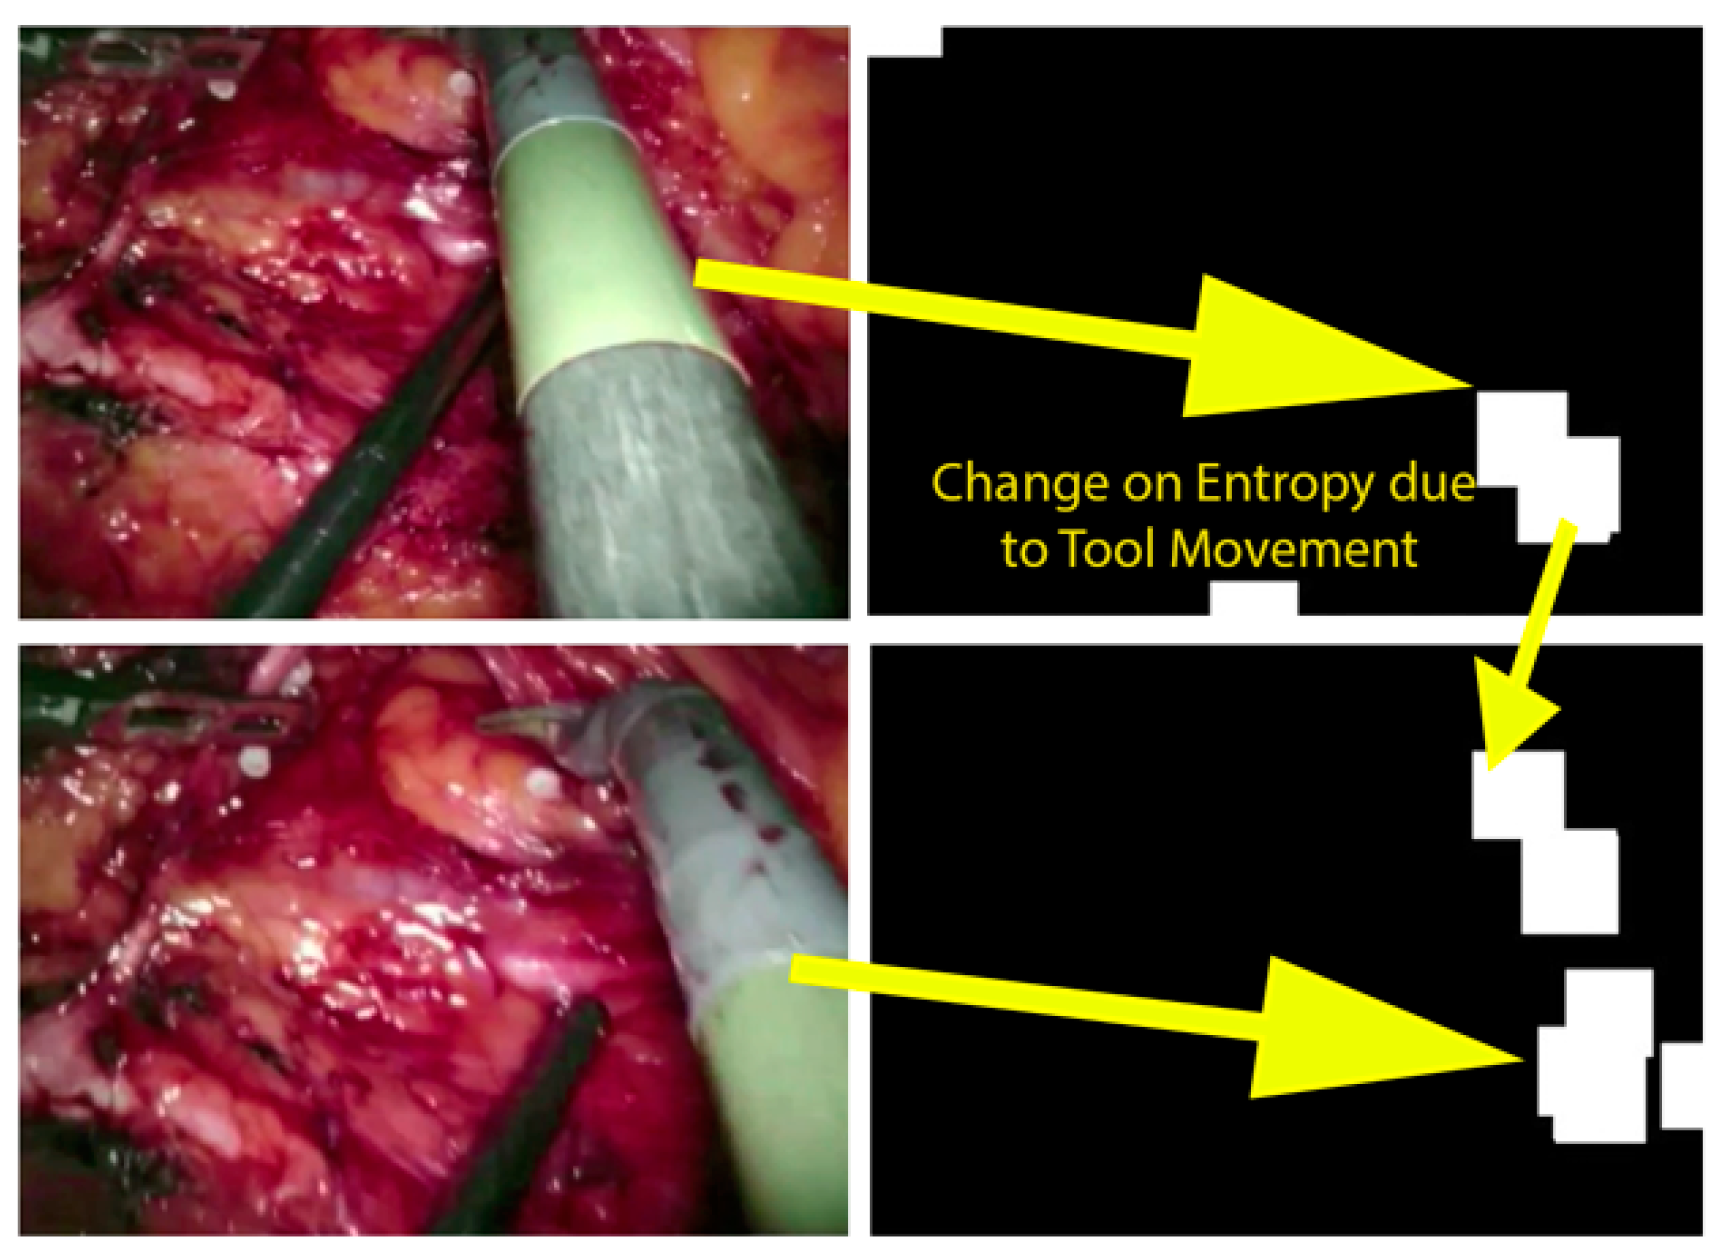
Figure 1 shows a masked RGB image generated by our surgical scene software in recorded video and the entropy change resulting from surgical motion in two consecutive frames. As you can see, the amount of non-red inside the surgical frame increased due to the change in the position of the surgical instrument. The right-hand side images show the areas where the surgical instrument is present. It should be mentioned that during surgery, various types of bleeding can be encountered which may be different from the type of bleeding that is demonstrated in
Figure 1. The basis of the prediction algorithm relies on the segmentation of the bloody regions and tools in each frame based on setting a range of red and non-red pixels. Different bleeding detection algorithms were covered in our previous paper [
32].
The entropy map consists of three types of areas: homogeneous areas formed by surgical instruments, blood spots (during bleeding), and heterogeneous (non-uniform) areas due to the textured nature of human internal tissues. The entropy filter assigns the highest grayscale value—255 (white)—to these heterogeneous areas (belonging to tissues), and assigns the lowest grayscale values to the homogeneous regions. The RGB masked frame includes three groups of pixels: black pixels, which are textured tissue; red pixels, which represent areas of blood; and non-red pixels that belong to homogeneous regions formed by the presence of surgical instruments. This lower entropy is delineated and placed in the video frame that precedes the first dynamic frame for rendering [
32].
In our algorithm, we use local entropy to quantify and represent the uniformity of small areas within each frame. More specifically, for a square region of K pixels by K pixels,
its local entropy,
is defined by [
43]:
where p
ij is the standard number of pixel intensities [i,j] in the local
K ×
K histogram of this frame. The entropy map is presented as a grayscale image with higher intensity for less uniform areas (with more information) and lower intensity for more uniform areas (with less encoded information).
Local entropy can be used to estimate the degree of greyness in a histogram. This local entropy is associated with the variation shown in the K × K window and represents one of the textural features of the tissue. The local entropy map calculation leads to an entropy map for each video frame. The entropy map of the generated image is a greyscale on which different areas of the video frame are displayed, with different degrees of homogeneity. In the context of screening for surgical instruments, regions where surgical instruments are available will experience lower values of local entropy. This is because the area covered by the tool is more uniform due to its uniform texture.
2.2. Deriving the Dynamics of Surgical Tools
In general, it can be observed that the regions of the surgical scene that include tissues have a higher degree of variety. They are less uniform than the bloody areas and surgical instruments areas. This is due to the textured nature of tissues. The other type of site with less uniformity is the boundaries between organs and/or kinds of tissues. The local entropy of pixels of these regions is higher. These non-uniform areas can be masked out utilizing Otsu thresholding [
42]. In the case of more uniform organs such as the liver and heart, although they have lower entropy, they can be distinguished from uniform areas formed by surgical tools based on their color. The uniform areas that belong to the tools can be extracted through this distinction.
This idea was used to monitor surgical instruments and analyze their dynamics during surgery as follows. First, we calculated the local entropy of each frame, which is the grayscale image. Then we masked the original video frame with a binary entropy map that extracts uniform areas from the original RGB frame and darkens them; heterogeneous regions belong to the patient’s tissues. This is called a masked RGB frame. Areas with non-red pixels inside an RGB masked frame were used to localize the tool. The temporal variation of the number of non-red pixels in this masked RGB frame was used to characterize the kinematics of these uniform non-red areas, and especially to compute their dynamics. The speed of a non-red homogeneous region,
, which is the change in the area of non-red pixels and the movement of centroid of the largest uniform region in two consecutive frames over time, is formulated as follows:
where
is the acceleration of uniform region
,
is the jerk of uniform region
, and
is the local entropy of the region
in frame n.
To analyze the movements of surgical tools in real time, our algorithm monitors the change in the entropy map distribution. It watches the local entropy maps of the previous stage for each frame over a certain period. Regions with a high degree of homogeneity were found on the local entropy map. For quantitative purposes, we binarized the entropy map by employing Otsu thresholding [
42]. Then we computed the change in the number of non-zero (non-black) pixels to measure the change in uniform areas.
An important aspect of this stage of the algorithm is determining the threshold and evaluating the level of change in uniformity of non-red areas by calculating the rate of change in non-red pixels in two consecutive frames. Comparing the gross time entropy of two successive frames can lead to high sensitivity to small changes in local uniformity. That causes large fluctuations in the relative change in the number of non-red pixels and low robustness when detecting sudden false movements of surgical instruments. For this purpose, our algorithm uses a moving average low pass filter with window size as a function of the human response time, usually 0.25 s (algorithm parameter). This method is used to smooth the relative change in several previous frames preceding the current frame. The threshold for detecting sudden movements of surgical instruments in calculating the entropy of time is proportional to the ratio between the image size and the size of the neighborhood used to generate the entropy map:
where
is the threshold of relative change in the number of red pixels, w is the width of the input image, h is the height of the image, and
is the window area used for computing the local entropy.
is a coefficient whose value is empirically determined through running the algorithm over a certain number of videos.
Based on our observation of recorded surgical videos, the sudden movement of surgical instruments precedes unexpected bleeding in many cases. The detection and localization of sudden movements of surgical instruments are based on the number of non-red pixels in the RGB masked frame using global thresholding [
44]. Once a sudden motion is detected over several frames, the system can alert the surgeon of impending dangerous movements associated with the occurrence of bleeding. The warning is based on the correlation we found between the improper movement of the surgical instruments and the formation of bleeding.
2.3. Tuning of Parameters in the Algorithm
Several parameters must be selected for the algorithm to work correctly. These are detailed below. We obtained sample values for these parameters from a dataset of five test videos, but these must be tuned for a specific application. We tested various sets of parameters and selected those that minimized the algorithm’s bleeding prediction error.
First, the appropriate window size for computing local entropy (i.e.,
K ×
K) must be selected, which is typically between 7 × 7 and 15 × 15 pixels [
45]. Due to the small size of the features in arterial bleeding, we chose a window size of 9 × 9 for this application. Second, the coefficient α in Equation (5) is an empirical coefficient that can be derived from a training dataset. For our five training video datasets, we found that a value of 0.01 for α worked well. This value meant that if the relative increase in the number of red pixels between two consecutive frames was more than one percent of the total number of pixels within the frame, our algorithm recognized it as a bleeding frame.
Third, the size of the low pass window of the moving median filter was selected. This filter can reduce the chance of false positives when bleeding is detected. We used a value of 3, which meant we compared the relative change in the number of red pixels with the average of the last three samples.
2.4. Data Collection for Algorithm Evaluation
We obtained the recorded videos for testing our algorithm from open sources on the Internet, including the U.S. National Library of Medicine [
46] (video links are available upon request). The videos showed various surgical procedures, such as midline lobectomy, right superior line lobectomy, thoracotomy, thoracoscopic lung surgery, and prostatectomy. Each video showed splash-like bleeding. The significant and inappropriate movement of surgical instruments and additional force on vascular surfaces [
30] caused bleeding. Although the reasons for the significant and insignificant movement of surgical instruments are not explained in all these videos and cannot be determined on examination, they are useful for our development of algorithms for the detection and prediction of bleeding.
Table 1 provides information on the videos.
Podsendkowski et al. categorized surgical instrument movement into two major types: non-repetitive movements and repetitive movements [
47]. Non-repetitive movements include movements associated with pulling or pushing tissue, grasping and moving tissue, and the motion of cutting with electrocautery devices. Repetitive movements include suturing movements, incision movements, and knot-tying movement. To validate our algorithm, we used 22 recorded videos of minimally invasive surgery (MIS) (5 for parameter tuning and 17 for testing). All 22 videos included some of the above-mentioned movements. We used five videos to tune the parameters of our algorithm. Three of them contain non-repetitive movements, whereas the other two contain repetitive movements.
Table 1 summarizes the properties of 17 testing video sets.
We use the video editing application Adobe After Effects 2020 (Adobe Inc., San Jose, CA, USA) to manually view the video frames. Our algorithm was implemented in MATLAB R2019b (MathWorks Inc., Natick, MA, USA). To run the algorithm, we used a 2016 MacBook Pro (Apple Inc., Cupertino, CA, USA) with a 2.8 GHz quad-core Intel Core i7 processor and 16 GHz DDR3 random access memory clocked at 1600 MHz.
In every recorded video, if a non-red pixel flashes above a certain threshold, our algorithm classifies the movement as sharp and issues a warning message. For each video frame, the movements are classified as safe or dangerous. To test the validity of this classification, we looked at the video frame-by-frame in After Effect 2020 video editing software to see if this message precedes actual bleeding. We tested this for two seconds until no other sudden change occurs in the field of view of the surgical camera. We believe that two seconds is a reasonable reaction time for the surgeon to take practical precautions to prevent bleeding. The validity of this classification was confirmed by viewing the video of the operation to determine if the movement is accompanied by bleeding after a maximum of two seconds.
2.5. Prediction Timing Evaluation
We also calculated the accuracy of the predicted bleeding time of our algorithm by measuring the advance warning time, which is the difference between the predicted bleeding time and the frame of the actual bleeding divided by the video frame rate:
4. Discussion
In this work, we show how measuring local information encoded in each video frame can be used to calculate spatial and temporal entropy, which can be used to detect sudden movements of surgical instruments and predict bleeding. We collected and analyzed 22 videos of minimally invasive surgery including various types of instrument movements. We used five videos for parameter identification and 17 videos for testing and evaluating our algorithm. Some of these movements were sudden and caused bleeding. The movement of the surgical instrument can be controlled by measuring uniform areas resulting from the presence of the surgical instrument. The detection of sudden changes within a surgical scene due to sudden movements of surgical instruments can be detected by measuring changes in encoded data in different regions of individual video frames. In addition, since our algorithm tracks and analyses the local change in the entropy of successive video frames, the algorithm is resistant to uniform noise.
Algorithmic detection of abrupt changes associated with sudden movements of surgical instruments can help the surgeons be aware of abnormal movements and prevent bleeding related to sudden movements of surgical instruments. This article points to the possible use of a personal assistant with an intelligent vision to assist the surgeon during MIS. This detection system can be used to attenuate the movement of the robot tools in the event of a risky movement, hence, potentially preventing unexpected bleeding. Therefore, the algorithm can be used to help prevent potentially dangerous bleeding complications and reduce patient harm.
Some of the limitations of our approach are listed below. First, there are no robust and open bleeding video databases available. To truly test the algorithm for clinical use, we need a lot more video frames. Since our algorithm is a computer vision-based technique, it can only detect bleeding in the camera’s field of view. In addition, lighting can affect the accuracy of our algorithm. Brightness problems can be solved using additional video frame pre-processing steps to improve image quality, such as flattening the histogram. This type of data processing increases computational costs, requiring faster processors and a possible shift to graphics processing unit (GPU)-based computations. For real-time imaging, our approach does not account for camera movement. Therefore, we assumed that the camera must remain relatively motionless during the movement of surgical tools. This can be corrected by using camera position data from visual simultaneous localization and mapping (VSLAM) techniques or a robotic kinematic feedback system [
50]. In case the procedure is done robotically, this correction can be performed by extracting kinematic data provided by the device. Sensor data that indicate forces applied by the tools may also help prediction algorithms. Potentially, the current draw from the motors of a robotic system could be used as an indication of applied torque.
In addition, our algorithm’s accuracy is influenced by the size of the neighborhood window for calculating local entropy and generating an entropy map. A window size that is too small will result in an inaccurate estimate of the local entropy due to the lack of a sample, while a window size that is too large will lose local information [
51]. Increasing the window area also affects the computational cost of our algorithm and makes it less efficient. A mathematical optimization method designed to minimize the computed error can select an appropriate neighborhood size or other algorithm parameters. In addition, an automated selection technique will help find different sets of parameters for different operation types, which may have different optimal parameters. In addition, machine learning techniques can be used to derive empirical parameters, but this needs a large amount of data and potentially clinical trials. Camera noise, movement, and surgical instruments all introduce a certain level of irregularity in each frame, leading to the false detection of arterial bleeding. In addition, to measure the change in homogeneous areas as an indicator of sudden movement of surgical instruments, monitoring the movement of the center of gravity of a homogeneous area and its simultaneous occurrence with jerk and non-red pixels can be used to increase the accuracy of the algorithm.
5. Conclusions
In this article, we developed an algorithm to detect sudden movements of surgical instruments, which is a potential cause of bleeding. Our algorithm supports the analysis and visualization of surgical instruments within the stream of recorded surgery video frames. It monitors the change in local entropy between the frames to classify the movement of surgical instruments as safe or abrupt with the possibility of bleeding. It can be used to predict bleeding from instrument movement for recorded surgical videos. In addition, we created a method for measuring the accuracy and precision of our algorithm for different sets of video signals. Accuracy is measured using a confusion matrix, as it is used as a tool to evaluate the algorithm’s performance.
The results are promising but still preliminary. There are limitations in the technique, and many more surgical videos (different procedures, types of bleeding, etc.) are required to improve the algorithm’s performance. However, with some further work, the algorithm may be beneficial in clinical applications and is the first step towards a predictive algorithm that can assist during surgery. As more surgeries are analyzed, tool-induced additional adverse events can be mitigated using this method. In addition, the algorithm does not include solutions for clinical scenarios where the abrupt change in the scene is due to an intentional cut, the release of a tissue held under pressure, or abrupt motion without tissue contact. Sharp tools can create damage without very abrupt motions. These special cases can be studied and added as the algorithm evolves. As future work, we intend to create a bleeding prediction probability-based system that considers the type of tool, the riskiness of the movement and proximity to critical tissue. This information, in conjunction with the motion scaling system of the robot, could be used to intelligently attenuate the instruments and mitigate dangerous outcomes.


