Review

A Review of Human Mobility Research Based on Big Data and Its Implication for Smart City Development

1
Department of Building and Real Estate, The Hong Kong Polytechnic University, Hung Hom, Hong Kong 999077, China
2
Research Institute for Sustainable Urban Development (RISUD), The Hong Kong Polytechnic University, Hung Hom, Hong Kong 999077, China
3
Department of Land Surveying and Geo-Informatics, The Hong Kong Polytechnic University, Hung Hom, Hong Kong 999077, China
4
Smart Cities Research Institute, The Hong Kong Polytechnic University, Hung Hom, Hong Kong 999077, China
*
Author to whom correspondence should be addressed.
ISPRS Int. J. Geo-Inf. 2021, 10(1), 13; https://0-doi-org.brum.beds.ac.uk/10.3390/ijgi10010013
Submission received: 5 November 2020 / Revised: 23 December 2020 / Accepted: 28 December 2020 / Published: 31 December 2020

Abstract

:
Along with the increase of big data and the advancement of technologies, comprehensive data-driven knowledge of urban systems is becoming more attainable, yet the connection between big-data research and its application e.g., in smart city development, is not clearly articulated. Focusing on Human Mobility, one of the most frequently investigated applications of big data analytics, a framework for linking international academic research and city-level management policy was established and applied to the case of Hong Kong. Literature regarding human mobility research using big data are reviewed. These studies contribute to (1) discovering the spatial-temporal phenomenon, (2) identifying the difference in human behaviour or spatial attributes, (3) explaining the dynamic of mobility, and (4) applying to city management. Then, the application of the research to smart city development are scrutinised based on email queries to various governmental departments in Hong Kong. The identified challenges include data isolation, data unavailability, gaming between costs and quality of data, limited knowledge derived from rich data, as well as estrangement between public and private sectors. With further improvement in the practical value of data analytics and the utilization of data sourced from multiple sectors, paths to achieve smarter cities from policymaking perspectives are highlighted.

1. Introduction

With the use of information and communication technologies infiltrating into various aspects of peoples’ daily life, big data sets concerning human mobility provide a powerful social microscope to support the discovery of complex knowledge [1]. The new sources of incessantly produced big data shed light on the understanding of human activity, from both individual and urban perspectives, helping to discover the relationships between human mobility and resource use in the social and spatial spheres of cities [2]. Big data analytics (e.g., exploratory data mining and machine-learning) are applied to intelligent decision-making, and the interplay between technology, social change and policy strategies entails enormous opportunities for smart city development [3].
The concept of the smart city is an expression of the multitude of urban living domains to which technology and policy interventions can be applied, and the domains classified as “hard” domains include office and residential buildings, energy grids, natural resources, energy and water management, waste management, environment, transport, mobility and logistics, as well as “soft” domains such as education, culture, e-government and policies that foster economic and social welfare [4]. The spatial-temporal characteristics of human mobility, as the most frequently investigated application of big data analytics [5], can be used to facilitate smart city development, in multiple disciplines such as smart traffic, smart urban planning, smart health, smart safety, smart commerce, etc. [6,7]. For example, the convergence of transportation and information technologies plays key roles in facilitating cooperative transportation, where data streams from sensed transportation, geographic information science and social media can be fused for human engagement and shared decision making [8]. The analytics of geospatial data, both in traditional forms of raster, vector, or graph and from advanced sources of sensors and mobile devices, enhances the power of location, which has been applied for fuel and time savings, revenue increase, and health care [9].
With the increase of big data and the advancement of technologies, city development could be better understood and promoted based on data-driven knowledge. On the side of data analytic, the practical value of data-driven research is to be discovered, whereas on the city development side, the transitions for smarter applications in multiple domains and disciplines are constantly emerging. How can governments and policy makers apply data-driven research to smart city development is worth further exploration. Attempting to link up these two sides of data and practice, this paper, based on the existing researches on human mobility in the era of big data, aims to explore how the research in this area has progressed and potentially how related research could be applied in smart city development.

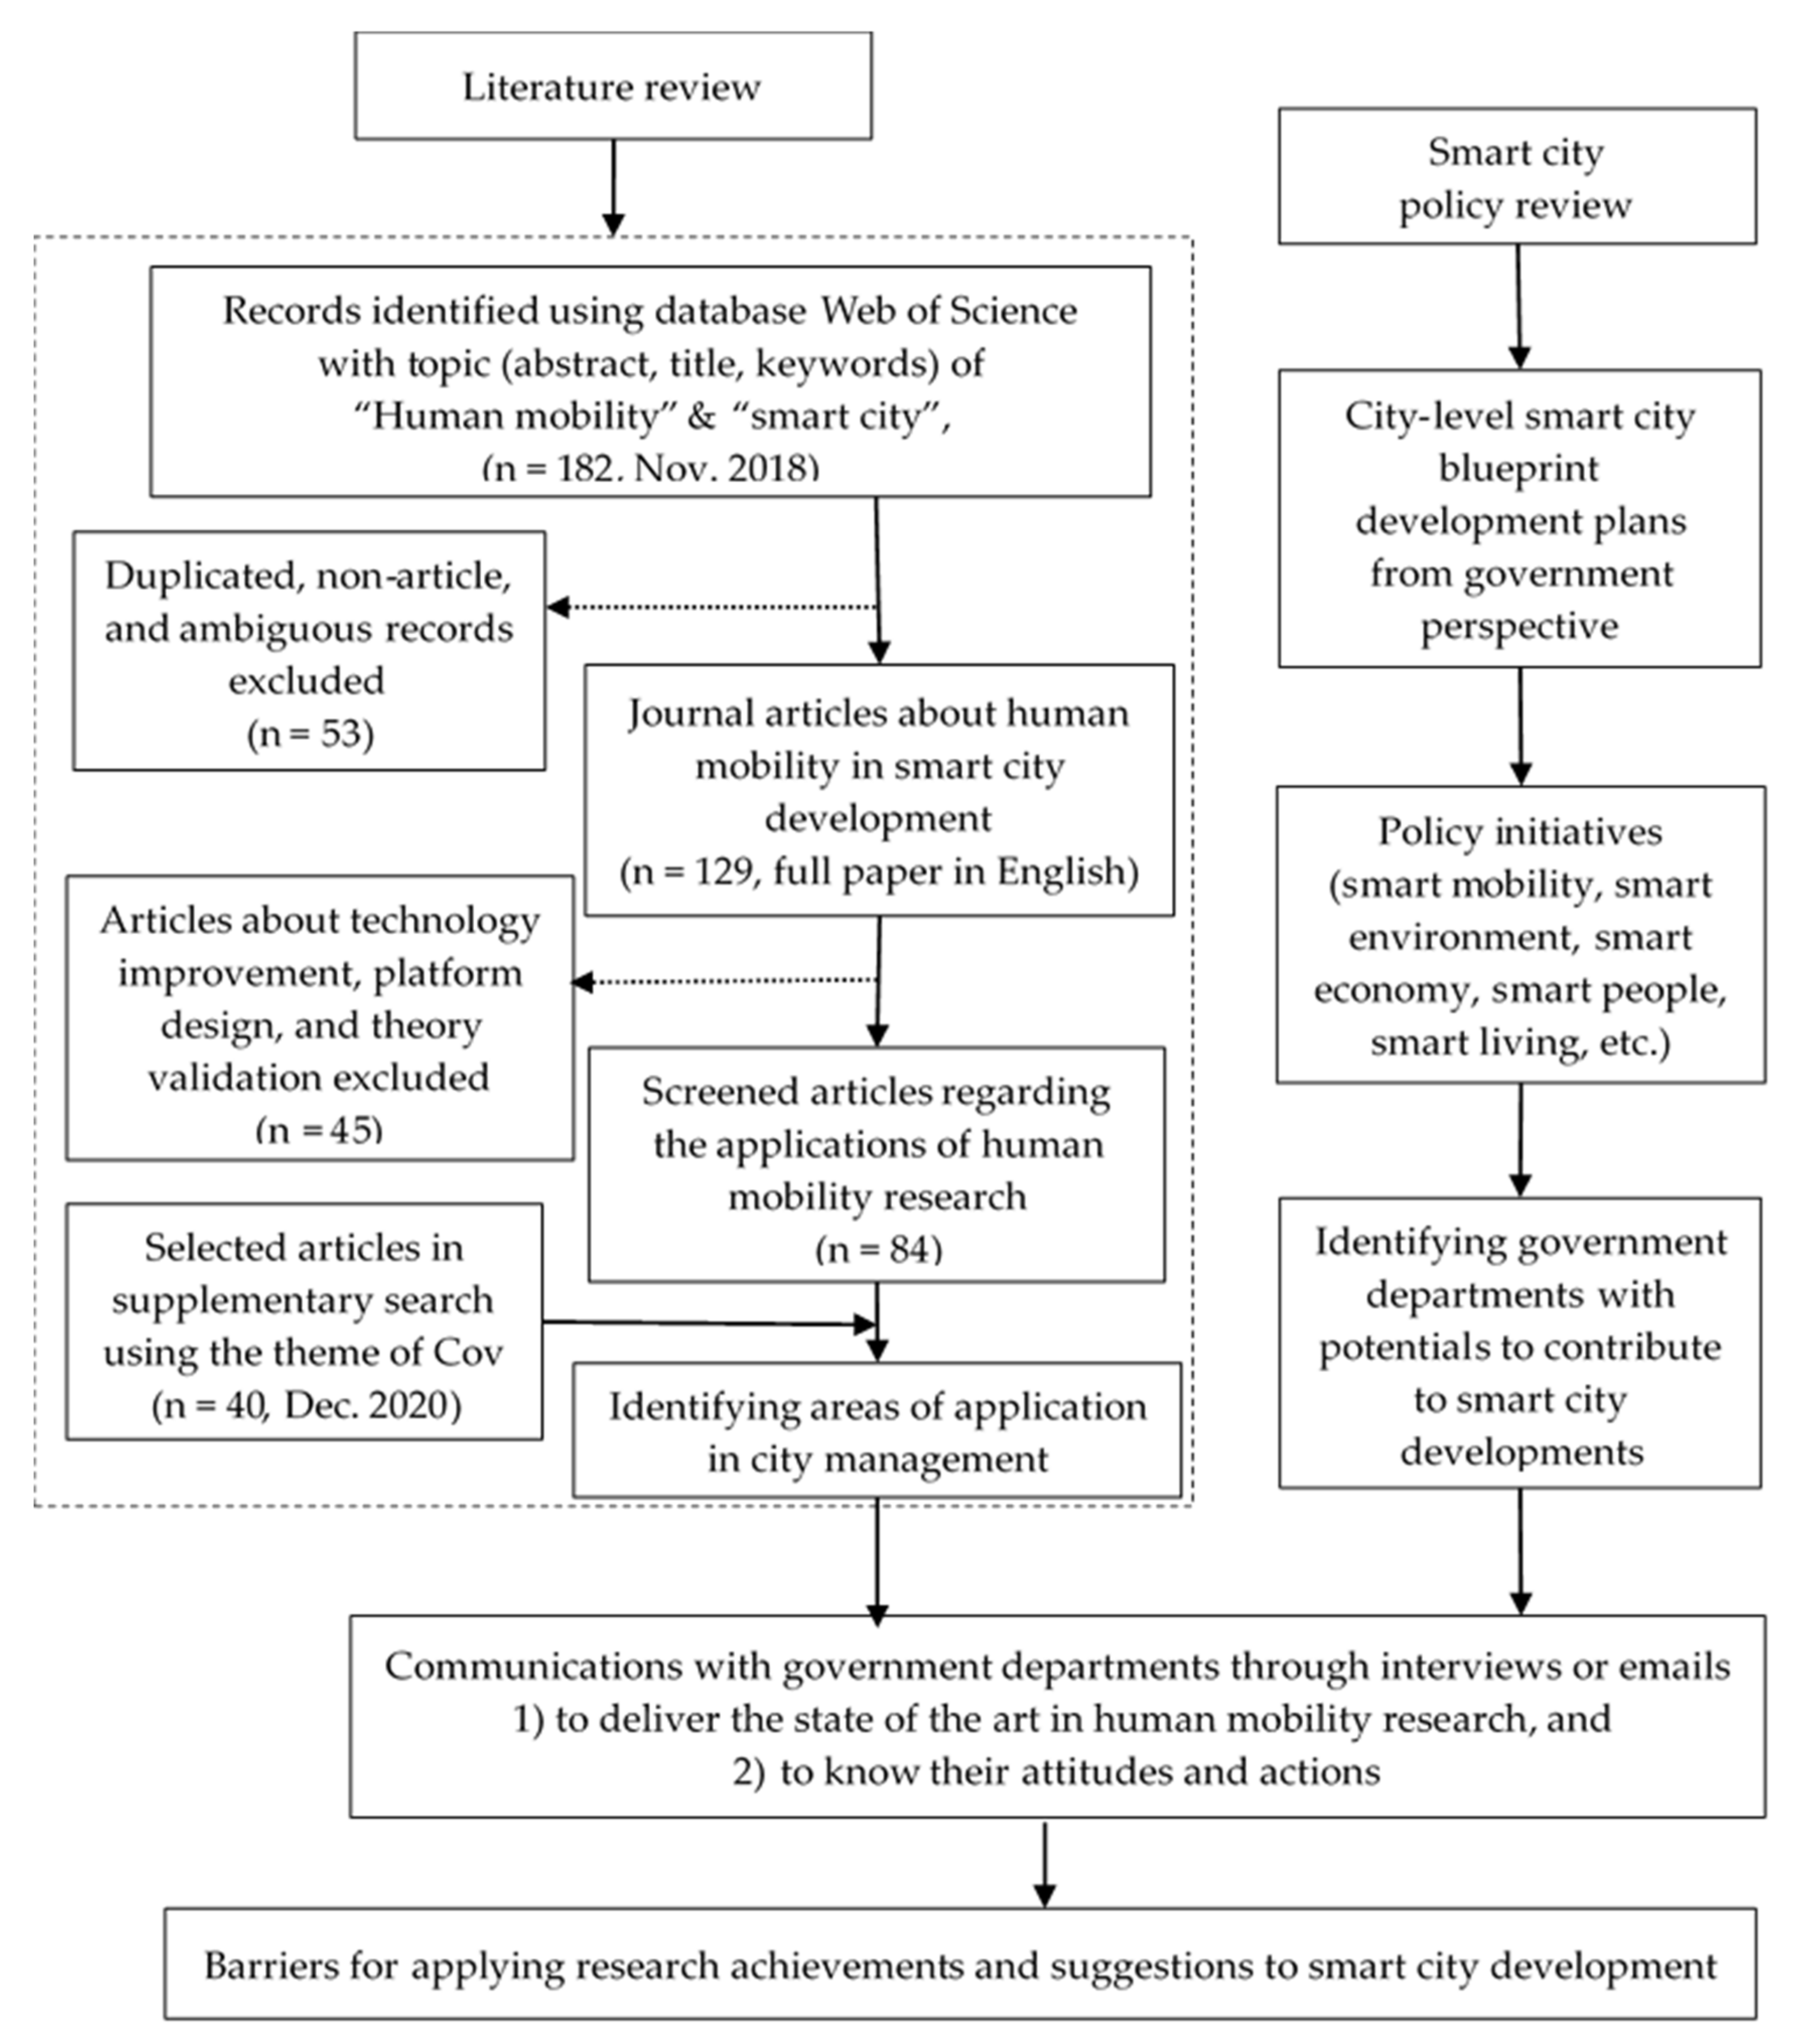
2. Materials and Methods

A research framework was established to link data-driven human mobility research with potential implementation of smart city developments. It mainly consists of two main parts, which are (a) a literature review of the international academic research on human mobility with big data, and (b) a policy review and analysis of smart city development at the city level. Figure 1 illustrates the proposed framework and the process of literature review and policy analysis.
To conduct the literature review, a literature research was done in November, 2018 on the peer-reviewed publications in the Web of Science Core Collection database, by using the targeted phrases “human mobility” and “smart city”. A total of 182 studies were identified, and 84 scientific articles indexed by the Science Citation Index Expanded and Social Sciences Citation Index were selected for further analysis. Recently, human mobility data has been highly involved in the research on the COVID-19 pandemic. To investigate the implications in such research to public health, as an important domain of smart city management, a supplementary search was made in December, 2020 in the above database, by using the themes of Cov (“COVID-19”, “SARs-CoV-2” or “2019-nCov”) and “human mobility”. A total of 81 articles were identified, among which 40 research articles had involved the actual use of empirical human mobility data.
The smart city policies were analysed in the context of Hong Kong (HK), where many policy directives have already been experimented or implemented by government. The “Smart City Blueprint” (available online at https://www.smartcity.gov.hk/report/) maps out development plans from an overall point of view by making use of innovation and technology and lists various strategies and initiatives in six major areas, namely Smart Mobility, Smart Environment, Smart Government, Smart Economy, Smart People, and Smart Living. Among them, some initiatives are associated with the analytics of human spatial-temporal behaviour. For example, Smart Mobility is highly related to spatial analysis of transport, while the spatial platform referring to Smart Government focuses on big data visualisation and Smart Economy concerns the place-based economy such as smart tourism. Afterwards, emails were sent to relevant government departments in HK to deliver the state of the art in human mobility research in the particular areas and to know their attitudes and actions in work. Issues of applying research in city development were identified and implications to smart city development were finally discussed.

3. Big Data based Human Mobility Research

Based on a literature review, the studies are primarily categorised by data sources, including mobile phone, mass media, taxi or car, bank card, metro card, website, wireless devices, and multiple sources. Mobile phone (trajectories or call records) is the source that produces the richest information with constantly track locations of individuals and passengers, which is similar to a taxi or car that reflect the locations of the vehicles as well as the drivers. Mass media is related to digital apps and human activities, while bank card is related to transactions and metro card reflects travel behaviour. Data obtained by wireless devices facilitates the understanding of mobility patterns at the smallest scales. Researches based on multiple sources strengthen the power of big data by integrating difference categories of information.
The literature is also categorised by 4 levels of aims, which are discovering the phenomenon, identifying the difference, explaining the differences and implementation in city management. Human and space are two objects normally targeted in research, since human behaviour is influenced by both personal attributes (who they are) and spatial attributes (where they live or work). Table 1 summarizes these researches, categorised by data source and research objective.

3.1. Discovering the Phenomenon

To understand the spatio-temporal patterns of human mobility is one of the basic targets and fundamental to follow-up analysis. Spatial-temporal paths consistent for each individual are mined from mobile data, whilst relationships among the generated hotspots in temporal dimensions are discovered [10]. Large-scale collective urban mobility was analysed to elaborate people flows between areas, as well as the exceptional patterns that are associated with real-world events such as soccer matches [11]. With taxi GPS data, the distributions of origin/destination data are visualised, based on which trips are confined to a certain distance or orientation range and drivers’ choices of routes could be figured out [12]. From massive event track app data, heat maps of popular routes online can be generated and visualised by virtue of client preferences [13]. Apart from visualization, the movement pattern could be assessed by feature, e.g., stability, in terms of the convergence and divergence of individuals [14].
Apart from phone and vehicle data, WiFi and locational data are used to uncover the transition characteristics between dynamical regimes [15], or to identify frequencies, directions, intensity, and trajectories [16]. With the transaction data of a smart subway fare card, the mobility model was used for generating the heterogeneous flows at aggregated level as well as visitations at the individual level [17].
Human mobilization, although it is a kind of human behaviour, implies the attributes of the specific spaces where mobility happens. To discover the characteristics of land use, big data analytics figure out clusters, such as residential area, office, leisure-commerce and rush hour clusters [18]. The inference of changes in movements facilitates the understanding of polycentric urban form based on the identified city hubs, centres, and borders [19]. Moreover, by involving the information of land use functions, the spatial variation of self-containment and employment and jobs–housing balance could be demonstrated [20].
The interaction between human behaviour and the urban environment could be re-interpreted in more quantitative approaches with big data. For example, population exposures in urban greenery were highly correlated with land use distribution and the dynamics of human mobility [21]. On a worldwide scale, the tourism hotspots in the US and EU cities are identified based on geotagged photographs, which in turn discovers the power-law distribution of the attractiveness of tourist attractions [22].
To achieve the research objectives of discovering the phenomenon, methods of spatial analysis and visual analytics are typically applied. Software tools with different functions are used, including but not limited to ArcGIS for spatial data analyses and visualizations, Java/Python for data processing, Tableau for visual analytics, SPSS for integrity and validity checks, PostgreSQL/PostGIS for data management, and the R platform for graphing.

3.2. Identification of the Differences

To identify the differences in human mobility and space utilization, clustering analysis is commonly adopted to distinguish the differences by parameters such as demographic features of gender, age, income, nationality, etc. It was found that pedestrian mobility is disaggregated between locals and foreigner, implying the impact of tourist flows on the resident life [23]. Via Twitter, human mobility measures are differentiated particularly between different race/ethnicity groups, then the age [24], while gender difference is observed in the location-based check-in data of Weibo [25].
In addition to the demographic parameters, categorizations are processed by mode or demand or other behavioural profiles, either observed or self-defined. Mobile sensed data analytics contribute to the recognition of user transport modes, e.g., by bike, bus, car, foot, and train [26]. Travel demands of taxi passengers are categorised by incorporating and taking into consideration the distance and time constraints, and geographical context [27]. Patterns of mobile users are clustered by both communication behaviour and average revenue per user [28], or by individual space–time profiles with different movements and behaviours [29]. Using data from the wide area network, by monitoring traffic in a few cities, vehicle trajectories are mined and categorised by time or location features [30].
The discovery of differences enriches the understanding of human behaviour and enhances the quality of services. It was found that people who have a higher diameter of area of influence (DAI) also spend more money for mobile communications, indicating the potentiality to use DAI as a feature for classifying socioeconomic levels of cities [31]. Tourism market segmentation based on crowdsourced data facilitates the provision of more personalised tourism services [32].
Systematic analysis combining difference and similarity among clusters improves the allocation of resources. To enhance collaborative mobility (CM) such as sharing travelling resources, the system with extracted GPS traces can automatically find sharing opportunities and recommend behavioural changes for conducting sharing services [33].
Methods of machine learning are widely adopted among this group of studies, such as support vector machines (SVMs), C-means fuzzy clustering, K-means clustering, hierarchical clustering, ant colony algorithm, etc.

3.3. Explanation of the Differences/Features

Although complex, the differences among groups or individuals are to some extent explicable, based on personal properties, spatial attributions, or the interactive effects of humans and the environment.
Individually, attributes regarding personality, interest, habit, memory, etc, are influential to human mobility. Personality traits help to explain individual differences in location-based social networks usage and the types of places visited [34]. The big five personality traits are commonly applied, and it was found that extraverted individuals have more diverse routines while high neuroticism and openness individuals associate with more instable routine [35]. Interest dynamics of humans, referring to preferential return to previously visited interests, the inertial effect, and exploration of new places, are causally connected to mobility behaviour [36]. Preference itself has rich connotations. For example, differences in the lifestyles between big city and small city residents were observed through the latent patterns of human preference, which is related to both age group and city context [37].
Another interesting discovery is that individual properties are determinative in both physical space and cyberspace movement, the latter defined as changes in online activities, typically corresponding to switching in the websites of exploration. It was detected that movements in the two spaces were similar in terms of exploration of new sites and preferential return to highly visited sites [38]. The unified underpinning of mobility in the real world and cyberspace is also explained as a memory-preferential mechanism in limited space [39].
Spatial or regional attributes, such as economic-social features, cultural sociology, land use function, etc. are important drivers for different mobility behaviours. Distinctive patterns highlight the similarity or the difference in behaviour among regions in Uganda, distinctly related to economic and social regional characteristics [40]. Social ecology reflected by dominant urban functions is also determinative [41], and one example is about intangible cultural ties, e.g., the existence and persistence of dialect borders identified with Weibo data affect human mobility for social interactions [42].
The integration of multiple data sources enhances the interpretation of different space attributes. Based on subway transaction records and points of interest (POI) information, the latent functions of subway stations and the correlation between mobility patterns and station functions were illustrated [43]. Similarly, building functions are inferred with WeChat location records, taxi GPS trajectories, POI, and building footprint from high-resolution Quickbird images [44].
Latent features of either human behaviour or place attributes reflected from economic activities in the process of movement are inspiring yet noteworthy. High income taxi drivers are more likely to deny passage to passengers [45]. The integration of individual economic spending with mobility implies the ability of cities to attracting foreign visitors [46]. People may become the “social bridges” between communities, since it is found that those who work at close-by locations could act similarly in community purchase behaviour even in different communities [47].
In the physical world, mobility is more like a result of interaction between individuals and the space or environment. Methods of statistical analysis are applied for explaining the drivers and their effects, including correlation analysis (mostly used), regression models, preferential attachment models to reproduce the statistical scaling of behaviours, etc.

3.4. Prediction and Implication

The results of some researches could be applied to city management, in multiple disciplines, here mainly categorised in four aspects of transportation system, public health, urban governance, and environment management and policy.

3.4.1. Transportation System

Transportation is the domain where applications of big data are broad. Strategies are proposed in the literature to predict the travel time of any trip, to provide real time traffic information, to predict movement patterns based on personality or spatio-temporal routines, to improve crash analysis, to plan bus routes, to improve taxi dispatch, and to optimise traffic during big events.
The consensual 3D speed map revealing the urban congestion patterns is used to predict the travel time of any trip within the city [48]. With information from individual participants or diary and trajectory generators, the overall traffic could be compared or monitored in real time [49,50]. With multiple data sources, the impact of big events on traffic could be estimated and strategies for reducing the collective travel time and congestion are proposed by evaluating different route choice scenarios at the urban scale [51]. Based on the established relationship between human mobility and personality, movement patterns could be predicted [52]. Twitter-based activity information could be incorporated in spatial analysis of crashes in urban areas, and geographically weighted regression (GWR) models were developed to establish a relationship between the crash counts reported and various contributing factors [53]. Intending to explore the night bus route planning issue by using taxi GPS traces, analysis was conducted to achieve the maximum number of passengers under the given conditions and constraints [54]. Agent-based modelling of taxi behaviour simulation with probe vehicle data helps to get deeper understanding of taxi behaviour, for better managing and dispatching the fleet of the taxi that can make monetary profit for the drivers [55].

3.4.2. Public Health

Increasing attention has been paid to the integration of human mobility data into the policy of public health, particularly in supporting environmental exposure assessment and programs designed for spatiotemporal disease control.
With population density data derived by mobile phone traffic and station-based air quality data, dynamic urban air pollution (e.g., PM2.5 concentrations) population exposures were investigated in details and compared among residents, tourists and commuters [56,57]. For guiding disease control, intra-urban transmission risk of dengue fever with hourly cell phone data was mapped, considering local human movements, temporal scale, and positioning uncertainty [58], while the degree of variation in transmission coefficient, a designated spatially and temporally dependent variable, was inferable using geolocated tweets [59]. Drivers of endemic schistosomiasis were unveiled with both socioeconomic and environmental factors and human mobility features, based on which the effects of control, for example, via improved access to safe water or educational campaigns were analysed [60]. However, it is argued that even though mobility and infectious diseases have been connected by quantifying disease-relevant travel patterns on fine spatial and temporal scales, how a system can be currently implemented against disease incidence remains questionable; the models need to be formally statistically evaluated and tested [61].
The increasing involvement of human mobility data in public health research has been well reflected in the recent intensive mobility-related studies on the COVID-19 pandemic. In particular, these studies have been facilitated by the latest public and aggregated massive mobile phone data provided by major location-based service vendors, such as Google COVID-19 Community Mobility Reports [62] and Baidu Migration data [63]. A focus of mobility-related COVID-19 studies is on the interactions between human mobility and pandemic. The interactions include the role played by human mobility in the pandemic transmission [64,65]; the combined association of mobility and other environment and socioeconomic factors on the pandemic spread [66] and peoples’s change in mobility behaviours and the use of urban spaces, usually because of mobility restrictions and social distancing policies [67,68]. Based on the mobility-pandemic interactions, studies have further involved human mobility data into the forecast of epidemic risk [69,70], as well as the evaluation and recommendation of various epidemic control measures [71,72]. The environmental and socioeconomic impacts of mobility restriction resulted from the pandemic have also been further investigated. While the reduced human mobility and activities have been found to result in a general reduction of pollution [73,74], they also have been found to lead to great economic loss and aggravation of social issues, such as inequality [75]. Thanks to the availability of timely human mobility data, various online and mobile platforms have been developed for near-real-time mapping of epidemic cases and predicted epidemic risks, to help anti-pandemic policy making and the self-protection of the public [76]. A list of technical tasks in geographic information systems to understand, predict, and support the control measures of COVID-19 are summarised in [77].

3.4.3. Urban Governance

Human mobility patterns reveal the movement of a large population, potential applications of which are raised in domains from big events management, disaster evacuation, crime prediction, and safety estimation, to public space/facility provision.
Knowledge about the occurrences of big events derived from bus trajectories including event start time, end time, temporal patterns of arrival and departure of event attendees, etc. can be usefully applied in event planning and management [78]. For predicting human evacuation following disasters, human emergency behaviour could be modelled using an intelligent deep learning system such as DeepMob [79]. Regarding the classification of crime hotspots, aggregated human behavioural data captured from the mobile network infrastructure, in combination with basic demographic information, can describe the crime level of a geographical area and assist crime prediction [80]. The safety of places in new developments or public areas is possible to estimate by operationalizing relevant concepts from criminological and urban theories, with prediction features exploited from census data, Foursquare, subway usage, and taxi usage [81]. The spatial interaction characteristics and service areas of different types and sizes of public facilities are identified based on taxi drop on drop off data, for optimizing the spatial configuration of medical or other types of public facilities [82].

3.4.4. Environmental Management and Policy

Referring to environment-related policies, big data contributes to the management of environment projects as well as the analysis of policy adoption. Data science and environmental management draw upon the results of national projects. The LENVIS project in Italy enables users to upload video of localised pollution events and personal narratives, forming a network of monitoring the interplay between the concentration levels of a set of airborne pollutants and the health care in hospital [83]. To assess whether the policy of energy-saving vehicles can be implemented, real mobility information is used as decision support for the taxi fleet manager to promote the adoption of electric taxi cabs [84]. Focusing on economic feasibility of the policy, quantitative calculations show that introducing electric vehicles in the taxi fleet increases the purchase cost of the taxis, however service, maintenance and repairs and fuel costs can be reduced, resulting in a reduction in total costs [85].

3.5. Summary of the Hierarchical Research

In summary, the hierarchy of research was illustrated by objective, with data requirements and methods briefly marked. The upper level is to simply show what happened in real world (discovering the phenomenon), mainly using the methods of basic spatial analysis and visualization. The middle levels attempt to explain how and why it happened with more data reflecting social-economic factors and their connections with spatial mobility using mathematical methods such as statistical analysis and machine learning. The bottom level of applications is based on prediction, a platform for information exchange, and knowledge generated from subject data that can be used to explore what we can do for city development and management. Although the methods applied at the bottom level were not always complex, more data are required to achieve the objectives at the deeper levels; see Figure 2.
Even though the advantages of applying big data analytic in the city are emphasised, the linkage between the concepts of human mobility and the smart city is still fuzzy. However, the current trends and evolution patterns of any individual smart city depend on the local context factors, and in order to shape appropriate strategies for particular cities therefore policy makers are urged to understand these factors [4].

4. Hong Kong Smart City Policy

To identify the gaps between the data-driven research and potential implementation in the various domains of smart city developments, communications with government are essential. In the case of HK, since only a few questions (not more than four) are targeted for each governmental department, emails rather than interviews were adopted for communication.

4.1. Views from Government

Focusing on the management scopes of different departments including the Transport Department, the Hong Kong Police Force, the Department of Health, the Environmental Protection Department, the Hong Kong Tourism Board, and the Planning Department, questions about “How can big data and the advanced analytics/technologies proposed in research applied in the real work?” were enquired with a brief introduction of related literature. Table 2 lists the fields of the questions for the corresponding government sectors. Details of the emails and the responses refer to Supplementary Materials.
According to their responses, the importance of applying big data in improving city governance was confirmed and many smart initiatives associated with human mobility were mentioned. Nevertheless, regarding the application of the introduced analytics, barriers are still significant. The difficulties mentioned in replied emails were interpreted in five aspects in the following Section 3.2.

4.2. Issues and Barriers in Application

Data isolation. The databases managed by different departments are not well integrated, and therefore the methodologies used in research could not be applied due to data limitation. In addition, data from sub-institutional sectors under the management of the same department may also be isolated. For example, regarding taxi dispatch, a few taxi hailing platforms are being used. Thus, the TD indicates that setting up or integrating these platforms is the primary condition to improve the operational efficiency and service quality of taxis.
Data unavailability. According to the reviewed literature, data from mobile phones is advantageous in reflecting human behaviour and discovering knowledge of peoples’ mobility. However, in the case of HK, these data are not available to government at the current moment, restricting the application of related research in real world. One example is the analysis of the real-time influence of air quality on human daily life. The real-time population exposure was measured in studied areas using mobile- and station-based big data, considering the spatiotemporal variability of both population distribution and pollutants concentrations. In contrast, the studies conducted by EPD took the air quality of a city as homogeneity without sufficient considerations of the spatial differences in pollution exposures.
Costs versus quality of data. The costs not only for the short-term installations but for the long-term operation are unneglectable barriers for obtaining big data, particularly those with high quality. Referring to air quality monitoring, even though some lower cost air monitoring devices are capable of providing quality data, their operating cost is not much lower than that of the existing stations, and thorough consideration is essential in planning for long term deployment of additional monitoring.
Limited knowledge derived from rich data. Even with integrated big data, how can deeper knowledge be generated based on more scientific analytics requires much effort. In the planning of bus routes, franchised bus companies submit proposals for service adjustment through the annual route planning programmes; however, the impacts are considered case by case rather than based on systematic analytics, by taking into consideration all the routes in the city as a whole. There is a large scope of information to turn the absorbed big data into generalized knowledge of human behaviour and space use. For instance, the HKTB has collaborated with social and digital media players such as Google, TripAdvisor and Facebook; nevertheless, the obtained data was not thoroughly used and mined to elaborate tourism behaviours, which if applicable, will be helpful in clarifying destination brandings as well as demonstrating the tourism market.
Estrangement between public and private sectors. The involvement of non-public sectors and cooperation among government, companies, institutions and even individuals are essential to the implementation of smart initiatives, yet proves to be difficult. Taking for instance the adoption of electric vehicles (EVs), chargers for public EVs are being installed to test the real-time electronic information through the Government Electronic Platform. However, how to enlarge the promotion of EVs to private sectors and individual car owners remains an open question to be further discussed.
In summary, the achievements in smart city development are laudable, yet it is still in the start-up stage, which mainly focuses on the base of smart infrastructure, such as the Common Spatial Data Infrastructure (CSDI) by the Development Bureau, map service platform by the Lands Department, Intelligent Transport Systems (ITS) by the TD, smart travel platform by HKTB, etc. Among the smart sub-domains, transportation is the area that is most related to human mobility and has applied more data-driven analytics and technologies than other areas. To accomplish the mission to “maximise innovation, knowledge and value creation for the government, business and the community”, the penetration of smart technologies to other development and management domains will come a long way.

5. Discussion

5.1. Data, Method, and Theory

Indicated from Figure 2, to apply research to city management and practice (the bottom level objective) requires more data than that for research with the upper-level objectives. Involving some subject data that are related yet uncommon in traditional research area should be an effective way to improve the practical value of the research. Some studies in Section 3.4 provide good demonstrations. Researchers are encouraged to diversify the database by turning outwards to other fields. Bearing in mind that data itself, though big and rich, has limitations, for example, the representativeness of data [86]. Taking bias among mobile phone users for instance, the discrepancy between the population captured by call detail records and the general population is obvious, e.g., students to be omitted compared with other members in the household [87]. Methods for big data processing as well are to be continuously modified and promoted. Two key issues of locational uncertainty and oscillation should be paid attention when elucidating the results, for example, uncertainty and oscillation in mobility patterns derived from passively-generated mobile phone data [88]. As the application of big data rapidly spreads worldwide, different approaches to protect personal data and secure call privacy require more deliberative considerations, for example, through protection regulation, differential privacy, decentralised machine learning strategy, volunteered information, etc. [89,90].
Social, economic, and behavioural theories are conductive to understanding the dynamics of human behaviour. Similar to what has been concluded in previous research, the smart city paradigm requires “inclusiveness”, as demonstrated in two dimensions: a wider set of data resources can be effectively integrated and a structure of mechanisms of learning and classification [83].

5.2. Continuous City Innovation

The “Smart City Blueprint” is a framework from the government’s perspective that illustrates the lifecycle of promoting innovation in Hong Kong; it starts by setting the long-term city goals, followed by innovation strategy, standards and platform, operating model, and lastly an execution plan. During the operating process, partnerships between government and a variety of organisations such as academia are encouraged to make the best use of information, tools, and practices. Narrowing done to the application of human mobility analytics, the role of research in linking big data and smart city policy is demonstrated in Figure 3.
On the basis of digital infrastructure, four elements of technology, theory, experiment and practice are essential to make use of data to serve decision making. Referring to human mobility, knowledge is generated through computer algorithms, data management, and temporal-spatial analysis that combines theories related to human-space interaction. The knowledge is afterwards tested in pilot projects and adjusted to become more applicable, which can be potentially generalised in practice through the promotion of relevant policy.
The mechanism of data opening and integration as well as the dynamic adjustment of the application of research is the key to formulate the loop of data-driven practice. Furthermore, in the scope of city policy, a cohesive blueprint networking different departments and city functions will be helpful to achieve comprehensive development. However, as previous study indicated, the juxtaposition of smart urbanism of HK does not work perfectly due to the lack of connection and incompatible elements [91].

5.3. Limitation and Further Study

The research links big data research to smart city practice but is limited in terms of the research scope and the generality of the proposed framework. Literature reviewed in Section 3, although covering a wide variety of applications, may not be sufficient to cover all the possibilities of research application. Since it emphasises the application of research on the policy side rather than the methodological sides, deep evaluations for a particular kind of data or method are not included in the paper. Studies focusing on the deeper analysis of data from a specific source, e.g., locating-request apps, smart cards, etc. would help to move forward to improve the effectiveness in practice [92]. Issues and barriers identified in this study are referrable to other cities in which governments play important roles in promoting smart city initiatives. However, policy analysis is confined to the city context of HK, where the development of the smart city is oriented by government, instead of being dominated by private sector as is the case in most western countries, and the proposed framework/methodology in this study can be applied to other cities to scrutinise the barriers in different city contexts.

6. Conclusions

Big data offers an unprecedented opportunity to obtain deeper understanding of human mobility attributes and of human-space interaction. This paper explored through what approaches could data-driven analysis of human mobility be applied to promoting the smart city. First, human mobility studies based on big data related to smart city in the Web of Science database was systematically reviewed. The studies were analysed according to 4 levels of aims: discovering the phenomenon, identify the differences, explain the differences, and implication to city management. Also reviewed was how human mobility studies helped cities fight the COVID-19 pandemic. Furthermore, based on email communications with government departments in HK, the practices of applying big data in building a smarter city from the perspective human mobility, and major challenges in the application of big data analytics for mobility in the city were analysed.
Apparently, there are many potentialities to achieve a smarter city by improving the practical value of data analytics, even though barriers still exist. When creating or optimizing methods for analysis, researchers are encouraged to incorporate with governors and policy makers to integrate more kinds of data in analytics to turn the absorbed big data into generalised knowledge and promote the applicability of technical methods and models in the operation of urban systems. Focusing on urban problems rather than the data itself, more practical analytics that take into account knowledge or theory from multiple disciplines will make better use of data to serve people as well as to facilitate the use of resources. Meanwhile, researchers need to pay attention to various uncertainties that would impact the applicability of their research, such as the representativeness of research subjects, and the uncertainty and oscillation in mobility patterns extracted from the data, as well as the protection of personal data and privacy. This article also illustrates the relationship among data, research, and policy application, identifying the roles of researchers in computer science and geography, practitioner in market or government and policy makers in promoting smart application. Although restricted in scope and city context, this study brings some insights to data-driven research and the development of the smart city.

Supplementary Materials

The following are available online at https://0-www-mdpi-com.brum.beds.ac.uk/2220-9964/10/1/13/s1, “Emails to government departments and their replies.” A. Sample of Email, B. List of questions sent to different departments, C. Responses from departments.

Author Contributions

Conceptualization, Anqi Wang and Edwin H. W. Chan; methodology, Anqi Wang and Anshu Zhang; resources, Xiaolin Zhou and Zhewei Liu; writing—original Draft Preparation, Anqi Wang, Xiaolin Zhou and Zhewei Liu; Writing—Review and Editing, Anqi Wang and Anshu Zhang; supervision, Edwin H. W. Chan; project administration, Wenzhong Shi; funding cquisition, Edwin H. W. Chan and Wenzhong Shi. All authors have read and agreed to the published version of the manuscript.

Funding

This research was funded by the National Key R&D Program of China (2019YFB2103102), and The Hong Kong Polytechnic University (1-BBWF, 1-ZVN6, 4-ZZFZ).

Informed Consent Statement

Not applicable.

Data Availability Statement

The literature data for the review was obtained from Web of Science and is available from www.webofknowledge.com. The interview data with Hong Kong government departments is available in the Supplementary Materials.

Acknowledgments

The authors appreciate the help of the interviewees in presenting their opinions on smart city development.

Conflicts of Interest

The authors declare no conflict of interest.

References

  1. Batty, M.; Axhausen, K.W.; Giannotti, F.; Pozdnoukhov, A.; Bazzani, A.; Wachowicz, M.; Ouzounis, G.; Portugali, Y. Smart cities of the future. Eur. Phys. J. Spéc. Top. 2012, 214, 481–518. [Google Scholar] [CrossRef] [Green Version]
  2. Yuan, Y.; Raubal, M. Analyzing the distribution of human activity space from mobile phone usage: An individual and urban-oriented study. Int. J. Geogr. Inf. Sci. 2016, 30, 1594–1621. [Google Scholar] [CrossRef]
  3. Hilbert, M. Big Data for Development: A Review of Promises and Challenges. Dev. Policy Rev. 2016, 34, 135–174. [Google Scholar] [CrossRef] [Green Version]
  4. Neirotti, P.; De Marco, A.; Cagliano, A.C.; Mangano, G.; Scorrano, F. Current trends in Smart City initiatives: Some stylised facts. Cities 2014, 38, 25–36. [Google Scholar] [CrossRef] [Green Version]
  5. Liu, J.; Li, J.; Li, W.; Liu, J. Rethinking big data: A review on the data quality and usage issues. ISPRS J. Photogramm. Remote. Sens. 2016, 115, 134–142. [Google Scholar] [CrossRef]
  6. Pan, G.; Qi, G.; Zhang, W.; Li, S.; Wu, Z.; Yang, L.T. Trace analysis and mining for smart cities: Issues, methods, and applications. IEEE Commun. Mag. 2013, 51, 120–126. [Google Scholar] [CrossRef]
  7. Yin, C.; Xiong, Z.; Chen, H.; Wang, J.; Cooper, D.; David, B. A literature survey on smart cities. Sci. China Inf. Sci. 2015, 58, 1–18. [Google Scholar] [CrossRef]
  8. Miller, H.J. Beyond sharing: Cultivating cooperative transportation systems through geographic information science. J. Transp. Geogr. 2013, 31, 296–308. [Google Scholar] [CrossRef]
  9. Lee, J.-G.; Kang, M. Geospatial Big Data: Challenges and Opportunities. Big Data Res. 2015, 2, 74–81. [Google Scholar] [CrossRef]
  10. Yao, H.; Xiong, M.; Zeng, D.; Gong, J. Mining multiple spatial–temporal paths from social media data. Futur. Gener. Comput. Syst. 2018, 87, 782–791. [Google Scholar] [CrossRef]
  11. Sagl, G.; Loidl, M.; Beinat, E. A Visual Analytics Approach for Extracting Spatio-Temporal Urban Mobility Information from Mobile Network Traffic. ISPRS Int. J. Geo-Inf. 2012, 1, 256–271. [Google Scholar] [CrossRef] [Green Version]
  12. Sainio, J.; Westerholm, J.; Oksanen, J. Generating Heat Maps of Popular Routes Online from Massive Mobile Sports Tracking Application Data in Milliseconds While Respecting Privacy. ISPRS Int. J. Geo-Inf. 2015, 4, 1813–1826. [Google Scholar] [CrossRef] [Green Version]
  13. Jiang, X.; Zheng, C.; Tian, Y.; Liang, R.-H. Large-scale taxi O/D visual analytics for understanding metropolitan human movement patterns. J. Vis. 2015, 18, 185–200. [Google Scholar] [CrossRef]
  14. Fang, Z.; Yang, X.; Xu, Y.; Shaw, S.-L.; Yin, L. Spatiotemporal model for assessing the stability of urban human convergence and divergence patterns. Int. J. Geogr. Inf. Sci. 2017, 31, 2119–2141. [Google Scholar] [CrossRef]
  15. Li, R.; Zhao, Z.; Yang, C.; Wu, C.; Zhang, H. Wireless big data in cellular networks: The cornerstone of smart cities. IET Commun. 2018, 12, 1517–1523. [Google Scholar] [CrossRef]
  16. Traunmueller, M.W.; Johnson, N.E.; Malik, A.; Kontokosta, C.E. Digital footprints: Using WiFi probe and locational data to analyze human mobility trajectories in cities. Comput. Environ. Urban Syst. 2018, 72, 4–12. [Google Scholar] [CrossRef]
  17. Hasan, S.; Schneider, C.M.; Ukkusuri, S.V.; Gonzalez, M.C. Spatiotemporal Patterns of Urban Human Mobility. J. Stat. Phys. 2013, 151, 304–318. [Google Scholar] [CrossRef] [Green Version]
  18. Ríos, S.A.; Munoz, R. Land Use detection with cell phone data using topic models: Case Santiago, Chile. Comput. Environ. Urban Syst. 2017, 61, 39–48. [Google Scholar] [CrossRef]
  19. Zhong, C.; Arisona, S.M.; Huang, X.; Batty, M.; Schmitt, G. Detecting the dynamics of urban structure through spatial network analysis. Int. J. Geogr. Inf. Sci. 2014, 28, 2178–2199. [Google Scholar] [CrossRef]
  20. Zhou, X.; Yeh, A.G.; Yue, Y. Spatial variation of self-containment and jobs-housing balance in Shenzhen using cellphone big data. J. Transp. Geogr. 2018, 68, 102–108. [Google Scholar] [CrossRef]
  21. Song, Y.; Huang, B.; Cai, J.; Chen, B. Dynamic assessments of population exposure to urban greenspace using multi-source big data. Sci. Total. Environ. 2018, 634, 1315–1325. [Google Scholar] [CrossRef] [PubMed]
  22. Paldino, S.; Bojic, I.; Sobolevsky, S.; Ratti, C.; González, M.C. Urban magnetism through the lens of geo-tagged photography. EPJ Data Sci. 2015, 4, 5. [Google Scholar] [CrossRef] [Green Version]
  23. Mizzi, C.; Fabbri, A.; Rambaldi, S.; Bertini, F.; Curti, N.; Sinigardi, S.; Luzi, R.; Venturi, G.; Davide, M.; Muratore, G.; et al. Unraveling pedestrian mobility on a road network using ICTs data during great tourist events. EPJ Data Sci. 2018, 7, 44. [Google Scholar] [CrossRef] [Green Version]
  24. Luo, F.; Cao, G.; Mulligan, K.; Li, X. Explore spatiotemporal and demographic characteristics of human mobility via Twitter: A case study of Chicago. Appl. Geogr. 2016, 70, 11–25. [Google Scholar] [CrossRef] [Green Version]
  25. Rizwan, M.; Wanggen, W.; Cervantes, O.; Gwiazdzinski, L.; Wan, W. Using Location-Based Social Media Data to Observe Check-In Behavior and Gender Difference: Bringing Weibo Data into Play. ISPRS Int. J. Geo-Inf. 2018, 7, 196. [Google Scholar] [CrossRef] [Green Version]
  26. Semanjski, I.; Gautama, S.; Ahas, R.; Witlox, F. Spatial context mining approach for transport mode recognition from mobile sensed big data. Comput. Environ. Urban Syst. 2017, 66, 38–52. [Google Scholar] [CrossRef]
  27. Gong, L.; Liu, X.; Wu, L.; Liu, Y. Inferring trip purposes and uncovering travel patterns from taxi trajectory data. Cartogr. Geogr. Inf. Sci. 2016, 43, 103–114. [Google Scholar] [CrossRef]
  28. Wang, Z.; Tu, L.; Guo, Z.; Yang, L.T.; Huang, B. Analysis of user behaviors by mining large network data sets. Futur. Gener. Comput. Syst. 2014, 37, 429–437. [Google Scholar] [CrossRef]
  29. Shen, J.; Cheng, T. A framework for identifying activity groups from individual space-time profiles. Int. J. Geogr. Inf. Sci. 2016, 30, 1785–1805. [Google Scholar] [CrossRef]
  30. Yang, J.; Li, X.; Wang, D.; Wang, J. A Group Mining Method for Big Data on Distributed Vehicle Trajectories in WAN. Int. J. Distrib. Sens. Netw. 2015, 11, 756107. [Google Scholar] [CrossRef]
  31. Wijesinghe, W.O.K.I.S.; Kumarasinghe, C. Relationship Among the Diameter of the Area of Influence & Refill Usage of Sri Lanka Using Anonymized Call Detail Records. ICST Trans. Scalable Inf. Syst. 2017, 4, 152104. [Google Scholar] [CrossRef]
  32. Rodríguez-Echeverría, J.; Semanjski, I.; Gautama, S.; Van De Weghe, N.; Ochoa, D. Unsupervised Hierarchical Clustering Approach for Tourism Market Segmentation Based on Crowdsourced Mobile Phone Data. Sensors 2018, 18, 2972. [Google Scholar] [CrossRef] [PubMed] [Green Version]
  33. Toader, B.; Sprumont, F.; Faye, S.; Popescu, M.; Viti, F. Usage of Smartphone Data to Derive an Indicator for Collaborative Mobility between Individuals. ISPRS Int. J. Geo-Inf. 2017, 6, 62. [Google Scholar] [CrossRef] [Green Version]
  34. Chorley, M.J.; Whitaker, R.M.; Allen, S.M. Personality and location-based social networks. Comput. Hum. Behav. 2015, 46, 45–56. [Google Scholar] [CrossRef] [Green Version]
  35. Alessandretti, L.; Lehmann, S.; Baronchelli, A. Understanding the interplay between social and spatial behaviour. EPJ Data Sci. 2018, 7, 36. [Google Scholar] [CrossRef]
  36. Zhao, Z.-D.; Yang, Z.; Zhang, Z.; Zhou, T.; Huang, Z.-G.; Lai, Y.-C. Emergence of scaling in human-interest dynamics. Sci. Rep. 2013, 3, 3472. [Google Scholar] [CrossRef]
  37. Hu, T.; Bigelow, E.; Luo, J.; Kautz, H. Tales of Two Cities: Using Social Media to Understand Idiosyncratic Lifestyles in Distinctive Metropolitan Areas. IEEE Trans. Big Data 2017, 3, 55–66. [Google Scholar] [CrossRef] [Green Version]
  38. Zhao, Z.-D.; Huang, Z.-G.; Huang, L.; Liu, H.; Lai, Y.-C. Scaling and correlation of human movements in cyberspace and physical space. Phys. Rev. E 2014, 90, 050802. [Google Scholar] [CrossRef] [Green Version]
  39. Zhao, Y.-M.; Zeng, A.; Xiao-Yong, Y.; Wang, W.-X.; Lai, Y.-C. Unified underpinning of human mobility in the real world and cyberspace. New J. Phys. 2016, 18, 53025. [Google Scholar] [CrossRef] [Green Version]
  40. Wang, H.; Kilmartin, L. Comparing Rural and Urban Social and Economic Behavior in Uganda: Insights from Mobile Voice Service Usage. J. Urban Technol. 2014, 21, 61–89. [Google Scholar] [CrossRef]
  41. Xu, F.; Li, Y.; Chen, M.; Chen, S. Mobile cellular big data: Linking cyberspace and the physical world with social ecology. IEEE Netw. 2016, 30, 6–12. [Google Scholar] [CrossRef] [Green Version]
  42. Wu, W.; Wang, J.; Dai, T. The Geography of Cultural Ties and Human Mobility: Big Data in Urban Contexts. Ann. Am. Assoc. Geogr. 2016, 106, 612–630. [Google Scholar] [CrossRef]
  43. Wang, J.; Kong, X.; Rahim, A.; Xia, F.; Tolba, A.; Al-Makhadmeh, Z. IS2Fun: Identification of Subway Station Functions Using Massive Urban Data. IEEE Access 2017, 5, 27103–27113. [Google Scholar] [CrossRef]
  44. Niu, N.; Liu, X.; Jin, H.; Ye, X.; Liu, Y.; Li, X.; Chen, Y.; Li, S. Integrating multi-source big data to infer building functions. Int. J. Geogr. Inf. Sci. 2017, 31, 1–20. [Google Scholar] [CrossRef]
  45. Zhang, S.; Wang, Z. Inferring Passenger Denial Behavior of Taxi Drivers from Large-Scale Taxi Traces. PLoS ONE 2016, 11, e0165597. [Google Scholar] [CrossRef] [PubMed]
  46. Sobolevsky, S.; Sitko, I.; Combes, R.T.D.; Hawelka, B.; Arias, J.M.; Ratti, C. Cities through the Prism of People’s Spending Behavior. PLoS ONE 2016, 11, e0146291. [Google Scholar] [CrossRef]
  47. Dong, X.; Suhara, Y.; Bozkaya, B.; Singh, V.K.; Lepri, B.; Pentland, A. ‘Sandy’ Social Bridges in Urban Purchase Behavior. ACM Trans. Intell. Syst. Technol. 2018, 9, 1–29. [Google Scholar] [CrossRef]
  48. Lopez, C.; Leclercq, L.; Krishnakumari, P.; Chiabaut, N.; Van Lint, H. Revealing the day-to-day regularity of urban congestion patterns with 3D speed maps. Sci. Rep. 2017, 7, 1–11. [Google Scholar] [CrossRef]
  49. De Domenico, M.; Lima, A.; González, M.C.; Arenas, A. Personalized routing for multitudes in smart cities. EPJ Data Sci. 2015, 4, 1. [Google Scholar] [CrossRef]
  50. Pappalardo, L.; Simini, F. Data-driven generation of spatio-temporal routines in human mobility. Data Min. Knowl. Discov. 2018, 32, 787–829. [Google Scholar] [CrossRef] [Green Version]
  51. Xu, Y.; Gonzalez, M.C. Collective benefits in traffic during mega events via the use of information technologies. J. R. Soc. Interface 2017, 14, 20161041. [Google Scholar] [CrossRef] [PubMed] [Green Version]
  52. Kim, D.Y.; Song, H.Y. Method of predicting human mobility patterns using deep learning. Neurocomputing 2018, 280, 56–64. [Google Scholar] [CrossRef]
  53. Bao, J.; Liu, P.; Yu, H.; Xu, C. Incorporating twitter-based human activity information in spatial analysis of crashes in urban areas. Accid. Anal. Prev. 2017, 106, 358–369. [Google Scholar] [CrossRef] [PubMed]
  54. Chen, C.; Zhang, D.; Li, N.; Zhou, Z.-H. B-Planner: Planning Bidirectional Night Bus Routes Using Large-Scale Taxi GPS Traces. IEEE Trans. Intell. Transp. Syst. 2014, 15, 1451–1465. [Google Scholar] [CrossRef] [Green Version]
  55. Ranjit, S.; Witayangkurn, A.; Nagai, M.; Shibasaki, R. Agent-Based Modeling of Taxi Behavior Simulation with Probe Vehicle Data. ISPRS Int. J. Geo-Inf. 2018, 7, 177. [Google Scholar] [CrossRef] [Green Version]
  56. Chen, B.; Song, Y.; Jiang, T.; Chen, Z.; Huang, B.; Xu, B. Real-Time Estimation of Population Exposure to PM2.5 Using Mobile- and Station-Based Big Data. Int. J. Environ. Res. Public Health 2018, 15, 573. [Google Scholar] [CrossRef] [Green Version]
  57. Gariazzo, C.; Pelliccioni, A.; Bolignano, A. A dynamic urban air pollution population exposure assessment study using model and population density data derived by mobile phone traffic. Atmos. Environ. 2016, 131, 289–300. [Google Scholar] [CrossRef]
  58. Mao, L.; Yin, L.; Song, X.; Mei, S. Mapping intra-urban transmission risk of dengue fever with big hourly cellphone data. Acta Trop. 2016, 162, 188–195. [Google Scholar] [CrossRef]
  59. Kraemer, M.U.G.; Bisanzio, D.; Reiner, R.C.; Zakar, R.; Hawkins, J.B.; Freifeld, C.C.; Smith, D.L.; Hay, S.I.; Brownstein, J.S.; Perkins, T.A. Inferences about spatiotemporal variation in dengue virus transmission are sensitive to assumptions about human mobility: A case study using geolocated tweets from Lahore, Pakistan. EPJ Data Sci. 2018, 7, 1–17. [Google Scholar] [CrossRef] [Green Version]
  60. Mari, L.; Gatto, M.; Ciddio, M.; Dia, E.D.; Sokolow, S.H.; De Leo, G.A.; Casagrandi, R. Big-data-driven modeling unveils country-wide drivers of endemic schistosomiasis. Sci. Rep. 2017, 7, 1–11. [Google Scholar] [CrossRef] [Green Version]
  61. Wesolowski, A.; Buckee, C.O.; Engø-Monsen, K.; Metcalf, C.J.E. Connecting Mobility to Infectious Diseases: The Promise and Limits of Mobile Phone Data. J. Infect. Dis. 2016, 214, S414–S420. [Google Scholar] [CrossRef] [PubMed]
  62. Google. COVID-19 Community Mobility Reports. 2020. Available online: https://www.google.com/covid19/mobility/ (accessed on 7 December 2020).
  63. Baidu. Baidu Qianxi—Baidu Map Huiyan. 2020. Available online: https://qianxi.baidu.com/ (accessed on 7 December 2020).
  64. Badr, H.S.; Du, H.; Marshall, M.; Dong, E.; Squire, M.M.; Gardner, L. Association between mobility patterns and COVID-19 transmission in the USA: A mathematical modelling study. Lancet Infect. Dis. 2020, 20, 1247–1254. [Google Scholar] [CrossRef]
  65. Iacus, S.M.; Santamaria, C.; Sermi, F.; Spyratos, S.; Tarchi, D.; Vespe, M. Human mobility and COVID-19 initial dynamics. Nonlinear Dyn. 2020, 101, 1901–1919. [Google Scholar] [CrossRef] [PubMed]
  66. Kubota, Y.; Shiono, T.; Kusumoto, B.; Fujinuma, J. Multiple drivers of the COVID-19 spread: The roles of climate, international mobility, and region-specific conditions. PLoS ONE 2020, 15, e0239385. [Google Scholar] [CrossRef] [PubMed]
  67. Santamaria, C.; Sermi, F.; Spyratos, S.; Iacus, S.M.; Annunziato, A.; Tarchi, D.; Vespe, M. Measuring the impact of COVID-19 confinement measures on human mobility using mobile positioning data. A European regional analysis. Saf. Sci. 2020, 132, 104925. [Google Scholar] [CrossRef] [PubMed]
  68. Venter, Z.S.; Barton, D.N.; Gundersen, V.; Figari, H.; Nowell, M. Urban nature in a time of crisis: Recreational use of green space increases during the COVID-19 outbreak in Oslo, Norway. Environ. Res. Lett. 2020, 15, 104075. [Google Scholar] [CrossRef]
  69. Jia, J.S.; Lu, X.; Yuan, Y.; Xu, G.; Jia, J.; Christakis, N.A. Population flow drives spatio-temporal distribution of COVID-19 in China. Nat. Cell Biol. 2020, 582, 389–394. [Google Scholar] [CrossRef]
  70. Wang, H.Y.; Yamamoto, N. Using a partial differential equation with Google Mobility data to predict COVID-19 in Arizona. Math. Biosci. Eng. 2020, 17, 4891–4904. [Google Scholar] [CrossRef]
  71. Kraemer, M.; Yang, C.-H.; Gutiérrez, B.; Wu, C.-H.; Klein, B.; Pigott, D.M.; Du Plessis, L.; Faria, N.R.; Li, R.; Hanage, W.P.; et al. The effect of human mobility and control measures on the COVID-19 epidemic in China. Science 2020, 368, 493–497. [Google Scholar] [CrossRef] [Green Version]
  72. Gatto, M.; Bertuzzo, E.; Mari, L.; Miccoli, S.; Carraro, L.; Casagrandi, R.; Rinaldo, A. Spread and dynamics of the COVID-19 epidemic in Italy: Effects of emergency containment measures. Proc. Natl. Acad. Sci. USA 2020, 117, 10484–10491. [Google Scholar] [CrossRef] [Green Version]
  73. Bao, R.; Zhang, A. Does lockdown reduce air pollution? Evidence from 44 cities in northern China. Sci. Total. Environ. 2020, 731, 139052. [Google Scholar] [CrossRef] [PubMed]
  74. Cheval, S.; Adamescu, C.M.; Georgiadis, T.; Herrnegger, M.; Piticar, A.; LeGates, D.R. Observed and Potential Impacts of the COVID-19 Pandemic on the Environment. Int. J. Environ. Res. Public Health 2020, 17, 4140. [Google Scholar] [CrossRef] [PubMed]
  75. Bonaccorsi, G.; Pierri, F.; Cinelli, M.; Flori, A.; Galeazzi, A.; Porcelli, F.; Schmidt, A.L.; Valensise, C.M.; Scala, A.; Quattrociocchi, W.; et al. Economic and social consequences of human mobility restrictions under COVID-19. Proc. Natl. Acad. Sci. USA 2020, 117, 15530–15535. [Google Scholar] [CrossRef] [PubMed]
  76. Boulos, M.N.K.; Geraghty, E.M. Geographical tracking and mapping of coronavirus disease COVID-19/severe acute res-piratory syndrome coronavirus 2 (SARS-CoV-2) epidemic and associated events around the world: How 21st century GIS technologies are supporting the global fight against outbreaks and epidemics. Int. J. Health Geogr. 2020, 19, 8. [Google Scholar]
  77. Zhou, C.; Su, F.; Pei, T.; Zhang, A.; Du, Y.; Luo, B.; Cao, Z.; Wang, J.; Yuan, W.; Zhu, Y.; et al. COVID-19: Challenges to GIS with Big Data. Geogr. Sustain. 2020, 1, 77–87. [Google Scholar] [CrossRef]
  78. Mazimpaka, J.D.; Timpf, S. How They Move Reveals What Is Happening: Understanding the Dynamics of Big Events from Human Mobility Pattern. ISPRS Int. J. Geo-Inf. 2017, 6, 15. [Google Scholar] [CrossRef] [Green Version]
  79. Song, X.; Shibasaki, R.; Yuan, N.J.; Xie, X.; Li, T.; Adachi, R. DeepMob. ACM Trans. Inf. Syst. 2017, 35, 1–19. [Google Scholar] [CrossRef]
  80. Bogomolov, A.; Lepri, B.; Staiano, J.; Letouzé, E.; Oliver, N.; Pianesi, F.; Pentland, A. Moves on the Street: Classifying Crime Hotspots Using Aggregated Anonymized Data on People Dynamics. Big Data 2015, 3, 148–158. [Google Scholar] [CrossRef]
  81. Kadar, C.; Pletikosa, I. Mining large-scale human mobility data for long-term crime prediction. EPJ Data Sci. 2018, 7, 26. [Google Scholar] [CrossRef]
  82. Kong, X.; Liu, Y.; Wang, Y.; Tong, D.; Zhang, J. Investigating Public Facility Characteristics from a Spatial Interaction Perspective: A Case Study of Beijing Hospitals Using Taxi Data. ISPRS Int. J. Geo-Inf. 2017, 6, 38. [Google Scholar] [CrossRef]
  83. Giordani, I.; Archetti, F.; Candelieri, A. Data Science and Environmental Management in Smart Cities. Environ. Eng. Manag. J. 2015, 14, 2095–2102. [Google Scholar] [CrossRef]
  84. Ardanuy, J.F.; Castano-Solis, S.; Álvaro-Hermana, R.; Merino, J.; Castillo, Á. Using mobility information to perform a feasibility study and the evaluation of spatio-temporal energy demanded by an electric taxi fleet. Energy Convers. Manag. 2018, 157, 59–70. [Google Scholar] [CrossRef] [Green Version]
  85. Guo, Q.; Karimi, H.A. A novel methodology for prediction of spatial-temporal activities using latent features. Comput. Environ. Urban Syst. 2017, 62, 74–85. [Google Scholar] [CrossRef]
  86. Lu, S.; Fang, Z.; Zhang, X.; Shaw, S.-L.; Yin, L.; Zhao, Z.; Yang, X. Understanding the Representativeness of Mobile Phone Location Data in Characterizing Human Mobility Indicators. ISPRS Int. J. Geo-Inf. 2017, 6, 7. [Google Scholar] [CrossRef] [Green Version]
  87. Arai, A.; Fan, Z.; Matekenya, D.; Shibasaki, R. Comparative Perspective of Human Behavior Patterns to Uncover Ownership Bias among Mobile Phone Users. ISPRS Int. J. Geo-Inf. 2016, 5, 85. [Google Scholar] [CrossRef] [Green Version]
  88. Wang, F.; Chen, C. On data processing required to derive mobility patterns from passively-generated mobile phone data. Transp. Res. Part C: Emerg. Technol. 2018, 87, 58–74. [Google Scholar] [CrossRef] [PubMed]
  89. Devkota, B.; Miyazaki, H.; Witayangkurn, A.; Kim, S.M. Using Volunteered Geographic Information and Nighttime Light Remote Sensing Data to Identify Tourism Areas of Interest. Sustainability 2019, 11, 4718. [Google Scholar] [CrossRef] [Green Version]
  90. Fan, Z.; Song, X.; Jiang, R.; Chen, Q.; Shibasaki, R. Decentralized Attention-based Personalized Human Mobility Prediction. Proc. ACM Interact. Mob. Wearable Ubiquitous Technol. 2019, 3, 1–26. [Google Scholar] [CrossRef]
  91. Cugurullo, F. Exposing smart cities and eco-cities: Frankenstein urbanism and the sustainability challenges of the experimental city. Environ. Plan. A: Econ. Space 2018, 50, 73–92. [Google Scholar] [CrossRef]
  92. Li, T.; Sun, D.; Jing, P.; Yang, K. Smart Card Data Mining of Public Transport Destination: A Literature Review. Information 2018, 9, 18. [Google Scholar] [CrossRef] [Green Version]
Figure 1. The framework for linking big data human mobility research with city-level smart city policy.
Ijgi 10 00013 g001
Figure 2. Hierarchy of research by objective (data requirement and method).
Ijgi 10 00013 g002
Figure 3. The role of research in linking big data and smart city policy.
Ijgi 10 00013 g003
Table 1. The applications of “human mobility” research using big data.
Data SourceMobile PhoneMass MediaTaxi and CarBank CardMetro CardWebsiteMulti- Source Data
Research Objective
Discover the phenomenonhuman mobility patternconvergence and divergence pattern, accessibilityspatial-temporal pathmobility pattern, crashesmobility patternstravel pattern along railwaymobility pattern
space featureactivity pattern, land use pattern, street, green space usage, traffic conditionheat mapscongestion patternspatiotemporal structure, spatial pattern
Identify the differencespopulation clusteringcentral behaviour, collaborative behaviour, clustering by personality, distance, demographic feature, use feature, transport modemicro-populations clustered by demographic feature or by personalitydriver/passenger behaviour clustered by trip purpose or patternsocial bridge, human consumption patternrhythms of urban life
space clarificationJob–housing balance, locational uncertaintytourism market segmentationinteraction parcelscity abilityvibrant areas, station functions, urban formthe effectiveness of growth boundary
Explain the differencesdynamics of human behaviour in space usagesocial ecology, social and economic activity, human-interest, deep knowledge, cyberspace and physical space relationcultural mechanismmigration effectmobility features and app usage behaviour
Imply to city managementfor quality of lifehealth-disease, health-air quality, crime predictionhealth-disease, crime predictionpublic facilityactivity pattern and predictioncollective travel time
for resource useinfrastructuretouristic potentialbus route plan, electric cabsenvironmental management, transport system
Count (excluding COVID-19 research)843912144627
COVID-19 and human mobilitybehavioural change, forecast of epidemic risk, impacts of mobility restriction---factors of pandemic transmission, forecast of epidemic risk, control measures, impacts of mobility restriction
factors of pandemic transmission, control measurespost-pandemic economic recovery
Count (COVID-19 research)40204000115
Table 2. Enquiries sent to departments of Hong Kong (HK).
DepartmentQuestion
Transport Department (TD)1. About Route Planning of Public Transport
2. About Big Event Transportation Management
3. About Taxi Dispatching
4. About Vehicle Crash Analysis
Hong Kong Police Force (HKPF)5. About Crime Prediction
Department of Health (HD)6. About Disease Control
Environmental Protection Department (EPD)7. About Air Pollution Exposure
8. About Electric Vehicle Adoption
Hong Kong Tourism Board (HKTB)9. About Tourism Behaviour
10. About Market Segmentation
11. About Old Town Heritage Tourism
Planning Department (PD)12. About Land Use Function
Publisher’s Note: MDPI stays neutral with regard to jurisdictional claims in published maps and institutional affiliations.

