Traffic Inequality and Relations in Maritime Silk Road: A Network Flow Analysis

 , ,
, ,  , , ,
, , ,
Abstract
:1. Introduction
2. Literature Review
2.1. Traffic Inequality
2.2. Traffic Relations and Status
3. Materials and Methods
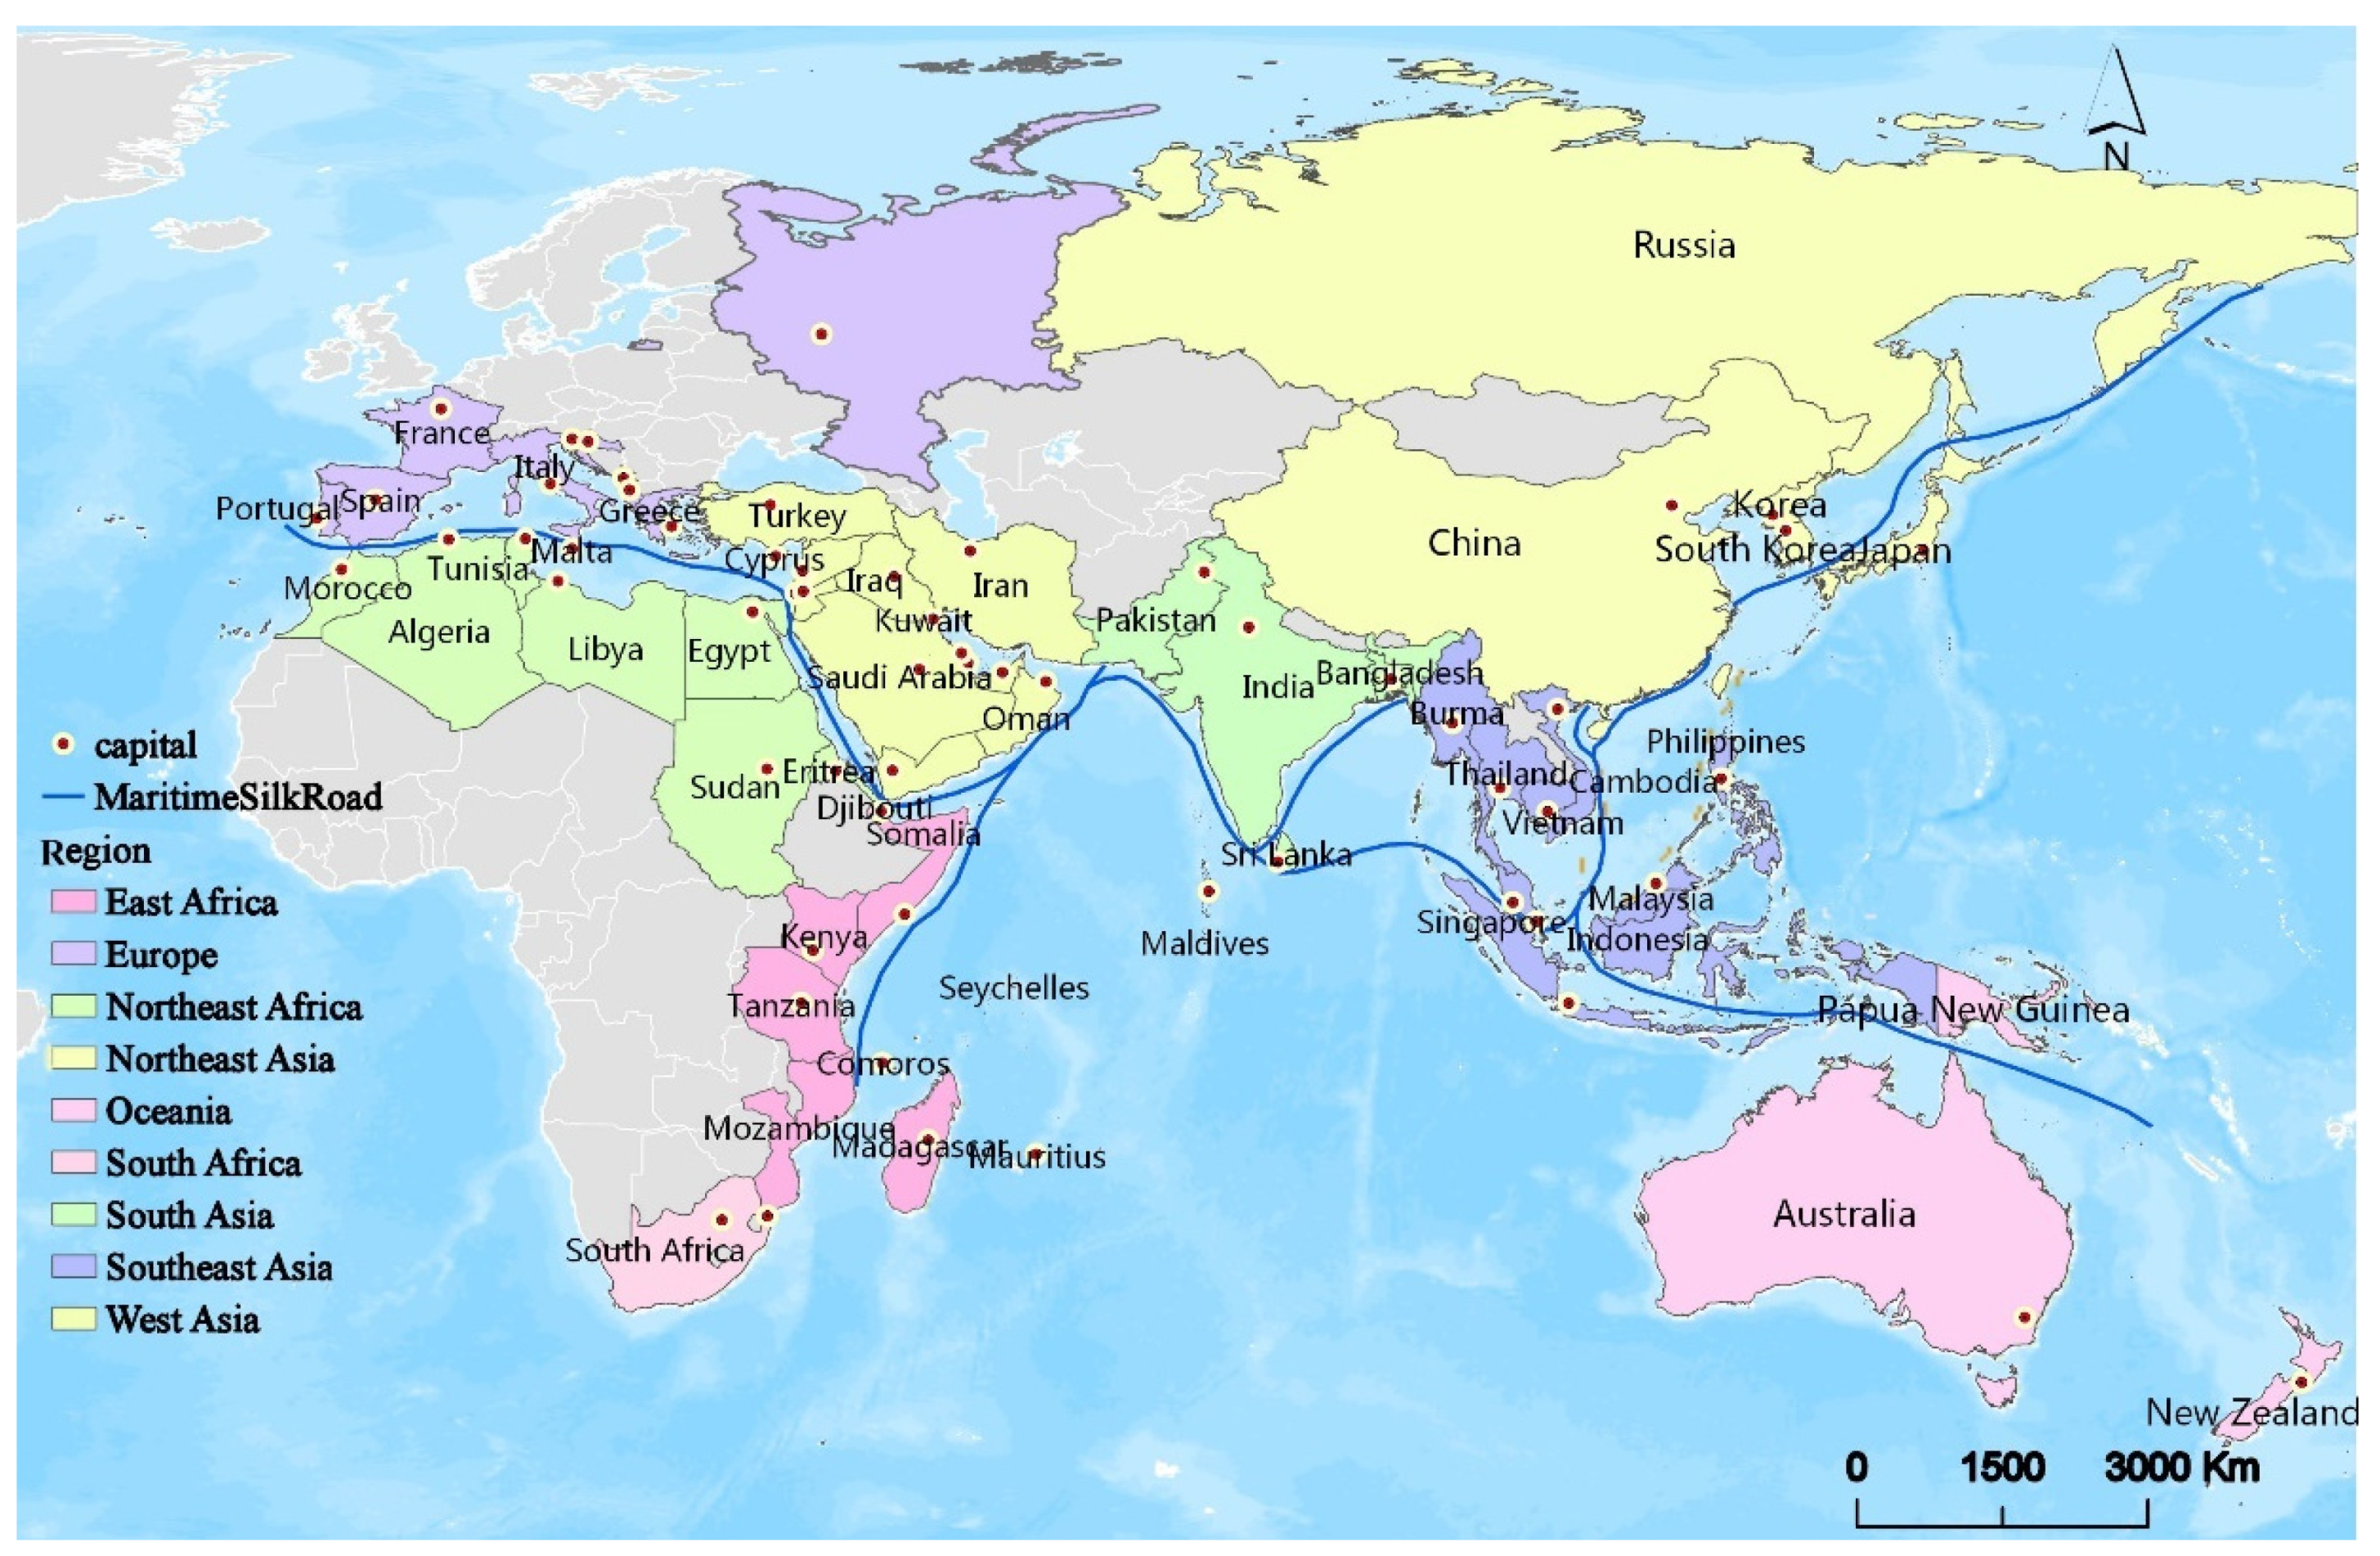
3.1. Study Area
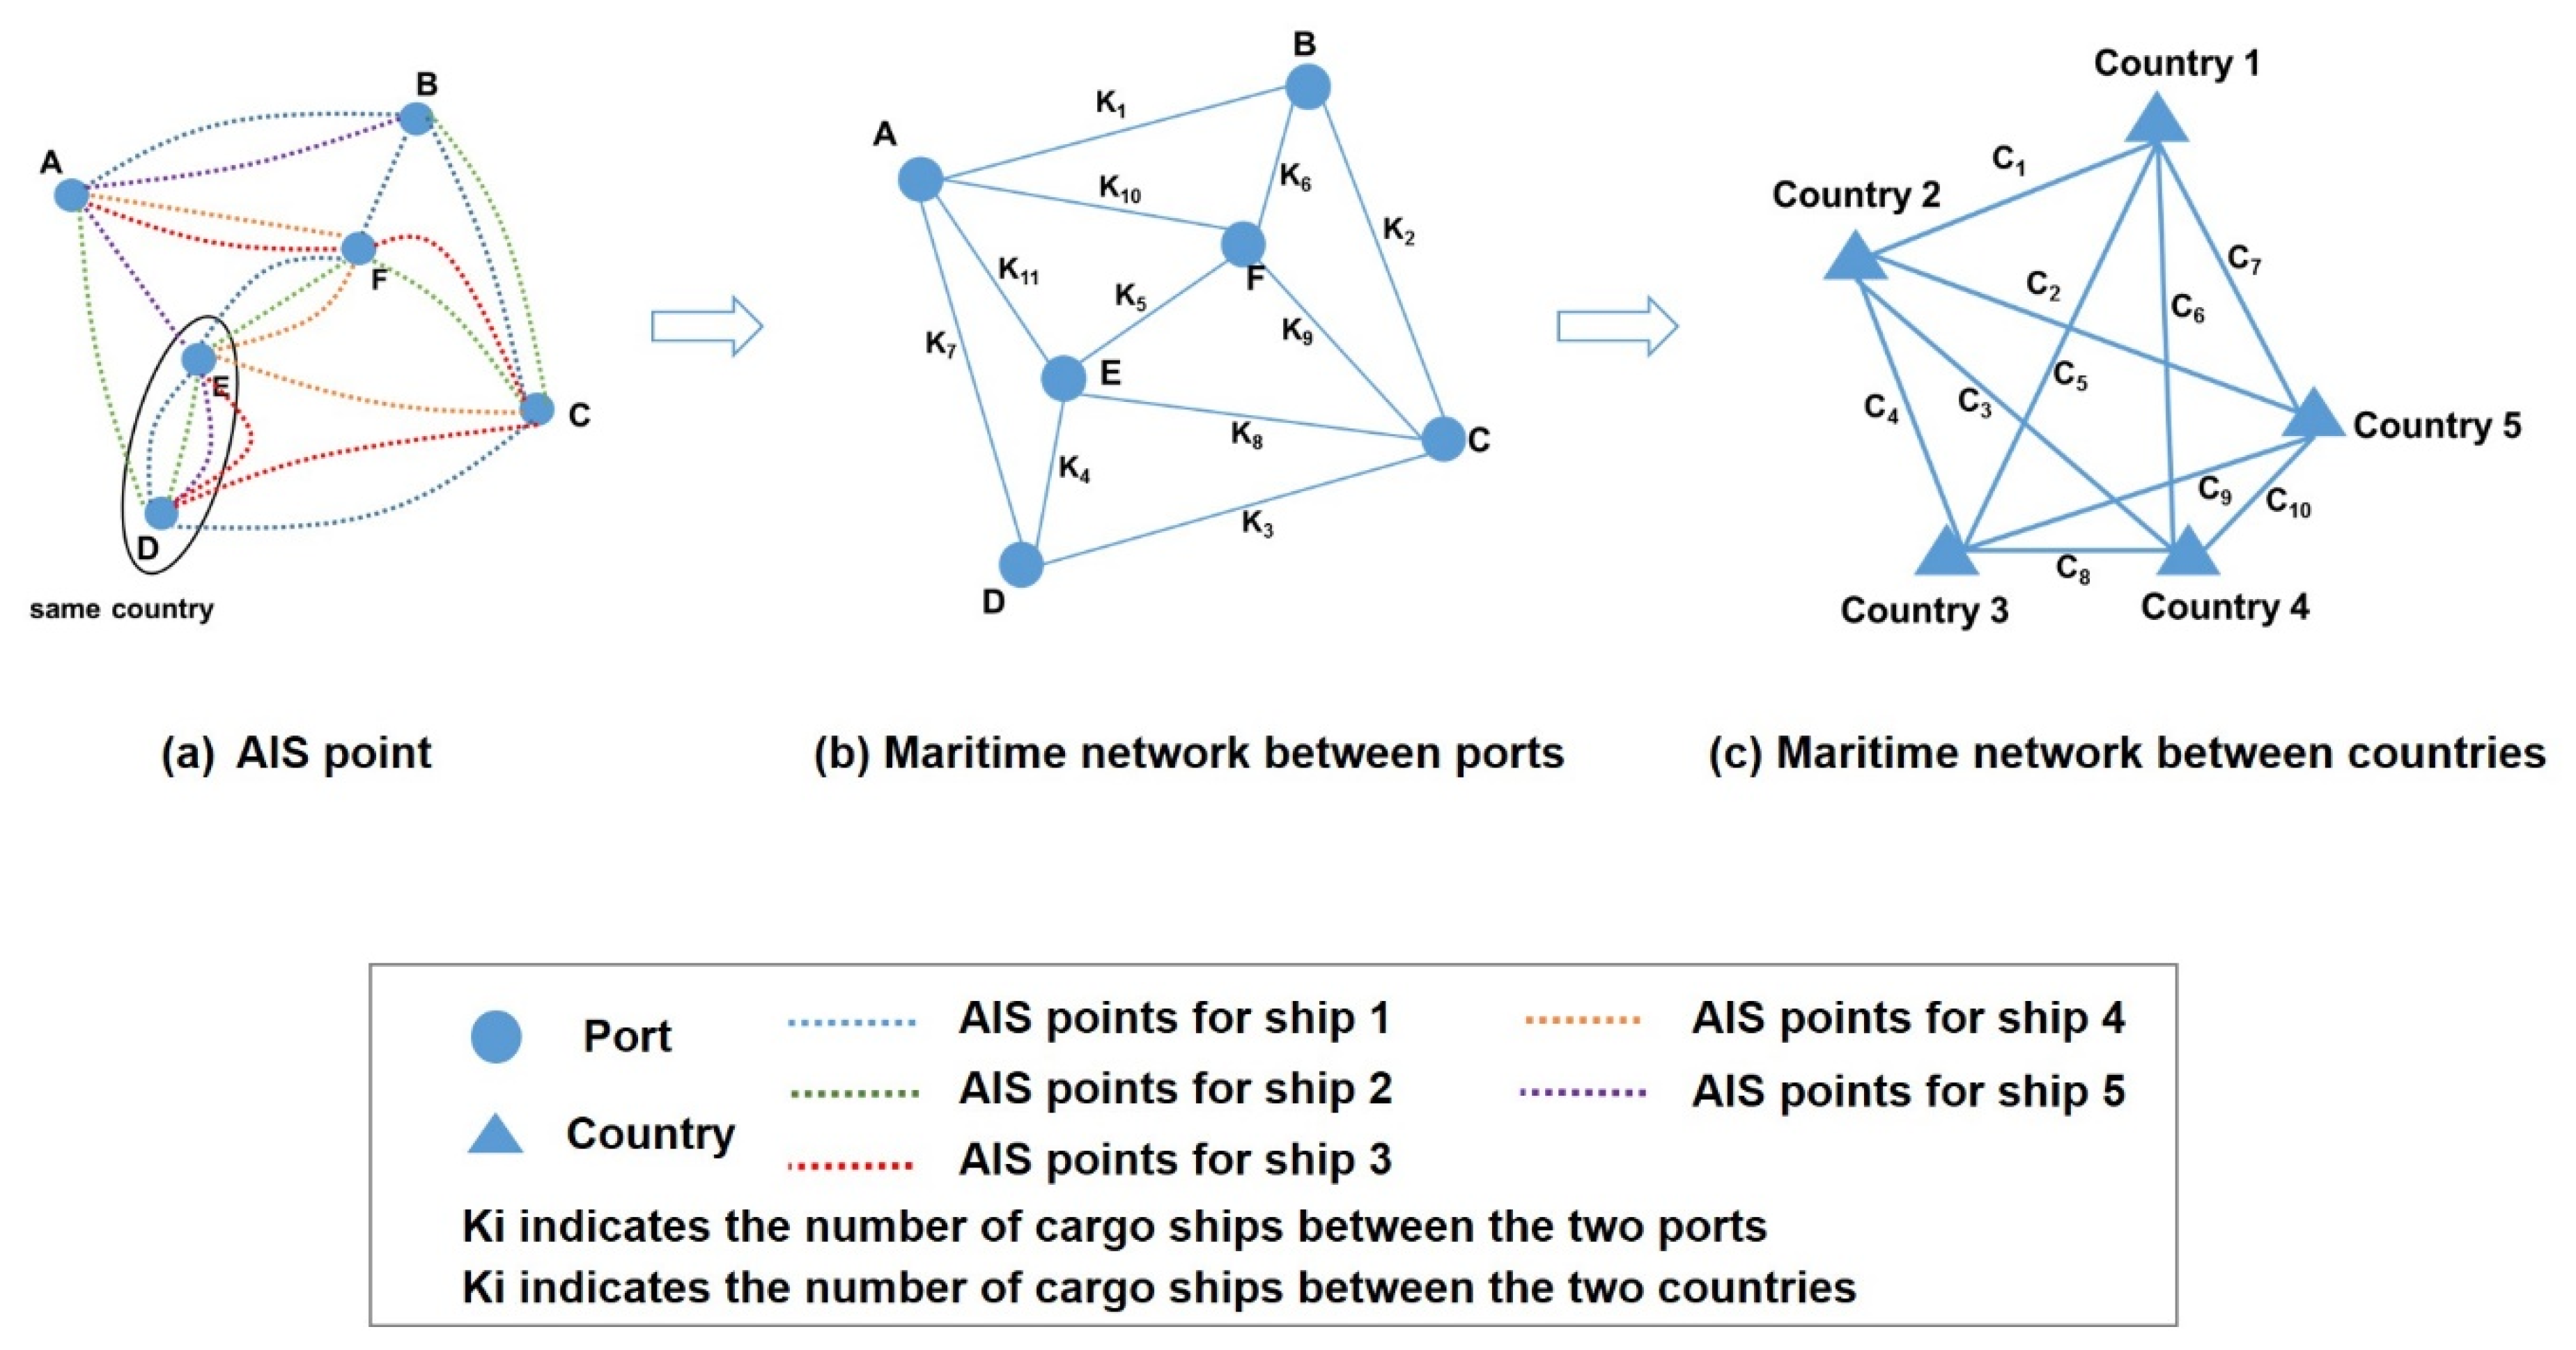
3.2. Data
3.3. Research Method
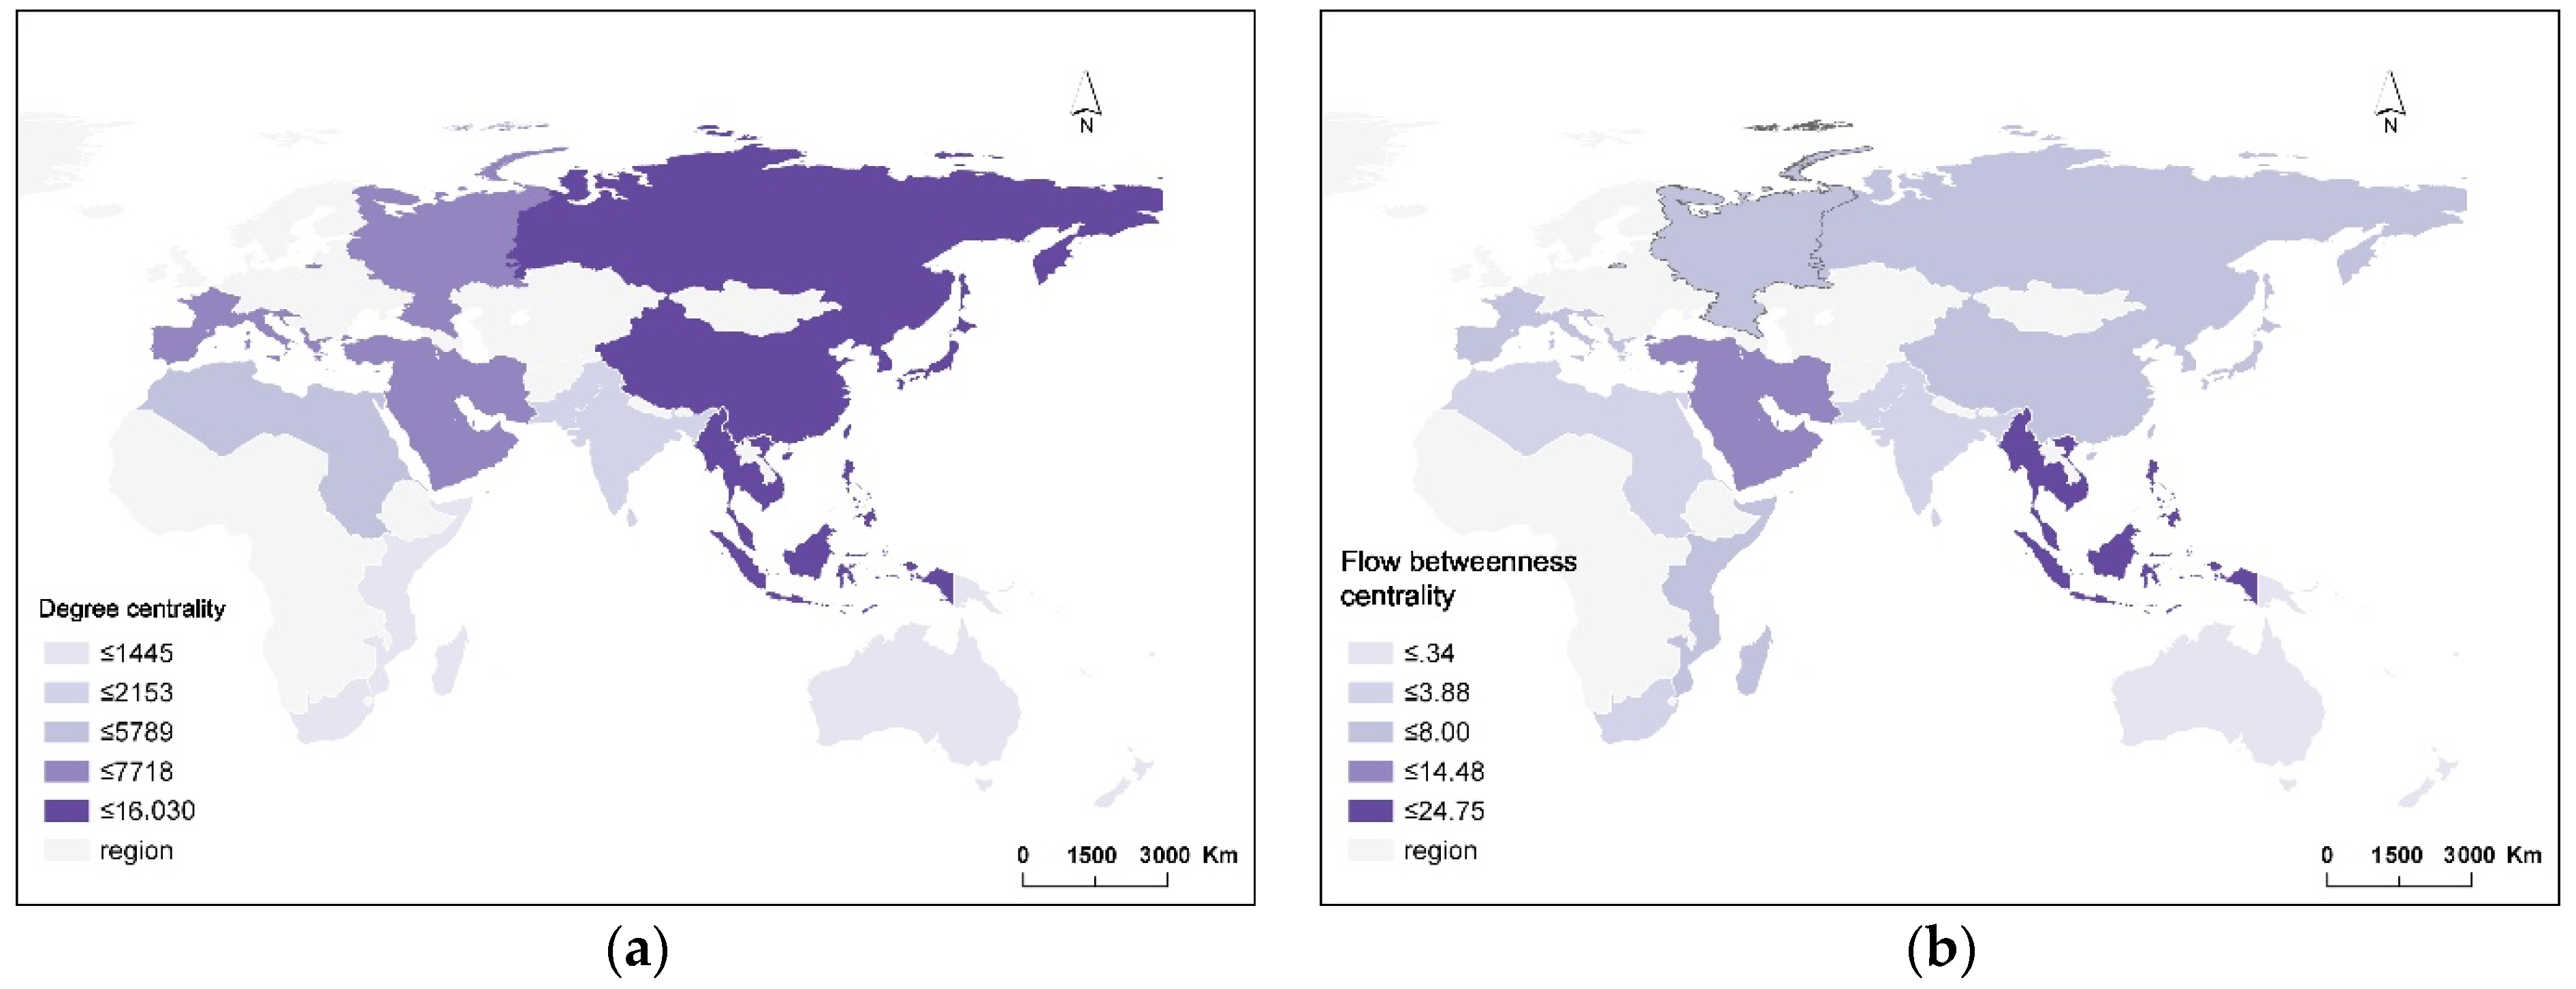
3.3.1. Degree
3.3.2. Social Network Analysis
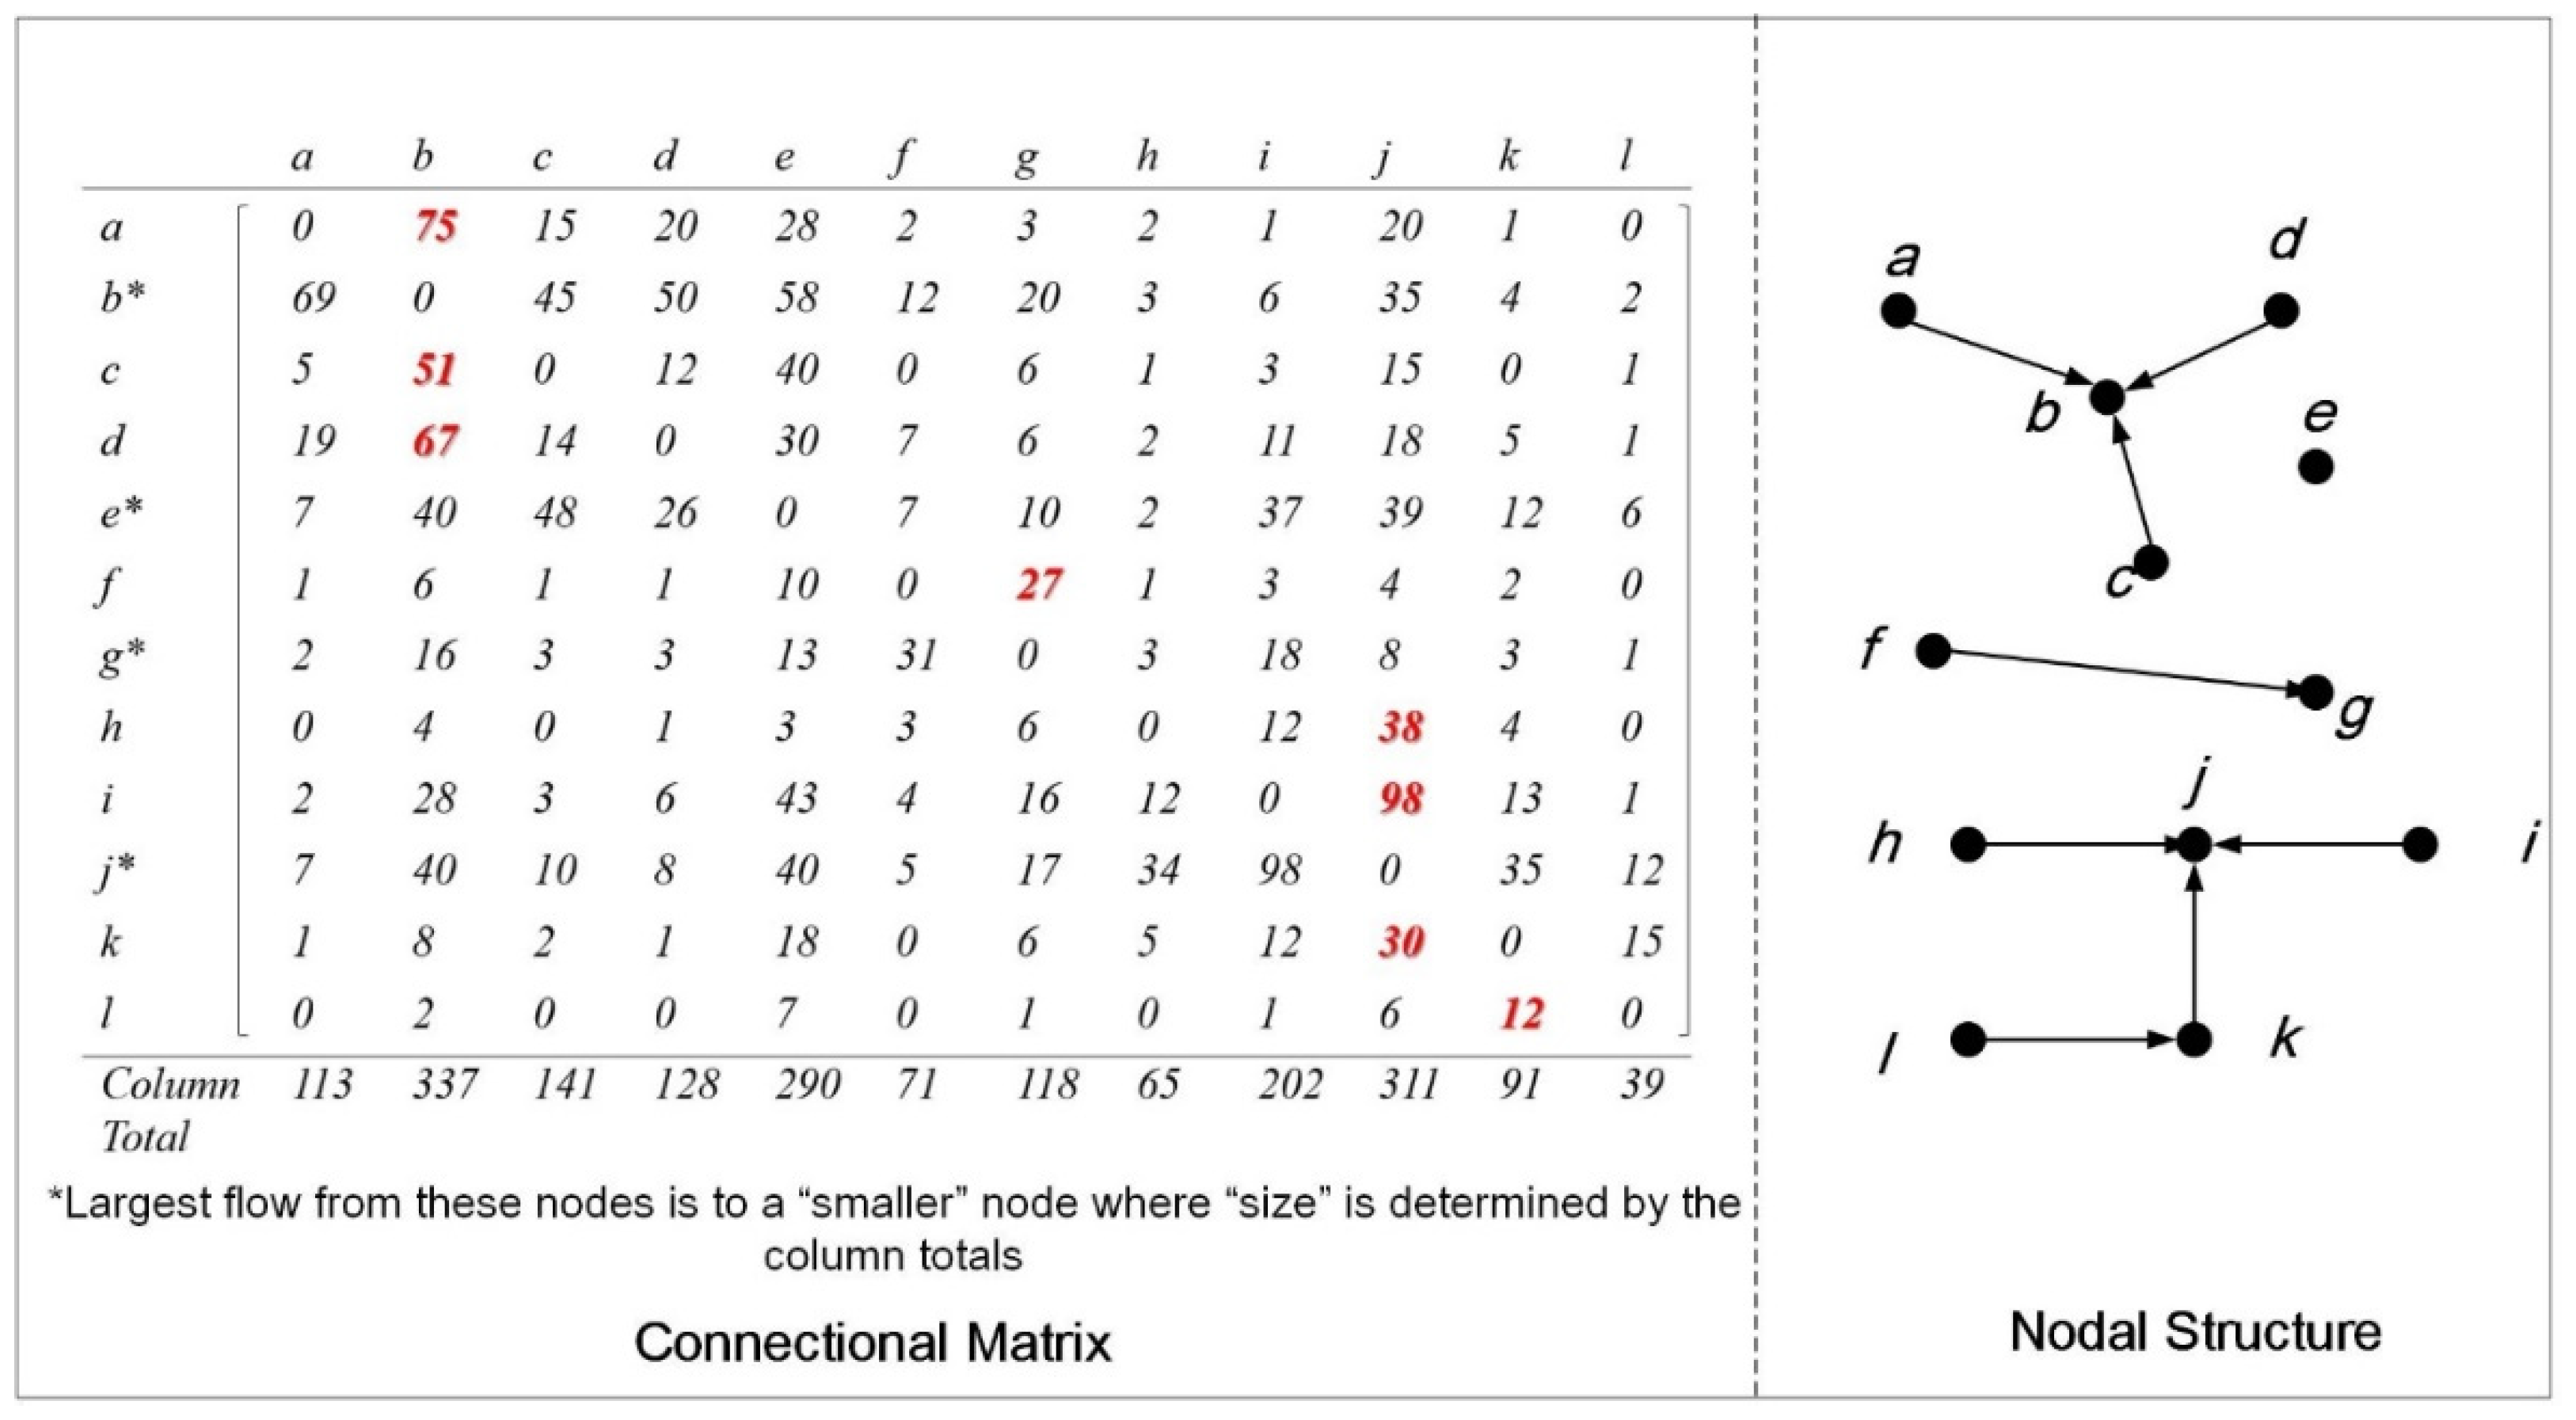
3.3.3. Primary Linkage Analysis
3.3.4. Traffic Sharing Ratio
3.3.5. Multiple Linkage Analysis
- (1)
- Traffic flow movement and network relations
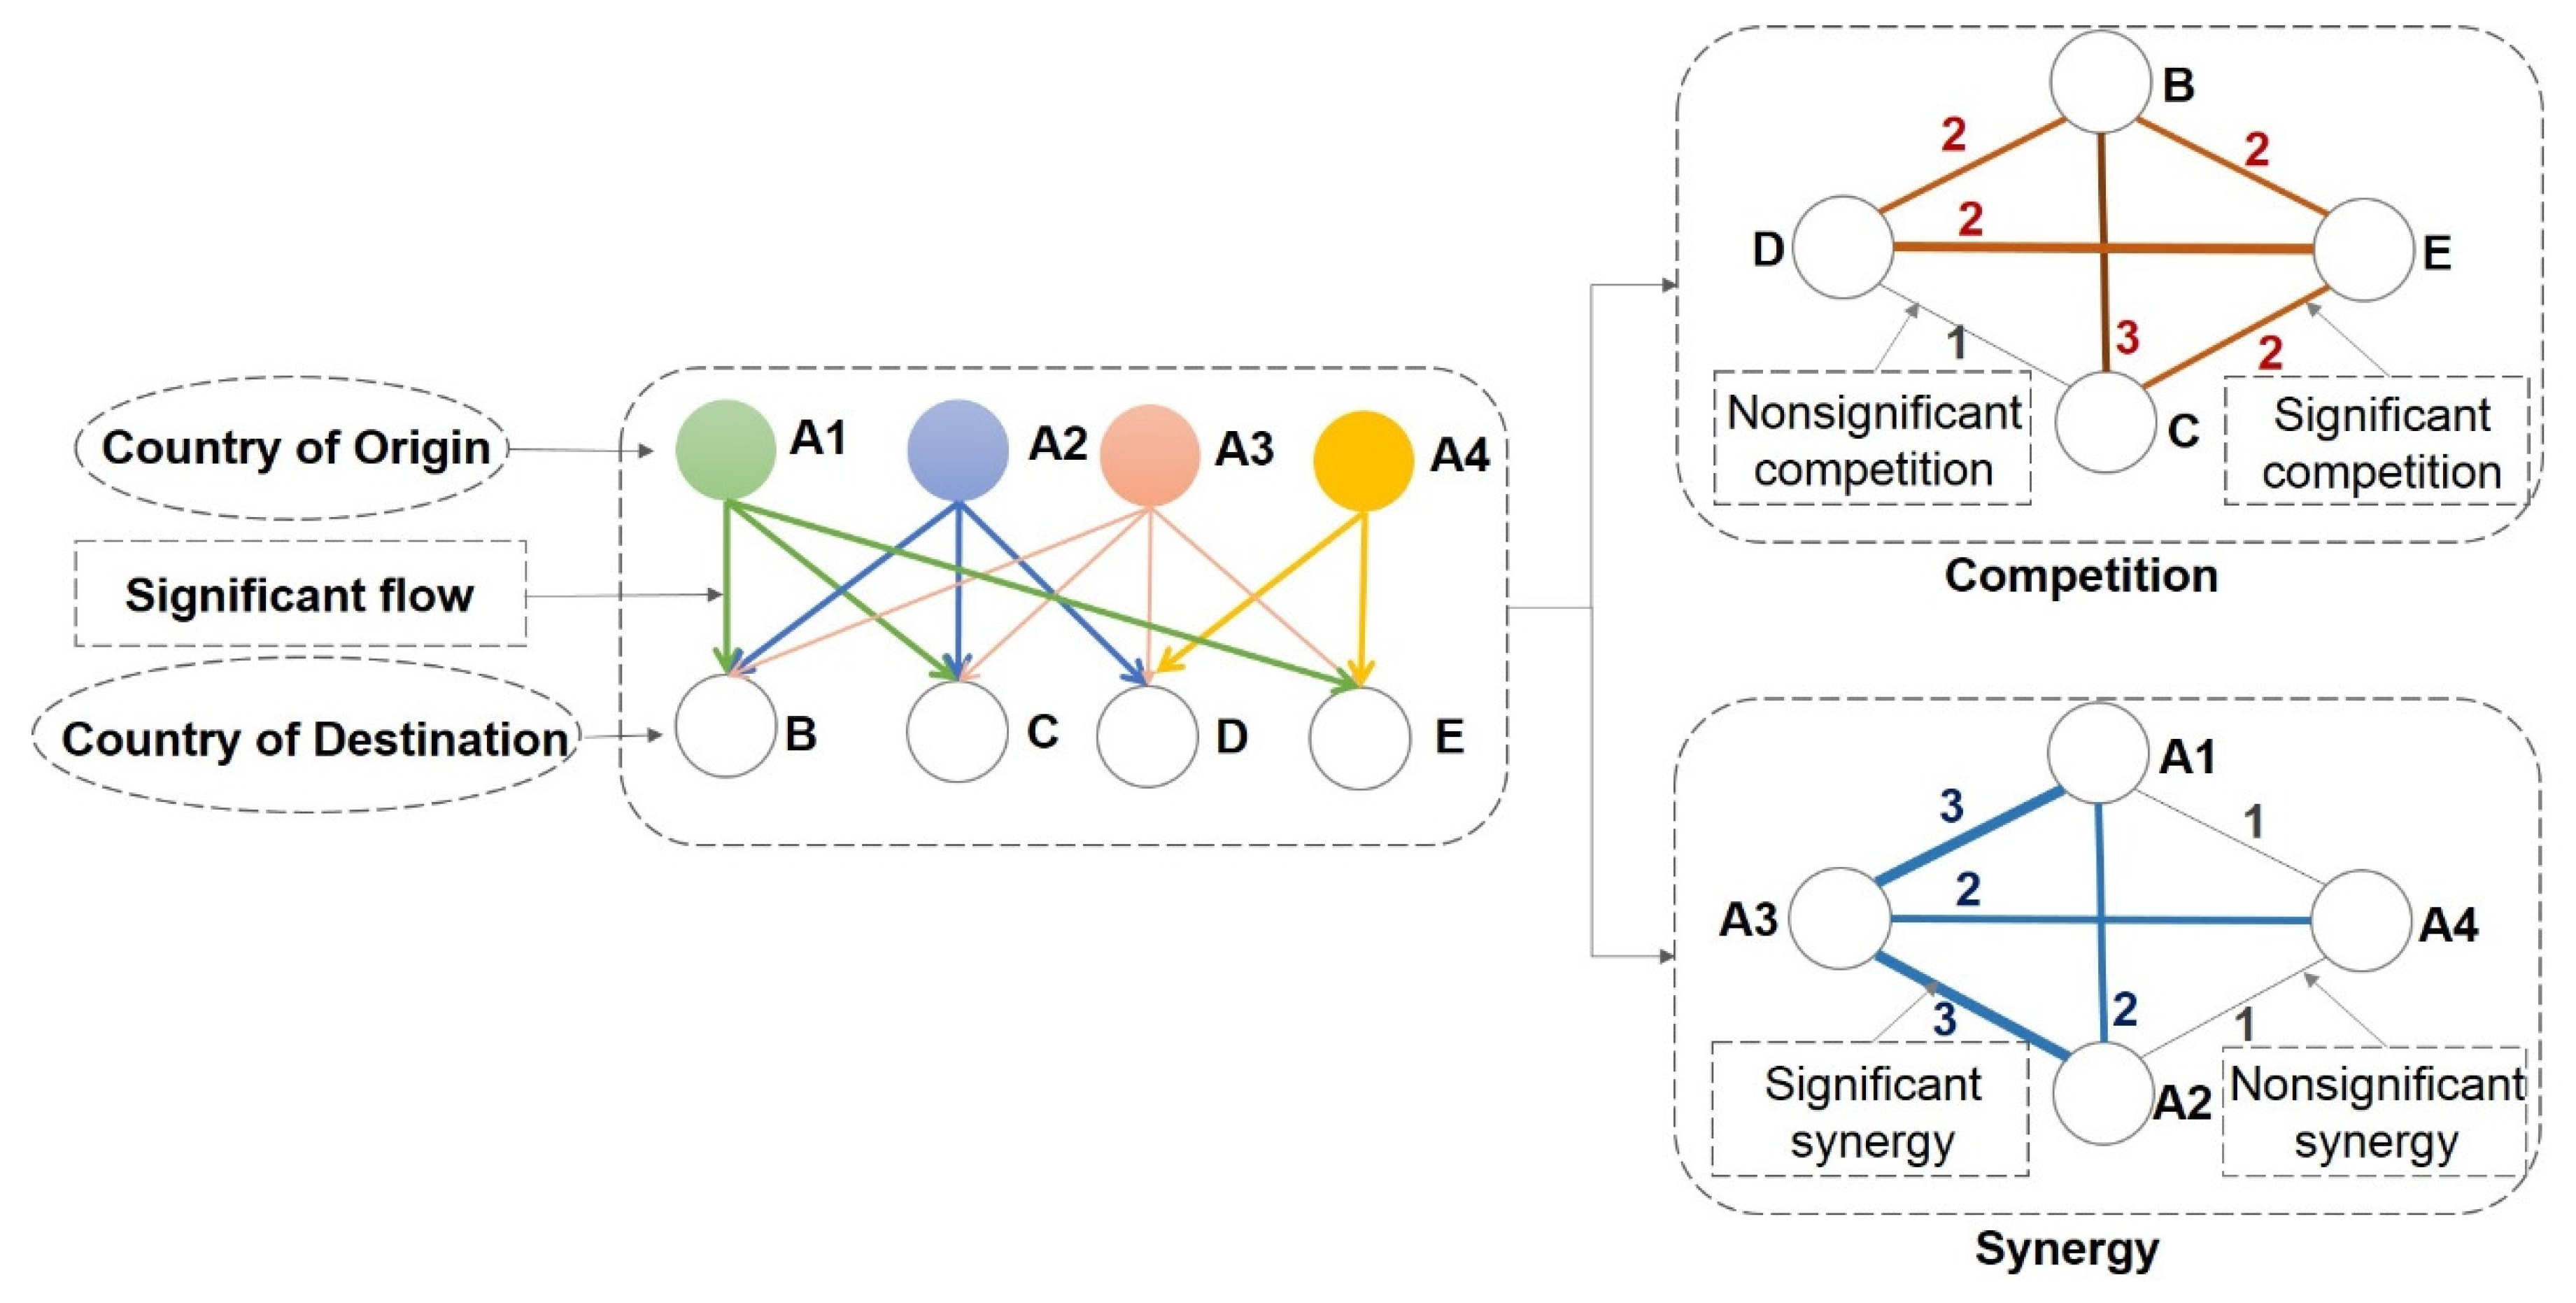
- (2)
- Competition–synergy model
4. Results
4.1. Traffic Inequality Analysis
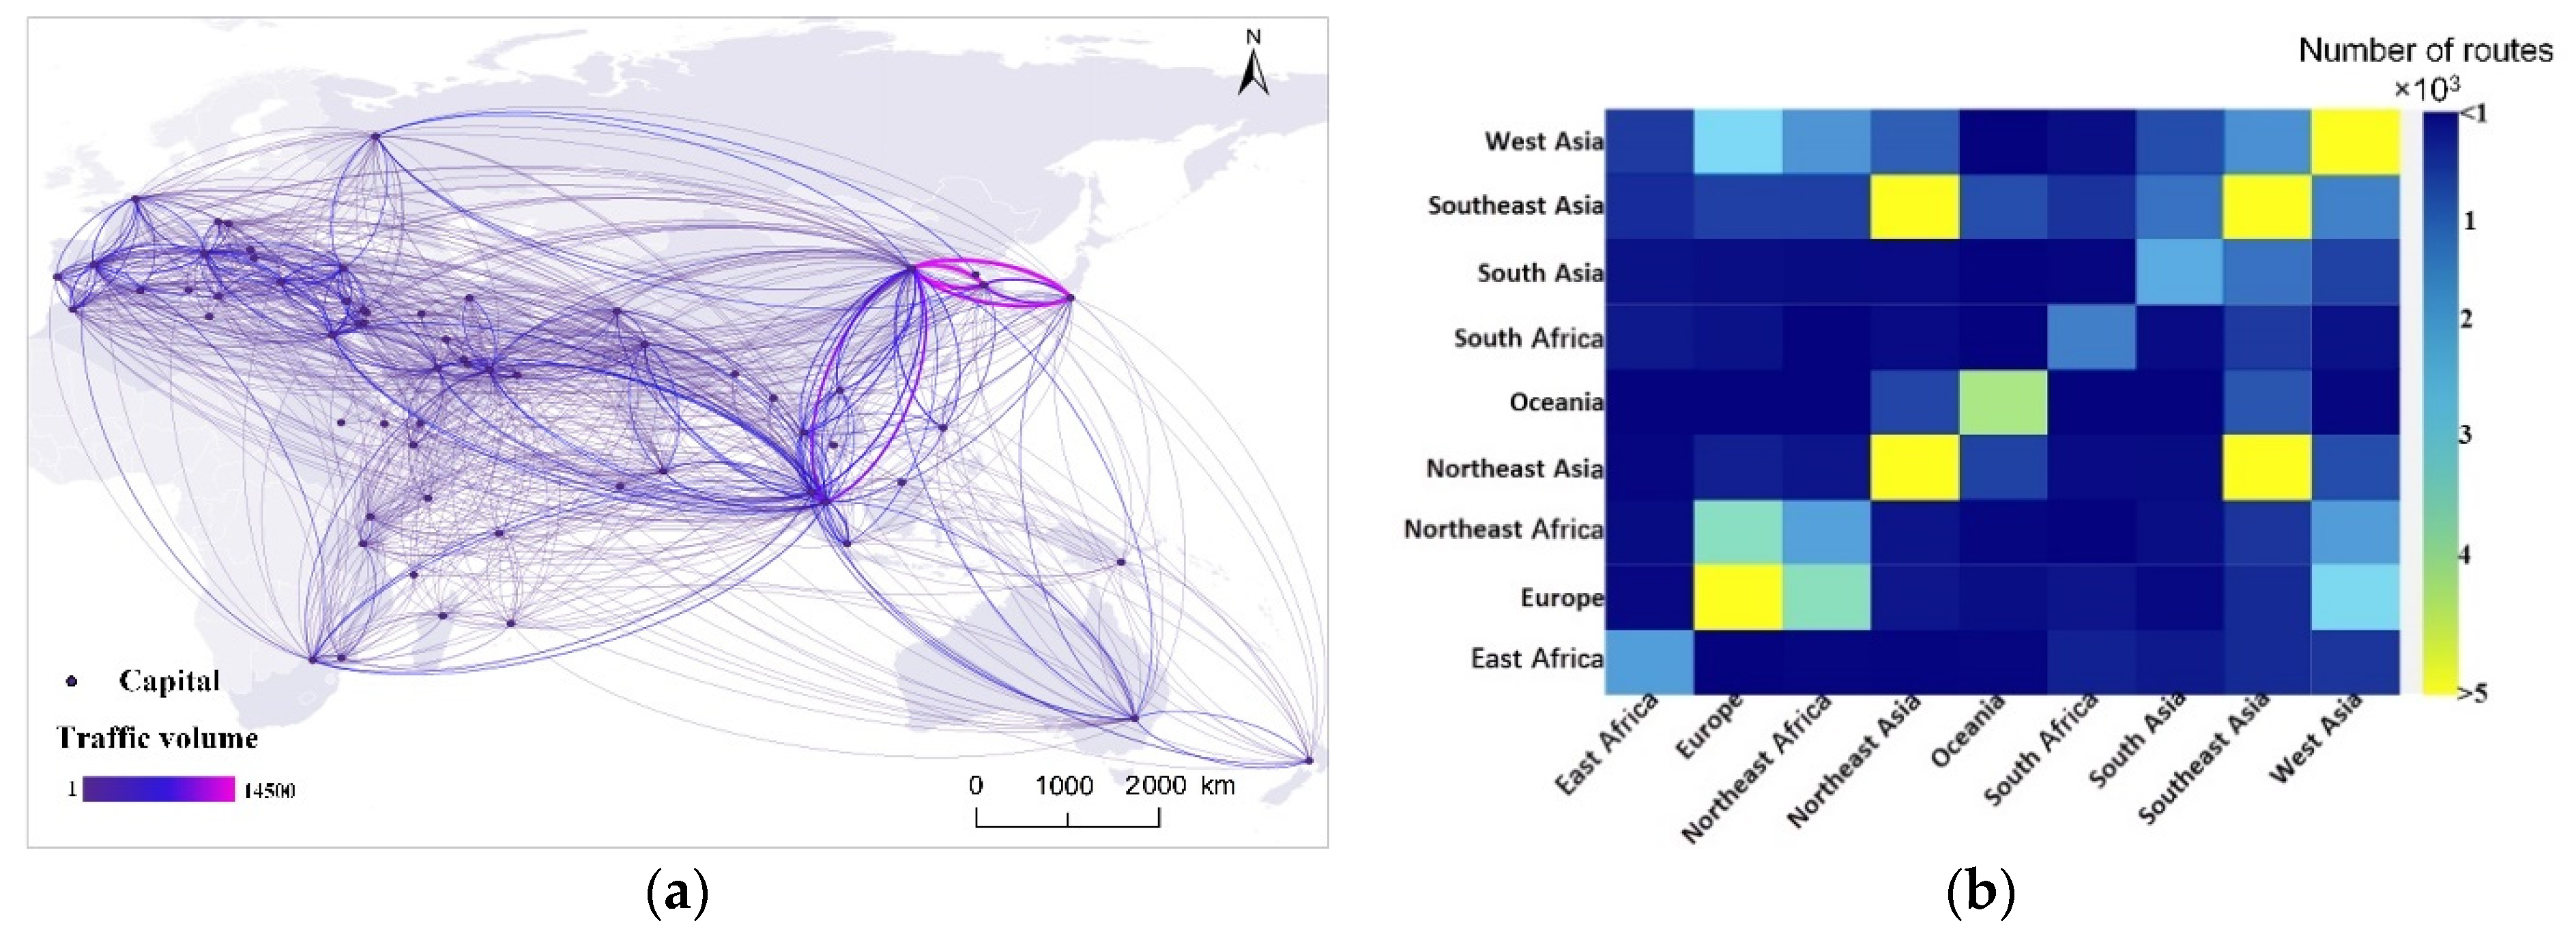
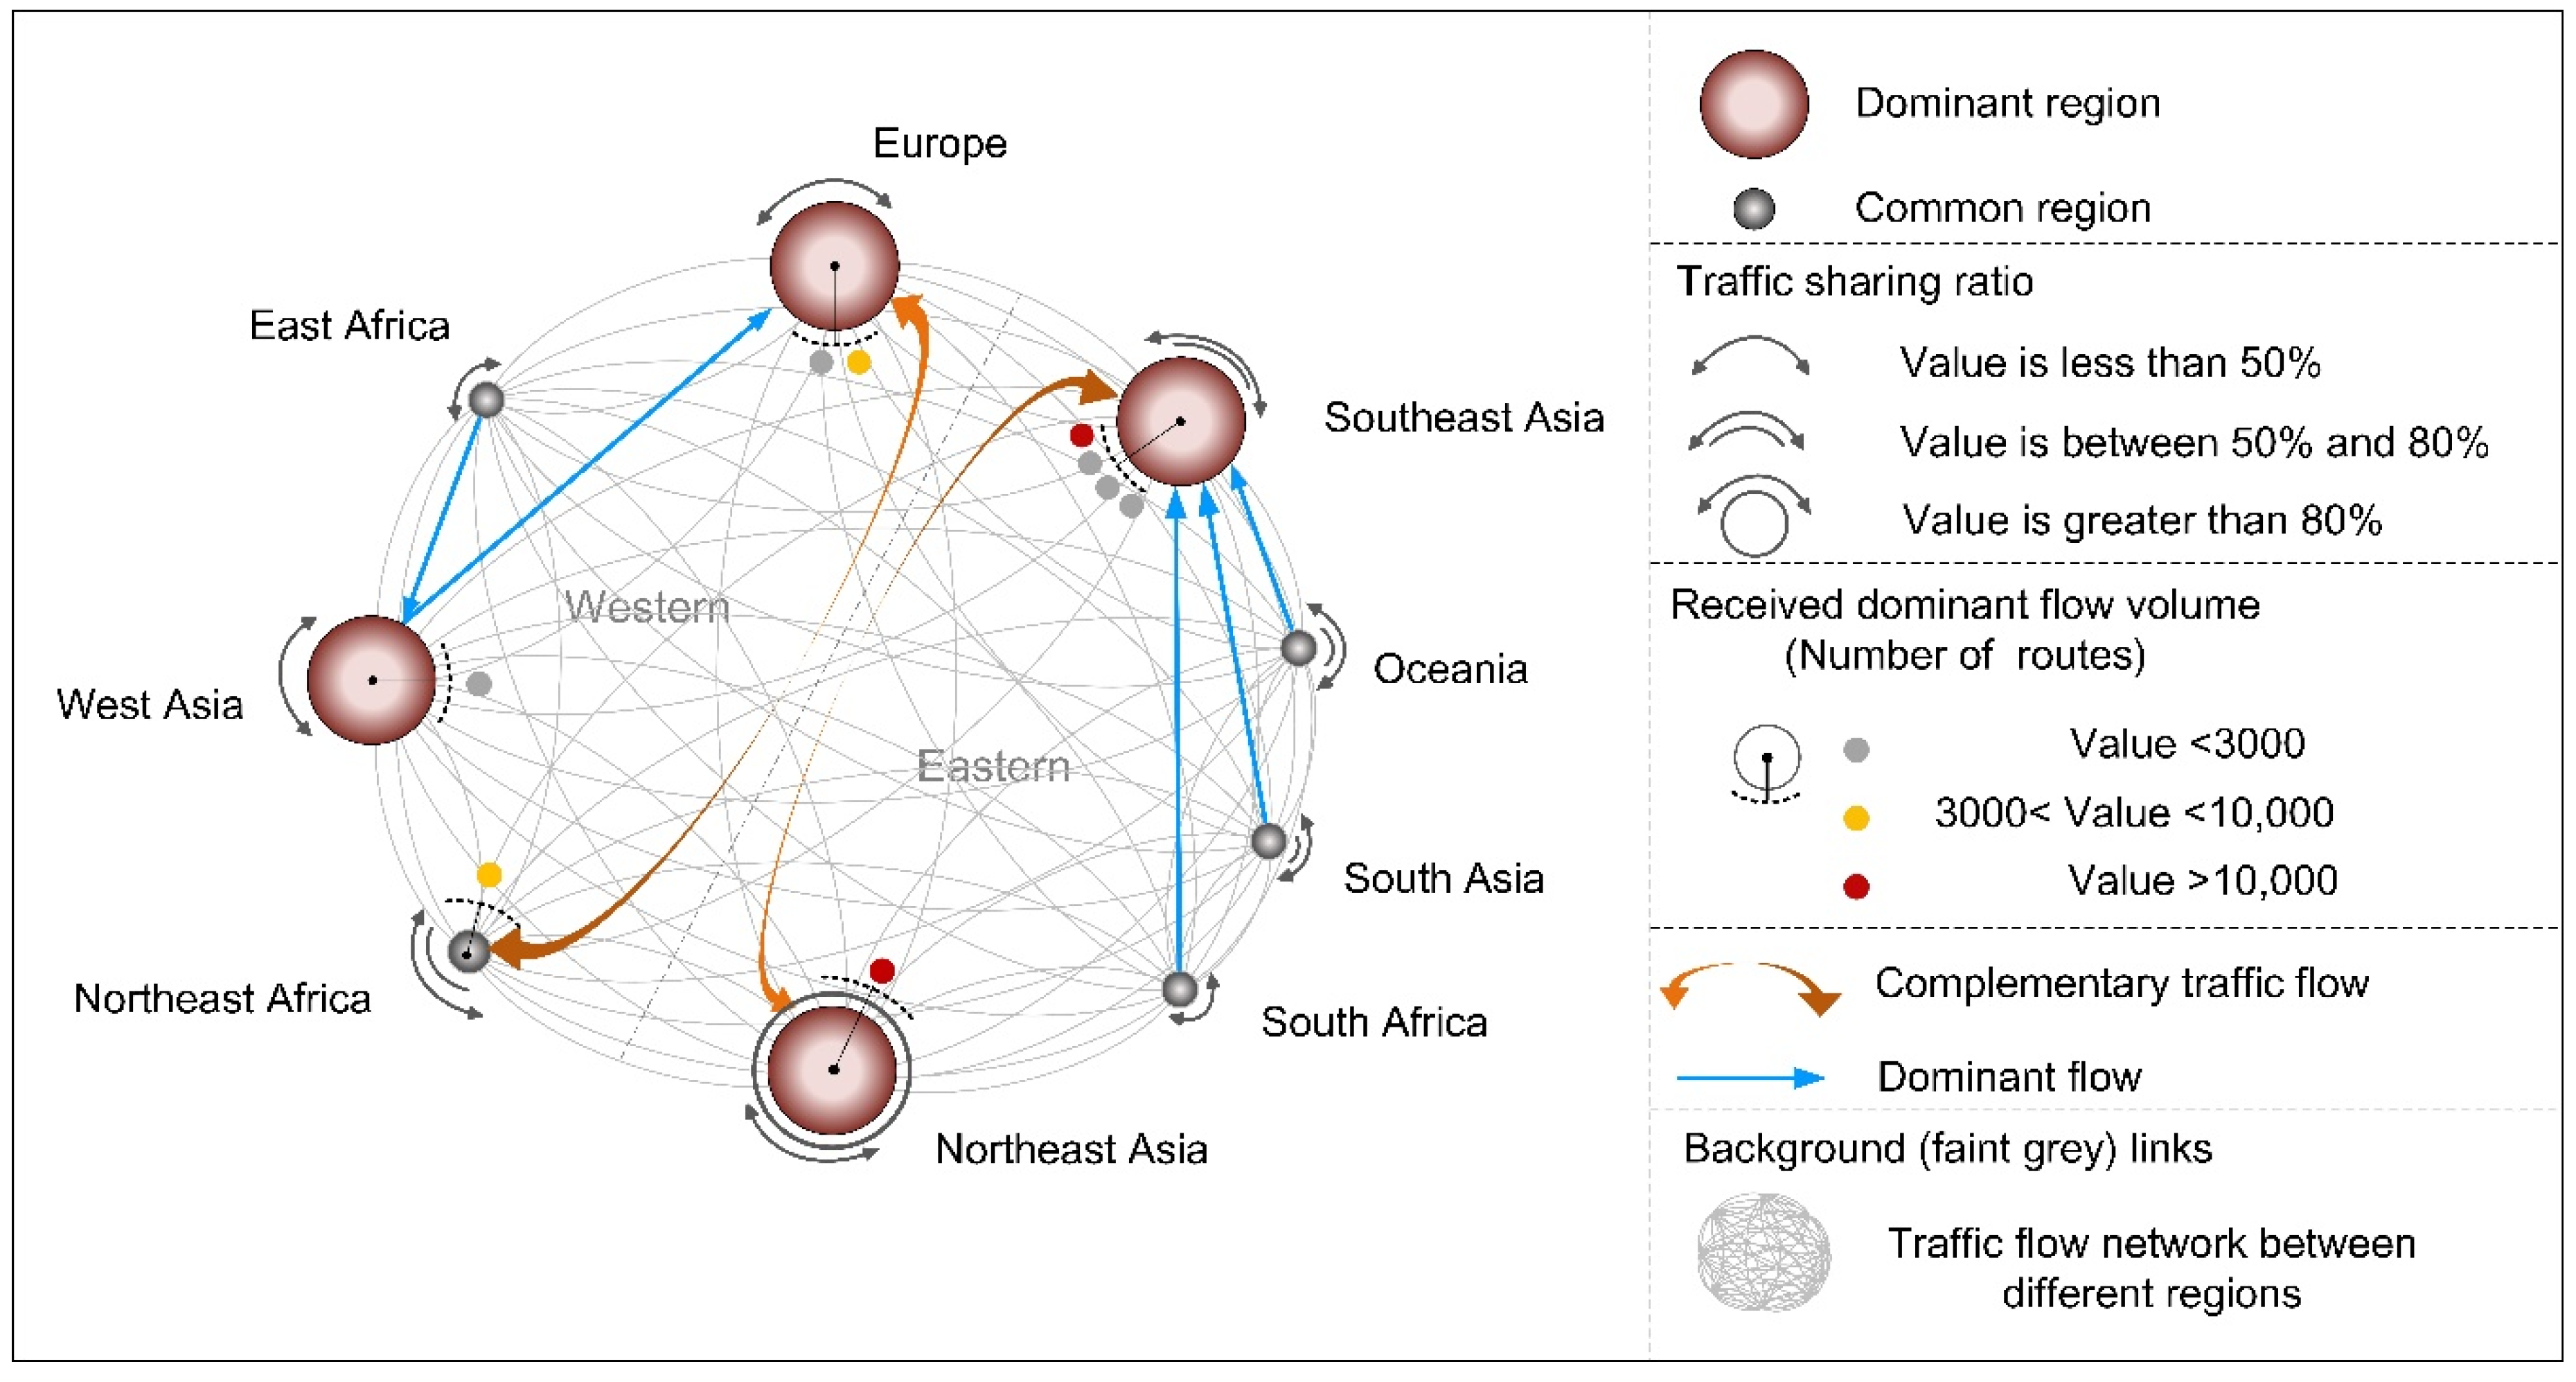
4.1.1. Spatial Distribution of Traffic Flow
4.1.2. Regional Dominant Role Analysis
4.2. Traffic Relations Analysis
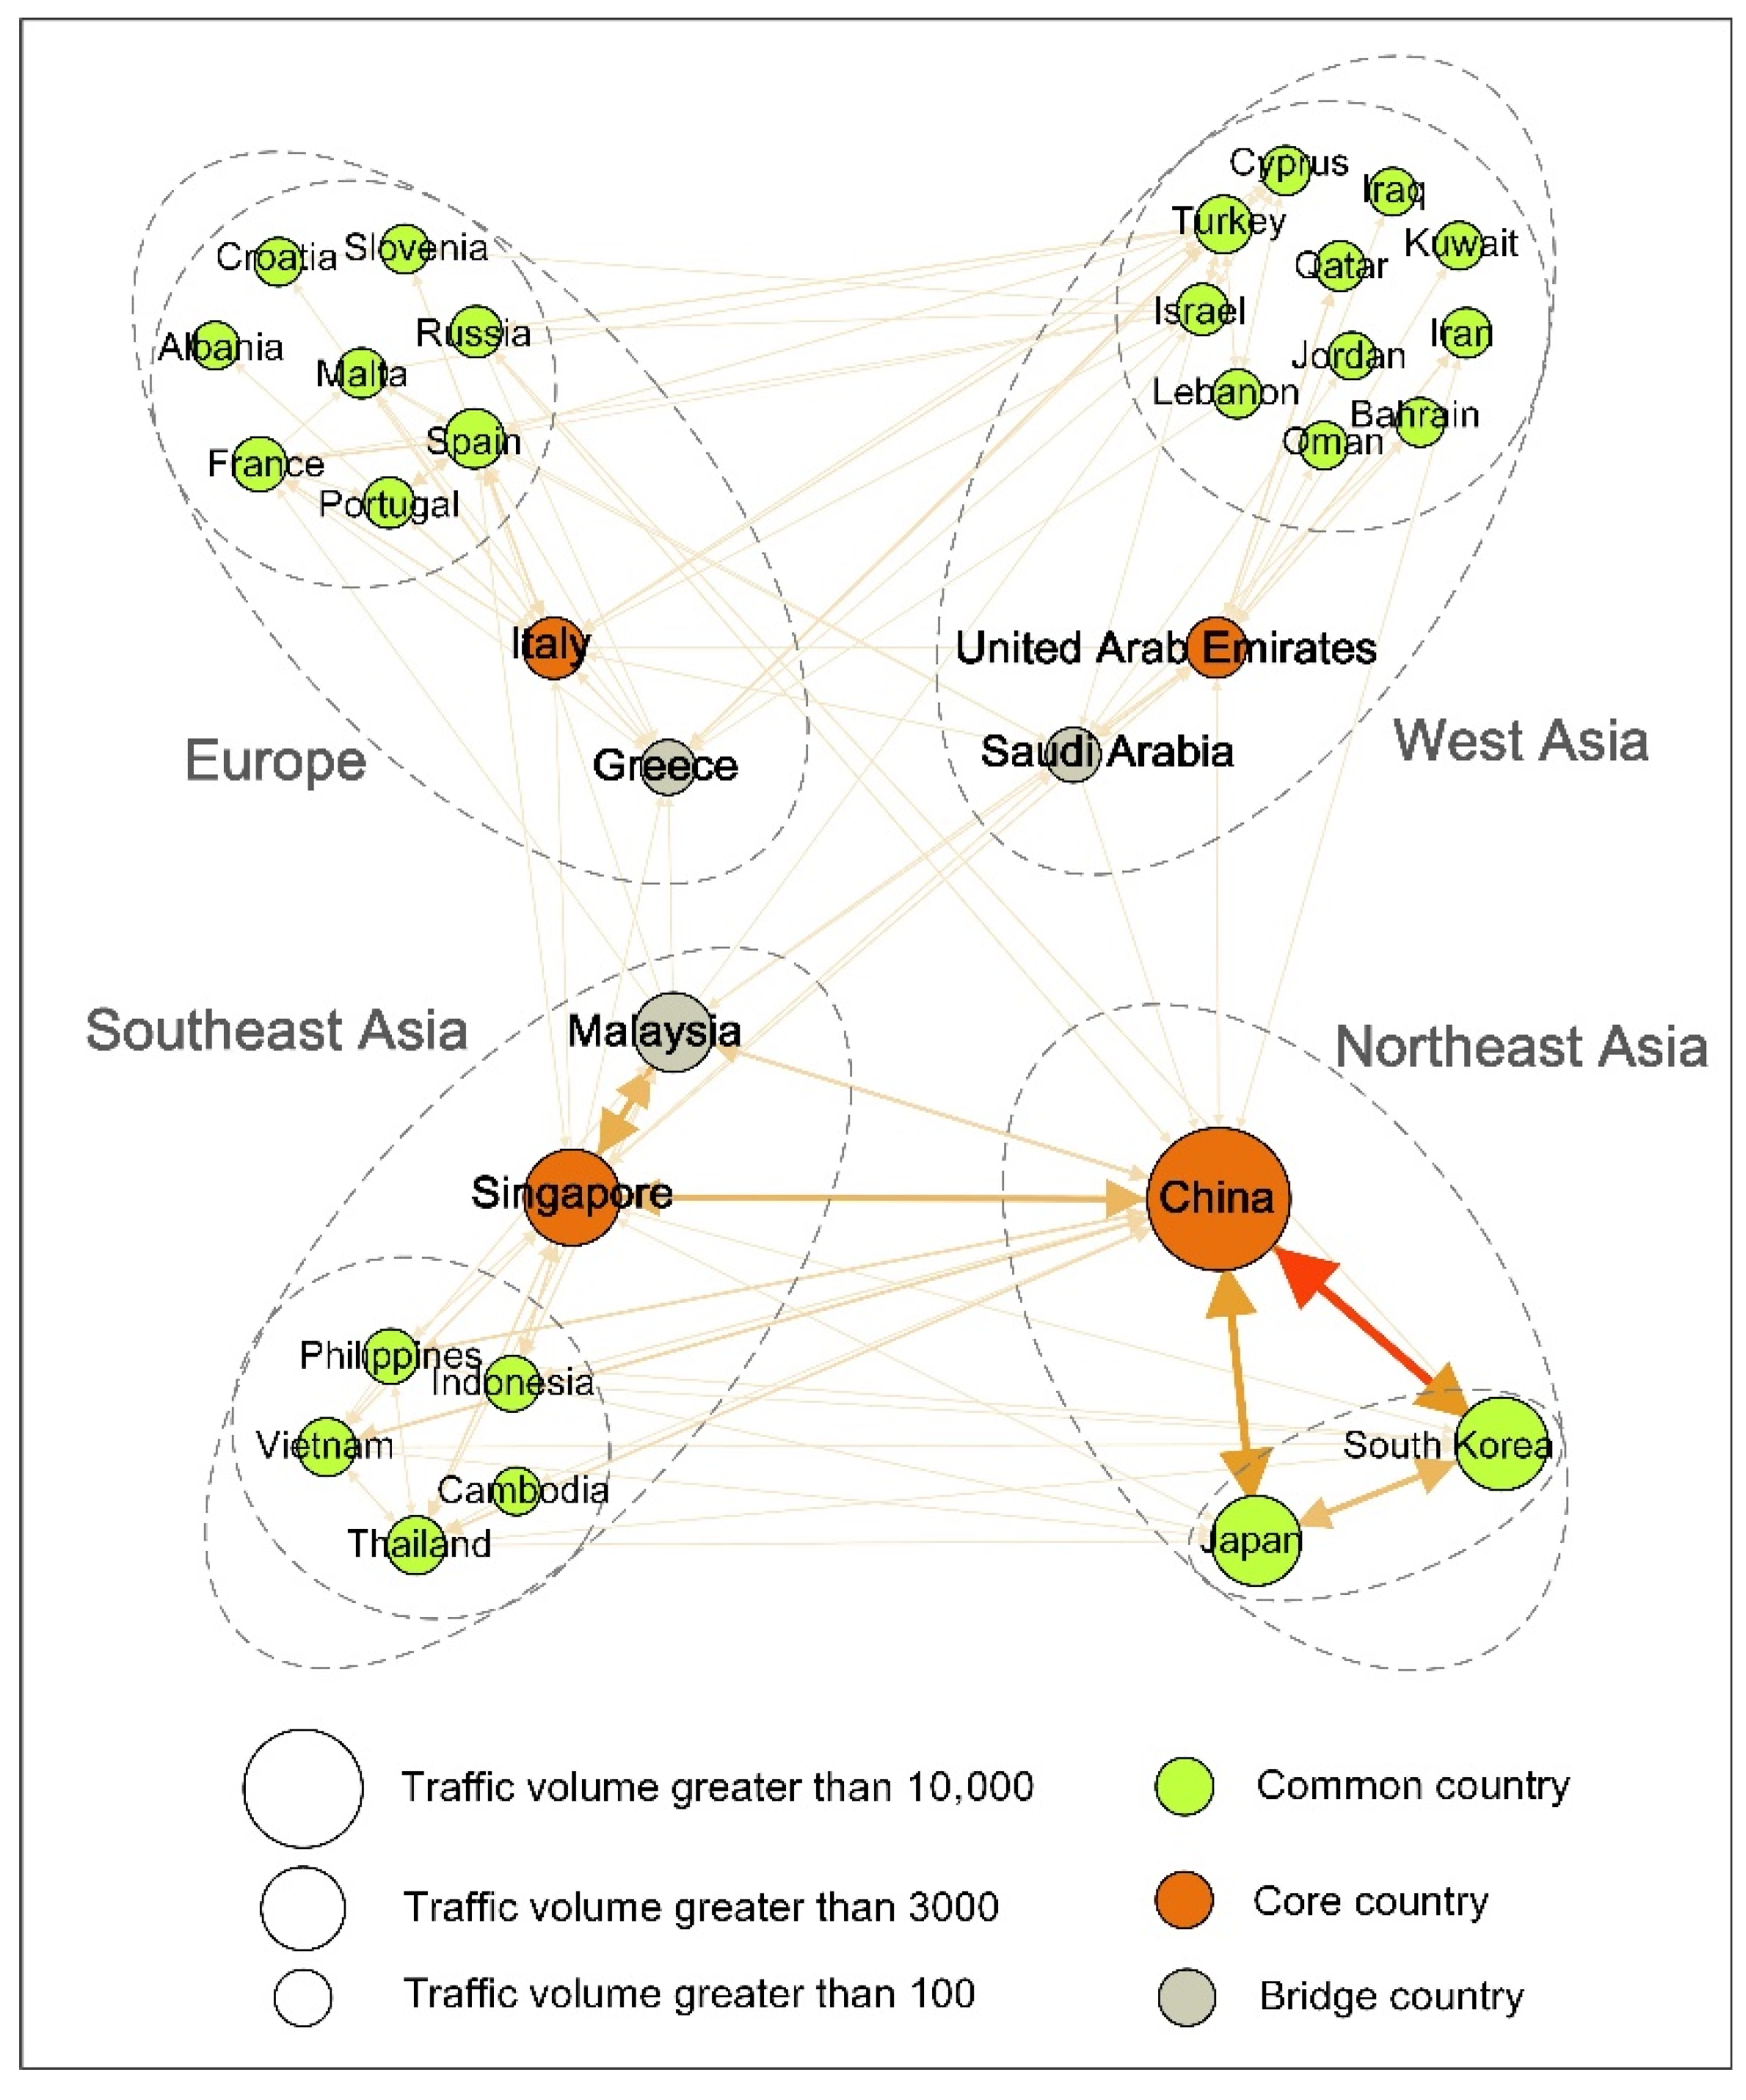
4.2.1. Role Assessment of National Maritime Traffic
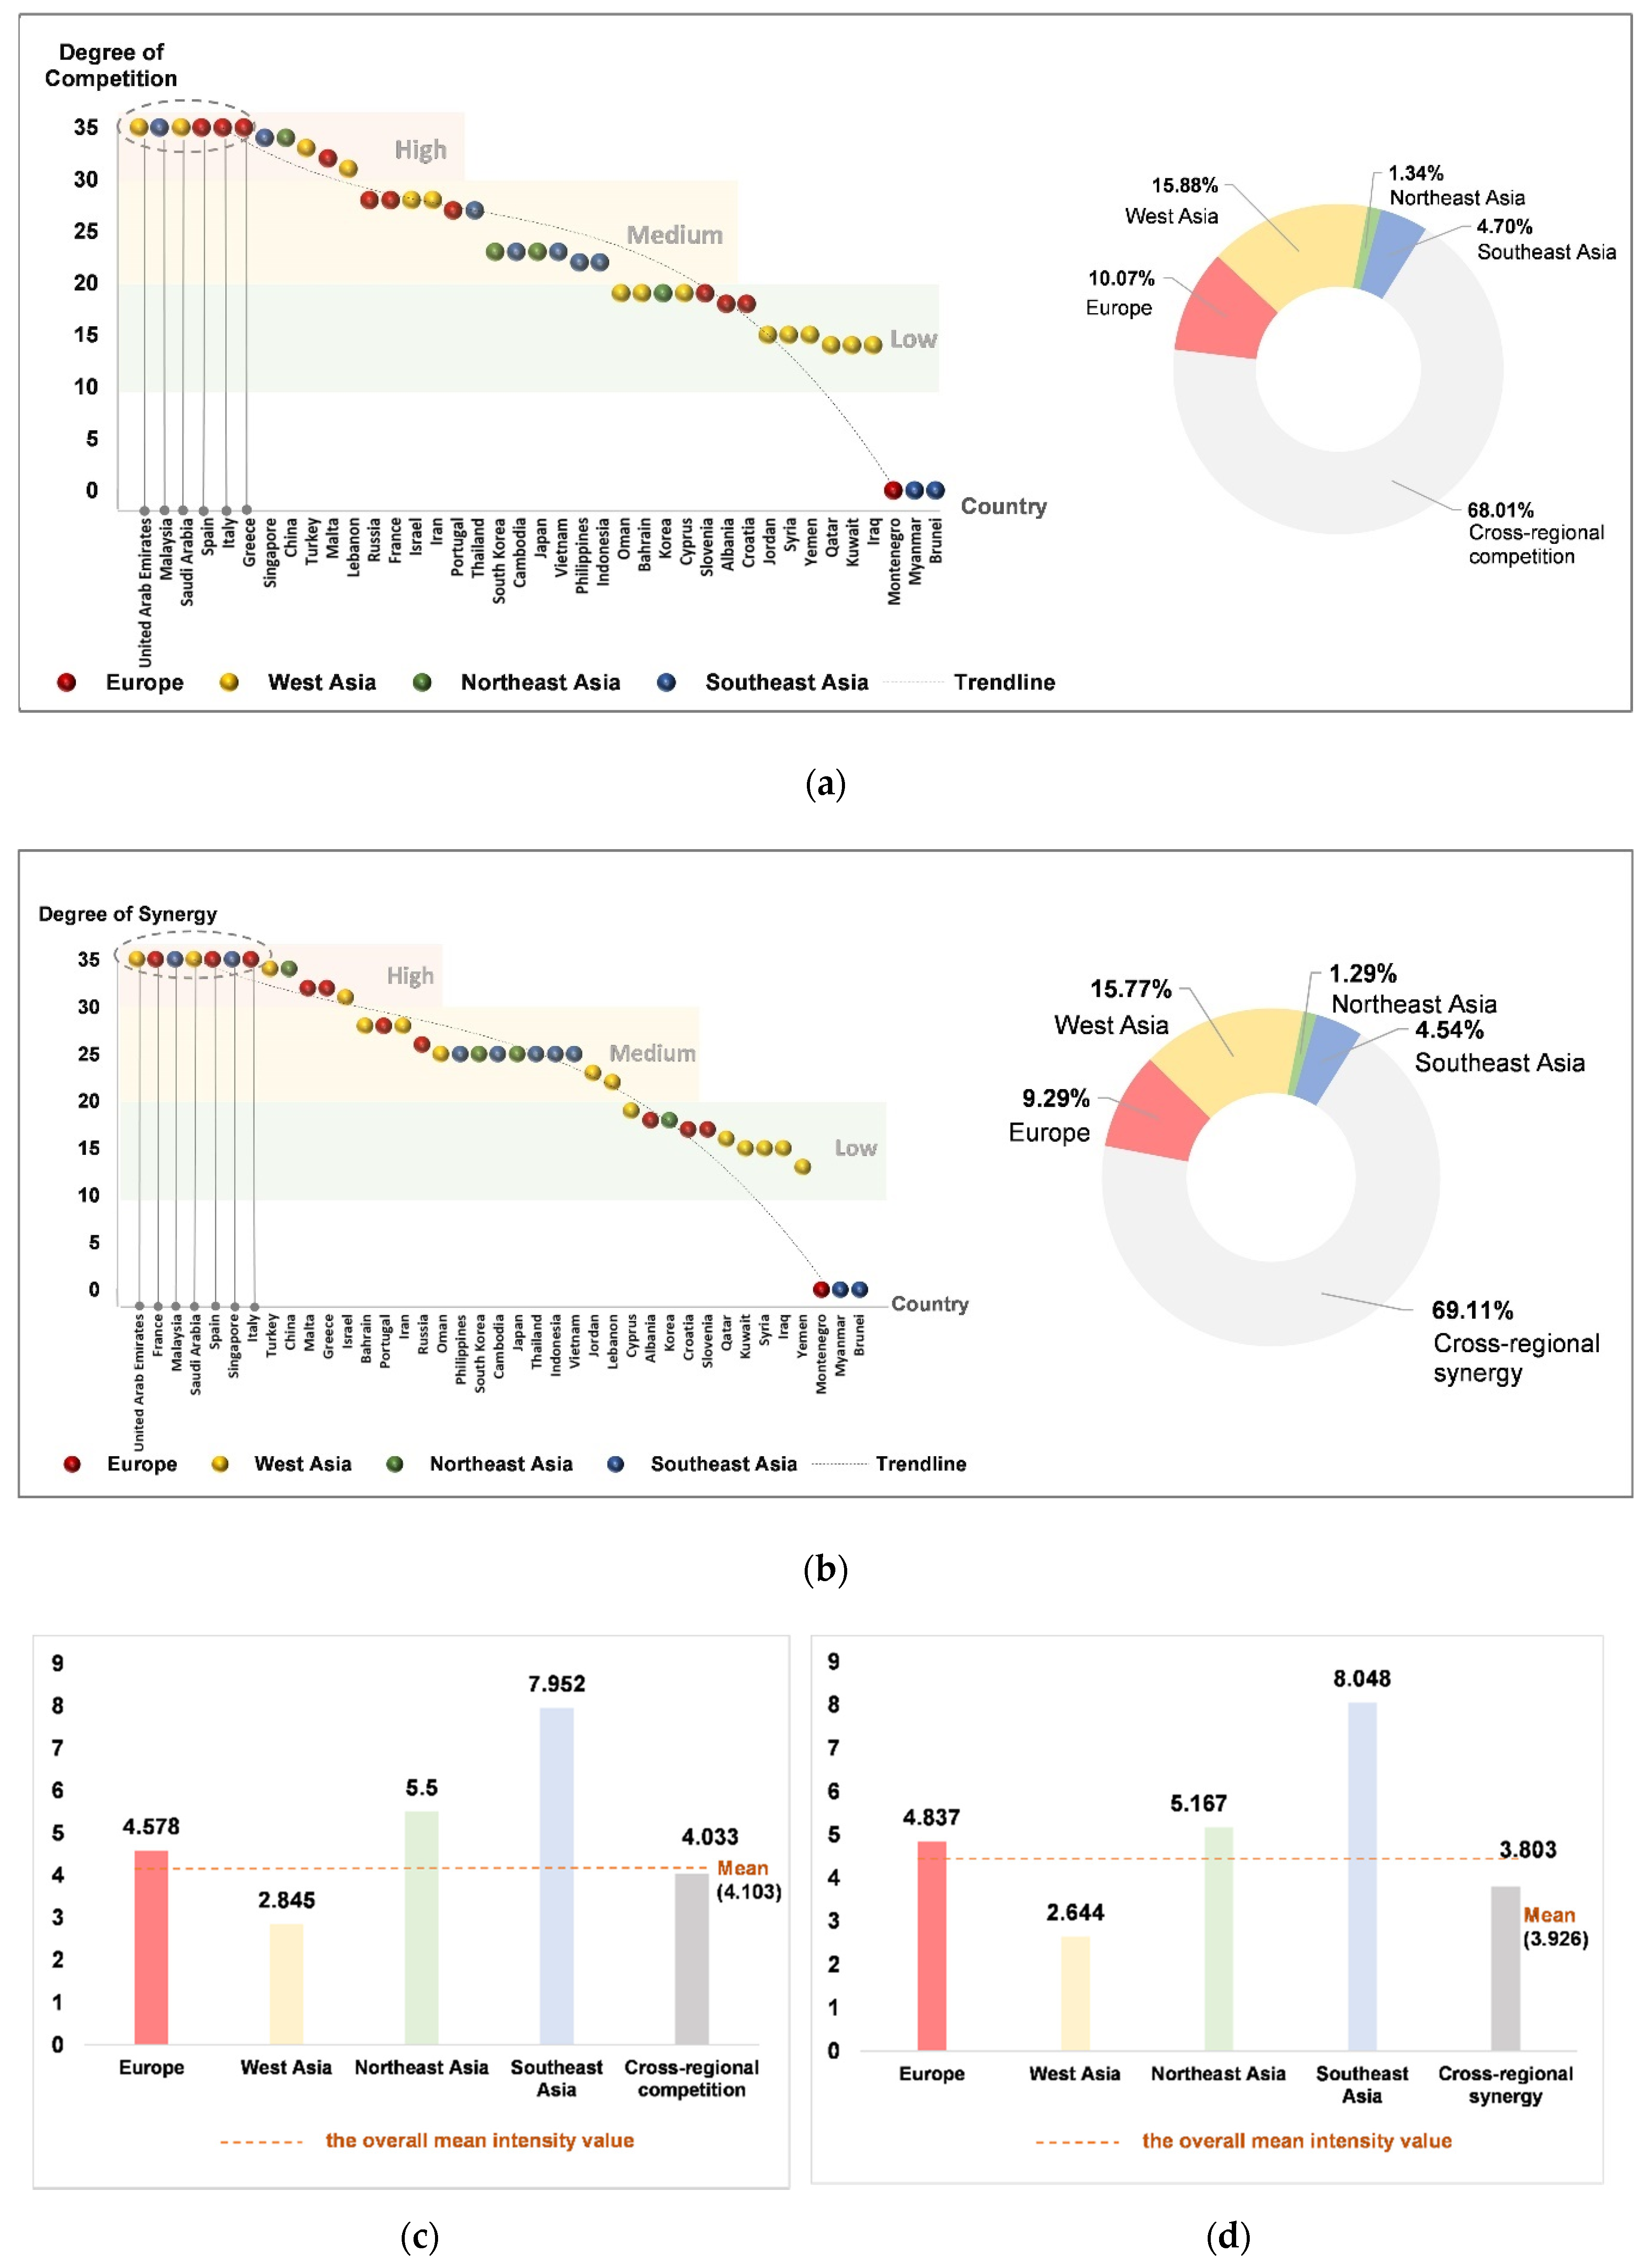
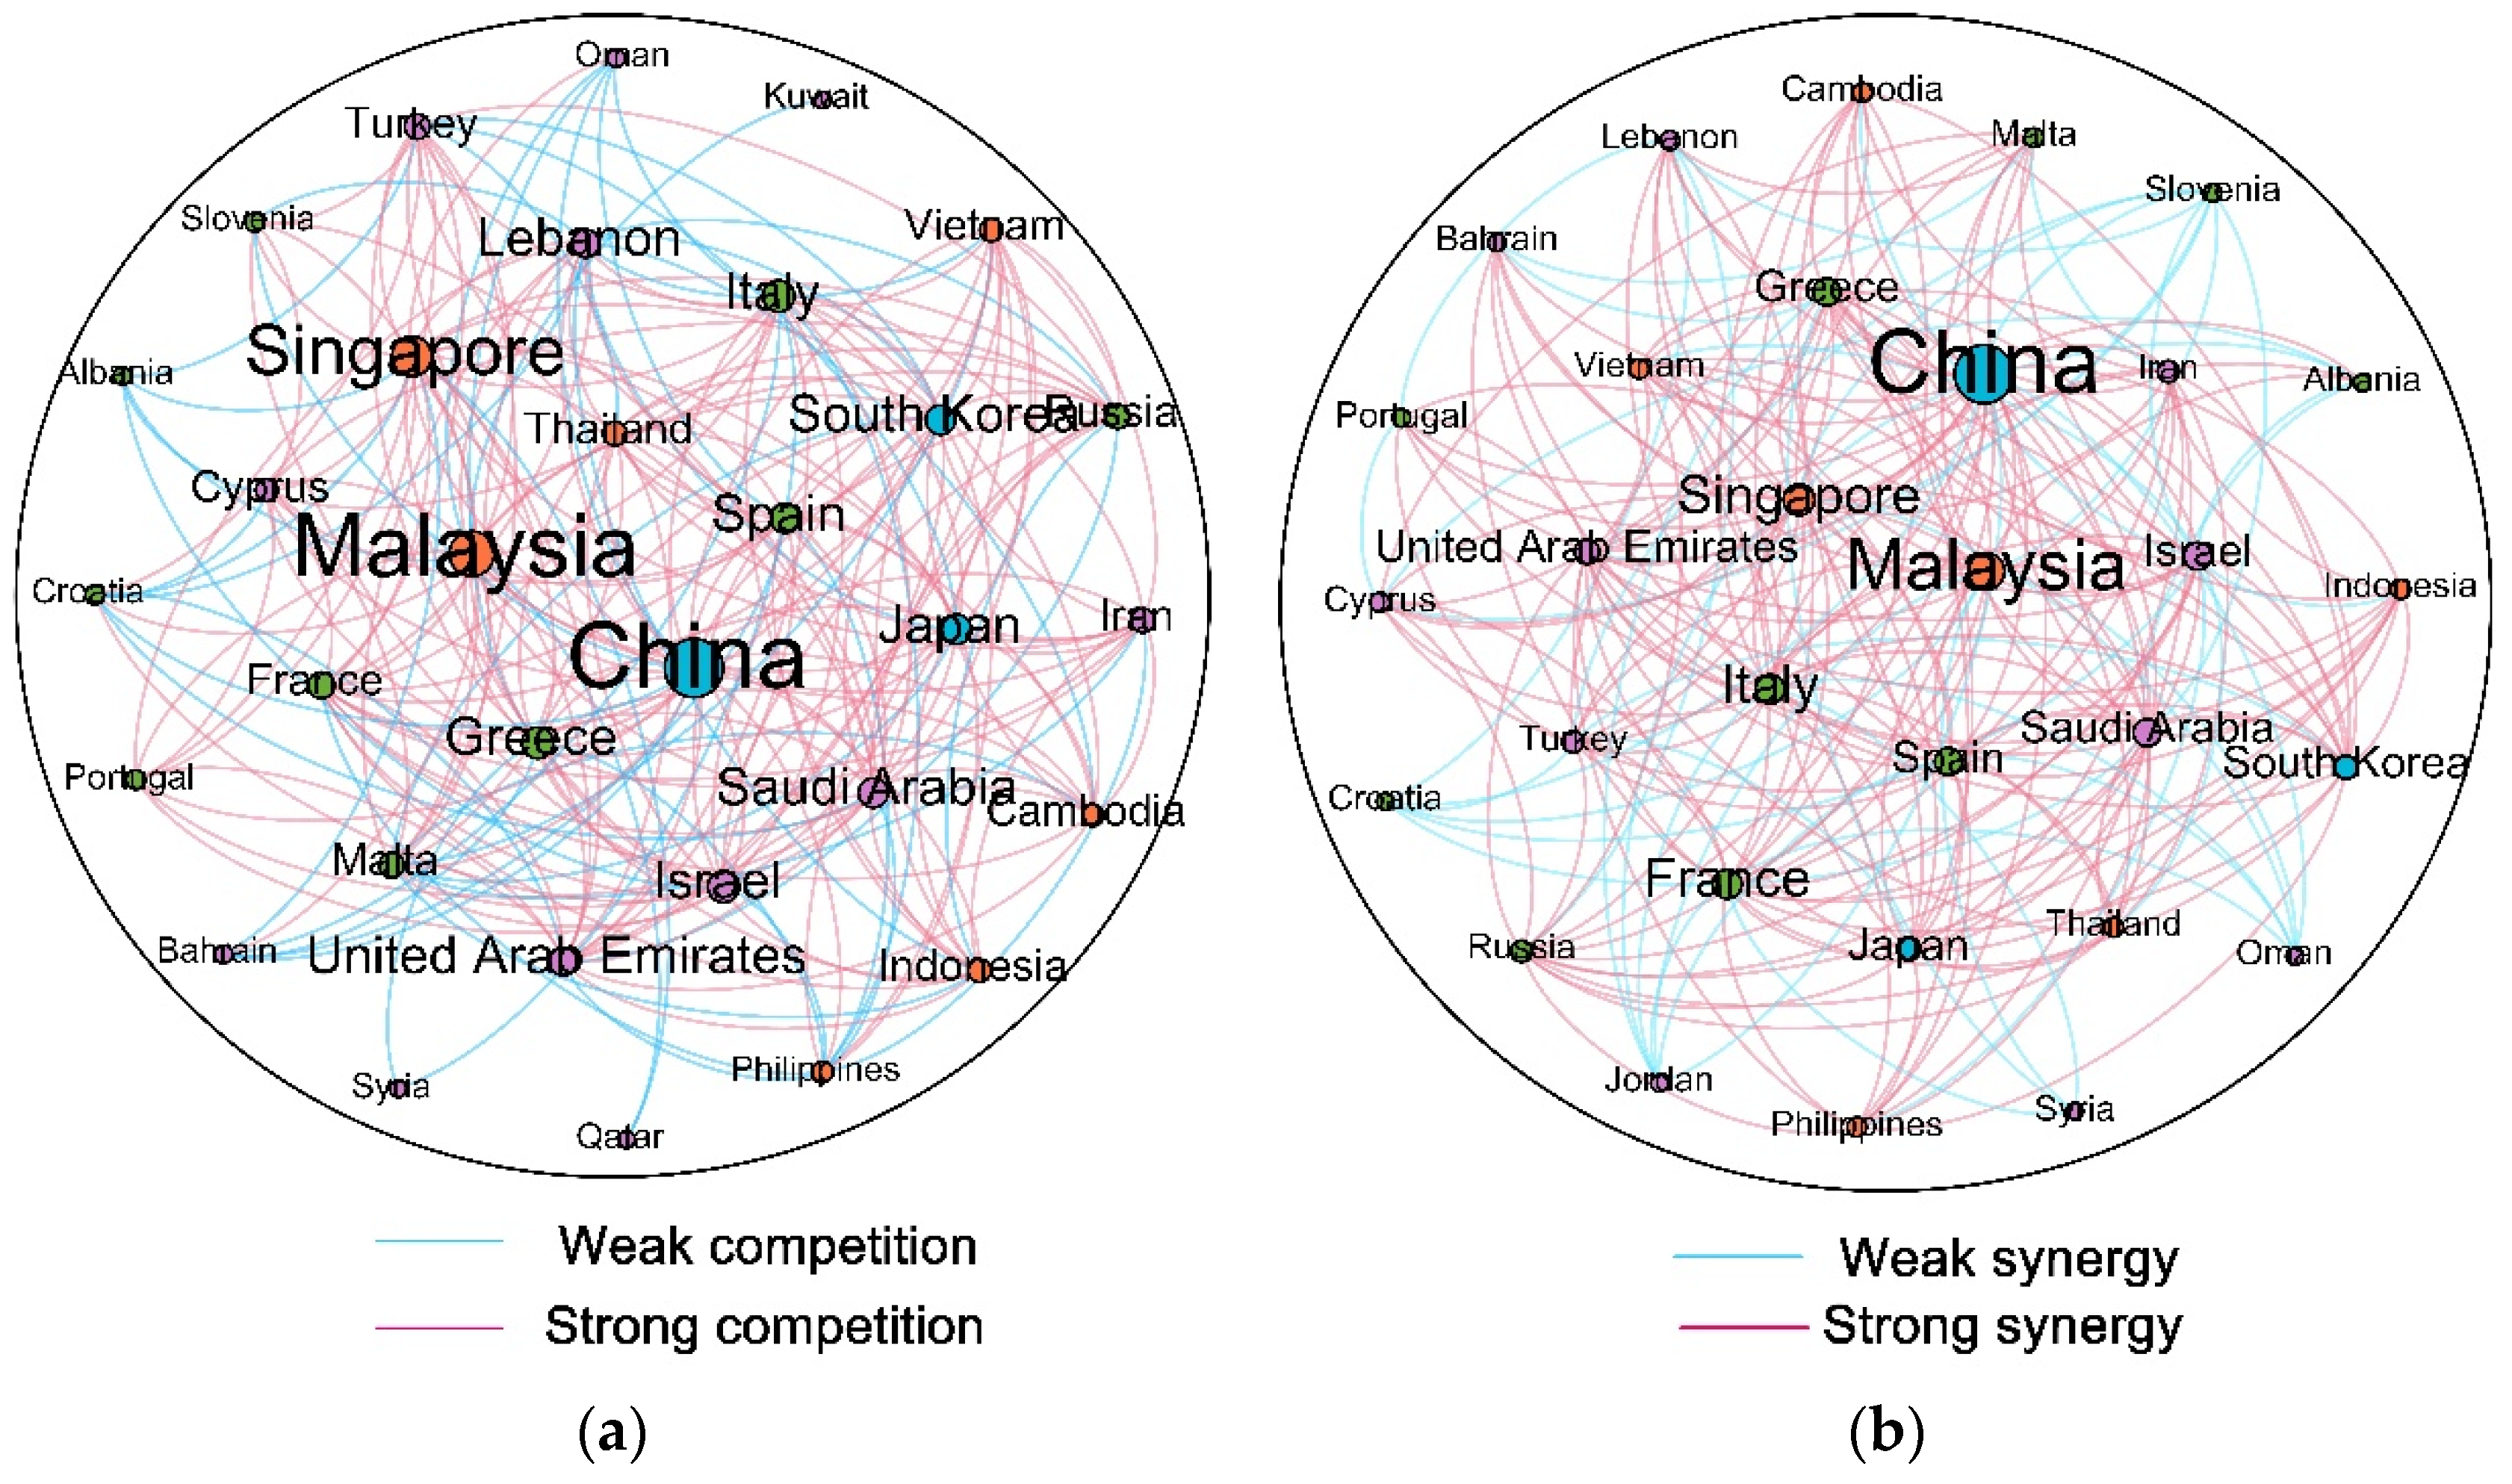
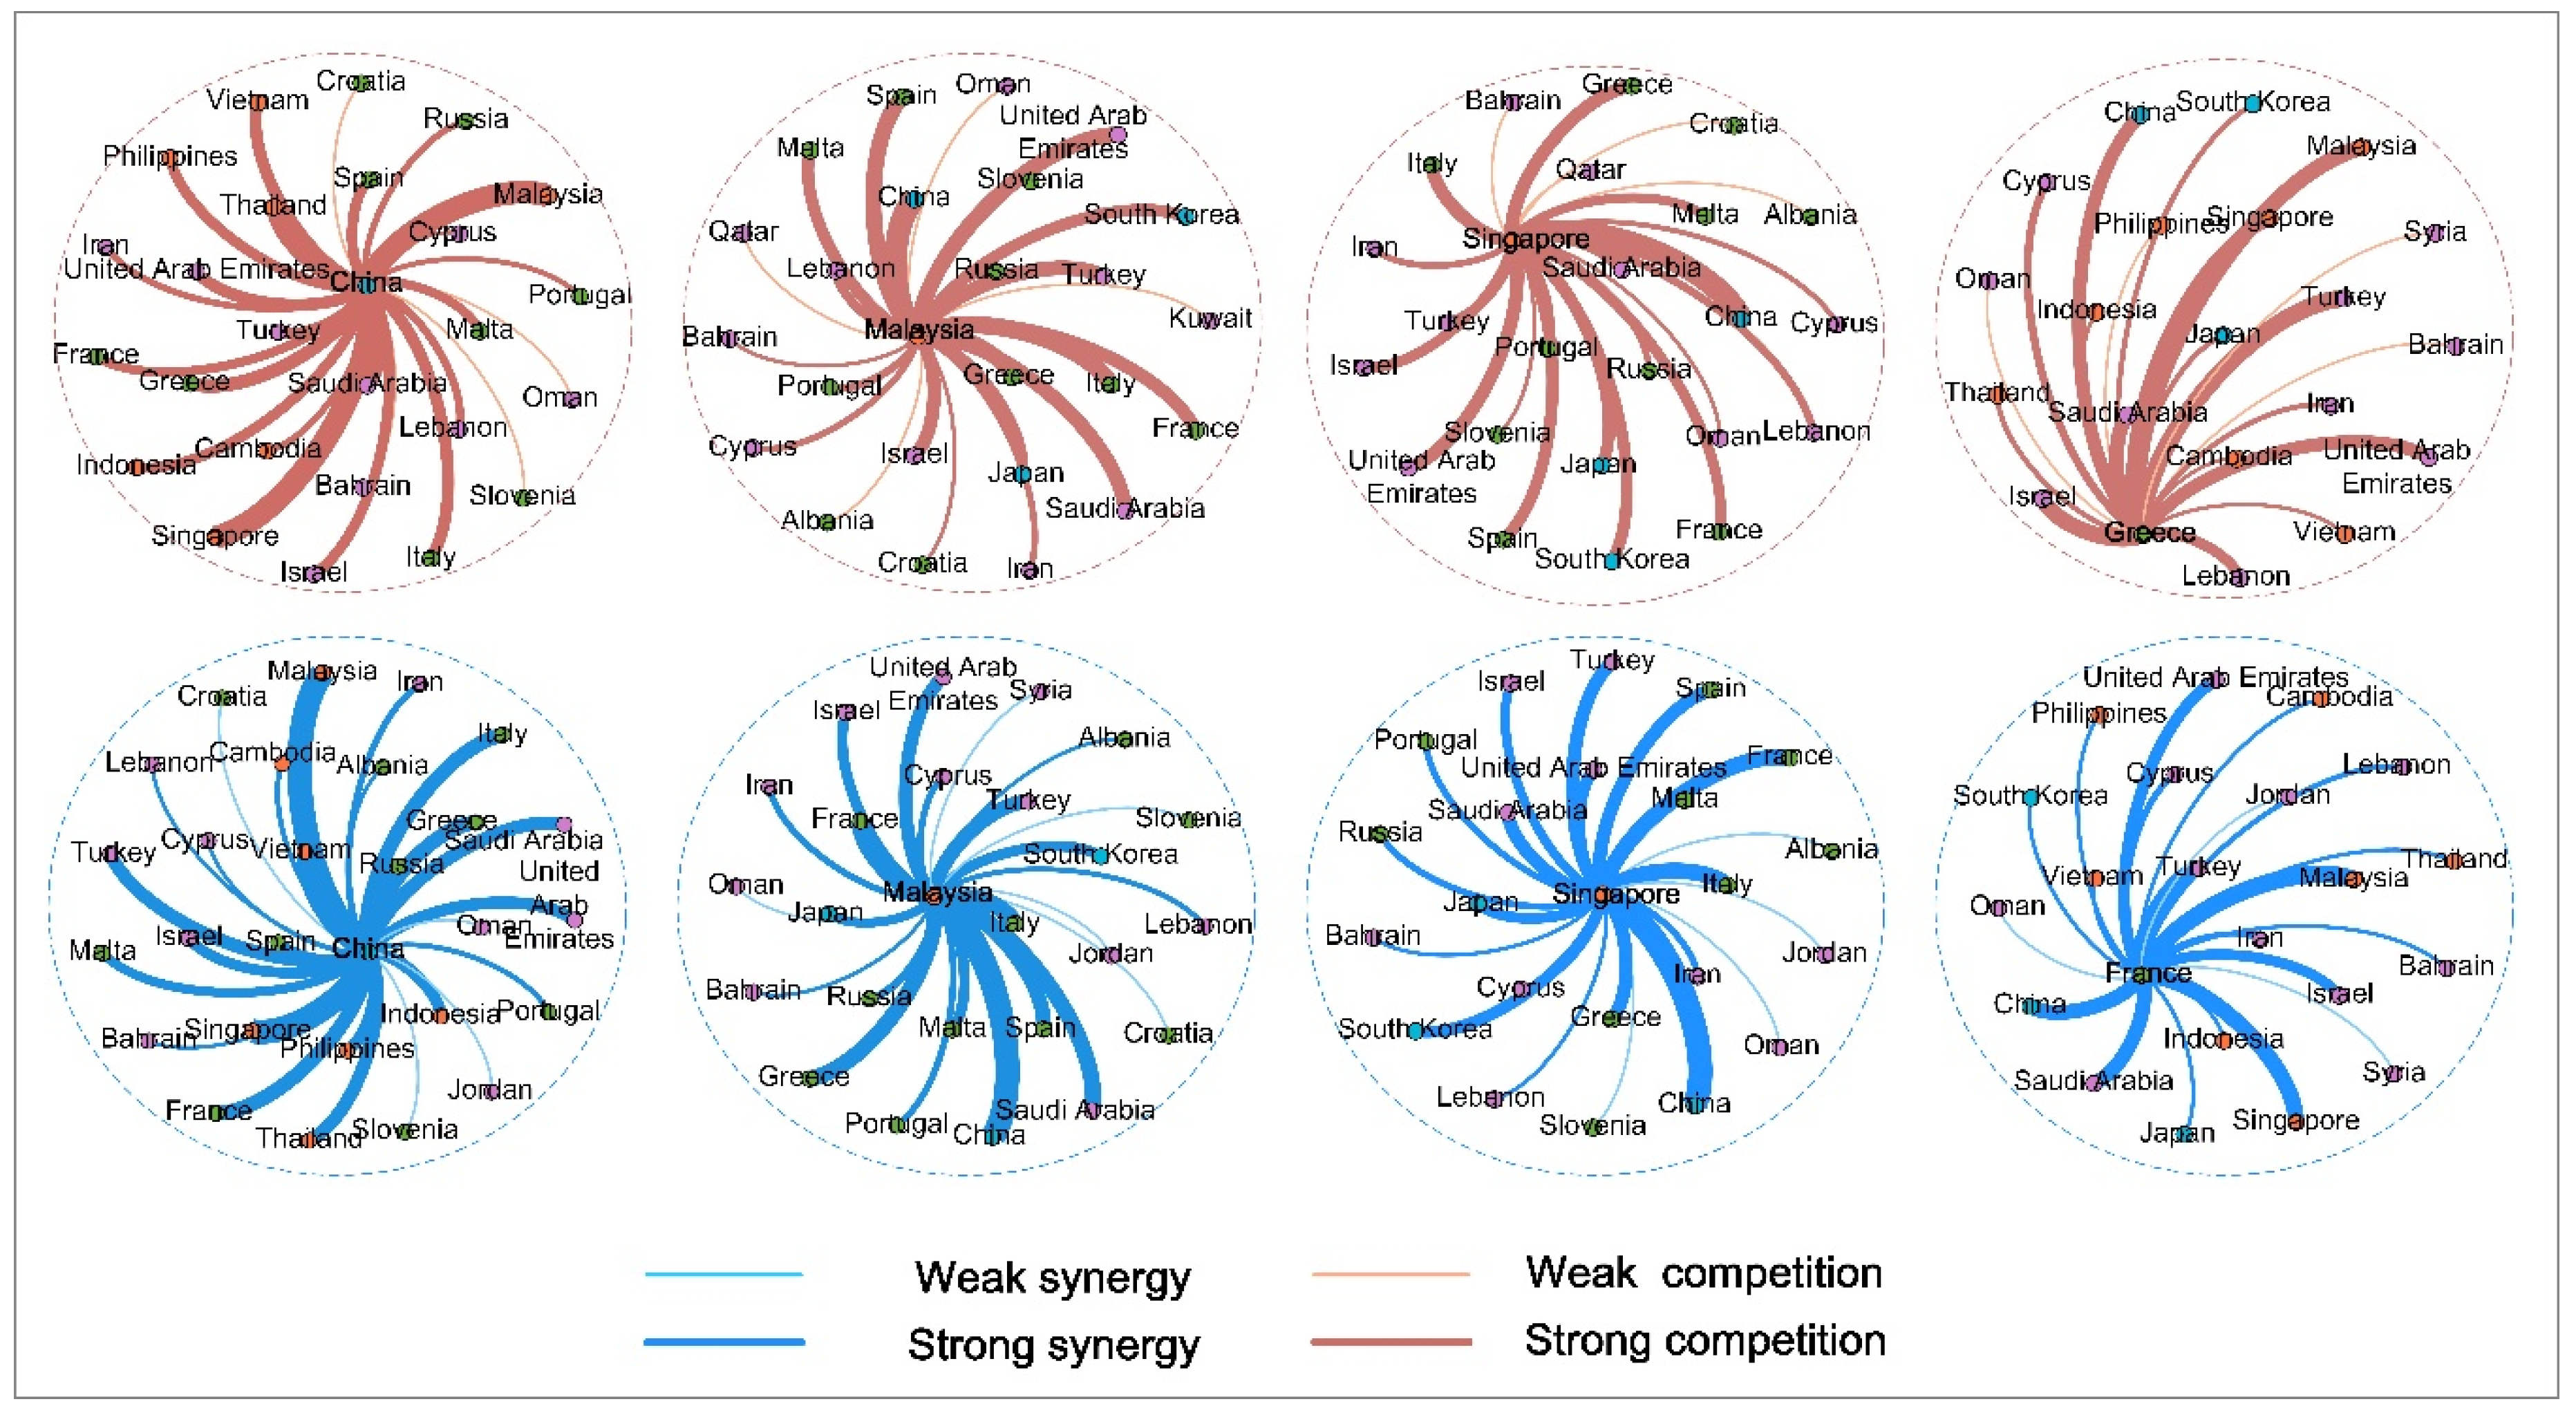
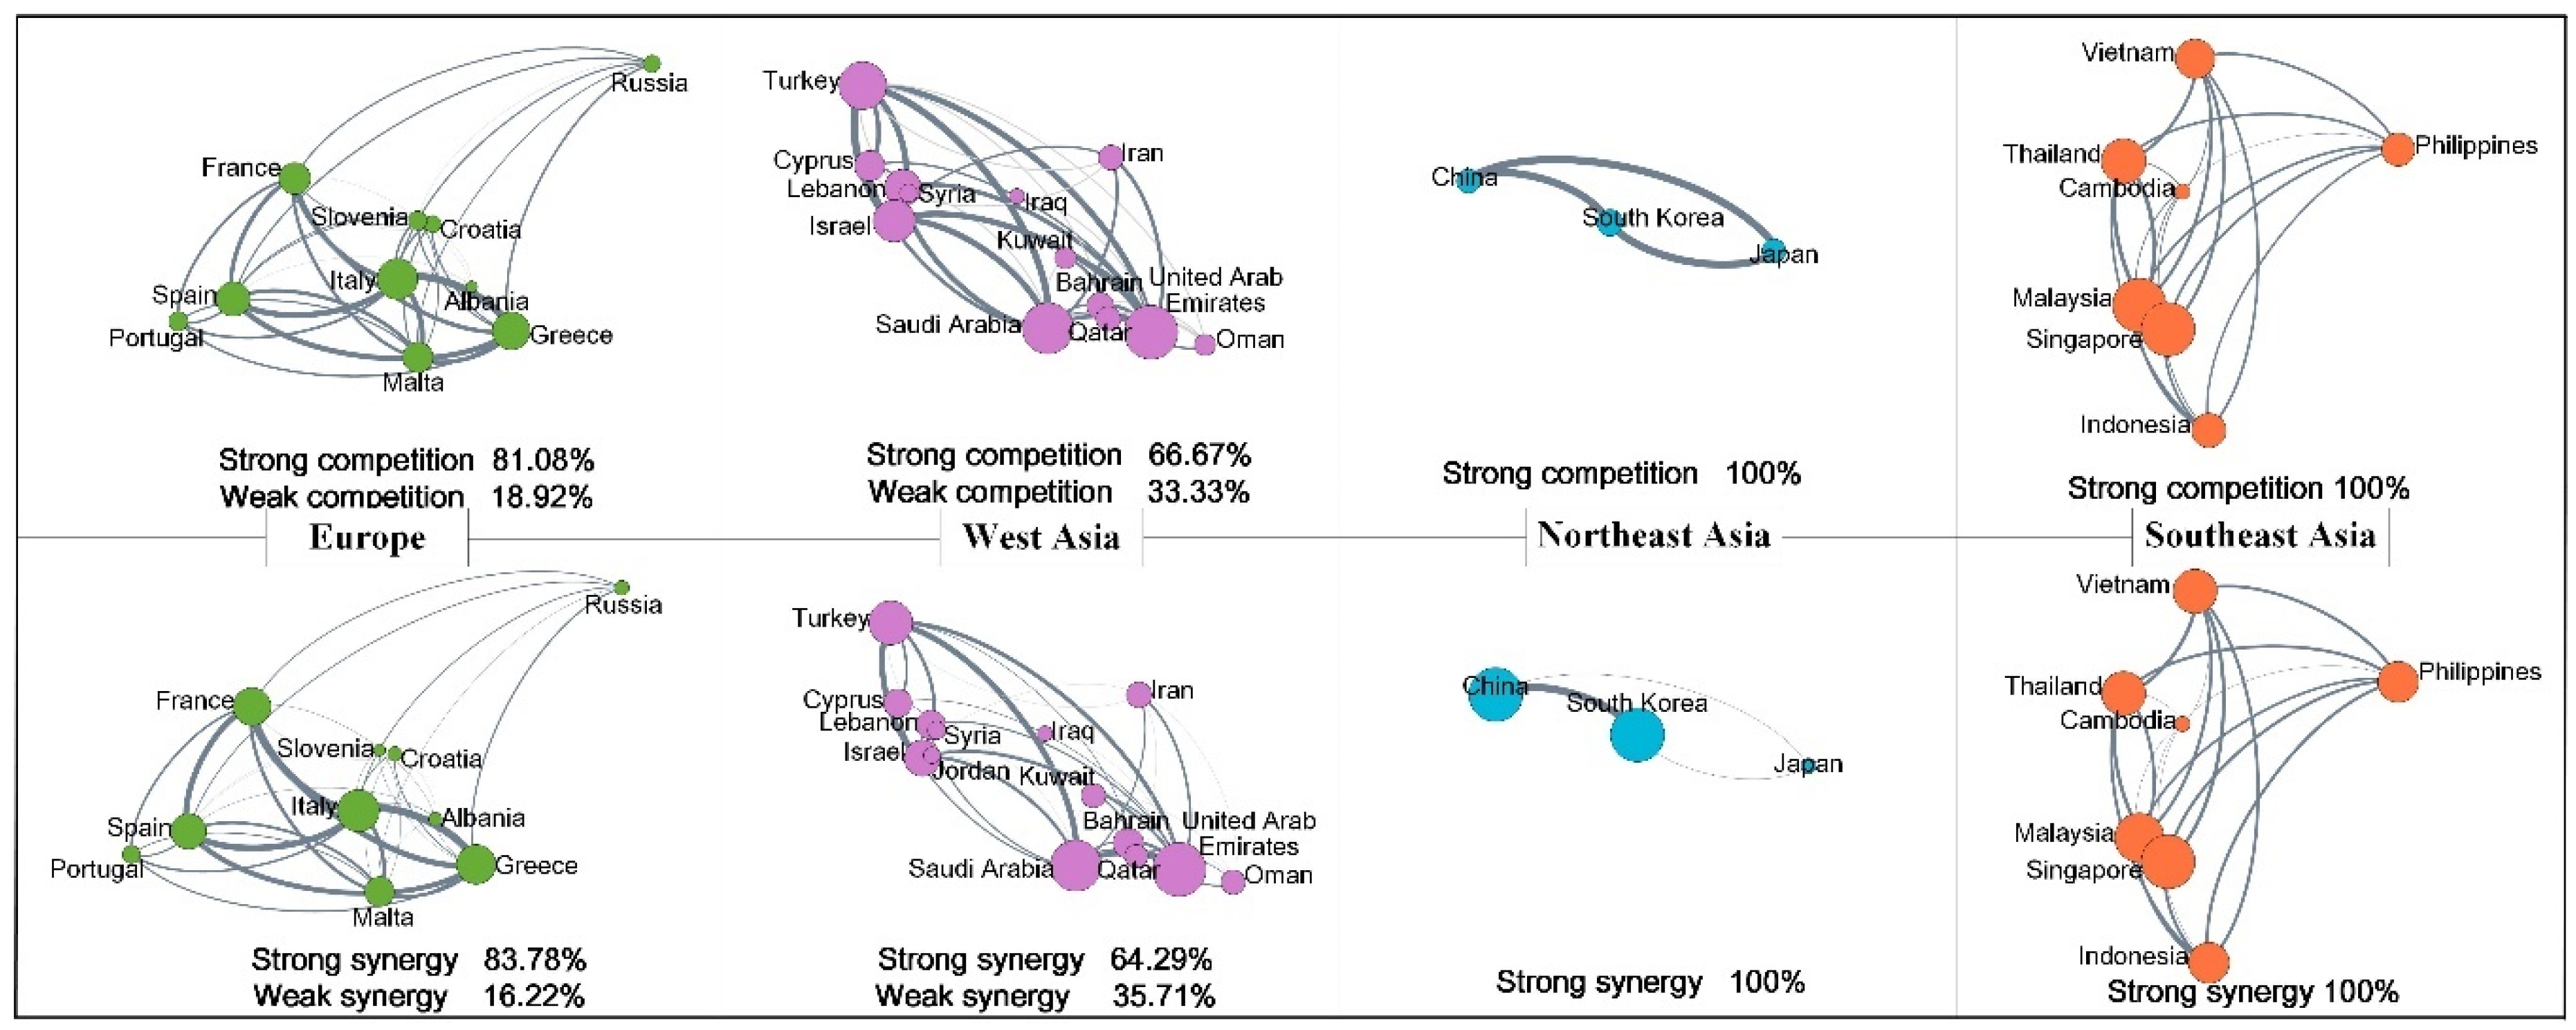
4.2.2. Maritime Traffic Competition-Synergy Analysis
5. Discussion
6. Conclusions
Author Contributions
Funding
Institutional Review Board Statement
Informed Consent Statement
Data Availability Statement
Acknowledgments
Conflicts of Interest
References
- Huang, J.; Wang, J. The Application and Disciplinary Influence of Transportation Big Data in Humanities and Economic Geography. J. Geoinf. Sci. 2020, 22, 1180–1188. [Google Scholar]
- Jin, F.; Wang, C.; Li, X. Discrimination Method and Application Analysis of China’s Regional Transportation Advantages. Acta Geogr. Sin. 2008, 63, 787–798. [Google Scholar]
- Wang, C. Discrimination Method and Demonstration of Spatial Flow Field of Intercity Traffic Flow—A Case Study of Chinese Railway Passenger Flow. Geogr. Res. 2009, 28, 1464–1475. [Google Scholar]
- Cheung, K.; Bell, M.G.H.; Pan, J.; Perera, S. An eigenvector centrality analysis of world container shipping network connectivity. Transp. Res. Part E Logist. 2020, 140, 101991. [Google Scholar] [CrossRef]
- Peng, P.; Cheng, S.; Chen, J.; Liao, M.; Wu, L.; Liu, X.; Lu, F. A fine-grained perspective on the robustness of global cargo ship transportation networks. J. Geogr. Sci. 2018, 28, 881–889. [Google Scholar] [CrossRef] [Green Version]
- Jiang, B.; Li, J.; Gong, C. Maritime Shipping and Export Trade on “Maritime Silk Road”. Asian J. Shipp. Logist. 2018, 34, 83–90. [Google Scholar] [CrossRef]
- Feng, T.; Kang, Q.; Pan, B.; Yang, Y. Synergies of sustainable development goals between China and countries along the Belt and Road initiative. Curr. Opin. Environ. Sustain. 2019, 39, 167–186. [Google Scholar] [CrossRef]
- Ha, M.; Yang, Z.; Lam, J.S.L. Port performance in container transport logistics: A multi-stakeholder perspective. Transp. Policy 2019, 73, 25–40. [Google Scholar] [CrossRef]
- Ducruet, C.; Itoh, H.; Berli, J. Urban gravity in the global container shipping network. J. Transp. Geogr. 2020, 85, 102729. [Google Scholar] [CrossRef]
- Lee, T.; Yeo, G.; Thai, V.V. Changing Concentration Ratios and Geographical Patterns of Bulk Ports: The Case of the Korean West Coast. Asian J. Shipp. Logist. 2014, 30, 155–173. [Google Scholar] [CrossRef] [Green Version]
- Feng, H.; Grifoll, M.; Zheng, P. From a feeder port to a hub port: The evolution pathways, dynamics and perspectives of Ningbo-Zhoushan port (China). Transp. Policy 2019, 76, 21–35. [Google Scholar] [CrossRef]
- He, D.; Yin, Q.; Zheng, M.; Gao, P. Transport and regional economic integration: Evidence from the Chang-Zhu-Tan region in China. Transp. Policy 2019, 79, 193–203. [Google Scholar] [CrossRef]
- Ducruet, C.; Lee, S.; Ng, A.K.Y. Centrality and vulnerability in liner shipping networks: Revisiting the Northeast Asian port hierarchy. Marit. Policy Manag. 2010, 37, 17–36. [Google Scholar] [CrossRef]
- Liu, F.; Andrienko, G.; Andrienko, N.; Chen, S.; Janssens, D.; Wets, G.; Theodoridis, Y. Citywide Traffic Analysis Based on the Combination of Visual and Analytic Approaches. J. Geovis. Spat. Anal. 2020, 4. [Google Scholar] [CrossRef]
- Le Tixerant, M.; Le Guyader, D.; Gourmelon, F.; Queffelec, B. How can Automatic Identification System (AIS) data be used for maritime spatial planning? Ocean Coast. Manag. 2018, 166, 18–30. [Google Scholar] [CrossRef] [Green Version]
- Wang, Z.; Yao, M.; Meng, C.; Claramunt, C. Risk Assessment of the Overseas Imported COVID-19 of Ocean-Going Ships Based on AIS and Infection Data. ISPRS Int. J. Geo Inf. 2020, 9, 351. [Google Scholar] [CrossRef]
- Xiao, Y.; Chen, Y.; Liu, X.; Yan, Z.; Cheng, L.; Li, M. Oil Flow Analysis in the Maritime Silk Road Region Using AIS Data. ISPRS Int. J. Geo Inf. 2020, 9, 265. [Google Scholar] [CrossRef] [Green Version]
- Cheng, L.; Yan, Z.; Xiao, Y.; Chen, Y.; Zhang, F.; Li, M. Using big data to track marine oil transportation along the 21st-century Maritime Silk Road. Sci. China Technol. Sci. 2019, 62, 677–686. [Google Scholar] [CrossRef]
- Zhong, R.X.; Cai, H.X.; Xu, D.B.; Chen, C.; Sumalee, A.; Pan, T.L. Dynamic feedback control of day-to-day traffic disequilibrium process. Transp. Res. C Emer. 2020, 114, 297–321. [Google Scholar] [CrossRef]
- Guo, Y.; Chen, Z.; Stuart, A.; Li, X.; Zhang, Y. A systematic overview of transportation equity in terms of accessibility, traffic emissions, and safety outcomes: From conventional to emerging technologies. Transp. Res. Interdiscip. Perspect. 2020, 4, 100091. [Google Scholar] [CrossRef]
- Stuart, A.L.; Zeager, M. An inequality study of ambient nitrogen dioxide and traffic levels near elementary schools in the Tampa area. J. Environ. Manag. 2011, 92, 1923–1930. [Google Scholar] [CrossRef] [PubMed]
- Wanke, P.; Chen, Z.; Zheng, X.; Antunes, J. Sustainability efficiency and carbon inequality of the Chinese transportation system: A Robust Bayesian Stochastic Frontier Analysis. J. Environ. Manag. 2020, 260, 110163. [Google Scholar] [CrossRef]
- Chen, H.; Du, W.; Li, N.; Chen, G.; Zheng, X. The socioeconomic inequality in traffic-related disability among Chinese adults: The application of concentration index. Accid. Anal. Prev. 2013, 55, 101–106. [Google Scholar] [CrossRef] [PubMed]
- Dadashova, B.; Li, X.; Turner, S.; Koeneman, P. Multivariate time series analysis of traffic congestion measures in urban areas as they relate to socioeconomic indicators. Socio Econ. Plan. Sci. 2020, 100877. [Google Scholar] [CrossRef]
- Notteboom, T.E. Traffic inequality in seaport systems revisited. J. Transp. Geogr. 2006, 14, 95–108. [Google Scholar] [CrossRef]
- Dagum, C. A new approach to the decomposition of the Gini income inequality ratio. Empir. Econ. 1997, 22, 515–531. [Google Scholar] [CrossRef]
- Wang, Y.; Cullinane, K. Traffic consolidation in East Asian container ports: A network flow analysis. Transp. Res. A Pol. 2014, 61, 152–163. [Google Scholar] [CrossRef]
- Xu, M.; Li, Z.; Shi, Y.; Zhang, X.; Jiang, S. Evolution of regional inequality in the global shipping network. J. Transp. Geogr. 2015, 44, 1–12. [Google Scholar] [CrossRef]
- Nguyen, P.N.; Woo, S.; Beresford, A.; Pettit, S. Competition, market concentration, and relative efficiency of major container ports in Southeast Asia. J. Transp. Geogr. 2020, 83, 102653. [Google Scholar] [CrossRef]
- Notteboom, T.E. Concentration and the formation of multi-port gateway regions in the European container port system: An update. J. Transp. Geogr. 2010, 18, 567–583. [Google Scholar] [CrossRef]
- Li, J.; Oh, Y. A Research on Competition and Cooperation Between Shanghai Port and Ningbo-Zhoushan Port. Asian J. Shipp. Logist. 2010, 26, 67–91. [Google Scholar] [CrossRef] [Green Version]
- Bowles, S.; Carlin, W. Inequality as experienced difference: A reformulation of the Gini coefficient. Econ. Lett. 2020, 186, 108789. [Google Scholar] [CrossRef]
- Li, K.X.; Lin, K.; Jin, M.; Yuen, K.F.; Yang, Z.; Xiao, Y. Impact of the belt and road initiative on commercial maritime power. Transp. Res. A Pol. 2020, 135, 160–167. [Google Scholar] [CrossRef]
- Zhao, Y.; Liu, X.; Wang, S.; Ge, Y. Energy relations between China and the countries along the Belt and Road: An analysis of the distribution of energy resources and interdependence relationships. Renew. Sustain. Energy Rev. 2019, 107, 133–144. [Google Scholar] [CrossRef]
- Yu, H.; Fang, Z.; Lu, F.; Murray, A.T.; Zhao, Z.; Xu, Y.; Yang, X. Massive Automatic Identification System Sensor Trajectory Data-Based Multi-Layer Linkage Network Dynamics of Maritime Transport along 21st-Century Maritime Silk Road. Sensors 2019, 19, 4197. [Google Scholar] [CrossRef] [PubMed] [Green Version]
- Kitamura, T.; Managi, S. Driving force and resistance: Network feature in oil trade. Appl. Energy 2017, 208, 361–375. [Google Scholar] [CrossRef]
- Pais Montes, C.; Freire Seoane, M.J.; González Laxe, F. General cargo and containership emergent routes: A complex networks description. Transp. Policy 2012, 24, 126–140. [Google Scholar] [CrossRef]
- Mou, N.; Liu, C.; Zhang, L.; Fu, X.; Xie, Y.; Li, Y.; Peng, P. Spatial Pattern and Regional Relevance Analysis of the Maritime Silk Road Shipping Network. Sustainability 2018, 10, 977. [Google Scholar] [CrossRef] [Green Version]
- Zhang, C.; Fu, J.; Pu, Z. A study of the petroleum trade network of countries along “The Belt and Road Initiative”. J. Clean. Prod. 2019, 222, 593–605. [Google Scholar] [CrossRef]
- Cullinane, K.; Wang, Y. The hierarchical configuration of the container port industry: An application of multiple linkage analysis. Marit. Policy Manag. 2012, 39, 169–187. [Google Scholar] [CrossRef]
- Huang, Y.; Yip, T.L.; Wen, Y. Comparative analysis of marine traffic flow in classical models. Ocean Eng. 2019, 187, 106195. [Google Scholar] [CrossRef]
- Jiang, B.; Li, J. DEA-based Performance Measurement of Seaports in Northeast Asia: Radial and Non-radial Approach. Asian J. Shipp. Logist. 2009, 25, 219–236. [Google Scholar] [CrossRef] [Green Version]
- Yap, W.Y.; Lam, J.S.L. Competition dynamics between container ports in East Asia. Transp. Res. A Pol. 2006, 40, 35–51. [Google Scholar] [CrossRef]
- Low, J.M.W.; Lam, S.W.; Tang, L.C. Assessment of hub status among Asian ports from a network perspective. Transp. Res. A Pol. 2009, 43, 593–606. [Google Scholar] [CrossRef]
- Viljoen, N.M.; Joubert, J.W. The vulnerability of the global container shipping network to targeted link disruption. Phys. A 2016, 462, 396–409. [Google Scholar] [CrossRef] [Green Version]
- Song, S.C.; Park, S.H.; Yeo, G.T. Network Structure Analysis of a Sub-Hub-Oriented Port. Asian J. Shipp. Logist. 2019, 35, 118–125. [Google Scholar] [CrossRef]
- Li, Z.; Xu, M.; Shi, Y. Centrality in global shipping network basing on worldwide shipping areas. Geo J. 2015, 80, 47–60. [Google Scholar] [CrossRef]
- Liu, J.; Guo, S.; Lu, Z.; Yu, F.; LI, H. An Approximate Flow Betweenness Centrality Measure for Complex Network. IEICE Trans. Inf. Syst. 2013, 96, 727–730. [Google Scholar] [CrossRef] [Green Version]
- Nystuen, J.D.; Dacey, M.F. A graph theory interpretation of nodal regions. Pap. Reg. Sci. Assoc. 1961, 7, 29–42. [Google Scholar] [CrossRef] [Green Version]
- Li, Z.; Li, W. Competitive landscape of China’s container ports based on multi-stream analysis. Econ. Geogr. 2019, 39, 124–131. [Google Scholar]
- Fu, X.; Ng, A.K.Y.; Lau, Y. The impacts of maritime piracy on global economic development: The case of Somalia. Marit. Policy Manag. 2010, 37, 677–697. [Google Scholar] [CrossRef]
- Marinacci, C.; Polo, R.A.; Ricci, S.; Rizzetto, L. Port’s structural and operational benchmark: Methodology and application to the Mediterranean basin. Marit. Transp. 2019, 187, 3–12. [Google Scholar] [CrossRef] [Green Version]
- Wu, L.; Xu, Y.; Wang, F. Identifying Port Calls of Ships by Uncertain Reasoning with Trajectory Data. ISPRS Int. J. Geo Inf. 2020, 9, 756. [Google Scholar] [CrossRef]


| Spatial Structure | Description | Node Relations |
|---|---|---|
 | A significant flow only flows to B. | A is highly dependent on B. |
 | Significant flows of A and B both flow towards each other. | A and B are complementary and dependent. |
 | A significant flow flows to more destination nodes. | There is potential competition for A among destination nodes. |
 | More source nodes significantly flow to B. | B is the hub of the source nodes. |
| Region | Northeast Asia | Southeast Asia | Europe | West Asia | South Asia | Oceania | Northeast Africa | East Africa |
|---|---|---|---|---|---|---|---|---|
| Top 20 (%) | 57.72% | 81.14% | 79.41% | 79.41% | 79.20% | 82.69% | 63.58% | 80.65% |
| Southeast Asia | Northeast Asia | West Asia | Europe |
|---|---|---|---|
| Brunei | China | Bahrain | Albania |
| Cambodia | Japan | Cyprus | Croatia |
| Indonesia | Korea | Iran | France |
| Malaysia | South Korea | Iraq | Italy |
| Myanmar | Israel | Greece | |
| Philippines | Jordan | Malta | |
| Singapore | Kuwait | Montenegro | |
| Thailand | Lebanon | Portugal | |
| Vietnam | Oman | Slovenia | |
| Qatar | Spain | ||
| Saudi Arabia | Russia | ||
| Syria | |||
| Turkey | |||
| United Arab Emirates | |||
| Yemen |
Publisher’s Note: MDPI stays neutral with regard to jurisdictional claims in published maps and institutional affiliations. |
© 2021 by the authors. Licensee MDPI, Basel, Switzerland. This article is an open access article distributed under the terms and conditions of the Creative Commons Attribution (CC BY) license (http://creativecommons.org/licenses/by/4.0/).
Share and Cite
Mou, N.; Ren, H.; Zheng, Y.; Chen, J.; Niu, J.; Yang, T.; Zhang, L.; Liu, F. Traffic Inequality and Relations in Maritime Silk Road: A Network Flow Analysis. ISPRS Int. J. Geo-Inf. 2021, 10, 40. https://0-doi-org.brum.beds.ac.uk/10.3390/ijgi10010040
Mou N, Ren H, Zheng Y, Chen J, Niu J, Yang T, Zhang L, Liu F. Traffic Inequality and Relations in Maritime Silk Road: A Network Flow Analysis. ISPRS International Journal of Geo-Information. 2021; 10(1):40. https://0-doi-org.brum.beds.ac.uk/10.3390/ijgi10010040
Chicago/Turabian StyleMou, Naixia, Haonan Ren, Yunhao Zheng, Jinhai Chen, Jiqiang Niu, Tengfei Yang, Lingxian Zhang, and Feng Liu. 2021. "Traffic Inequality and Relations in Maritime Silk Road: A Network Flow Analysis" ISPRS International Journal of Geo-Information 10, no. 1: 40. https://0-doi-org.brum.beds.ac.uk/10.3390/ijgi10010040