Article

Construction of a WebGIS Tool Based on a GIS Semiautomated Processing for the Localization of P2G Plants in Sicily (Italy)

by
Marcello La Guardia
1,*,
Filippo D’Ippolito
1 and
Maurizio Cellura
2
1
Department of Engineering, Polytechnic School of University of Palermo, Viale delle Scienze, Edificio 10, 90128 Palermo, Italy
2
Department of Engineering, Polytechnic School of University of Palermo, Viale delle Scienze, Edificio 9, 90128 Palermo, Italy
*
Author to whom correspondence should be addressed.
ISPRS Int. J. Geo-Inf. 2021, 10(10), 671; https://0-doi-org.brum.beds.ac.uk/10.3390/ijgi10100671
Submission received: 27 July 2021 / Revised: 21 September 2021 / Accepted: 28 September 2021 / Published: 2 October 2021

Abstract

:
The recent diffusion of RES (Renewable Energy Sources), considering the electric energy produced by photovoltaic and wind plants, brought to light the problem of the unpredictable nature of wind and solar energy. P2G (Power to Gas) implementation seems to be the right solution, transforming curtailed energy in hydrogen. The choice of the settlement of P2G plants is linked to many factors like the distances between the gas grid and the settlement of RES plants, the transportation networks, the energy production, and population distribution. In light of this, the implementation of a Multi-Criteria Analysis (MCA) into a Geographic Information System (GIS) processing represents a good strategy to achieve the goal in a specific territorial asset. In this work, this method has been applied to the case of study of Sicily (Italy). The paper shows in detail the geomatic semi-automated processing that allows to find the set of possible solutions and further to choose the best localization for new P2G plants, connected to a Relational Database Management System (RDBMS) and integrated with a WebGIS visualization for real-time analysis. This system is useful for the management, the development, and the study of hydrogen technologies, in order to link the electrical network and the gas network datasets with economical and infrastructural assets through GIS processing. In the future new factors will join in the process as policies on hydrogen take shape.
Keywords:
P2G; WebGIS; RES; RDBMS; MCA

1. Introduction

The last few years have been characterized by the definition of strategic policies aimed at saving future generations and at solving global pollution. To achieve this goal, it is necessary to have a revolution in the field of energy sources. The rapid spread of RES plants has opened up new hopeful scenarios considering the renewable nature of wind and photovoltaic electrical energy, but, at the same time, new problems to solve have arisen. In fact, the unpredictable nature of these energy sources now represents the main limit of these technologies, because the excesses of unforeseen energy should be curtailed in order to prevent an overload of the electrical transmission network [1]. Recent experimentations solved this crucial limit with the exploitation of P2G technology, converting into hydrogen the excess of electric energy from photovoltaic or wind plants, avoiding the waste of energy [2,3].
The hydrogen produced could be injected directly into the gas network (with strict limits of percentages in volume) or could be destined to methanation processes [4]. Recent research opened up new scenarios regarding the use of hydrogen as a source of energy in many sectors, as transport fuel (power to fuel) or power for feedstock (in industries).
The P2G solution, hence, links the gas and the electric network, and the settlements of this kind of plants should consider multiple factors that involve the process. These factors are related to the territorial relationship [5] between the installation, the points of demands, the supply RES plants, the gas pipeline, the railway and roads networks, etc.
The need to consider several factors related to heterogeneous datasets, led to the necessary adoption of GIS-based models, where it is possible to overlap several georeferred layers, representing the multiple factors involved in the process, and to define the domain of possible solutions in the studied territorial asset. Geographic information systems (GIS) are massively adopted in public administration, industry, economy, and several disciplines, because they provide the integration of different datasets for positioning, data acquisition, analysis, and dissemination functions [6]. The complexity of recent advances regarding energy generation, storage, and energy infrastructure design made necessary the integration of GIS to solve geospatial challenges in the renewable energy field [7]. In fact, the diffusion of RES technology is strongly linked to the individuation of the most suitable land for new RES plant localizations [8]. The use of GIS-based analysis in the field of RES localization has been recently adopted in many cases, for instance it is widely used for the localization of new wind plants [9]. GIS-based models have been also exploited in the evaluation of available forest biomass residue useful to generate electrical and thermal energy [10], or in the localization of new biomethanation power plants [11]. At the same time, the choice of the best localization needs the development of an optimization model. The implementation of MCA analysis to define a proper optimization model is required, considering the necessary criteria that allow to choose the best localization of new power plant installations. This approach, which combines GIS-based models and MCA analysis, has been tested in recent years for wind power plant site selections [12], but also to find the best localization of solid waste incineration power plants [13] and solar PV power plants [14]. The integration of MCA and GIS allows to solve site suitability problems with the possibility to combine data storage, geospatial analysis, geospatial decision support system, and visualization [15].
The management of the datasets related to geospatial information, where geometric and semantic data are combined, needs the implementation of an RDBMS database, which makes it possible to remotely share, analyze, and modify the datasets involved in the system [16]. At the same time, the WebGIS visualization allows users to visualize the entire dataset and to analyze the solution of the localization problem, strictly connected with the geographical asset [17].
The presented work shows the construction of a framework (combining GIS processing, MCA calculation, RDBMS server remotely implementation, and WebGIS online visualization) that allows to choose the localization of a new P2G plant in the territory of Sicily and to visualize it on WebGIS (Figure 1). The GIS processing and the MCA calculation involved in the workflow are semi-automated processes based on chains of several algorithms that allow to define the domain of possible solutions in a single step. Then, a proper script allows to extract the best localization of the new P2G plant from the matrix of possible solutions.
The first section of the paper shows how in recent years, GIS processing methods help to localize new power plants combining several factors. The second section presents the structure of the semi-automated GIS processing chain that allows to find the best localization of new P2G installations. The third section shows the system that connects the processing chain to the RDBMS server, the geographical server, and the WebGIS visualization. The last paragraph shows the conclusions and the possible future research developments in this field.

2. GIS-Based Processing for Localization of Power Plants

Recent advances in GIS technologies offered the possibility of integrating open source modules based on Python language that allow to carry out several geospatial processes [18]. This strategy has been followed firstly in the 1980s by the developers of GRASS GIS (Geographical Resources Analysis Support System), which still represents one of the main components of the Open-Source Geospatial software [19]. GRASS consists of the main landmark of Open-Source geographic information system, integrating raster, vector, and image processing capabilities, including also network analysis functions and SQL-based attribute management [20].
Following in the footsteps of GRASS, Quantum GIS (QGIS) currently represents one of the most diffused open-source GIS, allowing the creation, analysis, editing, and mapping of geospatial data. The processing framework of QGIS, an object-oriented framework based on Python, allows the implementation of geoprocessing algorithms and the construction of automated workflows, combining several software libraries [21].
The possibilities offered by GIS, in recent times, have led scientists to use geospatial datasets for studying problems related to several fields of research. For instance, virtual web GIS-based applications have been recently used for improving the accessibility of geosites [22]. Similar applications have been recently experimented with to investigate the level of contaminations in a sewage system, providing information through geovisualization techniques [23]. At the same time, this kind of technology has been used for the creation of virtual immersive 3D environments useful for the enhancement of accessibility of CH [24] or the teaching of landscape design [25].
In our case, a particular interest regards the examples applied to energy production optimization models. For instance, GIS is a tool recently used for the localization of new biomass power plants, analyzing the distribution of the forests and the dispersed feedstock locations, and transport and economic constraints [26]. Considering other applications, GIS-based processing models have been used for simulating the cost for energy wood supply chains in Finland, necessary due to the increasing use of bioenergy for traditional forest products and biofuels [27]. Furthermore, GIS processing and spatio-temporal data have been also used to define the localization, size, and capacity of solar plants, in order to maximize solar energy production and minimize costs [28]. Similar approaches have been followed in Saudi Arabia for the site selection of solar power plants, filtering in GIS the suitable lands to consider, taking into account environmental parameters, and the nearness to the main transport networks and the urban centers [14]. There are, hence, many study cases where GIS tools are implemented for the localization of new power plants in order to consider heterogeneous criteria based on geospatial features [29,30,31].
At the same time, there are many recent examples in the field of energy production that exploit WebGIS portal implementation. For instance, the possibility of exploration of deep geothermal resources has been fundamental to acquire geological and geophysical data in Denmark, necessary for exploiting deep geothermal energy instead of conventional energy sources [32]. Considering the study of the biomass contribution, the BIOPOLE, a WebGIS based DSS (Decision Support System) coordinated in Italy by the Department of Environment, Energy and Technology Grids of Lombardy Region, allowed to analyze the biomass availability and to localize the new potential bio-energy plants on the basis of several regional layers [33].
Considering this field of research, the presented work shows an integration of GIS processing tools, MCA, and WebGIS implementation applied to the localization of new P2G installations in the Sicilian territorial asset.

3. Semi-Automated GIS Processing

The study case presented in this work considers the localization of new P2G plants in the territory of Sicily (Italy). As affirmed before, the created WebGIS platform visualizes the dataset of the possible solutions loaded into the RDBMS database. The set of possible solutions and the relative cost is the result of a process that involves both an MCA model and a semi-automated GIS processing chain.
In particular, the MCA model involved in the process divides the framework in two parts (Figure 2). The first part consists of the definition of the domain of possible localizations, starting from a grid that considers the entire territory of the Mediterranean Island. The second part starts from this last domain and defines the final cost of every possible localization. In this section, the focus is centered on the first part, where a geomatic automated process is involved to define the domain of the possible solutions, considering specific territorial constraints.
The MCA model on the basis of this processing assumes that the localization of new P2G plants follows specific criteria that define the constraints of the domain of possible solutions. These criteria are based on scientific reasons like the complexity of the production and transport of hydrogen and the key role played by the P2G plant in the connection between electric and gas networks.
In fact, new P2G installations need specific requirements as the proximity with the road network, the railway network, and with the existing photovoltaic or wind plants. There are also further parameters involved in the cost function to insert as attributes of possible solutions. In particular, it is necessary to consider the nearness of the gas network and the cost of minimum distance between new installations and the main urban centers (filtering the centers with more than 50,000 inhabitants). The cost of minimum distance should be calculated considering both road and railway network.
The semi-automated GIS processing model developed considers all of these criteria, and is structured in four different steps: buffering, intersection, cleaning, and cost of distance definition (Figure 3).
The result of every phase is the starting point of the next one in the processing chain. The involved process has been developed in QGIS opensource software, version 3.14.
The first phase starts from the environmental dataset composed by the square grid projected on the surface of Sicily (with a spatial resolution of 1 × 1 km), the railway network, and the main road network of the Mediterranean island, and, in the end, the localization of the wind and photovoltaic plants. The entire opensource starting dataset is provided by ISTAT (National Institute of Statistics of Italy), ANAS (National Autonomous Company of Roads), and SNAM (National Pipeline Company), and considers the UTM WGS 84 EPSG 32,633 reference system. Every step of the framework involves several datasets containing point, line, and multipoint shapefiles (Table 1).
The square grid processing produces a shapefile containing a network of points, which will be next overlapped with the buffered layers of the considered networks and power plants. In particular, the line shapefiles of the railway and the main roads network have been buffered considering a thickness of 0.5 km, instead the point shapefile containing the localization of existing wind and photovoltaic plants has been buffered with a thickness of one kilometer. The choice of the buffering thickness is strictly related to the local transportation network density and to the RES density.
The next step of the chain consists on the intersection of the square grid of points with the buffered layers, starting with the higher density shapefiles and ending with minor density ones. The first overlapping operation consists on the intersection between the square grid with the buffered main road network. The second is between the result of the previous one and the railway network. The last one is between the intersection with the previous networks and the buffer of existing wind and photovoltaic plants.
The result of intersection operations is a point shapefile, containing the domain of the possible localizations of new P2G installations. This shapefile needs to be cleaned due to the presence of multiple points and to be properly prepared for the cost function implementation. The cleaning step considers three subsequent operations that involve the shapefile of possible localizations of new P2G. The first one is the conversion of the shapefile from multipoint to point, necessary to make the further steps of the chain. The second consists on the elimination of duplicate geometries, in order to achieve unique geospatial results. The third step adds an auto-incremental field, necessary to correctly identify every solution in the cost function.
The last phase starts from the cleaned domain of possible new localizations of P2G plants in Sicily, and defines the cost of minimum distance of every solution considering several factors, as introduced before. The minimum distance between every possible solution and the main urban centers through the main road network and the railway network has been calculated using the QNEAT plugin [34]. This plugin calculates the entry cost, the network cost, the exit cost, and the total cost between two different point shapefiles through a specific line shapefile (the connection network).
Another considered factor is the minimum distance between every possible P2G localization and the network of the gas grid. This last operation is implemented in two steps. Firstly, the line shapefile of the gas network is converted into a point shapefile with an interval of five meters between successive points. Subsequently, the minimum distance between the point shapefile of the gas grid and the point shapefile of every possible localization is calculated, considering the minimum distance from the nearest node.
The four phases here described are implemented in a single processing chain that automatically calculates consecutively every step starting from initial dataset (Table 2), in order to obtain the final domain of possible solutions with the relative costs of distance. The output of the GIS automated processing chain is the dataset that allows to calculate the final cost function.
The dataset included in the final cost function considers several factors that come into play in the localization problem:
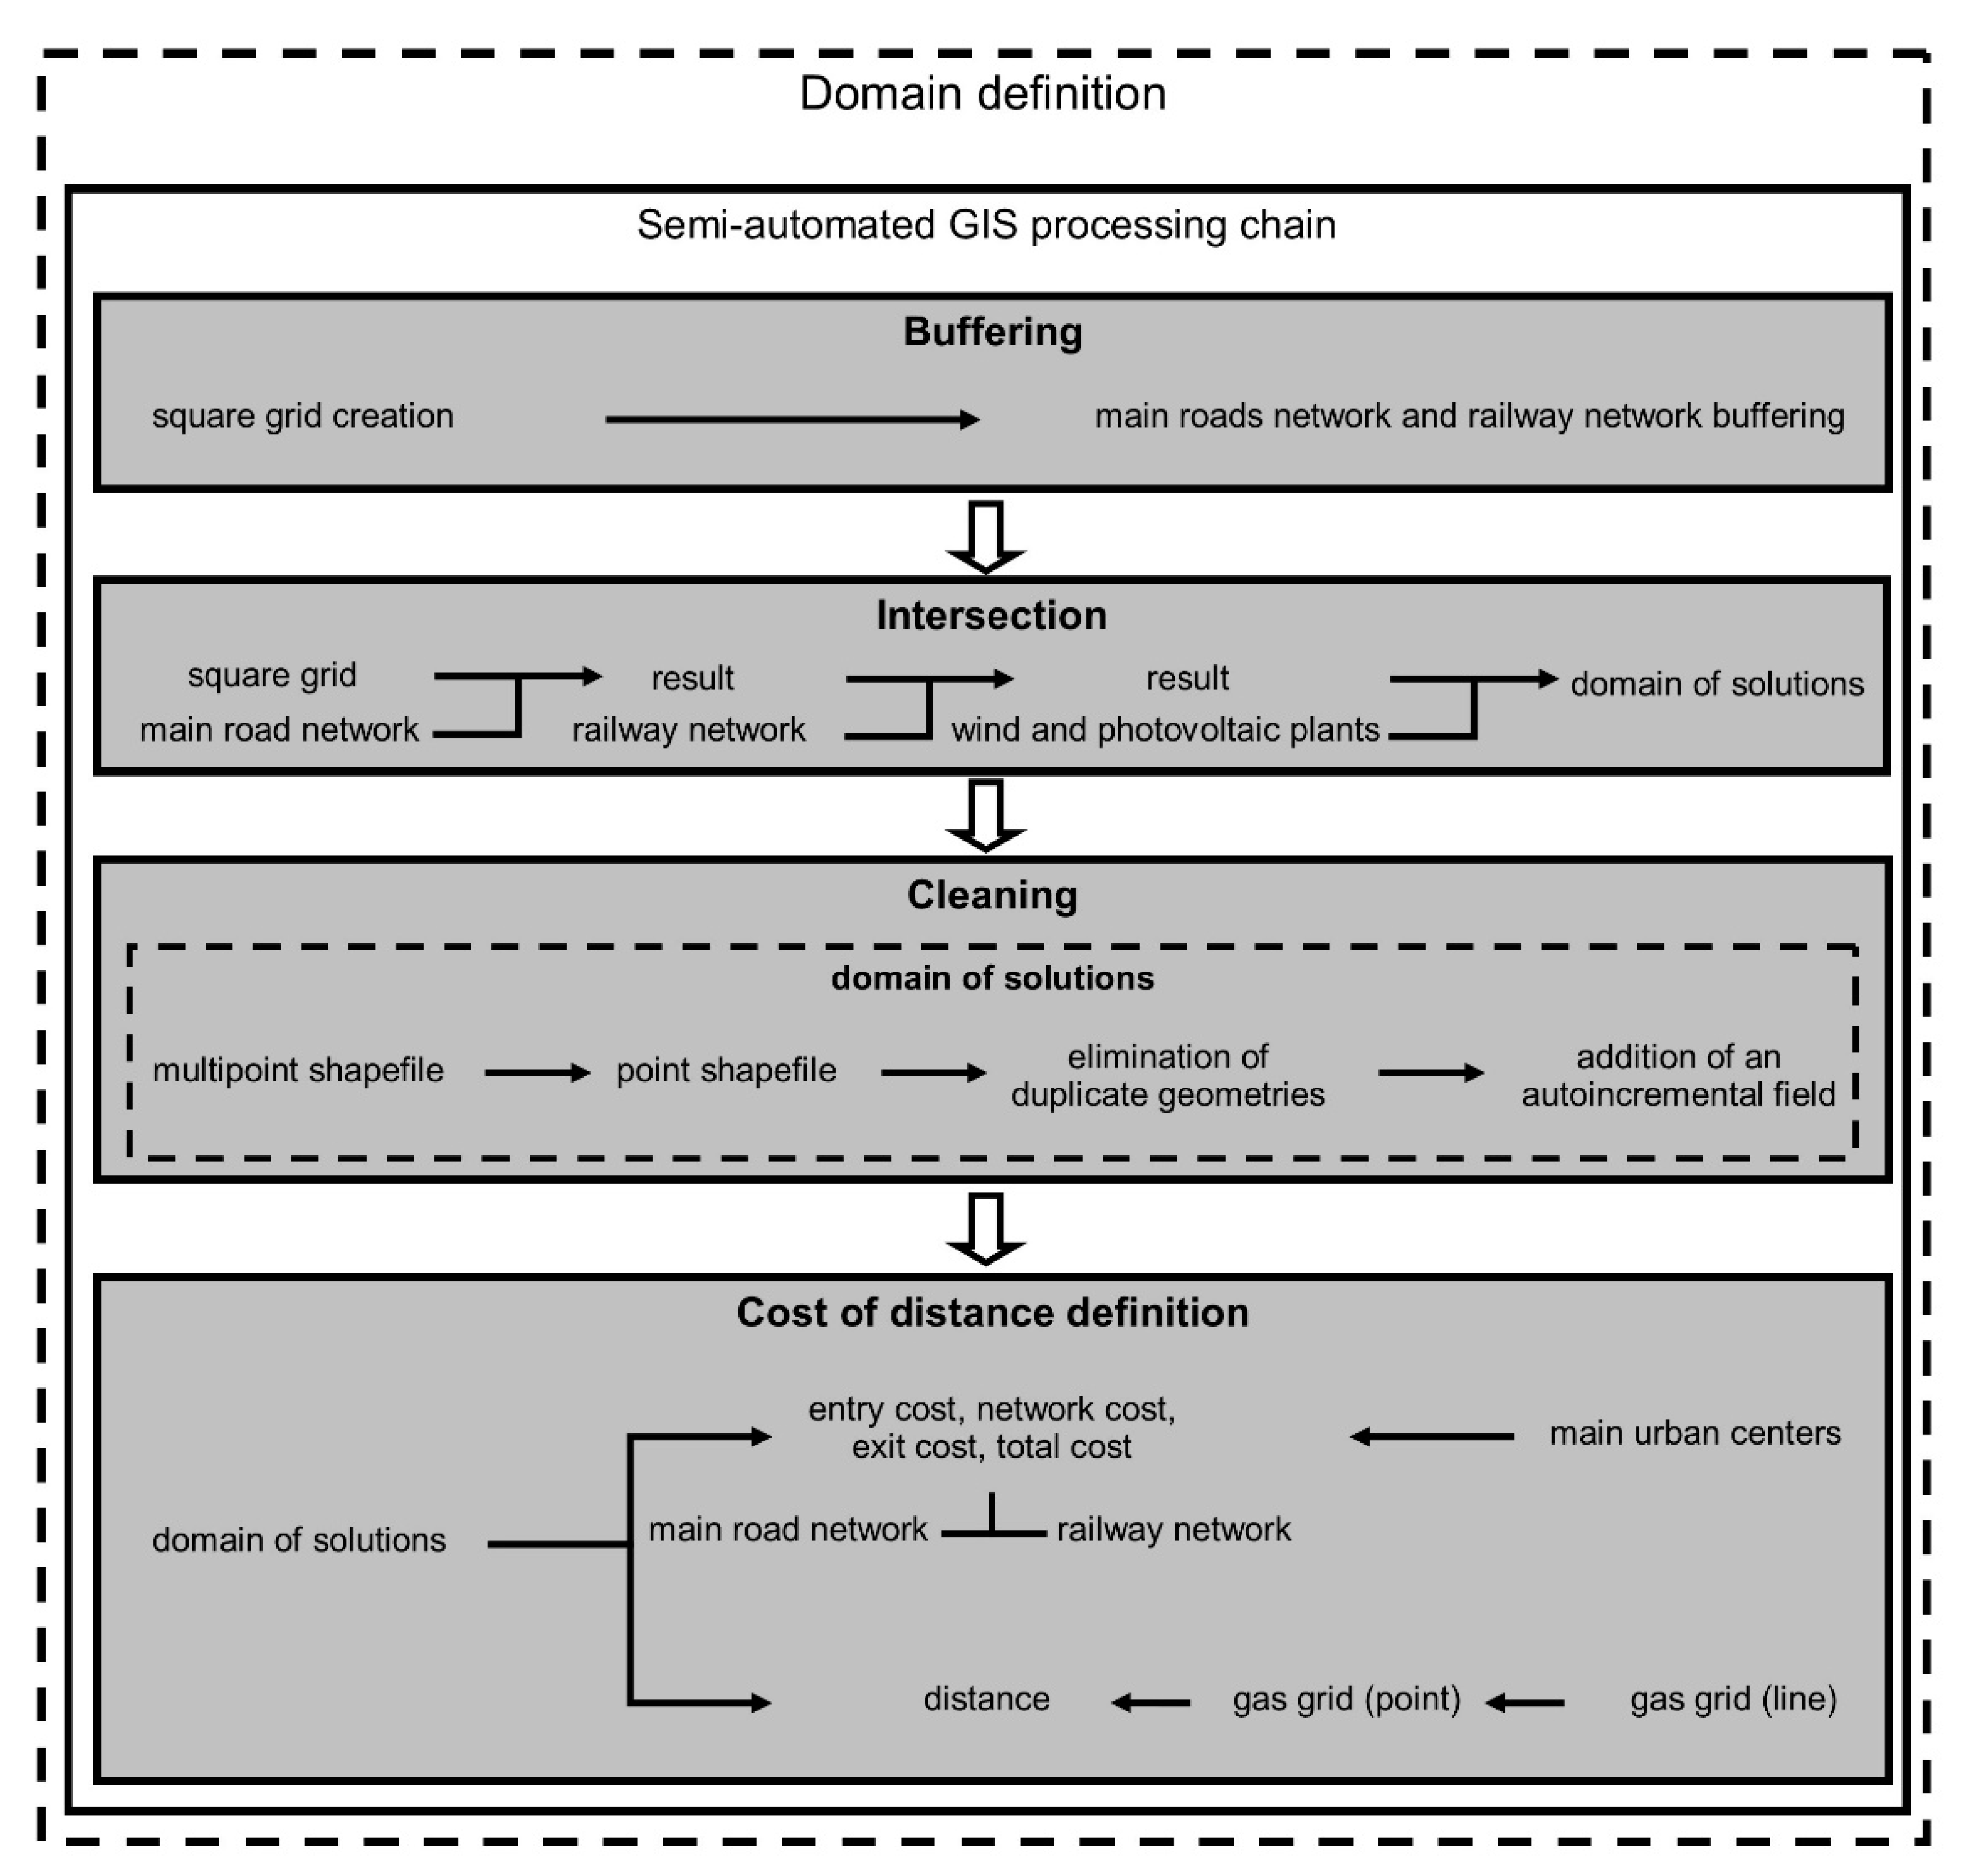
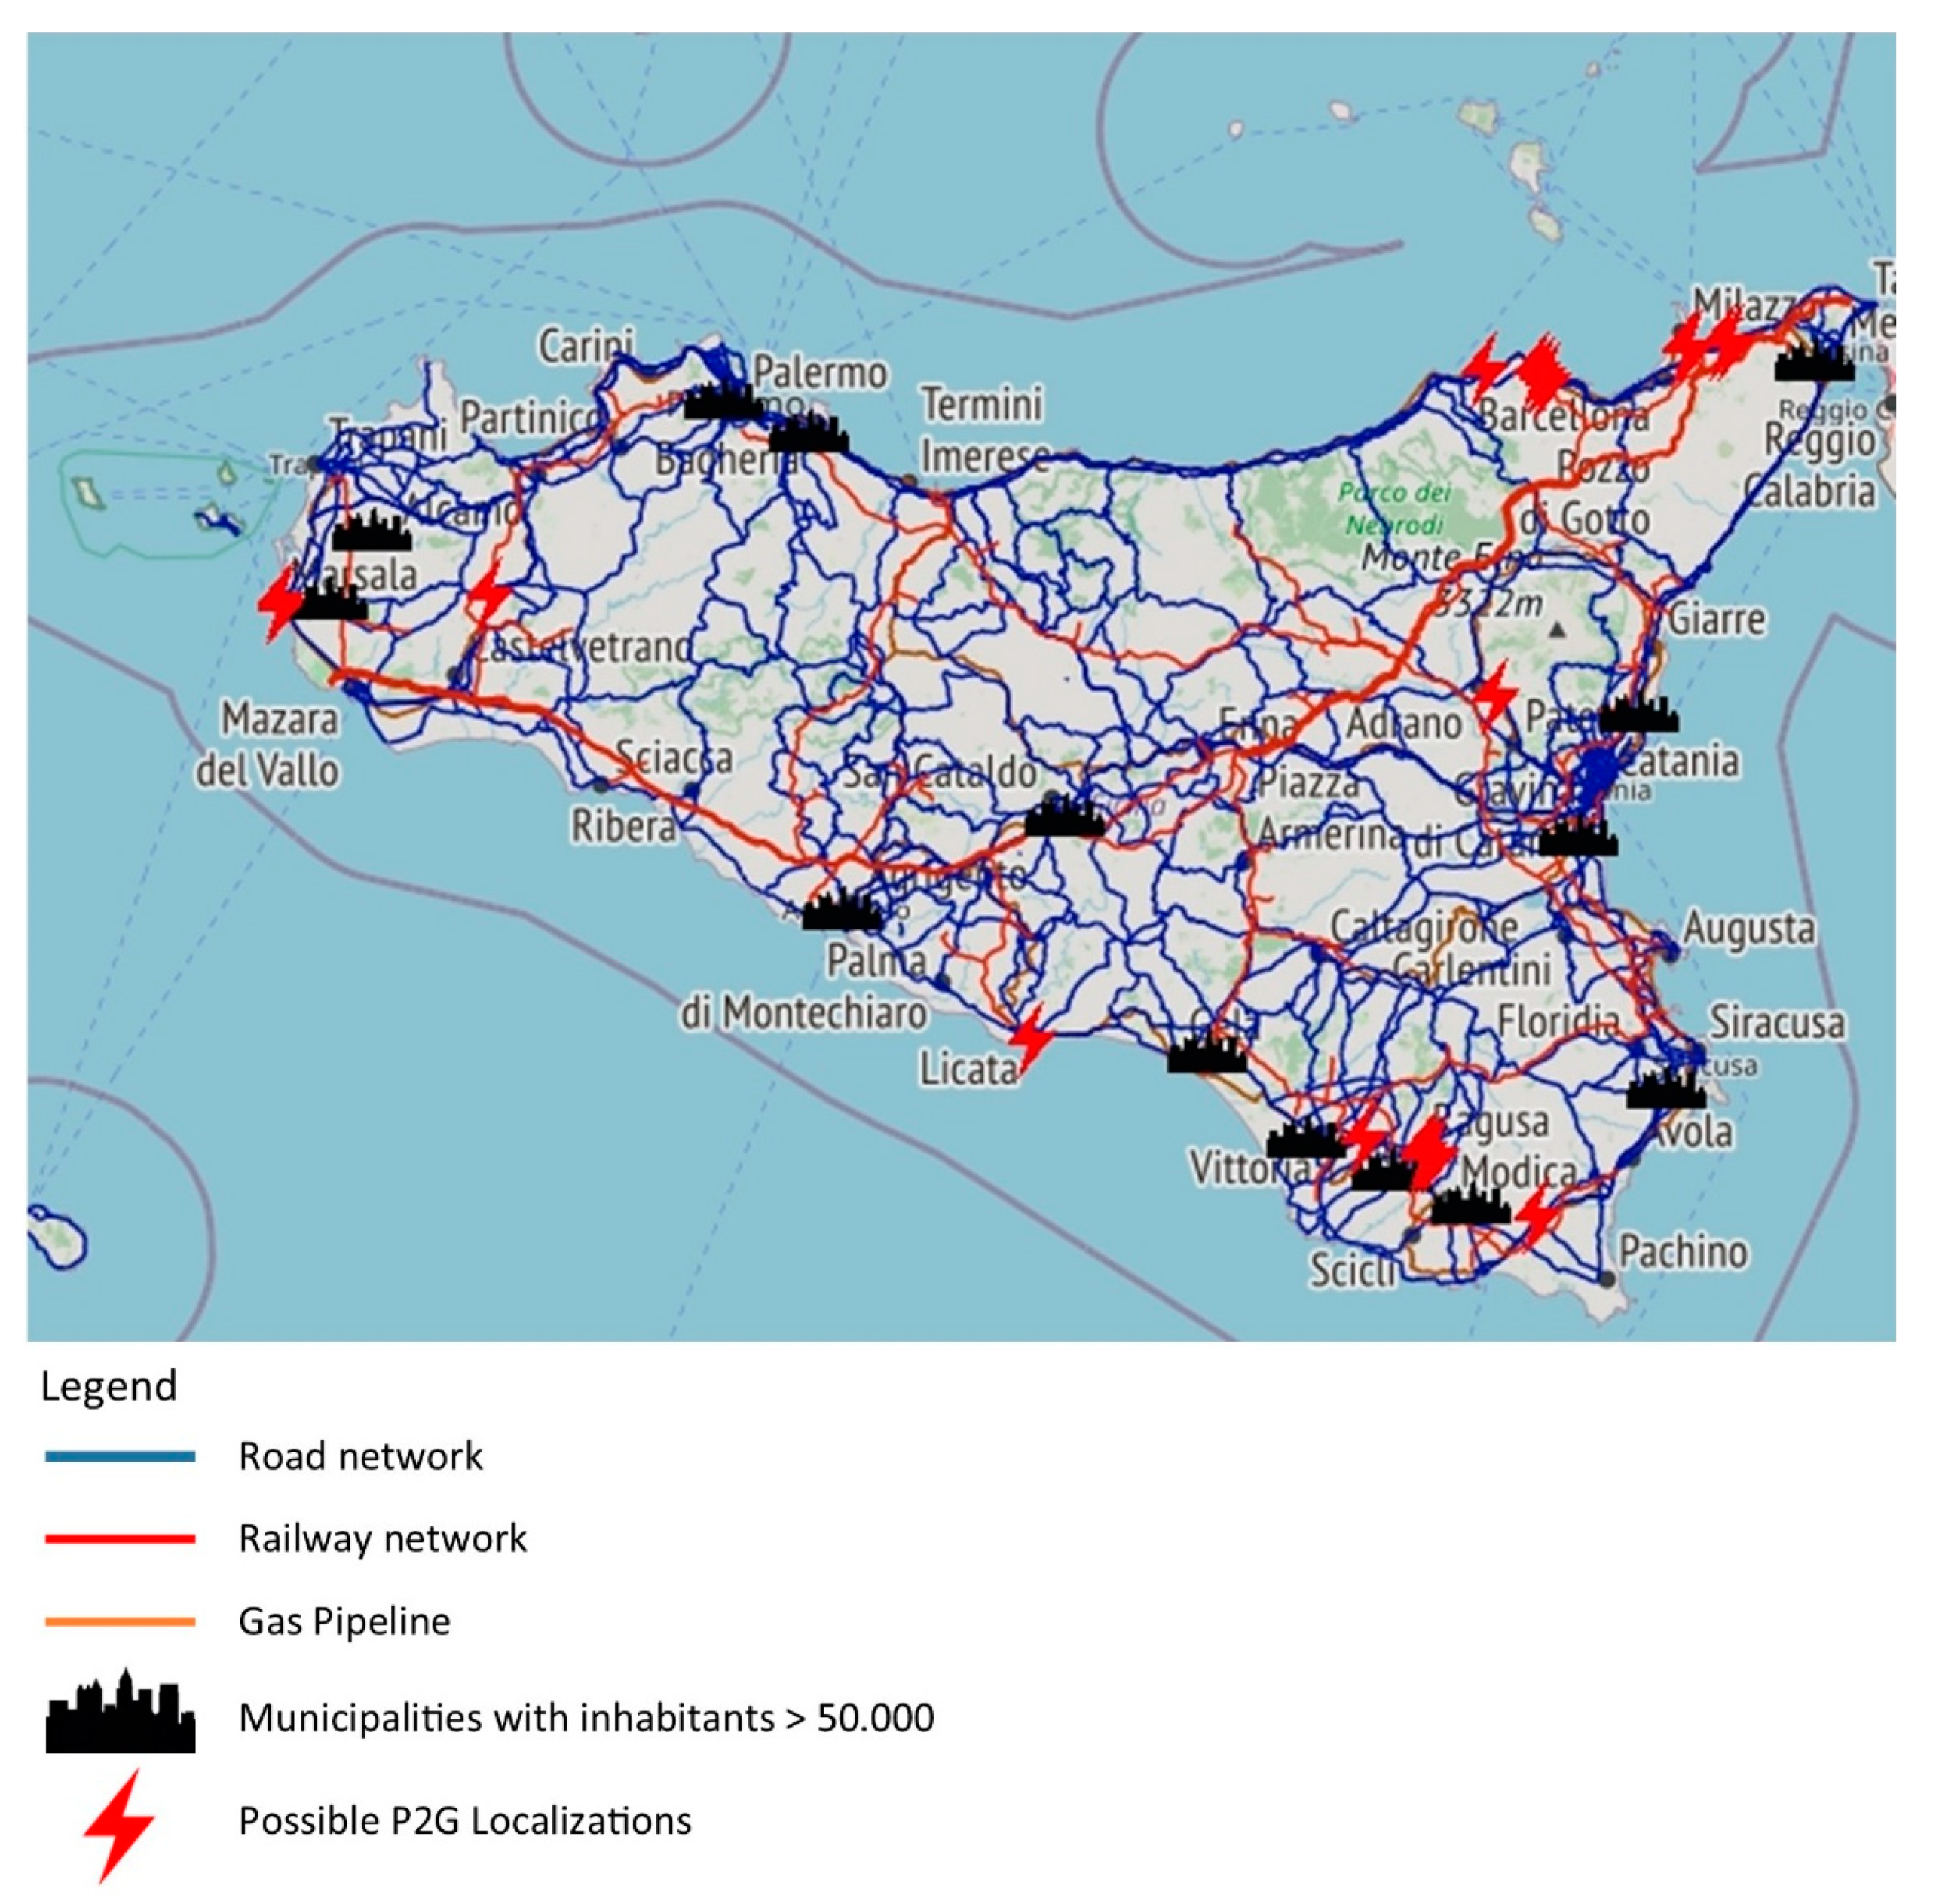
  • The hydrogen demand, considered proportional to the population of the main inhabited centers.
  • The supply energy from the existing photovoltaic and wind facilities settled in Sicily.
  • The distances between the hydrogen demand nodes and supply energy nodes considering different networks (main roads, railway, and pipeline).
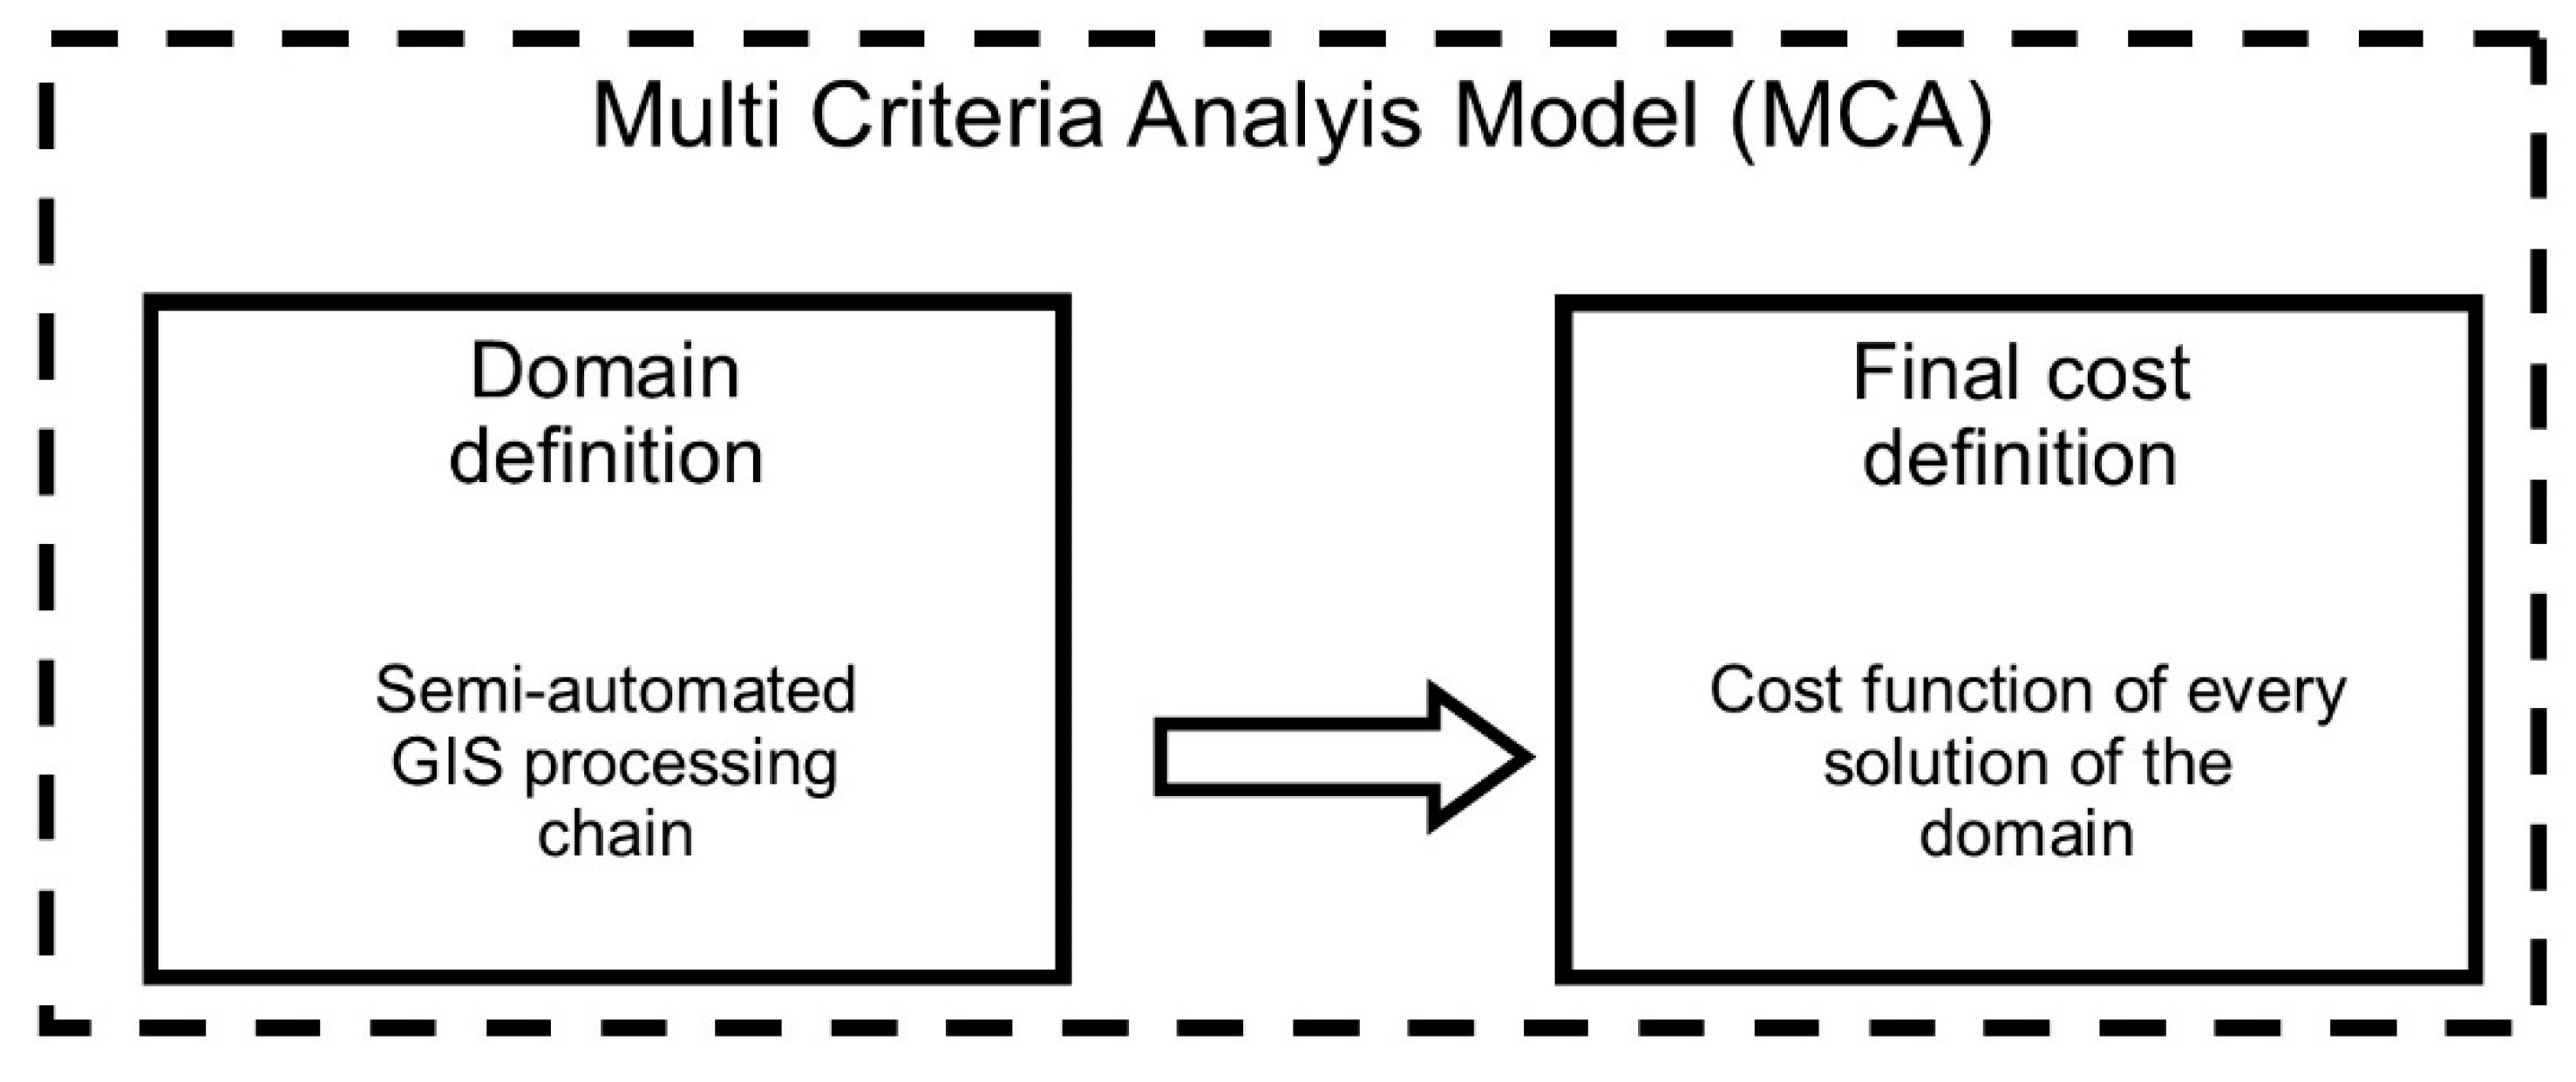
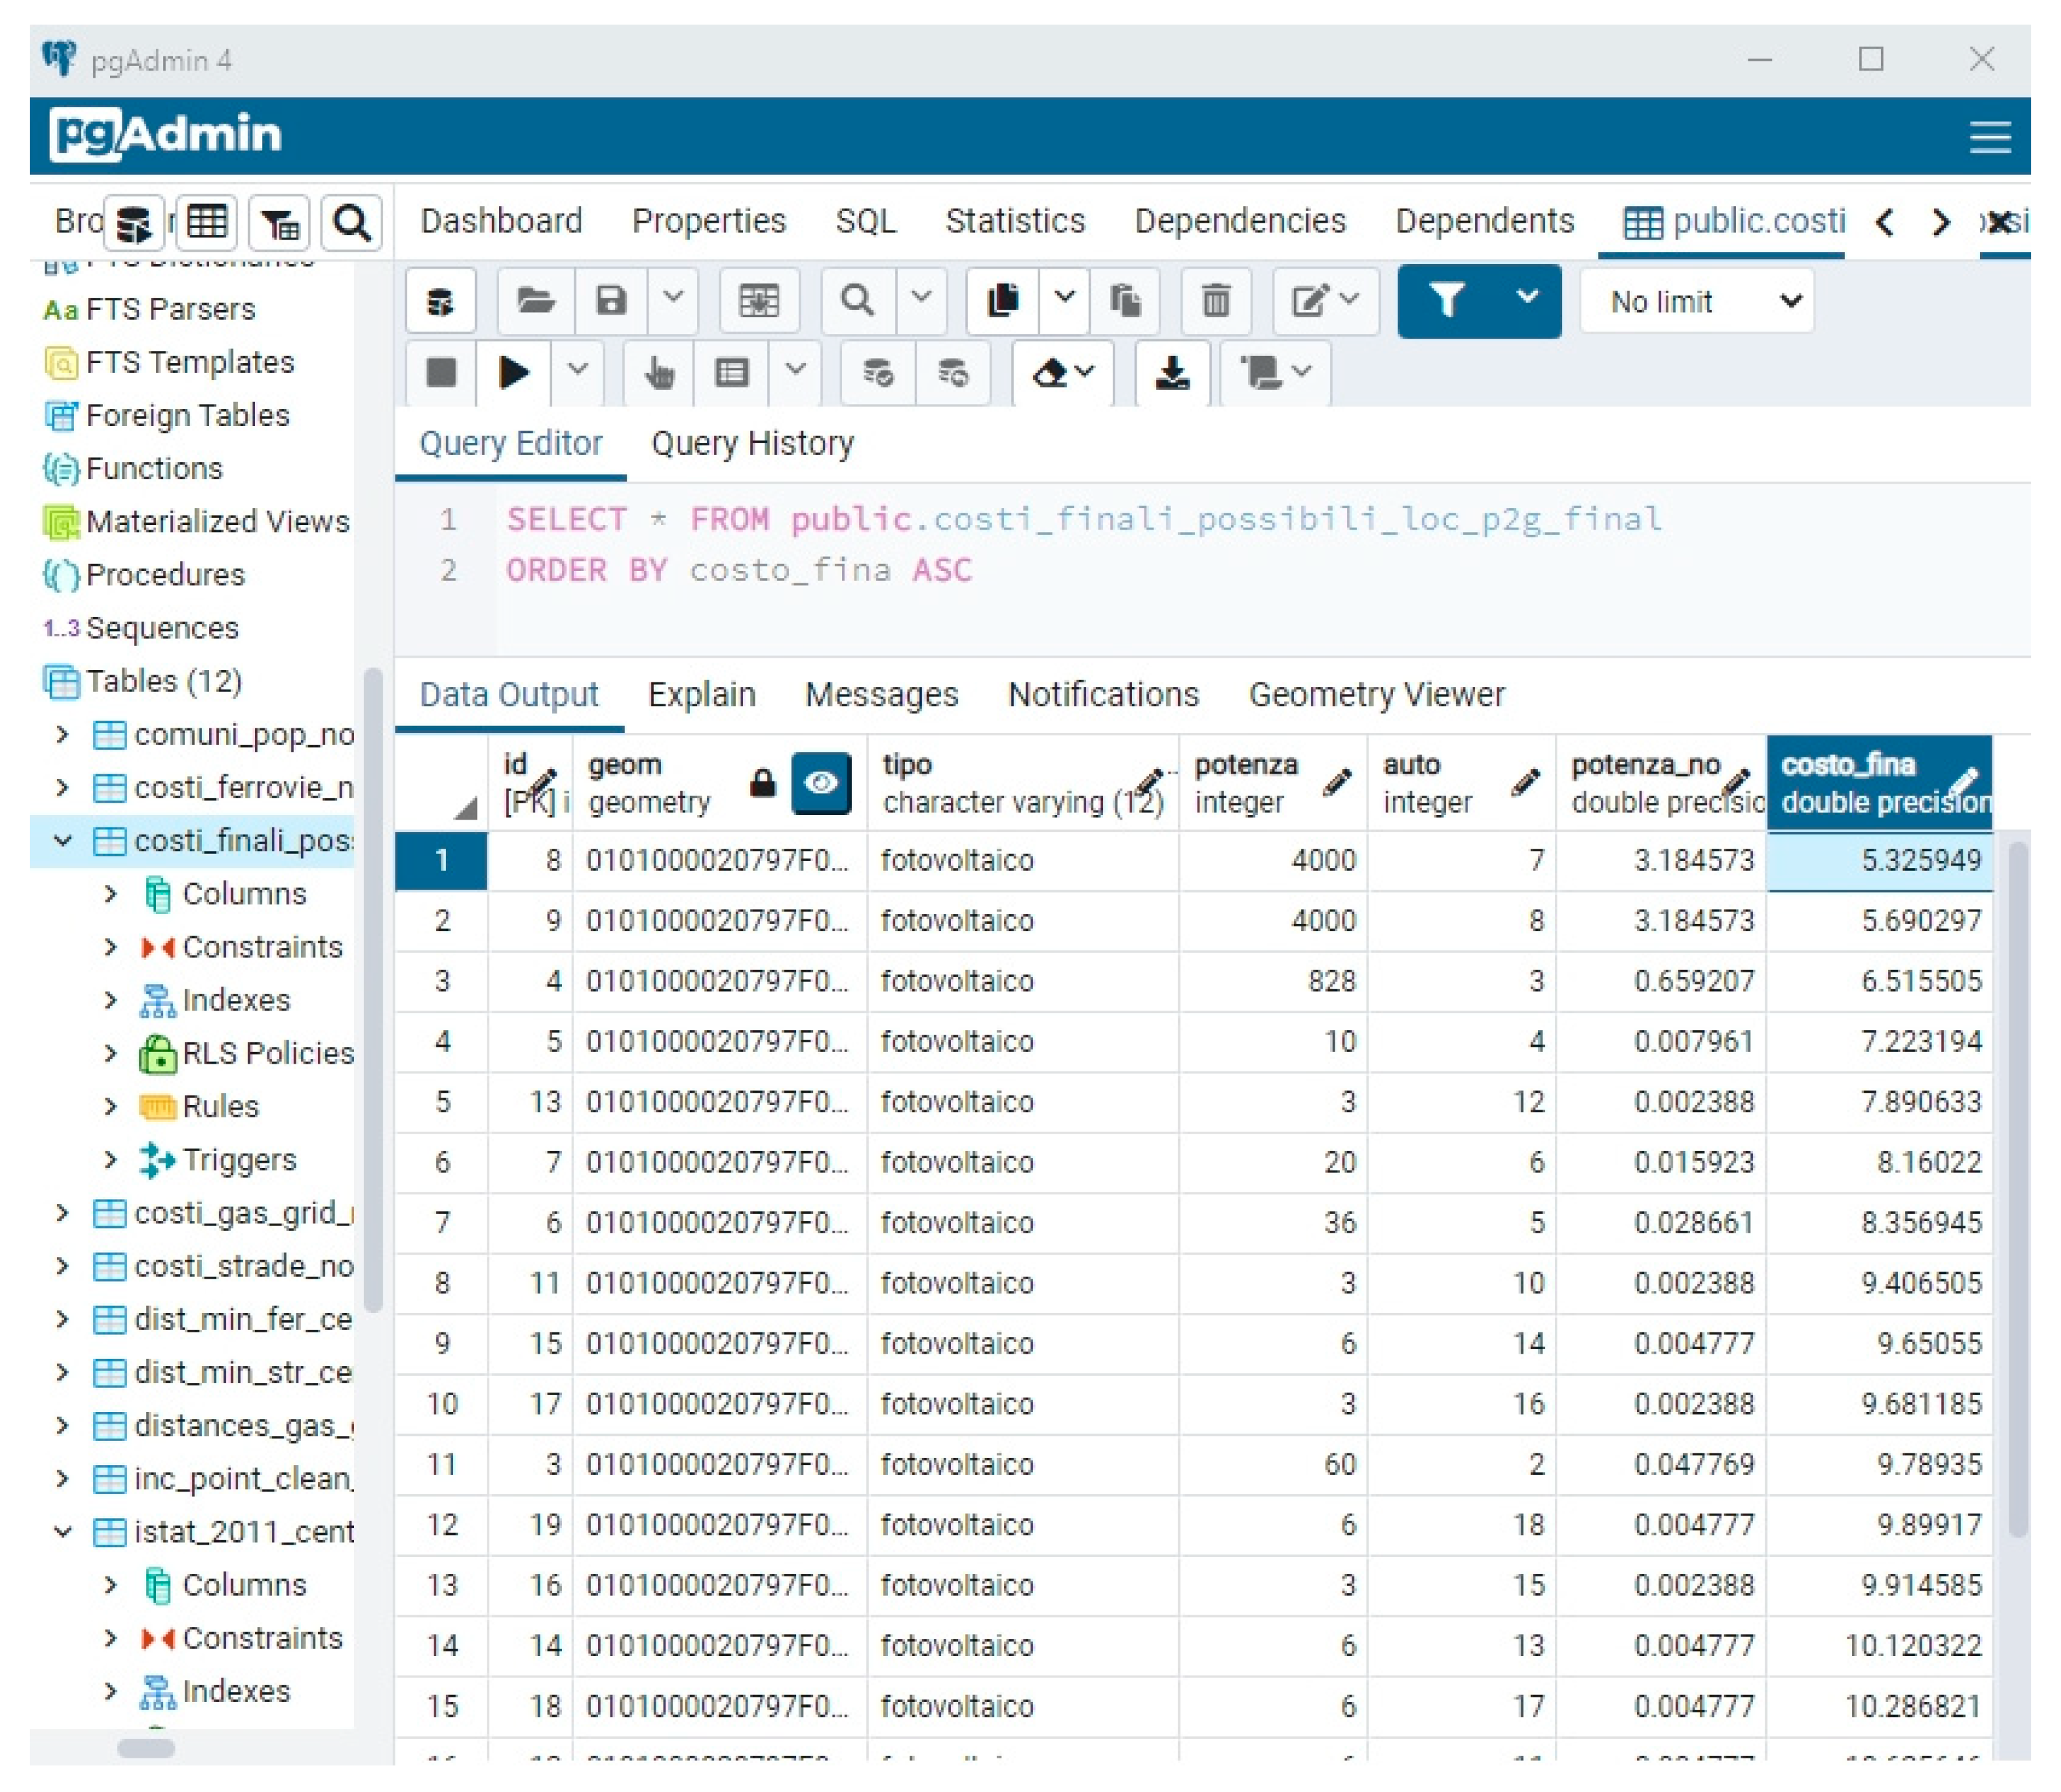
  • The cost function is calculated for every possible solution within the domain of possible localizations.
The details regarding construction of the cost function are the subject of a further work. The calculation of the final cost is implemented in Matlab software, with a proper script that calls locally the dataset generated from the geomatic processing in QGIS (“Shaperead” function). The factors are then normalized in Matlab and each element of the final cost vector is calculated considering the hydrogen demand, the supply energy, and the distances.
Once obtained, the total cost of every solution (that represents every possible P2G plant localization of the domain) is registered in a proper field of the shapefile and remotely exported from Matlab software into the RDBMS database (“Shapewrite” function).

4. Final Results: The WebGIS Platform

The developed processing chain, as defined before, starts with the implementation of the original shapefiles in QGIS. Then, activating the GIS processing chain, specialists automatically define in a few minutes the discretized domain of possible solutions using the structured process in QGIS. The shapefile containing the domain of possible solutions is subsequently elaborated in MATLAB, defining the total cost of each solution in a few seconds, and then reloaded in QGIS.
The complete dataset of the Mediterranean Island contains the involved infrastructures (railway, main road network, main gas pipeline), the existing wind and photovoltaic power plants, and finally, the domain of the possible new P2G installation with the indication of the relative cost (Figure 4). The entire dataset is remotely loaded from QGIS into Postgres, the RDBMS opensource database, with the PostGIS geospatial extension.
The RDBMS database is real-time remotely connected with GeoServer, an opensource server for geospatial datasets. Geoserver stores the dataset loaded from Postgres and activates the WMS (Web Map Service) service, necessary for the WebGIS implementation. In Geoserver the style of visualization of every shapefile of the dataset is edited in proper .css files.
Once the WMS service is activated, the WebGIS visualization is built in an .html template, through the implementation of Open Layers libraries. These javascript libraries allow the web visualization of the map inside the .html page, editing the template and calling the dataset stored in Geoserver through WMS service (Figure 5). It is also possible to make queries, allowing the exploration and the analysis of the entire dataset.
In this way, it is possible to analyze the results of the geomatic processing developed before, sharing the information about possible P2G installations in the territory of Sicily.
Specialists can navigate the map remotely, analyzing the territorial asset with the possibility of querying information on the included datasets. The WebGIS integration is available for every kind of device (smartphones, tablets, PCs), because it is created inside the .html page and does not require any kind of client installation (Figure 6).

5. Discussion and Conclusions

The work described in this paper shows how Geomatics implementations could be useful in the field of energy, in particular in the localization of innovative power plant solutions like P2G. The semiautomated GIS processing chain here described allows to apply the MCA model in order to define the domain of possible P2G localizations. At the same time, the implemented WebGIS structure, based on the connection with Geoserver and Postgres, allows to visualize in real-time the entire dataset on the web nd to show the final cost of every possible solution. This kind of approach could be very useful in the future for the management of new energy policies based on hydrogen technologies, where it is necessary to analyze on web several kinds of datasets associated to the localization in real time. In fact, the design and the management of energy plants in the field of hydrogen technology need the integration of the datasets provided by the gas pipeline, electric network, transport networks, energy demand, and energy production. In this complex scenario, the integration of a WebGIS system, real time connected with a relational database, is very useful to provide the necessary services for the management of the network. In the future, further integrations will help to automate the studied framework, in order to optimize the structure of the WebGIS platform. At the same time, new tests in the field of P2G technology and the development of new policies associated to it, will suggest further integrations to be considered in the framework.

Author Contributions

Conceptualization, Marcello La Guardia, Filippo D’Ippolito and Maurizio Cellura; methodology, Marcello La Guardia, Filippo D’Ippolito and Maurizio Cellura; software, Marcello La Guardia, Filippo D’Ippolito and Maurizio Cellura; validation, Marcello La Guardia, Filippo D’Ippolito and Maurizio Cellura; formal analysis, Marcello La Guardia, Filippo D’Ippolito and Maurizio Cellura; investigation, Marcello La Guardia, Filippo D’Ippolito and Maurizio Cellura; resources, Marcello La Guardia, Filippo D’Ippolito and Maurizio Cellura; data curation, Marcello La Guardia, Filippo D’Ippolito and Maurizio Cellura; writing—original draft preparation, Marcello La Guardia, Filippo D’Ippolito and Maurizio Cellura; writing—review and editing, Marcello La Guardia, Filippo D’Ippolito and Maurizio Cellura; visualization, Marcello La Guardia, Filippo D’Ippolito and Maurizio Cellura; supervision, Marcello La Guardia, Filippo D’Ippolito and Maurizio Cellura; funding acquisition, Marcello La Guardia, Filippo D’Ippolito and Maurizio Cellura. All authors have read and agreed to the published version of the manuscript.

Funding

This research received no external funding.

Conflicts of Interest

The authors declare no conflict of interest.

References

  1. Simonis, B.; Newborough, M. Sizing and operating power-to-gas systems to absorb excess renewable electricity. Int. J. Hydrog. Energy 2017, 42, 21635–21647. [Google Scholar] [CrossRef]
  2. McDonagh, S.; O’Shea, R.; Wall, D.M.; Deane, J.P.; Murphy, J.D. Modelling of a power-to-gas system to predict the levelised cost of energy of an advanced renewable gaseous transport fuel. Appl. Energy 2018, 215, 444–456. [Google Scholar] [CrossRef]
  3. Thema, M.; Bauer, F.; Sterner, M. Power-to-Gas: Electrolysis and methanation status review. Renew. Sustain. Energy Rev. 2019, 112, 775–787. [Google Scholar] [CrossRef]
  4. Götz, M.; Lefebvre, J.; Mörs, F.; McDaniel Kock, A.; Graf, F.; Bajohr, S.; Reinmert, R.; Kolb, T. Renewable Power-to-Gas: A technological and economic review. Renew. Energy 2016, 85, 1371–1390. [Google Scholar] [CrossRef] [Green Version]
  5. Gahleitner, G. Hydrogen from renewable electricity: An international review of power-to-gas pilot plants for stationary applications. Int. J. Hydrog. Energy 2013, 38.5, 2039–2061. [Google Scholar] [CrossRef]
  6. Goodchild, M. Geographic information systems and science: Today and tomorrow. Ann. GIS 2009, 15, 3–9. [Google Scholar] [CrossRef] [Green Version]
  7. Resch, B.; Sagl, G.; Törnros, T.; Bachmaier, A.; Eggers, J.-B.; Herkel, S.; Narmsara, S.; Gündra, H. GIS-Based Planning and Modeling for Renewable Energy: Challenges and Future Research Avenues. ISPRS Int. J. Geo-Inf. 2014, 3, 662–692. [Google Scholar] [CrossRef]
  8. Guo, J.; Fast, V.; Teri, P.; Calvert, K. Integrating Land-Use and Renewable Energy Planning Decisions: A Technical Mapping Guide for Local Government. ISPRS Int. J. Geo-Inf. 2020, 9, 324. [Google Scholar] [CrossRef]
  9. Miller, A.; Li, R. A Geospatial Approach for Prioritizing Wind Farm Development in Northeast Nebraska, USA. ISPRS Int. J. Geo-Inf. 2014, 3, 968–979. [Google Scholar] [CrossRef] [Green Version]
  10. Viana, H.; Cohen, W.B.; Lopes, D.; Aranha, J. Assessment of forest biomass for use as energy. GIS-based analysis of geographical availability and locations of wood-fired power plants in Portugal. Appl. Energy 2010, 87, 2551–2560. [Google Scholar] [CrossRef]
  11. Brahma, A.; Saikia, K.; Hiloidhari, M.; Baruah, D.C. GIS based planning of a biomethanation power plant in Assam, India. Renew. Sustain. Energy Rev. 2016, 62, 596–608. [Google Scholar] [CrossRef]
  12. Atici, K.B.; Simsek, A.B.; Ulucan, A.; Tosun, M.U. A GIS-based Multiple Criteria Decision Analysis approach for wind power plant site selection. Util. Policy 2015, 37, 86–96. [Google Scholar] [CrossRef]
  13. Feyzi, S.; Khanmohammadi, M.; Abedinzadeh, N.; Aalipour, M. Multi- criteria decision analysis FANP based on GIS for siting municipal solid waste incineration power plant in the north of Iran. Sustain. Cities Soc. 2019, 47, 101513. [Google Scholar] [CrossRef]
  14. Al Garni, H.Z.; Awasthi, A. Solar PV power plant site selection using a GIS-AHP based approach with application in Saudi Arabia. Appl. Energy 2017, 206, 1225–1240. [Google Scholar] [CrossRef]
  15. Albraheem, L.; Alabdulkarim, L. Geospatial Analysis of Solar Energy in Riyadh Using a GIS-AHP-Based Technique. ISPRS Int. J. Geo-Inf. 2021, 10, 291. [Google Scholar] [CrossRef]
  16. Li, W.; Zlatanova, S.; Diakite, A.A.; Aleksandrov, M.; Yan, J. Towards Integrating Heterogeneous Data: A Spatial DBMS Solution from a CRC-LCL Project in Australia. ISPRS Int. J. Geo-Inf. 2020, 9, 63. [Google Scholar] [CrossRef] [Green Version]
  17. Noskov, A. Smart City Webgis Applications: Proof of Work Concept For High-Level Quality-Of-Service Assurance. ISPRS Ann. Photogramm. Remote Sens. Spatial Inf. Sci 2018, IV-4/W7, 99–106. [Google Scholar] [CrossRef] [Green Version]
  18. Grippa, T.; Lennert, M.; Beaumont, B.; Vanhuysse, S.; Stephenne, N.; Wolff, E. An Open-Source Semi-Automated Processing Chain for Urban Object-Based Classification. Remote Sens. 2017, 9, 358. [Google Scholar] [CrossRef] [Green Version]
  19. Neteler, M.; Bowman, M.H.; Landa, M.; Metz, M. GRASS GIS: A multi-purpose open source GIS. Environ. Model. Softw. 2012, 31, 124–130. [Google Scholar] [CrossRef] [Green Version]
  20. Neteler, M.; Beaudette, D.; Cavallini, P.; Lami, L.; Cepicky, J. GRASS GIS. In Open Source Approaches in Spatial Data Handling. Advances in Geographic Information Science; Hall, G.B., Leahy, M.G., Eds.; Springer: Berlin/Heidelberg, Germany, 2008; Volume 2, pp. 171–199. [Google Scholar] [CrossRef]
  21. Graser, A.; Olaya, V. Processing: A Python Framework for the Seamless Integration of Geoprocessing Tools in QGIS. ISPRS Int. J. Geo-Inf. 2015, 4, 2219–2245. [Google Scholar] [CrossRef]
  22. Pasquaré Mariotto, F.; Antoniou, V.; Drymoni, K.; Bonali, F.L.; Nomikou, P.; Fallati, L.; Karatzaferis, O.; Vlasopoulos, O. Virtual Geosite Communication through a WebGIS Platform: A Case Study from Santorini Island (Greece). Appl. Sci. 2021, 11, 5466. [Google Scholar] [CrossRef]
  23. Balla, D.; Zichar, M.; Tóth, R.; Kiss, E.; Karancsi, G.; Mester, T. Geovisualization Techniques of Spatial Environmental Data Using Different Visualization Tools. Appl. Sci. 2020, 10, 6701. [Google Scholar] [CrossRef]
  24. Scianna, A.; Gaglio, G.F.; La Guardia, M.; Nuccio, G. Development of a Virtual CH Path on WEB: Integration of a GIS, VR, and Other Multimedia Data. In Digital Heritage. Progress in Cultural Heritage: Documentation, Preservation, and Protection. EuroMed 2020. Lecture Notes in Computer Science; Ioannides, M., Fink, E., Cantoni, L., Champion, E., Eds.; Springer: Cham, Switzerland, 2021; Volume 12642, pp. 178–189. [Google Scholar] [CrossRef]
  25. Carbonell-Carrera, C.; Saorin, J.L.; Melián Díaz, D. User VR Experience and Motivation Study in an Immersive 3D Geovisualization Environment Using a Game Engine for Landscape Design Teaching. Land 2021, 10, 492. [Google Scholar] [CrossRef]
  26. Woo, H.; Acuna, M.; Moroni, M.; Taskhiri, M.S.; Turner, P. Optimizing the Location of Biomass Energy Facilities by Integrating Multi-Criteria Analysis (MCA) and Geographical Information Systems (GIS). Forests 2018, 9, 585. [Google Scholar] [CrossRef] [Green Version]
  27. Tahvanainen, T.; Anttila, P. Supply chain cost analysis of long-distance transportation of energy wood in Finland. Biomass Bioenergy 2011, 35, 3360–3375. [Google Scholar] [CrossRef]
  28. Al-Kurdi, N.; Pillot, B.; Gervet, C.; Linguet, L. Towards Robust Scenarios of Spatio-Temporal Renewable Energy Planning: A GIS-RO Approach. In Principles and Practice of Constraint Programming. CP 2019. Lecture Notes in Computer Science; Schiex, T., de Givry, S., Eds.; Springer: Cham, Switzerland, 2019; Volume 11802, pp. 729–747. [Google Scholar] [CrossRef] [Green Version]
  29. Liu, J.; Xu, F.; Lin, S. Site selection of photovoltaic power plants in a value chain based on grey cumulative prospect theory for sustainability: A case study in Northwest China. J. Clean. Prod. 2017, 148, 386–397. [Google Scholar] [CrossRef]
  30. Janke, J.R. Multicriteria GIS modeling of wind and solar farms in Colorado. Renew. Energy 2010, 35, 2228–2234. [Google Scholar] [CrossRef]
  31. Sánchez-Lozano, J.M.; Antunes, C.H.; García-Cascales, M.S.; Dias, L.C. GIS-based photovoltaic solar farms site selection using ELECTRE-TRI: Evaluating the case for Torre Pacheco, Murcia, Southeast of Spain. Renew. Energy 2014, 66, 478–494. [Google Scholar] [CrossRef]
  32. Vosgerau, H.; Mathiesen, A.; Sparre Andersen, M.; Boldreel, L.O.; Hjuler, M.L.; Kamla, E.; Kristensen, L.; Brogaard Pedersen, C.; Pjetursson, B.; Nielsen, L.H. A WebGIS portal for exploration of deep geothermal energy based on geological and geophysical data. GEUS Bull. 2016, 35, 23–26. [Google Scholar] [CrossRef]
  33. Maffeis, G.; Roncolato, D.; Cherubini, A.; Bernardoni, A.; Boccardi, S.; Greco, A.; Chiesa, A.; Brolis, M.; Fasano, M. BIOPOLE: WebGIS-Based Decision Support System (DSS) in Bio-Energy Plant Localization. Int. Congr. Environ. Model. Softw. 2012, 278. Available online: https://scholarsarchive.byu.edu/iemssconference/2012/Stream-B/278/ (accessed on 25 July 2021).
  34. Raffler, C. QNEAT3—QGIS Network Analysis Toolbox, 2018, Vienna. Available online: https://root676.github.io/ (accessed on 21 July 2021).
Figure 1. The framework. The starting dataset loaded in Qgis is elaborated with GIS processing. Matlab integration allows to build the cost function from the QGIS dataset and to resend the updated version of the dataset to QGIS. The final dataset is then stored in Postgres (the RDBMS server) and real-time connected with Geoserver. The Open-Layers interface allows the WebGIS visualization connecting the .html page with Geoserver through WMS service.
Ijgi 10 00671 g001
Figure 2. The structure of the MCA model.
Ijgi 10 00671 g002
Figure 3. The framework of semi-automated GIS processing. Every step of the domain definition is handled manually in QGIS software, connecting each one with the previous and the next one. Once activated, it automatically works, performing the steps consecutively.
Ijgi 10 00671 g003
Figure 4. The Postgres visualization of the domain of possible solutions sorted by final cost.
Ijgi 10 00671 g004
Figure 5. The structure of the WebGIS platform.
Ijgi 10 00671 g005
Figure 6. The real-time web visualization of the platform with the relative legend.
Ijgi 10 00671 g006
Table 1. The shapefiles involved in every step of the framework.
StepShapefilesType
Bufferingsquare gridpoint
railway networkline
main roads networkline
wind and photovoltaic plantspoint
Intersectionsquare gridpoint
railway network
main roads network
line
line
wind and photovoltaic plantspoint
Cleaningdomain of possible localizationsmultipoint
domain of possible localizationspoint
Cost of distances definitiondomain of possible localizationspoint
main urban centerspoint
main roads networkline
railway networkline
gas networkline
gas networkpoint
Table 2. The Geospatial operations involved in the semiautomated GIS processing.
ShapefileTypeGeospatial OperationProperties
square gridpointgrid creation1 * 1 km ext.
railway networklinebuffering0.5 * 0.5 km ext.
main roads networklinebuffering0.5 * 0.5 km ext.
wind and photovoltaic plantspointbuffering1 * 1 km ext.
square gridpointintersection in order of density
railway networkline
main roads networkline
wind and photovoltaic plantspoint
domain of possible localizationsmultipointmultipoint to point conversion
domain of possible localizationspointmultiple geometries removal
domain of possible localizationspointauto-incremental field addiction
domain of possible localizationspointOrigin-destination matrix (QNEAT)Shortest path
optimization
main urban centerspoint
main roads networkline
railway networkline
gas networklineline to point conversion5 m dist.
gas networkpointdistance from the nearest node
Publisher’s Note: MDPI stays neutral with regard to jurisdictional claims in published maps and institutional affiliations.

