
Accessibility Assessment of Buildings Based on Multi-Source Spatial Data: Taking Wuhan as a Case Study


Abstract
:1. Introduction
2. Literature Review
2.1. Accessibility Measurement for Communities
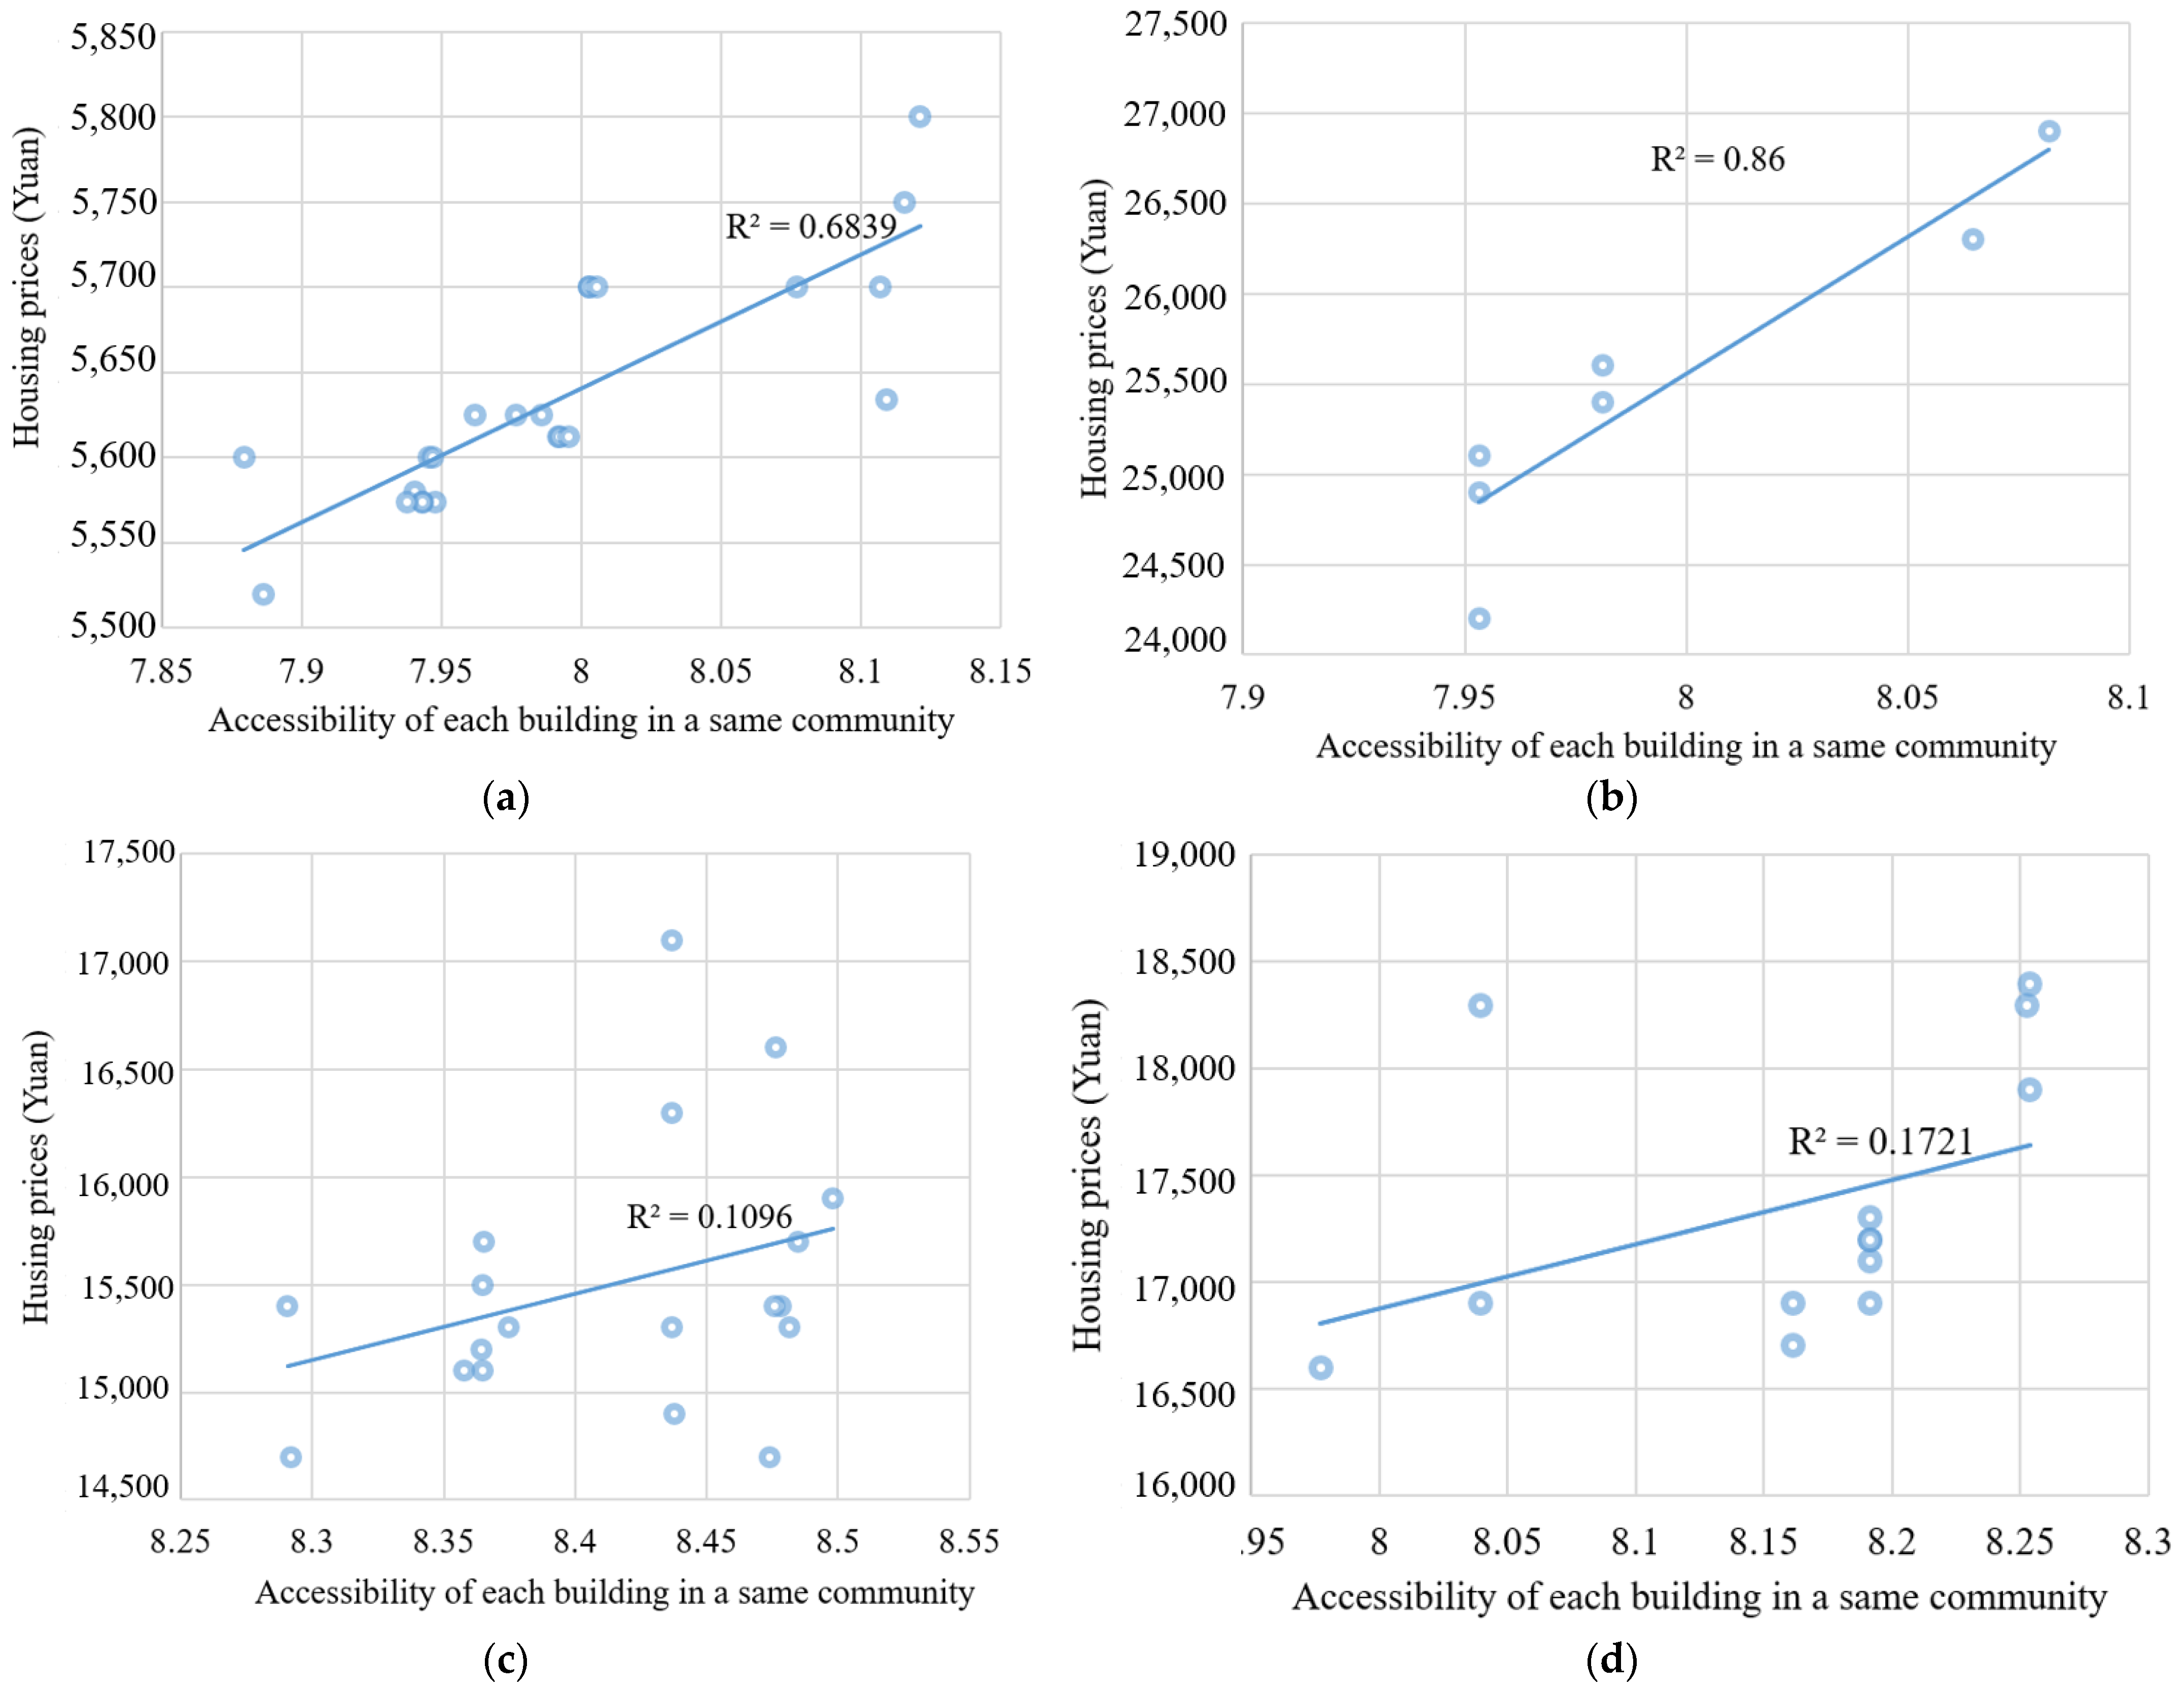
2.2. Social Impact Related to Housing Estate Accessibility
3. Methodology
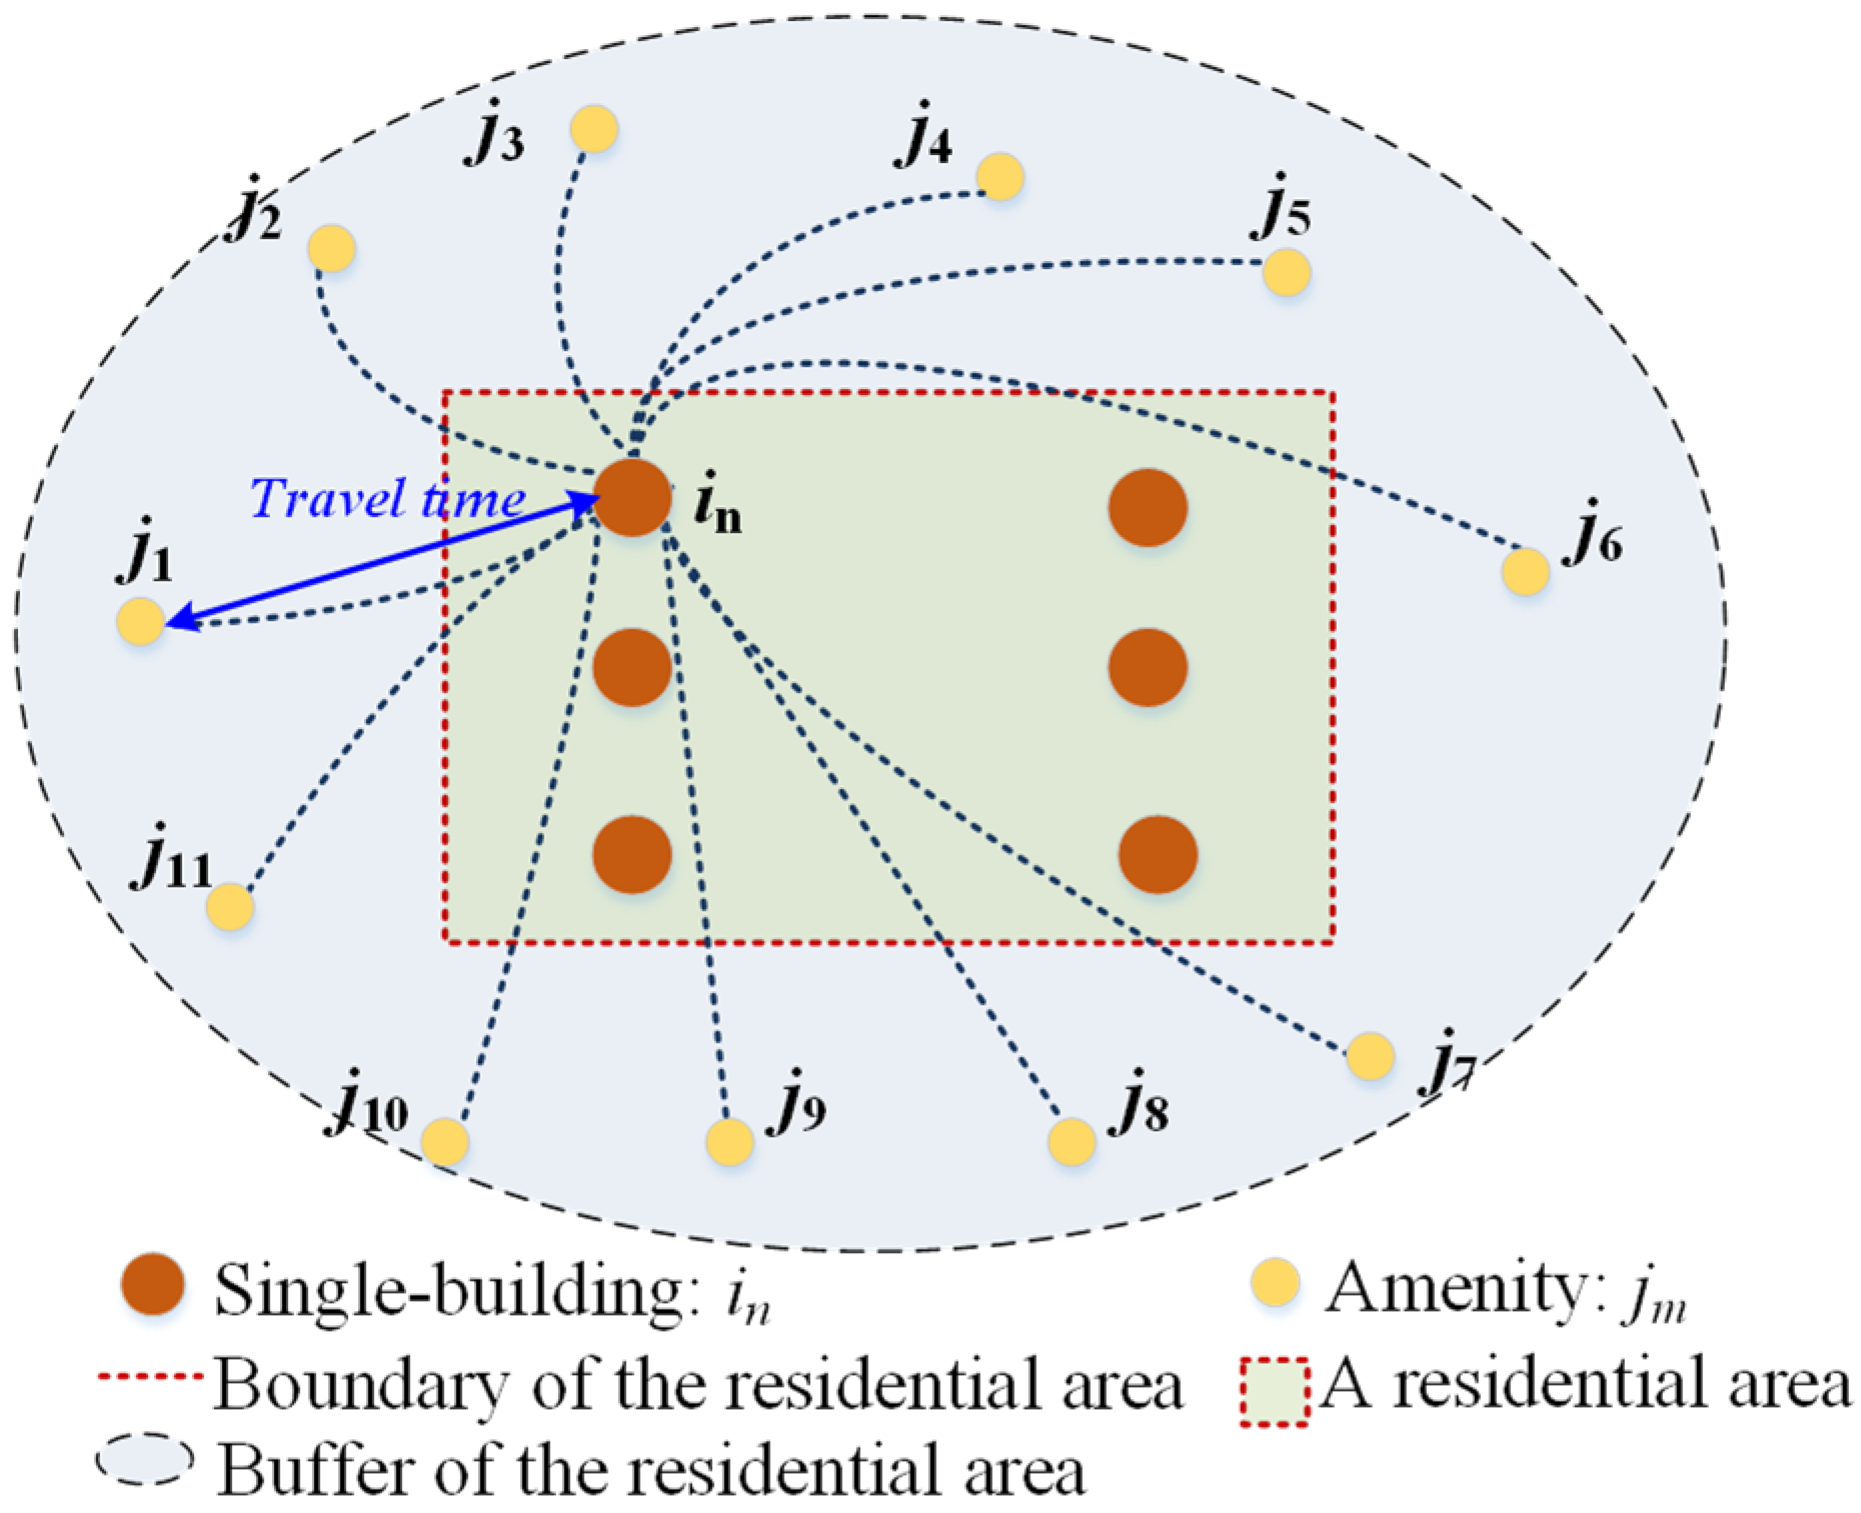
3.1. Modelling Accessibility of Housing Estate
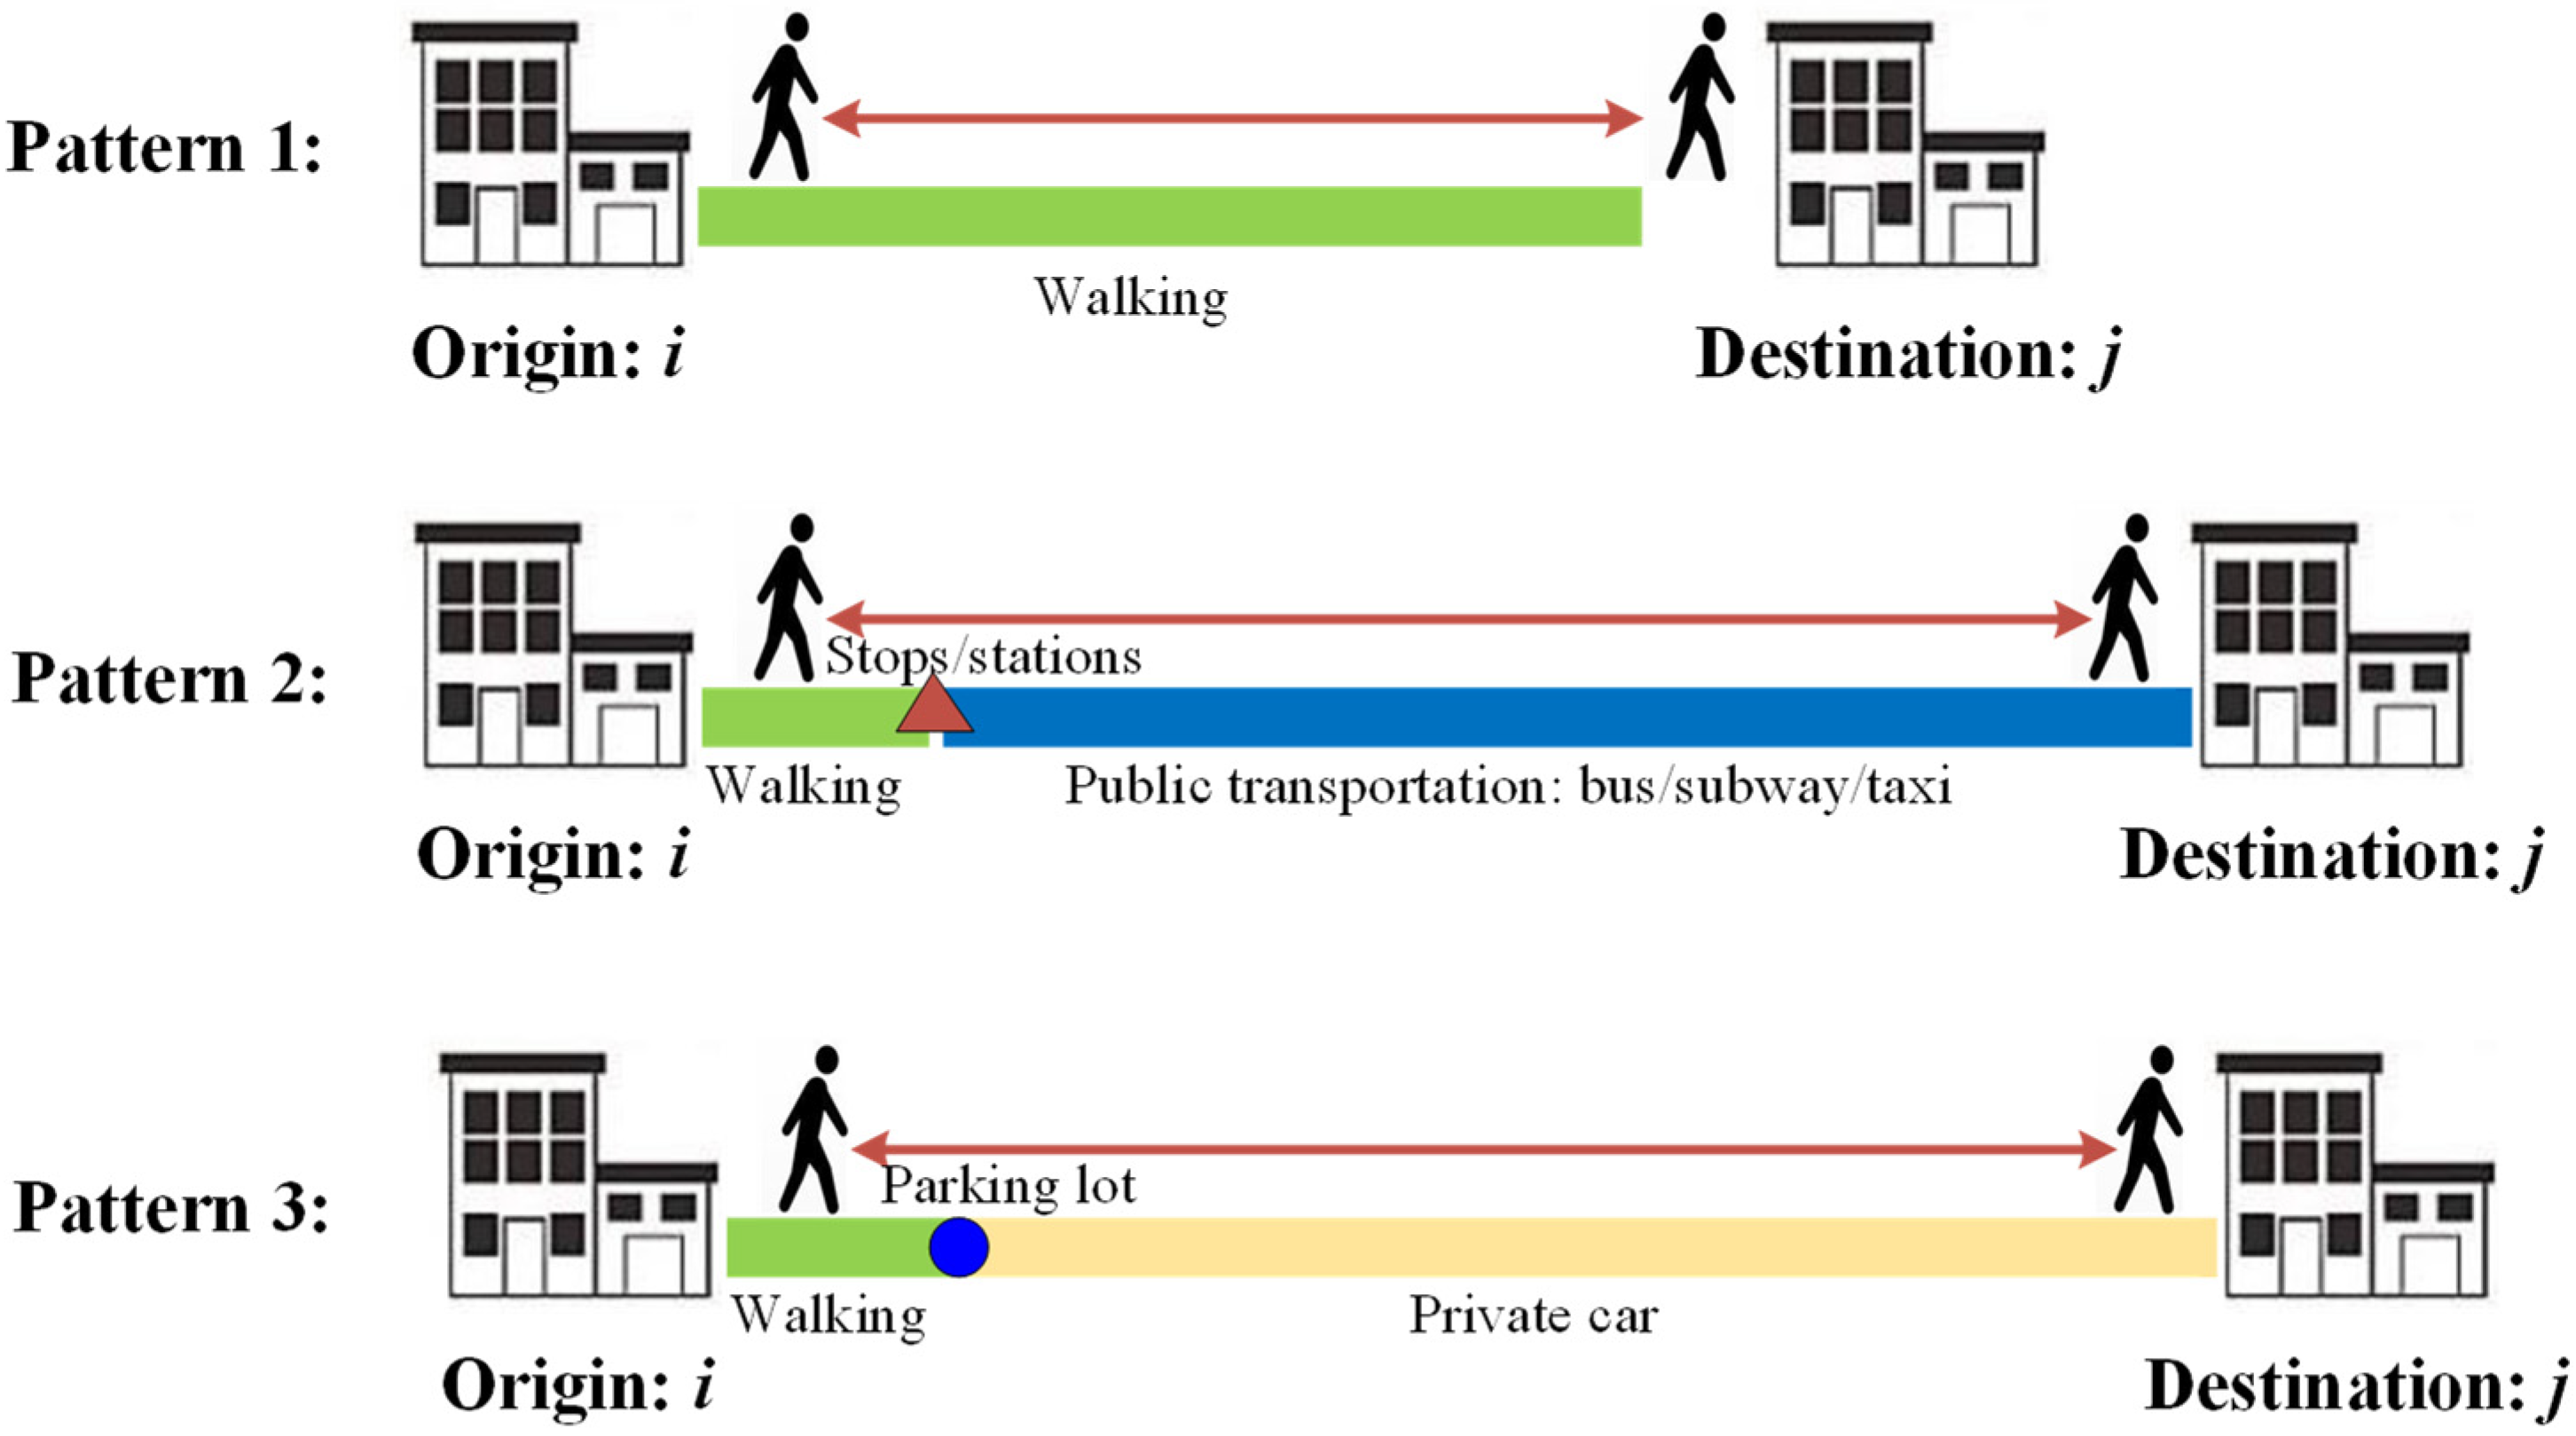
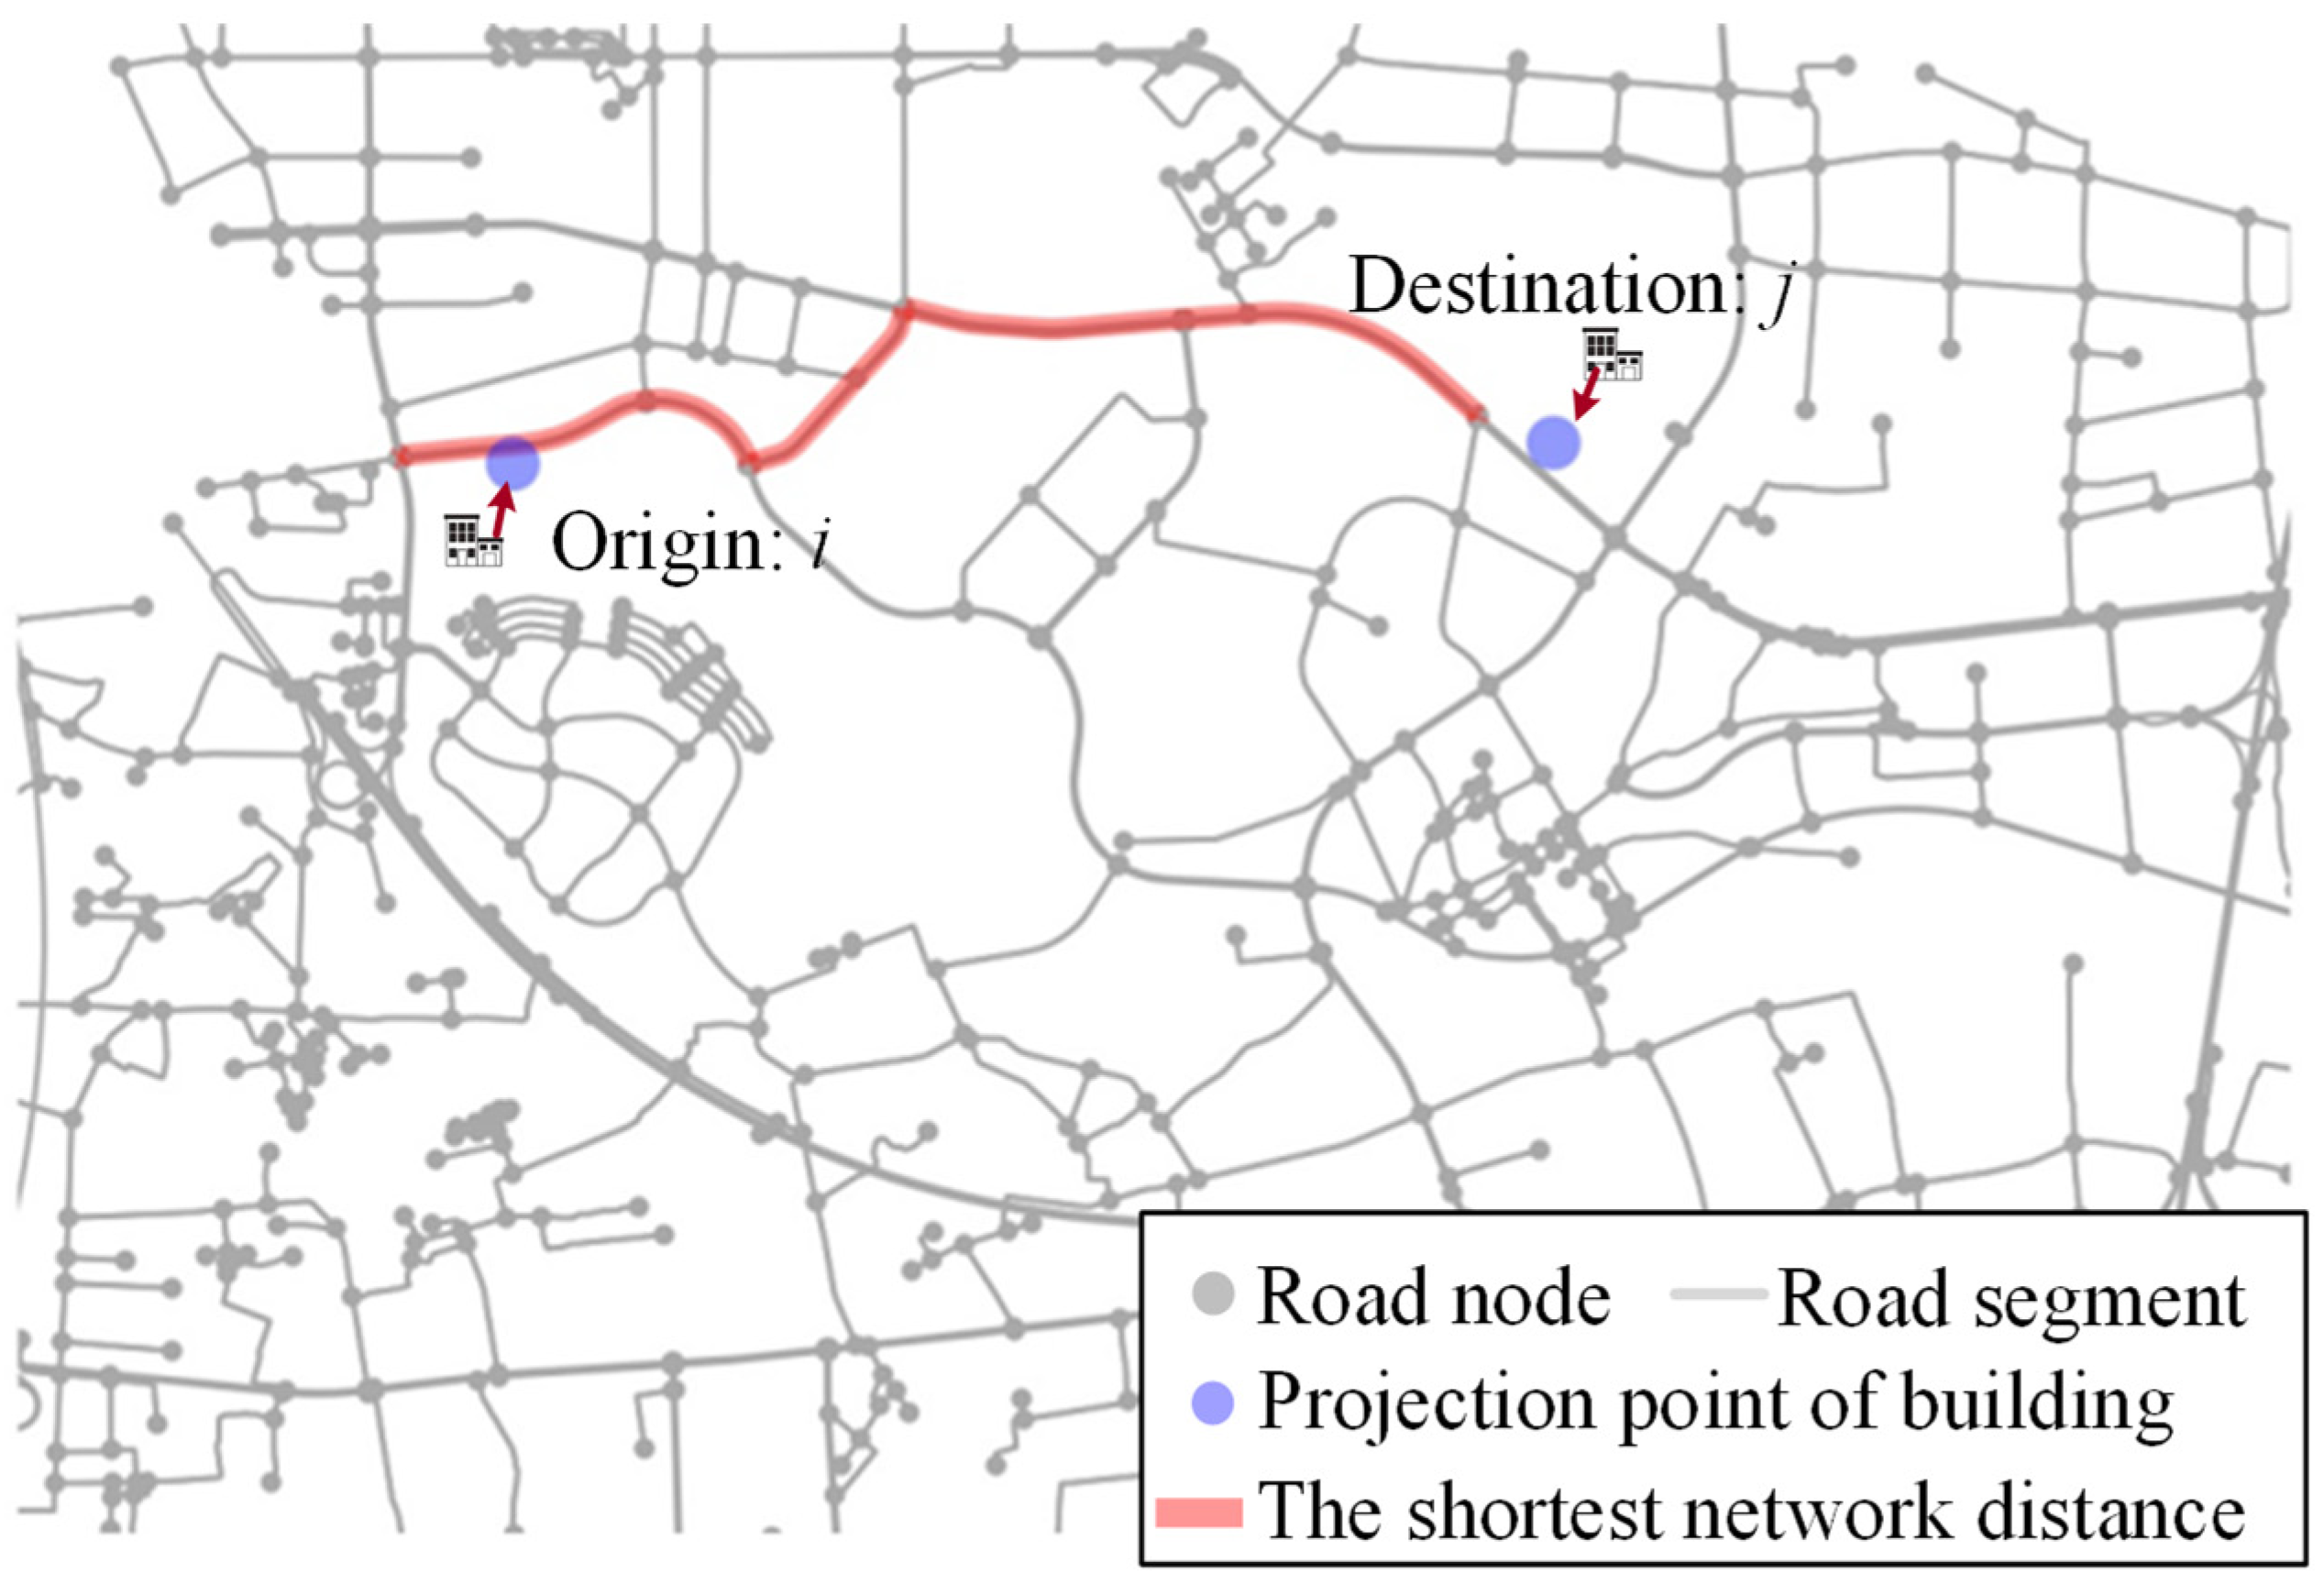
3.2. Travel Time in Multimodal Transportation Networks
4. Case Study
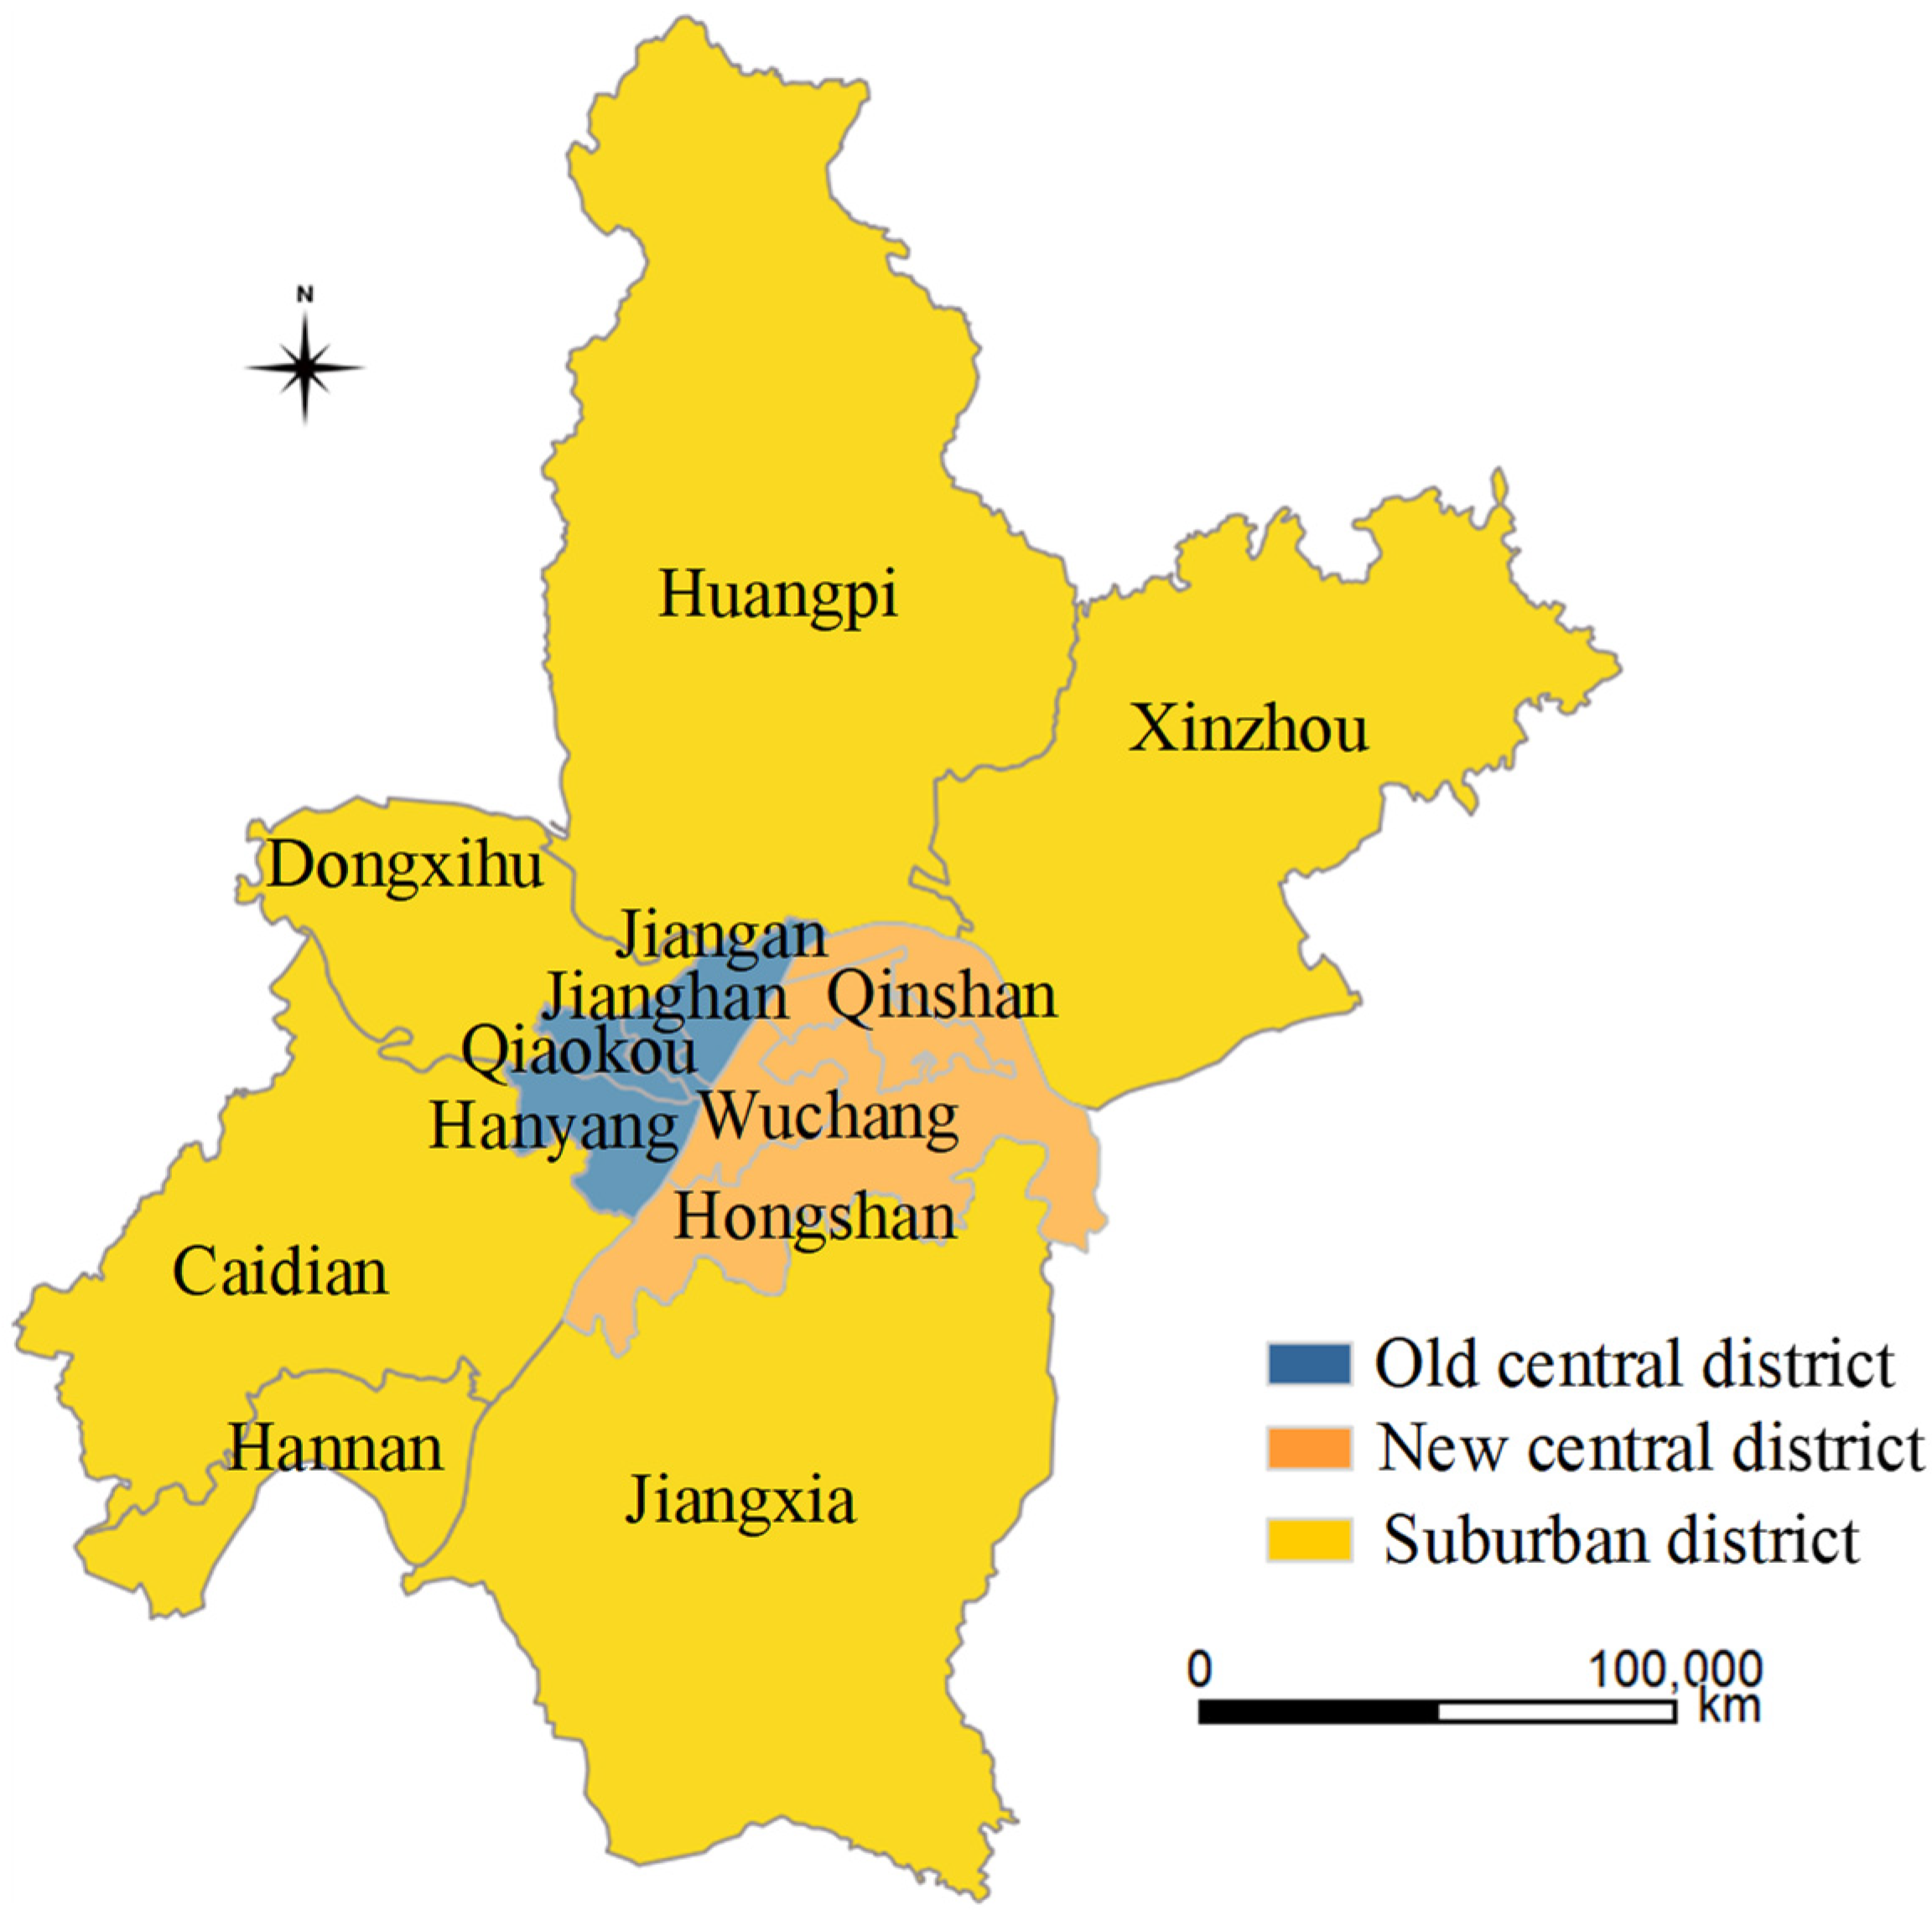
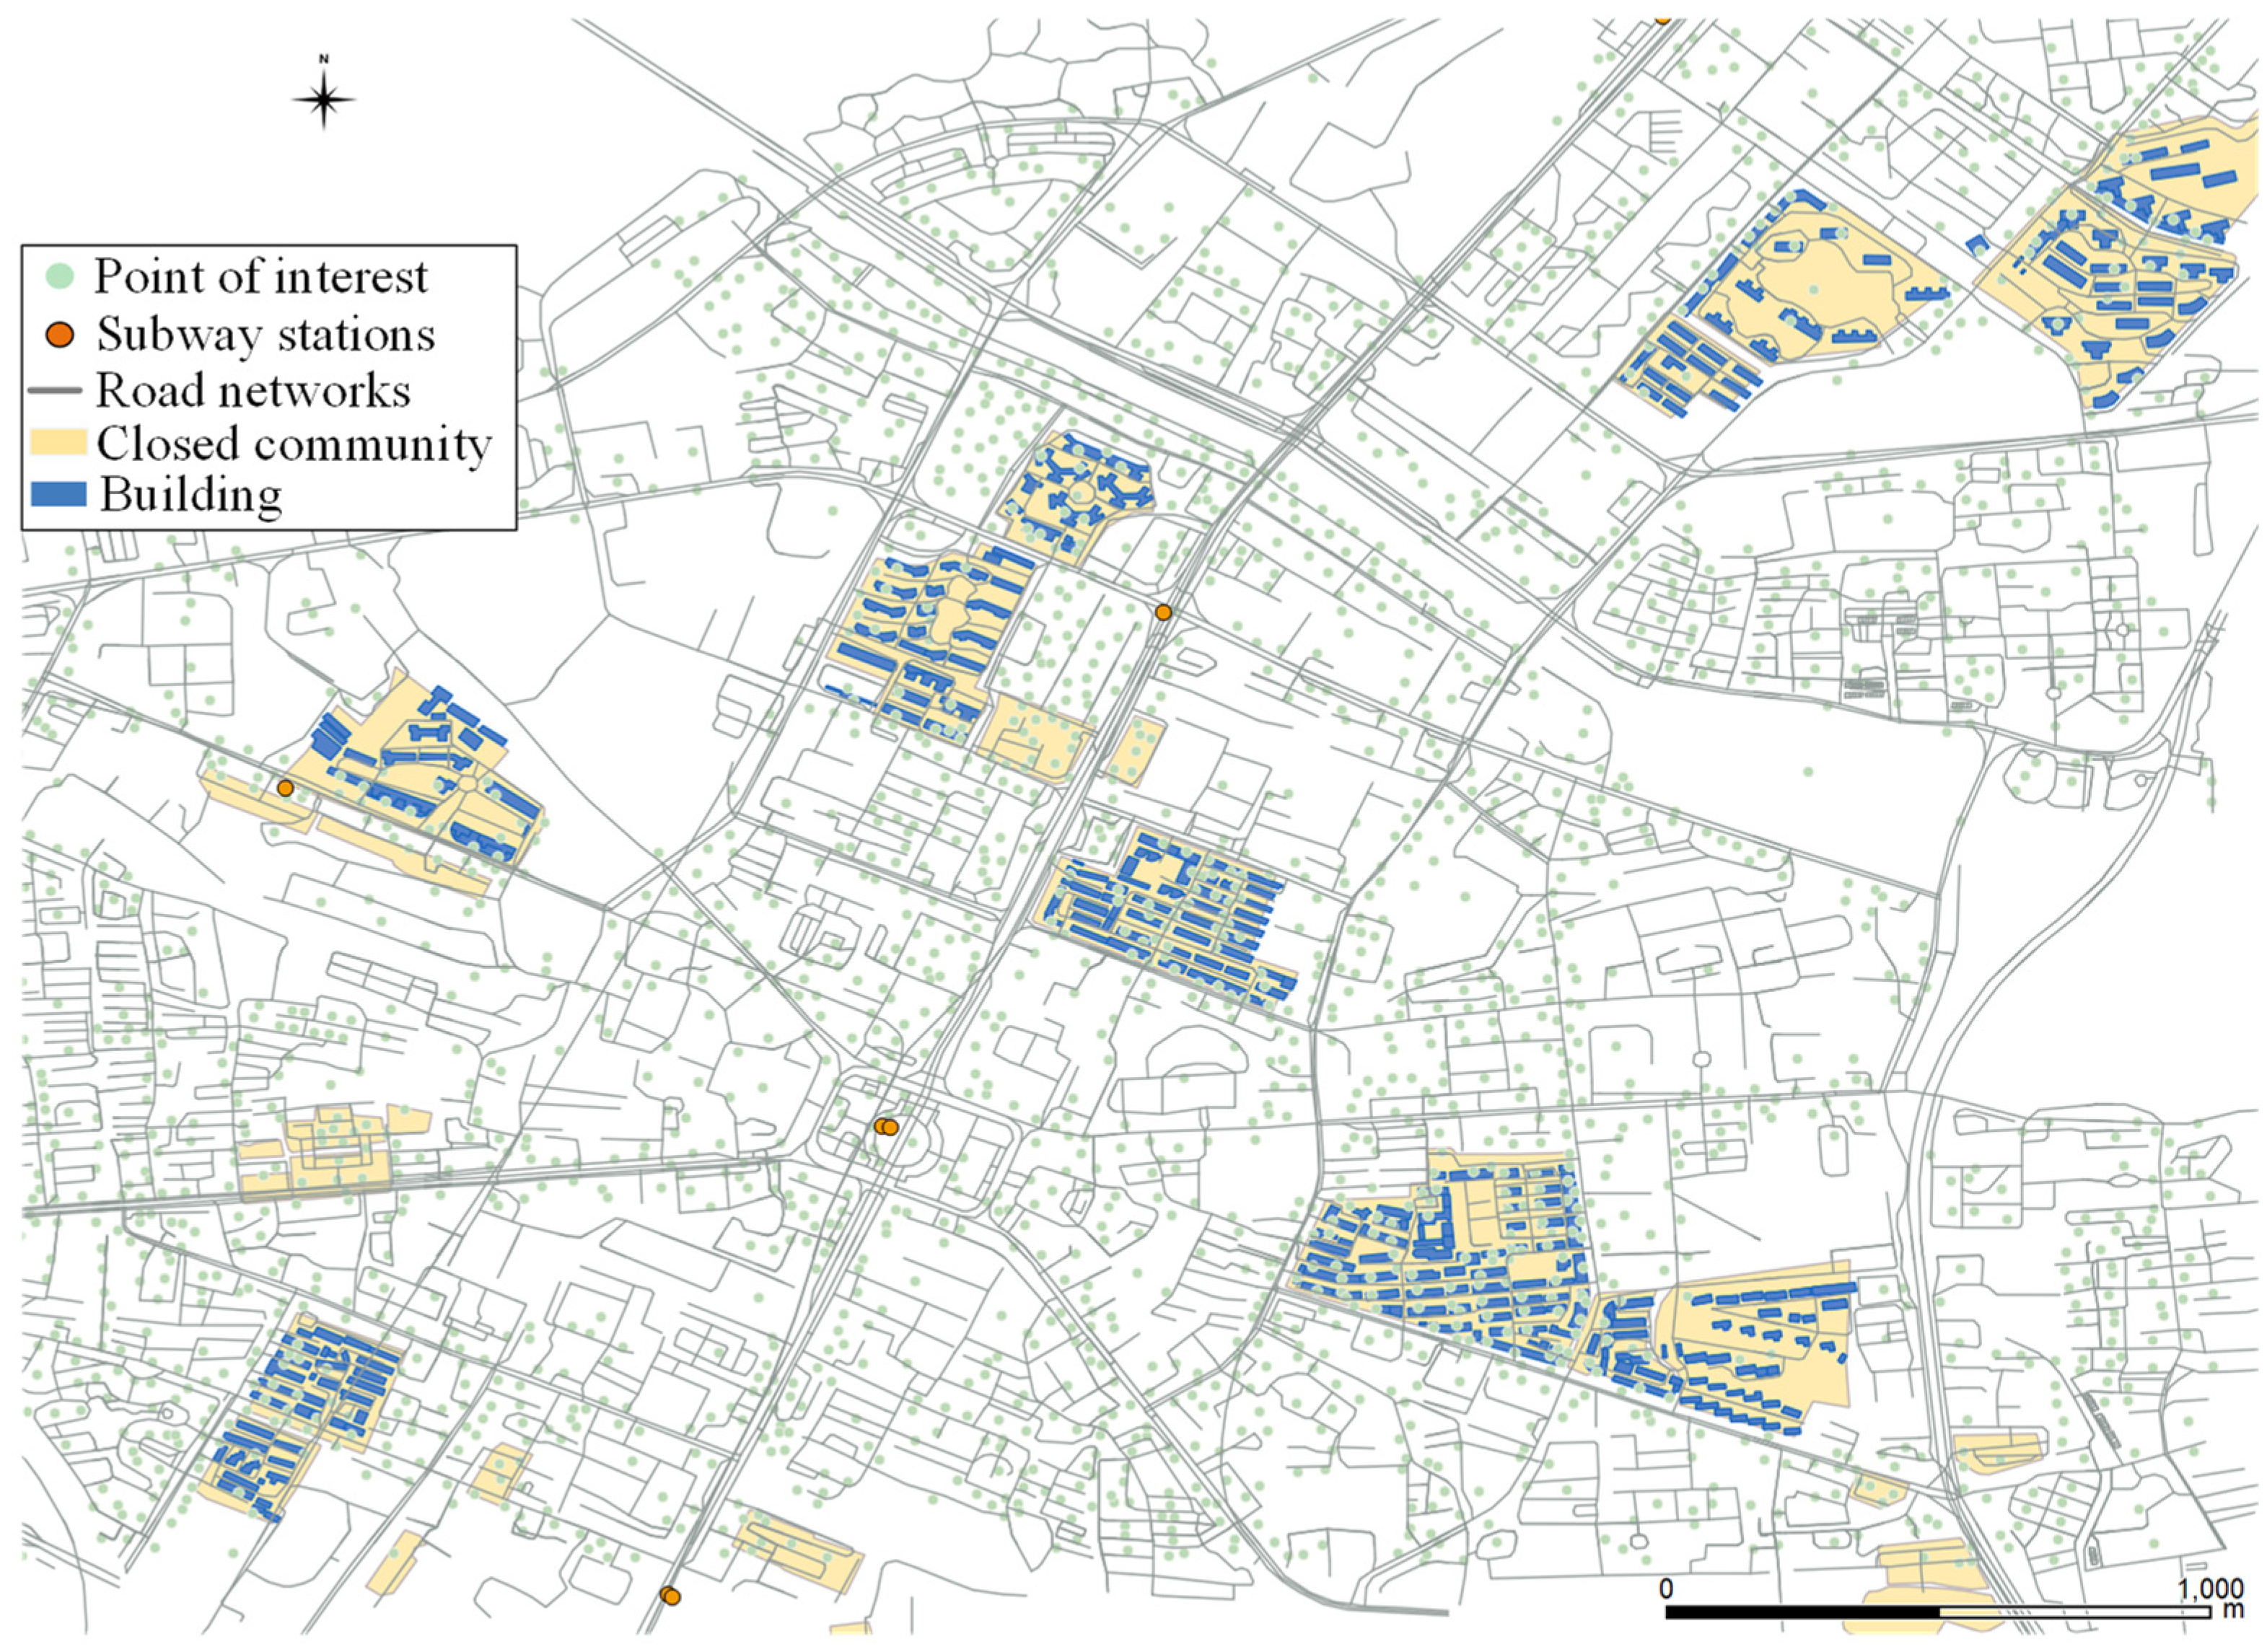
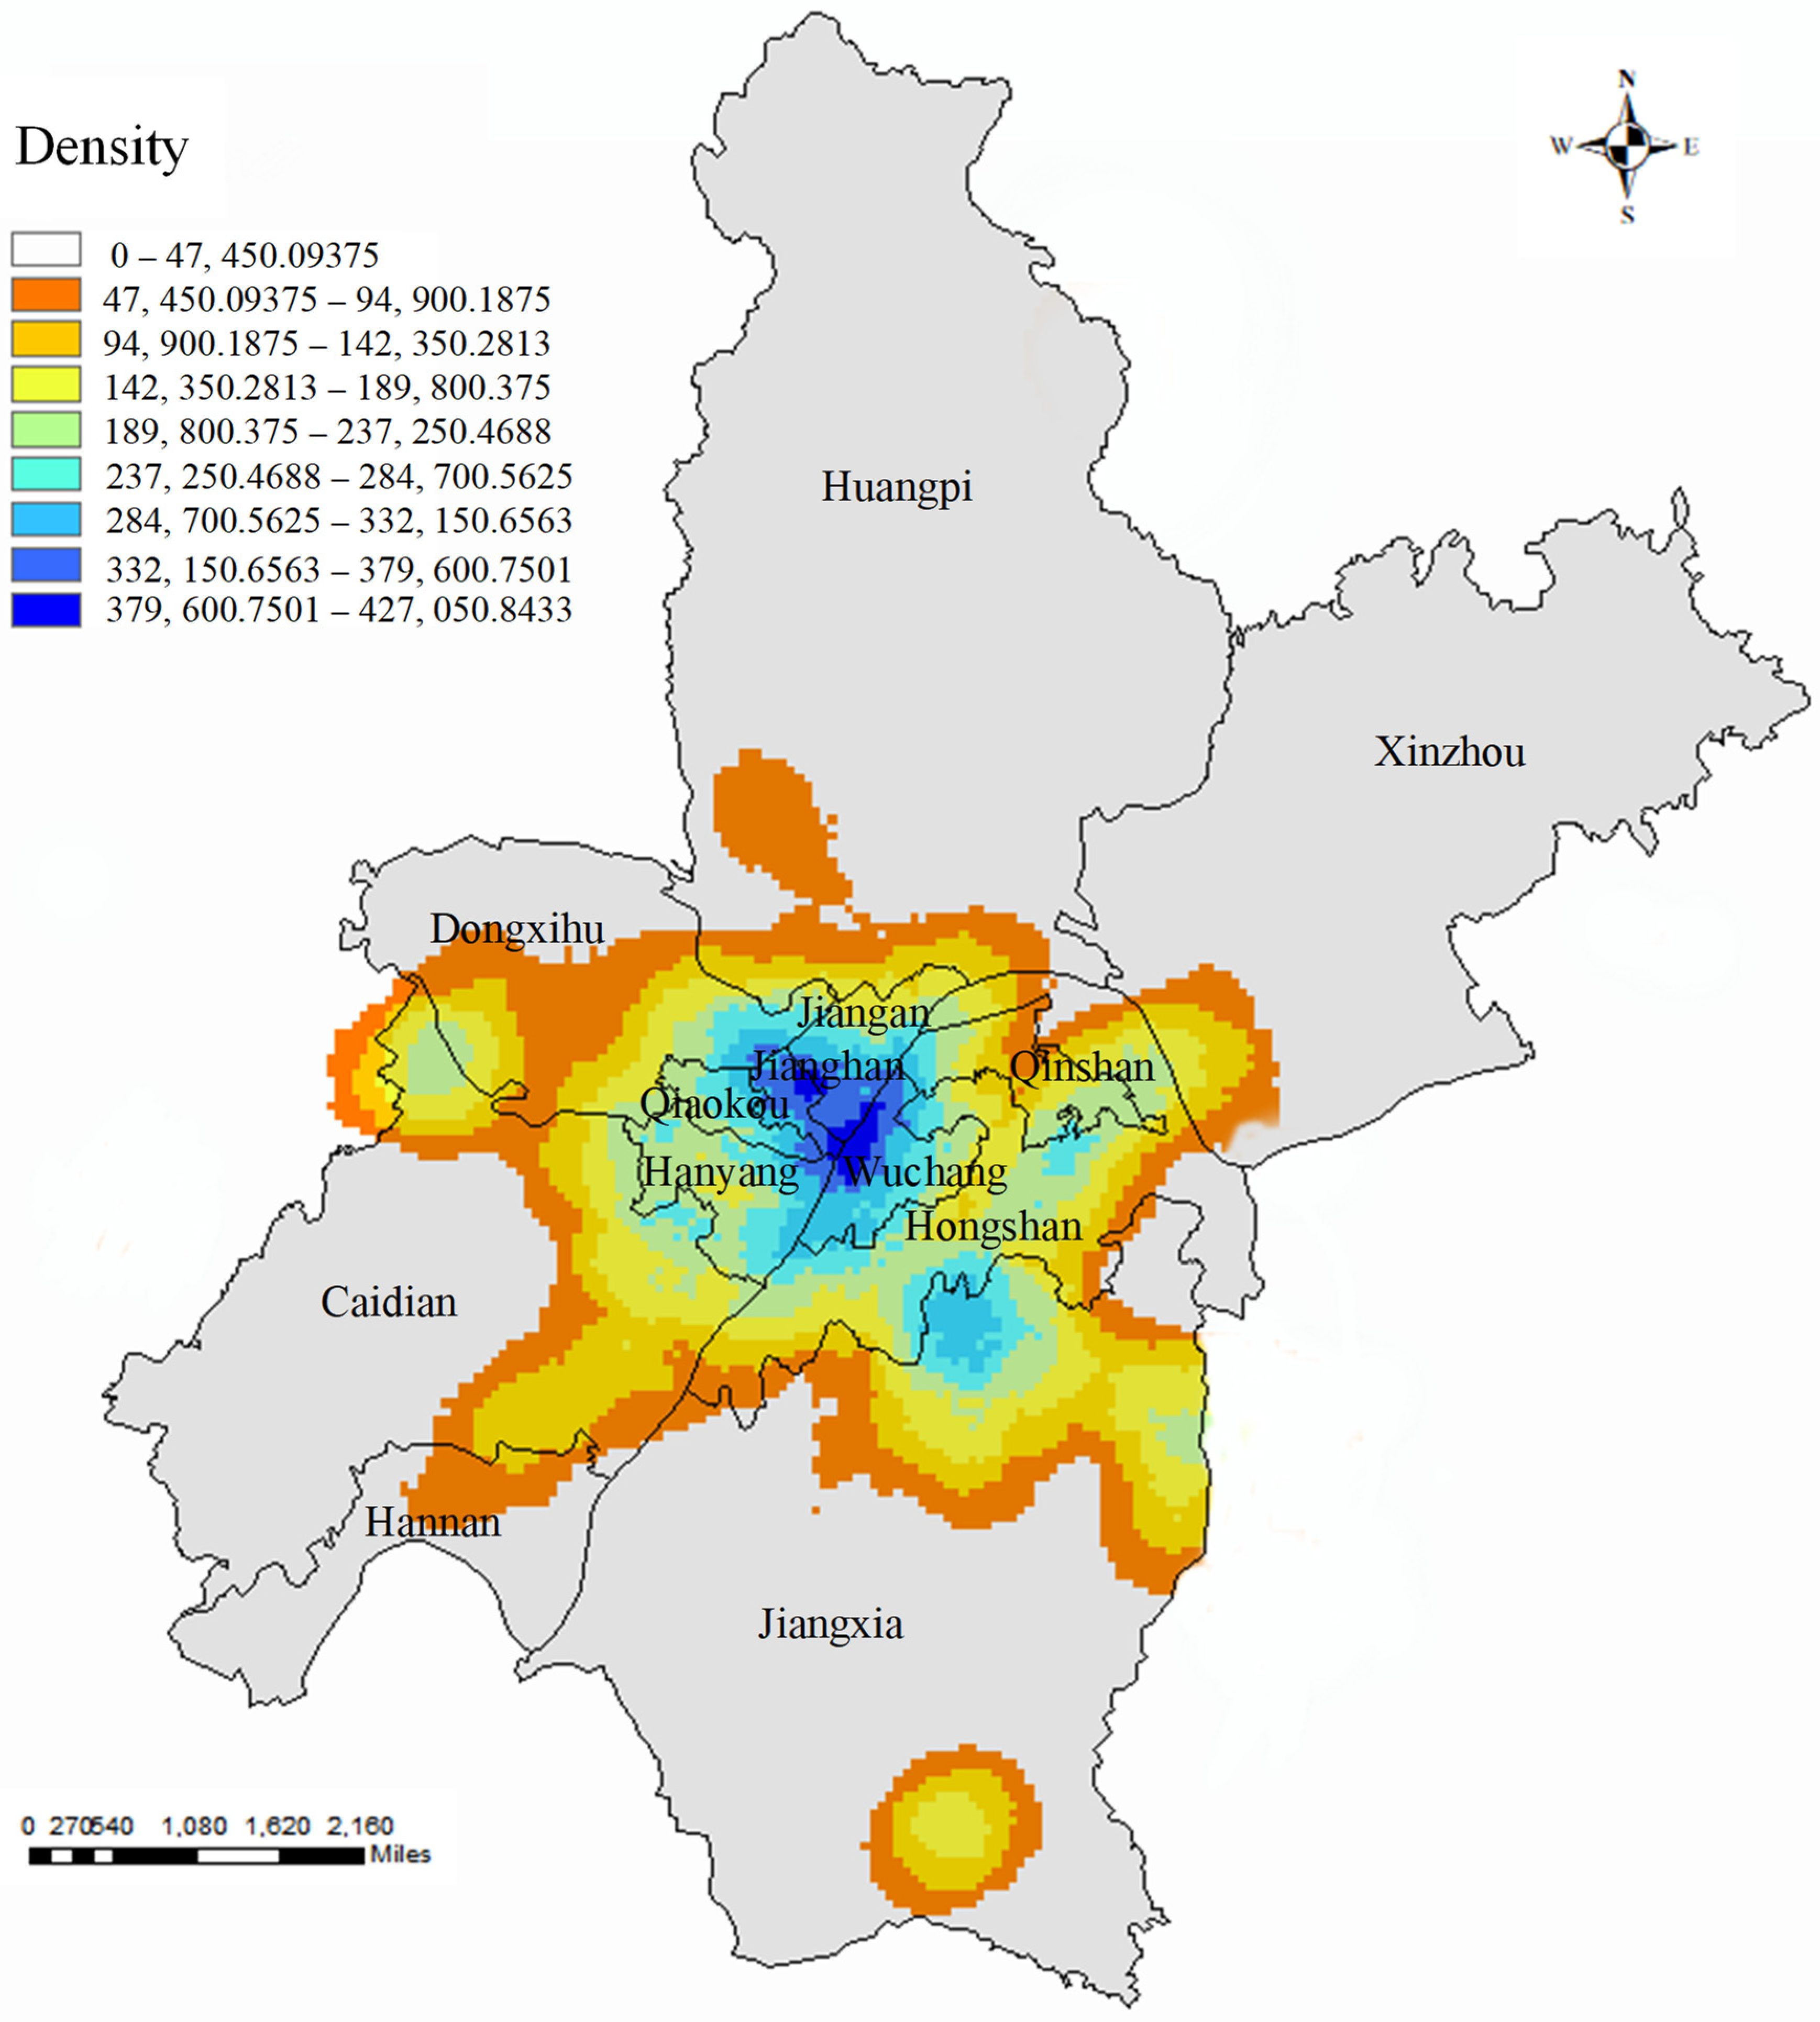
4.1. Study Area and Data
4.2. Data Preprocessing
| Algorithm 1. Optimized spatial matching algorithm (OPMA) | |
| 1: | Input: the position of a community: Si, i = 1, 2, …, n; the position of textual data: sj, j = 1, 2, …, m |
| 2: | Output: the optimized matching set Pi2 |
| Function | |
| step 1: computing the distance between Si and sj and sorting distance results | |
| 4: | for each q in Si, do |
| 5: | for each p in sj, do |
| 6: | xi = getDistance (q, p) |
| 7: | end for |
| 8: | sort distance set Xi = (x1, …, xi) based on the value of xi |
| step 2: selecting the initial matching set | |
| 9: | Gi = getGeometricAverage (j ≥ ) |
| 10: | get the initial matching set Pi based on the Gi |
| 11: | if xj ≥ Gi then |
| 12: | emit Xi |
| step 3: getting the order for the following optimization | |
| 13: | for each q in Si, do |
| 14: | Ni = getProportion (i, q ≥ ) |
| 15: | end for |
| 16: | get a descending order of Si based on the value of Ni |
| step 4: optimizing the initial matching set Pi1 based on the order of step 3 | |
| 17: | Matching: Pi1 = match (Si, Pi(xj, j = 1, 2, …, Ni*m) |
| step 5: finding the redundant matching results through a traversal, and using dynamic programming (DP) technique to match these redundant results again | |
| 18: | for each P in Pi1, do |
| 19: | Pi2 = DP (match = (Si, Pi(xj, j = 1, 2, …, Ni*m)), num > 1) |
| 20: | end for |
| 21: | emit set Pi2 |
| End function | |
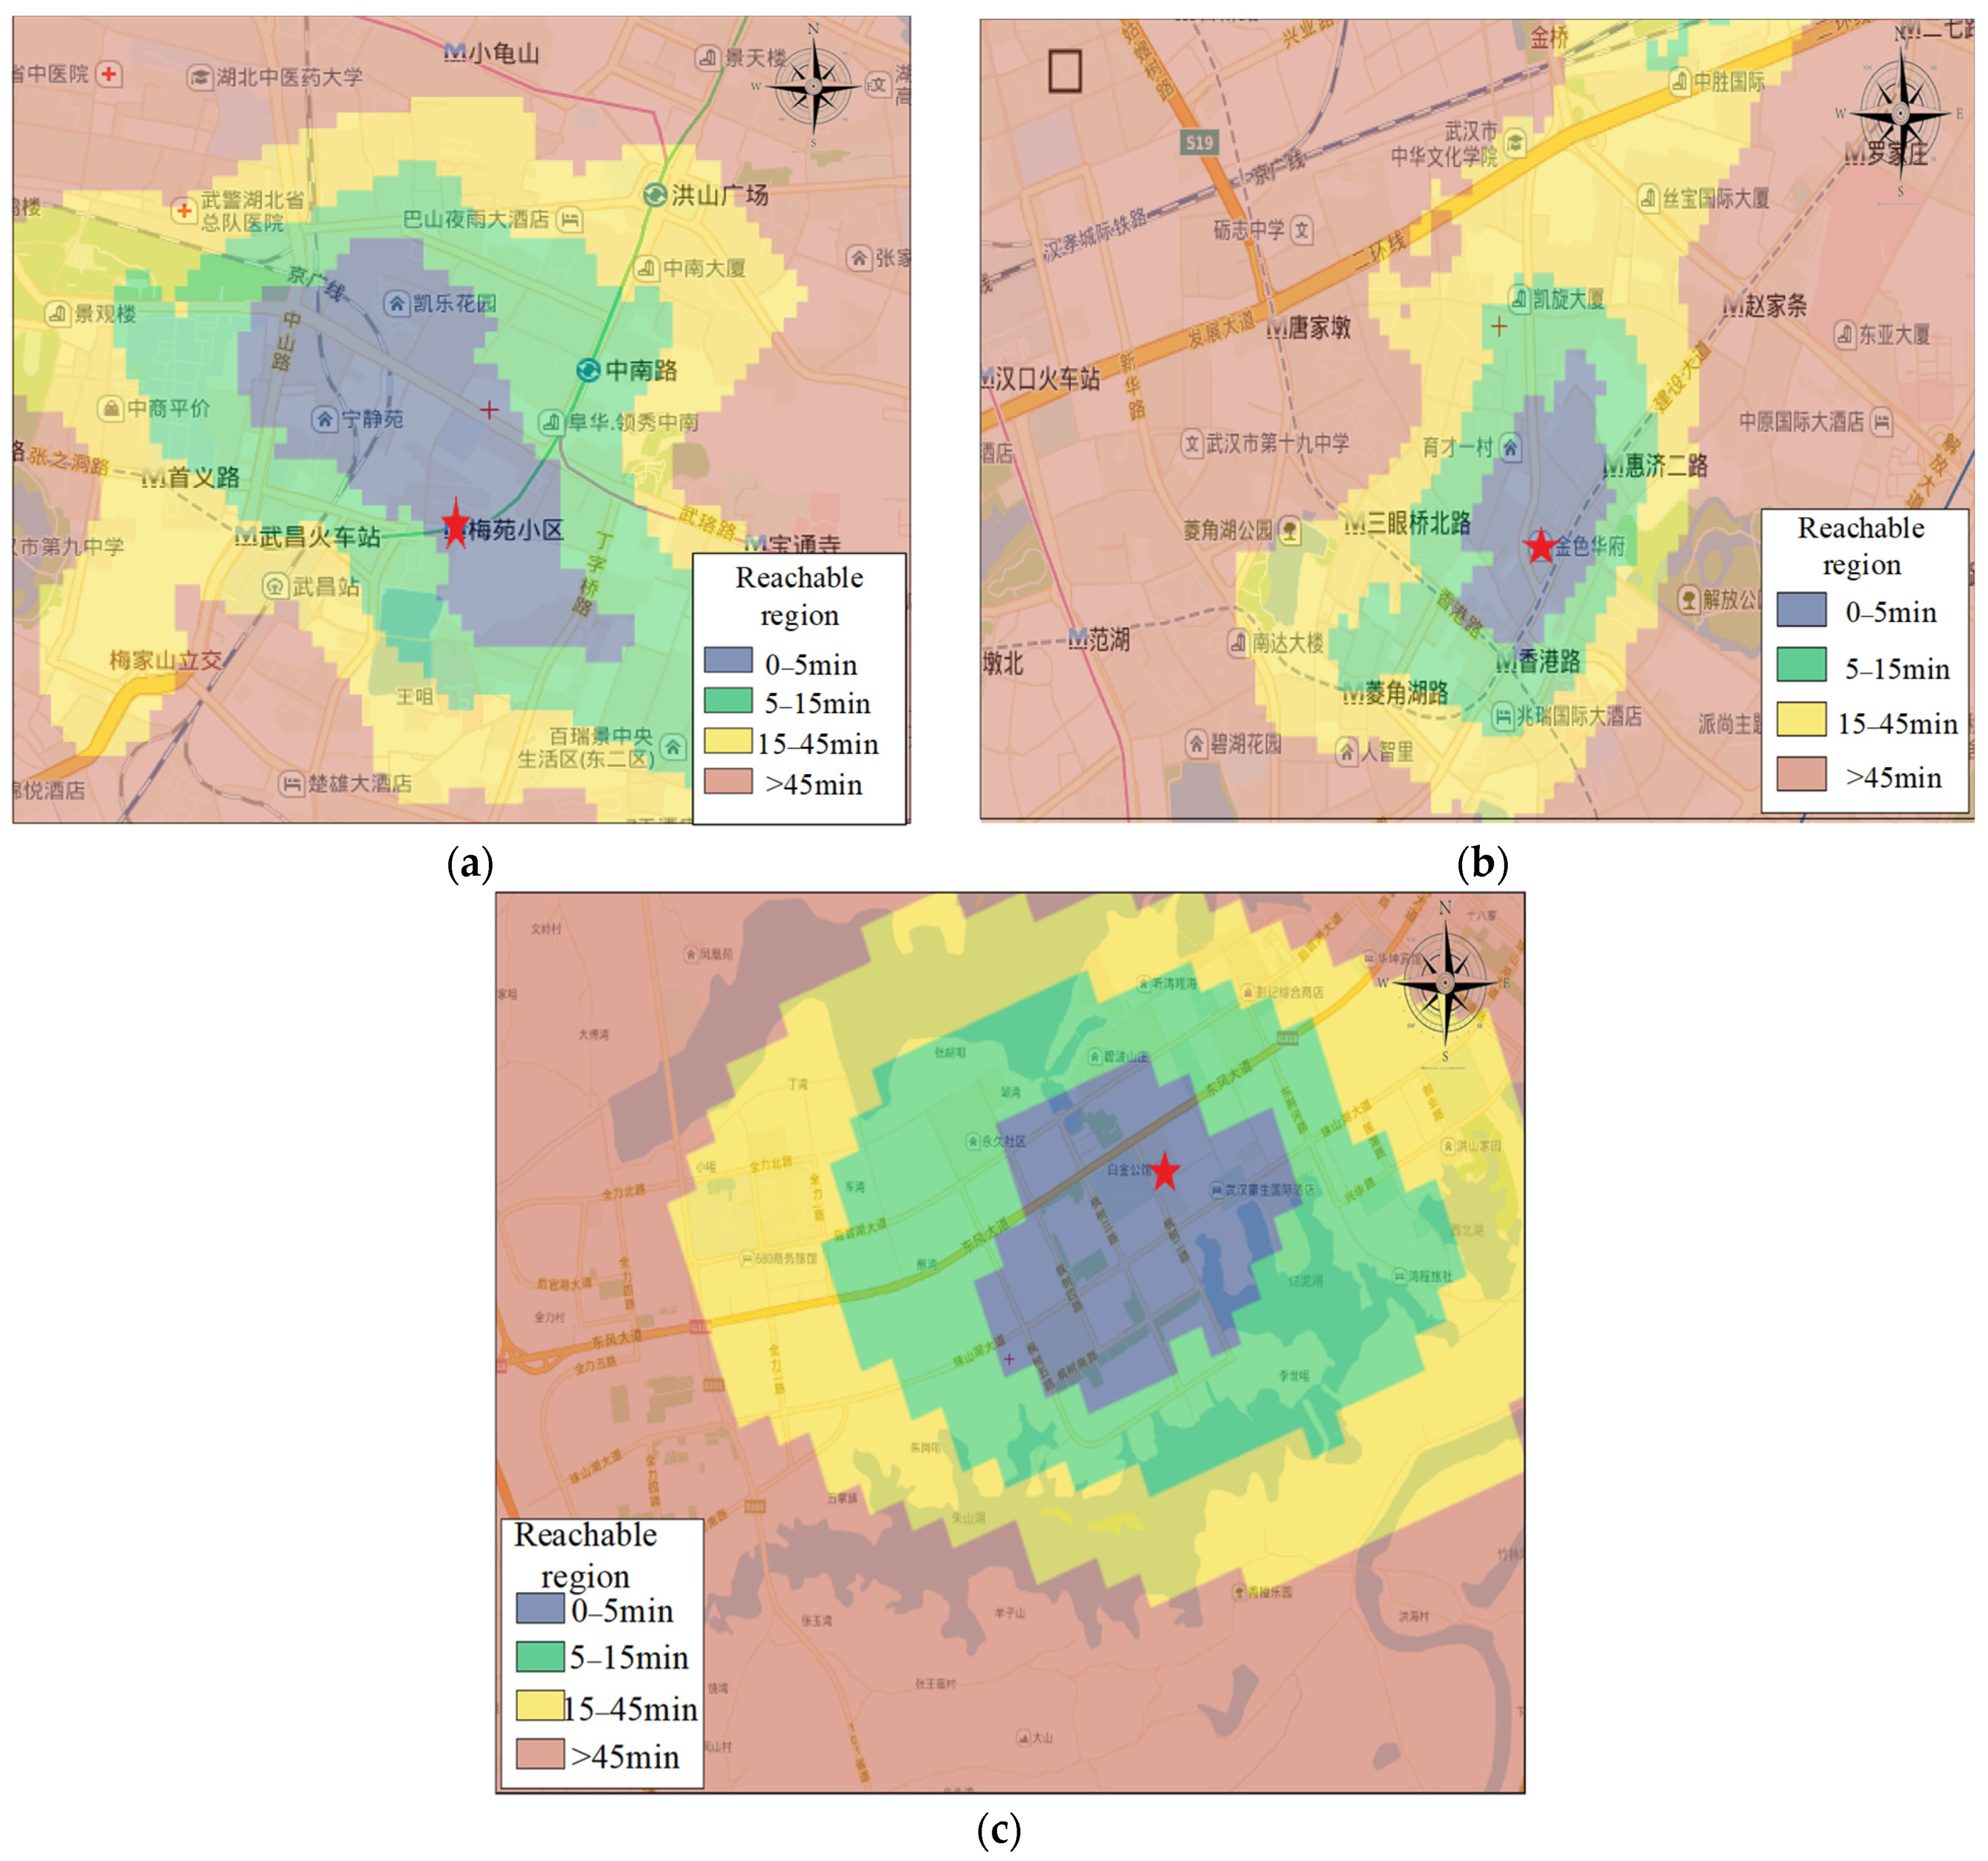
4.3. Accessibility Measurement
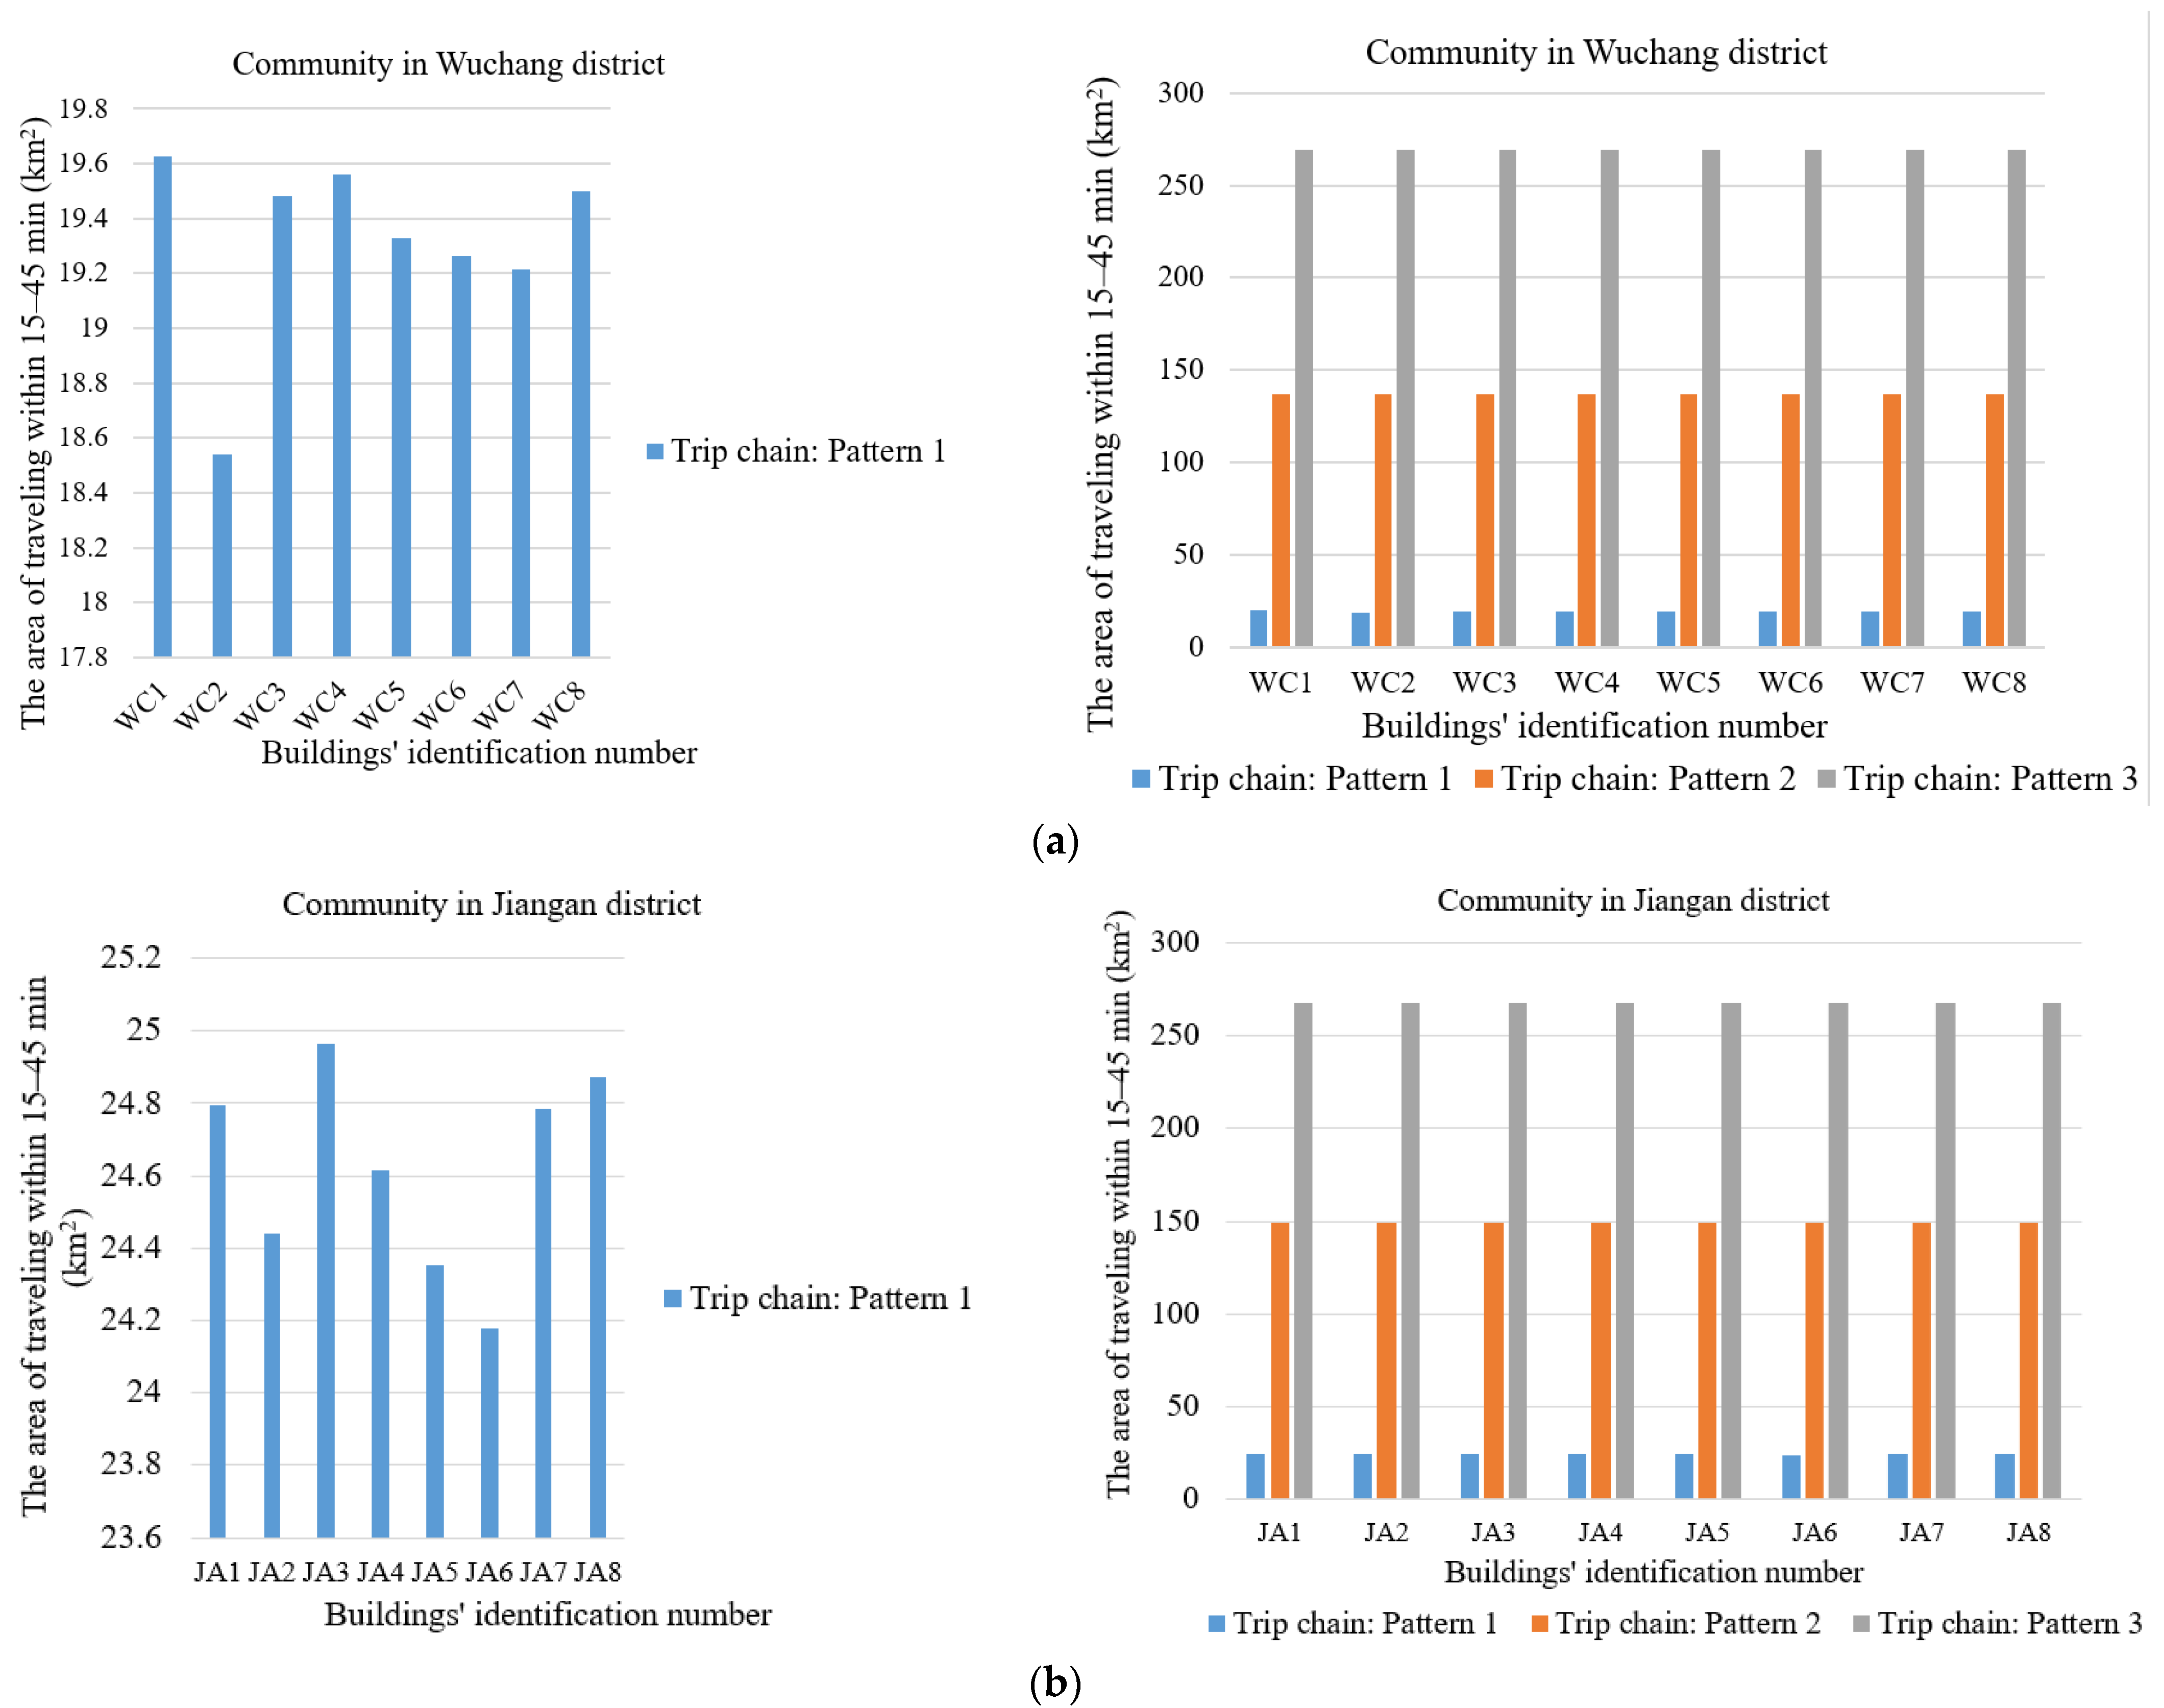
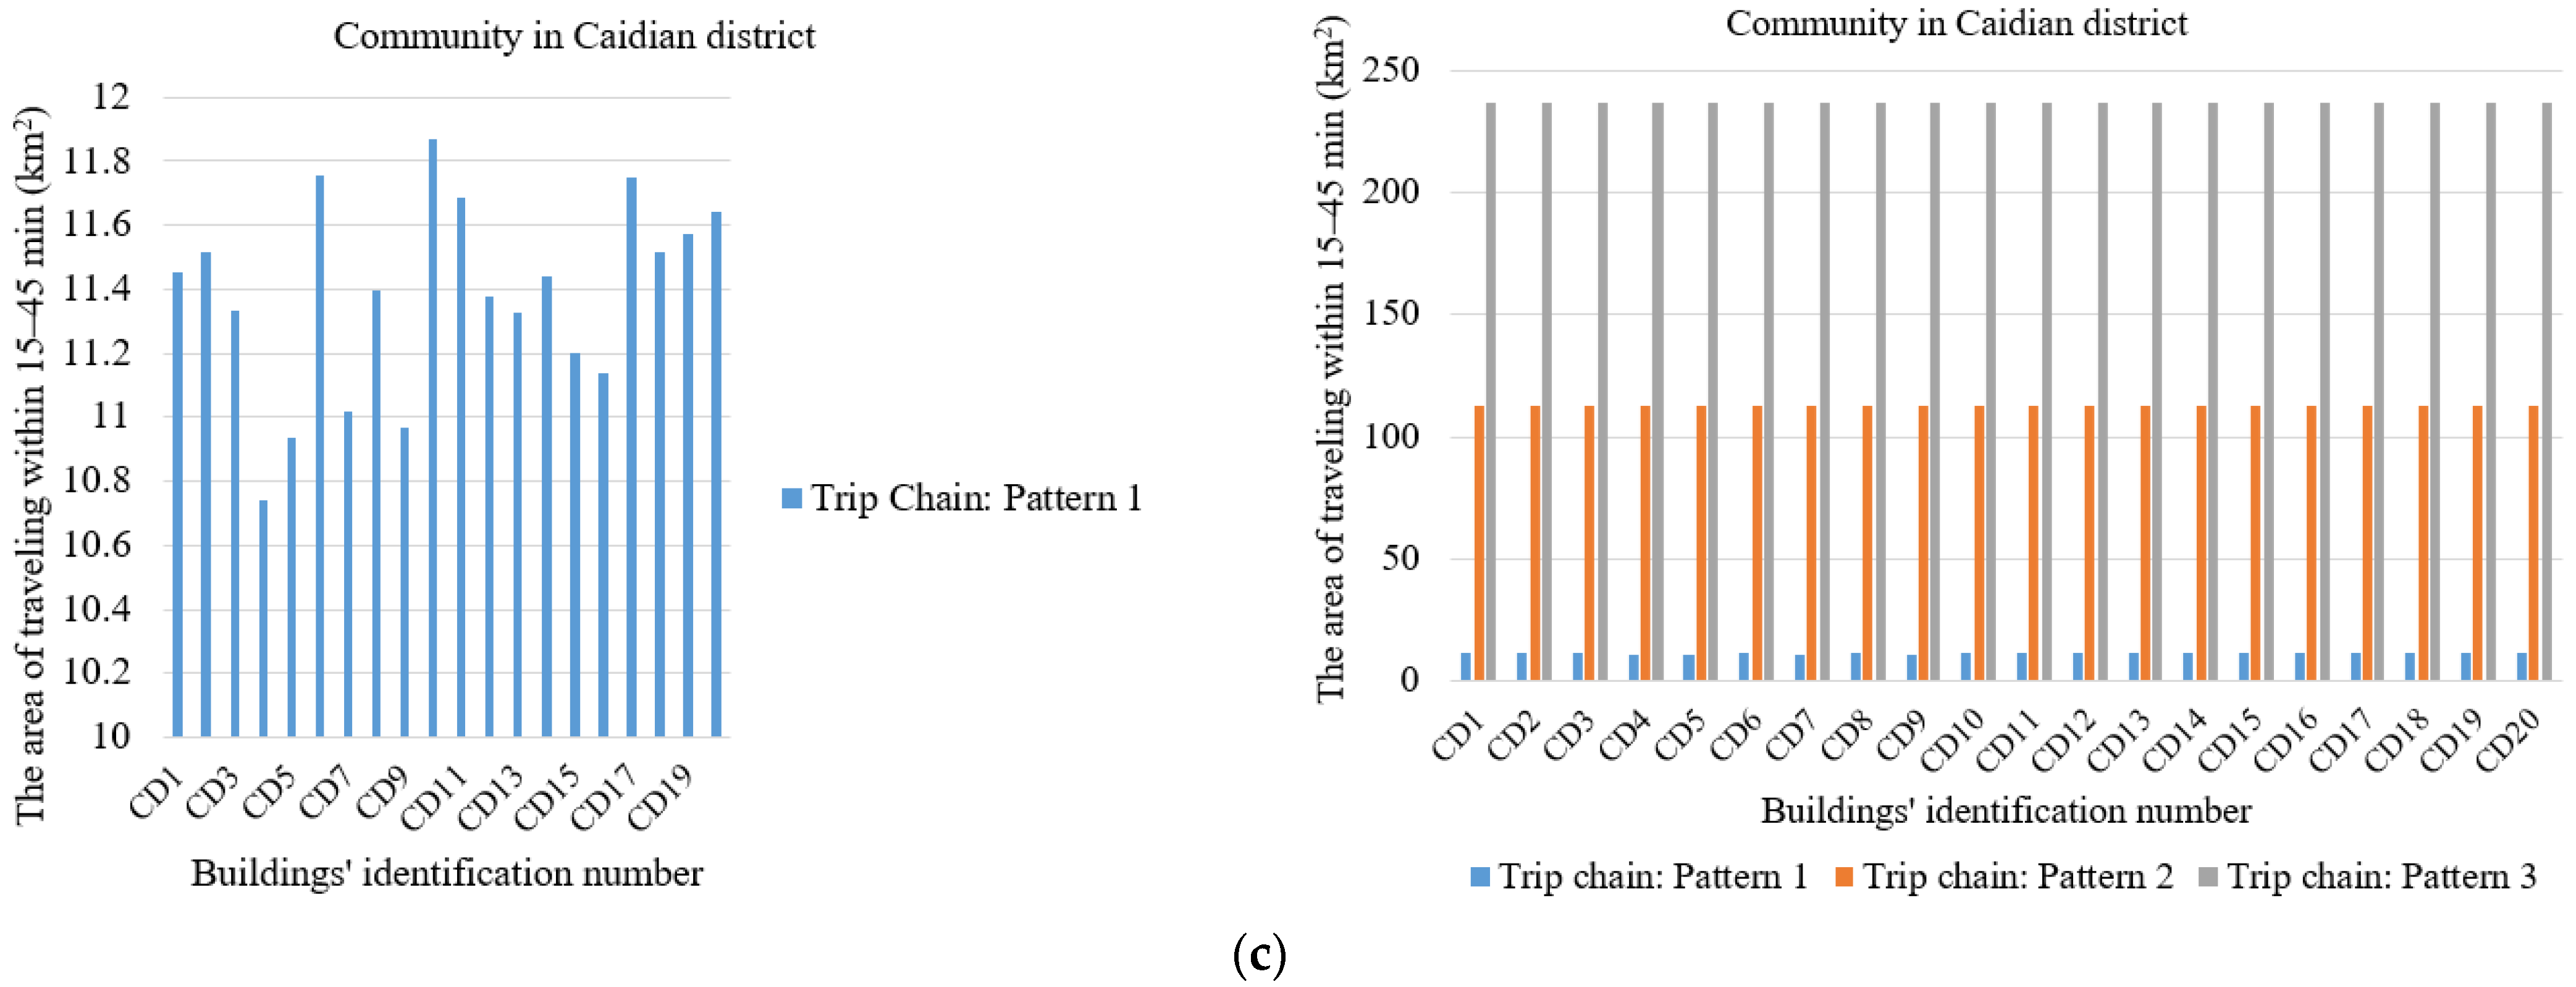
4.3.1. Traveling Cost Analysis for Multi-Mode of Trip Pattern
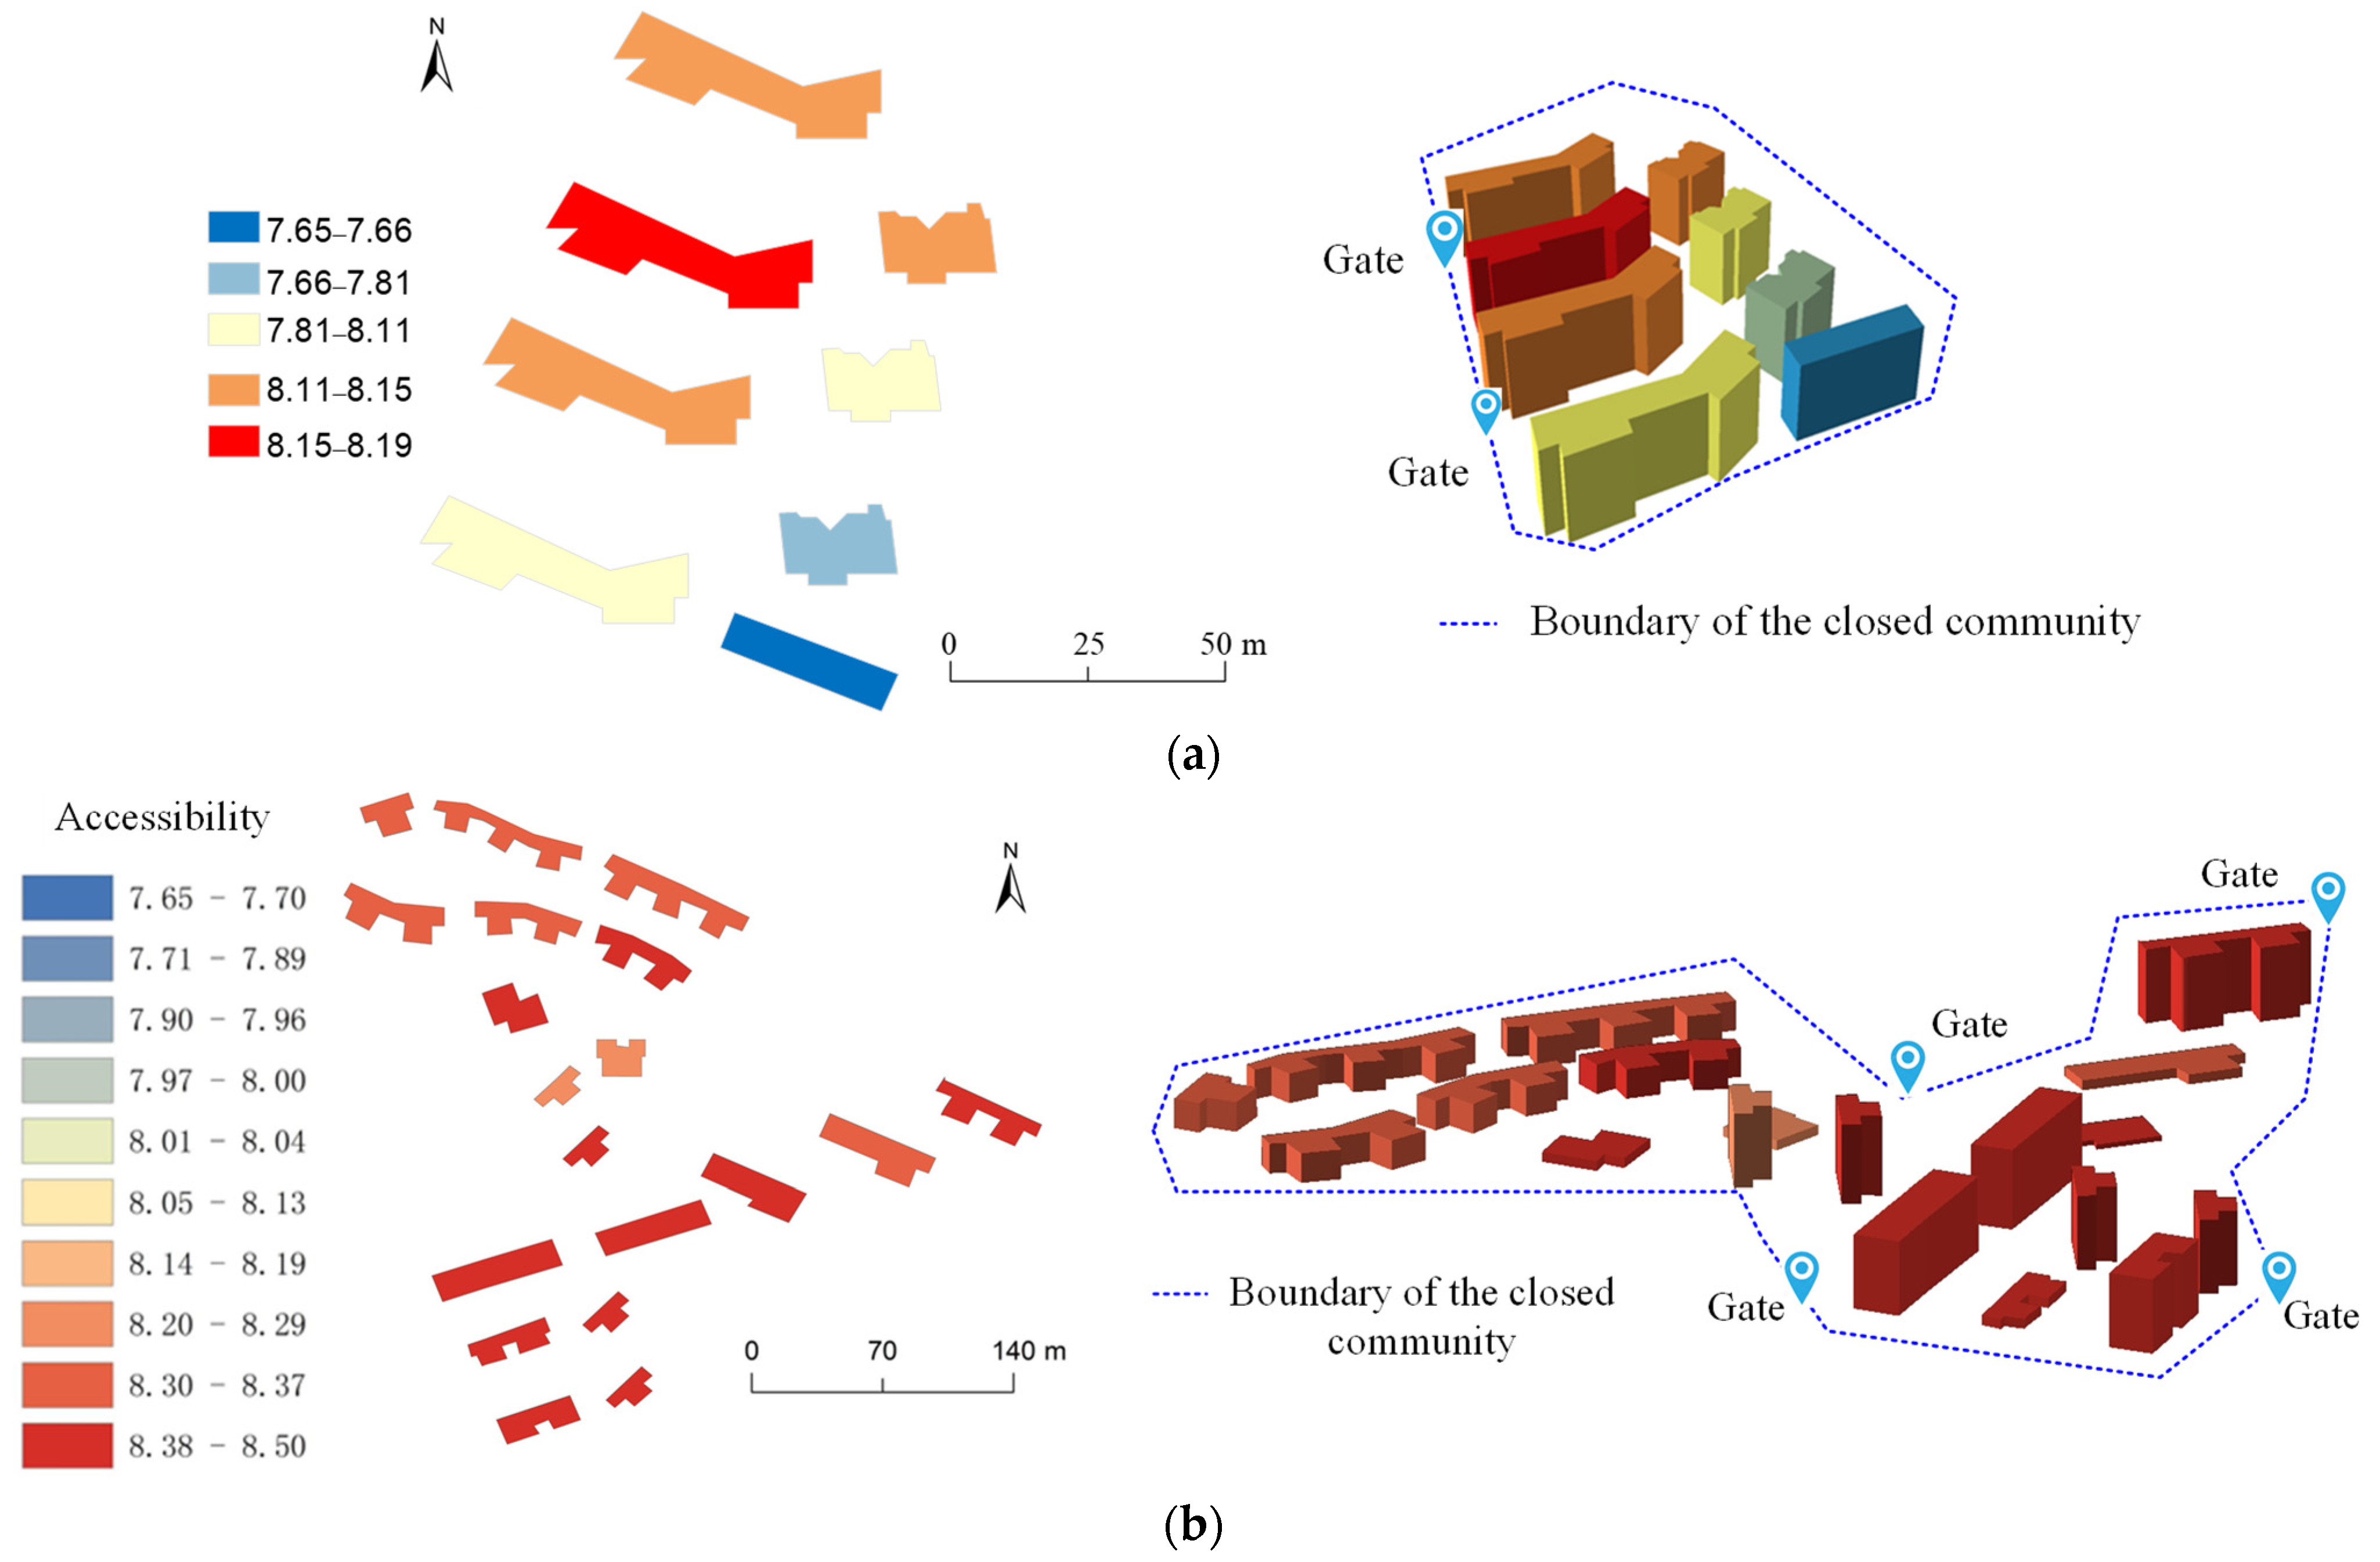
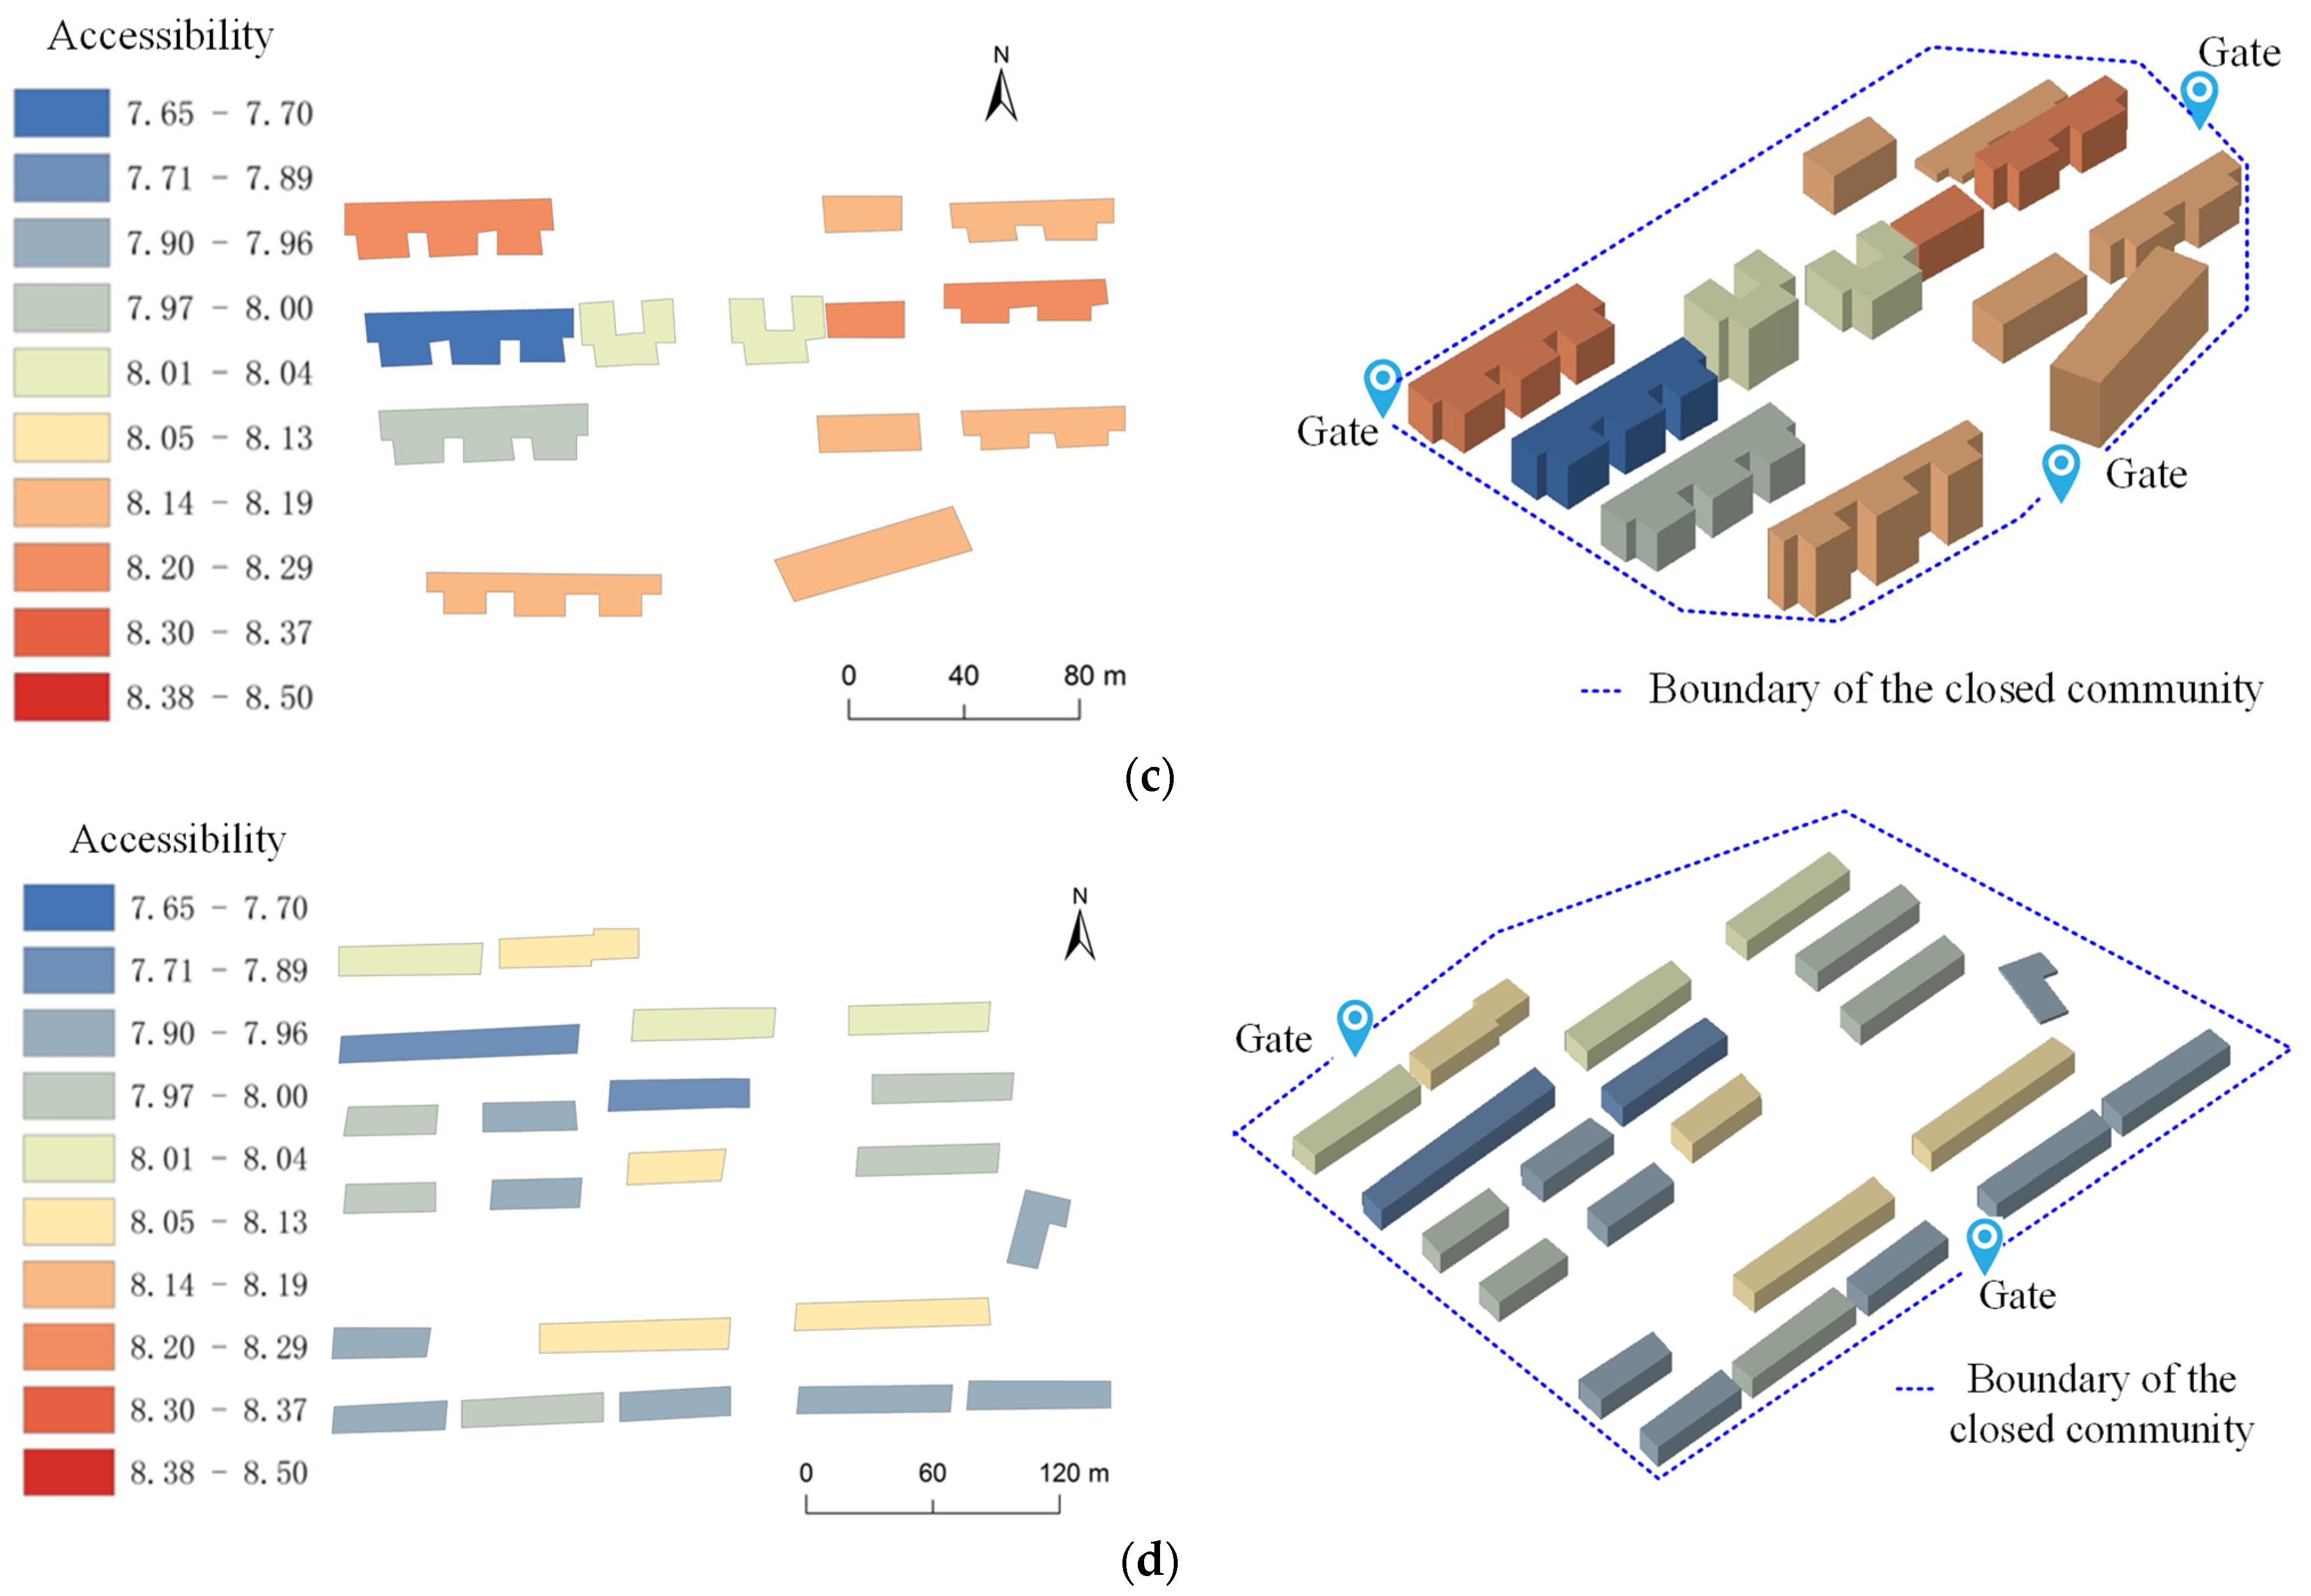
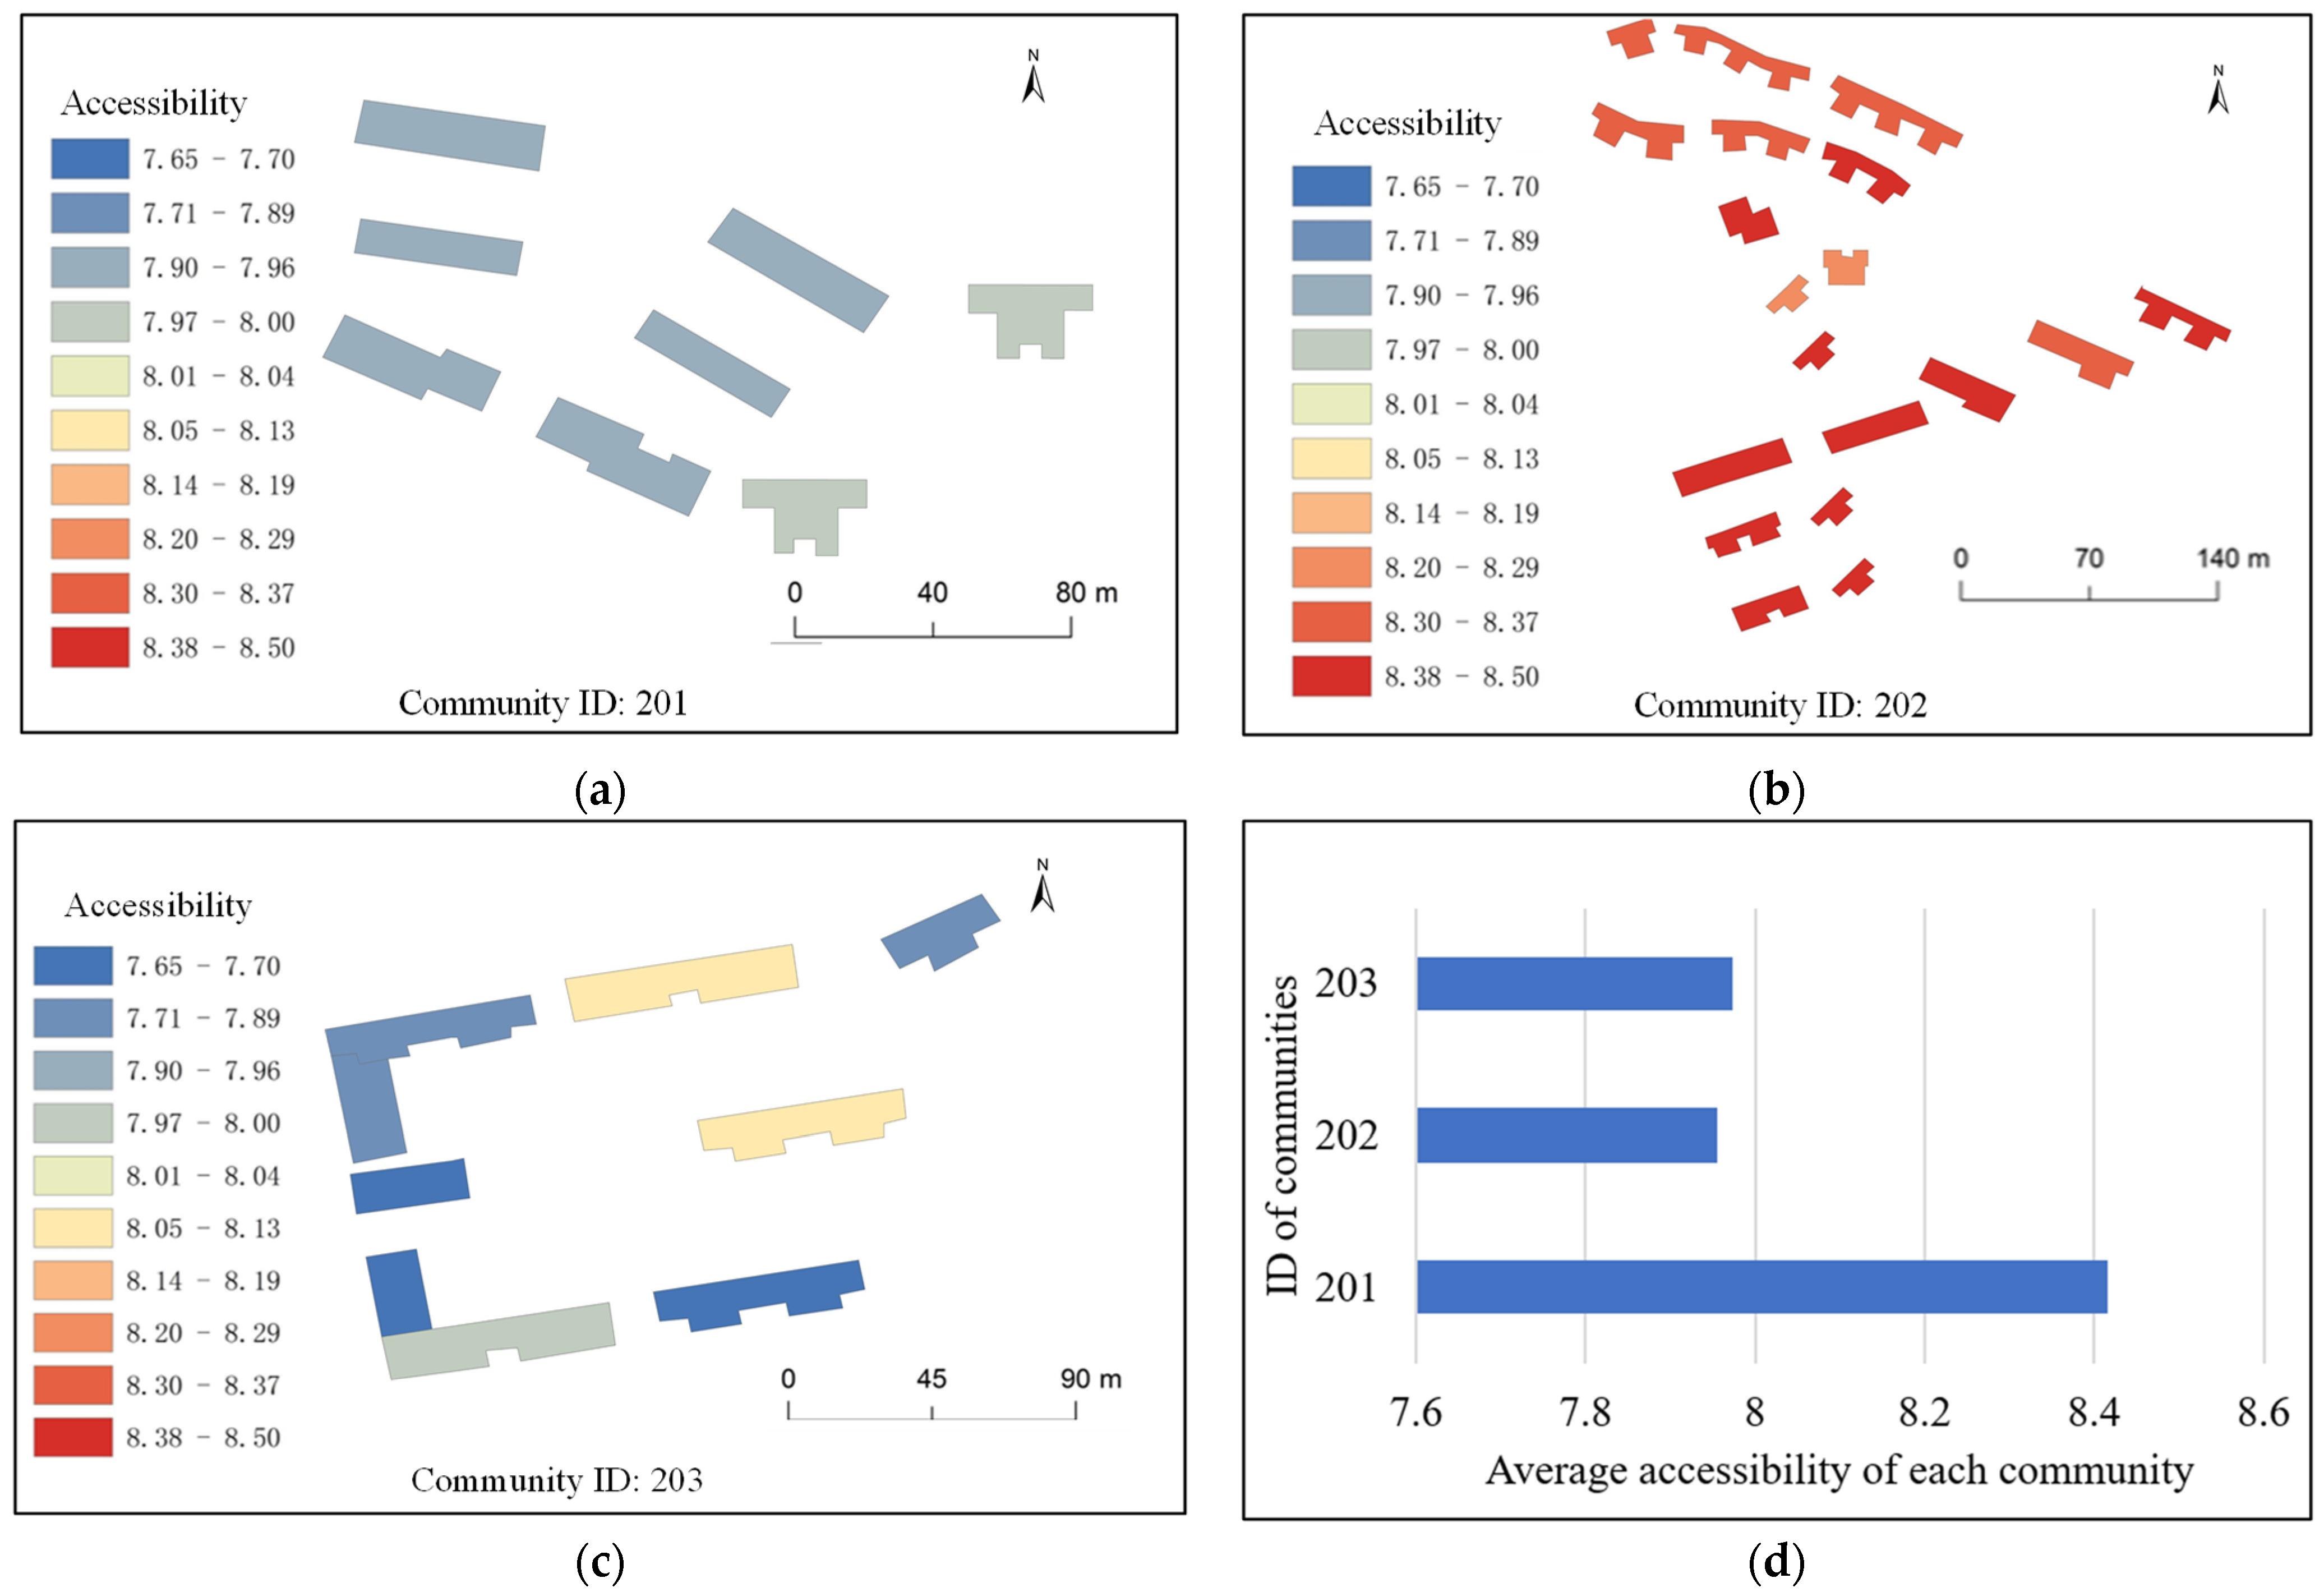
4.3.2. Accessibility Measurement Results within Walking Distance
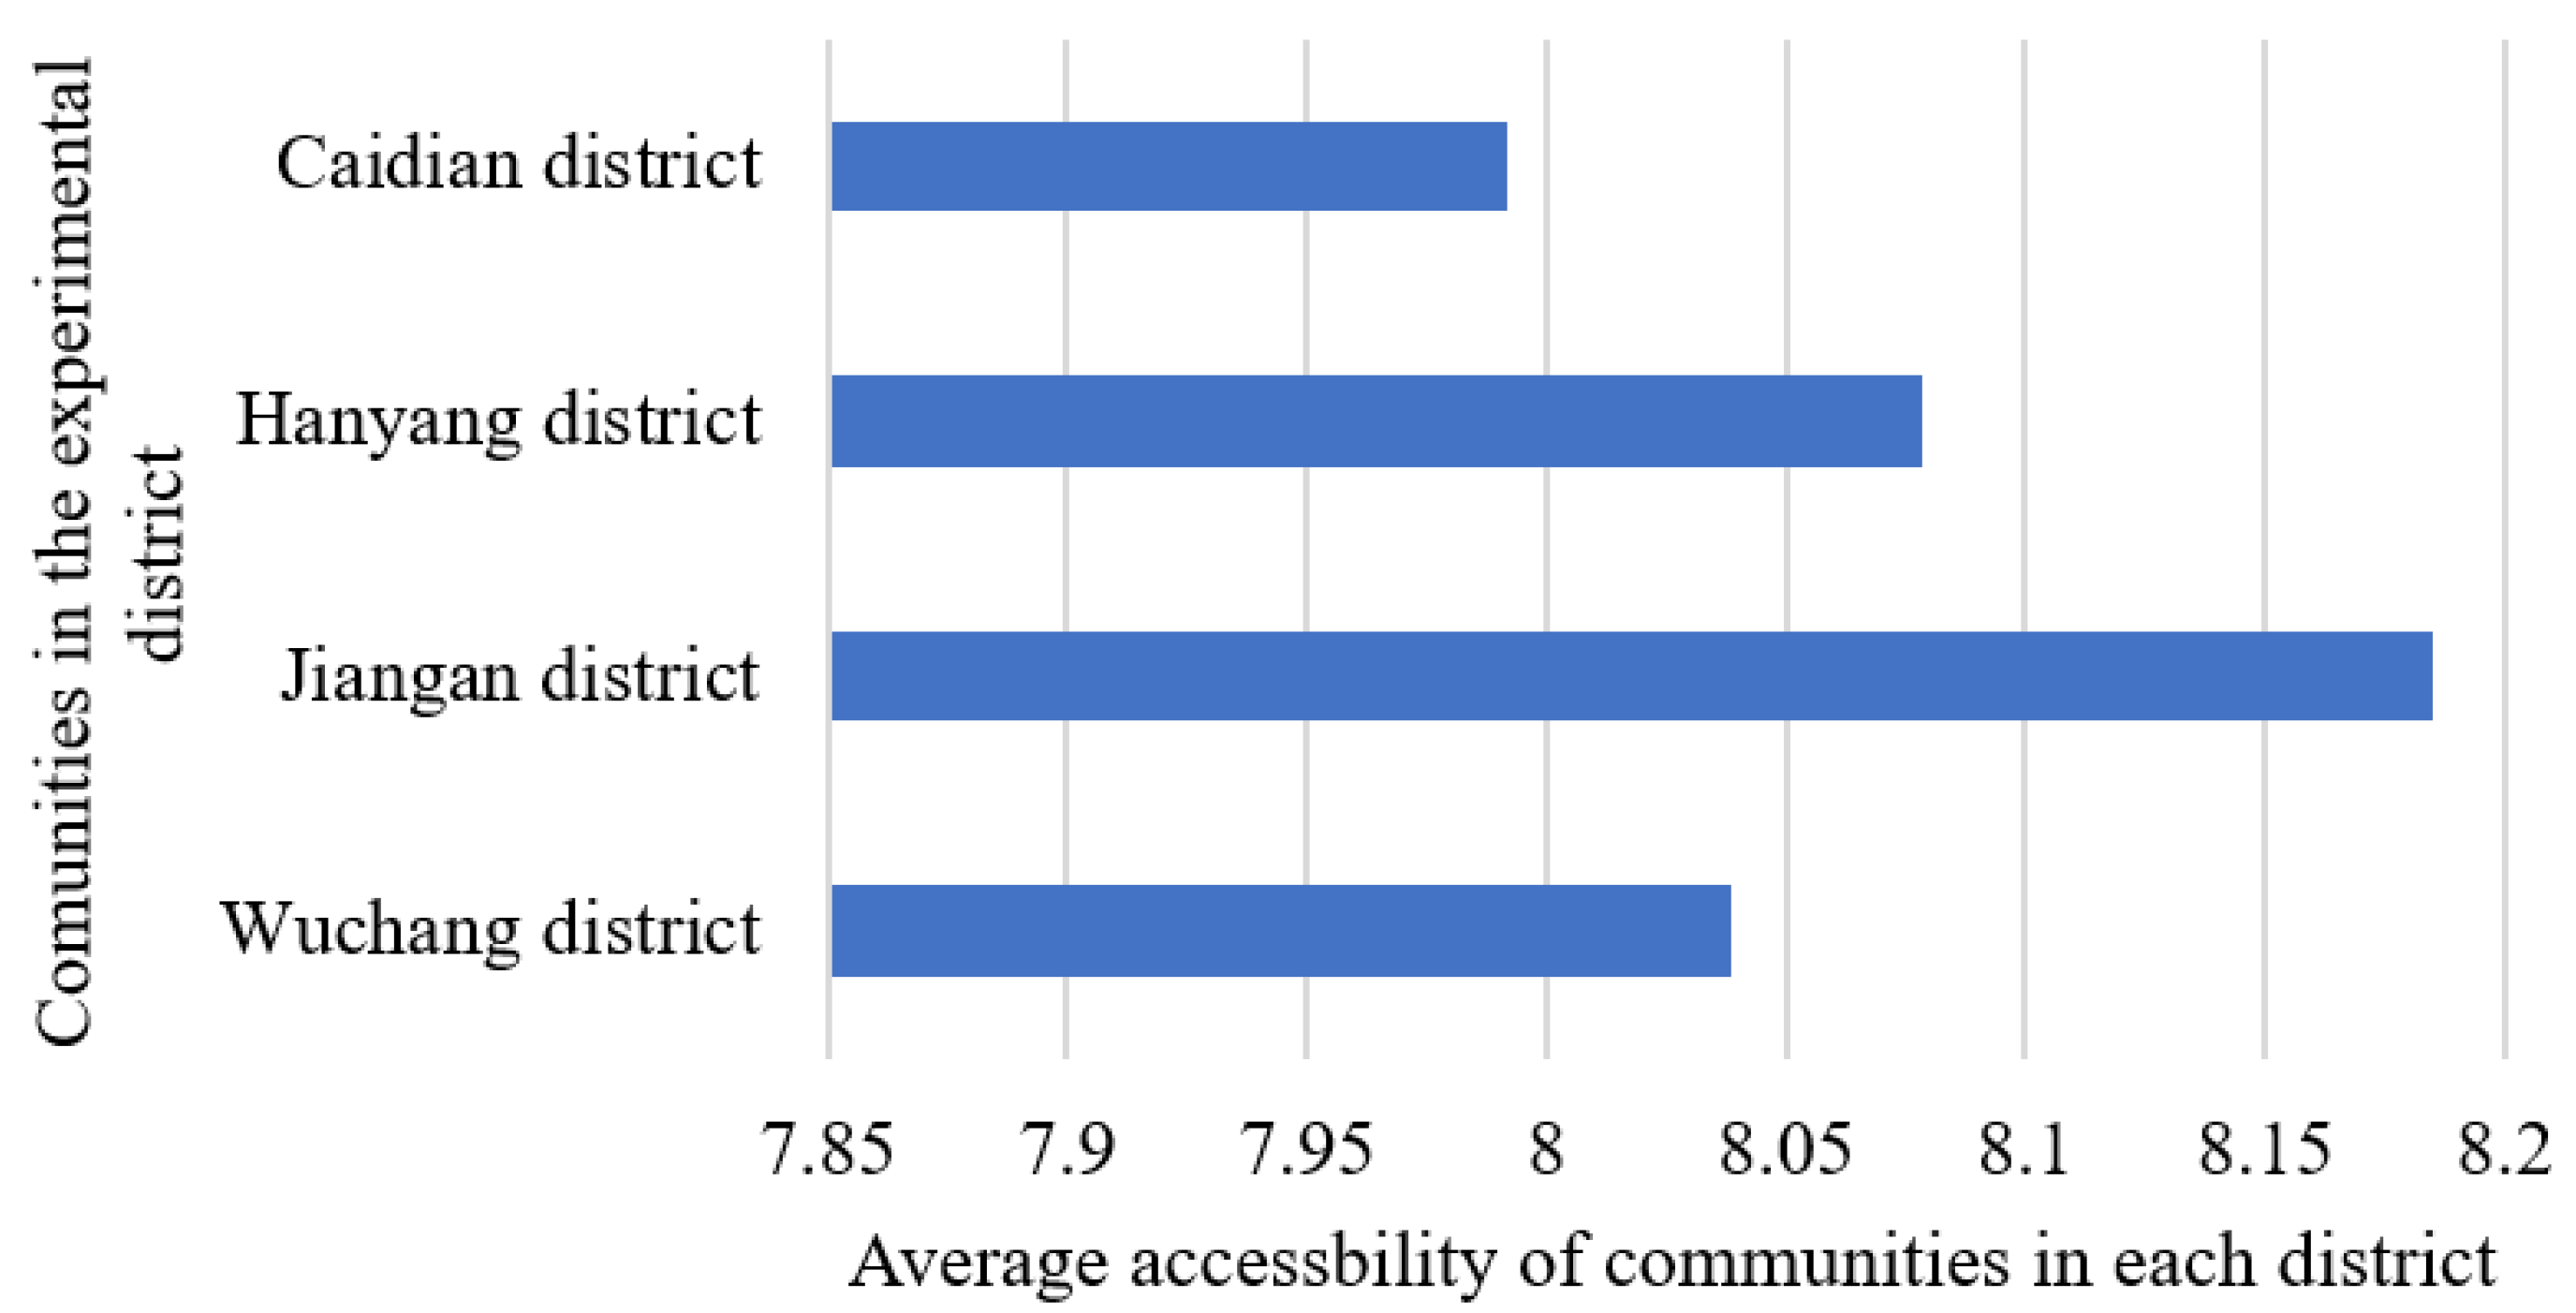
4.4. Resource Equity Analysis Based on the Accessibility Measurement
5. Conclusions
Author Contributions
Funding
Institutional Review Board Statement
Informed Consent Statement
Acknowledgments
Conflicts of Interest
References
- Ståhl, A.; Carlsson, G.; Hovbrandt, P.; Iwarsson, S. Let’s go for a walk!”: Identification and prioritisation of accessibility and safety measures involving elderly people in a residential area. Eur. J. Ageing 2008, 5, 265–273. [Google Scholar] [CrossRef] [Green Version]
- Pirie, G.H. Measuring accessibility: A review and proposal. Environ. Plan. A 1979, 11, 299–312. [Google Scholar] [CrossRef]
- Piotr, C. How to calculate real estate accessibility. In Proceedings of the FIG Working Week: Knowing to Manage the Territory, Protect the Environment, Evaluate the Cultural Heritage, Rome, Italy, 6–10 May 2012. [Google Scholar]
- Ben-Elia, E.; Benenson, I. A spatially-explicit method for analyzing the equity of transit commuters’ accessibility. Transp. Res. Part A Policy Pract. 2019, 120, 31–42. [Google Scholar] [CrossRef]
- Handy, S.L.; Niemeier, D.A. Measuring accessibility: An exploration of issues and alternatives. Environ. Plan. A 1997, 29, 1175–1194. [Google Scholar] [CrossRef]
- Cheng, J.; Bertolini, L.; Le Clercq, F.; Kapoen, L. Understanding Accessiblity: A New Strategy for Its Modelling. 2005. Available online: http://www.e-du.nl/frontiers/2005/discussion/documents/Cheng_accessibility.pdf (accessed on 10 January 2020).
- Preston, J.; Rajé, F. Accessibility, mobility and transport-related social exclusion. J. Transp. Geogr. 2007, 15, 151–160. [Google Scholar] [CrossRef]
- Chen, J.; Ni, J.; Xi, C.; Li, S.; Wang, J. Determining intra-urban spatial accessibility disparities in multimodal public transport networks. J. Transp. Geogr. 2017, 65, 123–133. [Google Scholar] [CrossRef]
- Geurs, K.T.; Van Wee, B. Accessibility evaluation of land-use and transport strategies: Review and research directions. J. Transp. Geogr. 2004, 12, 127–140. [Google Scholar] [CrossRef]
- Grengs, J.; Levine, J.; Shen, Q.; Shen, Q. Intermetropolitan comparison of transportation accessibility: Sorting out mobility and proximity in San Francisco and Washington, DC. J. Plan. Educ. Res. 2010, 29, 427–443. [Google Scholar] [CrossRef]
- Piovani, D.; Arcaute, E.; Uchoa, G.; Wilson, A.; Batty, M. Measuring accessibility using gravity and radiation models. R. Soc. Open Sci. 2018, 5, 171668. [Google Scholar] [CrossRef] [Green Version]
- De Jong, G.; Daly, A.; Pieters, M.; Van der Hoorn, T. The logsum as an evaluation measure: Review of the literature and new results. Transp. Res. Part A Policy Pract. 2007, 41, 874–889. [Google Scholar] [CrossRef] [Green Version]
- Järv, O.; Tenkanen, H.; Salonen, M.; Ahas, R.; Toivonen, T. Dynamic cities: Location-based accessibility modelling as a function of time. Appl. Geogr. 2018, 95, 101–110. [Google Scholar] [CrossRef]
- Chin, H.C.; Foong, K.W. Influence of school accessibility on housing values. J. Urban Plan. Dev. 2006, 132, 120–129. [Google Scholar] [CrossRef]
- Ibem, E.O. The contribution of Public–Private Partnerships (PPPs) to improving accessibility of low-income earners to housing in southern Nigeria. J. Hous. Built Environ. 2011, 26, 201–217. [Google Scholar] [CrossRef]
- Li, H.; Wei, Y.D.; Yu, Z.; Tian, G. Amenity, accessibility and housing values in metropolitan USA: A study of Salt Lake County, Utah. Cities 2016, 59, 113–125. [Google Scholar] [CrossRef]
- Li, H.; Wei, Y.D.; Wu, Y.; Tian, G. Analyzing housing prices in Shanghai with open data: Amenity, accessibility and urban structure. Cities 2019, 91, 165–179. [Google Scholar] [CrossRef]
- Benenson, I.; Ben-Elia, E.; Rofé, Y.; Geyzersky, D. The benefits of a high-resolution analysis of transit accessibility. Int. J. Geogr. Inf. Sci. 2017, 31, 213–236. [Google Scholar] [CrossRef]
- Ingram, D.R. The concept of accessibility: A search for an operational form. Reg. Stud. 1971, 5, 101–107. [Google Scholar] [CrossRef]
- Vickerman, R.W. Accessibility, attraction, and potential: A review of some concepts and their use in determining mobility. Environ. Plan. A 1974, 6, 675–691. [Google Scholar] [CrossRef] [Green Version]
- Shen, G. Location of manufactured housing and its accessibility to community services: A GIS-assisted spatial analysis. Soc.-Econom. Plan. Sci. 2005, 39, 25–41. [Google Scholar] [CrossRef]
- Liang, Y.; Zhu, W. Research on the correlation between the residential area housing price and the accessibility of the public service networks. Comput. Syst. Appl. 2016, 12, 24–29. [Google Scholar]
- Bruno, G.; Improta, G. Using gravity models for the evaluation of new university site locations: A case study. Comput. Oper. Res. 2008, 35, 436–444. [Google Scholar] [CrossRef]
- Krings, G.; Calabrese, F.; Ratti, C.; Blondel, V.D. Urban gravity: A model for inter-city telecommunication flows. J. Stat. Mech. Theory Exp. 2009, 7, L07003. [Google Scholar] [CrossRef] [Green Version]
- Anderson, J.E. The gravity model. Annu. Rev. Econ. 2011, 3, 133–160. [Google Scholar] [CrossRef] [Green Version]
- Tian, Y.; Jim, C.Y.; Liu, Y. Using a spatial interaction model to assess the accessibility of district parks in Hong Kong. Sustainability 2017, 9, 1924. [Google Scholar] [CrossRef] [Green Version]
- Yue, H.; Shao, C. Study on the Application of A* Shortest Path Search Algorithm in Dynamic Urban Traffic. In Proceedings of the International Conference on Natural Computation IEEE, Haikou, China, 24–27 August 2007. [Google Scholar]
- Xie, J.; Yang, T.; Li, G.; Schloss Dagstuhl-Leibniz-Zentrum fuer Informatik. Extracting Geospatial Information from Social Media Data for Hazard Mitigation, Typhoon Hato as Case Study (Short Paper). In Proceedings of the 10th International Conference on Geographic Information Science (GIScience 2018), Melbourne, Australia, 28–31 August 2018. [Google Scholar]
- Bellman, R.E.; Dreyfus, S.E. Applied Dynamic Programming; Princeton University Press: Princeton, NJ, USA, 1962; Available online: http://ictclas.nlpir.org/downloads (accessed on 20 January 2020).
- Yang, X.; Tang, L.; Ren, C.; Chen, Y.; Xie, Z.; Li, Q. Pedestrian network generation based on crowdsourced tracking data. Int. J. Geogr. Inf. Sci. 2020, 34, 1051–1074. [Google Scholar] [CrossRef]
- Smith, G.; Gidlow, C.; Davey, R.; Foster, C. What is my walking neighbourhood? A pilot study of English adults’ definitions of their local walking neighbourhoods. Int. J. Behav. Nutr. Phys. Act. 2010, 7, 34. [Google Scholar] [CrossRef] [Green Version]


| Symbol | Definition |
|---|---|
| i | Origin (single building) |
| j | Destination(amenity) |
| Tij | Spatial interaction between the origin i and destination j |
| Oi | The number of residents in a building i |
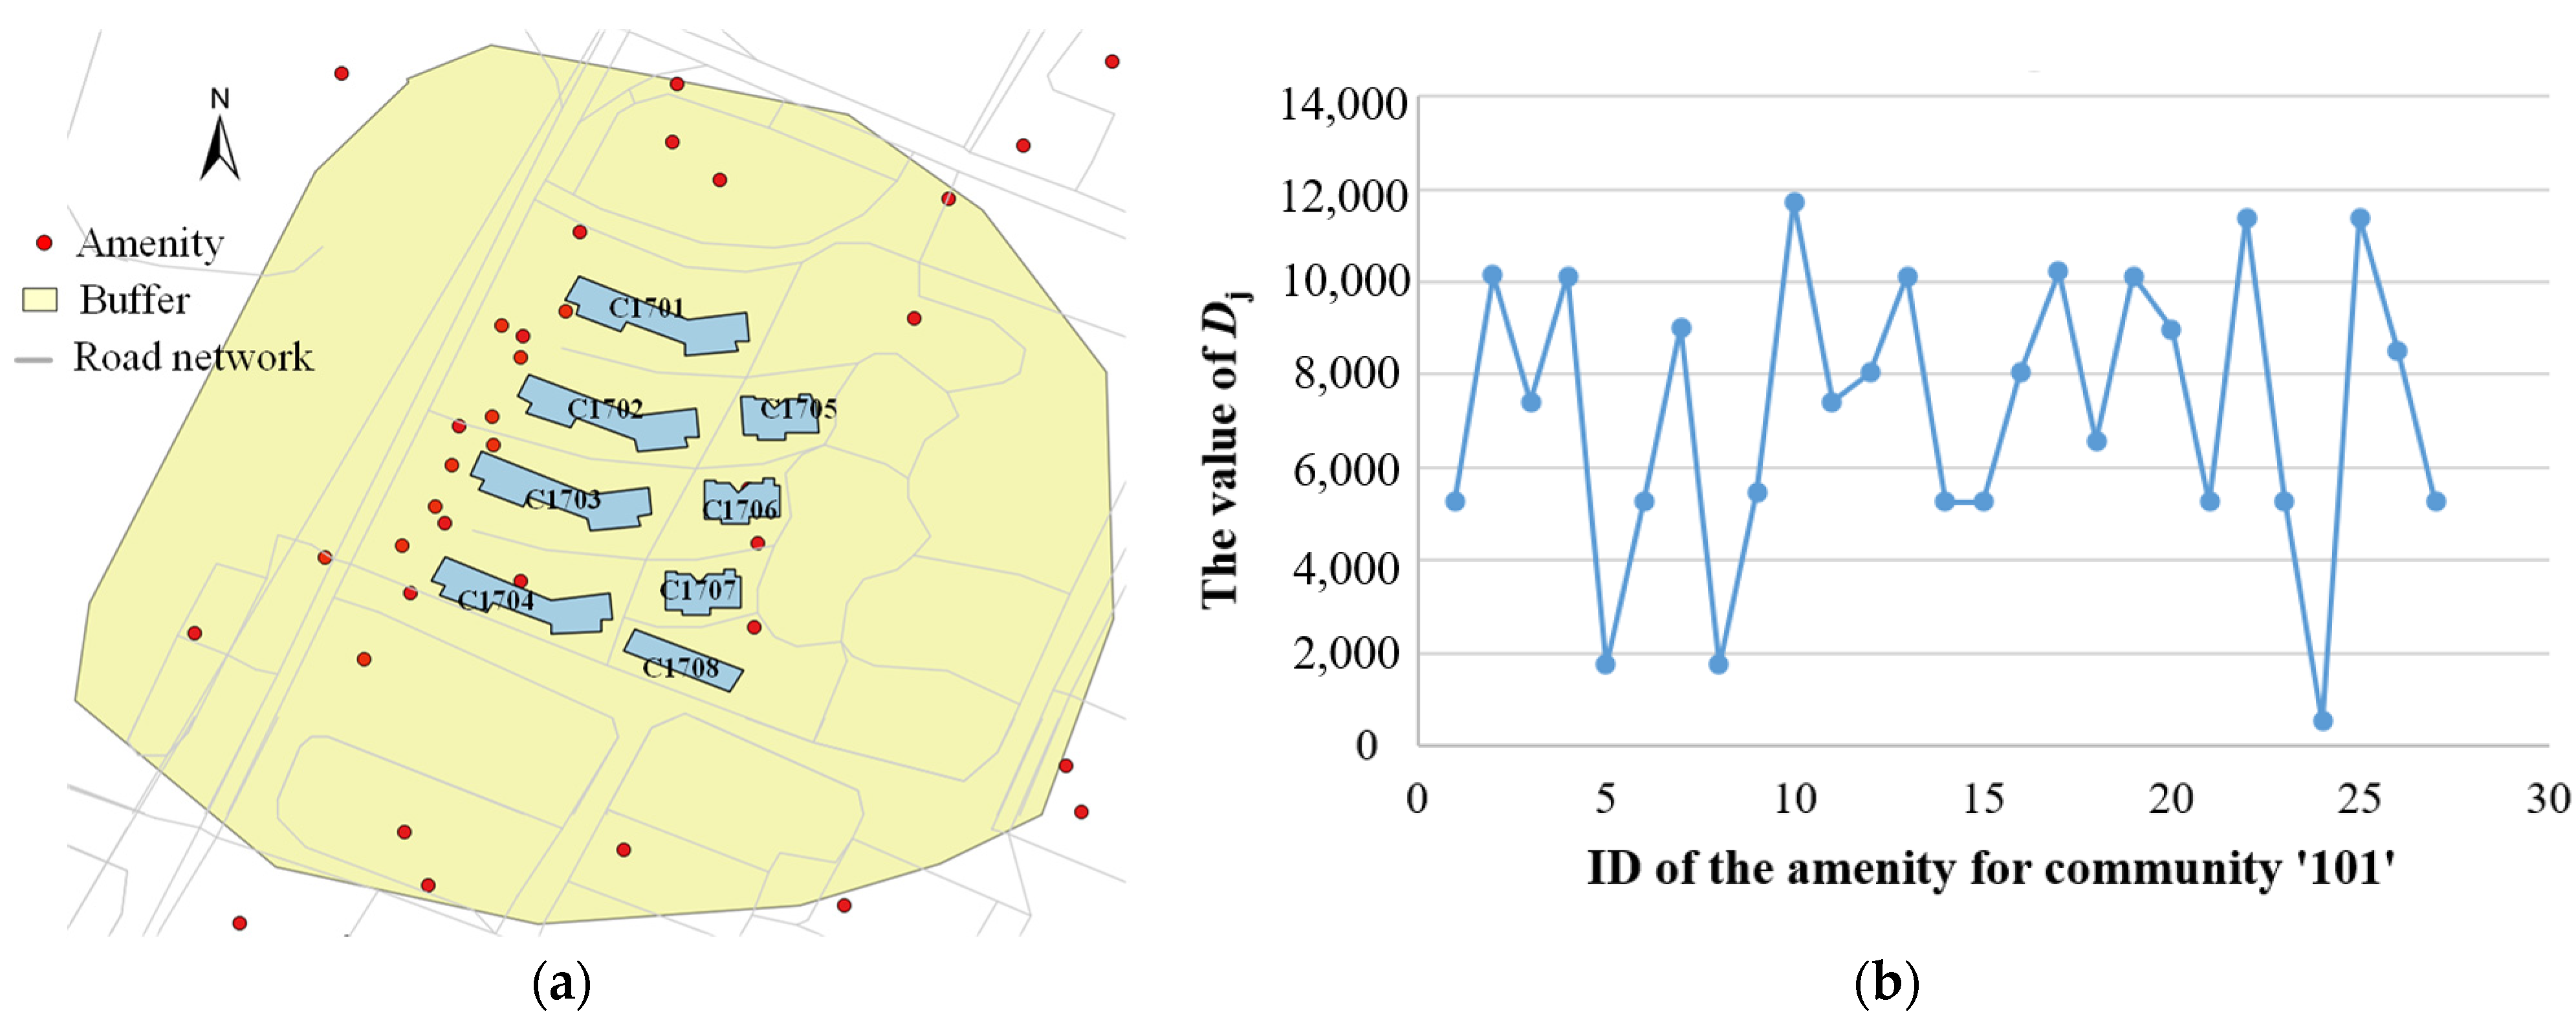
| Dj | The population capacity of surrounding amenities j |
| cij | The travel time of the shortest path from the origin i to a destination j |
| k | A parameter that reflects increasing rate in a friction of the time |
| Ai | An attractiveness index which is used to reflect the main characteristics of a residential area |
| Ti | The accessibility of building i |
| Nd | The total number of amenities in a buffer of building i |
| NT | All amenities in the experimental area |
| tpd | The number of amenity types in the buffer of building i |
| NP | The total number of amenity types in the experimental area |
| p1 | The proportion of Nd to NT |
| p2 | The proportion of tpd to NP |
| p3 | The proportion of ngood to Nsign |
| ngood | The number of positive comments from residents |
| Nsign | The total number of comments from residents, Nsign = 0 for no comment |
| pk | The travel mode, pk = 1 for walking, pk = 2 for public transportation, pk = 3 for private car |
| disij | The shortest network distance from an origin i to a destination j |
| disis | The shortest network distance from i to a stop/station s |
| dissj | The shortest network distance from s to j |
| disip | The shortest network distance from i to a nearest parking lot p |
| dispj | The shortest network distance from p to j |
| v1 | The average speed of walking |
| v2 | The average speed of public transportation |
| v3 | The average speed of private car |
| District | Community ID | Total Area (m2) | The Number of Buildings |
|---|---|---|---|
| Wuchang | 101 | 40,282 | 8 |
| Jiangan | 201 | 32,000 | 8 |
| 202 | 111,106 | 19 | |
| 203 | 37,647 | 9 | |
| Hanyang | 301 | 62,651 | 13 |
| 302 | 67,412 | 7 | |
| Caidian | 401 | 103,572 | 23 |
| District Name | Population | Area (km2) | Annual GDP (Billion) |
|---|---|---|---|
| Jiangan | 690,000 | 64 | 1100.8 |
| Hanyang | 530,000 | 108 | 1100.2 |
| Wuchang | 1,140,000 | 81 | 1290.1 |
| Caidian | 470,000 | 1094 | 440.7 |
Publisher’s Note: MDPI stays neutral with regard to jurisdictional claims in published maps and institutional affiliations. |
© 2021 by the authors. Licensee MDPI, Basel, Switzerland. This article is an open access article distributed under the terms and conditions of the Creative Commons Attribution (CC BY) license (https://creativecommons.org/licenses/by/4.0/).
Share and Cite
Yang, X.; Cao, Y.; Wu, A.; Guo, M.; Dong, Z.; Tang, L. Accessibility Assessment of Buildings Based on Multi-Source Spatial Data: Taking Wuhan as a Case Study. ISPRS Int. J. Geo-Inf. 2021, 10, 701. https://0-doi-org.brum.beds.ac.uk/10.3390/ijgi10100701
Yang X, Cao Y, Wu A, Guo M, Dong Z, Tang L. Accessibility Assessment of Buildings Based on Multi-Source Spatial Data: Taking Wuhan as a Case Study. ISPRS International Journal of Geo-Information. 2021; 10(10):701. https://0-doi-org.brum.beds.ac.uk/10.3390/ijgi10100701
Chicago/Turabian StyleYang, Xue, Yanjia Cao, Anqi Wu, Mingqiang Guo, Zhen Dong, and Luliang Tang. 2021. "Accessibility Assessment of Buildings Based on Multi-Source Spatial Data: Taking Wuhan as a Case Study" ISPRS International Journal of Geo-Information 10, no. 10: 701. https://0-doi-org.brum.beds.ac.uk/10.3390/ijgi10100701