
Impact Assessing of Traffic Lights via GPS Vehicle Trajectories

1
School of Computer Science and Engineering, Hunan University of Science and Technology, Xiangtan 411201, China
2
Hunan Key Laboratory for Service Computing and Novel Software Technology, Hunan University of Science and Technology, Xiangtan 411201, China
*
Author to whom correspondence should be addressed.
ISPRS Int. J. Geo-Inf. 2021, 10(11), 769; https://0-doi-org.brum.beds.ac.uk/10.3390/ijgi10110769
Submission received: 27 September 2021
/
Revised: 27 October 2021
/
Accepted: 8 November 2021
/
Published: 12 November 2021
Abstract
:The adaptability of traffic lights in the control of vehicle traffic heavily affects the trafficability of vehicles and the travel efficiency of traffic participants in busy urban areas. Existing studies mainly have focused on the presence of traffic lights, but rarely evaluate the impact of traffic lights by analyzing traffic data, thus there is no solution for practicably and precisely self-regulating traffic lights. To address these issues, we propose a low-cost and fast traffic signal detection and impact assessment framework, which detects traffic lights from GPS trajectories and intersection features in a supervised way, and analyzes the impact range and time of traffic lights from intersection track data segments. The experimental results show that our approach gains the best AUC value of 0.95 under the ROC standard classification and indicates that the impact pattern of traffic lights at intersections is high related to the travel rule of traffic participants.
1. Introduction
Traffic signal information not only can achieve vehicle safety, global scheduling and increase traffic efficiency, but also can improve the quality of application services, such as intelligent navigation and route planning, and effectively estimate the driving time of unmanned vehicles. Therefore, it has become an indispensable source of input data in various urban navigation applications. The path planning system uses traffic signal information to calculate the shortest time path, thus reducing the waiting time of vehicles in crossroads, improving fuel efficiency and reducing greenhouse gas emissions [1,2,3]. The research results of Apple J. et al. [4] indicate traffic signal information can also provide a more accurate travel time estimation for the navigation system. Obviously, if the traffic signal information is correct, accurate and up-to-date, then it can better serve the urban traffic. Some traditional solutions have used visual algorithms to process street scenes mapped by vehicles and extract traffic signal information. However, due to the greater impact of weather and light on the accuracy of the vision algorithm, and the cost of this scheme being higher, the detection of traffic lights based on trajectory data has become a popular research topic. A natural question is how to update traffic signal information at the best time and cost. From the perspective of the transportation department, theoretically, traffic lights are mainly set based on the size of intersections, pedestrian crossing needs, road grades and other factors, thereby, regulating the vehicular traffic and the behavior of traffic participants within a certain range. However, in nearly every country, there is strict criteria for setting traffic lights. According to the Chinese road traffic signal settings and installation specifications (GB14886-2016) [5], the intersection traffic lights are set based on three aspects: intersection type, intersection traffic flow and intersection traffic accident condition, which are not related to the rest of the intersection features. However, setting traffic lights with a fix time usually cannot adapt to the temporary changing or periodic law of traffic flow. From the perspective of traffic participants, traffic lights are important information that determines different behaviors, such as waiting or moving forward, at the current intersection.
In this paper, we explore the effect of using GPS trajectories and intersection features for detecting intersection traffic lights, and the influence of sampling trajectories in different intersection ranges on classification performance for setting traffic lights. According to the available data and the specification, we mainly consider three most relevant intersection characteristics in our traffic signal detection and impact assessment framework: intersection type, multiple of different types of roads, and intersection traffic flow. In fact, the traffic signal detection is a binary classification problem, and the impact accessment of traffic lights is a feature extraction and analysis problem, but involves different traffic scenarios and periodic laws of traffic flow. The following summarizes the main contributions of this paper:
- (1)
- A detection framework based on deep learning algorithm is proposed, which focuses on three decisive metrics specified by the specifications for road traffic signal setup and installation. It differs from other frameworks in terms of physical feature vectors and statistical feature vectors extracted from trajectory data.
- (2)
- A new DLSTM network is designed to fuse intersection features and trajectory velocity sequence features for joint learning, thereby, further improving the detection accuracy of intersection traffic lights.
- (3)
- An incremental matching algorithm is designed to quantitatively measure the impact of traffic lights by calculating the impact range and time of traffic lights at intersections based on vehicle movement patterns, which will benefit the self-regulation of traffic lights.
The rest of the paper is organized as follows. After a brief review of related work in Section 2, a deep learning-based framework is proposed in Section 3, where we detail the trajectory velocity sequence computation, intersection feature extraction, and metric computation. Section 4 shows the experimental results and discussion on the public dataset provided by the Drip Gaia project. Finally, the paper is summarized in Section 5.
2. Related Works
There are two main approaches for detecting traffic lights by using trajectory data. One approach involves using traditional machine learning algorithms as a classification method. Hu et al. [6] calculated physical feature vectors, including final stopping time, minimum speed, number of decelerations, number of stops and the distance to an intersection, and statistical feature vectors, including minimum, maximum, mean and variance, based on trajectory data, and then used the random forest classification method to detect intersection stop signs and traffic lights, and finally classified intersection traffic lights. Later, Qiu et al. [7] used the feature of a deceleration followed by an acceleration to detect stop signs. In addition, to evaluate the detection performance, they used two different kinds of data: data from in-car sensors (transverse oscillation rate, steering wheel angle, brake position, throttle position, and inertial sensors) and cell phone inertial sensors (gyroscope, magnetometer, and accelerometer). They found that while there were more specific types of automotive sensor data, such as brakes and accelerometers, the classification using cell phone sensor data was also reasonably accurate. This suggests that trajectories are highly correlated with stop signs. Recently, Meneroux et al. [8] extracted velocity profiles from GPS trajectories, used a random forest approach to detect traffic lights and analyzed the impact of three different types of data feature extraction methods, namely raw velocity measurement techniques, image recognition techniques and functional data analysis techniques, on the classification effectiveness.
Deep learning algorithms have also attracted the attention of researchers as another popular classification method. The earliest related study [9] was presented by Pribe and Rogers, which included a method that used neural network learning to compare driver behavior with two associated traffic rules (stop lights and stop signs). They used the mean and standard deviation of the characteristics associated with the stopping events, namely the number of stops, the total duration of all stops and the last three stops, as input to the neural network. In addition, they calculated the percentage of cross-sectional measurements for each road segment containing at least one stop. Recently, Golze et al. [10] used different sampling settings of the same nature: random oversampling [11], SMOTE (Synthetic Minority Oversampling TEchnique) [12] and ADASYN (ADAptive SYNthetic sampling approach) [13]. They investigated the effect of learning traffic rules (traffic lights, yield rules) on physical feature vectors obtained from trajectory data and compared the classification accuracy of decision trees, random forests, support vector machines, and neural network algorithms to initially explore the difference between machine learning and deep learning. Also, Cheng et al. [14] proposed a sequence-to-sequence deep learning model that uses trajectory velocity sequences as time series to achieve the above objectives in order to prevent the absence of implied motion information of vehicle trajectories.
However, the aforementioned studies failed to utilize roadway features. Based on this, Saremi F. et al. [15] extracted relevant road features from OSM (OpenStreetMap, which provides free worldwide geodata collected by volunteers), such as speed class of the road segment, distance from one intersection to the next closest intersection, end-to-end distance and road segment category. They used a random forest approach as a classifier to predict traffic lights and stop signs, and investigated the effect of using only road features and combining intersection features and physical feature values of trajectories (number of stops, intersection speed and stopping time) on the classification. The results showed that the classification accuracy is improved by using a mixture of feature vectors.
Most of the above work uses physical and statistical features extracted from GPS trajectories, such as stop time, stop duration, deceleration, stop event, and speed curve. These types of characteristics summarize the movement dynamics of the vehicle over time at the relevant intersection. However, the detailed information about the movement of the vehicle trajectory from the previous time slot to the next time slot is lost. On the other hand, the statistical characteristics of vehicle trajectories at the same time and intersection are not necessarily the same. In addition, from the perspective of using relevant data as much as possible to improve classification performance, the above-mentioned research also ignores the setting standards of road traffic lights, and there is no further classification of traffic lights. Although some studies have used deep learning algorithms for classification, they have not clearly used specific networks and settings, that is, they have not fully compared the effects of deep learning algorithms and machine learning algorithms.
3. Proposed Research Framework and Approach
3.1. GPS Track Sequence
The GPS track record of vehicle is a triple structure, including longitude, latitude and time. And the GPS track records are collected in chronological order.
where is the time stamp, which indicates the time of sampling, represents the location of vehicle at sampling time. Based on the above definition, traffic light detection based on trajectory data is essentially a classification problem. For a given intersection , the mathematical form of traffic light detection is as follows:
where refers to the type of traffic light, and refers to the trajectory sequence and intersection features, which are used to detect the traffic light, as follows:
where, denotes a sequence of track velocity, Itype represents the intersection type, denotes the traffic flow at the intersection, denotes the number of major roads accessed by the intersection, and denotes the number of minor roads accessed by the intersection.
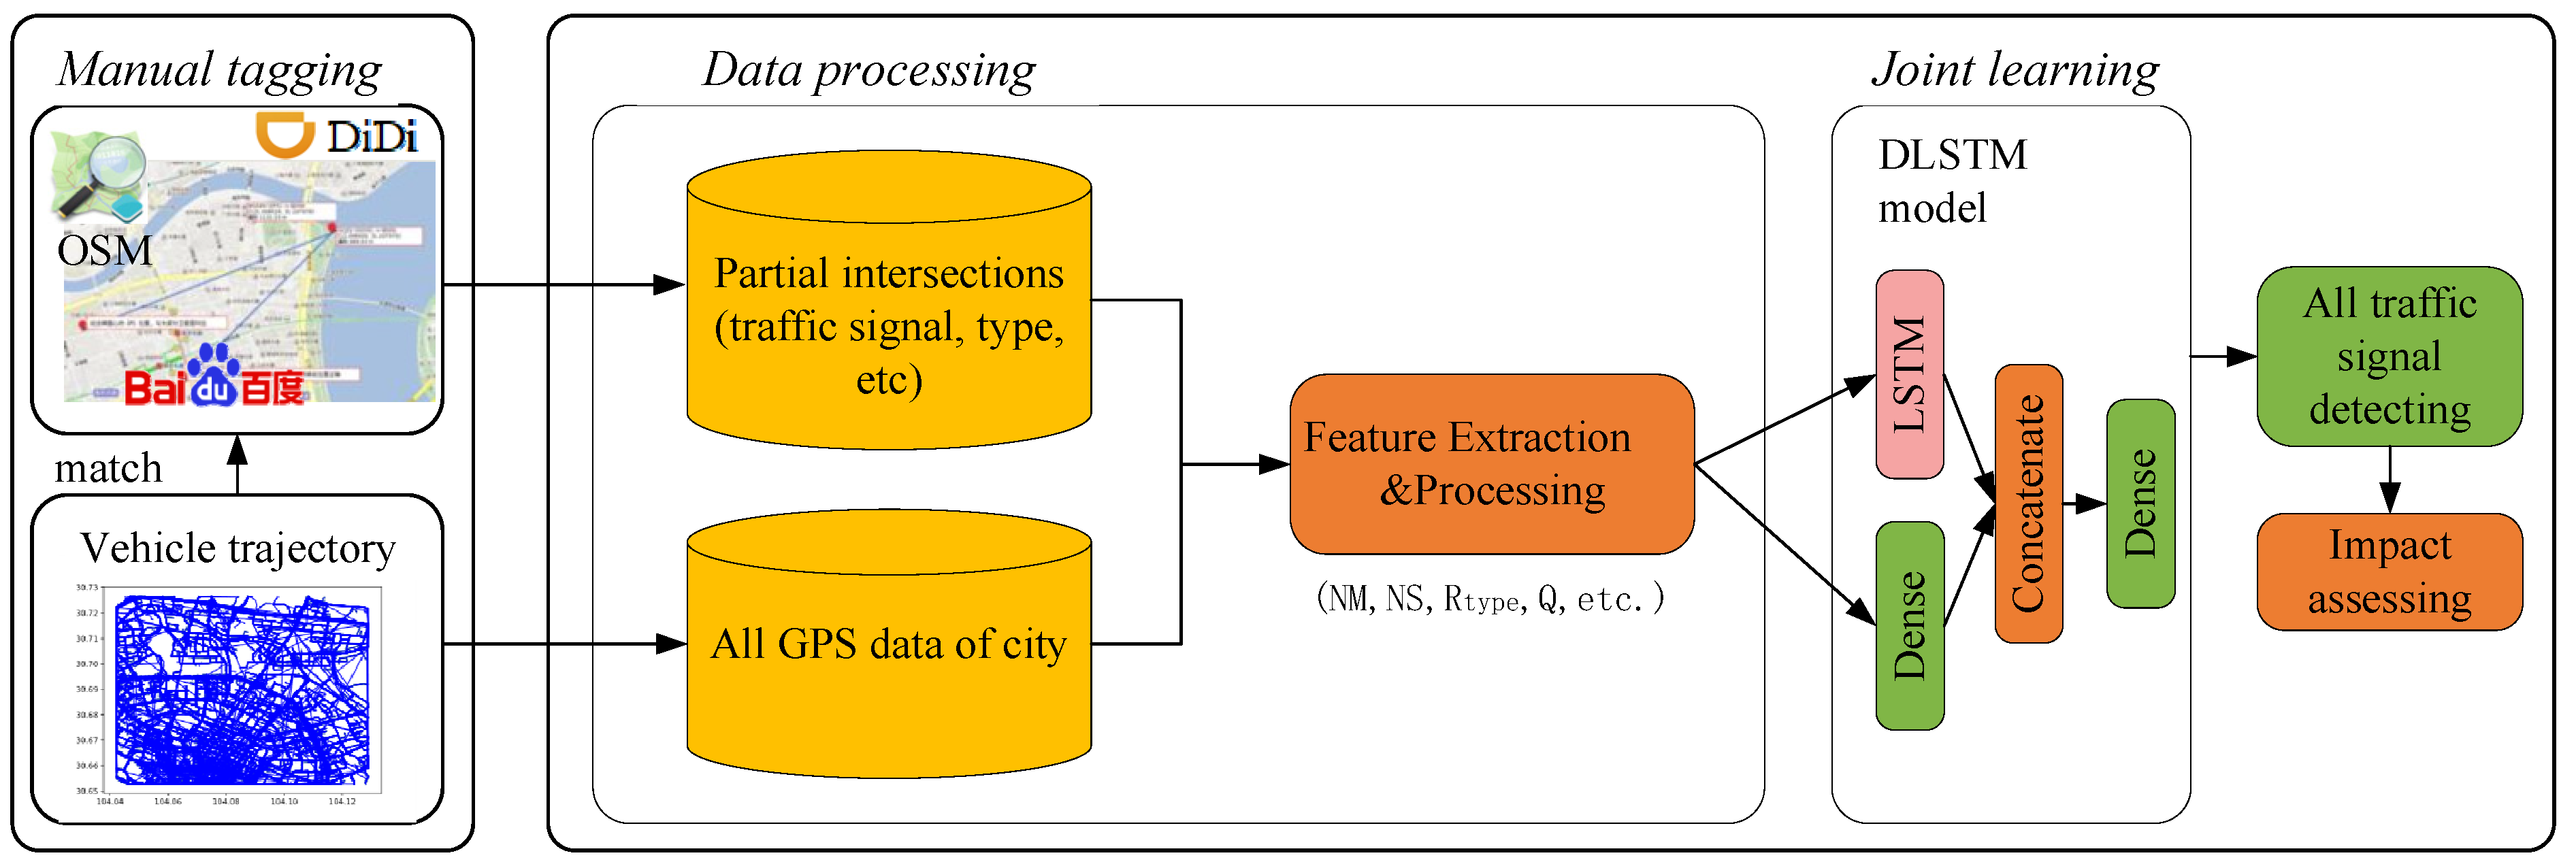
For extracting the trajectory velocity sequence and intersection features, and accessing the impact range and time of traffic lights, the research framework is proposed, as shown in Figure 1. In this study, the intersection type is represented by the type of access road, and the road type (Rtype) is considered as the classification of speed limit, which is calculated from the trajectory data owing to the following main reasons: (a) to ensure the consistency of the map and trajectory data in terms of timeliness; and (b) to compensate for the lack of relevant data due to the lack of detailed map information. After traffic light detecting by using supervised learning, the impact accessing of traffic lights applies an incremental matching algorithm. In the following sections, we will describe in detail the processing shown in the research framework.
3.2. Trajectory Map Matching
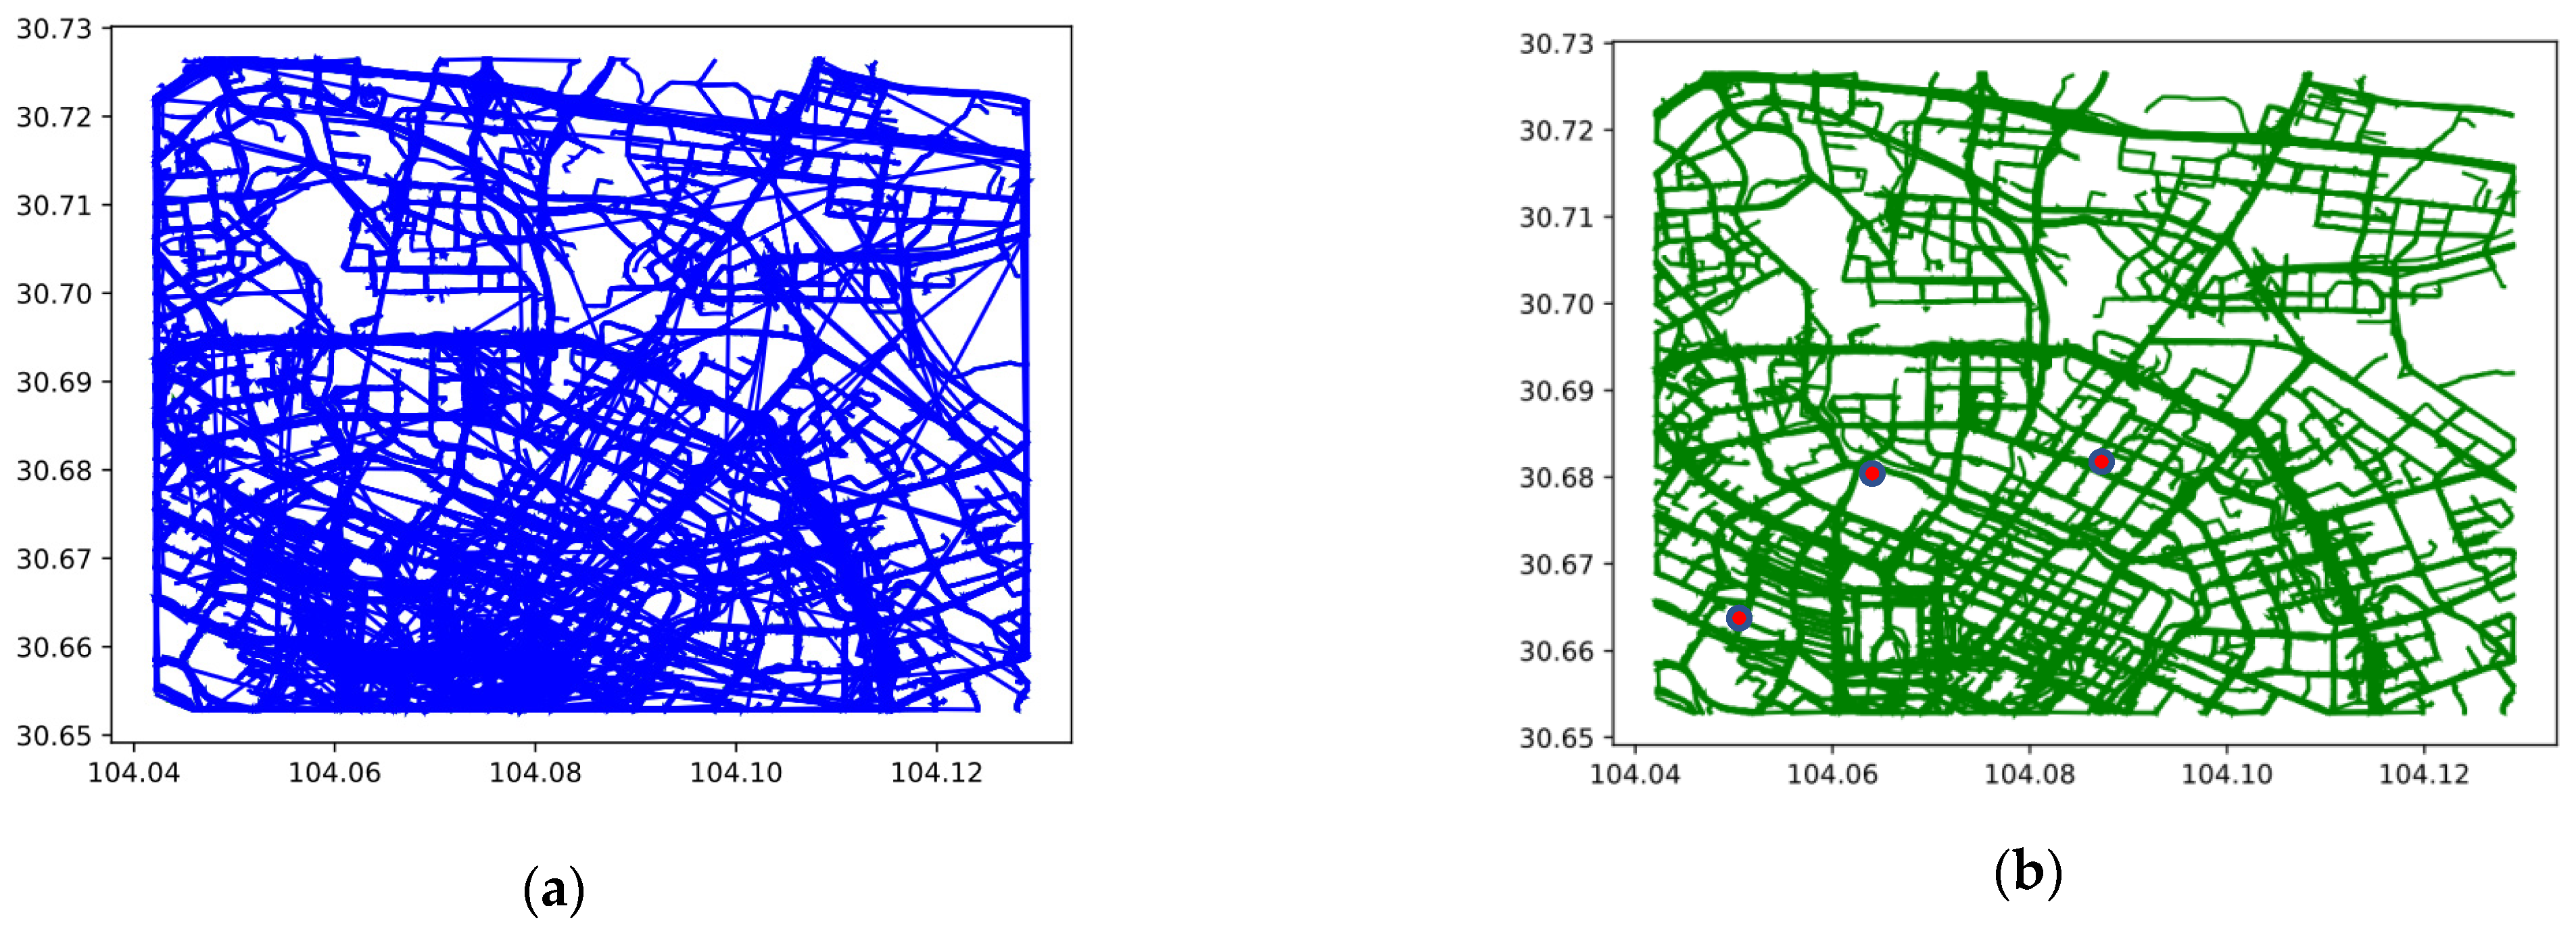
The feature module serves as a guideline for the corresponding processing of the original trajectories shown in Figure 2a. First, the trajectory-road network matching will be performed. For a trajectory record tr in the data set, after the track point drift phenomenon has been resolved, the trajectory points can correspond to specific street points. Therefore, we used the common geometric matching method (i.e., the distance-based and spatial relationship-based similarity methods) for matching track points to their nearest road.
Due to the types of intersections and the length of the traffic lights not being consistent, the range of influence on the vehicle velocity is also different. The calculation method of the vehicle velocity is based on the velocity of trajectory point in a certain road, which is shown as follows:
where is a GPS track point, e is a road ID, is the actual distance between two GPS track points and and R is the earth’s mean radius of 6371.04 km.
3.3. Intersection Feature Extraction
The speed limit () level of road indicates the road type. For the maximum speed limit () of a certain road e, only two types are discussed in this section: (i). The arterial roads with the speed limit greater than 60 km. (ii). The secondary roads where the speed limit is less than or equal to 60 km. The road type Rtype is:
According to the road network topology obtained from the data set, the number of major and minor roads at intersections, namely NM and NS, are counted. The types of intersections are distinguished according to the types of roads connected. There are three types: (i) access roads are all arterial roads, (ii) access road types are all secondary arterial roads, and (iii) two types of access roads are mixed. Then the intersection type Itype is:
The three types of intersections are common in a city, illustrated in Figure 3, which are detailed from Figure 2b.
Traffic flow (Q) is the number of vehicles passing a reference point per unit of time, i.e., vehicles per hour. The inverse of flow is headway time (h), which is the time that elapses between the ith vehicle passing a reference point in space and the (i + 1)th vehicle. In congestion, h remains constant. As a traffic jam forms, h approaches infinity. The flow (Q) passing a fixed point (x1) during an interval (T) is equal to the inverse of the average headway of the m vehicles.
Q = m/T
3.4. Intersection Traffic Signal Marking
The OSM map data of the area corresponding to the DiDi data set, which collected by the ride-hailing service of DiDi company, was downloaded, and 49 intersection traffic lights are filtered out in the area based on keywords. Then, the coordinate picking system of Baidu is used to manually mark the traffic light information of the remaining 200 intersections in the area. Since the coordinate system used in OSM, DiDi and Baidu Map is not a standard, we have unified the coordinate system by using public conversion codes. After completing the above work, we can get the intersection feature vector ItFe = (Type(e), NM, NS, TrV), the traffic signal mark vector TL and the vehicle trajectory velocity vector VT = (TrV1,…, TrVn). Before inputting them, the VT is sampled according to the intersection range.
3.5. Traffic Signal Detection Using DLSTM Mode
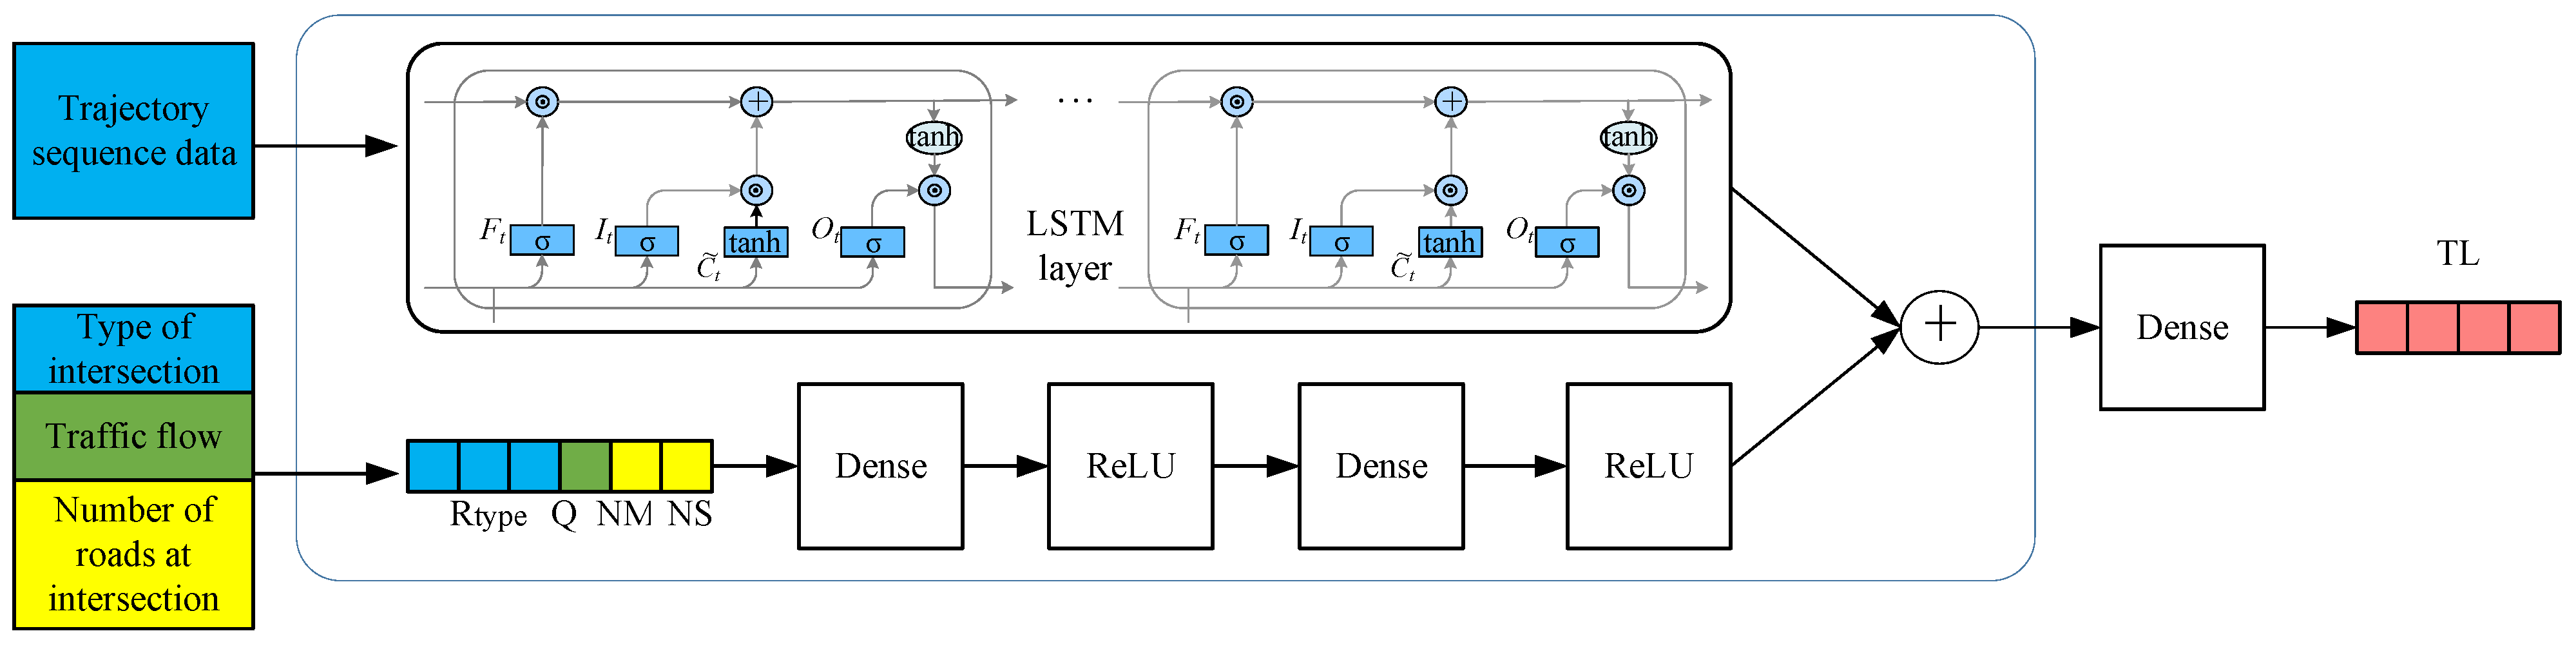
The trajectory and intersection characteristics of the joint learning data are crucial to improve the accuracy of intersection traffic lights detecting. For structured data analysis, the common approach is to use machine learning and common multilayer perceptron models to mine the potential patterns in the data, while for temporal data analysis, the common mining models are common RNN and GRU with LSTM. Therefore, in consideration of the high convergence phase, transforming the MLP with LSTM, both are neural networks, and splicing vectors can retain the long-term dependence of LSTM learning at low-cost. Consequently, we propose a DLSTM network which combining the Dense module and LSTM based on a multi-input model. First, the Dense module is used to process discrete intersection features, and the LSTM structure of the RNN module is used to learn the timing information implicit in the trajectory, and then the two separately processed tensors are merged to jointly learn one more precise data model. Figure 4 illustrates the processing structure of intersection and trajectory features, as follows:
Trajectory sequence feature VT: Given a trajectory sequence tr within the range of an intersection, the LSTM network captures the complex relationship between the trajectory state sequence and traffic lights. Specifically, the LSTM network regards the trajectory as the state sequence of the vehicle, accepts the 1D state representation of the vehicle, and returns a 1D vector of implicit information, denoted as H1. In the network, an LSTM recurrent neuron contains:
- (a)
- An input gate it and the corresponding weight matrix Wxi, Whi, Wci, bi; a forget gate ft and the corresponding weight matrix Wxf, Whf, Wcf, bf; an output gate ot and the corresponding weight matrix Who, Wco, bo. All these gates can produce a threshold, which determines the degree of information change. The parameter updating calculations are as follows:
- (b)
- Intersection characteristics (Rtype, Q, MN, NS): Because the characteristics of an intersection, such as intersection type, average traffic at an intersection and number of access roads, are static for a period of time, we regard them as an intersection feature vector and mark it as L. Then, a fully connected multilayer perceptual neural network is designed for learning these discrete features. Specifically, the sequential model with two layers of dense/fully connected networks and subsequent ReLU activation functions is given by:L1 = Dense(L), L2 = ReLU(L1),
L3 = Dense(L2), L4 = ReLU(L3).
Subsequently, the two tensors of L4 and H1 are connected to form a vector of joint learning. After a fully connected layer transformation and activation of the Softmax function, the traffic light mark TL, that is the result of classification Yn, is obtained as follows:
L6 = Dense(L5), TL = Softmax(L6)
Furthermore, the cross-entropy loss, which is commonly applied for single-label multi-classification, is used as the loss function of DLSTM:
The output of this hybrid network is the probability vector TL after the Softmax performed, where 0 indicates that there is no traffic light at the intersection, and conversely, 1 identifies the presence of a traffic light at the intersection.
3.6. Traffic Signal Impact Assessing
The impact of traffic lights on vehicle movement is not constant over time. Therefore, an incremental matching algorithm, as shown in Algorithm 1, is designed for calculating the impact range and time of traffic lights at intersections, and further measuring the impact of traffic lights on the waiting queue of vehicles. The algorithm determines the intersection impact area based on the phase change of velocity curve near an intersection, denoted as AdR. Similarly, the impact time also can be calculated based on the velocity-time series using Algorithm 1.
| Algorithm 1. Incremental Matching Algorithm for Calculating the Impact Range of Traffic Lights |
| Input: an intersection and the passing vehicle trajectories; Output: Adaptive impact range of the traffic light; Initialize , initialize the set , and set the increment determination threshold ε = 5; For each track at the intersection: Calculated trajectory velocity sequence ; /* is the velocity of trajectory point to */ Calculate the acceleration ; if /*The vehicle is in the acceleration or deceleration phase, not in the stopping phase*/ ; /* The affected area of the track is increased by 1 m*/ end if if : /* The vehicle is in the constant speed phase or the stop phase */ add to ; /* The impact range of the traffic light has been determined and there will be no more added */ end if ; /* Take the largest value in the set as the impact range of the traffic light at the intersection */ |
4. Experiments and Analysis
4.1. Experimental Data Set
In our experiment, for verifying the approach of intersection detection and impact range assessing, we used the data set of Chengdu city, China. Trajectory points in the data set are recorded at a frequency of 2 to 6 s per time. Part of the traffic signal marker data set comes from OSM [16]. The rest of the corresponding track areas are manually marked from the Baidu coordinate picking platform in the Baidu Map. We choose the picking area to be within the second ring road in Chengdu. After the data processing, a data set of intersections are available. In particular, the data examples of three types of intersections are presented as Table 1.
4.2. Evaluation Index and Result
The purpose of defining vehicle trajectories-based traffic light detection as a classification task is to construct the relationship between a given dataset and the presence of traffic lights. Since traffic lights are present at the vast majority of intersections in urban roads, it is clear that this data is unbalanced and requires the receiver operating characteristic (ROC) as a measure. Compared with the single accuracy and recall index, ROC curve has an excellent characteristic: when the distribution of positive and negative samples in the test set changes, the ROC curve can remain unchanged. Class imbalance often occurs in the actual data set, that is, negative samples are much more than positive samples (or vice versa), and the distribution of positive and negative samples in the test data may change at any time.
Moreover, the area under receiver operating characteristic (AUROC), refers to the area under the ROC curve, is also a widely used metric in classification field. ROC curve defines false positive rate (FPR) as x axis and true positive rate (TPR) as y axis, which are calculated as follows:
In this paper, the mainstream algorithms (i.e., decision tree, random forest, SVM, MLP [17], KNN and Naive Bayes classifier) mentioned in the work [10,11] are used as the classifier for comparison. We take the average of the AUROC values of each category as the final result of the method. Generally, the smaller the cross-entropy loss value, the higher the AUROC values, which means the better the classification results. And the results shown in Figure 5 demonstrate that our method achieve the better classification results.
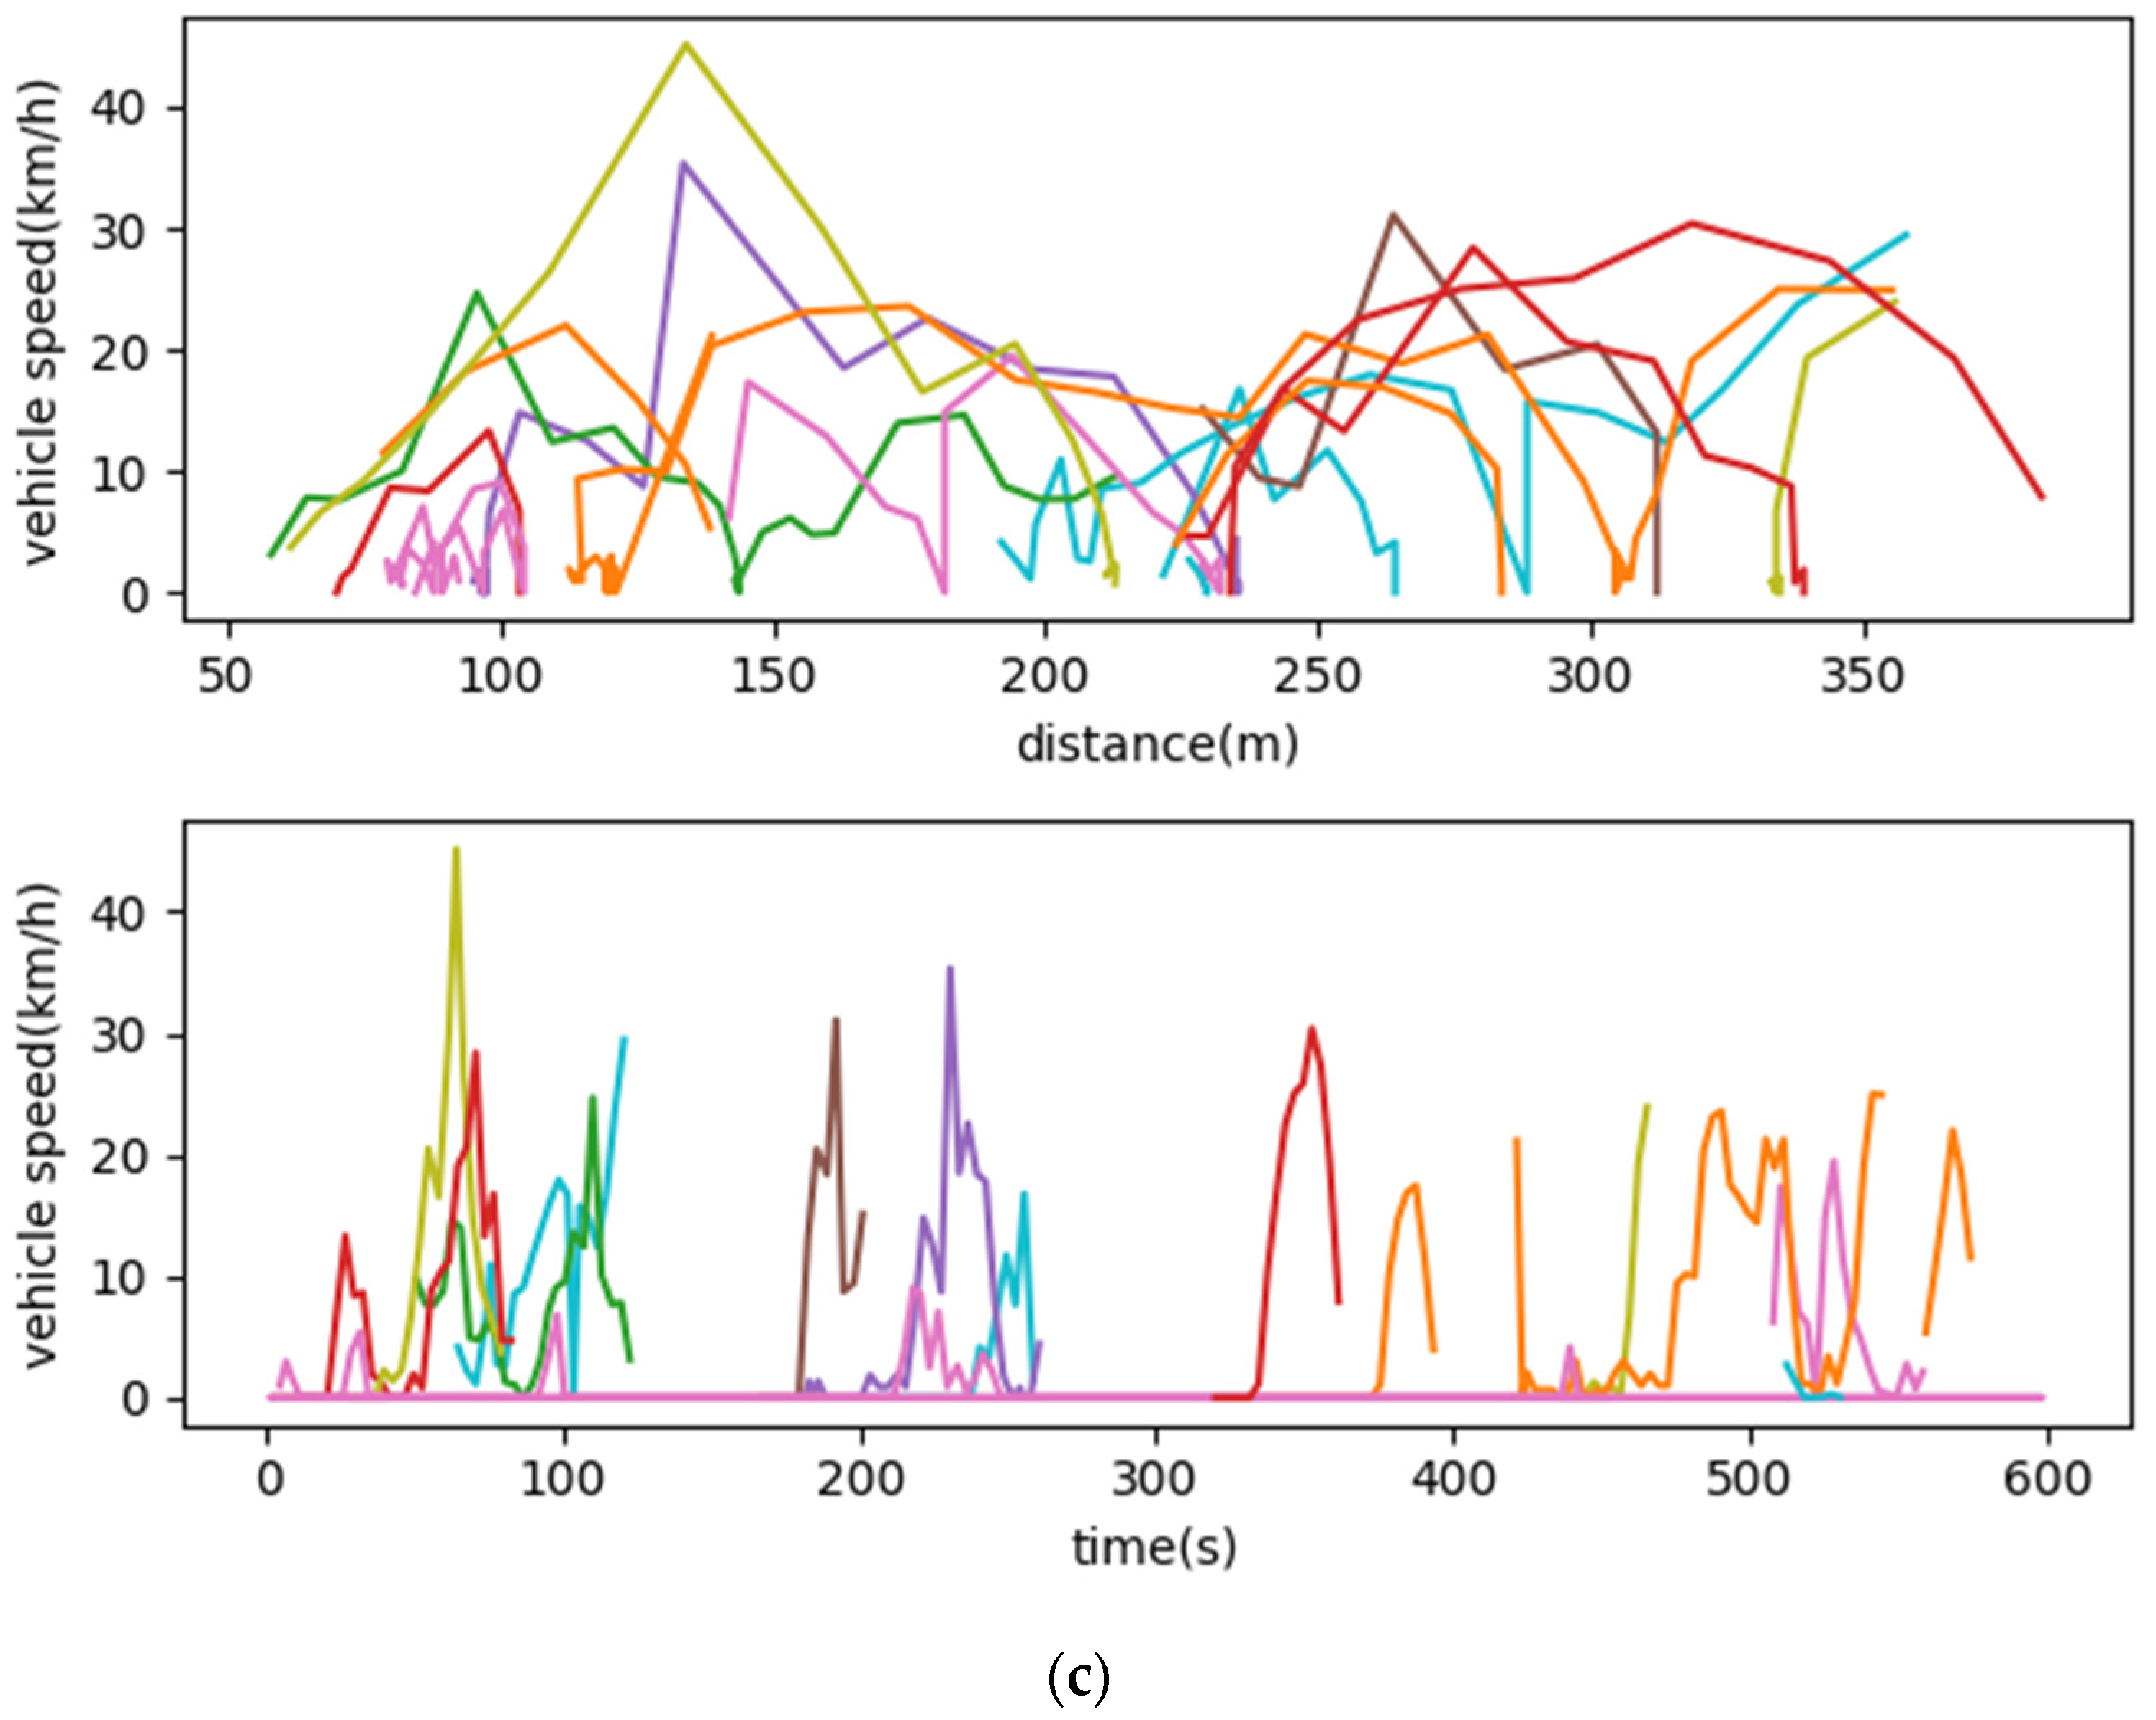
Furthermore, different intersection traffic lights affect the different average range and average time, and the different number of passed vehicles, as shown in Figure 6. From Figure 6a, we can see that the impact time and range of the high volume intersection are unstable and easily change, which means that the state of the intersection is highly influenced by the traffic flow. The number of times the vehicles waiting for the traffic light, as well as the length of the waiting queue, varies at different periods. For the low volume intersection in Figure 6c, it has an almost fixed-size of impact time and range, and the passing vehicles basically wait for only one signal cycle duration to pass. Specifically, compared to the other two types of intersections at busy main road intersections, the impact range of traffic lights on vehicles is the largest, and the impact time is the longest, due to the traffic flow and traffic light settings. From the individual speed-time graphs, it can be seen that the traffic light impact time is consistent with the time cycle of red light, showing cyclic regularity.
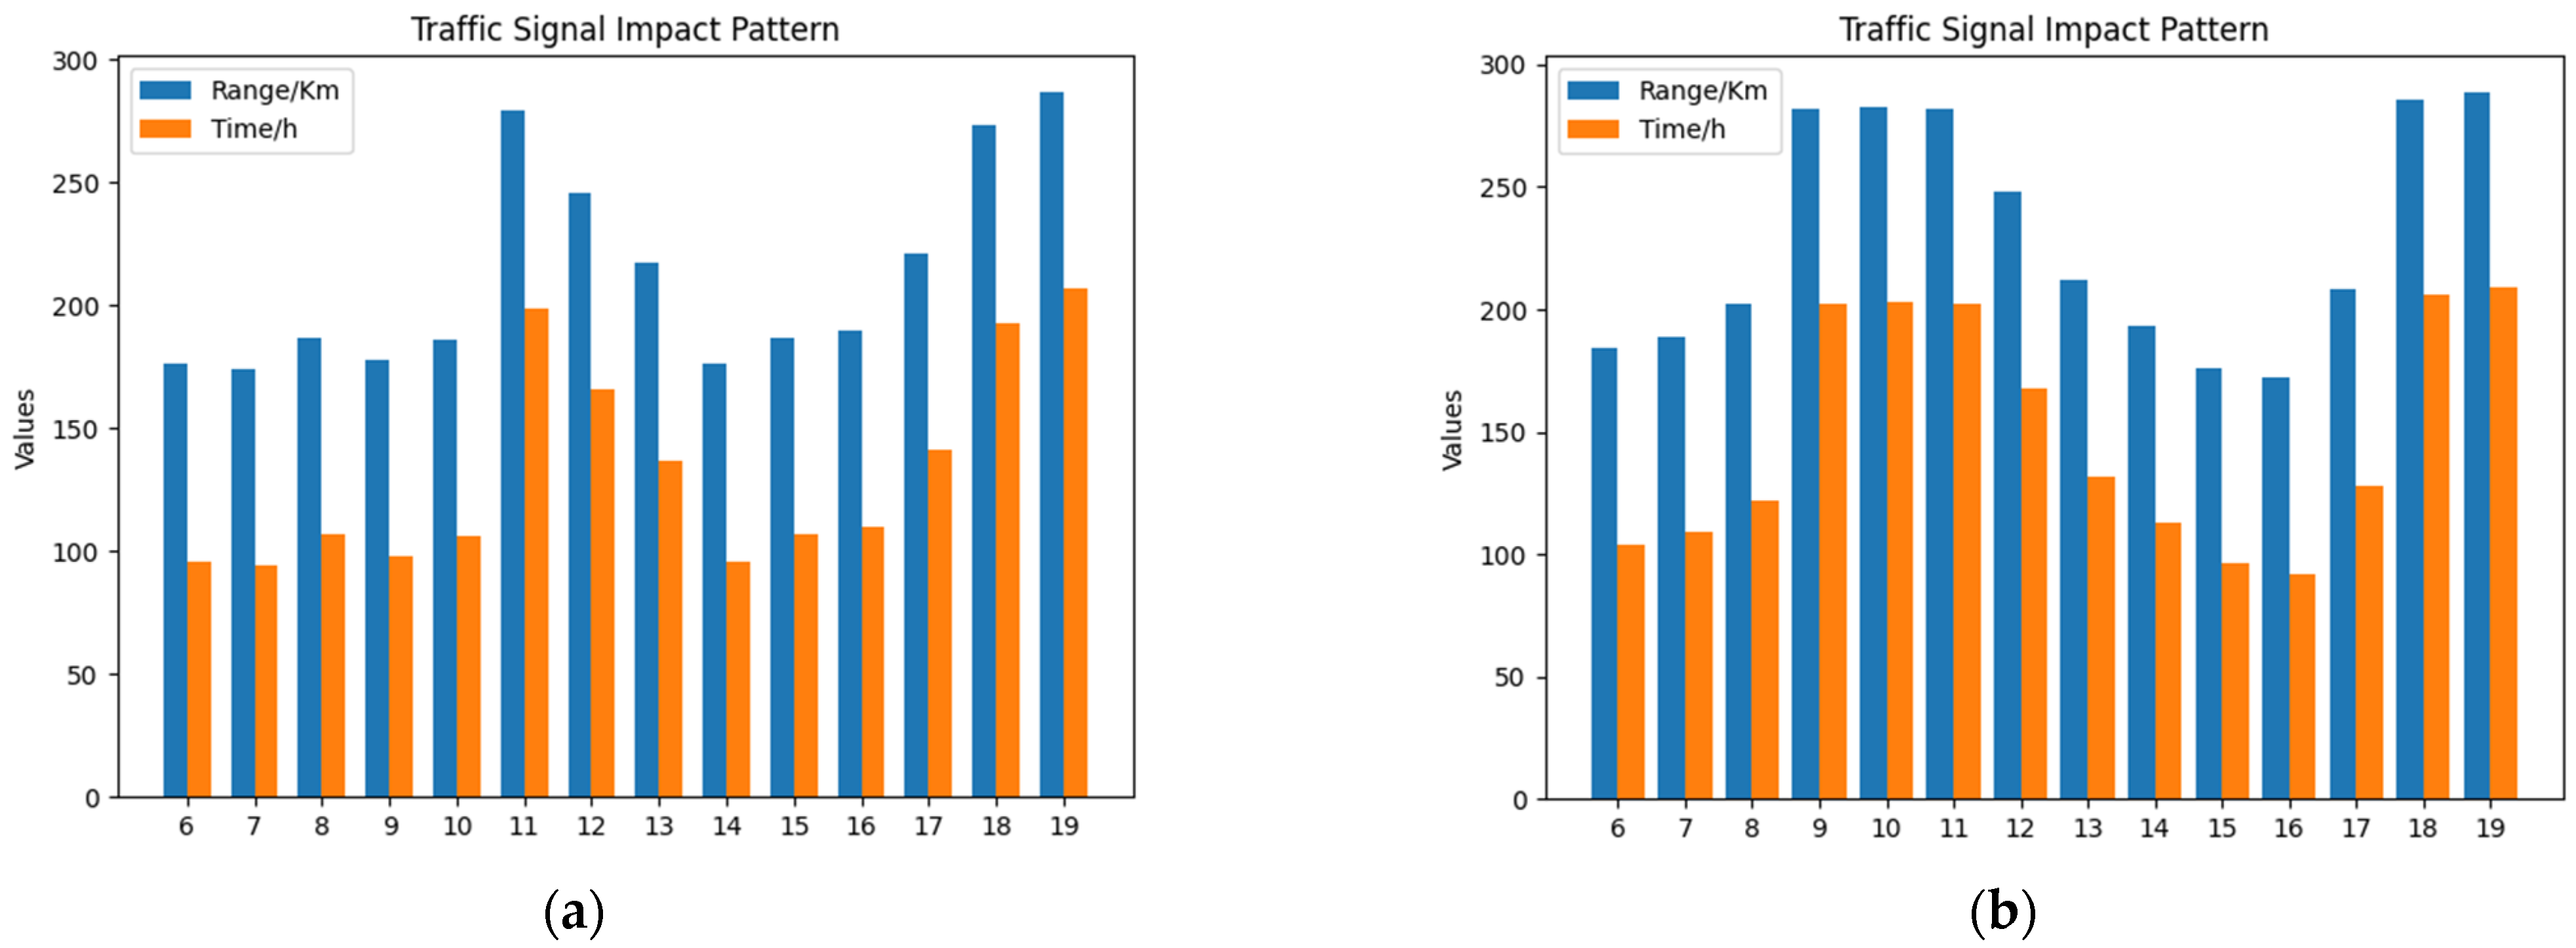
During the weekday and non-workday periods, the overall traffic light impact pattern varies with the travel cycle shown in Figure 7. Specifically, during the weekday period, the traffic light impact range and impact time reach higher values as the morning, afternoon, and evening peaks occur one after another, in addition to the time when the traffic flow is low and the traffic light impact pattern is a fixed range of red light duration and visible distance. Similarly, during non-working days, the traffic light impact range and impact time reach higher values in the midday and evening as the recreational peak occurs.
One obvious conclusion can be drawn that the traffic light influence pattern is closely related to the travel of urban residents; when there are fewer vehicles on the road, the traffic lights are stable and periodically control the traffic. However, the control role of traffic lights is greatly reduced during peak travel periods, so we often see traffic police directing vehicles to pass during peak travel periods.
5. Conclusions
In this paper, we have proposed a traffic light detection and impact assessing framework, which has two merits. First, it can estimate the influence range of traffic lights, and further distinguish the types of traffic lights, so as to have a more detailed classification of traffic lights, instead of simply detecting the presence or absence. Secondly, the DLSTM network in our framework can handle discrete and sequence features separately, and directly extract the timing information of the trajectory itself to improve the accuracy of detection, without the need for cumbersome extraction of trajectory derived attributes. Furthermore, in line with the intersection type and intersection traffic mentioned in the traffic light settings standard, the framework mainly extracts the most related intersection features, but indiscriminately has made use of all data about intersections. Therefore, the framework improves the accuracy of traffic light impact patterns based on trajectory data and eliminates redundant data. From the experimental results, the multi-input network DLSTM shows the advantages of combining different types of data to learn, and the AUC value under the ROC curve to be 0.95, which is demonstrated to have the best classification performance.
However, the analysis and extraction of dynamic characteristics of intersections are not comprehensive, such as collecting important traffic accident information. In the future, we will consider the influence of dynamic events on traffic lights. We also plan to collect more accurate track data, more relevant data, and be able to more adaptively regulate traffic lights for improving the travel efficiency of traffic participants in busy urban areas.
Author Contributions
Methodology, Zhuhua Liao; project administration, Zhuhua Liao; validation, Hao Xiao; visualization, Silin Liu; writing—original draft, Hao Xiao and Zhuhua Liao; writing—review and editing, Yizhi Liu and Aiping Yi. All authors have read and agreed to the published version of the manuscript.
Funding
This research was funded by the Natural Science Foundation of Hunan Province (No. 2021JJ30276), National Natural Science Foundation of China (No. 41871320) and the Scientific Research Fund of Hunan Provincial Education Department (No. 19C0755).
Data Availability Statement
The vehicle trajectory datasets used in traffic lights analysis are available only after the approval of the company audit is obtained. The data can be found here: https://outreach.didichuxing.com/research/opendata/, accessed on 21 March 2021.
Conflicts of Interest
The authors declare no conflict of interest.
References
- Zhao, Y.; Zhang, Y.; Yu, T.; Liu, T.; Wang, X.; Tian, X.; Liu, X. CityDrive: A map-generating and speed-optimizing driving system. In Proceedings of the IEEE INFOCOM 2014-IEEE Conference on Computer Communications, Toronto, ON, Canada, 27 April–2 May 2014; IEEE: Piscataway, NJ, USA, 2014; pp. 1986–1994. [Google Scholar]
- Yang, S.; Yang, B.; Kang, Z.; Deng, L. IHG-MA: Inductive heterogeneous graph multi-agent reinforcement learning for multi-intersection traffic signal control. Neural Netw. 2021, 139, 265–277. [Google Scholar] [CrossRef] [PubMed]
- Haklay, M.; Weber, P. Openstreetmap: User-generated street maps. IEEE Pervasive Comput. 2008, 7, 12–18. [Google Scholar] [CrossRef] [Green Version]
- Hu, S.; Su, L.; Liu, H.; Wang, H.; Abdelzaher, T.F. Smartroad: Smartphone-based crowd sensing for traffic regulator detection and identification. ACM Trans. Sens. Netw. (TOSN) 2015, 11, 1–27. [Google Scholar] [CrossRef]
- State Administration for Market Regulation. Specification for Setting and Installation of Road Traffic Signal Lights. 2016. Available online: http://openstd.samr.gov.cn/bzgk/gb/ (accessed on 3 April 2021).
- Apple, J.; Chang, P.; Clauson, A.; Dixon, H.; Fakhoury, H.; Ginsberg, M.; Keenan, E.; Leighton, A.; Scavezze, K.; Smith, B. Green Driver: AI in a Microcosm. In Proceedings of the Twenty-Fifth AAAI Conference on Artificial Intelligence, AAAI 2011, San Francisco, CA, USA, 7–11 August 2011. [Google Scholar]
- Qiu, H.; Chen, J.; Jain, S.; Jiang, Y.; McCartney, M.; Kar, G.; Bai, F.; Grimm, D.K.; Gruteser, M.; Govindan, R. Towards robust vehicular context sensing. IEEE Trans. Veh. Technol. 2017, 67, 1909–1922. [Google Scholar] [CrossRef]
- Méneroux, Y.; Le Guilcher, A.; Saint Pierre, G.; Hamed, M.G.; Mustière, S.; Orfila, O. Traffic signal detection from in-vehicle GPS speed profiles using functional data analysis and machine learning. Int. J. Data Sci. Anal. 2019, 10, 101–119. [Google Scholar] [CrossRef] [Green Version]
- Pribe, C.A.; Rogers, S.O. Learning to associate observed driver behavior with traffic controls. Transp. Res. Rec. 1999, 1679, 95–100. [Google Scholar] [CrossRef] [Green Version]
- Golze, J.; Zourlidou, S.; Sester, M. Traffic Regulator Detection Using GPS Trajectories. KN-J. Cartogr. Geogr. Inf. 2020, 70, 95–105. [Google Scholar] [CrossRef]
- Freund, Y.; Schapire, R.E. A decision-theoretic generalization of on-line learning and an application to boosting. J. Comput. Syst. Sci. 1997, 55, 119–139. [Google Scholar] [CrossRef] [Green Version]
- Chawla, N.V.; Bowyer, K.W.; Hall, L.O.; Kegelmeyer, W.P. SMOTE: Synthetic minority over-sampling technique. J. Artif. Intell. Res. 2002, 16, 321–357. [Google Scholar] [CrossRef]
- He, H.; Bai, Y.; Garcia, E.A.; Li, S. ADASYN: Adaptive synthetic sampling approach for imbalanced learning. In Proceedings of the IEEE International Joint Conference on Neural Networks (IEEE World Congress on Computational Intelligence), Hong Kong, China, 1–8 June 2008; pp. 1322–1328. [Google Scholar]
- Cheng, H.; Zourlidou, S.; Sester, M. Traffic Control Recognition with Speed-Profiles: A Deep Learning Approach. ISPRS Int. J. Geo-Inf. 2020, 9, 652. [Google Scholar] [CrossRef]
- Saremi, F.; Abdelzaher, T. Combining map-based inference and crowd-sensing for detecting traffic regulators. In Proceedings of the 2015 IEEE 12th International Conference on Mobile ad Hoc and Sensor Systems, Dallas, TX, USA, 19–22 October 2015; IEEE: Piscataway, NJ, USA, 2015; pp. 145–153. [Google Scholar]
- OpenStreetMap. Available online: https://www.openstreetmap.org (accessed on 25 March 2021).
- Díaz-Álvarez, A.; Clavijo, M.; Jiménez, F.; Talavera, E.; Serradilla, F. Modelling the human lane-change execution behaviour through Multilayer Perceptrons and Convolutional Neural Networks. Transp. Res. Part F Traffic Psychol. Behav. 2018, 56, 134–148. [Google Scholar] [CrossRef]
Figure 1.
The framework of traffic light impact accessing.

Figure 2.
Trajectory-map matching: (a) original trajectory and (b) trajectory after match and process.
Figure 2.
Trajectory-map matching: (a) original trajectory and (b) trajectory after match and process.

Figure 3.
Different types of intersections: (a) the main road intersects the main road; (b) intersection of secondary arterial road and main arterial road; and (c) intersection of secondary trunk road and secondary trunk road.
Figure 3.
Different types of intersections: (a) the main road intersects the main road; (b) intersection of secondary arterial road and main arterial road; and (c) intersection of secondary trunk road and secondary trunk road.

Figure 4.
Core multi-input model of DLSTM.

Figure 5.
The ROC curves of various classification methods.

Figure 6.
The impact range and time of traffic light at different intersections: (a) the impact result of traffic light at type 1 intersection; (b) the impact result of traffic light at type 2 intersection; and (c) the impact result of traffic light at type 3 intersection.
Figure 6.
The impact range and time of traffic light at different intersections: (a) the impact result of traffic light at type 1 intersection; (b) the impact result of traffic light at type 2 intersection; and (c) the impact result of traffic light at type 3 intersection.


Figure 7.
The impact range and time of traffic lights at different dates: (a) weekdays (form 6 a.m. to 7 p.m.) and (b) holidays and weekends (from 6 a.m. to 7 p.m.).
Figure 7.
The impact range and time of traffic lights at different dates: (a) weekdays (form 6 a.m. to 7 p.m.) and (b) holidays and weekends (from 6 a.m. to 7 p.m.).


Table 1.
Typical intersection data example.
| Index | Rtype | NM | NS | Q | VT | TL |
|---|---|---|---|---|---|---|
| 1 | 1 | 2 | 0 | 300 | {tr1, tr2, tr3} | 1 |
| 2 | 2 | 1 | 1 | 100 | {tr5, tr6} | 1 |
| 3 | 3 | 0 | 2 | 20 | {tr7} | 0 |
Publisher’s Note: MDPI stays neutral with regard to jurisdictional claims in published maps and institutional affiliations. |
© 2021 by the authors. Licensee MDPI, Basel, Switzerland. This article is an open access article distributed under the terms and conditions of the Creative Commons Attribution (CC BY) license (https://creativecommons.org/licenses/by/4.0/).
Share and Cite
MDPI and ACS Style
Liao, Z.; Xiao, H.; Liu, S.; Liu, Y.; Yi, A. Impact Assessing of Traffic Lights via GPS Vehicle Trajectories. ISPRS Int. J. Geo-Inf. 2021, 10, 769. https://0-doi-org.brum.beds.ac.uk/10.3390/ijgi10110769
AMA Style
Liao Z, Xiao H, Liu S, Liu Y, Yi A. Impact Assessing of Traffic Lights via GPS Vehicle Trajectories. ISPRS International Journal of Geo-Information. 2021; 10(11):769. https://0-doi-org.brum.beds.ac.uk/10.3390/ijgi10110769
Chicago/Turabian StyleLiao, Zhuhua, Hao Xiao, Silin Liu, Yizhi Liu, and Aiping Yi. 2021. "Impact Assessing of Traffic Lights via GPS Vehicle Trajectories" ISPRS International Journal of Geo-Information 10, no. 11: 769. https://0-doi-org.brum.beds.ac.uk/10.3390/ijgi10110769
Note that from the first issue of 2016, this journal uses article numbers instead of page numbers. See further details here.