Article

The Dynamic Influence of High-Speed Rail on the Spatial Structure of Economic Networks and the Underlying Mechanisms in Northeastern China

1
School of Public Administration, Zhongnan University of Economics and Law, Wuhan 430073, China
2
School of Intelligent Manufacturing, Jianghan University, Wuhan 430056, China
3
Key Laboratory of Watershed Geographic Sciences, Nanjing Institute of Geography and Limnology, Chinese Academy of Sciences, Nanjing 210008, China
4
Department of Planning and Environmental Management, University of Manchester, Manchester M13 9PL, UK
*
Author to whom correspondence should be addressed.
ISPRS Int. J. Geo-Inf. 2021, 10(11), 776; https://0-doi-org.brum.beds.ac.uk/10.3390/ijgi10110776
Submission received: 8 October 2021 / Revised: 30 October 2021 / Accepted: 6 November 2021 / Published: 15 November 2021

Abstract

:
Drawing on 185 cities in the northeastern region of China, this paper improves the radiation model by incorporating the accessibility index to characterize the asymmetric process of economic linkages before HSR in 2007 and after HSR in 2016. Then social network analysis is utilized to examine the impact of HSR on the spatial structure of economic networks, including nodal centrality and community structures. Finally, spatial econometric models are employed to explore the driving factors of nodal centrality in economic networks and some policy implications are proposed. The major findings of this paper are the following. First, HSR services can weaken the core-peripheral inequality of economic linkages and a corridor economy is evident in northeastern China. Second, HSR services have significantly improved the out-degree centrality of prefecture-level cities but have slightly decreased the in-degree centrality of Liaoning. Third, there was a slight decline of coherence in the economic network after the construction of HSR and the within-modular connections were strengthened by HSR. Four, the spatial error model (SEM) is more desirable for explaining the distribution of in-degree centrality. GDP, fixed asset investment, education, population, and fiscal expenditure are important contributors to the in-degree centrality in economic networks. These findings give significant insights into city system planning, integrated transport and land use development, formulating regional poles and the coordinated development across administrative boundaries in northeastern China.

1. Introduction

The operation of high-speed rail (HSR) marks the entry of a new modern era of railway transportation. With the advantages of high speed, large capacity, low energy consumption, comfort and safety, HSR has leapt to the dominant position of the transportation system [1]. Presently two-thirds of the world’s HSR is in China and the high-speed railway network is still expanding with a total length of 29,000 km at the end of 2018 [2]. China aims to build 38,000 km of high-speed railways by 2025 and wants to link all provincial capitals and cities with a population of more than 500,000 [3]. HSR services have shortened the space-time distances between cities, and changed regional accessibility and connectivity in urban space, thus achieving shifting patterns in the national economy [4,5,6]. Further studies are required to examine how the dramatic space-time compression of HSR reshapes the linkages between cities and changes the network centrality by applying the network model of intercity relations.
The existing literature has widely studied the influence of HSR on urban dynamics in terms of transport accessibility, economic productivity and regional inequality. Through examining geographic effects of high-speed rail in East Asia, Jin et al. [7] found that the current operating and planned HSR networks in Japan, South Korea, and China will bring substantial improvement in accessibility, but also enlarge the inequality of nodal accessibility between core cities and peripheral areas along HSR lines. According to Chandra and Vadali [8], the proposed America 2050 HSR plan is likely to cause positive changes in potential accessibility for counties with HSR stations and increase job attractiveness for all six industry sectors. Furthermore, HSR network can redistribute economic activities by encouraging labor mobility [9] and improve per capita productivity after controlling for the effects of regional contexts and other factor inputs such as labor, capital, and technology [10]. However, the issue of whether HSR development promotes regional integration or disparities has been disputed [11]. Jiao et al. [12] proved that the HSR network widens internal inequalities within the eastern, central, and western regions in mainland China. Wetwitoo and Kato [13] analyzed the potential benefits of the HSR service in Japan, such as agglomeration economies and network externalities, which facilitate the mitigation of regional inequality between major cities and peripheral cities in terms of economic productivity.
The accessibility impacts of HSR planning have been a central issue in transport geography and sustainable land use development. The direct impact of HSR services in travel time savings and empirical studies have demonstrated that HSR has obviously decreased inter-city, interregional travel times in Asian and European countries [10]. The timetable-based accessibility measure mainly considers the operating speed of HSR and fails to reflect conventional rail (CR) services, train schedules, and passenger profiles [14]. On the one hand, HSR services are designed to substitute CR services in the European context while mode substitution cannot be achieved in the China context because of the moderate speed improvement, service frequency, and affordable costs of CR services during rapid HSR development. Intercity rail accessibility should be effectively measured by the connection of the HSR network with CR. On the other hand, Geurs and van Wee [15] argued that an efficient accessibility model should incorporate the individual’s spatial–temporal constraints. The train service frequency, indicating waiting time at rail stops, is an important factor in determining the influence of HSR services on the complete journey of passengers [16], and cannot be neglected when evaluating rail accessibility from a user perspective.
Furthermore, HSR networks promote the reorganization of most dominant activities (e.g., financial flows, services, residential choices, and manufacturing) in an open economy [17,18] and then produce the associated agglomeration effects in the form of increasing market integration [19]. Through improving market access and enhancing spatial clustering by HSR, firms and workers in nearby second- and third-tier cities can benefit from the consumption amenities in megacities while avoiding the high real estate cost and the low life quality in an enormous city [19]. Zhang et al. [20] argued that HSR construction facilitates the cultivation of new hub cities and stimulates spatial structure of an urban agglomeration to its optimal status. Due to the core-peripheral structure and the corridor effect of regional accessibility, industrial activities and employment opportunities are mainly concentrated along the HSR corridor in the Appalachian region of the U.S. [8,21]. HSR extensions may contribute to increased spatial imbalance and lead to a more polarized pattern of spatial development in urban and regional systems [6,22]. Further study is required of how HSR networks configure a different spatial form and process in the information age.
HSR networks not only transform regional accessibility by dramatically shrinking time and space [23], but also shift patterns of network centrality and reshape spatial structures in regional urban systems [24,25]. However, only a few studies have focused on the impacts of HSR on connectivity and spatial structure of the economic network. Based on the empirical analysis of Li and Cai [26], China Railway Network (CRN) displays scale-free distribution and relatively stable spatiotemporal structures. Jiao et al. [27] examined the impacts of HSR on the typological properties of city networks from 2003 to 2014 and confirmed the positive changes of HSR in improving connectivity and enhancing location advantage of cities. However, their studies failed to consider the geographic location of cities and measure spatial interactions between cities. Thus the network-based characteristics of HSR and spatial regimes of the city network need to be further explored. The conventional gravity model is the popular technique to characterize spatial interactions and has been widely applied in previous studies. However, because of the many limitations of the gravity model, such as parameter settings and symmetric interactions, Simini et al. [28] proposed the radiation model according to the process of dispersion and absorption of matter movement in solid state physics. Therefore, this study improves on the radiation model by using the accessibility index to characterize the asymmetric process of economic networks.
Railway networks are complex systems made up of nodes, hubs, spatial organization, and scalability [17]. Graph theory techniques have been widely applied to characterize the non-trivial topological features and network-based interactions. Social network analysis (SNA) is further developed to detect the structure of the networks, including network metrics (e.g., centrality, transitivity, and social similarity) and the communities or clusters on a graph [29], and has been widely utilized to study real world phenomena such as tourism, social capital formation, and crime [30,31,32]. Some of the literature has investigated the evolving process of transport networks and evaluated their network characteristics using various complex network measures [33,34]. These network-based measures are useful to explore the typological properties of transport networks, but fail to detect spatial clusters and the hierarchical structure of communities by taking into account rail accessibility. This paper aims to comprehensively examine the structural centrality of HSR networks by adopting the technique of SNA and examine the underlying mechanisms by using spatial econometric models.
Note, regional contextual variations should be taken into account when analyzing the impacts of HSR in a given territory [35]. Most studies have not adequately interpreted the context of HSR planning and regional policies and present studies in the China context are limited in metropolitan regions such as the Yangtze River Delta (YRD) and Beijing–Tianjin–Hebei region [20,36]. The northeastern region of China, as the former heavy industrial base, has seen a relative decline in its economy. In 2004 the central government proposed a strategy of “Revive the Northeast”, aiming to bring the northeast rust belt back to life. Northeastern China formed the earliest intercity CR network connecting major cities and industrial and mining centers in the region. HSR construction in three northeastern provinces is based on dense-distributed and high-capacity CR networks, and includes measures such as electrification projects to improve the operating speed on existing CR lines instead of building brand-new HSR lines. In the European context, the LARG (lean, agile, resilient, and green) paradigm in transport systems and railway infrastructures is applied when designing a new HSR line [37]. Therefore, it is significant to examine how the integration of HSR into CR networks improves regional accessibility and reshapes spatial structures of regional economies in this typical context of northeastern China.
This paper contributes to the literature and policy debates as follows: (1) Differing from the traditional gravity model, the radiation model and the accessibility index are integrated to examine the asymmetric process of economic linkages by considering the economic radiation capacity of the source and destination cities. (2) The nodal centrality of economic networks, including in-degree and out-degree centrality and the community structure, are important components when comprehensively examining the influence of HSR on spatial structure, which give significant insights into the spatial optimization of transport development. (3) Spatial econometric models are useful to detect the presence of spatial dependence in economic networks and can better examine the mechanisms of nodal centrality. (4) Some policy changes are proposed to revive northeastern China and promote integrated economic development.
The remaining sections are structured as follows: Section 2 describes the study area, data description and work flow as well as methodology; Section 3 analyzes the evolving pattern of economic linkages before and after HSR, examines the influence of HSR on nodal centrality and community structure, and then investigates the underlying mechanisms; Section 4 and Section 5 discuss the main findings and put forward some policy implications for integrated transport and land use planning.

2. Materials and Methods
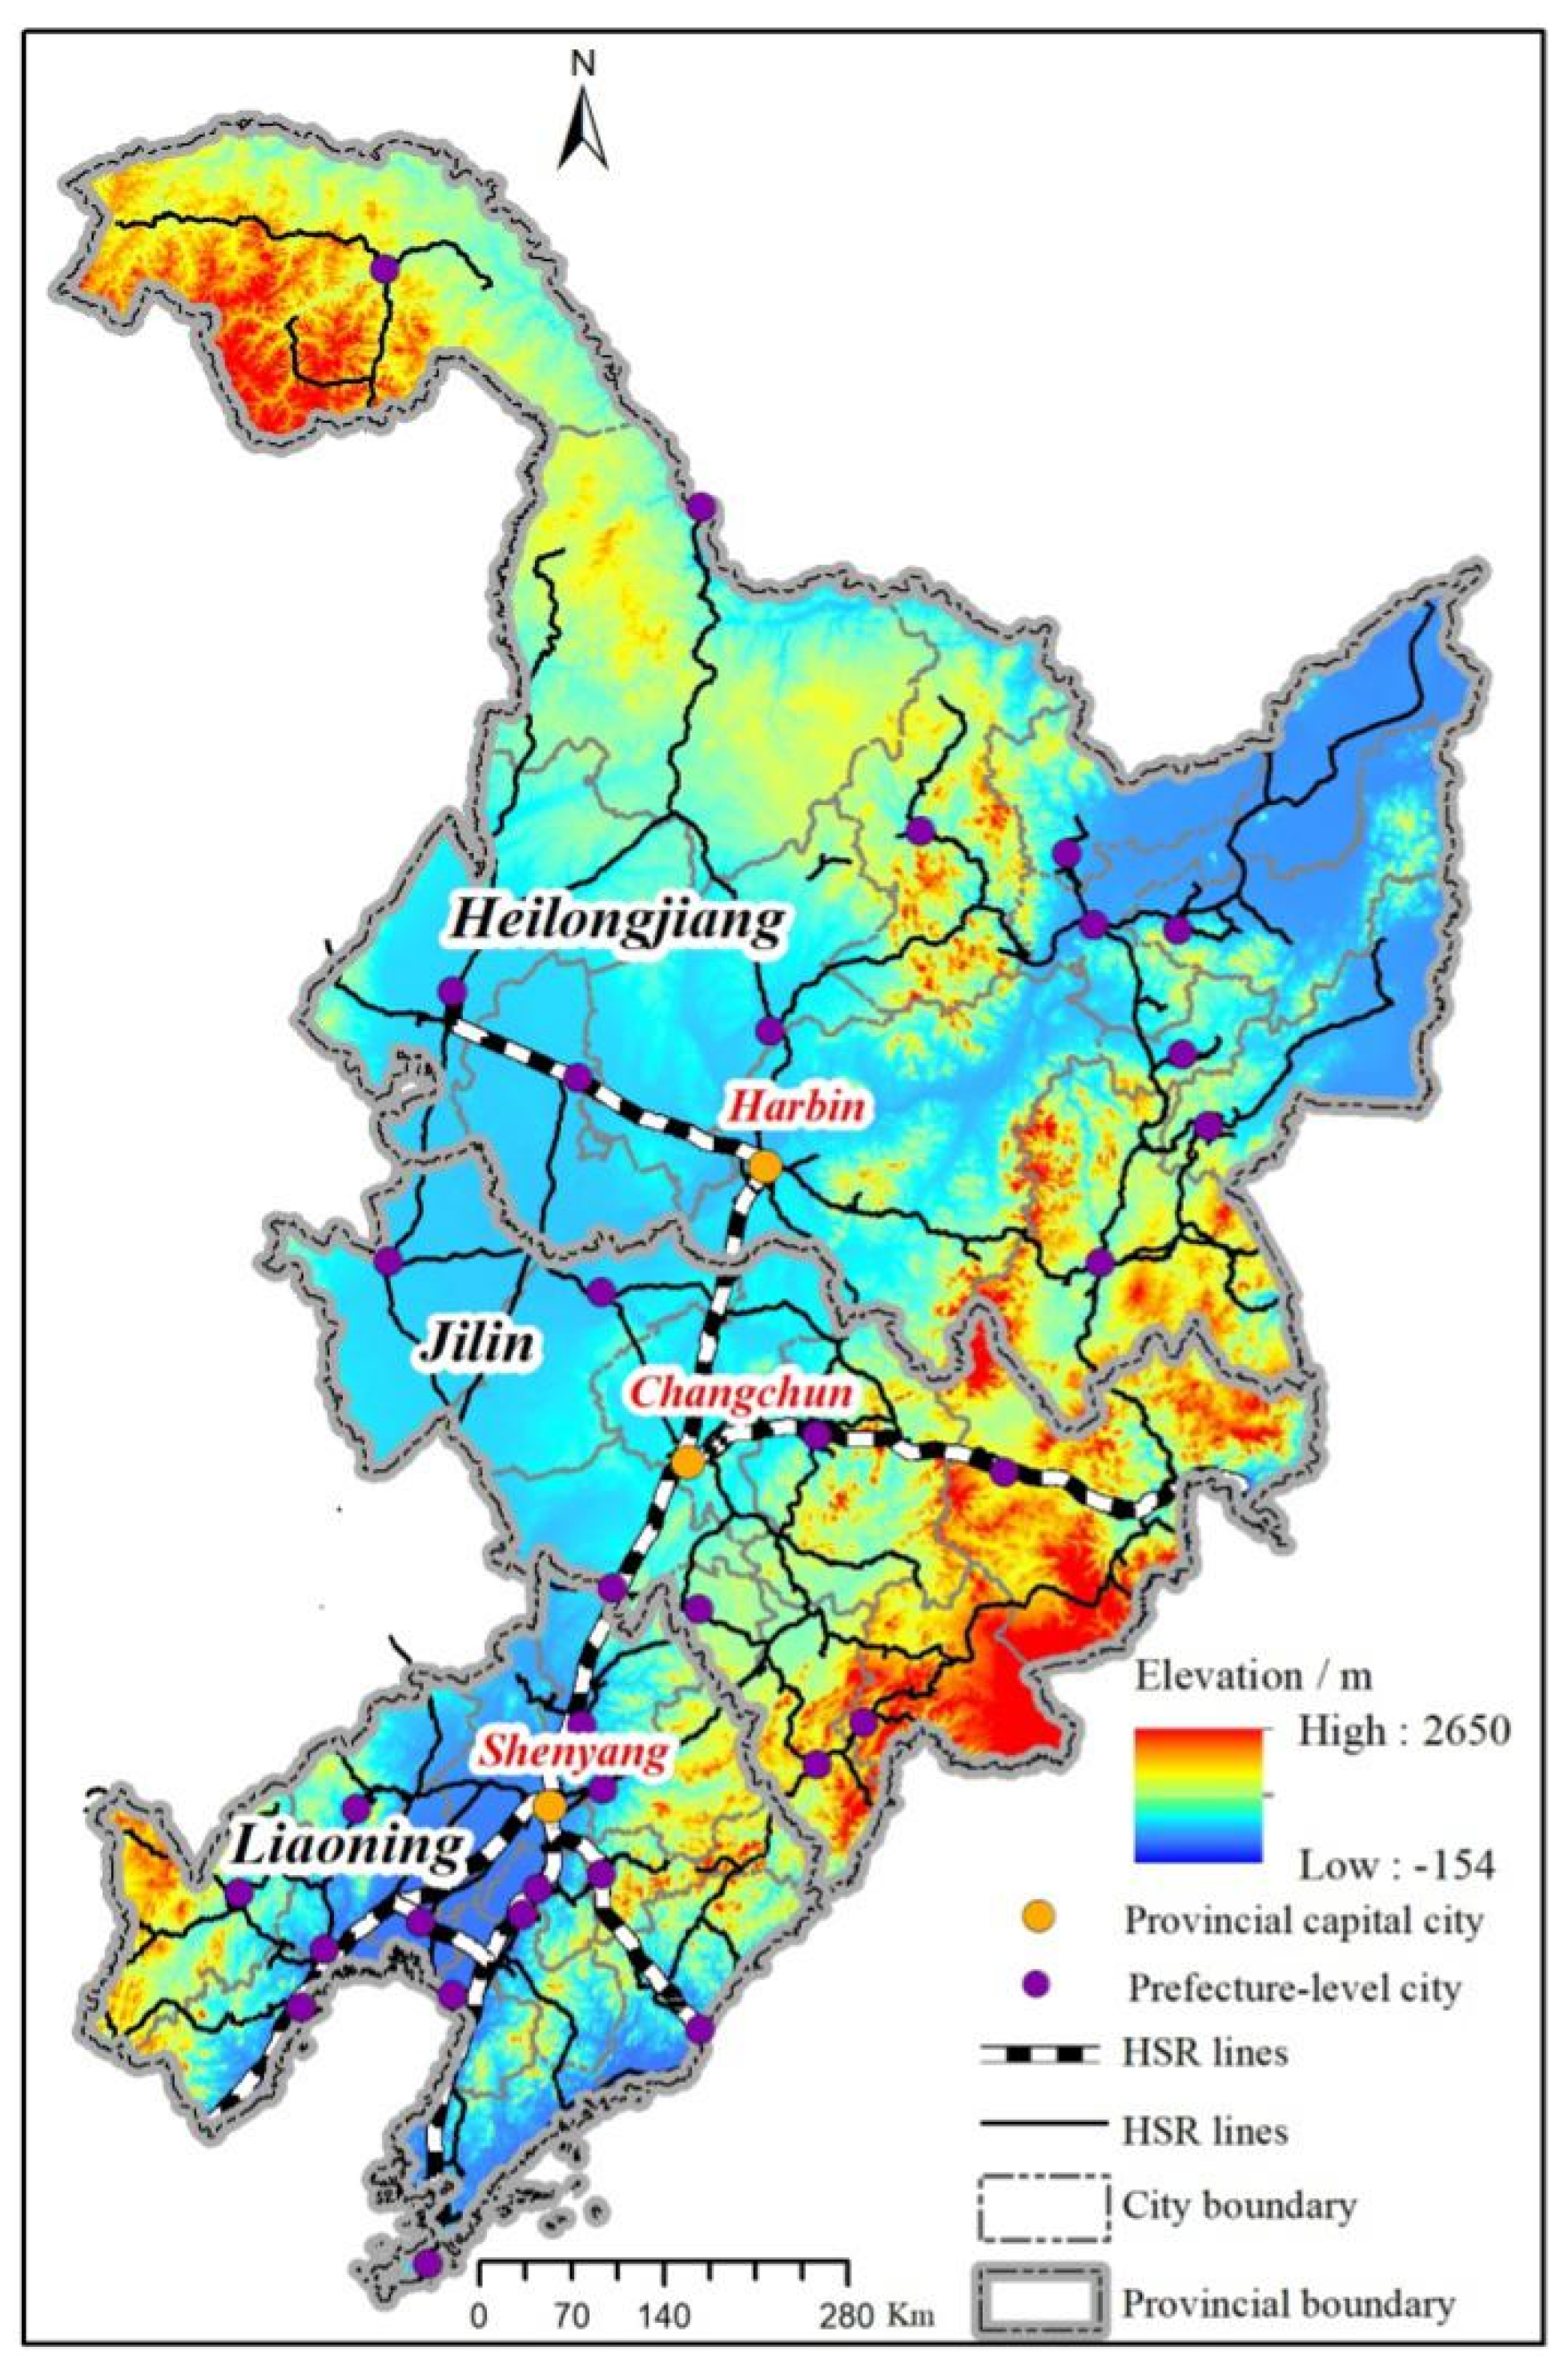
2.1. The Study Area

The northeastern provinces as seen in Figure 1 in China are adjacent to Russia, North Korea, and Japan in northeast Asia. In 2017 the northeastern region had a population of 108.75 million and a GDP (gross domestic product) of RMB 5426 billion, respectively accounting for 7.82% and 6.40% of the Chinese totals. However, the northeastern region, known as the rust belt, is facing the issues of population loss and economic recession although it has well developed its transport infrastructure system, especially the CR network, since the 1900s. Electrification of the railroad started in 1994 and a total of RMB 15 billion was invested to improve the operating speed and reduce air pollution in the railway system. The Harbin–Dalian railway was the first electric high-speed railway with a length of 921 km, connecting 25 major cities in three northeastern provinces by the end of 2012. The rapid expansion of HSR networks in the northeastern region has promoted regional cooperation between China and northeast Asian countries, stimulating the regional economy and speeding up the reforms of state-led enterprises.
At the end of 2017, railway operation mileage in northeastern China reached 24,164 km with 2373 km of HSR. Railway passenger traffic numbers reached 346 million persons in Heilongjiang, 329 million persons in Jilin, and 725 million persons in Liaoning. The northeastern region includes 36 prefecture-level cities and 185 small cities while the CR services covered 121 cities in 2007 and 129 cities in 2016 with 44 cities owning HSR services. How these upgraded and newly-built HSR networks helped to transform accessibility and shape the space economy require further attention to realize the strategy of “Revive the Northeast”.

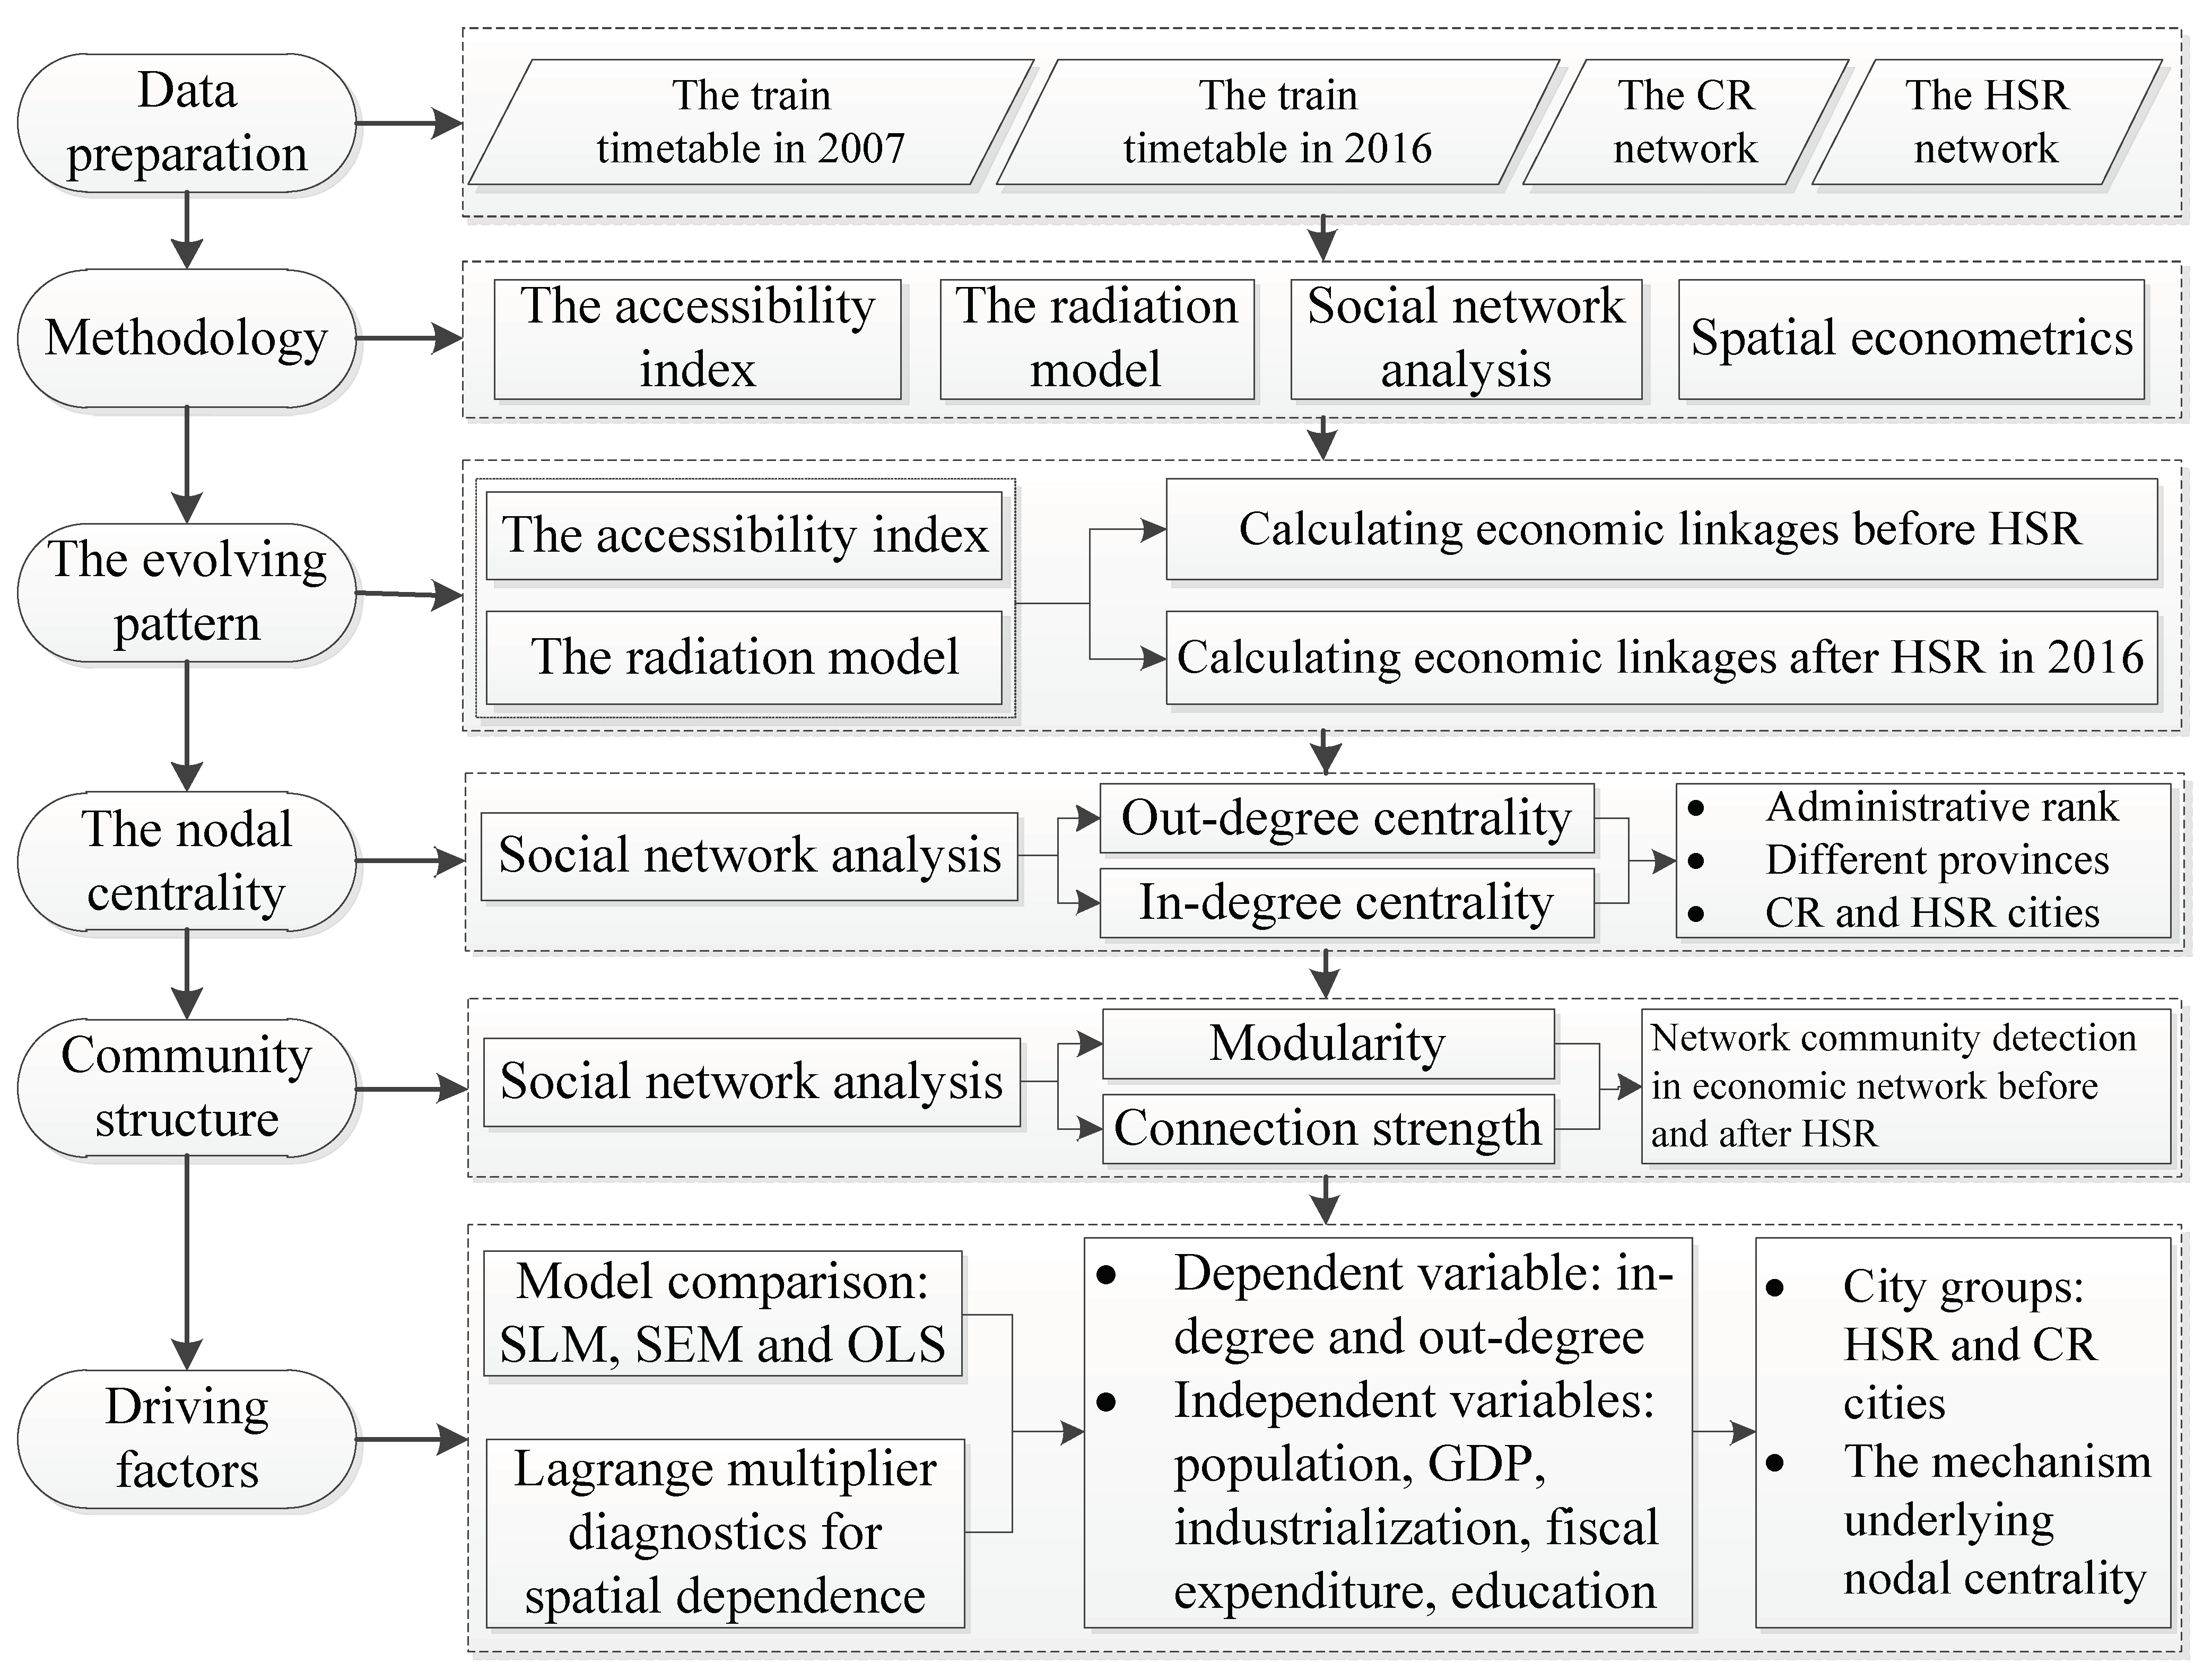
2.2. Data Description and Work Flow of the Study

Train timetables were used to calculate door-to-door intercity rail accessibility and related information such as travel distance, departure times, arrival times, train fares, and stop times at each station [38], obtained from a public website (https://www.12306.cn/index/, accessed on 5 November 2021). The geographic locations of train routes were derived from Baidu Maps. In order to examine the dual impacts of CR and HSR networks, train timetables before and after the HSR era (the years of 2007 and 2016) were compared to calculate the changes of rail accessibility and the network-based structure. The first train timetable in 2007 refers to the schedules of CR trains having no HSR trains, and the average operating speed at that time reached 70 km/h after six rounds of China Railway Speed Up Campaigns. In 2016, 72.4% of county-level/prefecture-level cities had CR or HSR stations with a total number of 44 HSR stations. The second train timetable in 2016 refers to the schedules of both CR and HSR trains. At that time, CR trains operated at a speed below 120 km/h while the operating speed of HSR had two ranges: 200–250 km/h and 300–350 km/h.
The railway network construction was done as described below: (1) The geographic centers of each city were extracted as the nodes and the size of the railway network was 185 nodes, which is larger than those in previous studies at regional scales. If there were any train services travelling from city i to city j, then an ‘edge’ was added. (2) In order to compare the effects of HSR on city system structure, this paper constructed two railway networks, namely the CR network in 2007 and the CR and HSR networks in 2016. The weight of each edge was determined by the rail accessibility between each pair of cities as shown in the methodology section. The weighted network could be turned into an unweighted binary network by setting the average value of rail accessibility in the network as the threshold. (3) The technique of network analysis was applied to construct the origin-destination matrix of rail accessibility using ArcGIS desktop 10.7.
Figure 2 describes the work flow of this study. Based on the railway networks of CR and HSR, the train timetables, train service frequency, and socioeconomic statistical data in northeastern China, this paper mainly employed advanced techniques such as the accessibility index, the radiation model, social network analysis, and spatial regressions to explore the impact of HSR on the spatial structure of economic networks and the underlying mechanisms.

2.3. Methodology

2.3.1. The Accessibility Index Considering Train Service Frequency

An efficient accessibility indicator should incorporate passengers’ spatial-temporal constraints. Train service frequency, which can effectively reflect waiting time at rail stops, was used to construct the accessibility index. This study calculates rail accessibility of each county-level unit for CR service networks in 2007 and HSR service networks in 2016, respectively, to examine the impact of HSR on the pattern of regional accessibility. First, we calculated the average travel time ( T i j ) of HSR or CR services between any two counties that had direct train services. Second, the accessibility index ( A I i j ) combined the average travel time and train service frequency n i j as shown in Equation (1) [16]. More frequent train services indicate less waiting time and can compensate for the travel time between cities. Here the train service frequency is utilized as a weight to the average travel time to calculate the accessibility indicator for each county-level unit.
A I i j = n i j 24 T i j
where A I i j represents the accessibility index from the source city i to the destination j ; a larger value of A I i j indicates higher accessibility between the origin and the destination or for the city unit i .

2.3.2. The Radiation Model to Assess Economic Linkages between Cities

Drawing on the process of dispersion and absorption of matter movement in solid state physics, the radiation model was first proposed by Simini et al. [28] to simulate the intensity of population migration, which was later verified by the actual data of logistics and information flow. Given its parameter-free nature, this model can be widely applied in most of the phenomena affected by mobility and transport processes. This model has the following features: first, it overcomes many limitations of the traditional gravity model, such as many parameter settings and lack of theoretical guidance. The radiation model transforms the traditional distance into a two-dimensional space surrounding the source location with the travel cost from the origin to the destination as the radius r i j . Second, the interaction between the origin and the destination is not symmetric, and considers not only the economy/population of the source and destination locations but also the total economy/population in the circle of the radius r i j . Third, in order to improve the predictive accuracy of the transport processes, this paper improves the radiation model by using the accessibility index considering train service frequency to determine the radius r i j . The equation is formulated as below:
C i j R = C i p i q j ( p i + h i j ) ( p i + q j + h i j )
C i = p i ( j A I i j / i j A I i j )
h i j = k i , j p k ( A I i k A I i j )
where C i j R is the economic linkage from the source city i to the destination city j ; p i , q j refer to gross domestic product per capita (PCGDP) in city i and city j ; h i j is the sum of PCGDP in city k with higher accessibility than A I i j surrounding the source location (excluding the source city and the destination city).

2.3.3. Social Network Analysis to Characterize Spatial Structure of Economic Networks

  • Network centrality. The degree centrality reflects the relative importance of the nodes’ role in network analysis. Degree centrality measures the number of nodes that are directly connected [39]. The economic linkage network as described in Section 2.3.2 is a directed network and there are two measures of degree, namely in-degree and out-degree. In-degree is the number of edges that point inward at a vertex while out-degree is the number of edges that point outward to other vertices.
  • Network community detection. Modular structure means the existence of strongly connected groups of nodes with relatively weak connections between groups [40]. The capacity to detect the nodes in network datasets in groups or communities has important practical implications in the real world. This paper utilized modularity Q to find good divisions of networks and divide networks into an optimal quantity of communities, defined as Q = 1 4 m i j ( A i j k i k j 2 m ) s i s j ( A i j is the number of edges between node i and j ; k i and k j are the degrees of node i and j ; m is the total number of edges in the network; s i is equal to 1 if node i belongs to group 1 and s i = 1 if it belongs to group 2). The method of optimal modularity developed by Newman [40] was applied to detect the community structure in networks because this algorithm is fast and accurate.

2.3.4. Spatial Regression Models to Examine the Driving Factors of Nodal Centrality in Economic Networks

It is commonly observed that sample data collected for regions in space are spatially dependent. Spatial regression models allow us to explain dependence between observations and are designed to incorporate dependence among samples in close geographical proximity. However, conventional regression models commonly used to analyze cross-section data assume the independence between observations. This paper compared spatial regression models and conventional regression models to derive the appropriate model for determining the driving factors of nodal centrality in economic networks. Two spatial regression models, namely a spatial lag model (SLM) and a spatial error model (SEM), were respectively examined in this study. The SLM model assumes the observed spatial dependence between neighboring samples while the SEM model justifies a spatial lag in the unobserved or latent error terms.
y = β 0 y 2007 + X β + ρ W y + ε
y = β 0 y 2007 + X β + ε
ε = λ W ε + τ
In Equation (5), representing SLM, and Equations (6) and (7), representing SEM, y is in-degree or out-degree in 2016 and y 2007 is in-degree or out-degree in 2007; ρ is the degree of spatial dependence; W is the spatial contiguity matrix; ε is the error term; λ denotes the degree to which spatial autocorrelation is introduced in the error term.
In order to examine the mechanisms underlying nodal centrality, three regression models, ordinary least squares (OLS), SLM, and SEM, were compared to derive how social, economic, fiscal, educational, and spatial factors affect nodal centrality across cities. Lagrange multiplier (LM) tests and robust LM tests for lags and errors were used to investigate whether spatial autocorrelation was present. If the tests for spatial dependence in lags or errors were statistically significant, a larger value from the tests implied a more appropriate model (SLM or SEM). Otherwise, OLS was more appropriate. To detect the differences of driving mechanisms between HSR cities and CR cities, we divided the whole samples into two groups according to whether there was a HSR station or not. Descriptive statistics of all exploratory variables are shown in Table 1. In-degree in 2007, being a HSR city or not, the level of economic development, population, public fiscal expenditure, fixed asset investment, industrialization, and education were hypothesized to be important predictors for nodal centrality of all cities.

3. Results

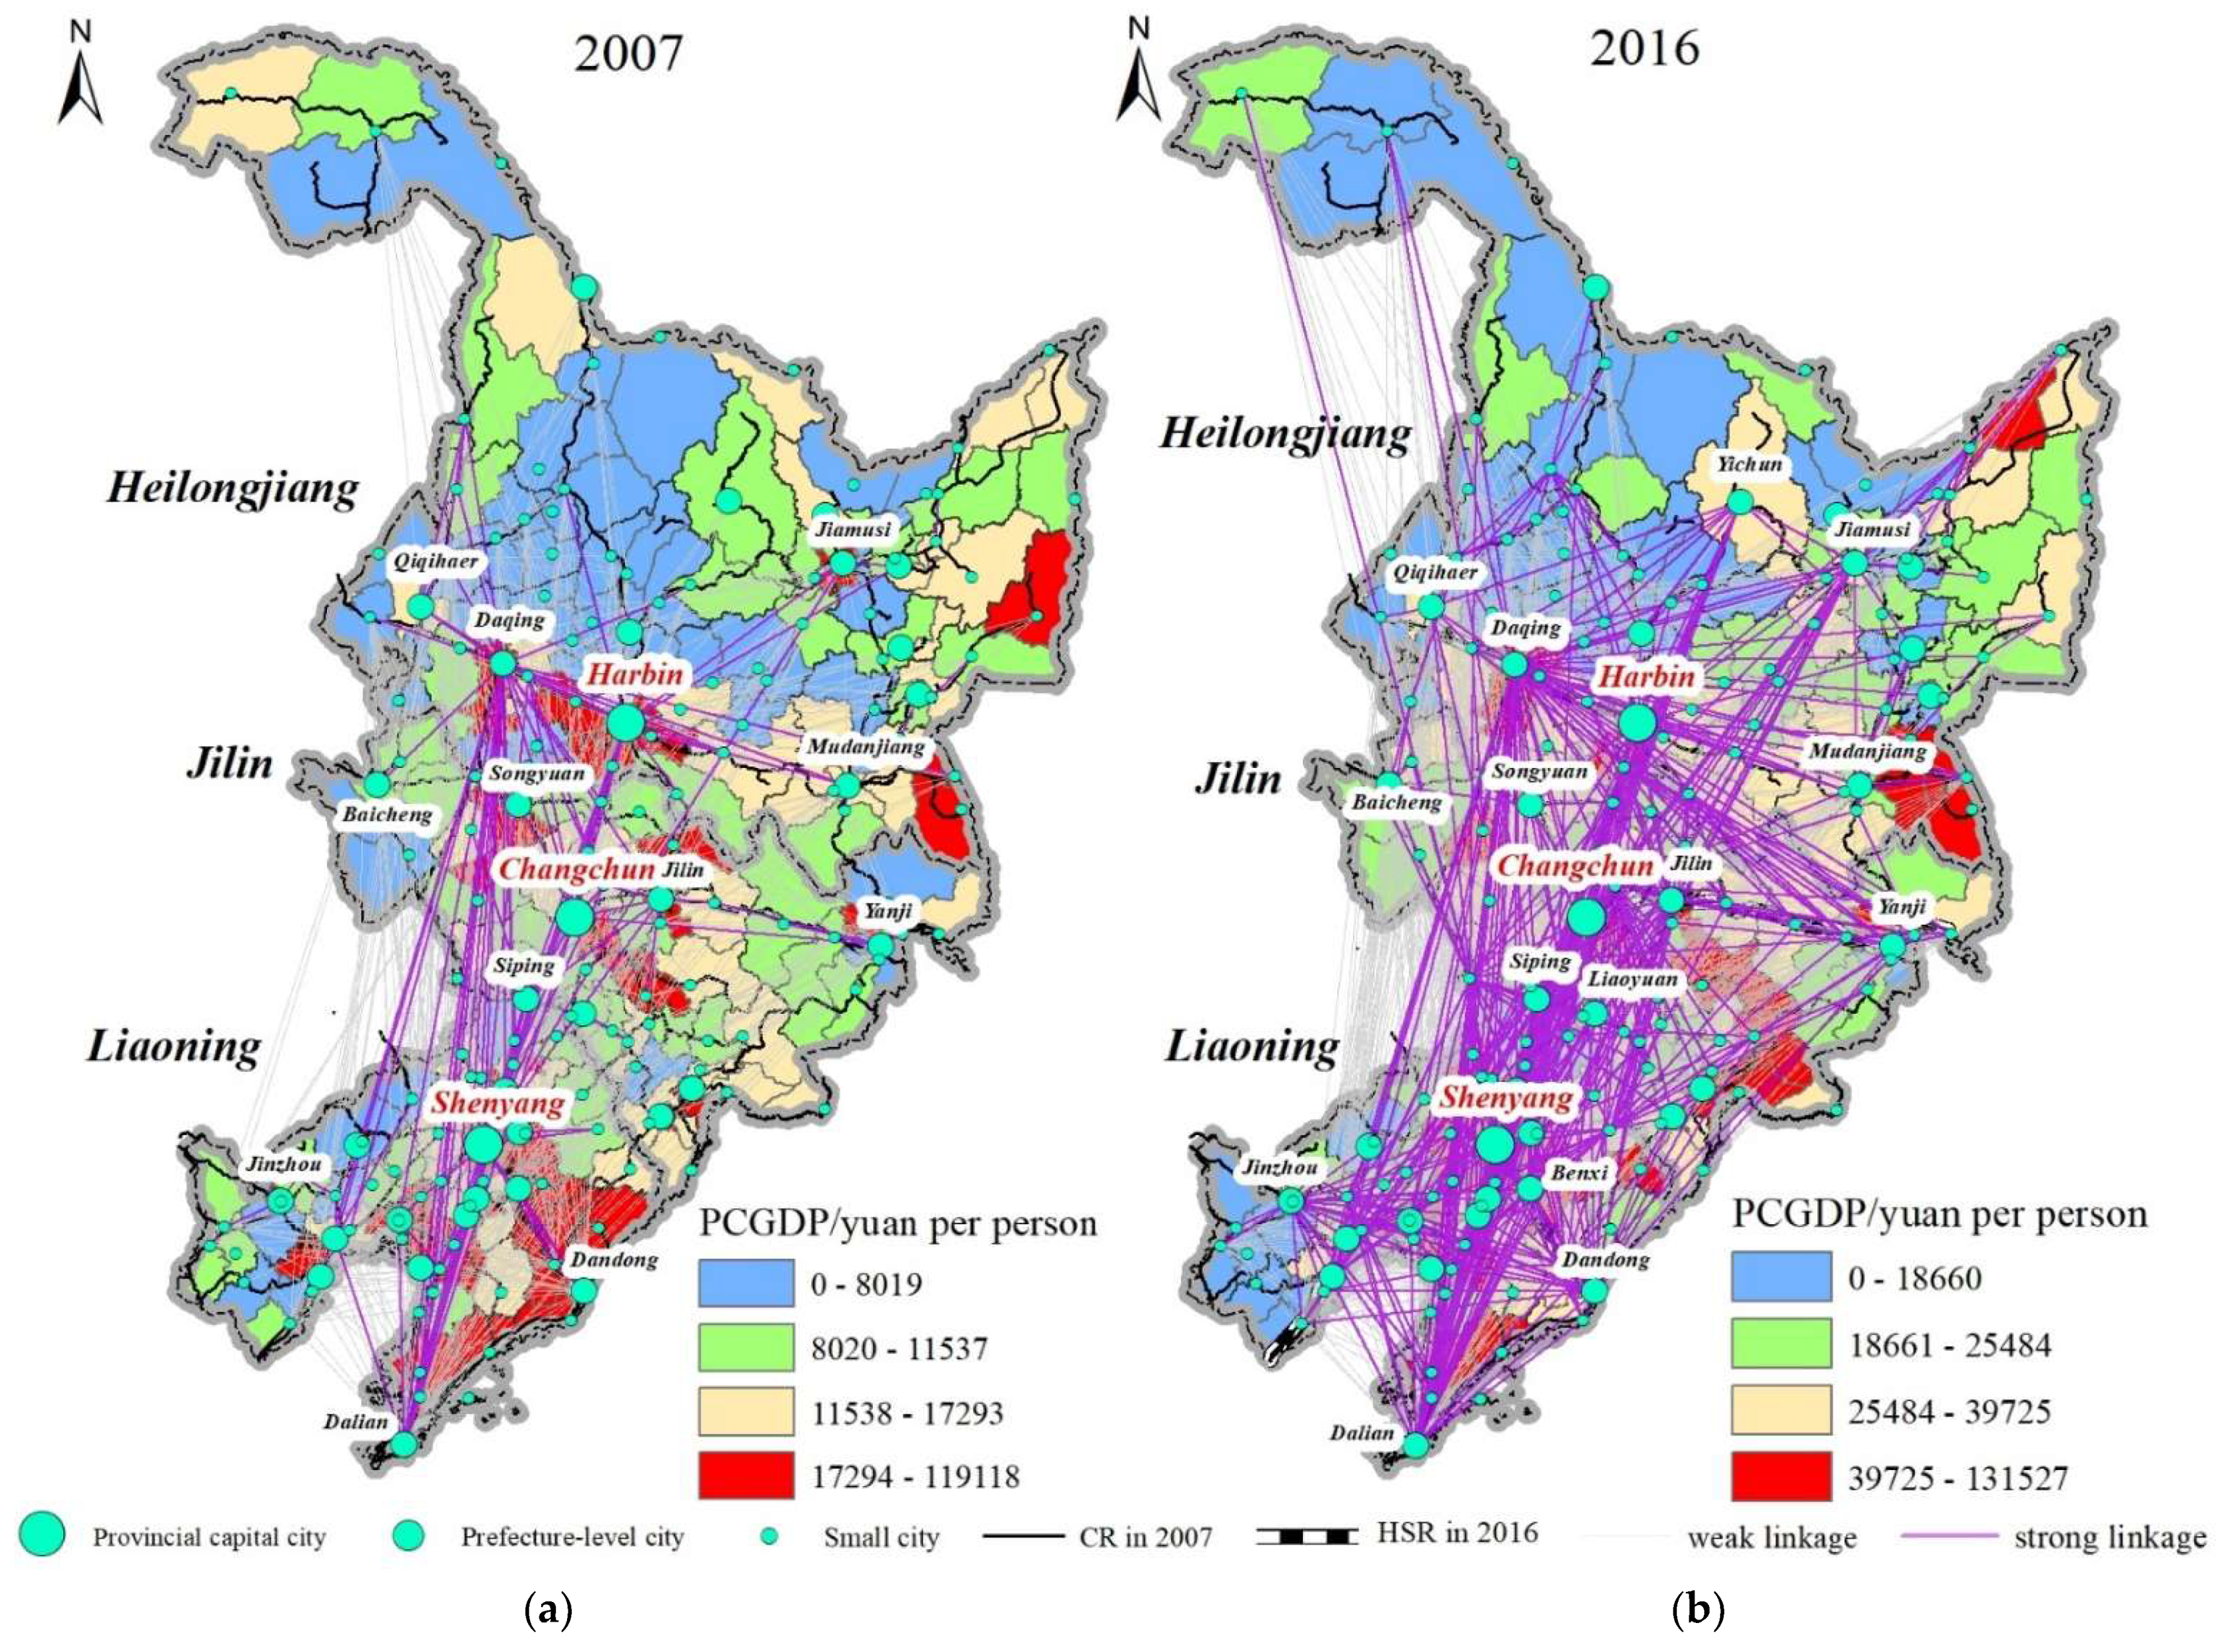
3.1. The Spatial Pattern of Economic Networks before and after HSR

Figure 3 demonstrates the evolving patterns of economic linkages before and after HSR services. Because CR services in 2007 (Figure 3a) and 2016 made not much difference, we concluded that the construction of HSR in the northeastern region significantly improved regional accessibility of each city and formulated a new “hexagonal” network structure of economic linkage along the HSR corridor in 2016 (Figure 3b). First, HSR services in northeastern China weakened the core-periphery structure of economic linkages and many small cities benefited from the service of HSR by promoting market integration with megacities, attracting more industrial activities and stimulating the regional economy [21]. Before the start of HSR, the network structure in northeastern China demonstrated a “triangular” shape with Daqing, Harbin, and Dalian as the apexes. In 2016, HSR lines such as Harbin–Daqing, Harbin–Qiqihaer, Changchun–Huichun, and Shenyang–Dandong were fully rolled out in the central and southern parts of northeastern China, driving the intercity economic linkages from the southwestern part to the northern, eastern, and southern parts. The spatially “hexagonal” network structure after HSR services significantly enhanced the intercity economic ties, especially between provincial capital cities and prefecture-level cities and small cities in northeastern China.
Furthermore, the “corridor effect” of HSR routes was evident in the railway network. Passengers in cities of the southeastern part of Jilin and the northern part of Heilongjiang transfer to HSR routes at important railway hubs (e.g., Changchun and Harbin) that provide frequent and fast train services. The construction of HSR lines facilitates the flow of commodities, labor, capital, and information between cities, which drives the expansion of the economic linkage network in northeastern China to small and medium-sized cities at the periphery and formulates the economic axes along the HSR lines. However, the intercity economic linkage network demonstrates a spatially-unbalanced pattern of “strong in the south and weak in the north, strong in the west and weak in the east”.
As demonstrated in Table 2, the proportion of small cities with strong economic linkages has increased after the start of HSR services and the network of economic linkages is flattening. The construction of HSR lines has promoted frequent resource flows and economic exchanges between cities, but it brings different impacts on core cities and peripheral cities. Regarding core cities, HSR construction enhanced the location advantage of large cities as transport hubs and greatly promoted the spatial spillover effect of economic development by strengthening the economic linkages between core cities and peripheral cities. However, as for small and medium-sized cities at the periphery, HSR construction significantly drove the cross-regional economic cooperation in the subordinate counties and cities. As indicated by the results of C i j R , the total intensity of economic linkages for small and medium-sized cities has significantly increased from 42.37% of the total economic linkages in all cities before HSR to 64.82% after HSR. With the continuing flattening trend of economic linkages among cities, there would be a gradual increase of the integrated regional economic development in northeastern China with the gradual improvement of HSR lines.

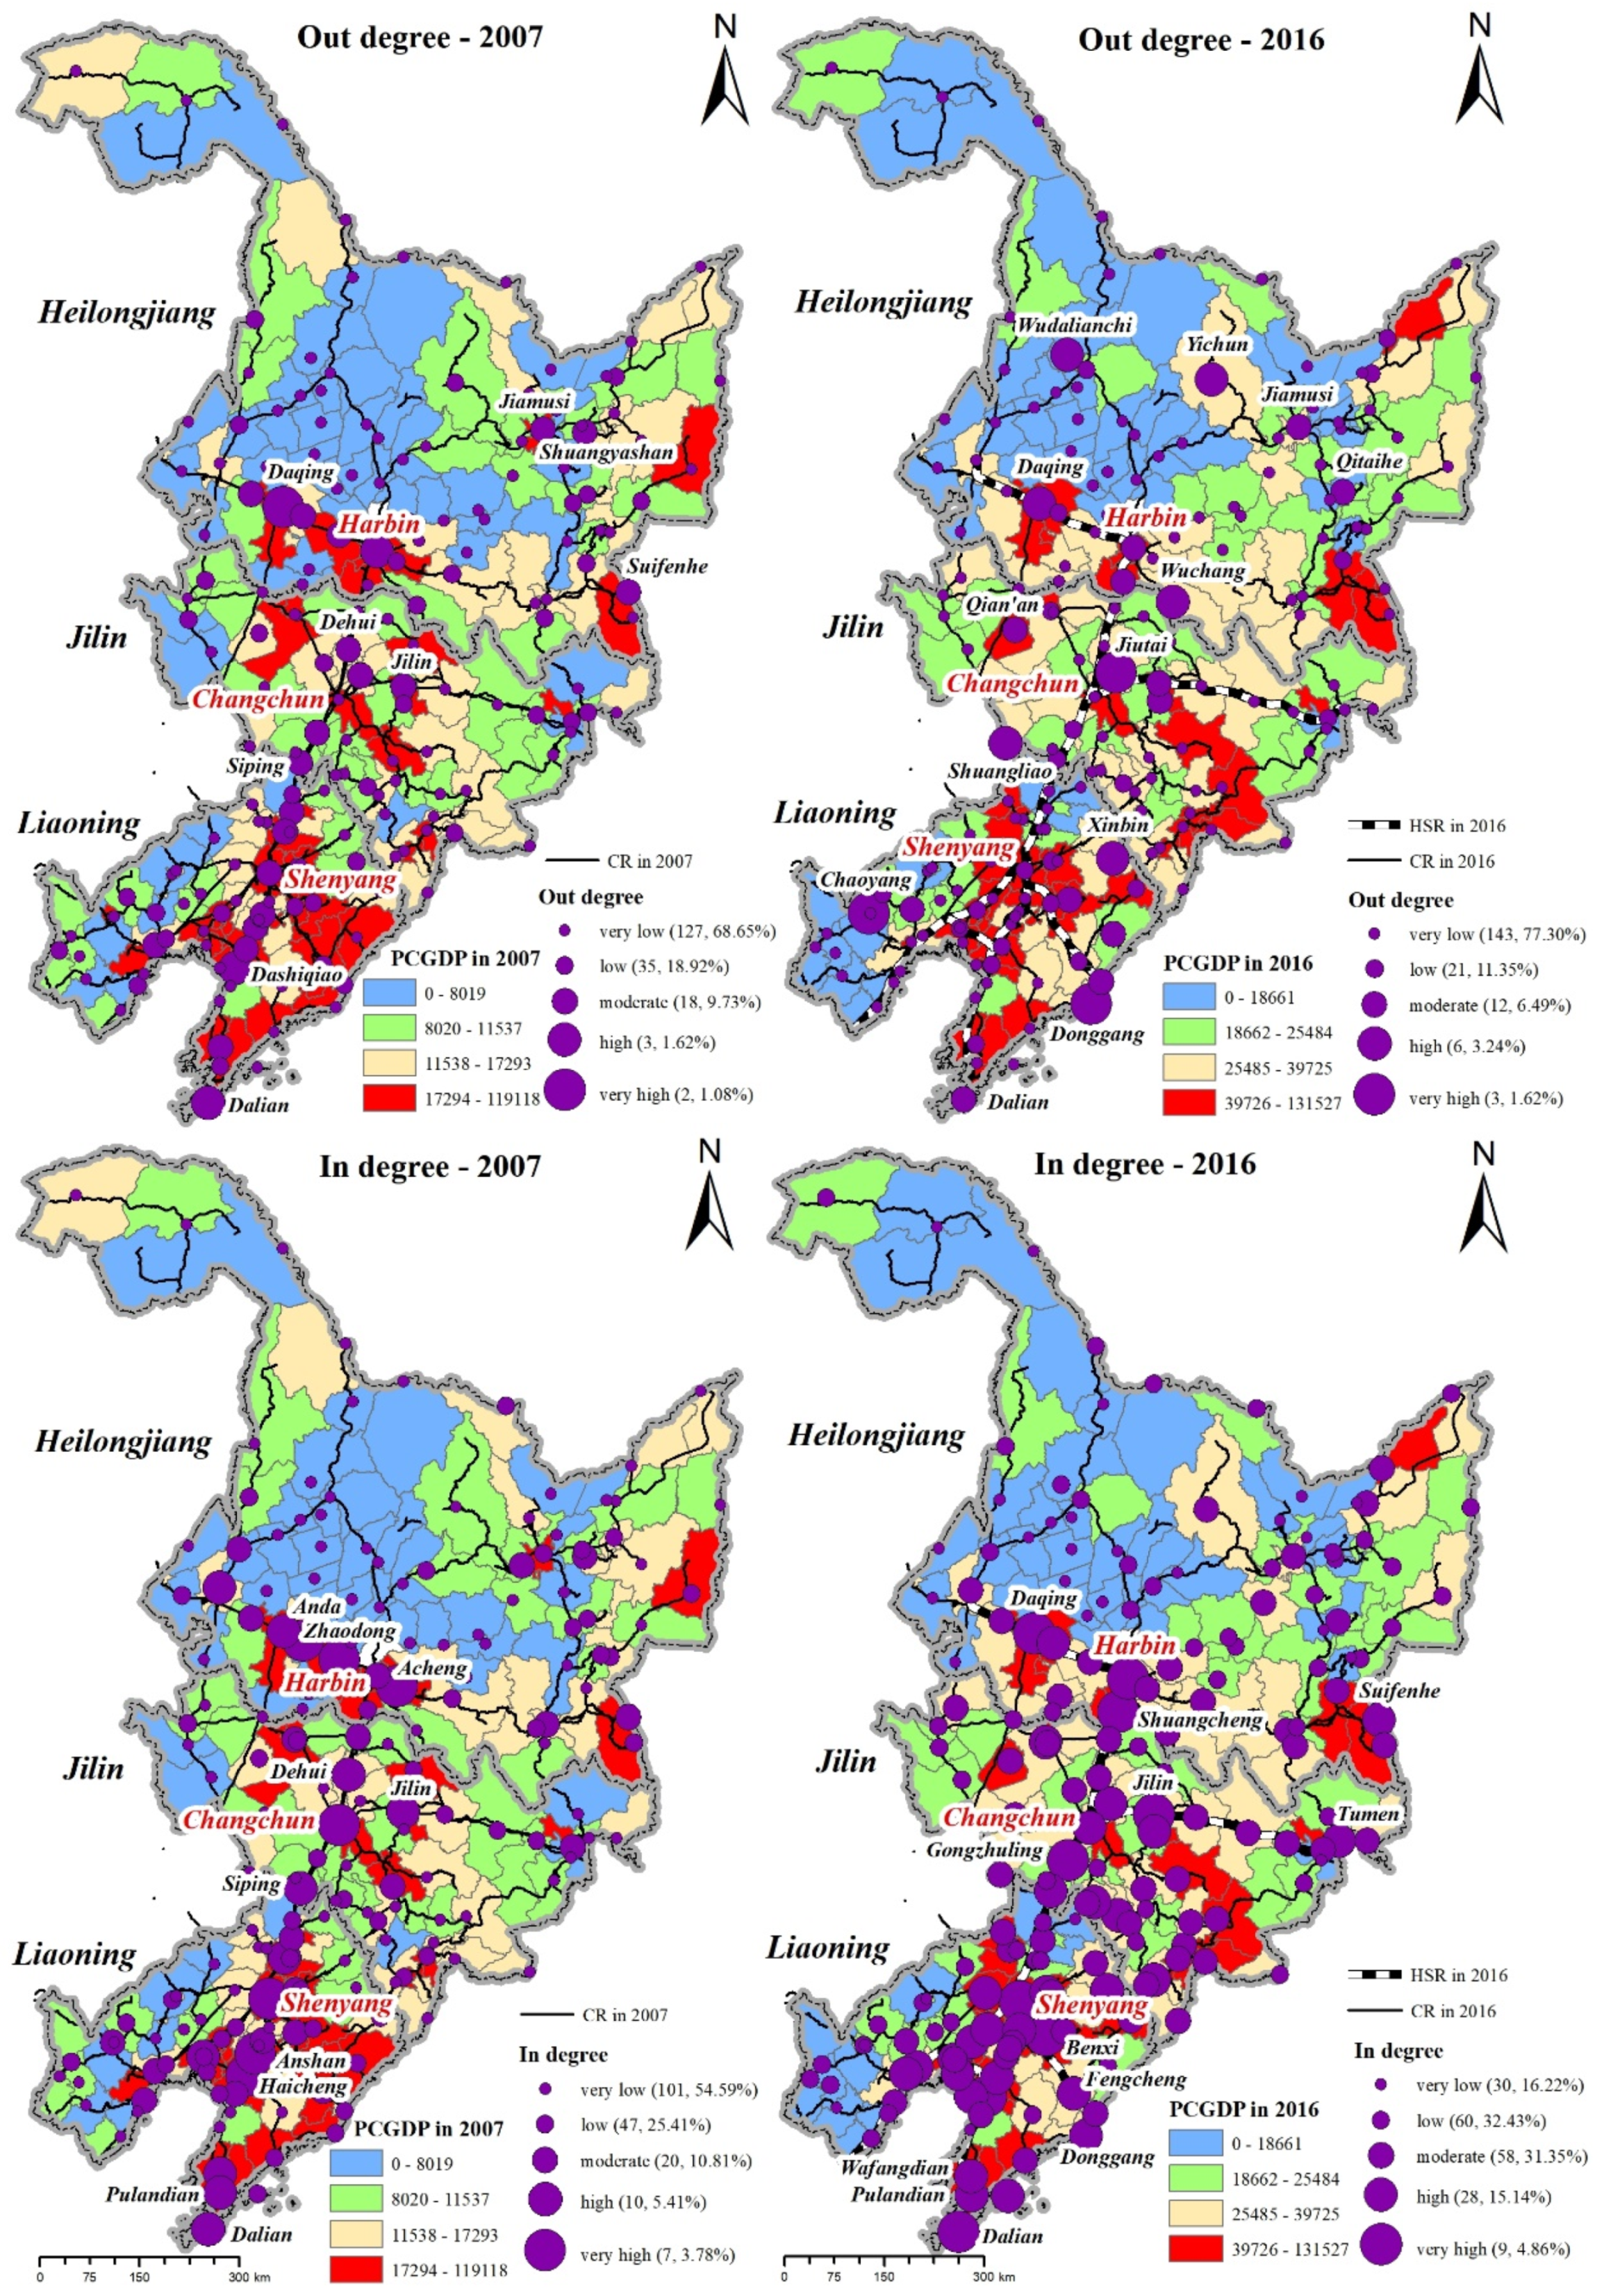
3.2. The Influence of HSR on the Out-Degree and In-Degree Centrality of Economic Networks

At the micro level, we assigned a role for each city in the railway network according to the value of degree centrality and then calculated the percentage of cities categorized in each role as demonstrated in Figure 4. The average value of normalized degree centrality in the northeastern region increased from 0.090 in 2007 to 0.697 in 2016, indicating that HSR networks significantly improved the connectivity in the city network. As seen from Table 3, there are three major points regarding the out-degree. First, HSR services significantly improved the average out-degree values of prefecture-level cities, which effectively stimulated the outflows of resources (i.e., labor and commodities) and revived the economy in northeastern China. Second, the average out-degree value of economic networks in Liaoning province improved the most from 0.108 in 2007 to 0.906 in 2016 after HSR services. Unbalanced regional development is also evident in northeastern China; the economic levels of Liaoning were comparatively better than that in Jilin and Heilongjiang provinces. HSR systems as an economic stimulus in northeastern China are expected to leverage the corridor effect and promote coordinated regional development. Third, the cities with HSR stations had much higher out-degree values than those without HSR stations. HSR can promote the development of urban economy and expansion of urban areas in cities with HSR stations.
The value of in-degree centrality in economic networks denotes the importance of a node in the inflow of resources. There are three major in-degree changes that progressed as below. First, HSR services significantly improved the in-degree value of provincial capital cities, prefecture-level cities, and small cities despite provincial capital cities still having the highest in-degree value. Harbin, Changchun, and Shenyang had stronger economic agglomeration ability. Second, HSR construction can significantly reshape the distribution of in-degree centrality in economic networks. The in-degree values of Heilongjiang and Jilin increased while that of Liaoning increased. This illustrates that the intensity of economic agglomeration in Liaoning weakened after HSR and spillover associations of the economy in Liaoning with other provinces were strengthened along the HSR corridor. Third, the in-degree value of cities with HSR stations was twice as high as that of cities without HSR stations, denoting the stronger ability of HSR stations to formulate economic agglomeration.

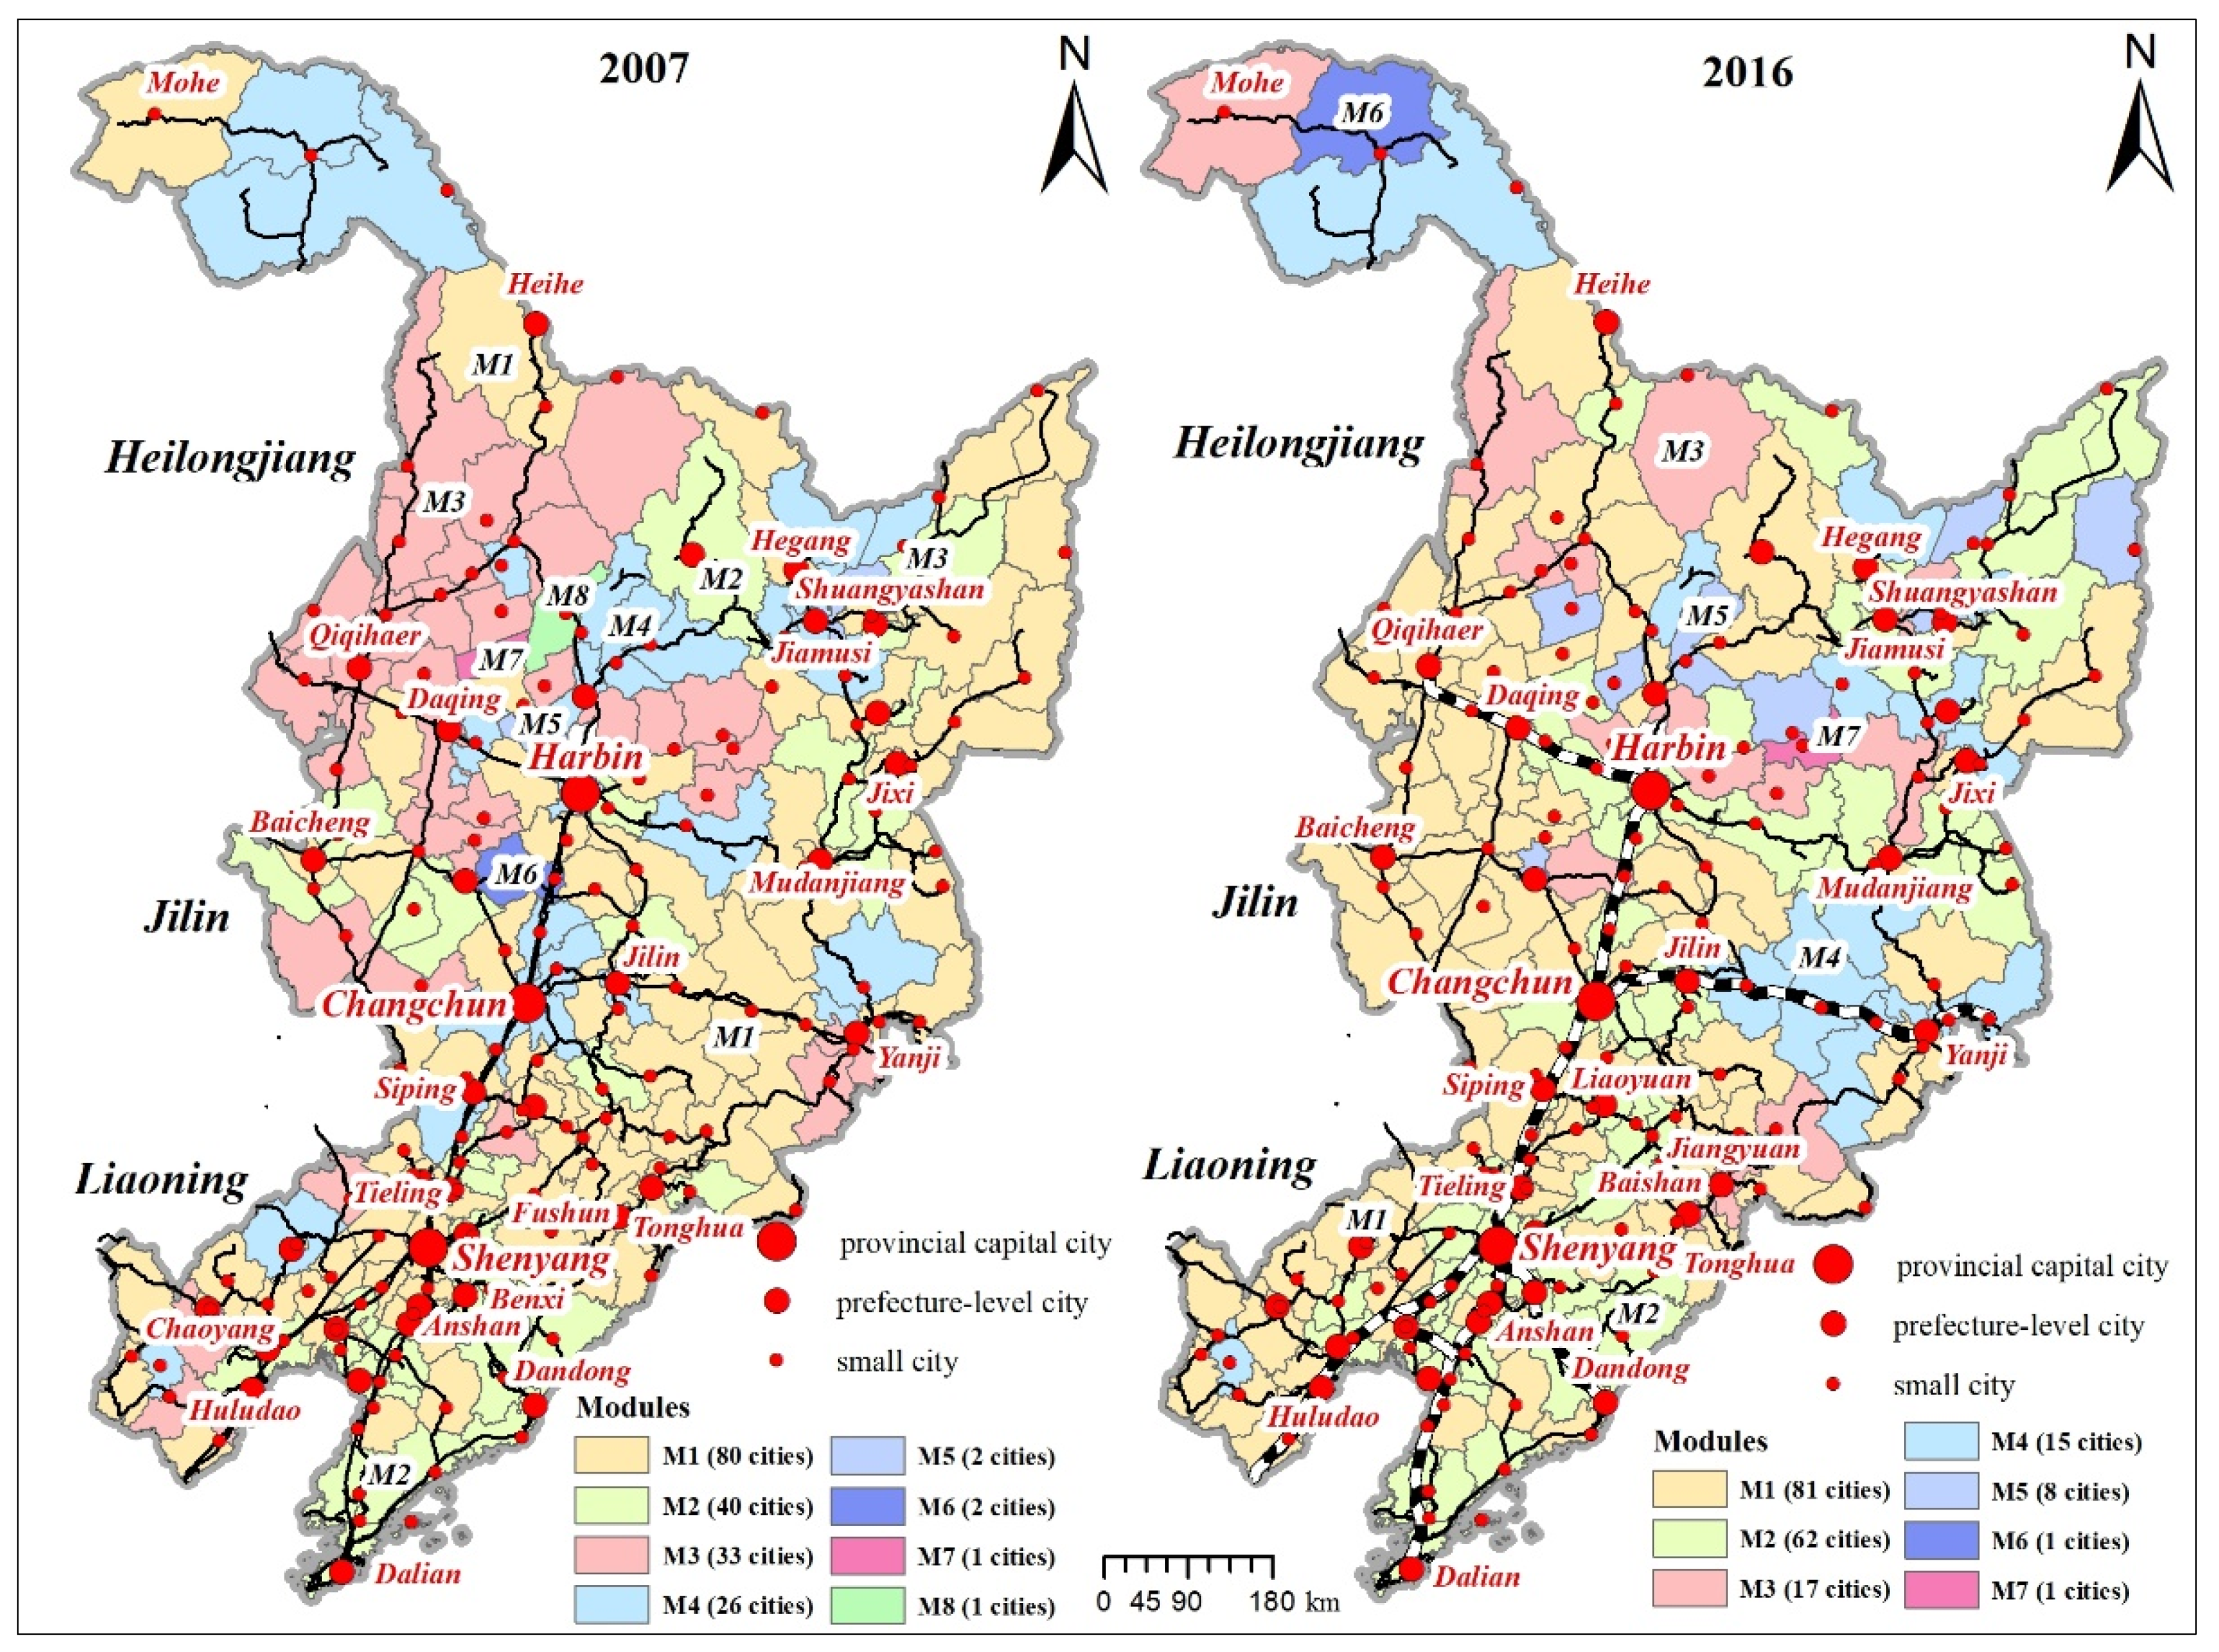
3.3. The Influence of HSR on the Community Structure of Economic Networks

The results of network community detection in the economic networks before and after HSR are demonstrated in Figure 5. Table 4 describes the statistical results showing the modularity, connection strength, module number, and size of modules. The optimal modularity of Q = 0.202 and Q = 0.131 was respectively found for a division into 8 communities in the economic network before HSR in 2007 and a division into 7 communities in the economic network after HSR in 2016. This indicates a slight decline of coherence in the economic network after the construction of HSR. Through aggregating the connections among cities in the same/different module as intra-modular/inter-modular connection strengths, the percentage of connection strength between modules respectively accounted for 59.39% in 2007 and 50.70% in 2016. HSR networks have a certain impact on the modular spatial pattern, especially in terms of strengthening the within-modular connections. HSR services can effectively strength the economic cooperation between cities within the same community through improving rail accessibility.
Because the construction of HSR lines has significantly changed the pattern of rail accessibility and thus altered the locational advantages of cities in economic development, HSR networks reshaped the community structure of economic linkages in northeastern China, as shown in Figure 4. There are two main communities after HSR in 2017, as shown below. First, the community M1 including 81 cities is mainly distributed along the Harbin–Huludao HSR line. This community is mainly comprised of small and medium-sized cities, which have benefited from the space-time shrinkage brought by HSR services and the strong and frequent economic cooperation within this community. Second, the community M2 including 62 cities with Harbin, Changchun, Shenyang, and Dalian as the core cities, is mainly dominated by the Harbin–Changchun urban agglomeration and the central Liaoning urban agglomeration. The Harbin–Changchun urban agglomeration was proposed in 2016 as a national strategy to formulate dual growth centers for reviving the northeast. In this community, HSR lines compressed the rail accessibility between the core cities (e.g., Shenyang and Dalian) and the peripheral small cities. According to the point-axis theory, the spatial spillover effect of economic development is evident in this community by promoting the flow of capital, talents, technology, and markets from the highly-developed provincial capital cities to the underdeveloped small or medium-sized cities.

3.4. The Driving Factors of Nodal Centrality in Economic Networks Using Spatial Regression Models

Table 3 demonstrates the regression results for in-degree and out-degree centrality. The in-degree of economic networks for all cities has significant spatial autocorrelation in error terms. According to the results of Lagrange multiplier diagnostics for spatial dependence in Table 5, SEM is more desirable for in-degree of all cities, denoting that the economic agglomeration ability of all cities is complicated and more influenced by uncertain factors. Regarding to in-degree of all cities, in-degree in 2007, population size, and public financial expenditure have significant and negative impacts whereas being a HSR city or not, GDP, fixed asset investment, and education are significant and positive contributors. First, the negative impact of in-degree in 2007 on in-degree in 2016 demonstrates that HSR construction weakened the in-degree centrality of cities because HSR causes the spatial spillover effect and promotes a more decentralized distribution of economic resources. Second, the negative impact of population size on in-degree in 2016 possibly implies that the high land prices and labor costs in large cities is not conducive to the agglomeration of economic activities. Third, the negative coefficient of public fiscal expenditure denotes that many cities face the fiscal burden of local government, such as “the three public expenses (san gong jing fei)” and civil service funds because of state-owned enterprise dominance in northeastern China. The budget overspending is unfavorable if the local government is to improve economic productivity and the business environment in northeastern China.
The out-degree in 2016, representing the capability of economic radiation, has insignificant spatial autocorrelation. Out-degree in 2007 and GDP were two significant and positive predictors of out-degree in 2016 for all cities. Among all cities, GDP had positive and significant impacts on both in-degree and out-degree. The level of economic development was an important factor to predict the spillover or agglomeration effect and cities with developed economies, often involving the concentration of infrastructure and other resources through an intercity network of transmission of innovation, information, and commodities. Among the HSR cities, in-degree in 2007, public fiscal expenditure and education were significant contributors for predicting in-degree in 2016 while out-degree in 2007 was the most important factor contributing to out-degree in 2015, and other socioeconomic variables became insignificant. Among CR cities, positive spatial autocorrelation of in-degree in 2016 was significant and SLM was the appropriate model to predict the in-degree of CR cities. This implies the spatial cluster of CR cities with high in-degree values, which have the capability to attract more capital inflow and labor migration. However, spatial dependence for out-degree in 2016 among CR cities was insignificant and GDP was the most important factor for enhancing spillover associations of the economy in each CR city with other CR cities.

4. Discussion and Policy Implications

4.1. Discussion

The network perspective is increasingly important given that high-speed transportation systems can stimulate the redevelopment of city centers at the nodal level, reshape the connectivity between or within metropolitan regions being comprised of big intermediate cities, and the surrounding small cities at the community level, and then reorganize the city’s rail transport systems as well as the hierarchy of the established city system at the regional level [29,41]. Previous studies mostly apply the traditional gravity model to characterize the economic interaction between cities while ignoring transport accessibility and the ability of economic radiation in each source city itself. This paper integrated the accessibility index of HSR or CR networks and the radiation model to compare the asymmetric processes of economic radiation between the source and the destination. Then the social network measure and spatial econometrics were used to examine the structural characteristics of economic linkages and the underlying mechanisms that help to optimize the future city system planning and transport planning.
HSR services not only significantly improve regional accessibility [42], but also have great influence on the core-periphery structure of economic inequality, the nodal centrality, and the community structure in economic networks, which gives new insight into the reviving of northeastern China. First, HSR lines have promoted a corridor economy and facilitated the free flow of commodities, labor, capital, and information between cities, driving the expansion of economic networks in northeastern China to small and medium-sized cities at the periphery and narrowing the core-peripheral inequality of economic development. Because of the complex climatic conditions in the alpine northeastern region of China, it is costly and complicated to build a brand-new HSR line. The electrification projects to improve the operating speed on existing CR lines also effectively stimulated the spatial balance of economic growth and revived northeastern China. Second, HSR services improved the out-degree of each city, especially the HSR cities, but the in-degree of Liaoning province has been reduced after HSR. This denotes that the centrifugal force of economic development was strengthened, especially along the HSR corridor, while the centripetal force was weakened in Liaoning. Urban agglomerations such as Central Liaoning, Central Jilin, and Harbin–Daqing–Qiqihaer as growth centers in northeastern China, are expected to cause the spatial spillover effect to stimulate the economic growth of neighboring cities and hence impede regional polarization. Third, regional coherence in the economic network demonstrated a slight decline after building of HSR lines and the within-modular connections were strengthened after HSR. Accordingly, the homogeneous industrial structure in northeastern China should be updated by consolidating and improving the manufacturing chains as well as enhancing intercity cooperation.
The mechanisms underlying the nodal centrality of economic networks are complicated and are driven by uncertain factors. The in-degree centrality of economic networks demonstrates significant spatial autocorrelation, indicating the strong spillover associations with neighboring cities. The capability of economic agglomeration represented by in-degree is positively associated with the level of economic development, fixed asset investment and education, while it is negatively associated with public fiscal expenditure. Due to the dominant state-owned enterprises in northeastern China, the local government faces a heavy fiscal burden, due to factors such as “the three public expense” and civil service funds, hence resulting in poor economic productivity in northeastern China. The government aims to improve the market-oriented operational mechanism and push the mixed-ownership reform of state-owned enterprise by introducing social capital and boosting innovation.

4.2. Policy Implications

Transport planning should be coordinated with the city system planning in the long run to accomplish the integrated development of transportation and land use. It is necessary to build a relatively well-structured city hierarchy with metropolitan cities as the engine, peripheral cities as the foundation, and intermediate cities as the hub [43]. Due to the continuous advancement of transport system in China, some peripheral cities may be upgraded to hub cities, causing the city system hierarchy and spatial structure to be changed temporarily. The development of ultraperipheral or peripheral cities should be emphasized in city system planning by strengthening their transport connections to metropolitan or intermediate cities. Furthermore, special attention should be paid to spatial planning, land use planning, and territorial planning around HSR stations, thus improving the land use intensity and promoting spatial organization of residential, industrial, and commercial activities.
The agglomeration economy as an important facilitator of economic growth should be increasingly encouraged in northeastern provinces to promote regional coordinated development and improve regional competitiveness. Presently only the mid-southern Liaoning urban agglomeration in the formation stage applies spatial spillover effects. The integrated planning of multimodal transport infrastructure (road, rail, water) should be implemented to produce free trade flow and improve economic efficiency between cities belonging to the same urban agglomeration. Moreover, a modern transport management system is also necessary for the urban agglomeration to manage and optimize all transportation activity throughout the supply chain. Due to the presence of “administrative economy” in China, regional design and planning cross administrative boundaries are required in the northeastern region to facilitate an integrated transport system within the metropolitan area connecting not only the metropolitan city and nearby medium-sized cities but also small cities. In order to better promote the economic agglomeration effect of HSR lines in northeastern China, it is important for the government to reduce fiscal expenditure on civil service funds and “the three public expense” as well as increase fiscal spending on transport infrastructure, innovation, and talent attraction.

5. Conclusions

Drawing on 185 cities in the northeastern region of China, this paper constructed economic networks before and after HSR based on the accessibility index, considering train service frequency and the radiation model. Then social network analysis was utilized to characterize the impact of HSR on nodal centrality and community structure of economic networks. Spatial regression models were employed to determine the driving factors of nodal centrality in economic networks. This study comprehensively captures the impact of HSR on reshaping economic networks from a spatial perspective and tries to give some new insights into integrated transport and land use spatial planning for the northeastern China.
The following research findings can be obtained from this paper. First, HSR services in northeastern China weaken the core-periphery structure of economic linkages and many small cities can benefit from HSR services. Second, HSR services significantly improve the average out-degree values of prefecture-level cities, which can effectively stimulate the outflows of resources. However, the in-degree centrality in Liaoning was weakened after HSR and spillover associations of the economy in Liaoning with other provinces were strengthened along the HSR corridor. Third, a slight decline of coherence occurs in the economic network after the construction of HSR. HSR networks have a certain impact on the modular spatial pattern, especially in terms of strengthening the within-modular connections. Four, SEM is more desirable for in-degree of all cities, denoting that the economic agglomeration ability of all cities is complicated and influenced by uncertain factors. GDP, fixed asset investment, education, population, and fiscal expenditure are important contributors to the in-degree centrality of economic networks.
These findings give significant insights into city system planning, integrated transport and land use development, formulating regional centers, and coordinated development across administrative boundaries in northeastern China. However, this study also has some limitations. The accessibility index only considers travel time and train service frequency while ignoring the waiting time of passengers at train stations and the choice of transport modes as well as travel demand. Although we claim that the radiation model can better capture the asymmetric process of economic linkages than the conventional gravity model, model comparisons can be conducted in the future to validate how spatial structure changes through scenario simulation.

Author Contributions

Conceptualization, Lei Mei and Lei Wang; methodology, Sanwei He; software, Sanwei He; writing—original draft preparation, Sanwei He; writing—review and editing, Lei Mei and Lei Wang; visualization, Lei Mei; supervision, Lei Wang. All authors have read and agreed to the published version of the manuscript.

Funding

This research is funded by the National Natural Science Foundation of China (42071207, 41601162) and Natural Science Foundation of Jiangsu Province, China (BK20200109).

Data Availability Statement

The datasets analyzed in this article are not publicly available. Requests to access the datasets should be directed to [email protected].

Conflicts of Interest

The authors declare no conflict of interest.

References

  1. Givoni, M. Development and Impact of the Modern High-speed Train: A Review. Transp. Rev. 2006, 26, 593–611. [Google Scholar] [CrossRef]
  2. Wei, S.; Jiao, J.; Wang, L.; Xu, J. Evolving Characteristics of High-Speed Railway Network Structure in Yangtze River Delta, China: The Perspective of Passenger Flows. Appl. Spat. Anal. Policy 2020, 13, 925–943. [Google Scholar] [CrossRef]
  3. Wang, L.; Xuejun, D. High-speed rail network development and winner and loser cities in megaregions: The case study of Yangtze River Delta, China. Cities 2018, 83, 71–82. [Google Scholar] [CrossRef] [Green Version]
  4. Gutiérrez, J. Location, economic potential and daily accessibility: An analysis of the accessibility impact of the high-speed line Madrid–Barcelona–French border. J. Transp. Geogr. 2001, 9, 229–242. [Google Scholar] [CrossRef]
  5. Spiekermann, K.; Wegener, M. The shrinking continent: New time-space maps of Europe. Environ. Plan. B Plan. Des. 1994, 21, 653–673. [Google Scholar] [CrossRef]
  6. Weng, J.; Zhu, X.; Li, X. Impact of High-speed Rail on Destination Accessibility: A Case Study of China. J. China Tour. Res. 2020, 16, 494–509. [Google Scholar] [CrossRef]
  7. Jin, F.; Jiao, J.; Qi, Y.; Yang, Y. Evolution and geographic effects of high-speed rail in East Asia: An accessibility approach. J. Geogr. Sci. 2017, 27, 515–532. [Google Scholar] [CrossRef] [Green Version]
  8. Chandra, S.; Vadali, S. Evaluating accessibility impacts of the proposed America 2050 high-speed rail corridor for the Appalachian Region. J. Transp. Geogr. 2014, 37, 28–46. [Google Scholar] [CrossRef]
  9. Li, X.; Huang, B.; Li, R.; Zhang, Y. Exploring the impact of high speed railways on the spatial redistribution of economic activities-Yangtze River Delta urban agglomeration as a case study. J. Transp. Geogr. 2016, 57, 194–206. [Google Scholar] [CrossRef]
  10. Liu, L.; Zhang, M. High-speed rail impacts on travel times, accessibility, and economic productivity: A benchmarking analysis in city-cluster regions of China. J. Transp. Geogr. 2018, 73, 25–40. [Google Scholar] [CrossRef]
  11. Liu, S.; Wan, Y.; Zhang, A. Does China’s high-speed rail development lead to regional disparities? A network perspective. Transp. Res. Part A Policy Pract. 2020, 138, 299–321. [Google Scholar] [CrossRef] [PubMed]
  12. Jiao, J.; Wang, J.; Jin, F.; Dunford, M. Impacts on accessibility of China’s present and future HSR network. J. Transp. Geogr. 2014, 40, 123–132. [Google Scholar] [CrossRef]
  13. Wetwitoo, J.; Kato, H. High-speed rail and regional economic productivity through agglomeration and network externality: A case study of inter-regional transportation in Japan. Case Stud. Transp. Policy 2017, 5, 549–559. [Google Scholar] [CrossRef]
  14. Wang, J.J.; Xu, J.; He, J. Spatial Impacts of High-Speed Railways in China: A Total-Travel-Time Approach. Environ. Plan. A Econ. Space 2013, 45, 2261–2280. [Google Scholar] [CrossRef]
  15. Geurs, K.T.; van Wee, B. Accessibility evaluation of land-use and transport strategies: Review and research directions. J. Transp. Geogr. 2004, 12, 127–140. [Google Scholar] [CrossRef]
  16. Wang, L. High-speed rail services development and regional accessibility restructuring in megaregions: A case of the Yangtze River Delta, China. Transp. Policy 2018, 72, 34–44. [Google Scholar] [CrossRef]
  17. Malavenda, G.A.; Musolino, G.; Rindone, C.; Vitetta, A. Residential Location, Mobility, and Travel Time: A Pilot Study in a Small-Size Italian Metropolitan Area. J. Adv. Transp. 2020, 31, 1–11. [Google Scholar] [CrossRef]
  18. Zheng, S.; Kahn, M.E. China’s bullet trains facilitate market integration and mitigate the cost of megacity growth. Proc. Natl. Acad. Sci. USA 2013, 110, E1248–E1253. [Google Scholar] [CrossRef] [Green Version]
  19. Zhang, P.; Zhao, Y.; Zhu, X.; Cai, Z.; Xu, J.; Shi, S. Spatial structure of urban agglomeration under the impact of high-speed railway construction: Based on the social network analysis. Sustain. Cities Soc. 2020, 62, 102404. [Google Scholar] [CrossRef]
  20. Shaw, S.-L.; Fang, Z.; Lu, S.; Tao, R. Impacts of high speed rail on railroad network accessibility in China. J. Transp. Geogr. 2014, 40, 112–122. [Google Scholar] [CrossRef]
  21. Monzón, A.; Ortega, E.; Lopez, E. Efficiency and spatial equity impacts of high-speed rail extensions in urban areas. Cities 2013, 30, 18–30. [Google Scholar] [CrossRef] [Green Version]
  22. Ureña, J.M.; Menerault, P.; Garmendia, M. The high-speed rail challenge for big intermediate cities: A national, regional and local perspective. Cities 2009, 26, 266–279. [Google Scholar] [CrossRef]
  23. Derudder, B.; Taylor, P. Change in the World City Network, 2000–2012. Prof. Geogr. 2016, 68, 624–637. [Google Scholar] [CrossRef]
  24. Vickerman, R. Can high-speed rail have a transformative effect on the economy? Transp. Policy 2018, 62, 31–37. [Google Scholar] [CrossRef] [Green Version]
  25. Li, W.; Cai, X. Empirical analysis of a scale-free railway network in China. Phys. A Stat. Mech. Appl. 2007, 382, 693–703. [Google Scholar] [CrossRef]
  26. Jiao, J.; Wang, J.; Jin, F. Impacts of high-speed rail lines on the city network in China. J. Transp. Geogr. 2017, 60, 257–266. [Google Scholar] [CrossRef]
  27. Simini, F.; González MCMaritan, A.; Barabási, A. A universal model for mobility and migration patterns. Nature 2012, 484, 96–100. [Google Scholar] [CrossRef]
  28. Camacho, D.; Panizo-Lledot, Á.; Bello-Orgaz, G.; Gonzalez-Pardo, A.; Cambria, E. The four dimensions of social network analysis: An overview of research methods, applications, and software tools. Inf. Fusion 2020, 63, 88–120. [Google Scholar] [CrossRef]
  29. Scott, J.; Carrington, P.J. The SAGE Handbook of Social Network Analysis; SAGE Publications Ltd.: Thousand Oaks, CA, USA, 2014. [Google Scholar]
  30. Leung, X.; Yu, W.; Fang, W.; Bihu, B.; Billy, S.; Kurt, A.; Xie, Z.J. A social network analysis of overseas tourist movement patterns in Beijing: The impact of the Olympic Games. Int. J. Tour. Res. 2012, 14, 469–484. [Google Scholar] [CrossRef]
  31. Tahmasebi, A.; Askaribezayeh, F. Microfinance and social capital formation- a social network analysis approach. Socio-Econ. Plan. Sci. 2021, 76, 100978. [Google Scholar] [CrossRef]
  32. Dupuy, G.; Stransky, V. Cities and highway networks in Europe. J. Transp. Geogr. 1996, 4, 107–121. [Google Scholar] [CrossRef]
  33. Xu, W.; Zhou, J.; Qiu, G. China’s high-speed rail network construction and planning over time: A network analysis. J. Transp. Geogr. 2018, 70, 40–54. [Google Scholar] [CrossRef]
  34. Chen, C.-L.; Vickerman, R.W. Can transport infrastructure change regions’ economic fortunes? Some evidence from Europe and China. Reg. Stud. 2017, 51, 144–160. [Google Scholar] [CrossRef]
  35. Castells, M. Grassrooting the space of flows. Urban Geogr. 1999, 20, 294–302. [Google Scholar] [CrossRef]
  36. Shao, S.; Tian, Z.; Yang, L. High speed rail and urban service industry agglomeration: Evidence from China’s Yangtze River Delta region. J. Transp. Geogr. 2017, 64, 174–183. [Google Scholar] [CrossRef]
  37. Russo, F. Which High-Speed Rail? LARG Approach between Plan and Design. Futur. Transp. 2021, 1, 202–226. [Google Scholar] [CrossRef]
  38. Wang, L.; Zhang, W.; Duan, X. Understanding Accessibility Changes from the Development of a High-Speed Rail Network in the Yangtze River Delta, China: Speed Increases and Distance Deductions. Appl. Spat. Anal. Policy 2019, 12, 1011–1029. [Google Scholar] [CrossRef]
  39. Barrat, A.; Barthelemy, M.; Pastor-Satorras, R.; Vespignani, A. The architecture of complex weighted networks. Proc. Natl. Acad. Sci. USA 2004, 101, 3747–3752. [Google Scholar] [CrossRef] [PubMed] [Green Version]
  40. Newman, M.E.J. Modularity and community structure in networks. Proc. Natl. Acad. Sci. USA 2006, 103, 8577–8582. [Google Scholar] [CrossRef] [Green Version]
  41. Garmendia, M.; de Ureña, J.M.; Ribalaygua, C.; Leal, J.; Coronado, J.M. Urban Residential Development in Isolated Small Cities That Are Partially Integrated in Metropolitan Areas By High Speed Train. Eur. Urban Reg. Stud. 2008, 15, 249–264. [Google Scholar] [CrossRef]
  42. Wetwitoo, J.; Kato, H. Inter-regional transportation and economic productivity: A case study of regional agglomeration economies in Japan. Ann. Reg. Sci. 2017, 59, 321–344. [Google Scholar] [CrossRef]
  43. Fang, C.; Pang, B.; Liu, H. Global city size hierarchy: Spatial patterns, regional features, and implications for China. Habitat Int. 2017, 66, 149–162. [Google Scholar] [CrossRef]
Figure 1. The study area in northeastern China comprising three provinces, namely Heilongjiang, Jilin, and Liaoning.
Ijgi 10 00776 g001
Figure 2. The work flow of this study.
Ijgi 10 00776 g002
Figure 3. The dynamics of economic linkages before and after HSR ((a) represents economic linkages before HSR in 2007 whereas (b) denotes economic linkages after HSR in 2016; economic linkages are categorized as strong linkages and weak linkages; if the value of an economic linkage from the source city to the destination is larger than the average value of all economic linkages, then the line is categorized as a strong linkage, otherwise a weak linkage).
Ijgi 10 00776 g003
Figure 4. Nodal centrality of each city in railway networks before and after HSR (the left column represents nodal centrality of CR railway networks in 2007; the right column denotes nodal centrality of CR and HSR railways networks in 2016).
Ijgi 10 00776 g004
Figure 5. Modular structures of economic networks before HSR in 2007 and after HSR in 2016 (different colors represent different modules; the number in the brackets denotes the number of cities in this community).
Ijgi 10 00776 g005
Table 1. Descriptive statistics of all exploratory variables.
VariablesDescriptionMeanS.D.MinMax
In-degree(2007)The in-degree value of each node in 20070.090.160.011.28
Out-degree(2007)The out-degree value of each node in 20070.090.2702.73
hsrcityIf the city has a HSR station, then the value is 1, otherwise 0.0.270.4501
lngdpThe natural logarithm of GDP5.261.172.438.94
lnpopThe natural logarithm of population3.780.721.956.31
expendThe ratio of public fiscal expenditure to GDP 0.220.130.051.17
lnfixedThe natural logarithm of fixed asset investment13.791.1410.9417.56
induThe ratio of industrial output to GDP0.350.150.030.71
eduThe ratio of secondary students to the total population at year end2.052.870.1324
Table 2. The top 20 cities or economic linkages in 2007 and 2016.
20072016
j = 1 n C i j R / n C i j R j = 1 n C i j R / n C i j R
rankcityvaluerankorigindestinationvalueOD
distance
rankcityvaluerankorigindestinationvalueOD
distance
1Daqing 231.25 1Harbin 1Acheng 31132.6 49.0 1Chaoyang 2103.0 1Harbin 1Shuangcheng 3689.3 73.8
2Harbin 117.08 2Dashiqiao 3Haicheng 3957.1 36.9 2Jiutai 385.8 2Daqing 2Shuangcheng 3683.9 212.7
3Dalian 214.66 3Siping 2Changchun 1884.6 119.0 3Donggang 368.2 3Shenyang 1Benxi 3627.4 32.6
4Dashiqiao 311.44 4Dalian 2Wafangdian 3854.4 99.9 4Wuchang 350.0 4Dalian 2Donggang 3492.2 284.7
5Siping 26.77 5Daqing 2Anda 3616.2 28.7 5Wudalianchi 349.7 5Anda 3Daqing 2460.5 28.8
6Anshan 25.61 6Dashiqiao 3Anshan 2566.1 81.4 6Daqing 243.6 6Daqing 2Harbin 1449.3 153.8
7Shenyang 14.87 7Daqing 2Zhaodong 3486.4 97.6 7Manbin 331.7 7Siping 2Gongzhuling 3437.6 64.5
8Zhaodong 34.77 8Daqing 2Changchun 1483.7 342.5 8Shuangliao 328.6 8Gongzhuling 3Jiutai 3426.8 123.1
9Jilin 24.35 9Harbin 1Daqing 2479.2 153.8 9Yichun 228.5 9Haicheng 3Dashiqiao 3409.5 36
10Jinzhou 24.18 10Harbin 1Anda 3478.8 131.6 10Qian’an 320.8 10Shuangcheng 3Gongzhuling 3344.7 269.7
11Duerbote 33.92 11Daqing 2Shenyang 1442.6 649.3 11Shuangcheng 319.6 11Pulandian 3Qiqihaer 2330.4 1039.4
12Kaiyuan 33.35 12Jilin 2Changchun 1439.7 117.6 12Jiamusi 219.2 12Dashiqiao 3Gaizhou 3329.1 33.4
13Shuangyashan 23.16 13Dalian 2Pulandian 3408.8 66.9 13Dandong 218.5 13Dehui 3Shuangcheng 3308.9 126
14Tieling 23.13 14Dalian 2Shenyang 1405.6 378.5 14Yixian 314.6 14Jilin 2Yongji 3306.6 23.5
15Jiamusi 23.04 15Dehui 3Changchun 1363.5 109.1 15Benxi 313.7 15Wafangdian 3Pulandian 3295.9 30.9
16Gongzhuling 32.99 16Daqing 2Qiqihaer 2330.4 158.6 16Kuandian 313.4 16Benxi 3Fengcheng 3293.9 152.1
17Dehui 32.95 17Harbin 1Zhaodong 3324.3 62.2 17Harbin 112.4 17Dandong 2Donggang 3293.3 28.3
18Jiutai 32.68 18Kaiyuan 3Tieling 3320.0 55.8 18Yongji 311.7 18Daqing 2Jilin 2284.6 441.5
19Liaoyang 22.67 19Jiutai 3Jilin 2314.5 78.2 19Qitaihe 211.5 19Fuyu 3Shuangcheng 3284.1 56.4
20Suifenhe 32.65 20Gongzhuling 3Siping 2313.8 63.7 20Dalian 211.0 20Dalian 2Dashiqiao 3281.5 225.8
Note: The unit for OD distance is kilometer; the superscript characters “1”, “2”, and “3” respectively represent provincial, prefecture-level and small cities.
Table 3. Normalized out-degree and in-degree centrality in 2007 and 2016.
TypeNumber of CitiesOut Degree in 2007Out Degree in 2016In Degree in 2007In Degree in 2016
MeanCVMeanCVMeanCVMeanCV
Administrative rank:
  Provincial capital city30.6441.2071.0490.7600.8140.6771.5050.316
  Prefecture-level city320.2402.1891.3182.1430.1500.8350.8830.510
  Small city1500.0472.3340.5572.9120.0631.6600.6410.510
Provincial level:
  Heilongjiang770.0983.6460.5622.5960.0721.7310.5700.705
  Jilin490.0572.0290.6572.8520.0902.0510.7710.369
  Liaoning590.1082.1300.9062.6021.1141.4740.8010.460
Having HSR stations or not:
  Cities with HSR stations51--0.9412.055--1.0040.494
  Cities without HSR stations134--0.6043.098--0.5800.402
The whole region1850.0903.0000.6972.7110.0901.7370.6970.541
Note: CV is the coefficient of variation and can reflect regional inequality of degree centrality.
Table 4. Network community detection in railway networks before and after HSR.
Network/ModulesModularityConnection Strength (%Total)Module NumberMinimum SizeMaximum SizeAverage Size
Within ModulesBetween Modules
CR network in 20070.20240.61%59.39%818023
CR and HSR network in 20160.13149.30%50.70%718126
Table 5. Regression results for in-degree and out-degree in 2016.
VariablesIn-Degree (2016)Out-Degree (2016)
All CitiesHSR CitiesCR CitiesAll CitiesHSR CitiesCR Cities
OLSSLMSEMOLSSLMSEMOLSSLMSEMOLSSLMSEMOLSSLMSEMOLSSLMSEM
in-degree (2007)−0.42 ***−0.42 ***−0.41 ***−0.70 **−0.68 **−0.63 **0.01 −0.010.01
out-degree (2007) 1.47 **1.47 **1.50 **1.88 **1.89 ***1.91 ***0.070.06−0.10
hsrcity0.27 ***0.27 ***0.26 *** −0.14−0.14−0.14
lngdp0.13 ***0.13 ***0.12 ***0.160.140.140.12 ***0.11 ***0.11 ***0.53 *0.53 *0.54 **−0.16−0.16−0.100.68 **0.63 **0.60 *
lnpop−0.28 ***−0.28 ***−0.30***−0.28−0.29−0.35 **−0.25 ***−0.23 ***−0.25 ***0.160.160.160.58 0.580.530.060.060.04
lnfixed0.12 ***0.12 ***0.12 ***0.130.140.110.10 ***0.09 ***0.10 ***−0.19−0.19 −0.210.280.280.26−0.20−0.16−0.11
expend−0.60 ***−0.57 ***−0.66 ***−1.80 **−2.14 ***−1.87 ***−0.42 ***−0.34 ***−0.41 ***0.010.010.00−0.24−0.15−0.150.240.200.26
edu0.04 ***0.04 ***0.05 ***0.04 *0.05 **0.07 ***0.010.000.00−0.11−0.11−0.11−0.14 −0.14 −0.15−0.010.030.06
indu−0.08−0.09−0.10−0.11−0.11−0.13 0.060.000.07−0.84−0.84 −0.810.910.900.81−1.69−1.78−1.77
Constant−0.49−0.49−0.38−0.32−0.070.35−0.41−0.47 *−0.420.390.390.56−4.80−4.88−4.720.270.00−0.58
ρ 0.03−0.22 * −0.20−0.35 ** 0.23 ***0.04 0.000.04 0.02 0.08 −0.14−0.16
N184184184505050134134134184184184505050134134134
R20.650.650.650.500.530.550.670.690.670.100.100.100.180.180.180.090.100.10
Log likelihood15.5815.6617.00−16.22−15.41−14.8578.9183.3278.95−368.34−368.34−368.3−98.9− 98.9−98.8−267.4−266.8−266.7
LM Test (lag)0.14 1.39 8.28 *** 0.00 0.01 0.94
Robust LM (lag)3.80 * 0.03 13.31 *** 1.47 0.35 0.01
LM Test (error)1.98 1.53 0.05 0.07 0.10 1.00
Robust LM (error)5.64 ** 0.18 5.08 ** 1.54 0.43 0.06
Appropriate modelSEM OLS SLM OLS OLS OLS
Note: *** is the 1% significance level; ** is the 5% significance level; * is the 10% significance level.
Publisher’s Note: MDPI stays neutral with regard to jurisdictional claims in published maps and institutional affiliations.

