Article

Spatial Modelling of Kaolin Deposit Demonstrated on the Jimlíkov-East Deposit, Karlovy Vary, Czech Republic

by
Marcela Jarošová
1,* and
František Staněk
2
1
Department of Mathematics, Faculty of Civil Engineering, VSB—Technical University of Ostrava, 17. listopadu 2172/15, 708 00 Poruba, Czech Republic
2
Department of Geological Engineering, Faculty of Mining and Geology, VSB—Technical University of Ostrava, 17. listopadu 2172/15, 708 00 Poruba, Czech Republic
*
Author to whom correspondence should be addressed.
ISPRS Int. J. Geo-Inf. 2021, 10(11), 788; https://0-doi-org.brum.beds.ac.uk/10.3390/ijgi10110788
Submission received: 30 August 2021 / Revised: 11 November 2021 / Accepted: 16 November 2021 / Published: 18 November 2021
(This article belongs to the Special Issue Application of Geology and GIS)

Abstract

:
The present study is focused on spatial modelling of a kaolin deposit in Karlovy Vary, Czech Republic, and the methodical procedure of development, evaluation and visualization of a 3D model are described step by step. The implementation of this methodology is performed in Visual Studio 2019 with use of the Surfer and Voxler objects from Golden Software. This methodology combined with the newly developed software (Kaolin_A and Kaolin_Viz programs) allow a user to create a variant dynamic model for the same or similar types of deposits. It enables a quick update of the model when changing the input data, based on the new mining exploration or when changing the modelling parameters. The presented approach leads to a more advanced evaluation of deposits, including various estimates of reserves according to pre-specified usability conditions. The efficiency of the developed methodology and the software for the evaluation of the deposit are demonstrated on the kaolin deposit Jimlíkov-East, located near the village Jimlíkov about 5 km west of Karlovy Vary in the Czech Republic.

1. Introduction

Research of critical and strategic minerals plays a crucial role in strategic planning on how to deal with these minerals in all countries, including the Czech Republic [1]. In the Czech Republic, kaolin, which is a key raw material for various industrial applications, was also included among the national critical raw materials [1]. For instance, it is used in the production of porcelain, washed kaolin, as a filler in the production of paper, and as an additive to paints and in refractory materials. It is also used in the cosmetics, pharmaceutical and food industries. The Czech Republic belongs to the leading states in Europe and the world, both in the mining of raw kaolin and in the production of washed kaolin. Other world’s major sites with the occurrence of kaolin include USA, UK, Brazil, China, and Germany [2].
The problem of optimal kaolin mining was addressed in the paper by M. Koneshloo and J.-P. Chiles [3], where a method for selective mining was described on two kaolin deposits of the Charentes Basin in France. Ukraine also belongs to the world’s major locations with significant kaolin deposits, and in the paper by R. Sobolevskyi et al., [4] an analysis of technological parameters of kaolin in this territory determining its quality was performed. The paper describes a method of calculating reserves in the Veliko Hadominetsky deposit, where mining began in 2017. E. Kogel [5] claimed that due to kaolin properties distinct from other minerals, new methods for mining and processing of kaolin are needed. Additionally, 3D models are increasingly required to perform selective mining.
Many authors have dealt with spatial modelling of deposits other than kaolin ones. The article by Xinyu Zhang et al. [6] deals with 3D geological modelling, which proposes a method for quickly processing papery borehole log information. Zhi-Wei Hou et al. [7] provided a systematic review of the state-of-the-art methods for preparing input data for 3D geological modelling. Other methods of spatial modelling of mineral deposits were described by Li et al. [8], whose modelling approach was to generate 3D predictive maps from 3D geological models. The mineral resource deposits are modelled and categorized by N. Battalgazy and N. Madani [9], who employed the projection pursuit multivariate transformation method, and then, the outputs are compared with conventional (co)-simulation methods. Li et al. [10] proposed multiple-point geostatistical simulation and local singularity analysis to identify regional geochemical anomalies and potential mineral resource areas. Liu et al. [11] constructed 3D geometric models for evaluating the Dawangding gold deposit in south China using the FLAC3D (fast Lagrangian analysis of continua in three dimensions) modelling. Hosseini and Asghari [12] described a multidimensional geostatistic simulation on block support in the presence of complex multidimensional relationships and compared their results with a common modelling approach. Li et al. [13] analyzed different 3D geological modelling processes. They considered dynamic updatability as one of the metrics to assess 3D geological modelling methods. Paithankar and Chatterjee [14] applied a multi-point geostatistical method and sequential Gaussian simulation to generate multiple equiprobable models of a selected deposit in Africa. Tao et al. [15] created a 3D geological model based on geological maps, geological plans, cross sections and boreholes. Subsequently, they used the weight of evidence method and fuzzy logic to integrate various predictor maps, in order to generate perspective maps. Mao et al. [16] performed multi-constraint geological modelling and spatial analysis involving 3D buffer analysis, shape analysis, and field analysis. The obtained spatial data were further integrated into three-dimensional prospectivity modelling by fuzzy weights of evidence and continuous methods to evaluate the mineral potential. Resource estimation of mineral deposits requires spatial modelling of orebody boundaries, based on a set of exploration borehole data. The use of multipoint statistics with the direct sampling algorithm and geostatistical simulation was described by Dagasan et al. [17] However, none of these researchers, aside those already mentioned in the previous paragraph, focused on kaolin deposits.
Currently, it is desirable to use mined kaolin deposits in an efficient way and in parallel, evaluate newly found kaolin stocks, to prepare suitable locations for future mining. This presupposes the construction of a 3D model of the kaolin deposit for the area of interest. This will allow for the determination of optimal kaolin mining not only based on historical data obtained from exploratory drills in the past but also from data obtained from any additional exploration and ongoing mining. Such a 3D model is the fundamental foundation for detailed local estimation of reserves according to the usability requirements. Kaolin has specific properties in mineralogical and chemical composition, as well as technological properties. In order to divide the reserves of kaolin in terms of their future use, it is necessary to classify these reserves into individual categories. In the case of the Czech Republic, these technological parameters are monitored and processed to categorize the reserves of kaolin deposits into so-called kaolin outwash (kaolin residue after kaolin washing out with the grain size up to 20 microns), Al2O3, Fe2O3, and TiO2 (Table 1). To meet this target, a methodology for creating a digital model of a kaolin deposit and appropriate software for creating 3D grids for the distribution of technological parameters, for the visualization of the model in 2D and 3D, and for stock estimates, was created. Section 2 describes the individual steps of the methodological procedure for modelling the technological parameters of kaolin at a given deposit. Afterwards, the methodology is implemented in the Visual Studio 2019 [18] environment using the Surfer [19] and Voxler [20] objects from Golden Software in Section 3.

2. Materials and Methods

The Jimlíkov-East kaolin deposit has been formed by kaolinization of granites of the Karlovy Vary massif in the Cretaceous-to-Paleogene periods [21]. These are the remains of the original weathering barks, which were preserved before denudation. The Karlovy Vary massif, which is part of the extensive Ore Mountains pluton, forms the crystalline bedrock of the deposit (Figure 1).
This section focuses on derivation and visualization of a 3D model of the deposit. The individual steps of the methodological procedure together with the developed software allow for the construction of various models of kaolin deposits. Each of the specific models will be the foundation for detailed local estimates of reserves according to the defined usability conditions. Additionally, models can be updated and modified according to the requirements of possible additional exploration and ongoing mining.
The modelling uses state-of-the-art available software: MS Excel, Surfer [19] and Voxler [20] from Golden Software, and the open-source program SGeMS [22]. Additional software implementation and its development is performed in the Visual Studio 2019 [18] environment with the support of the object-oriented programming language Visual Basic (VB.NET). MS Excel macros in VBA are used to ensure the compatibility of used programs. The steps of the methodological procedure can be summarized into the following list:
  • Evaluation of all available archive materials. The first step consists of the collection of all available information of the geological composition of the area from the archives of the Geofond of the Czech Republic [23,24,25,26,27,28] and the revision of the obtained input data.
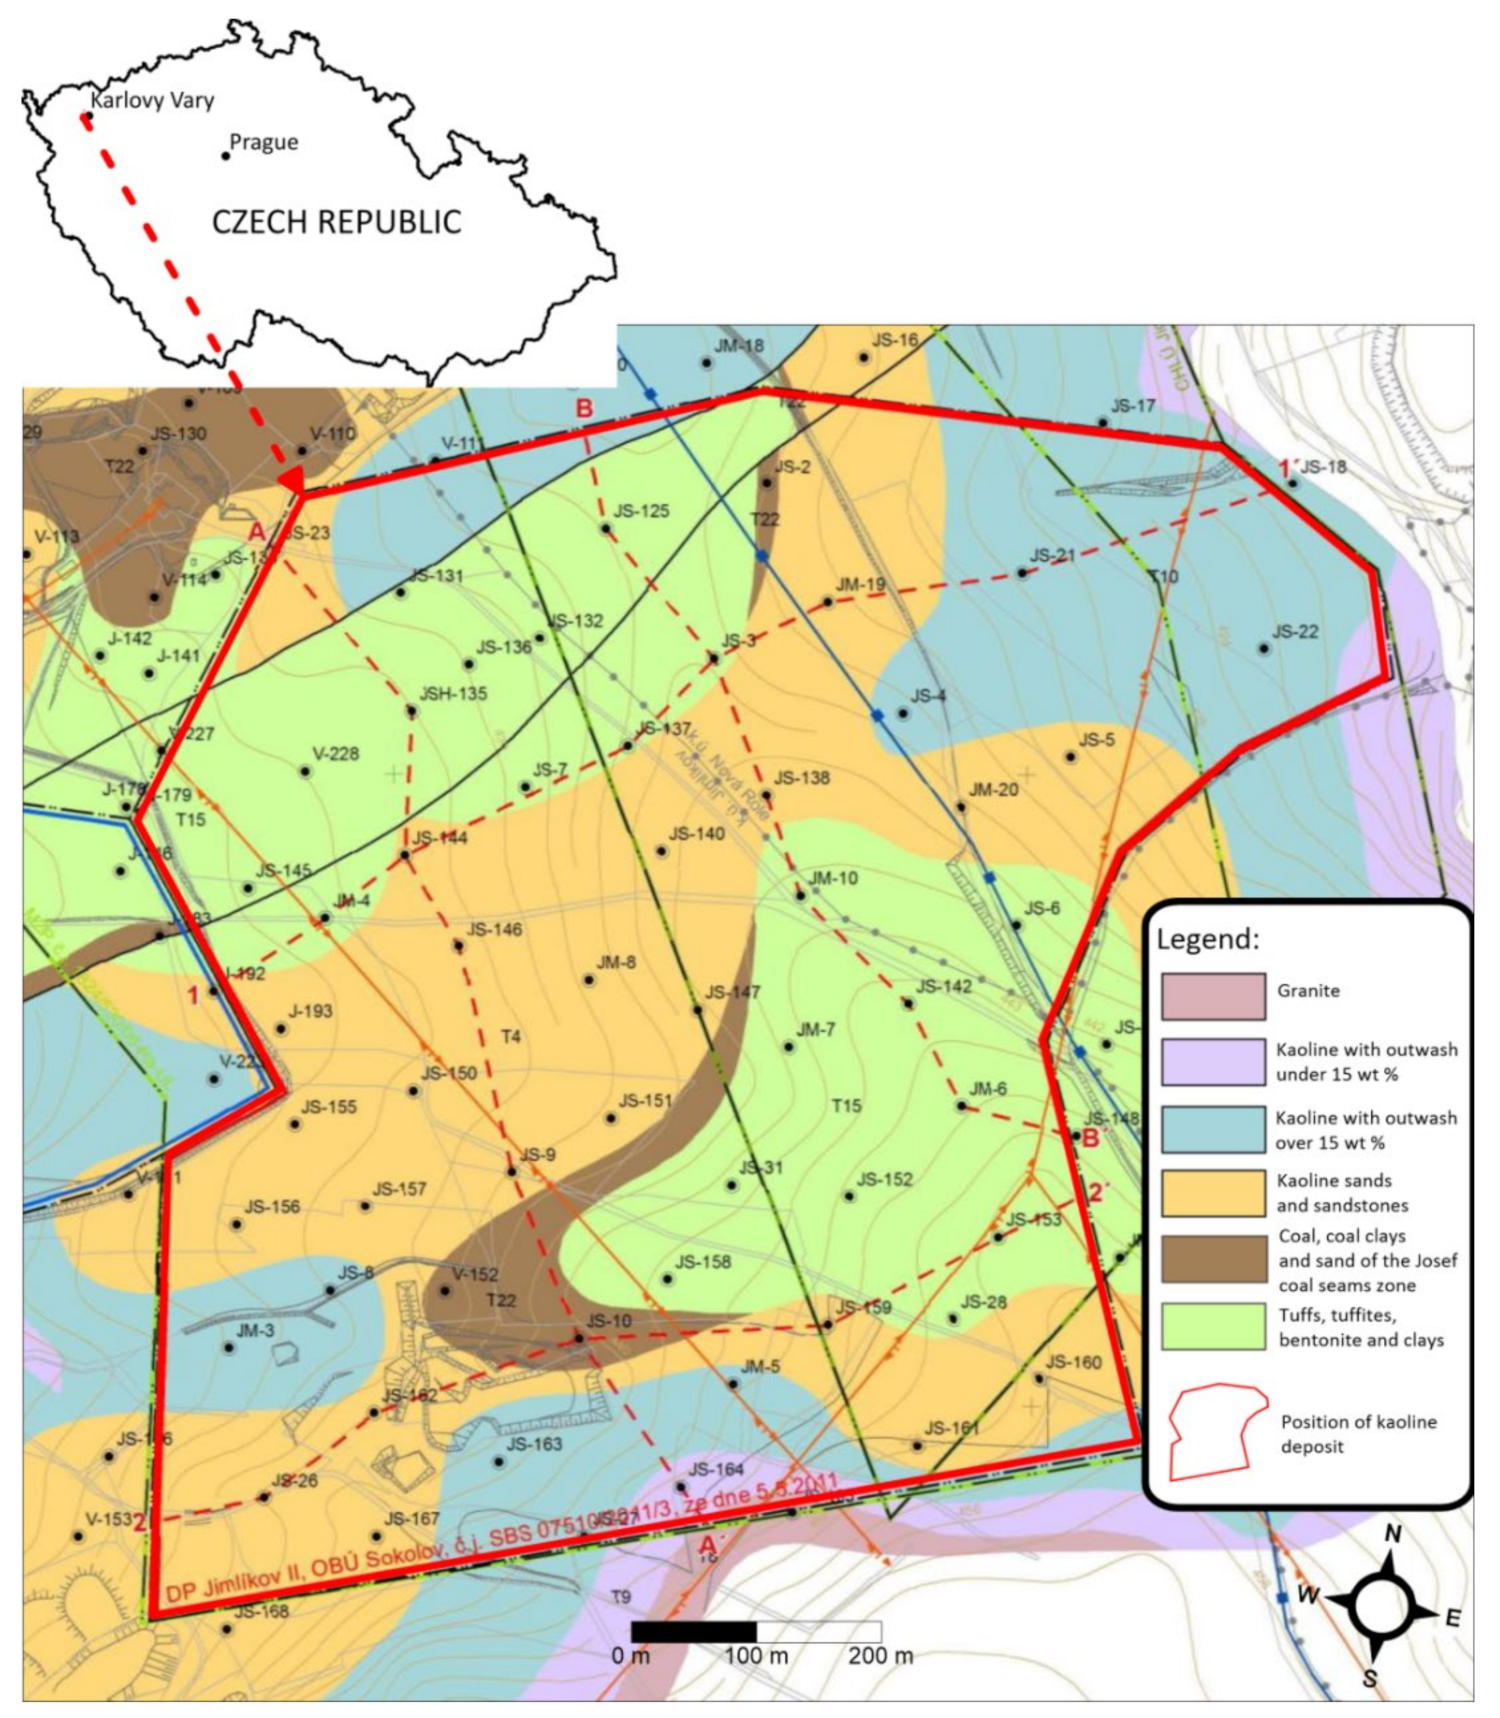
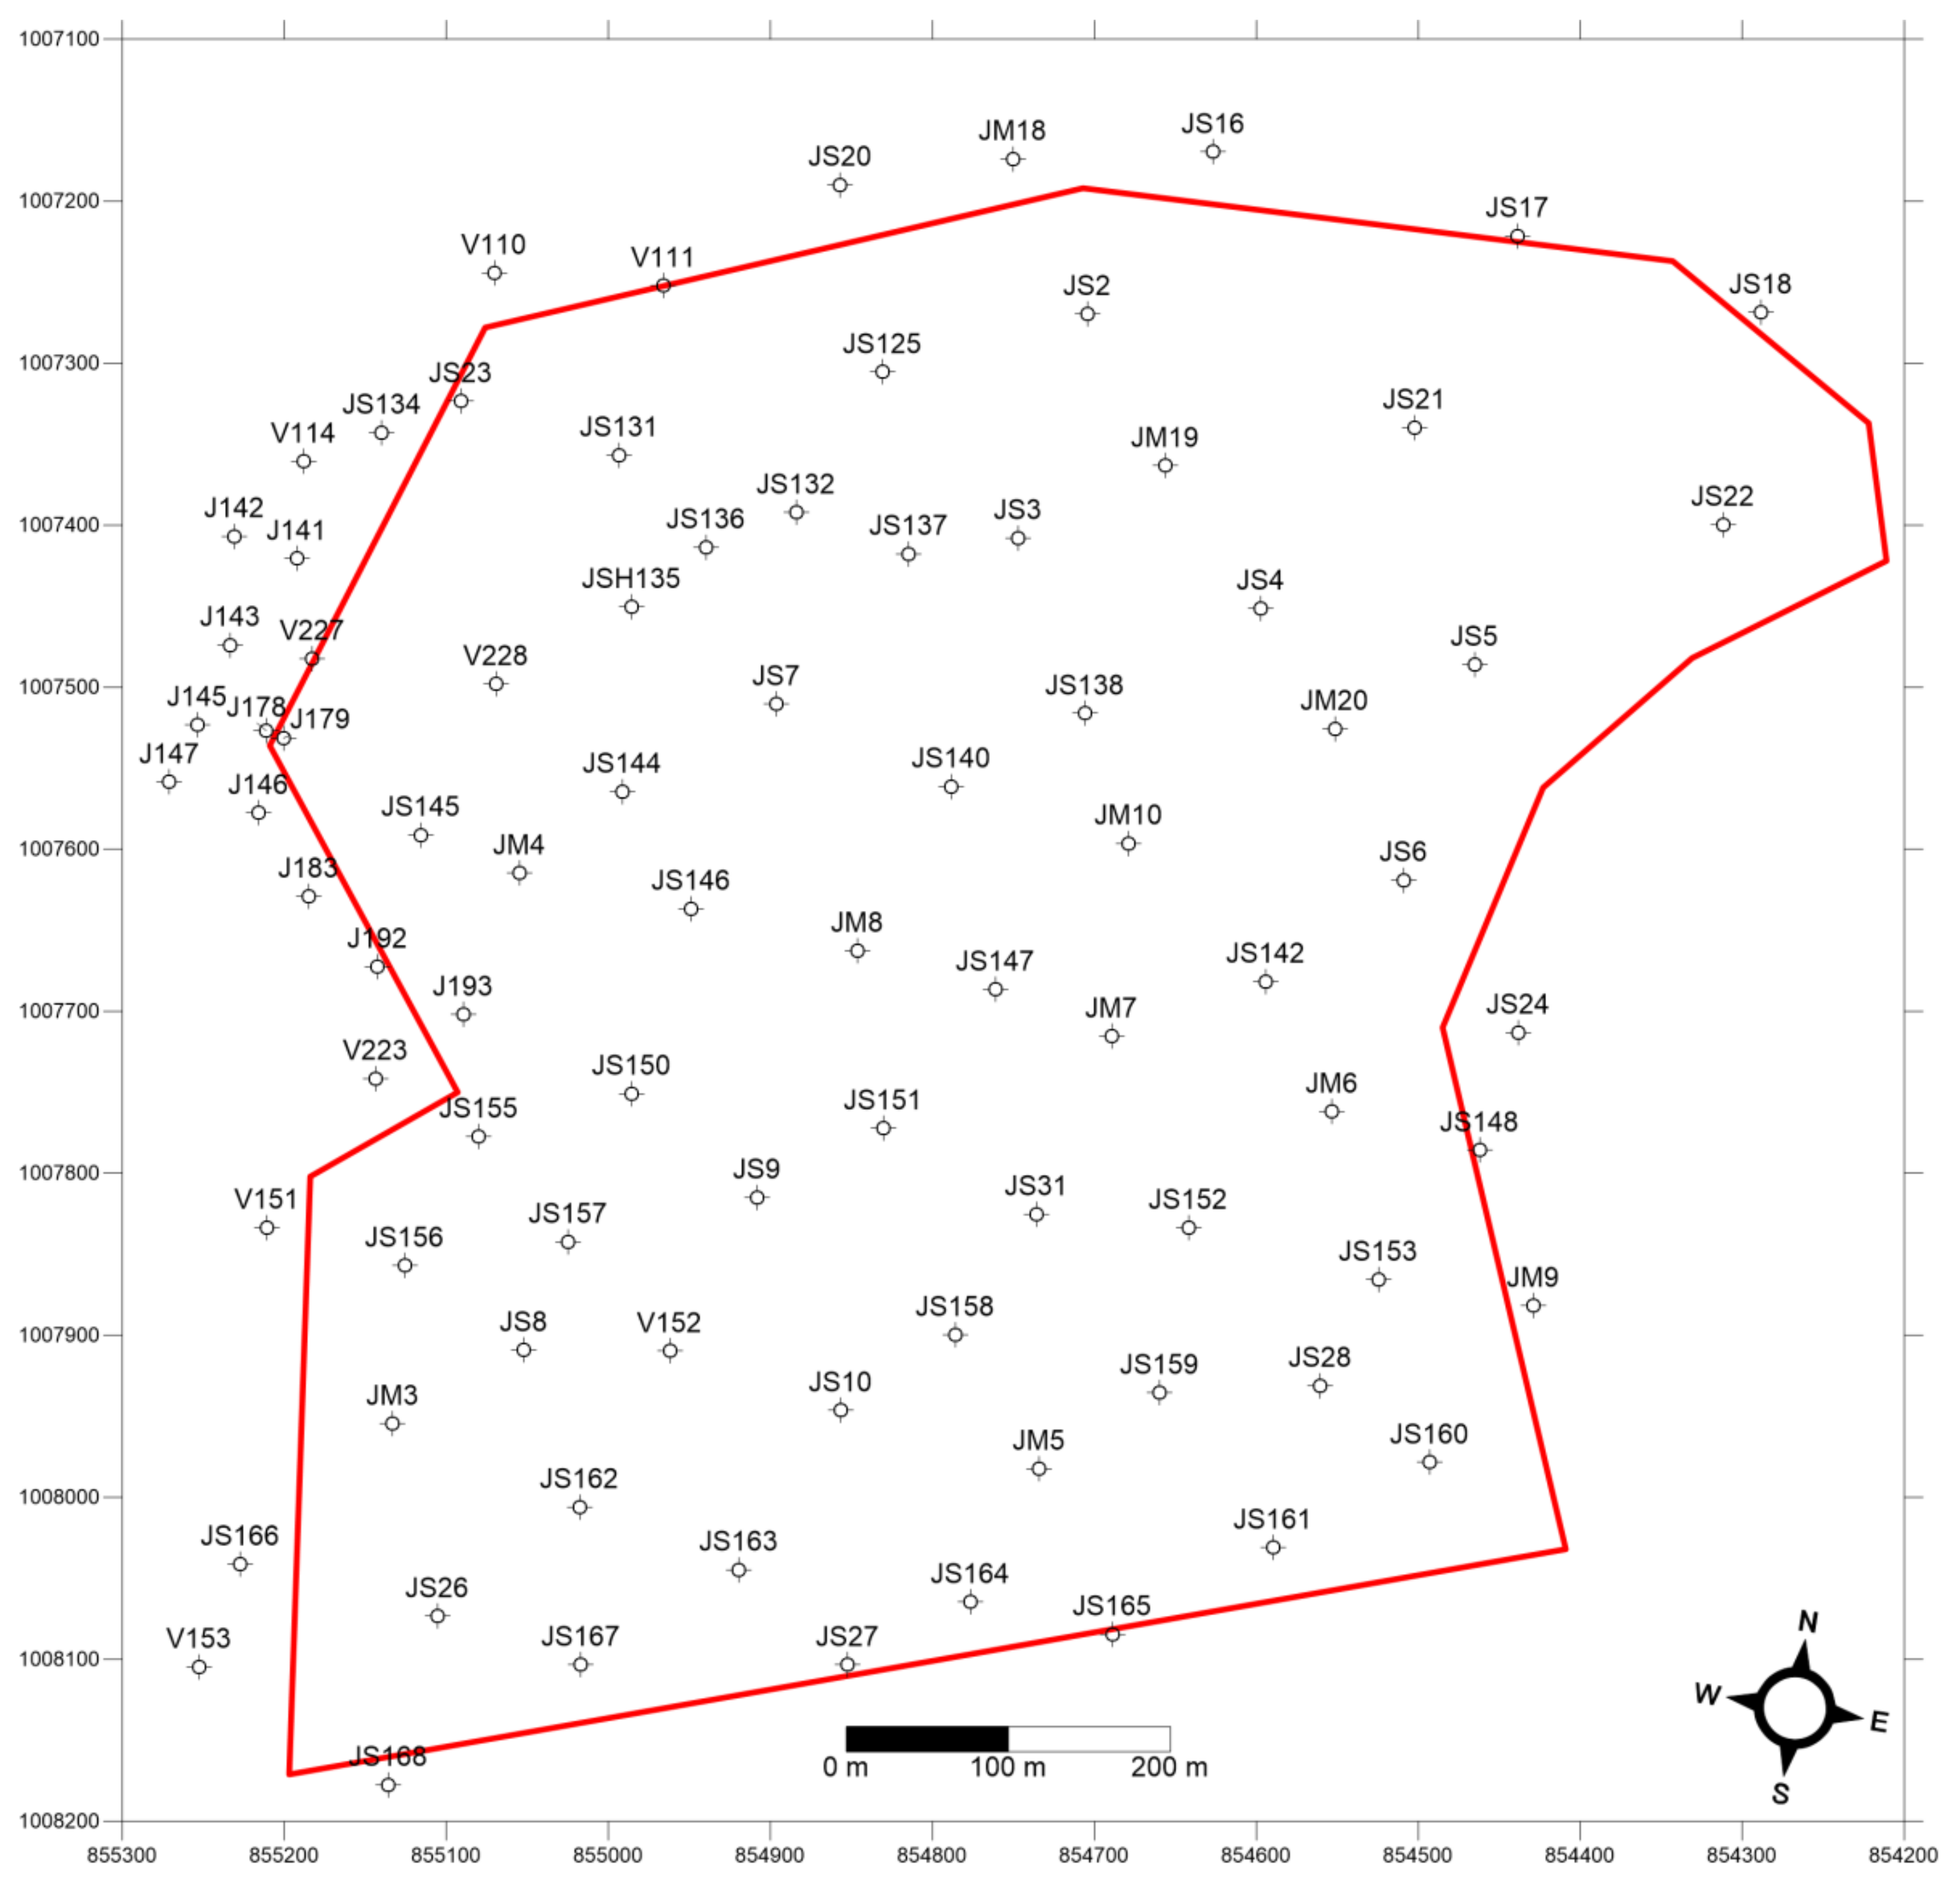
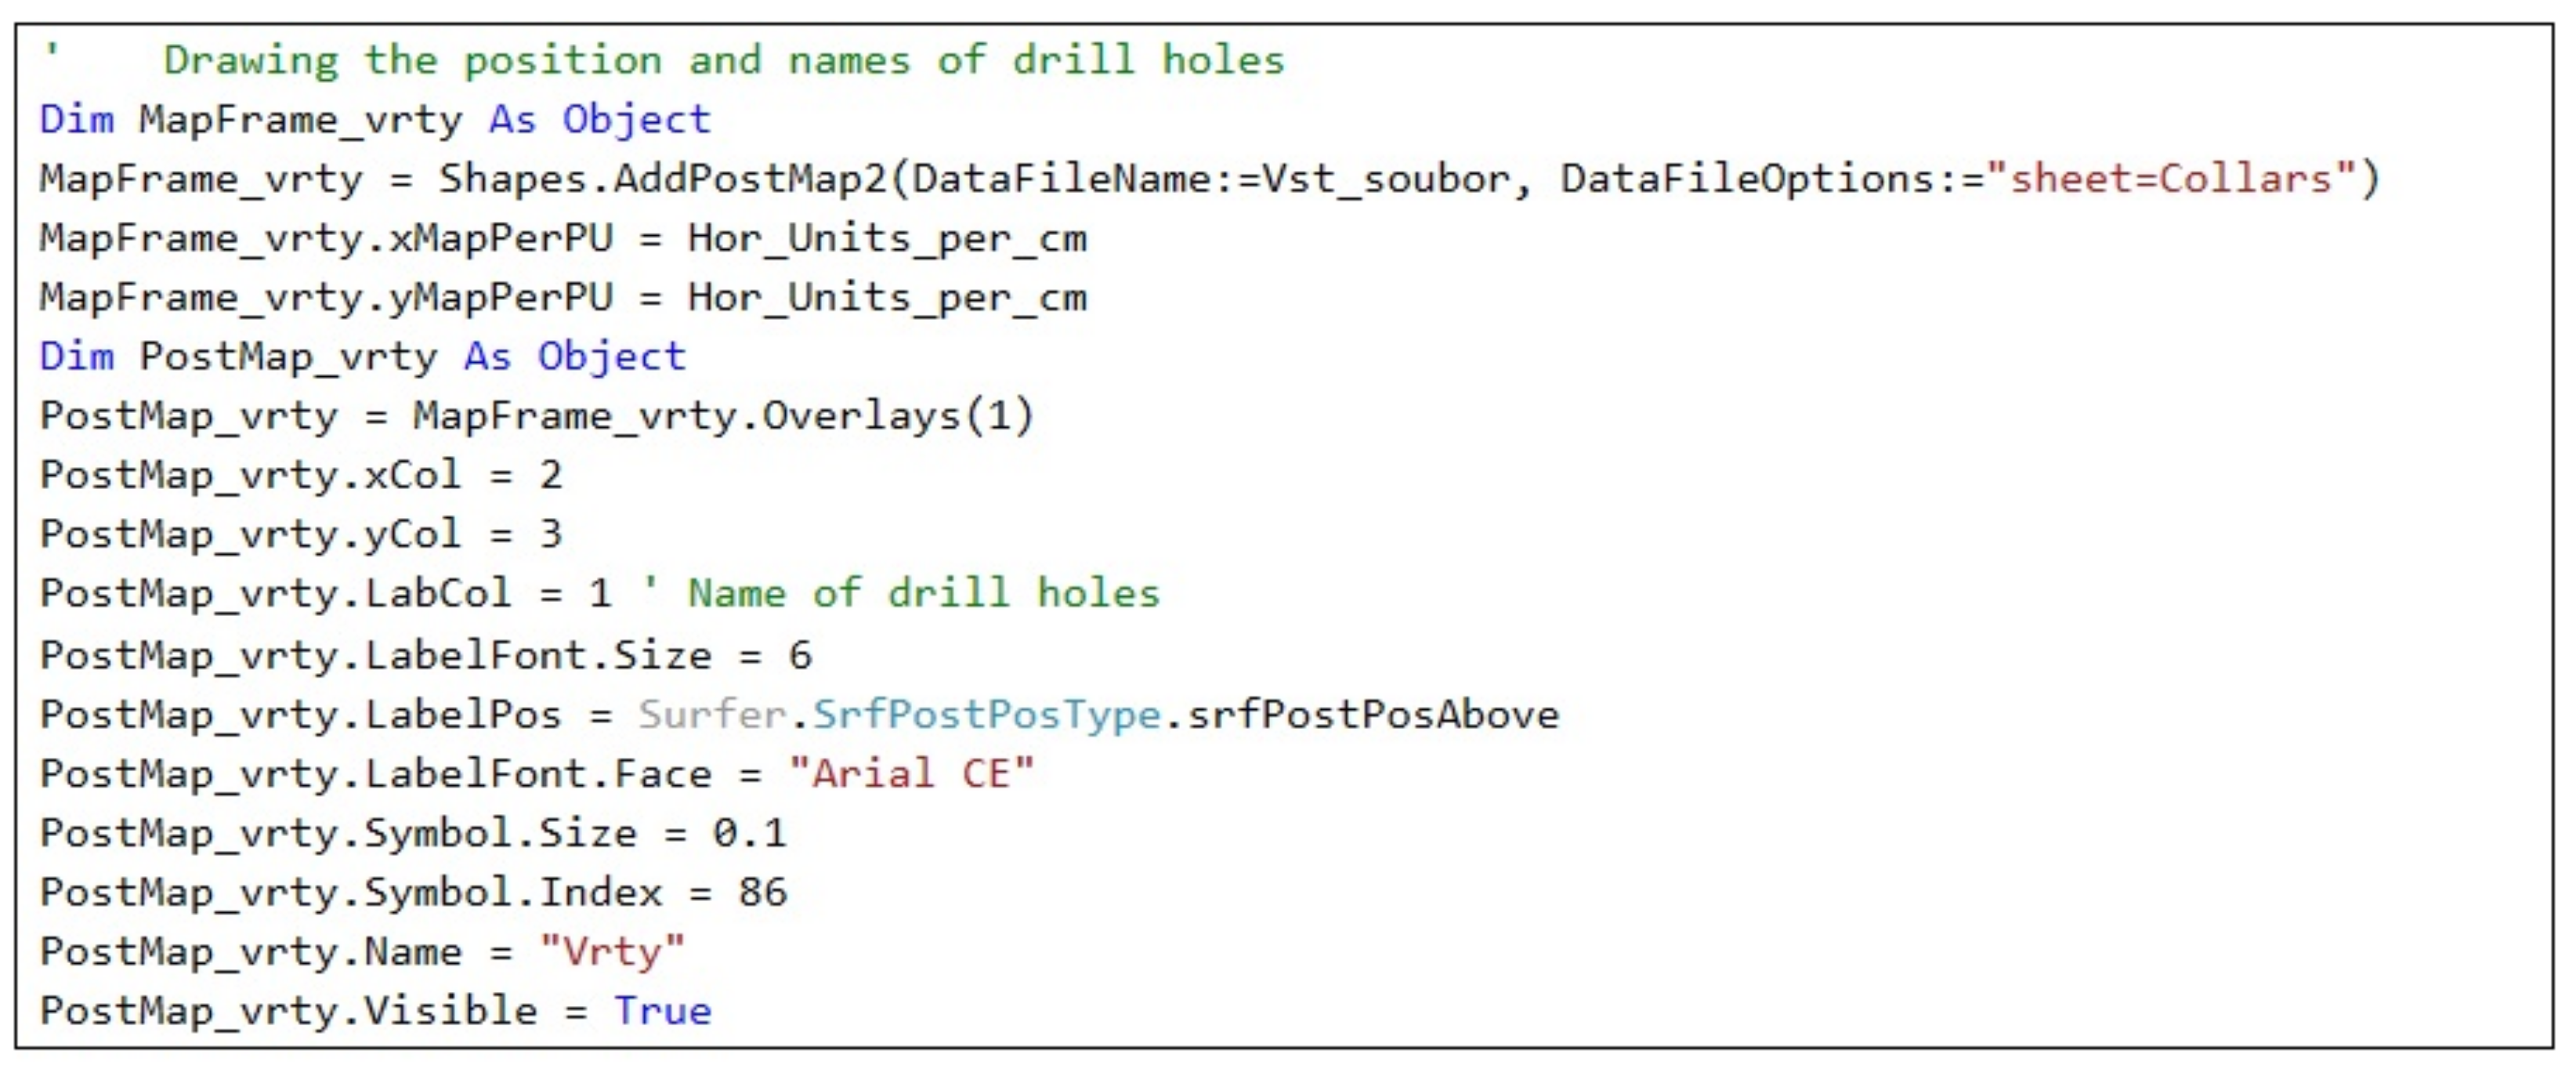
  • Verification and correction of input data. Verification and correction of the input data are performed by the comparison of the data with information from archive reports using the visualization (in 2D and 3D), and the comparison with the corresponding archive horizontal and vertical sections (see Step 1). In the case of our example of the kaolin deposit Jimlíkov–East, many errors in the data were found. The sources of these errors are various. However, most of them were caused by typographical mistakes during the digitalization process. The calculation includes corrected data from 85 exploration drill holes (Figure 2) and 1098 analyzed samples, for which the categories (classes) of the reserves according to Table 1 were calculated with respect to the content of kaolin outwash, Al2O3, Fe2O3, and TiO2.
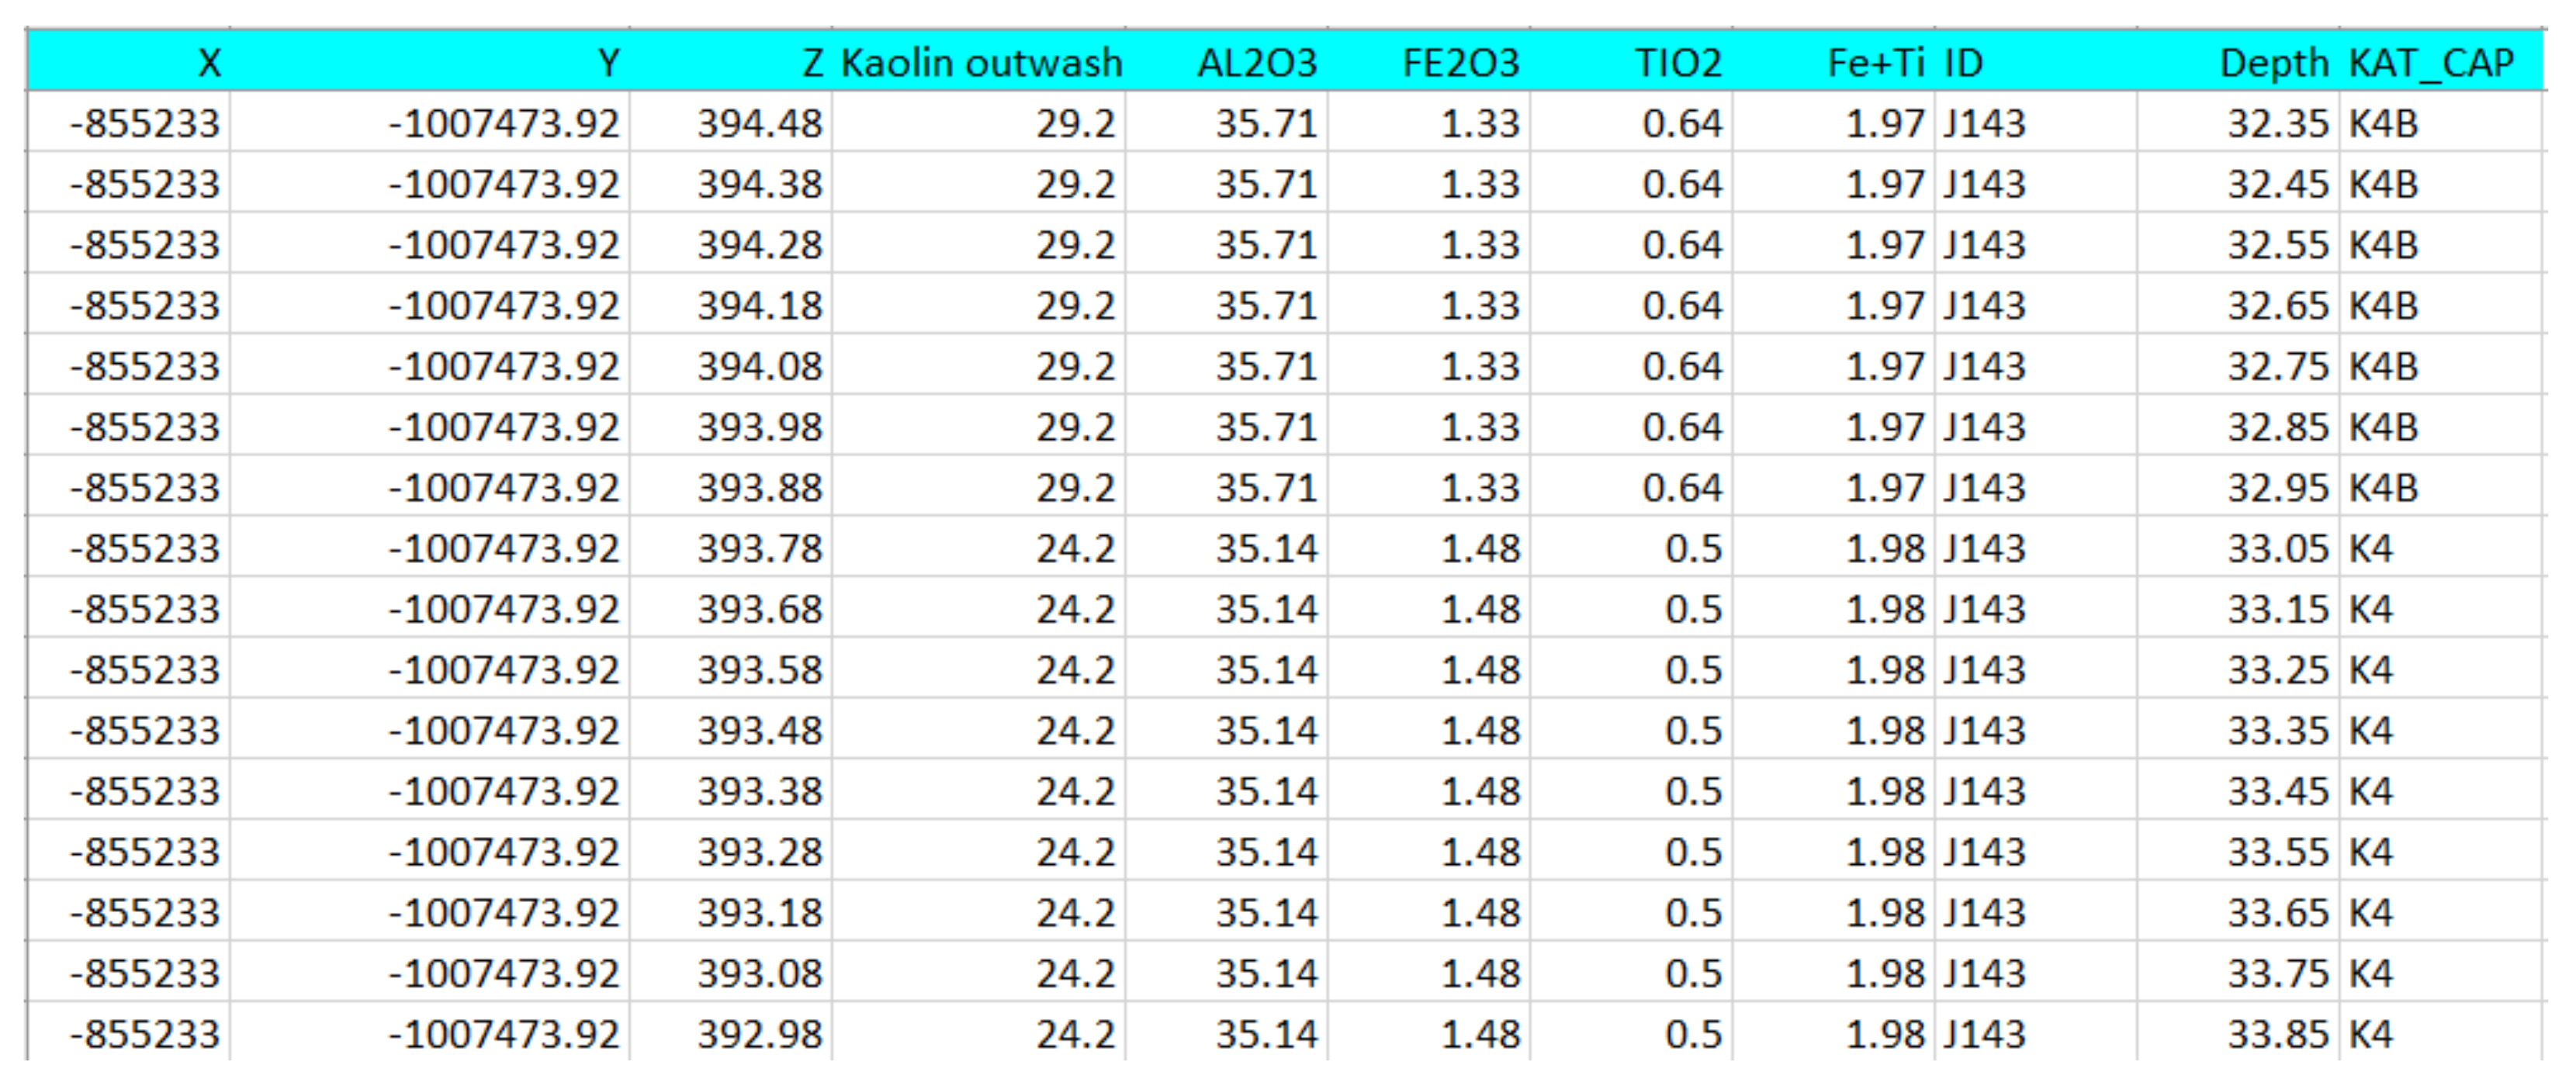
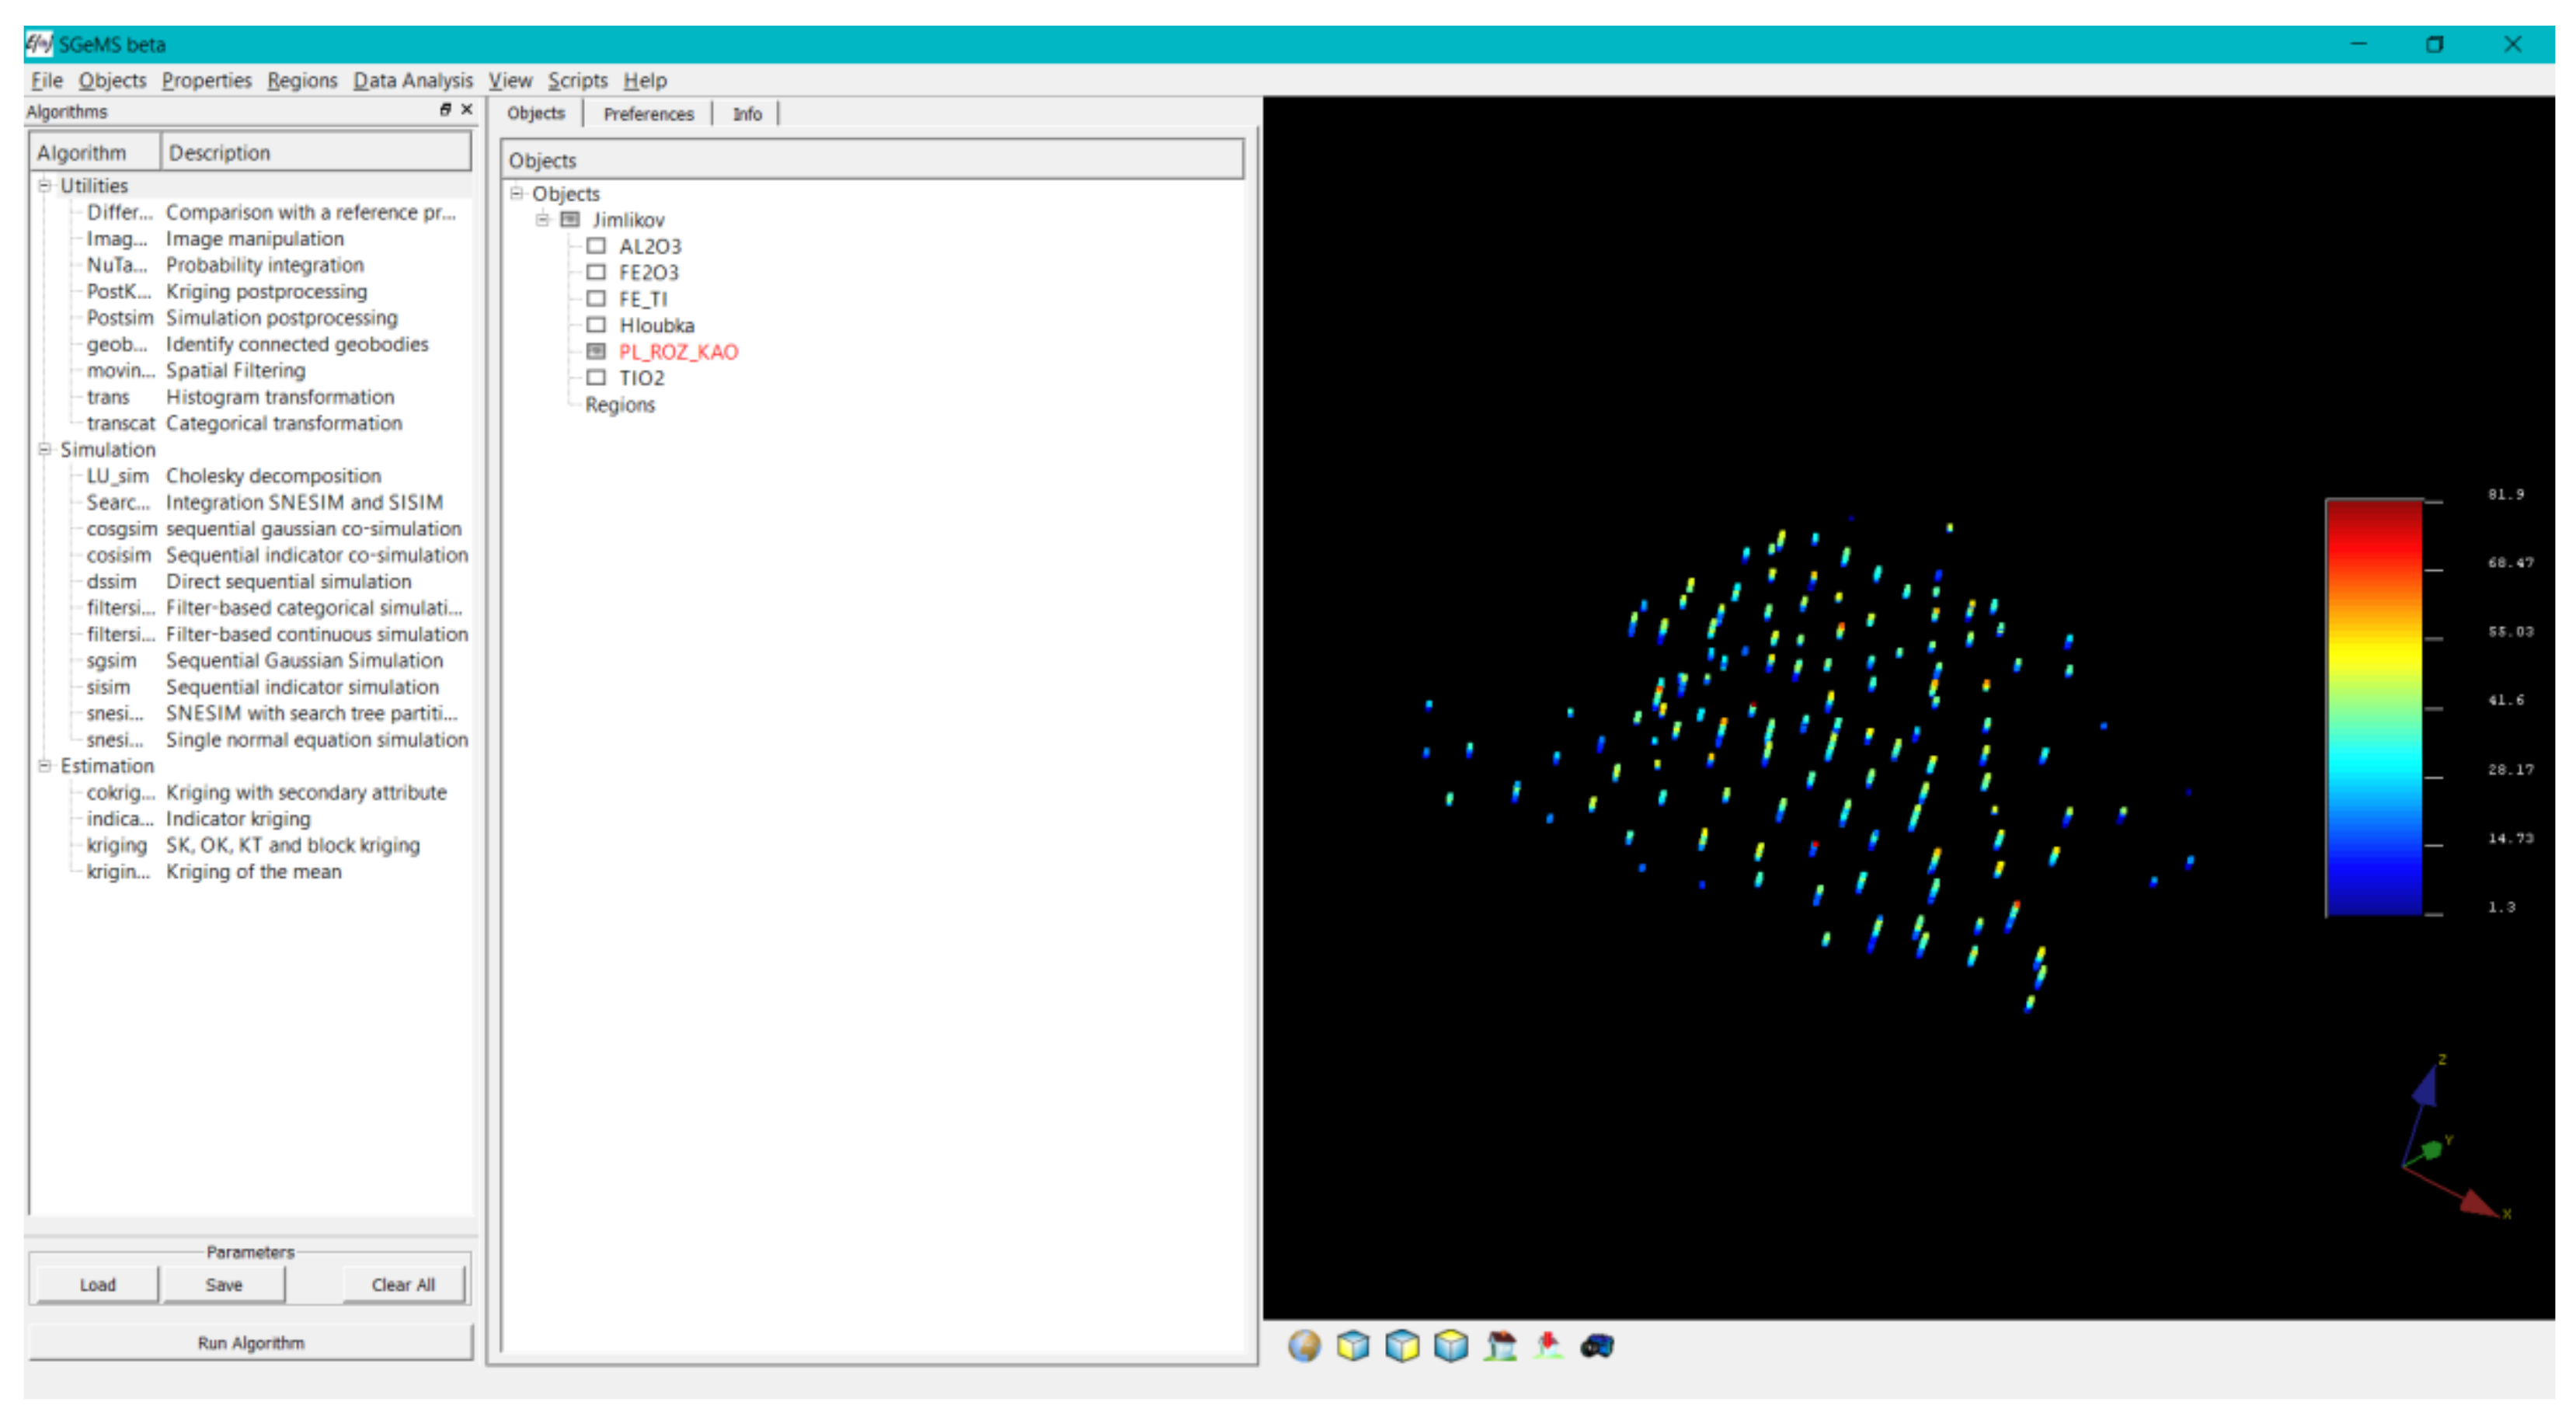
  • Calculation and visualization of spatial localization of the input data. Corrected and completed input data (geometric parameters of prospect holes and samples with the content of technological parameters) are divided into 10 cm sections using the created macro in a such a way that the data have the same carrier (in total 21,209), spatially located in the center of each section. The file of necessary data is created as a source for further processing (Figure 3): horizontal and vertical sections for statistical analyses, gridding, 2D and 3D visualization, etc. Another created macro converts the necessary data to the format GSLIB [29] for the processing program SGeMS. After the import into the environment SGeMS [22], these data can be visualized (Figure 4).
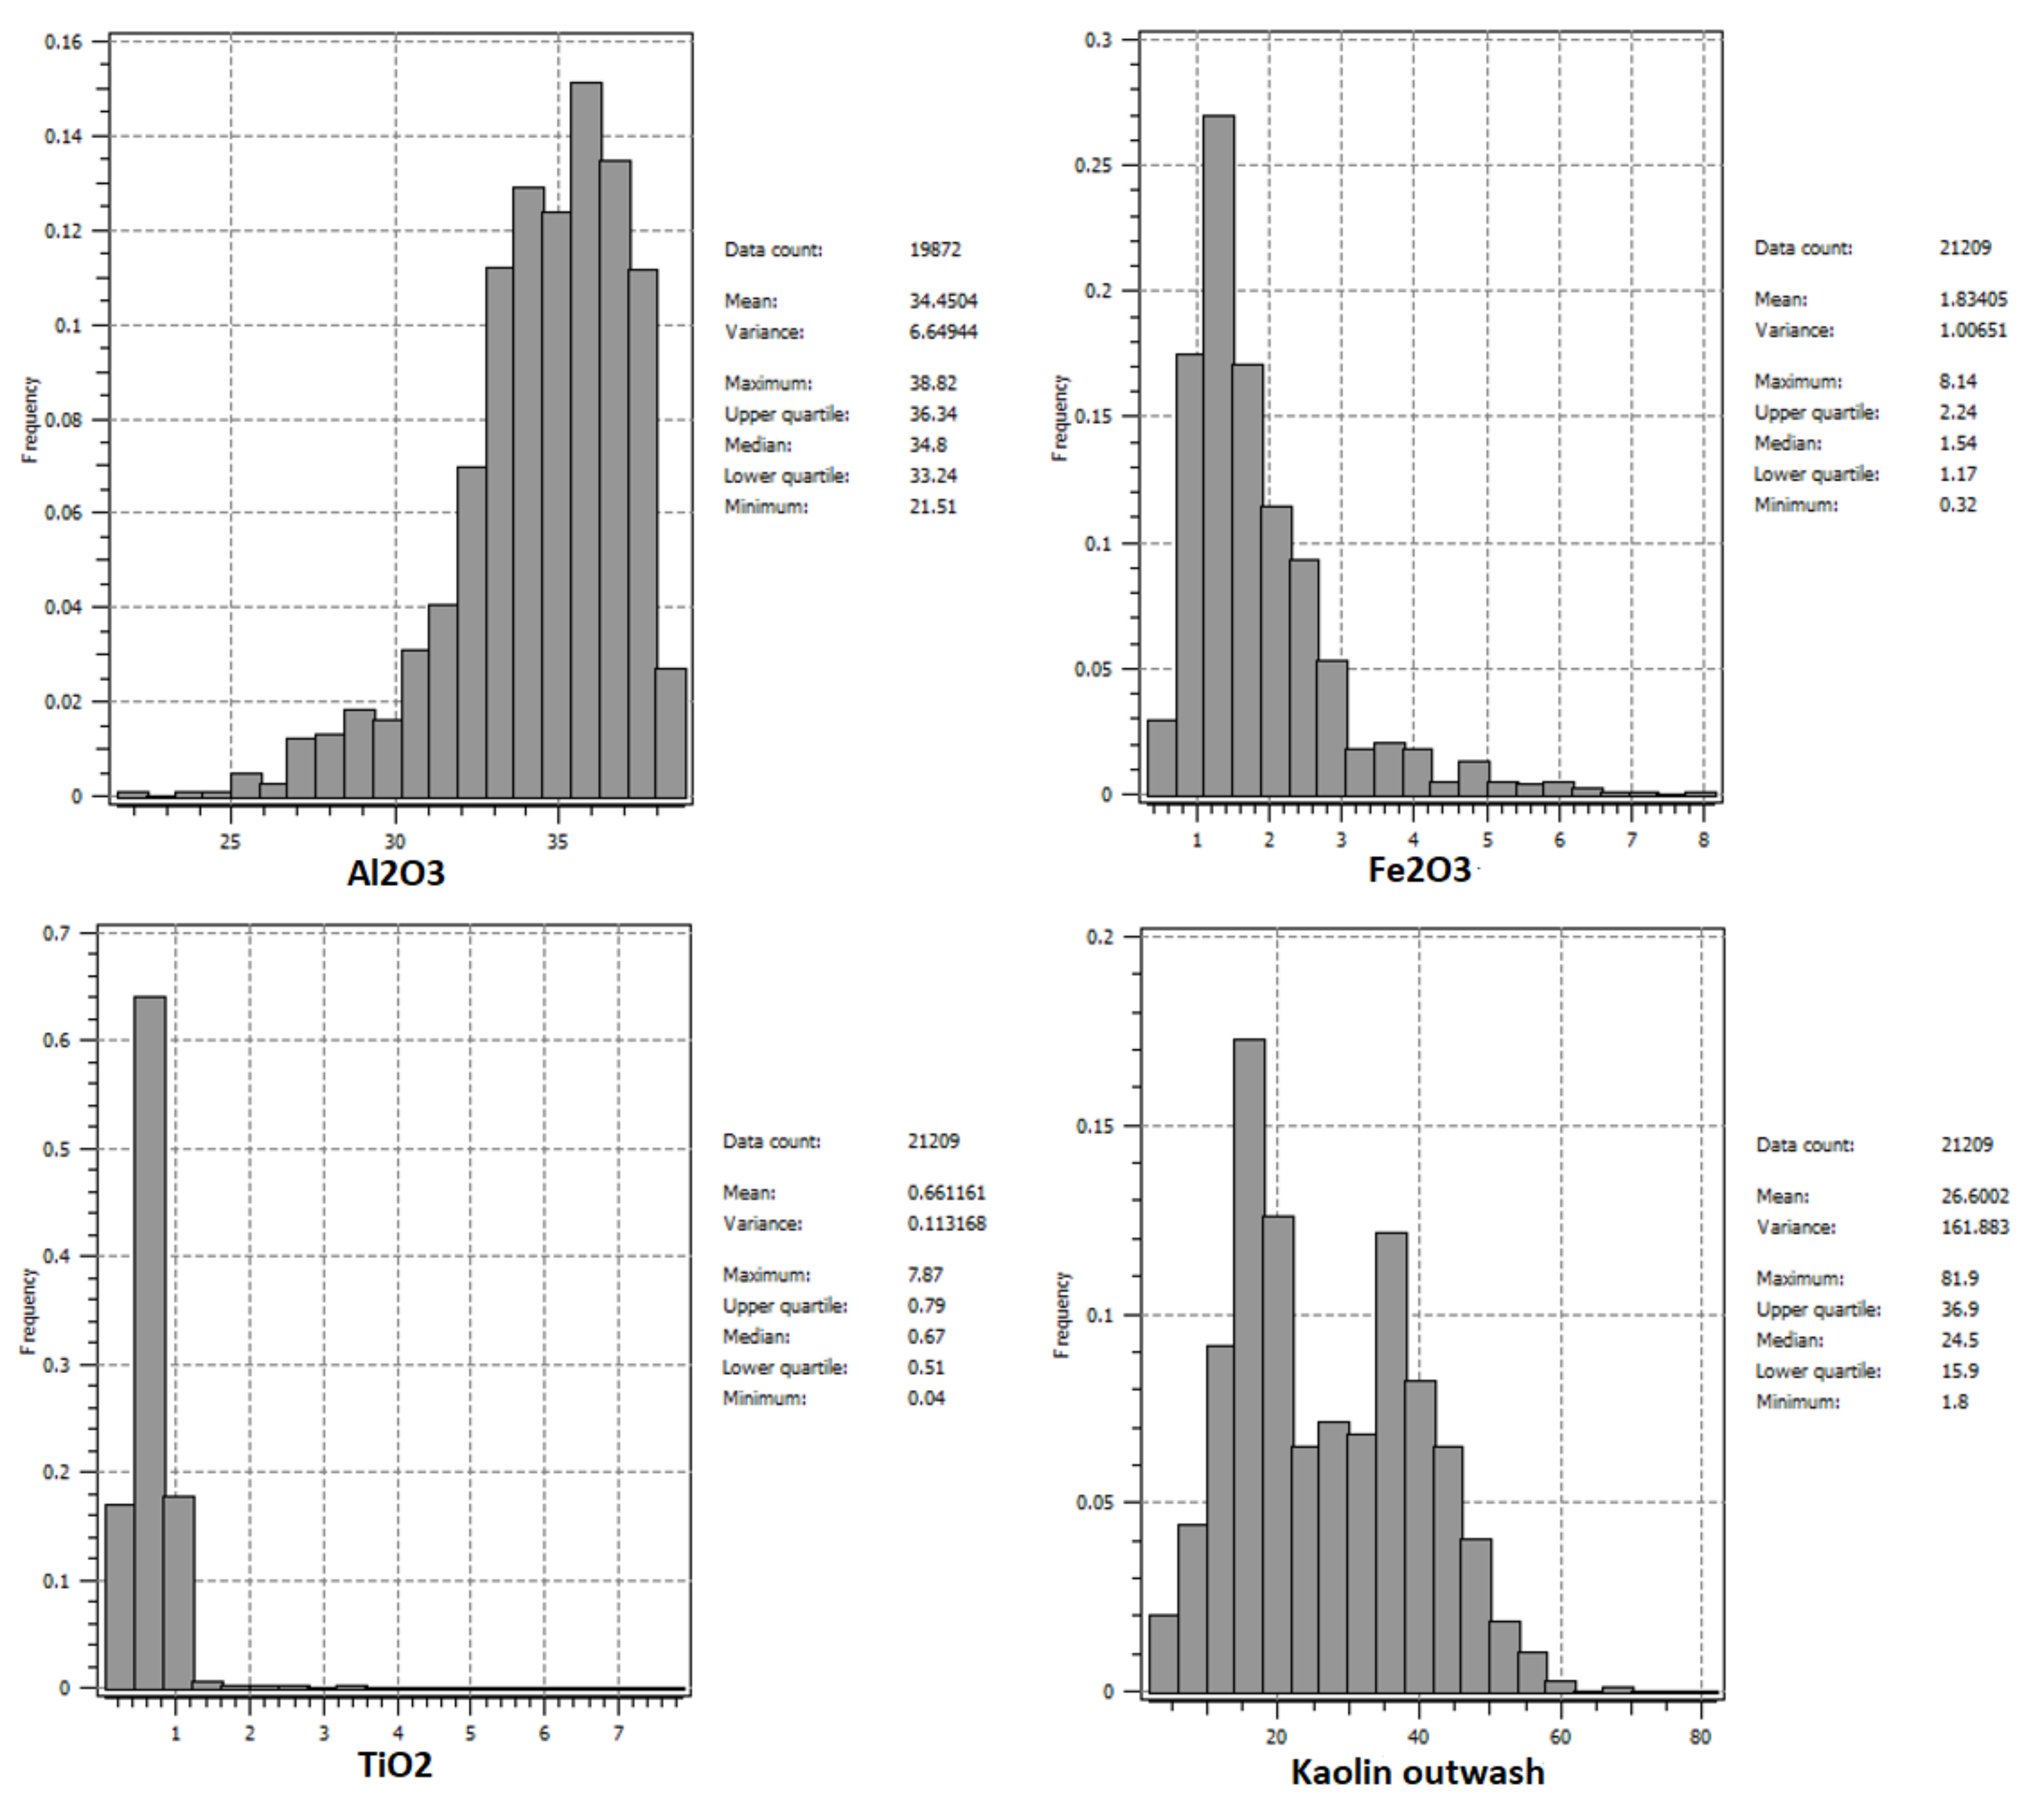
  • Statistical processing of the technological parameters. Basic statistical processing of the technological parameters is performed in the SGeMS environment [22]. An example of the output is given in Figure 5—histograms of the frequencies of individual technological parameters and their basic statistical characteristics.
  • Modelling of the bottom and the top of the kaolin deposit and overall lithology. To spatially limit the occurrence of kaolin in the model, it is necessary to model the rock interface of the deposit. Gradually, 2D grids of eight geological layers were created from the crystalline basement to the surface. Based on these 2D grids, the grids of both the bottom and top of the kaolin occurrence were created. These two grids bound the 3D model of the deposit. During mining, it will be necessary to regularly update the grid of the top of the kaolin occurrence.
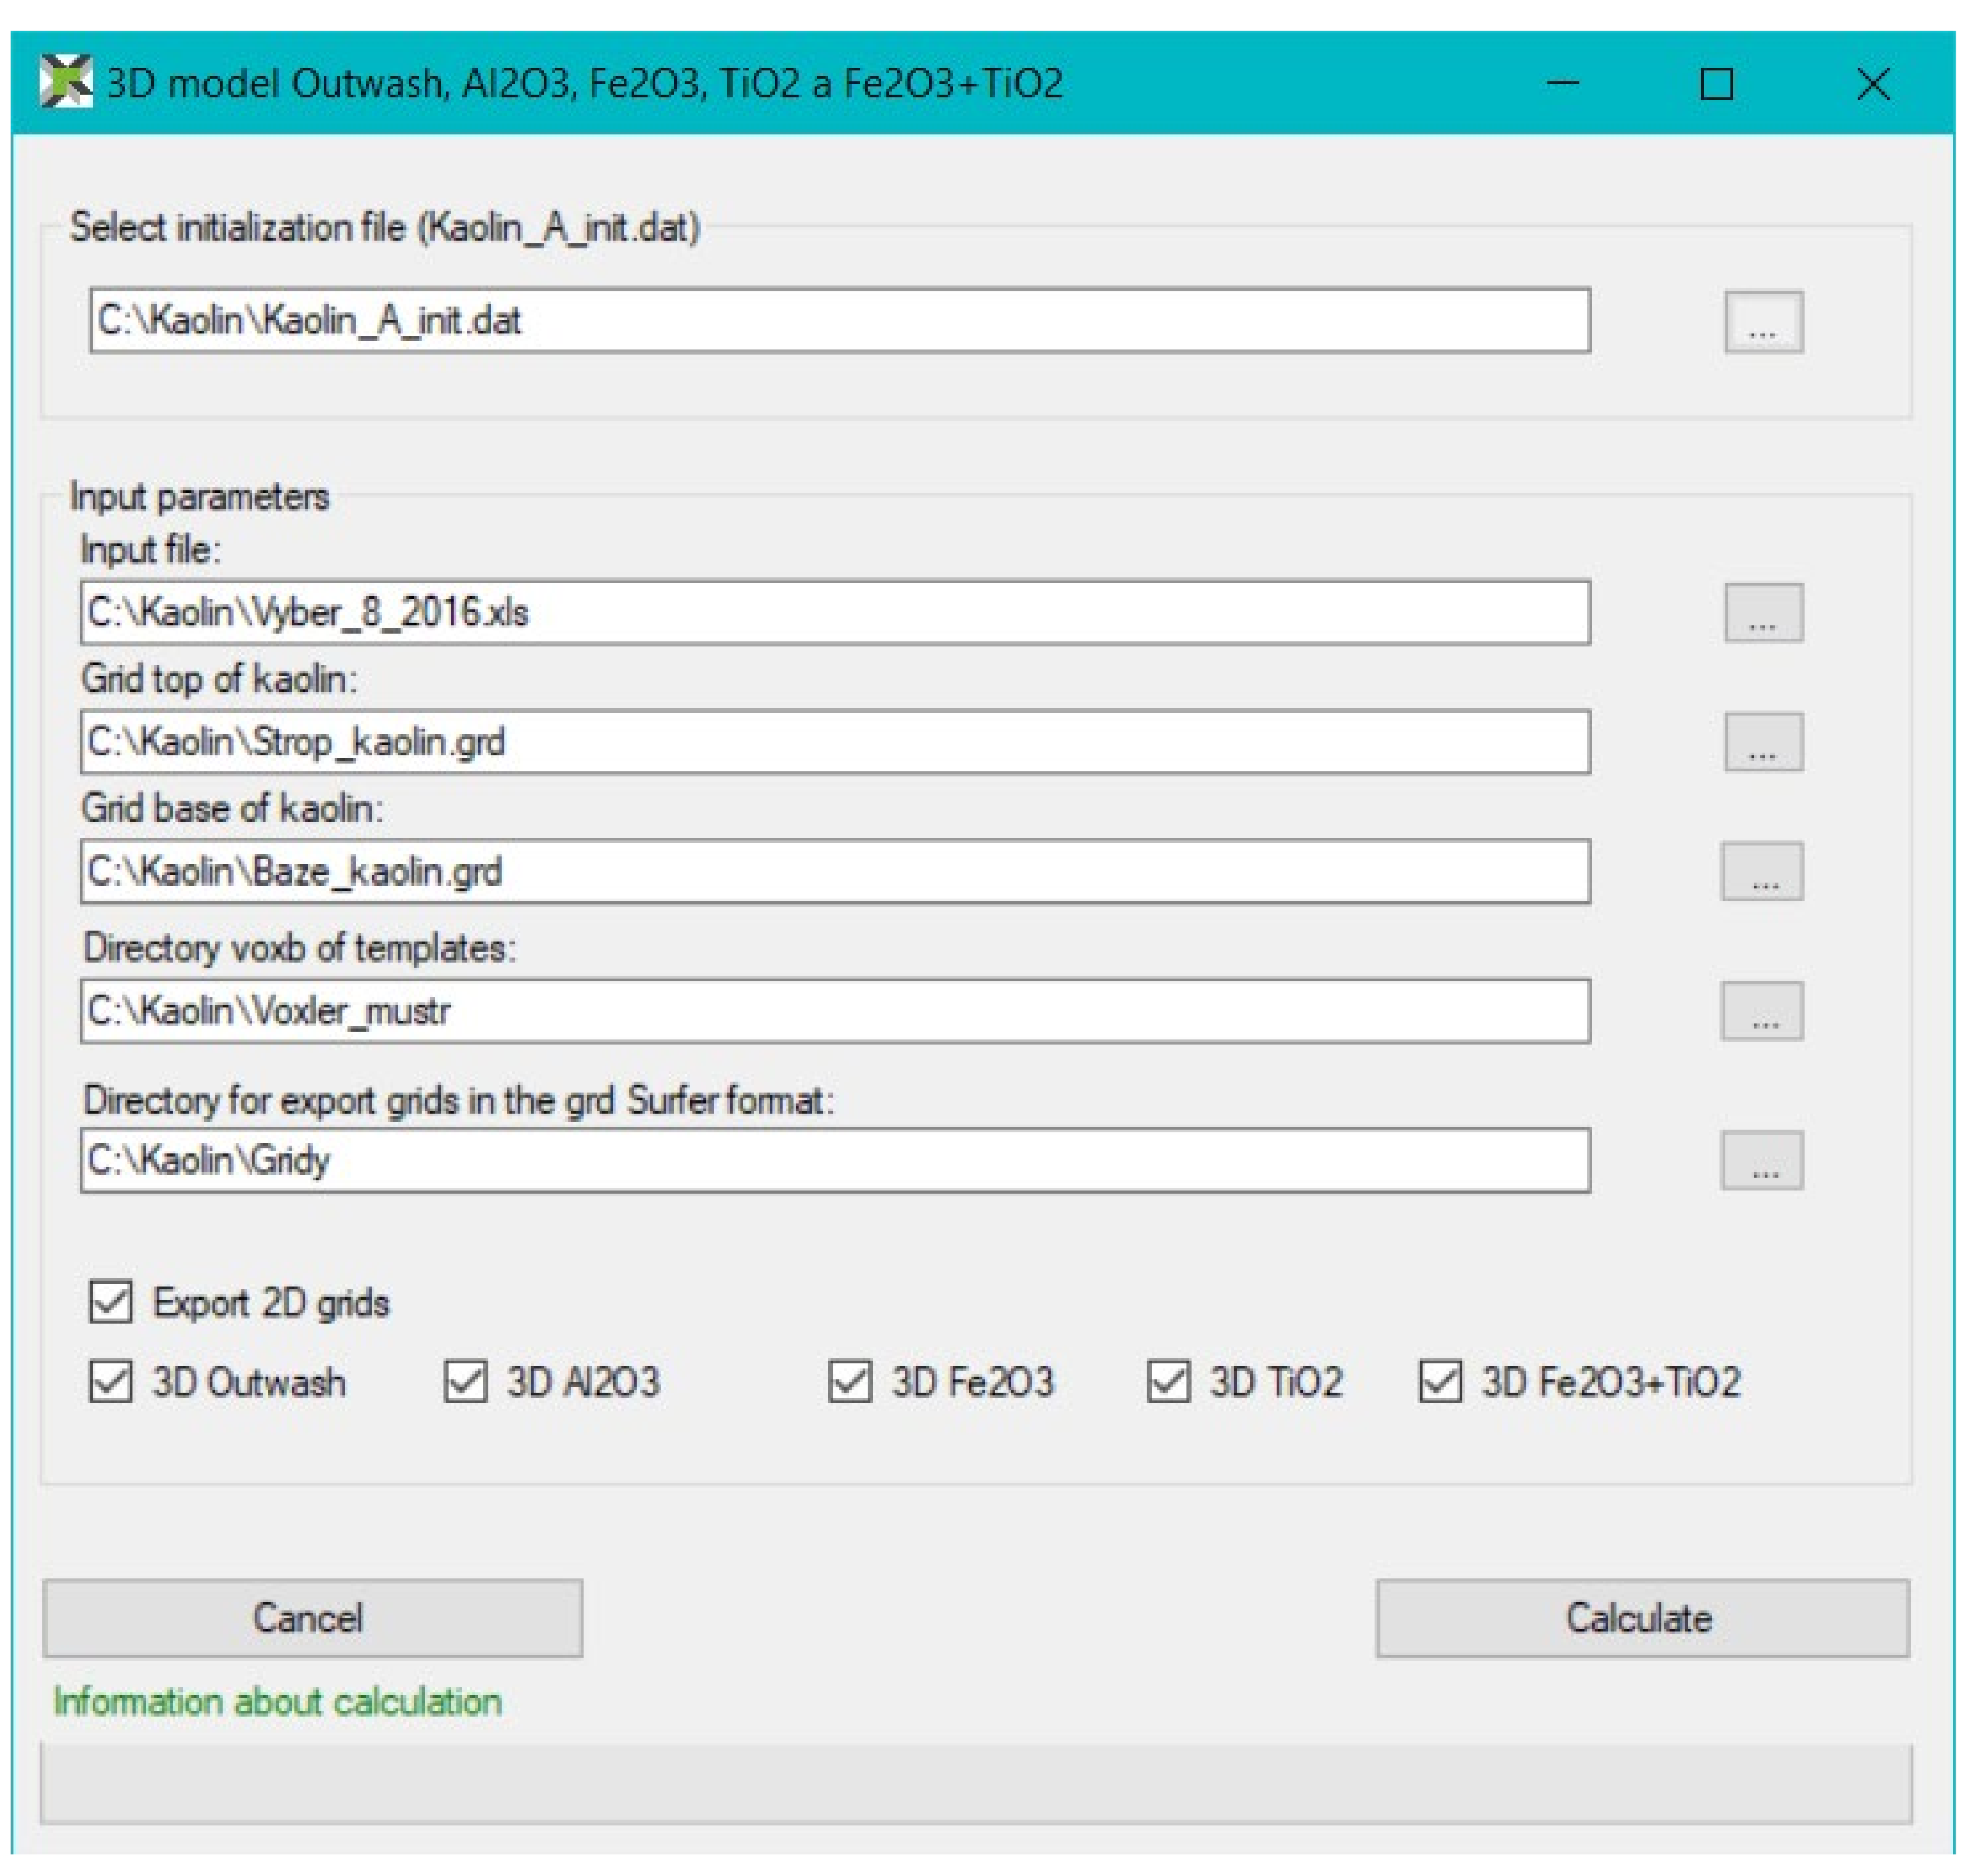
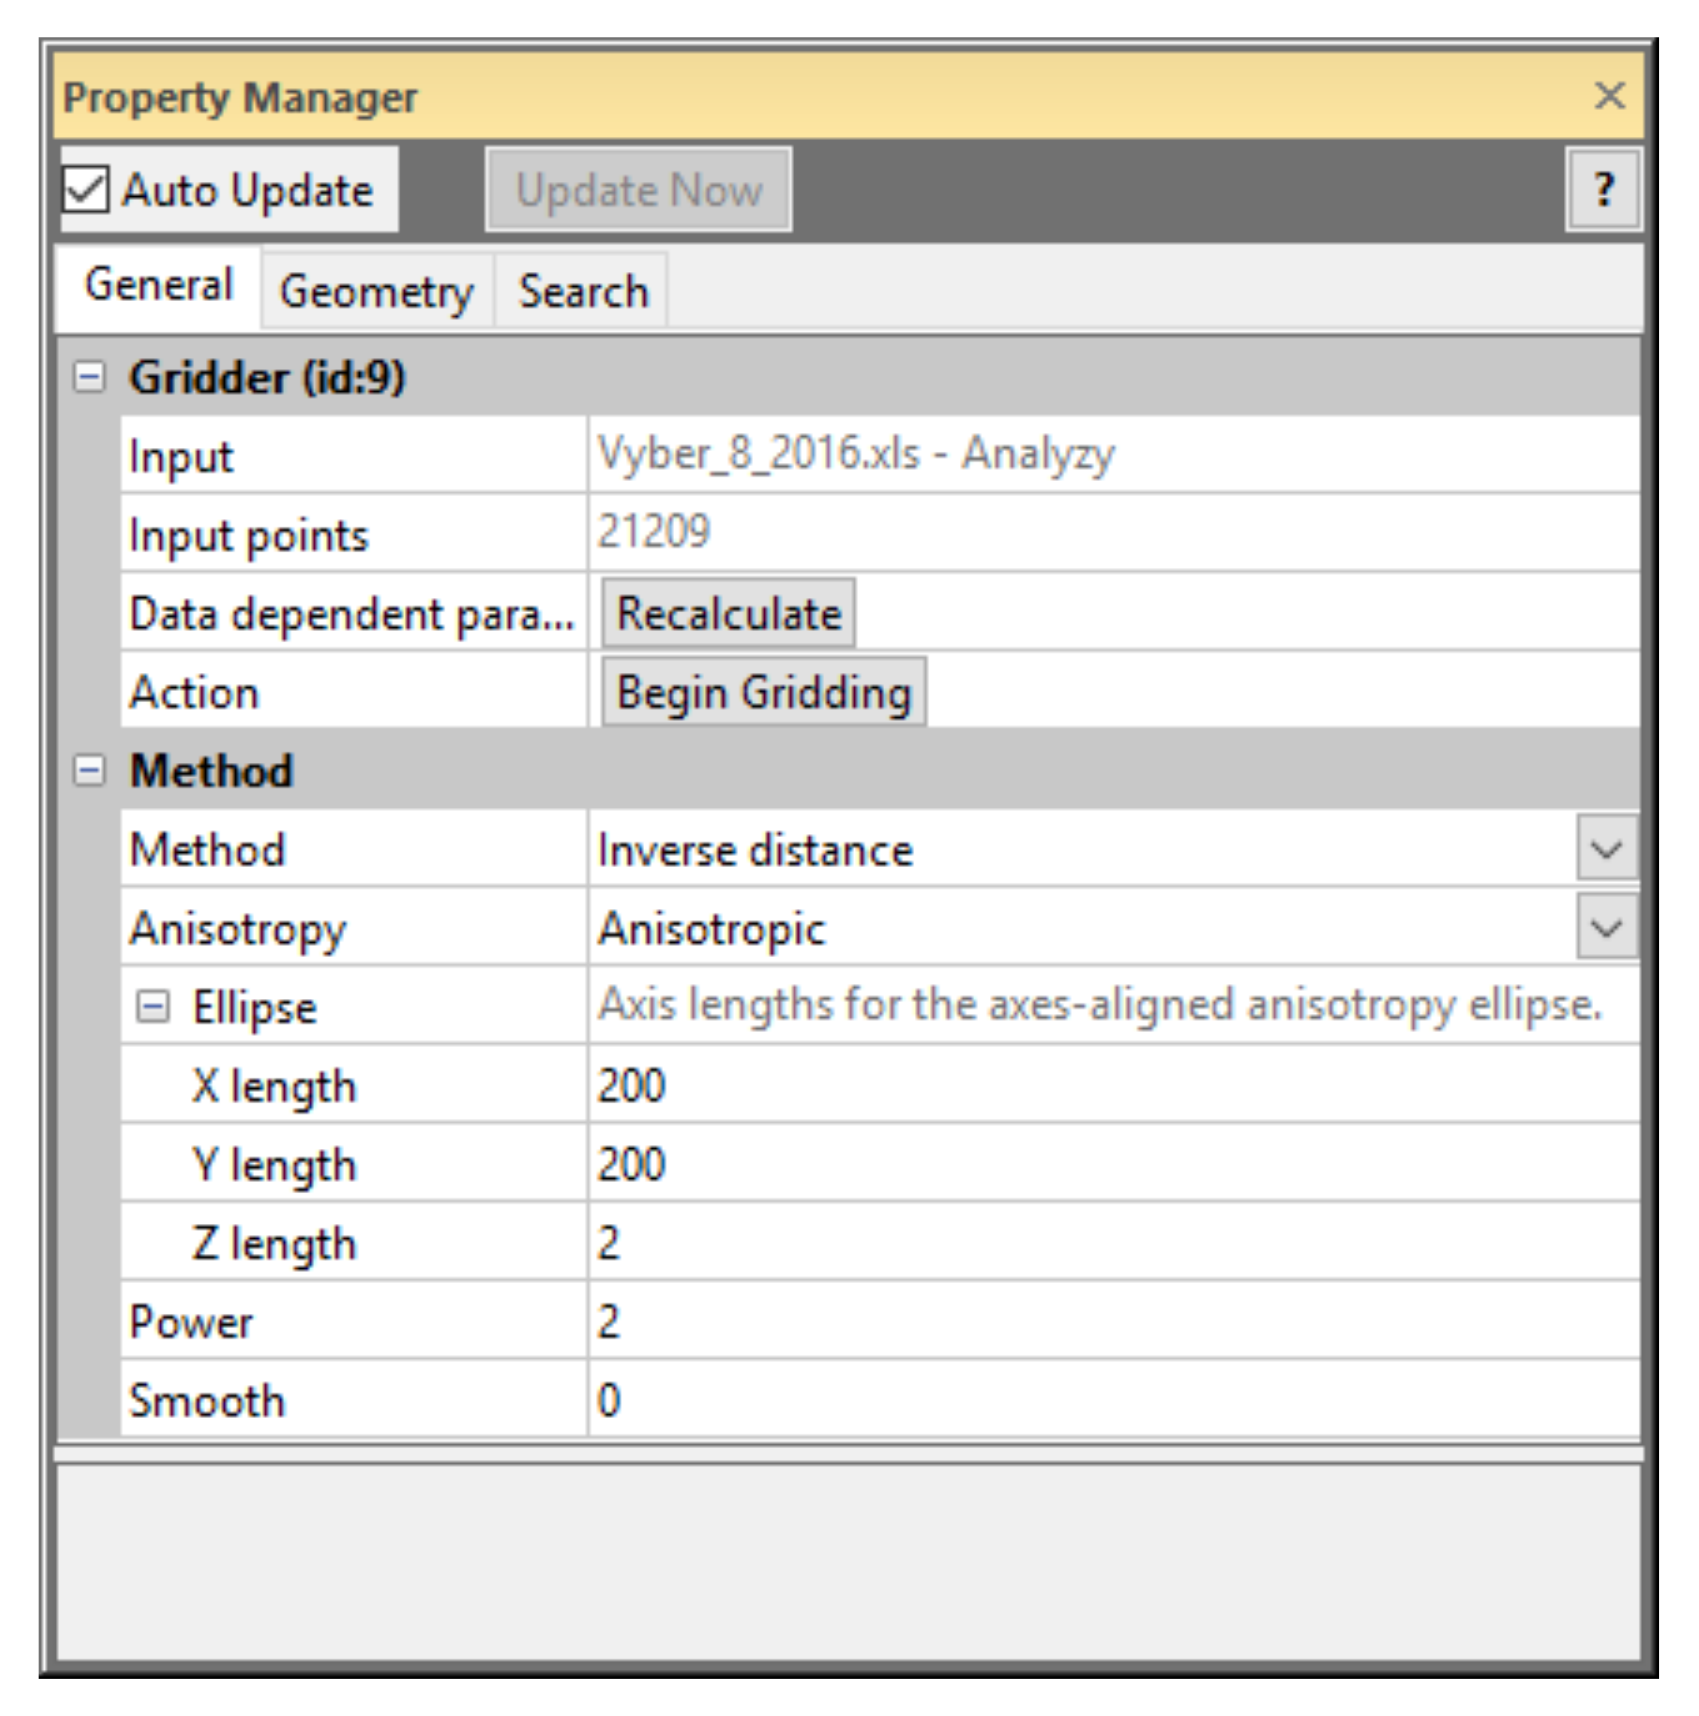
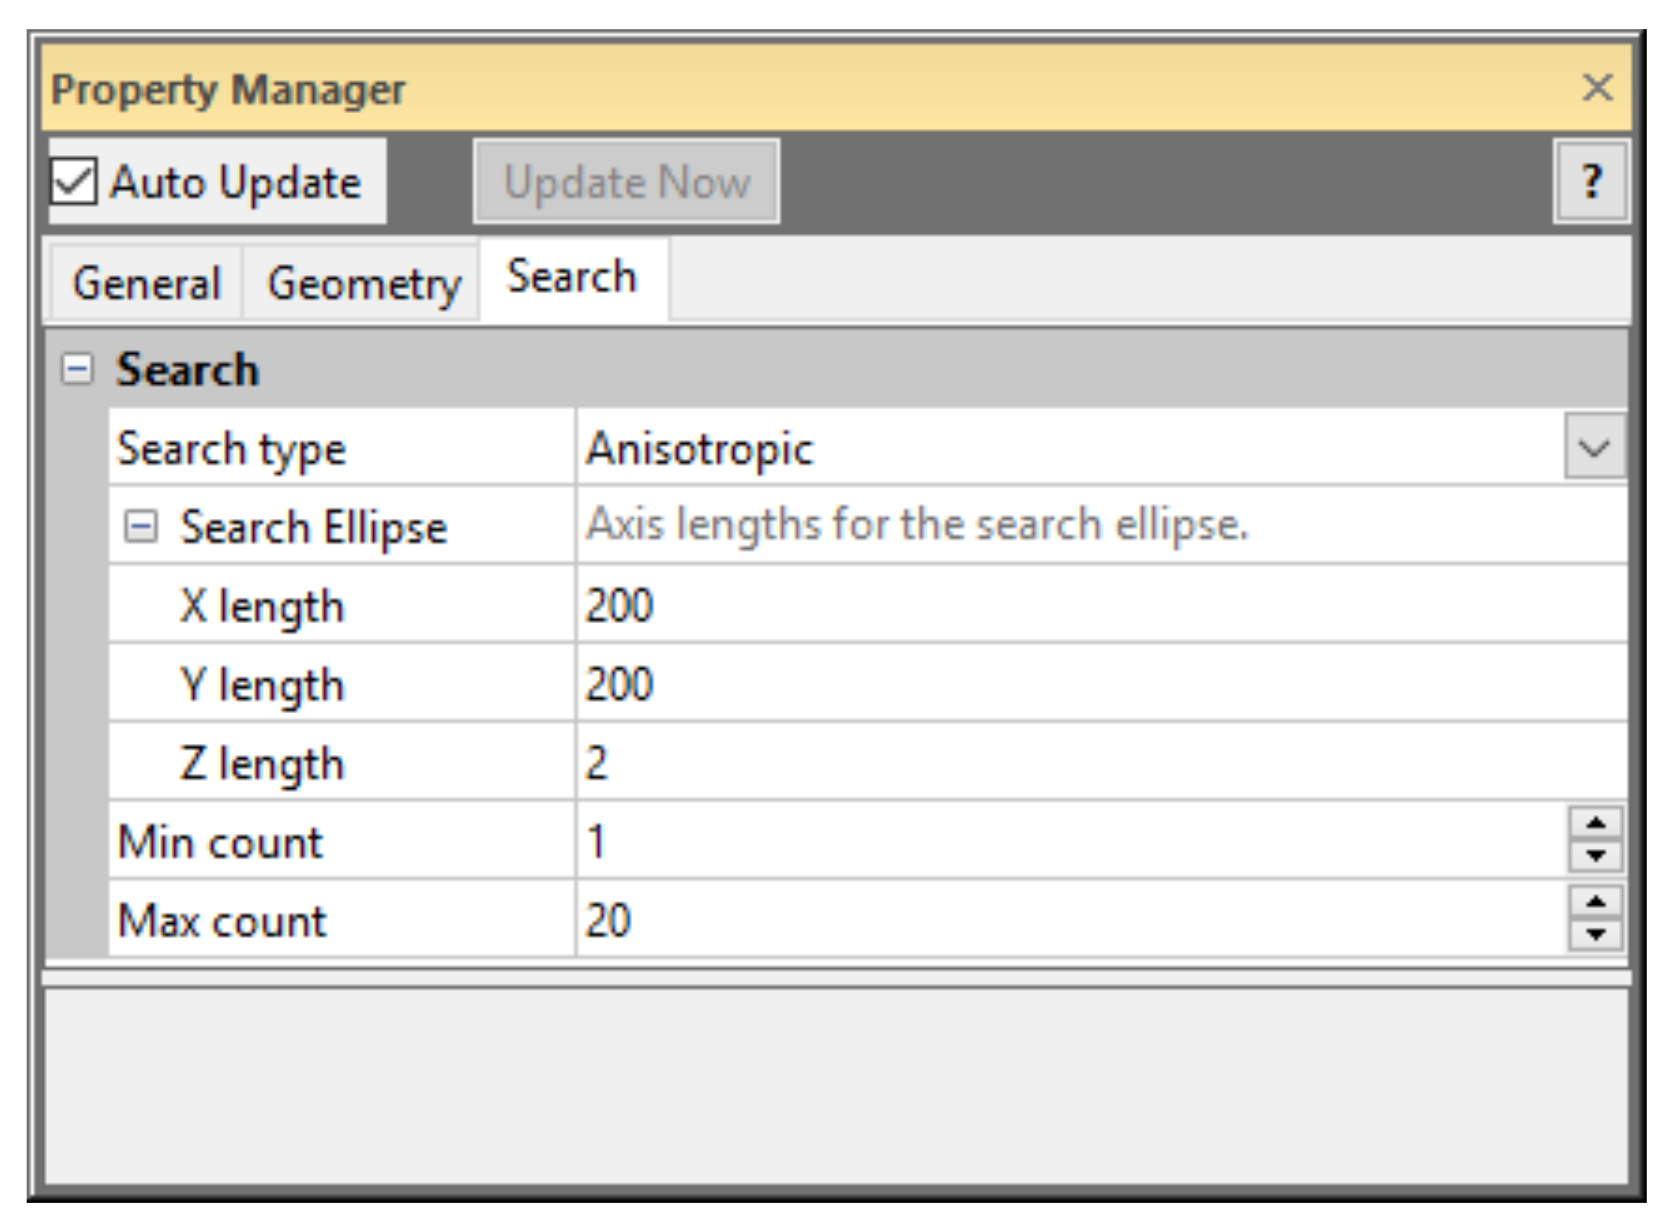
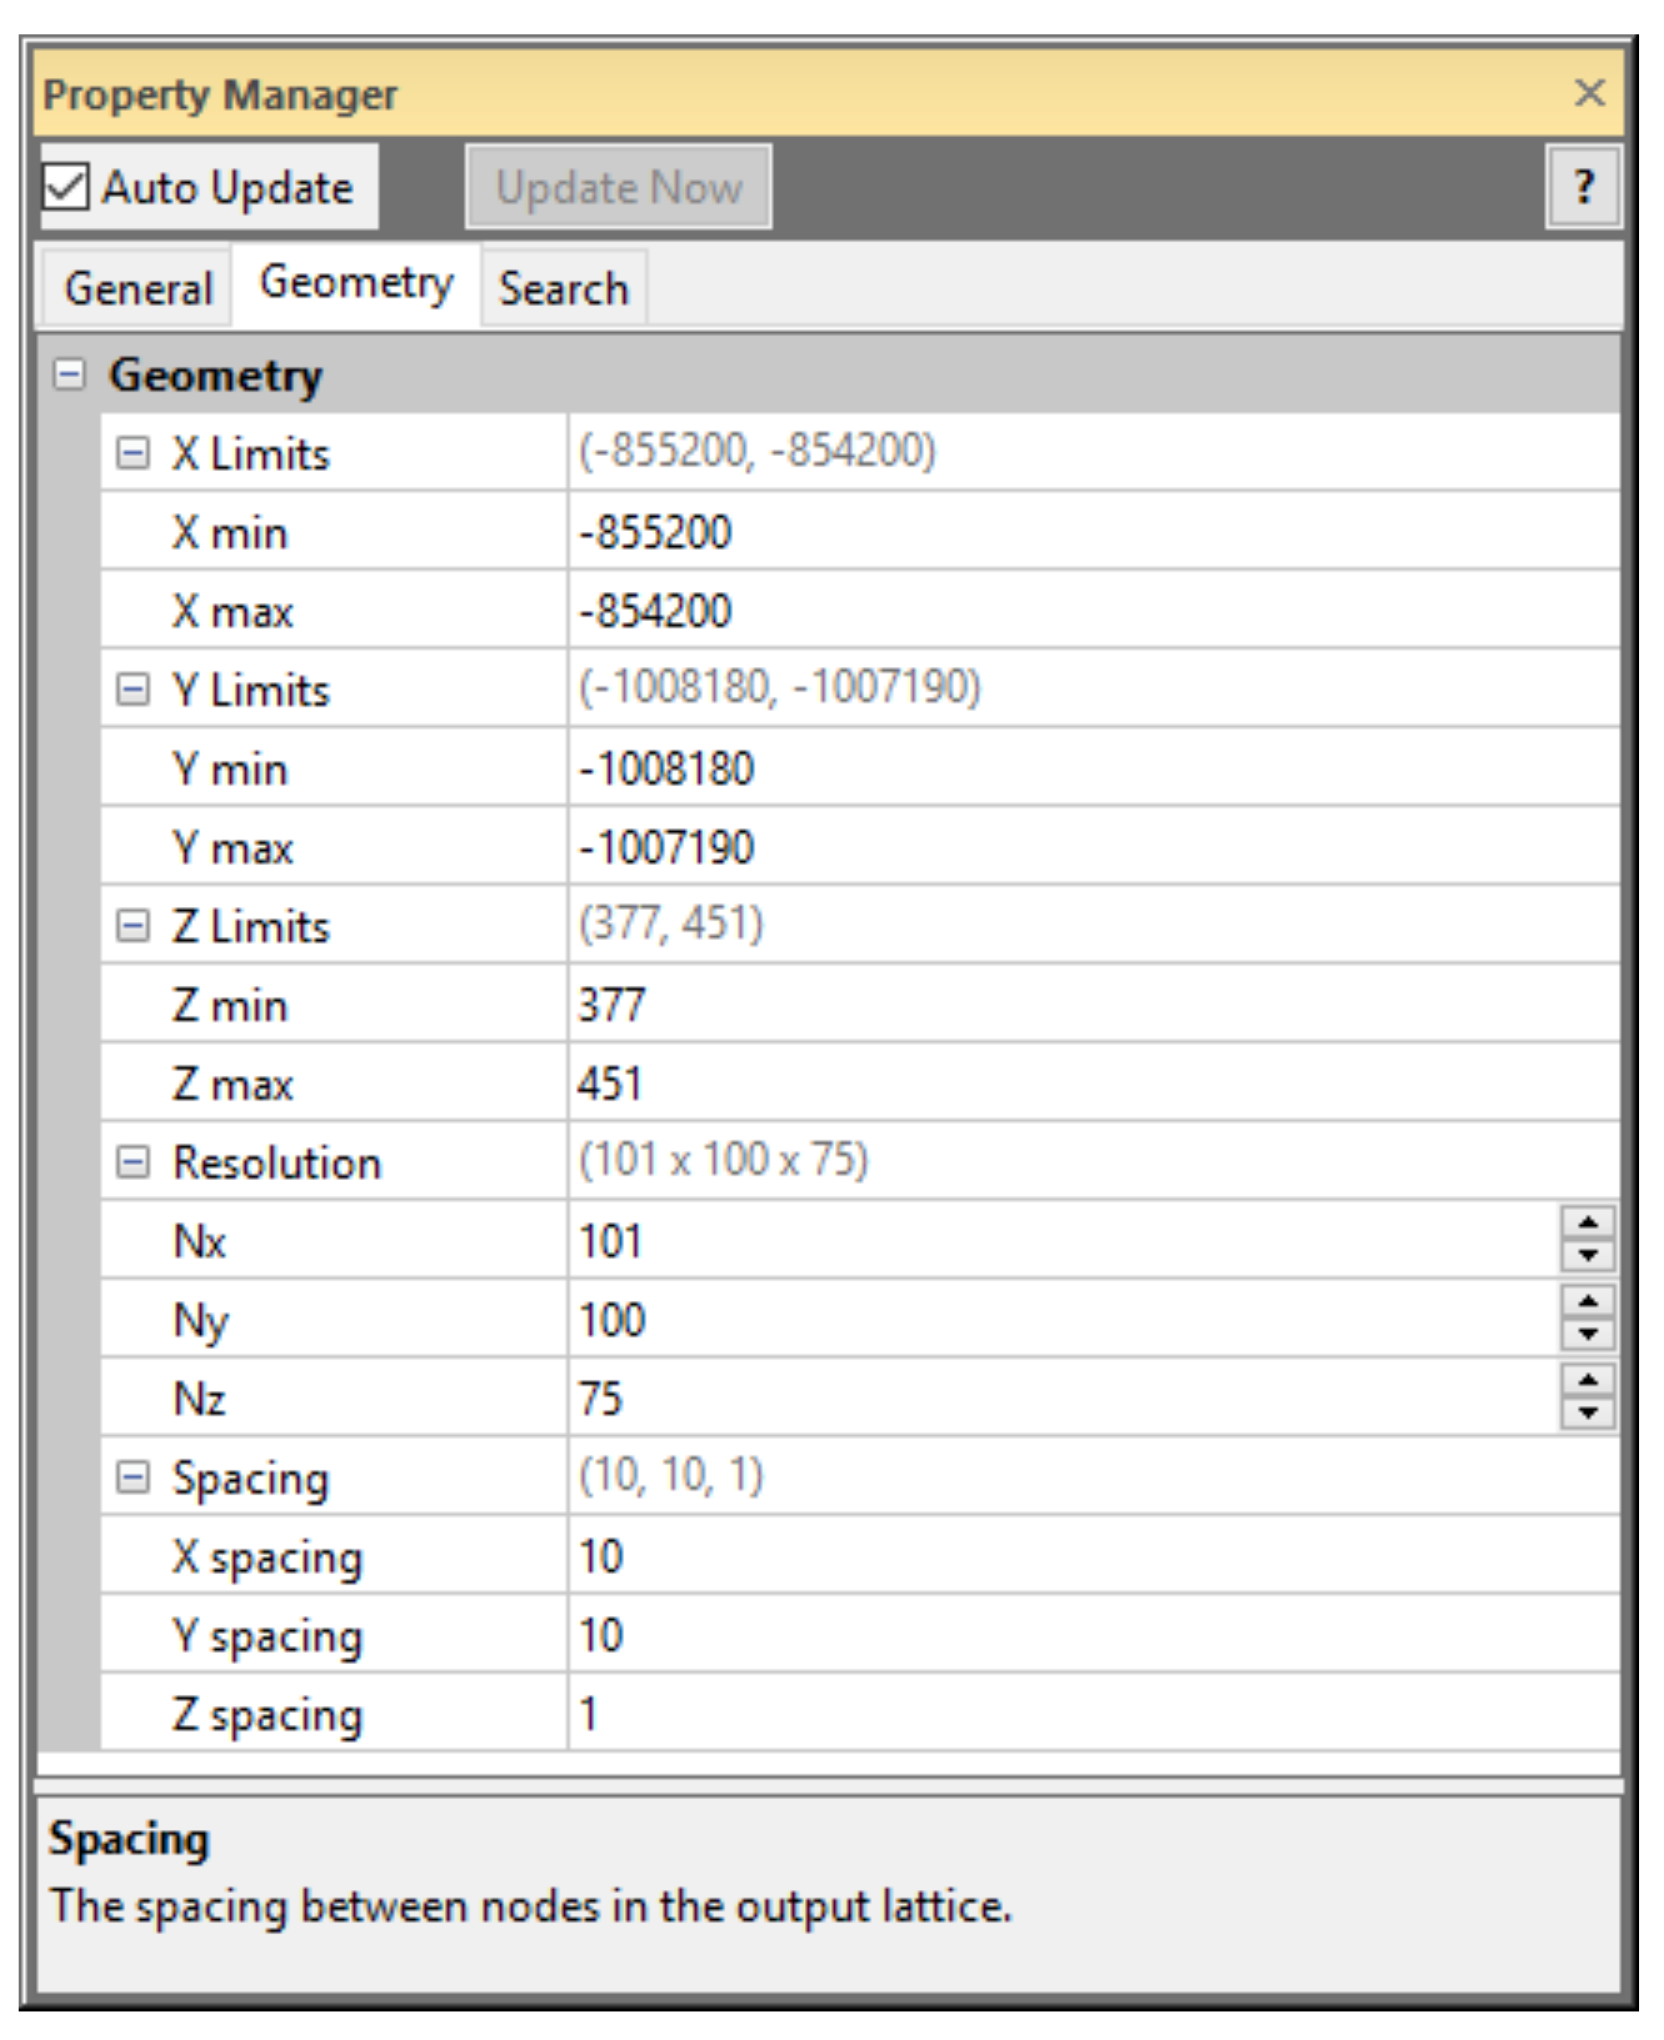
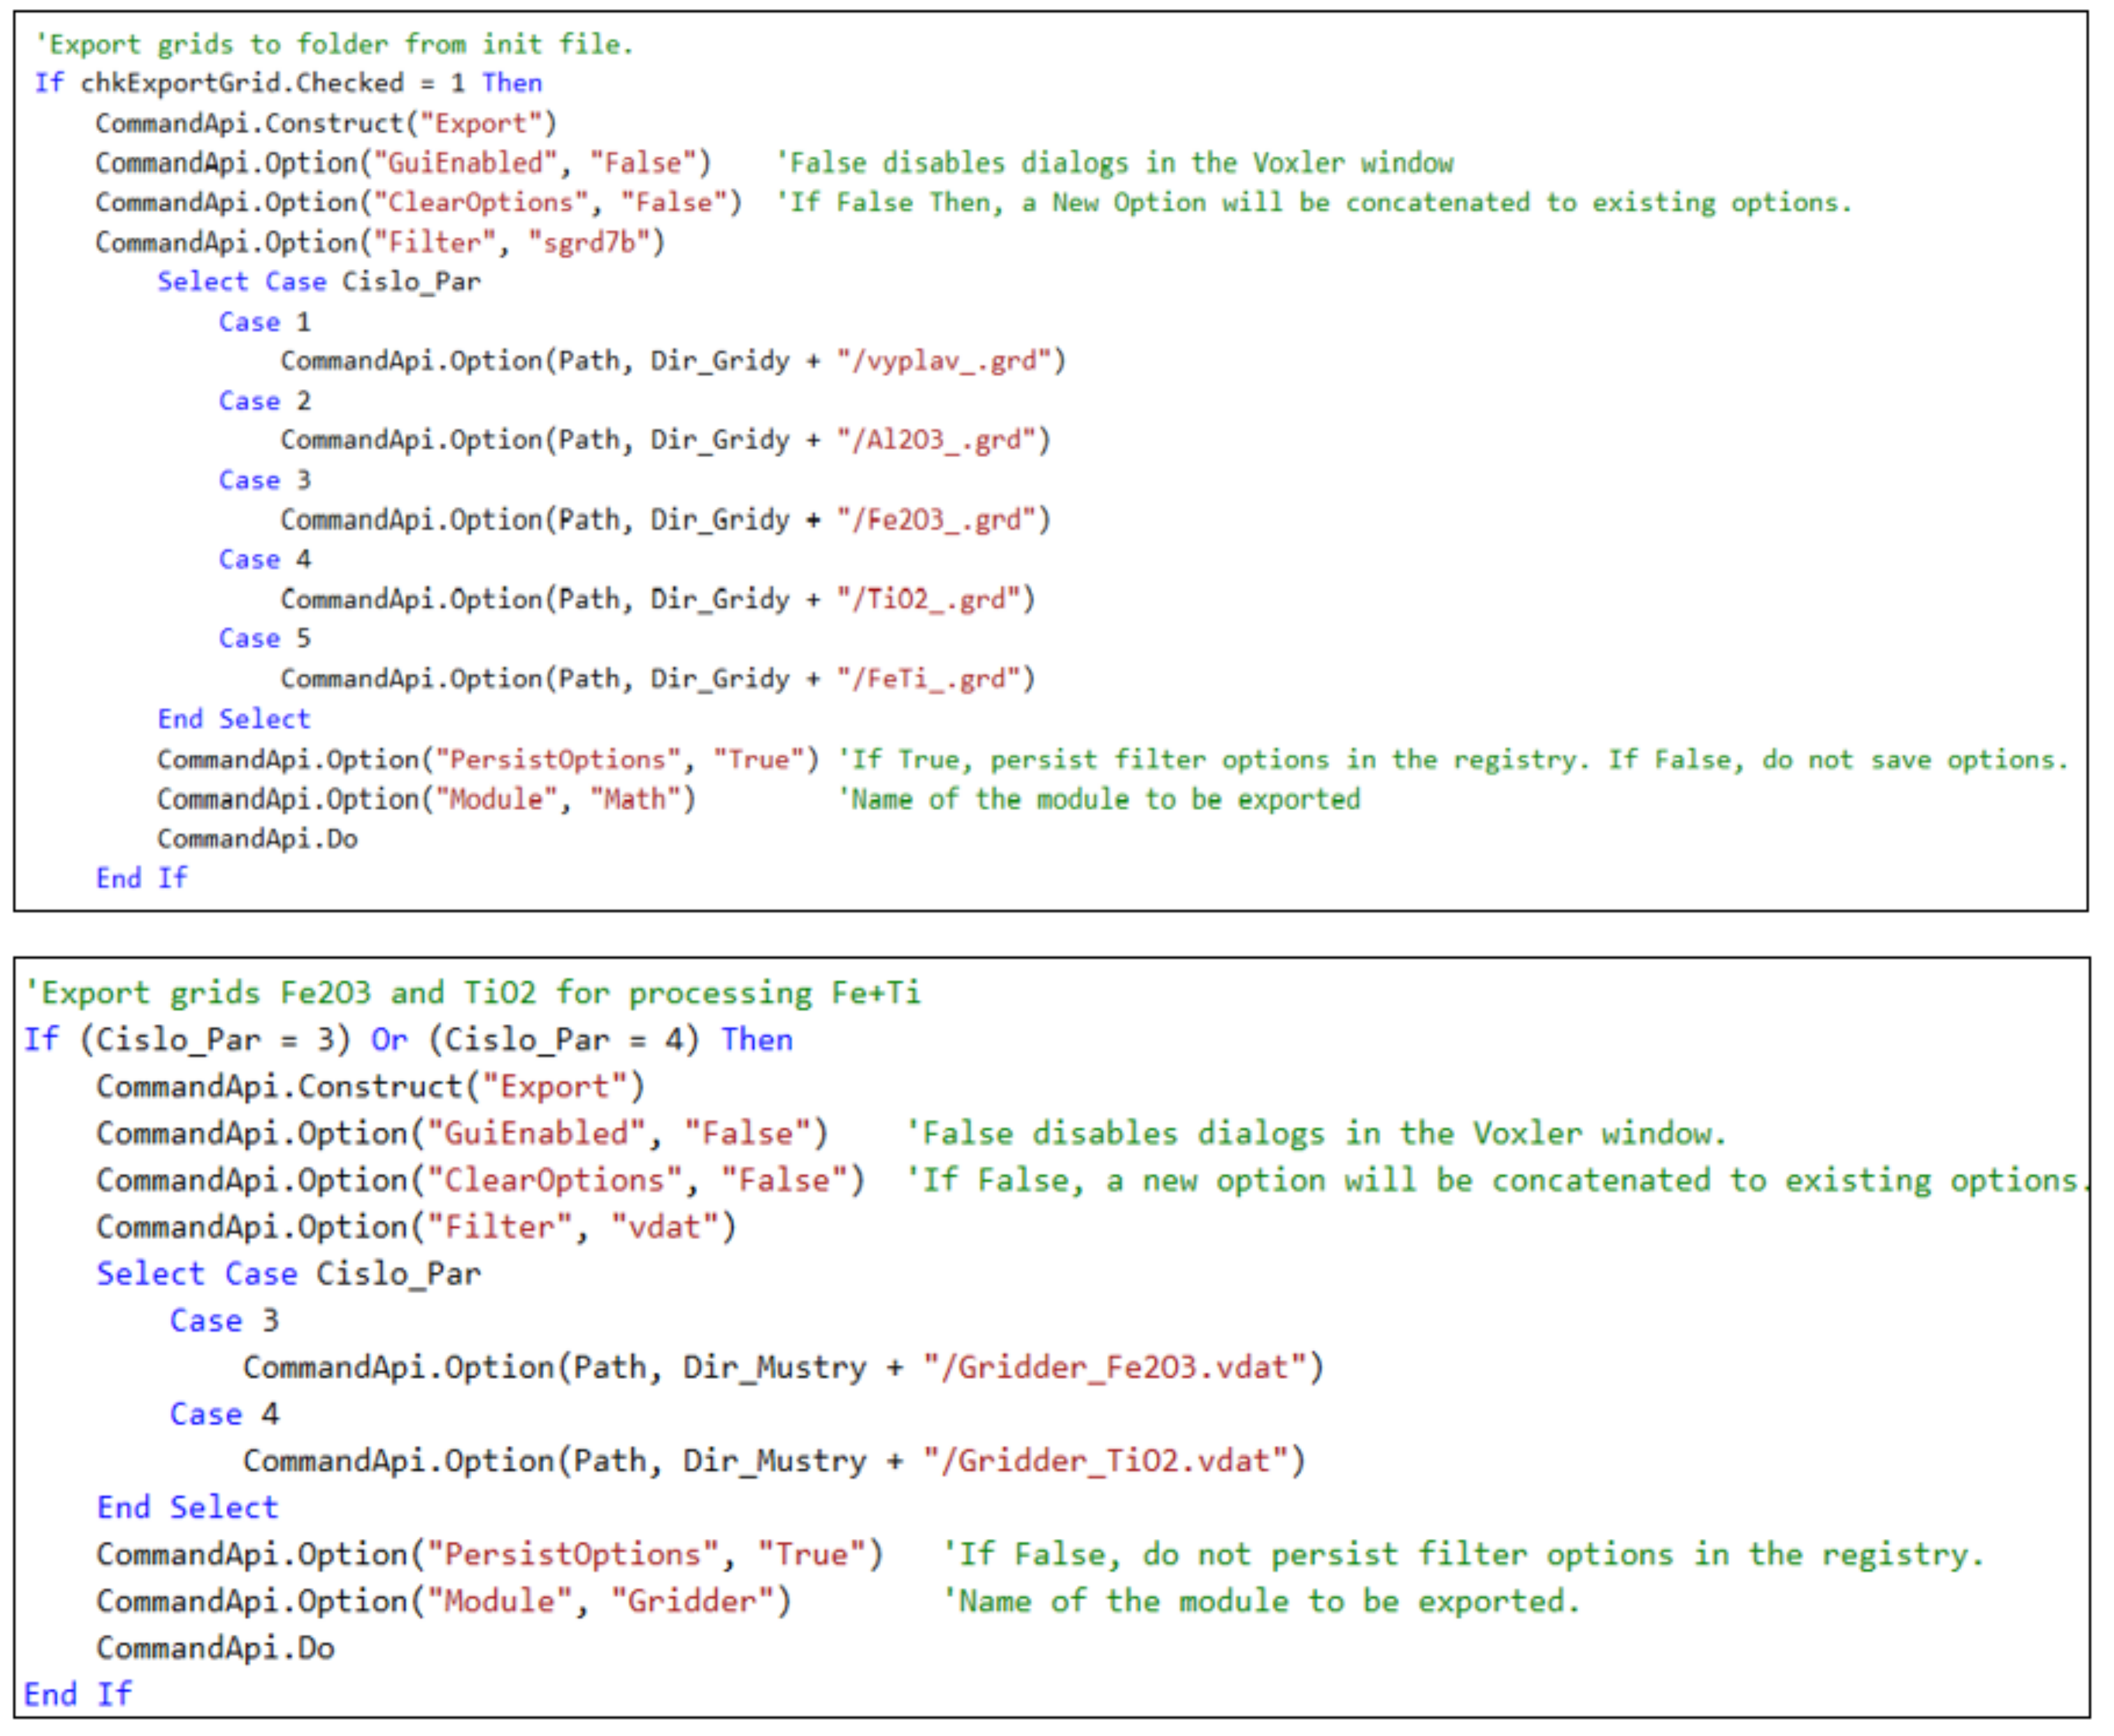
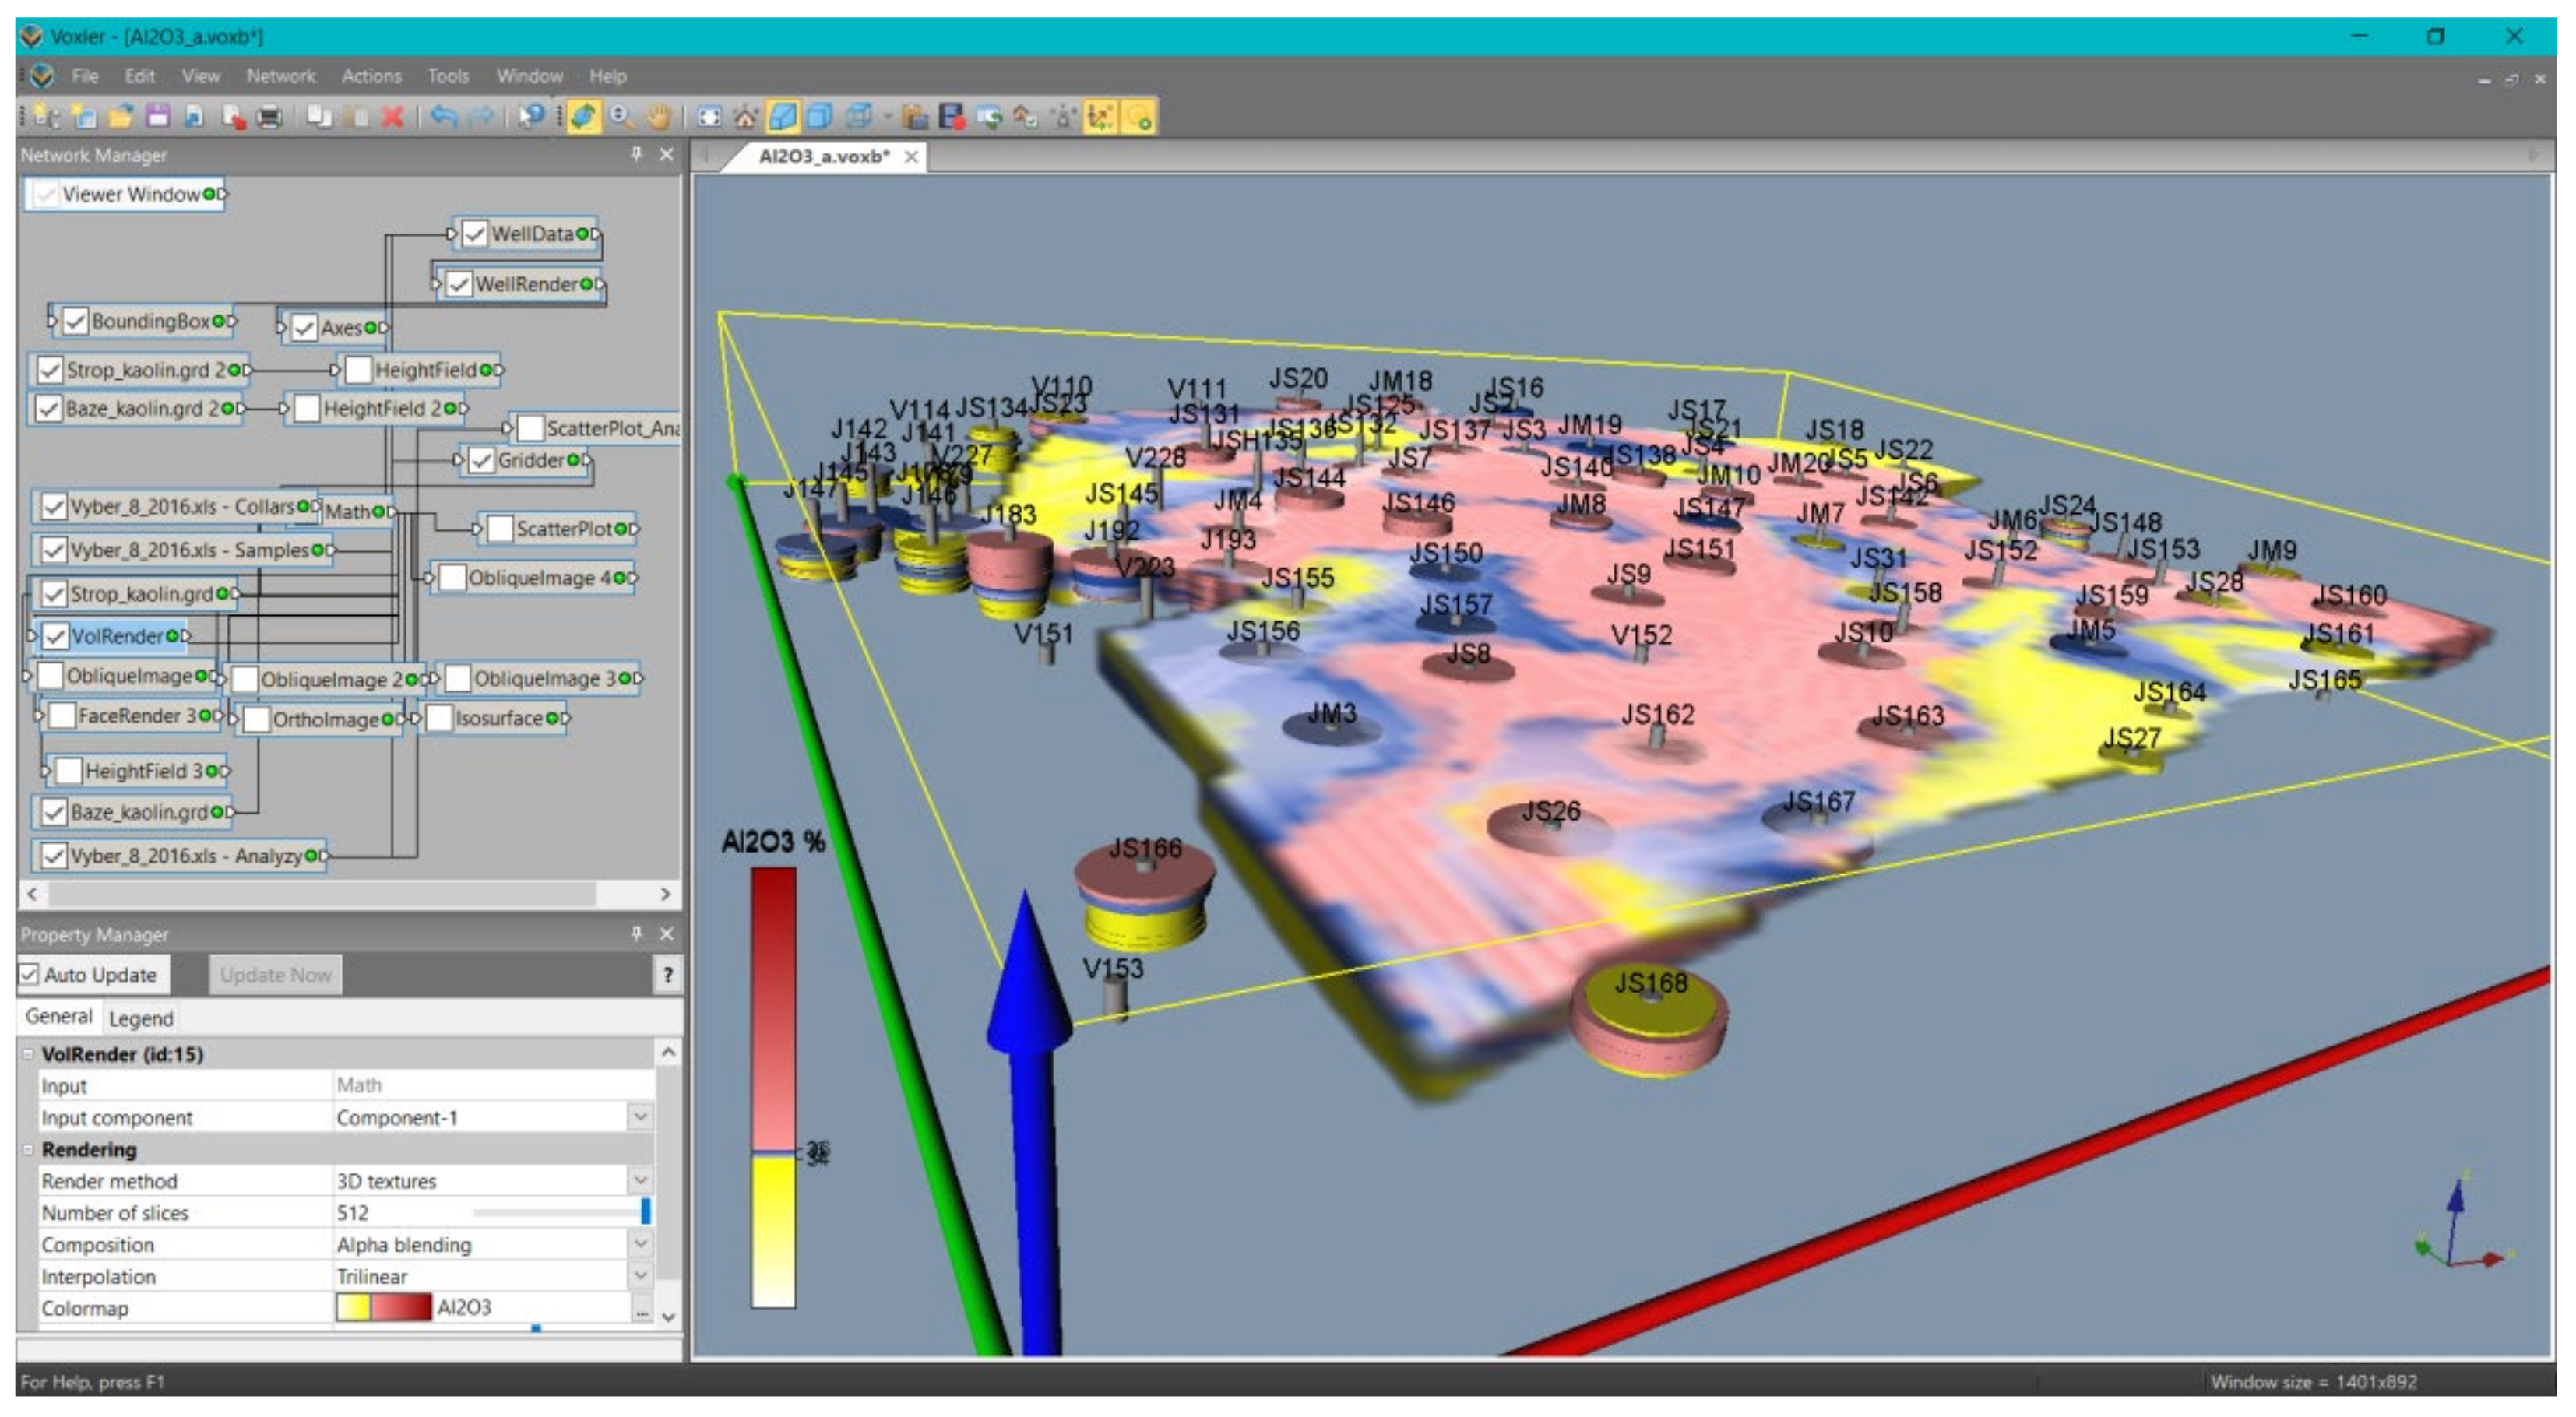
  • Three-dimensional visualization of the input data for the kaolin deposit in the Voxler environment, the construction of 3D grids based on technological parameters, and the export of the 2D grids in individual horizons to the grd Surfer format. Input data are processed by the implemented program Kaolin_A (see Section 3.2). This code generates 3D grids of individual parameters using the specified parameters of anisotropy, grid geometry, and the selection of samples for interpolation. Additionally, it also displays individual parameters in the Voxler environment. These parameters can be changed and tuned to construct variants of deposit models. The program also exports 2D grids in the format grd (Surfer) of individual horizontal layers of all parameters, which are further processed by the program Kaolin_Viz (see Section 3.3).
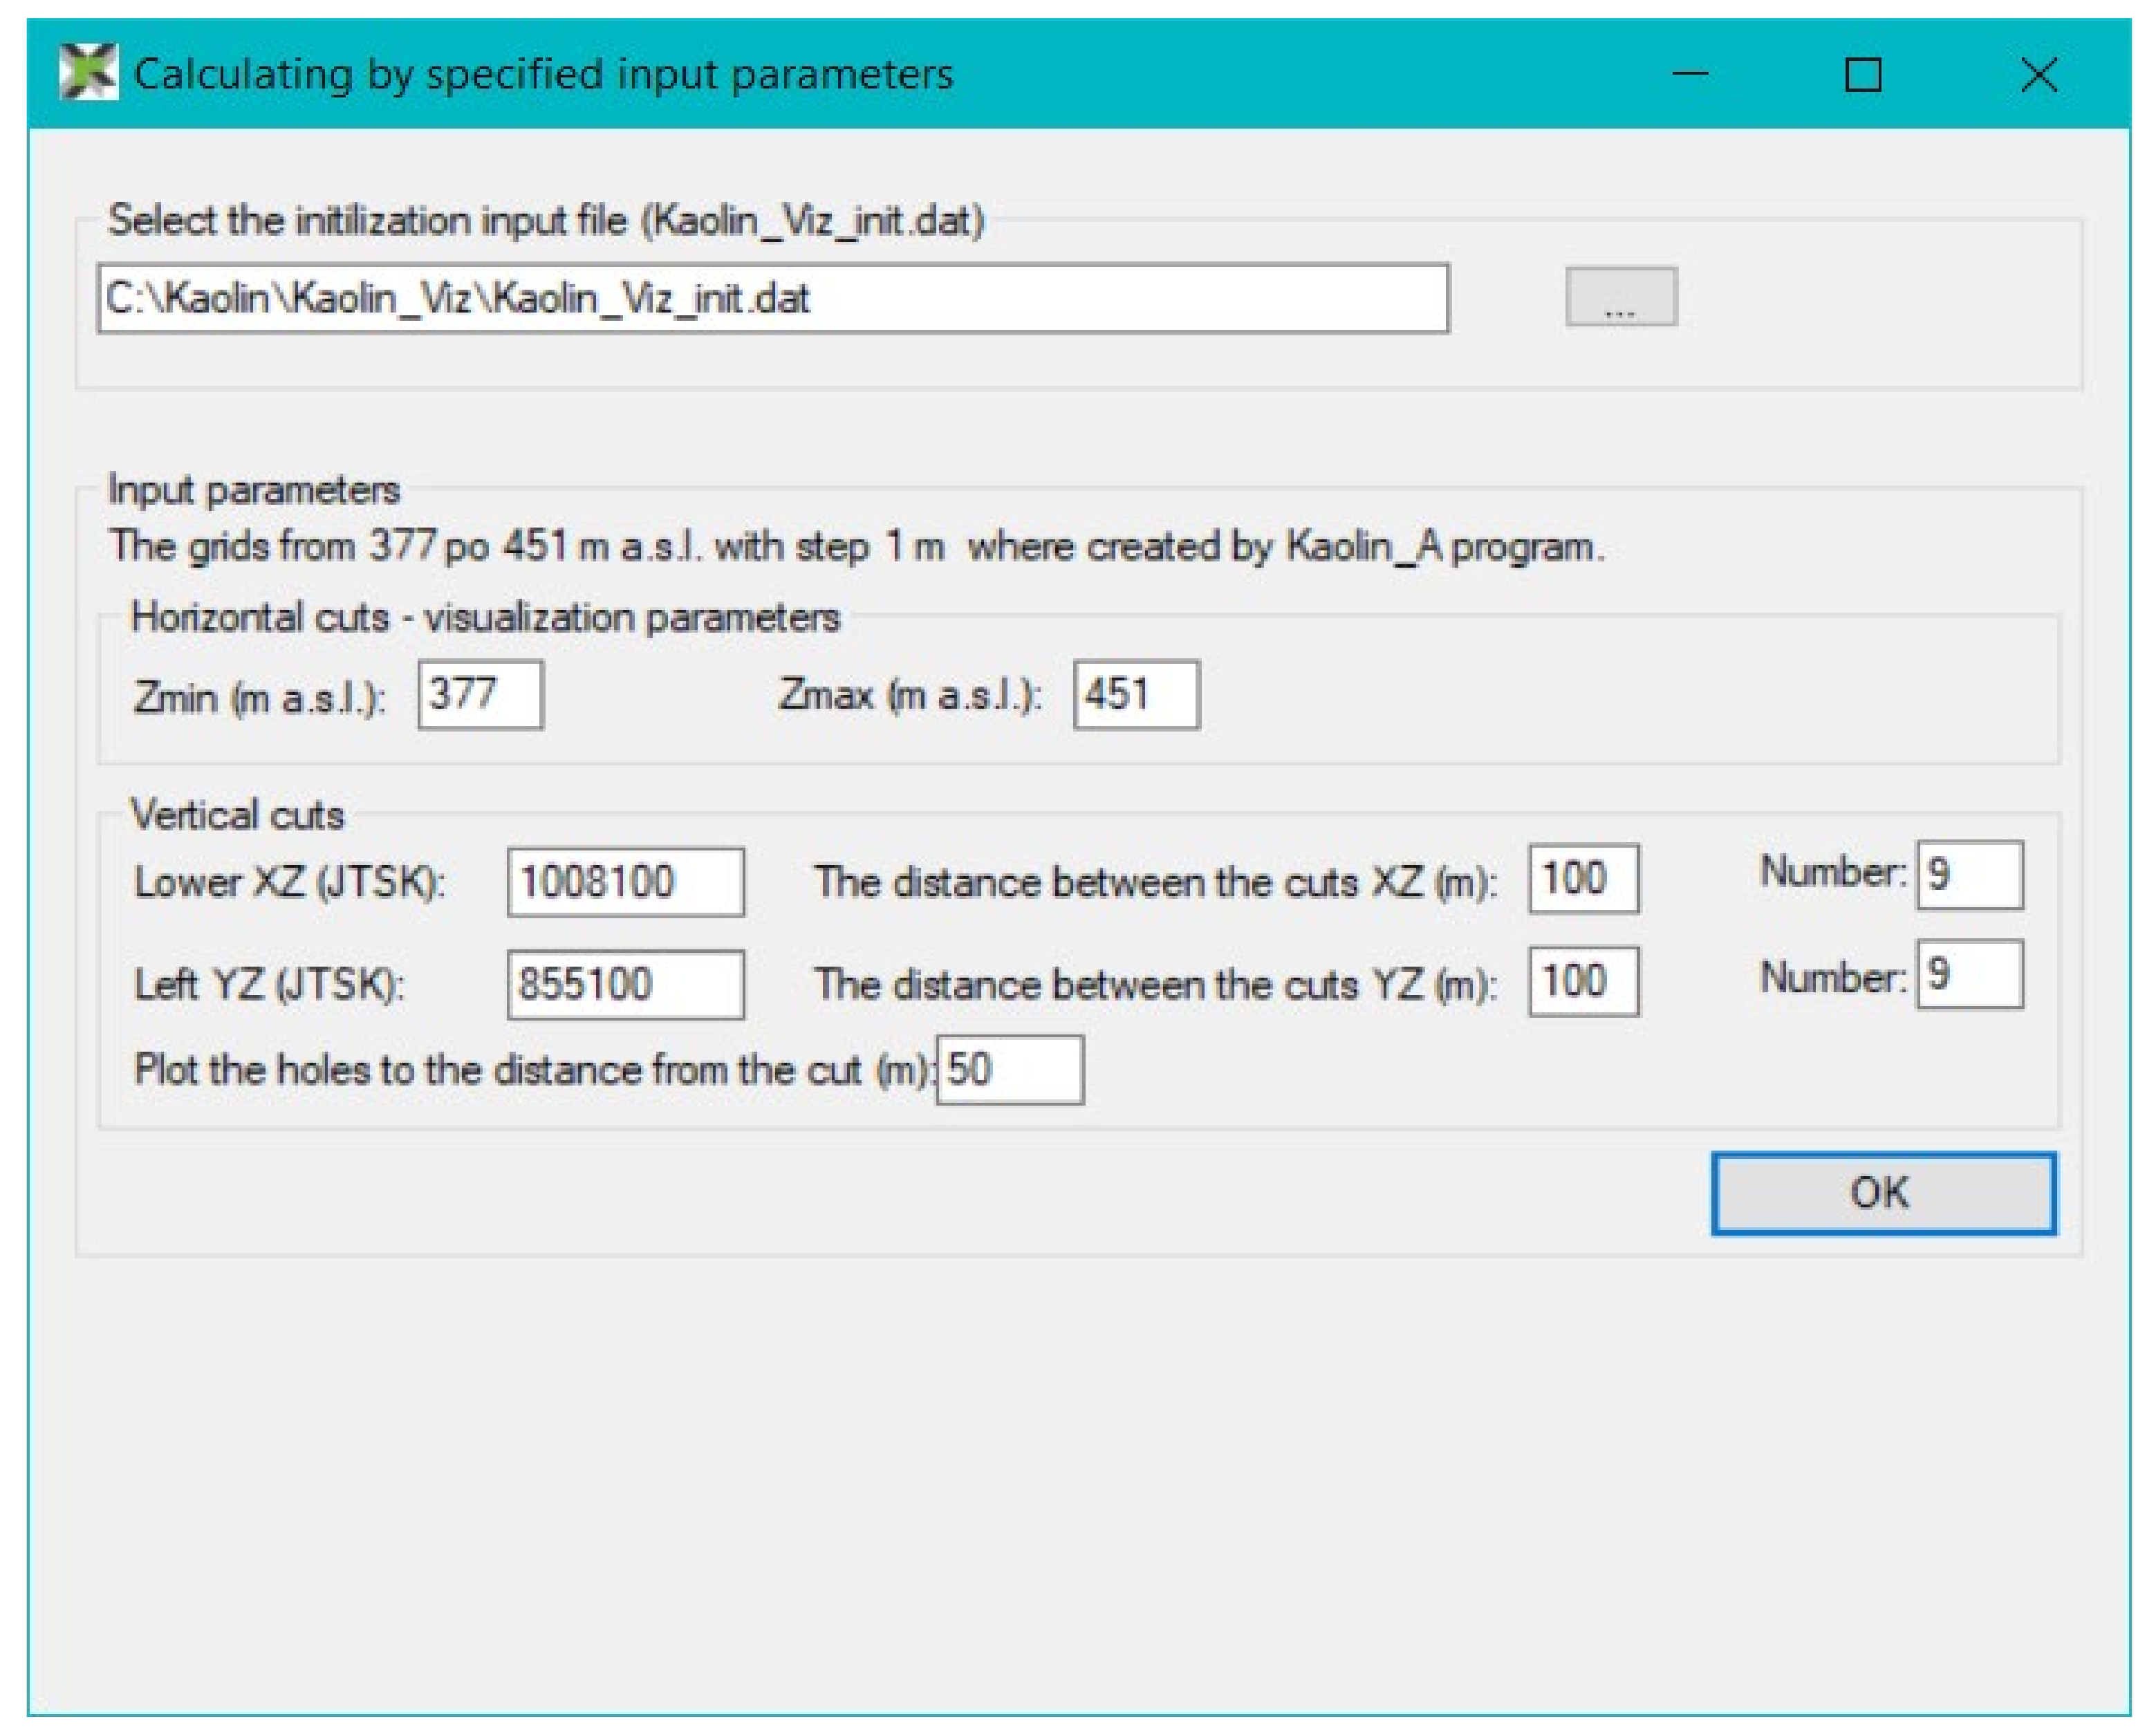
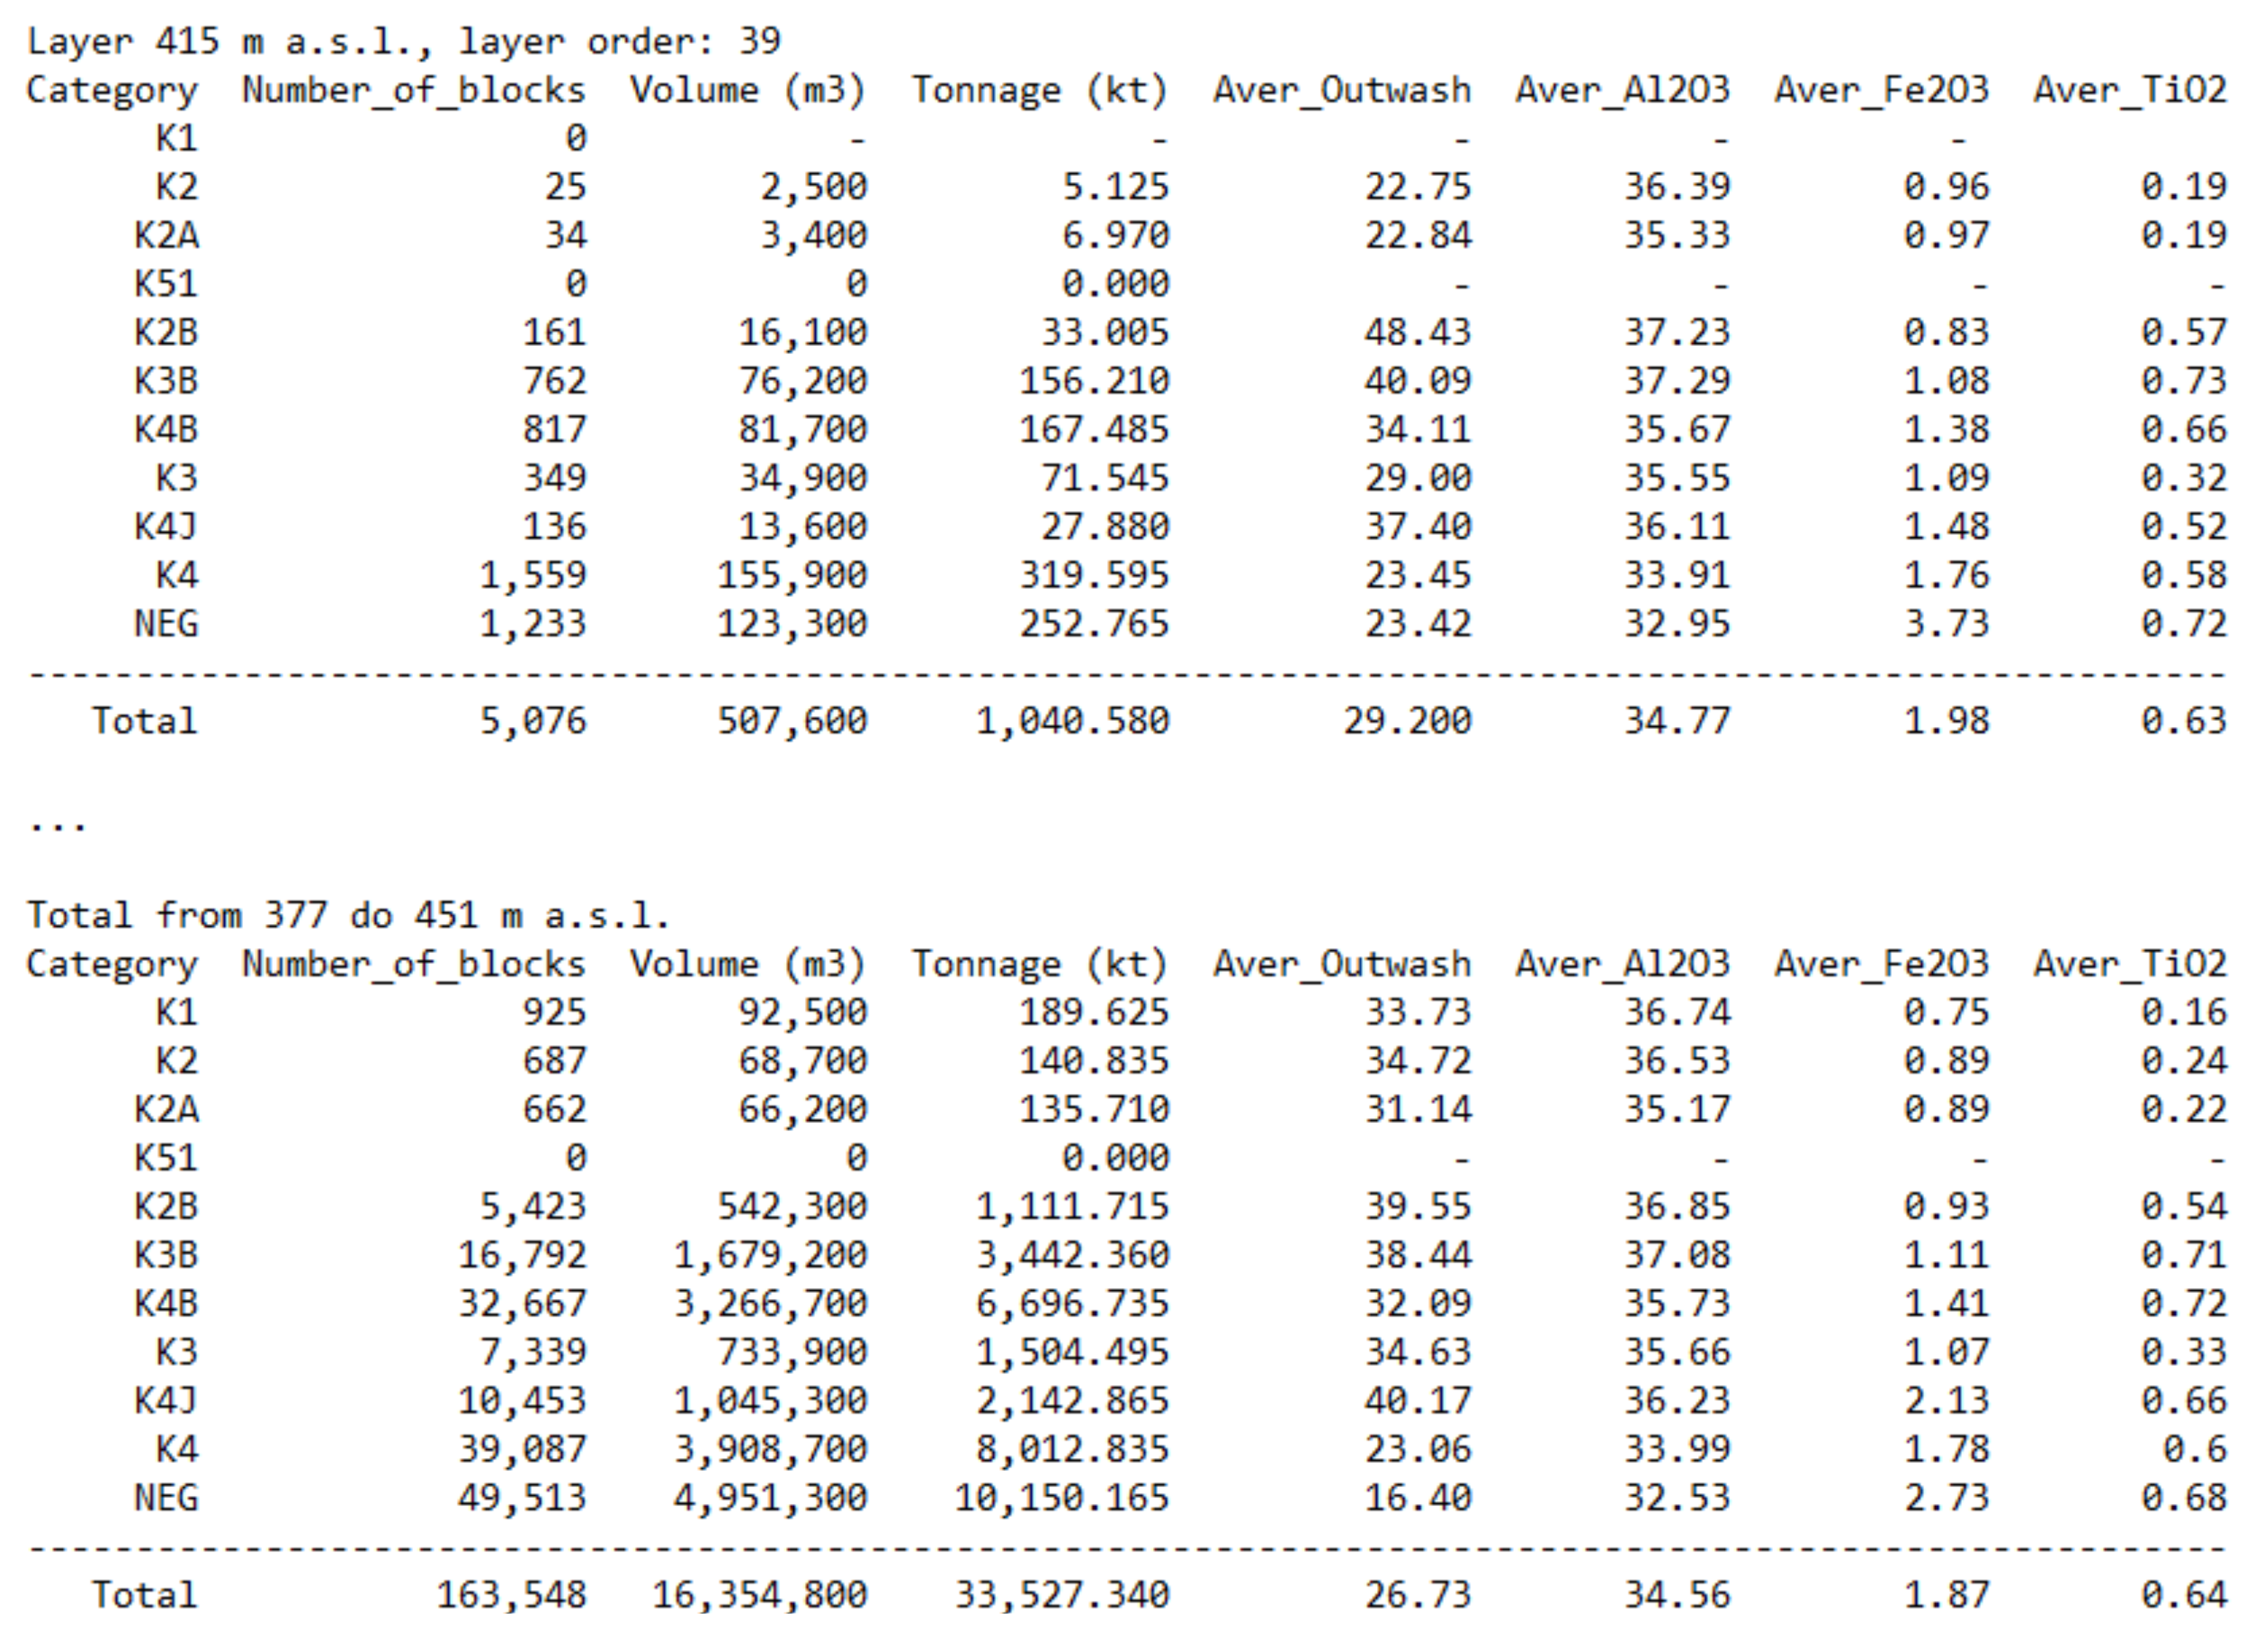
  • The categorization of the blocks of reserves in 2D grids (in individual horizons), based on both the grids of technological parameters (exported using the program Kaolin_A) and predefined parameters for the categories of reserves. Categories of the blocks of reserves are transformed into a 3D grid and the reserves of the deposit are estimated. As indicated in Step 6, the Kaolin_Viz program processes the outputs created by the program Kaolin_A. The first of the four modules of the program Kaolin_Viz performs the categorization of blocks of reserves based on the grids of kaolin outwash, Al2O3, Fe2O3, TiO2 and Fe2O3 + TiO2 (exported by the program Kaolin_A) and the defined parameters of categories of reserves (Table 1). Additionally, this module estimates kaolin deposits reserves in text form.
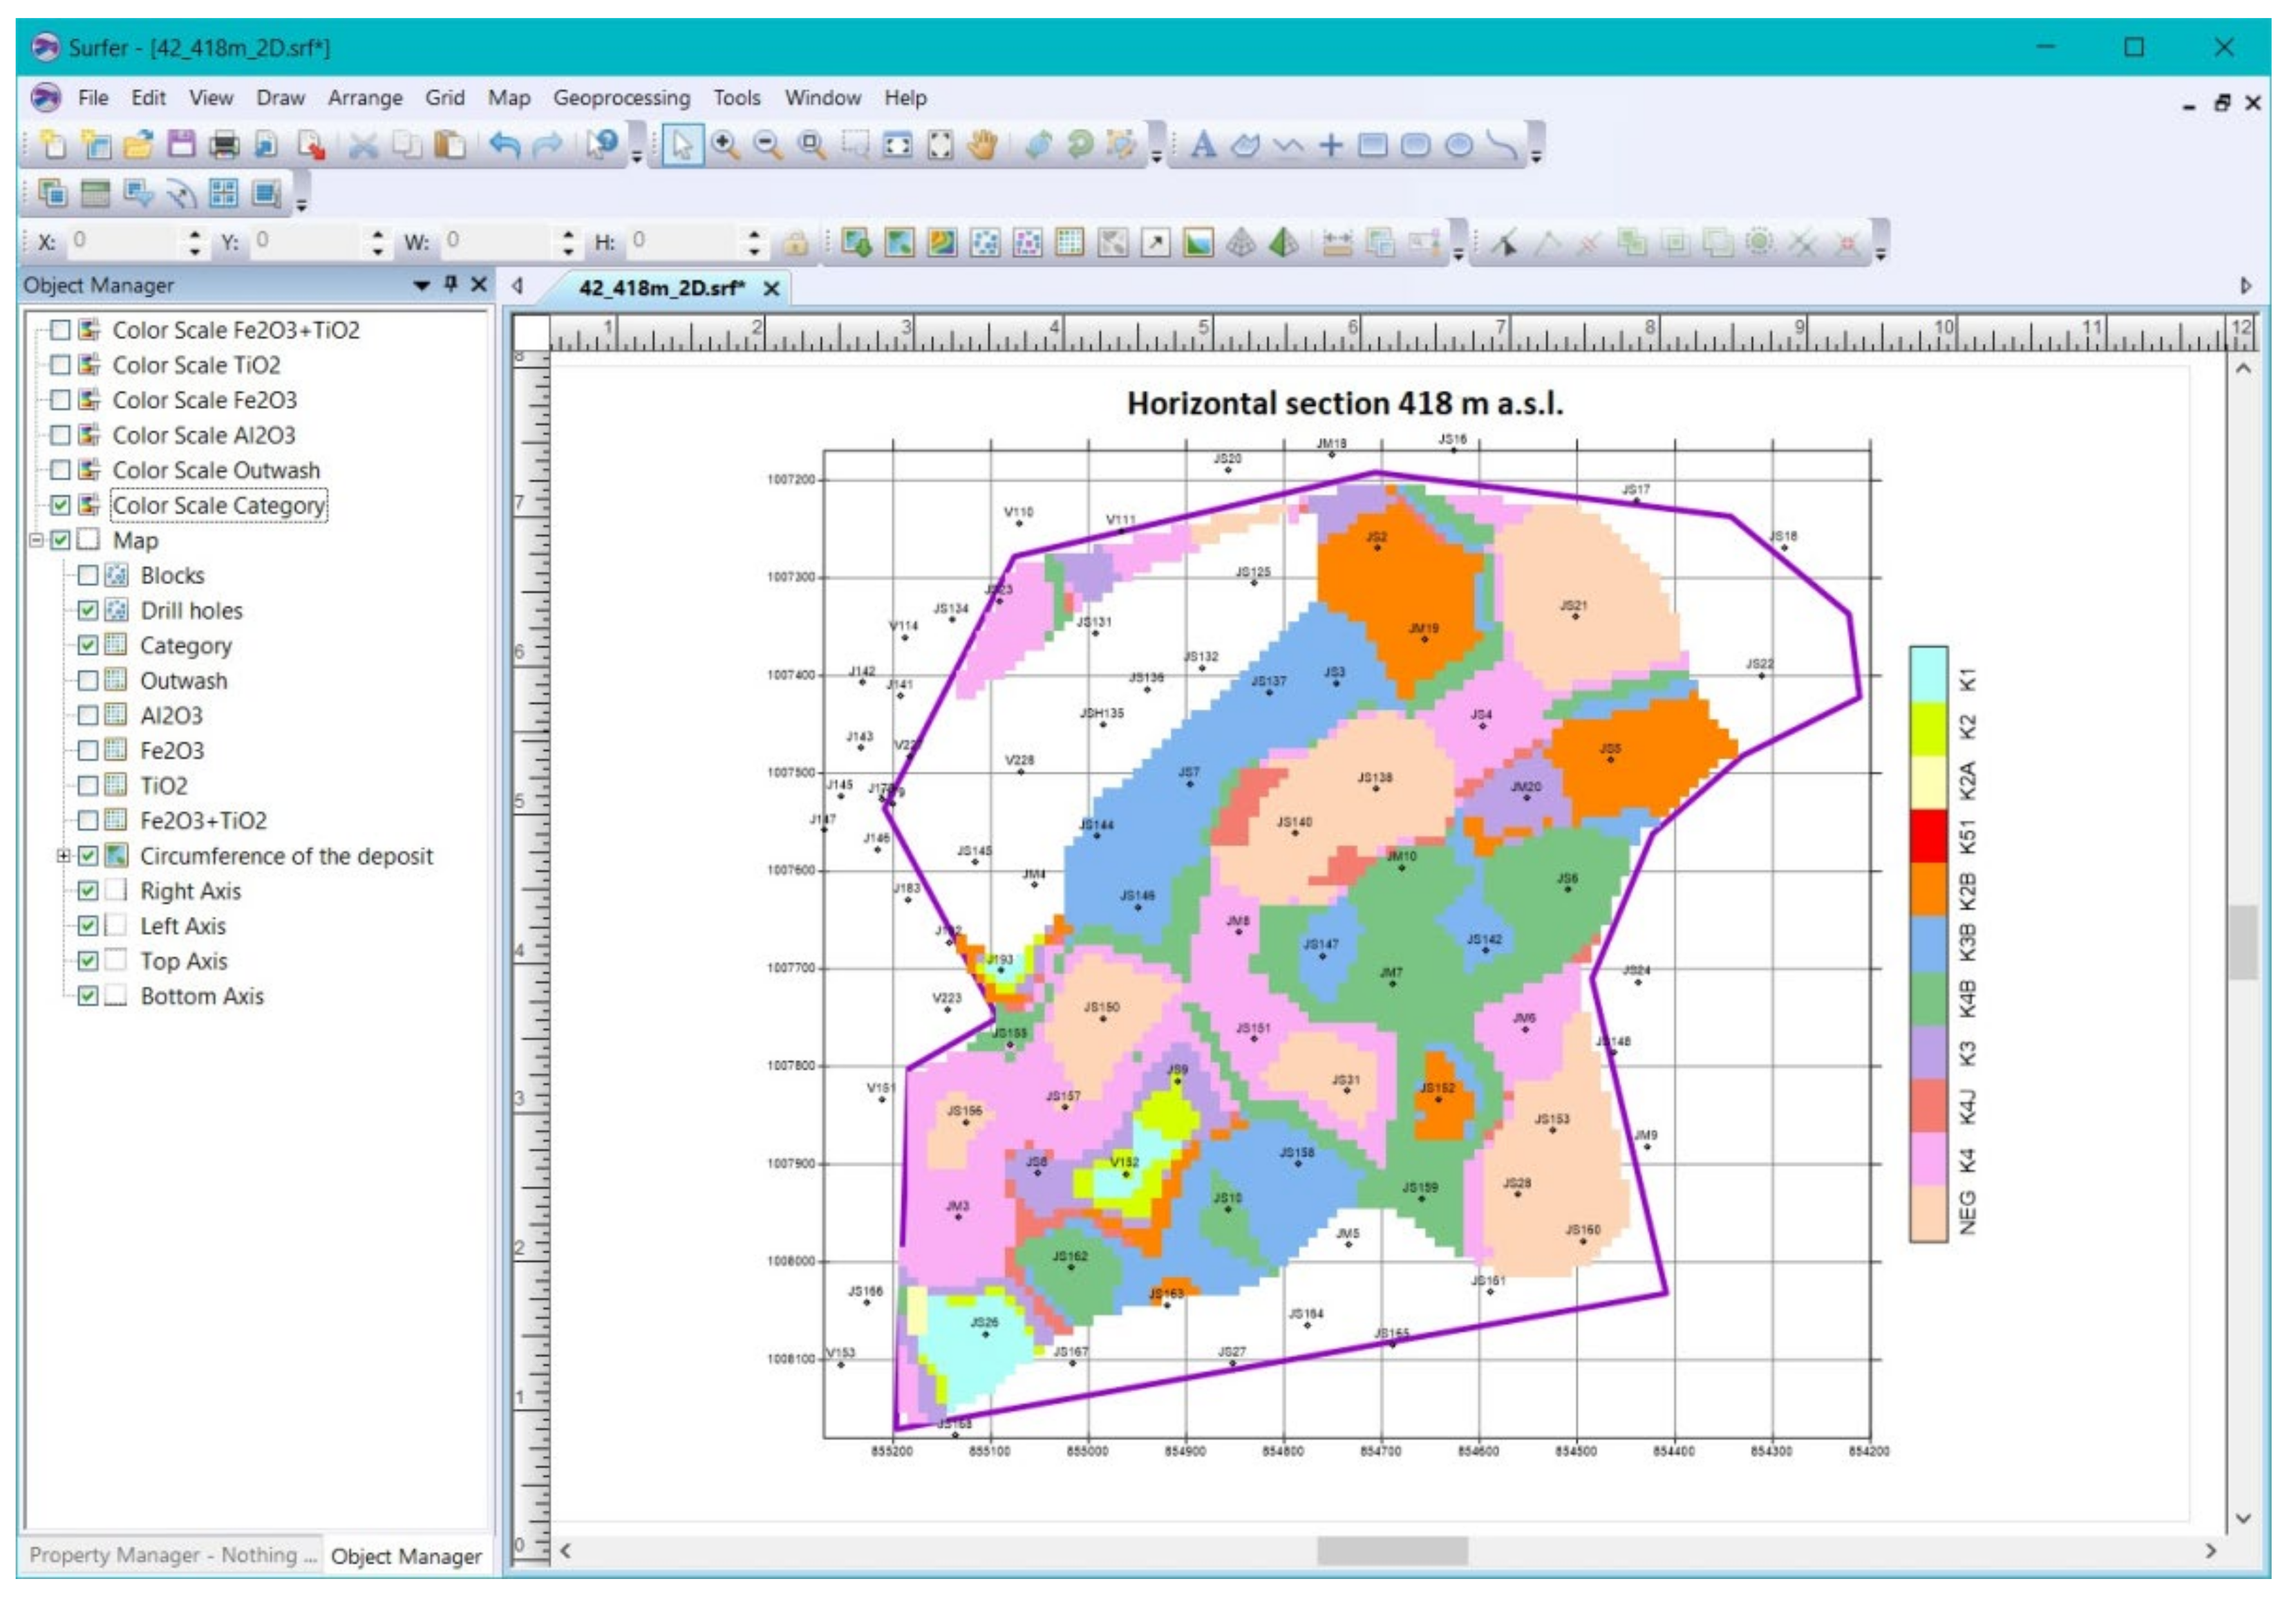
  • Two-dimensional visualization of horizontal sections in the Surfer software environment. The second module of the program Kaolin_Viz performs the visualization of a series of horizontal sections in 2D in the Surfer environment.
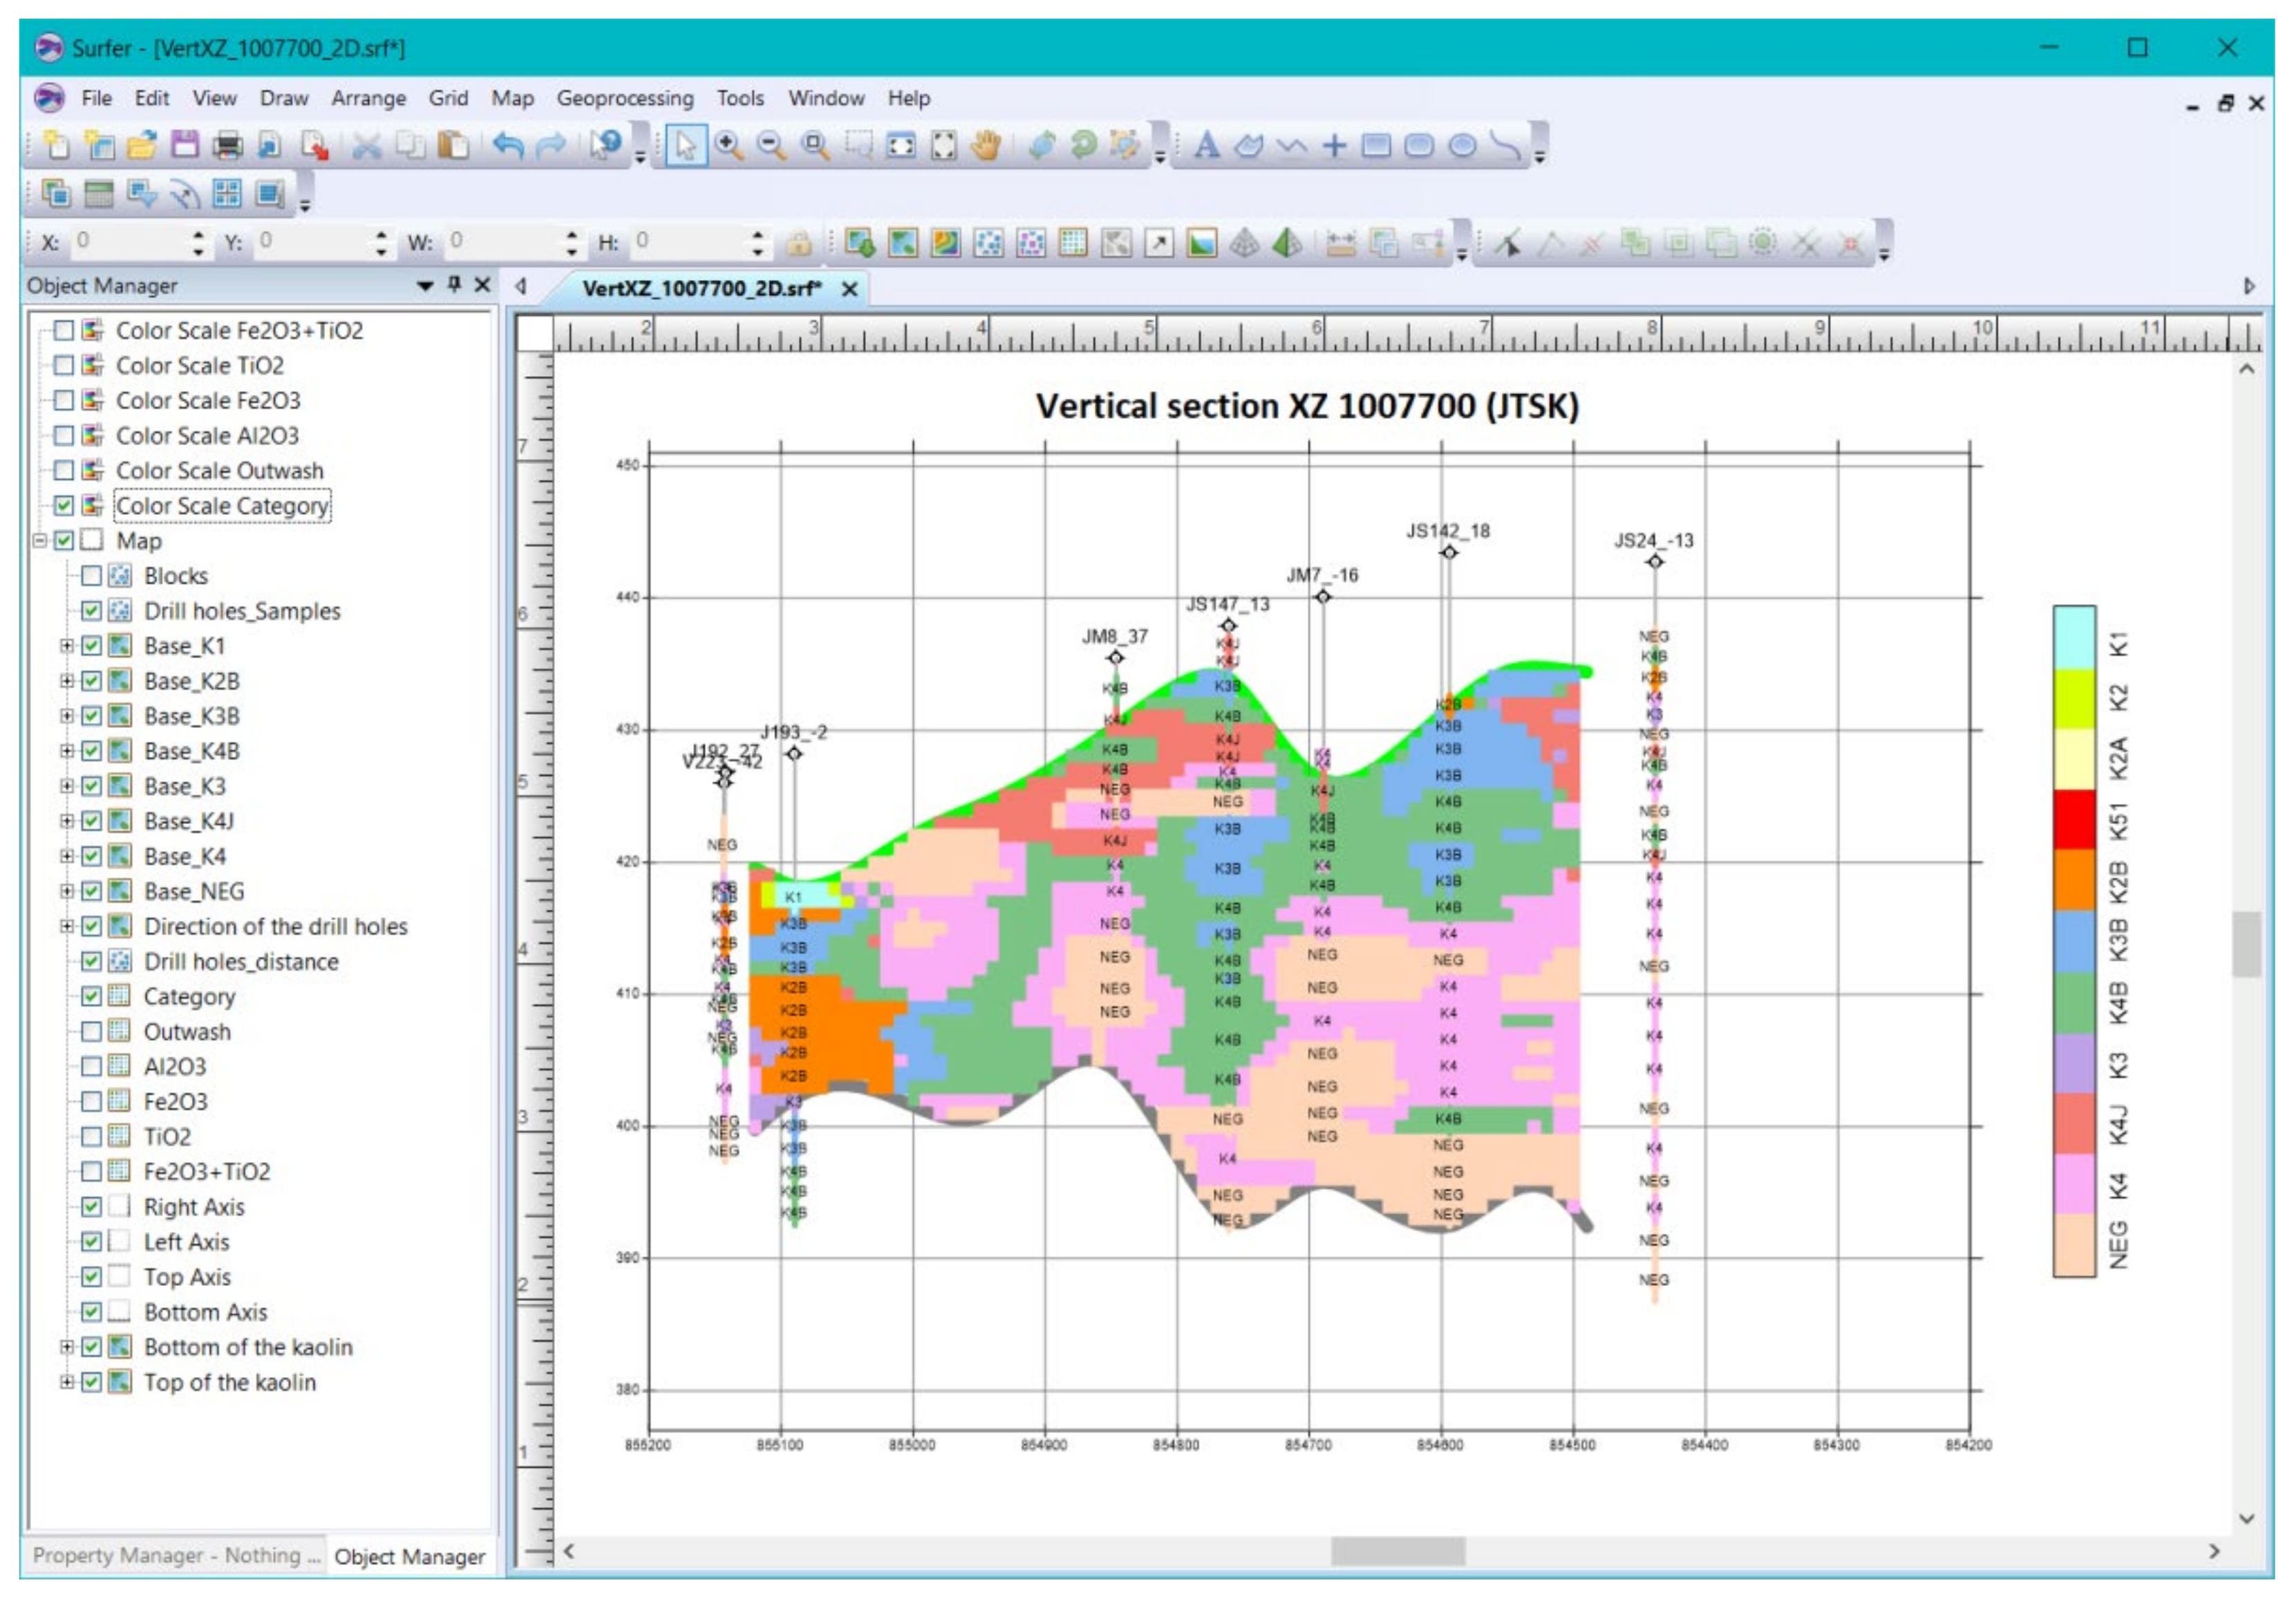
  • Two-dimensional visualization of the series of vertical sections in the Surfer software environment. The third module of the program Kaolin_Viz implements the visualization of the network of vertical sections XZ and YZ in 2D in the Surfer environment.
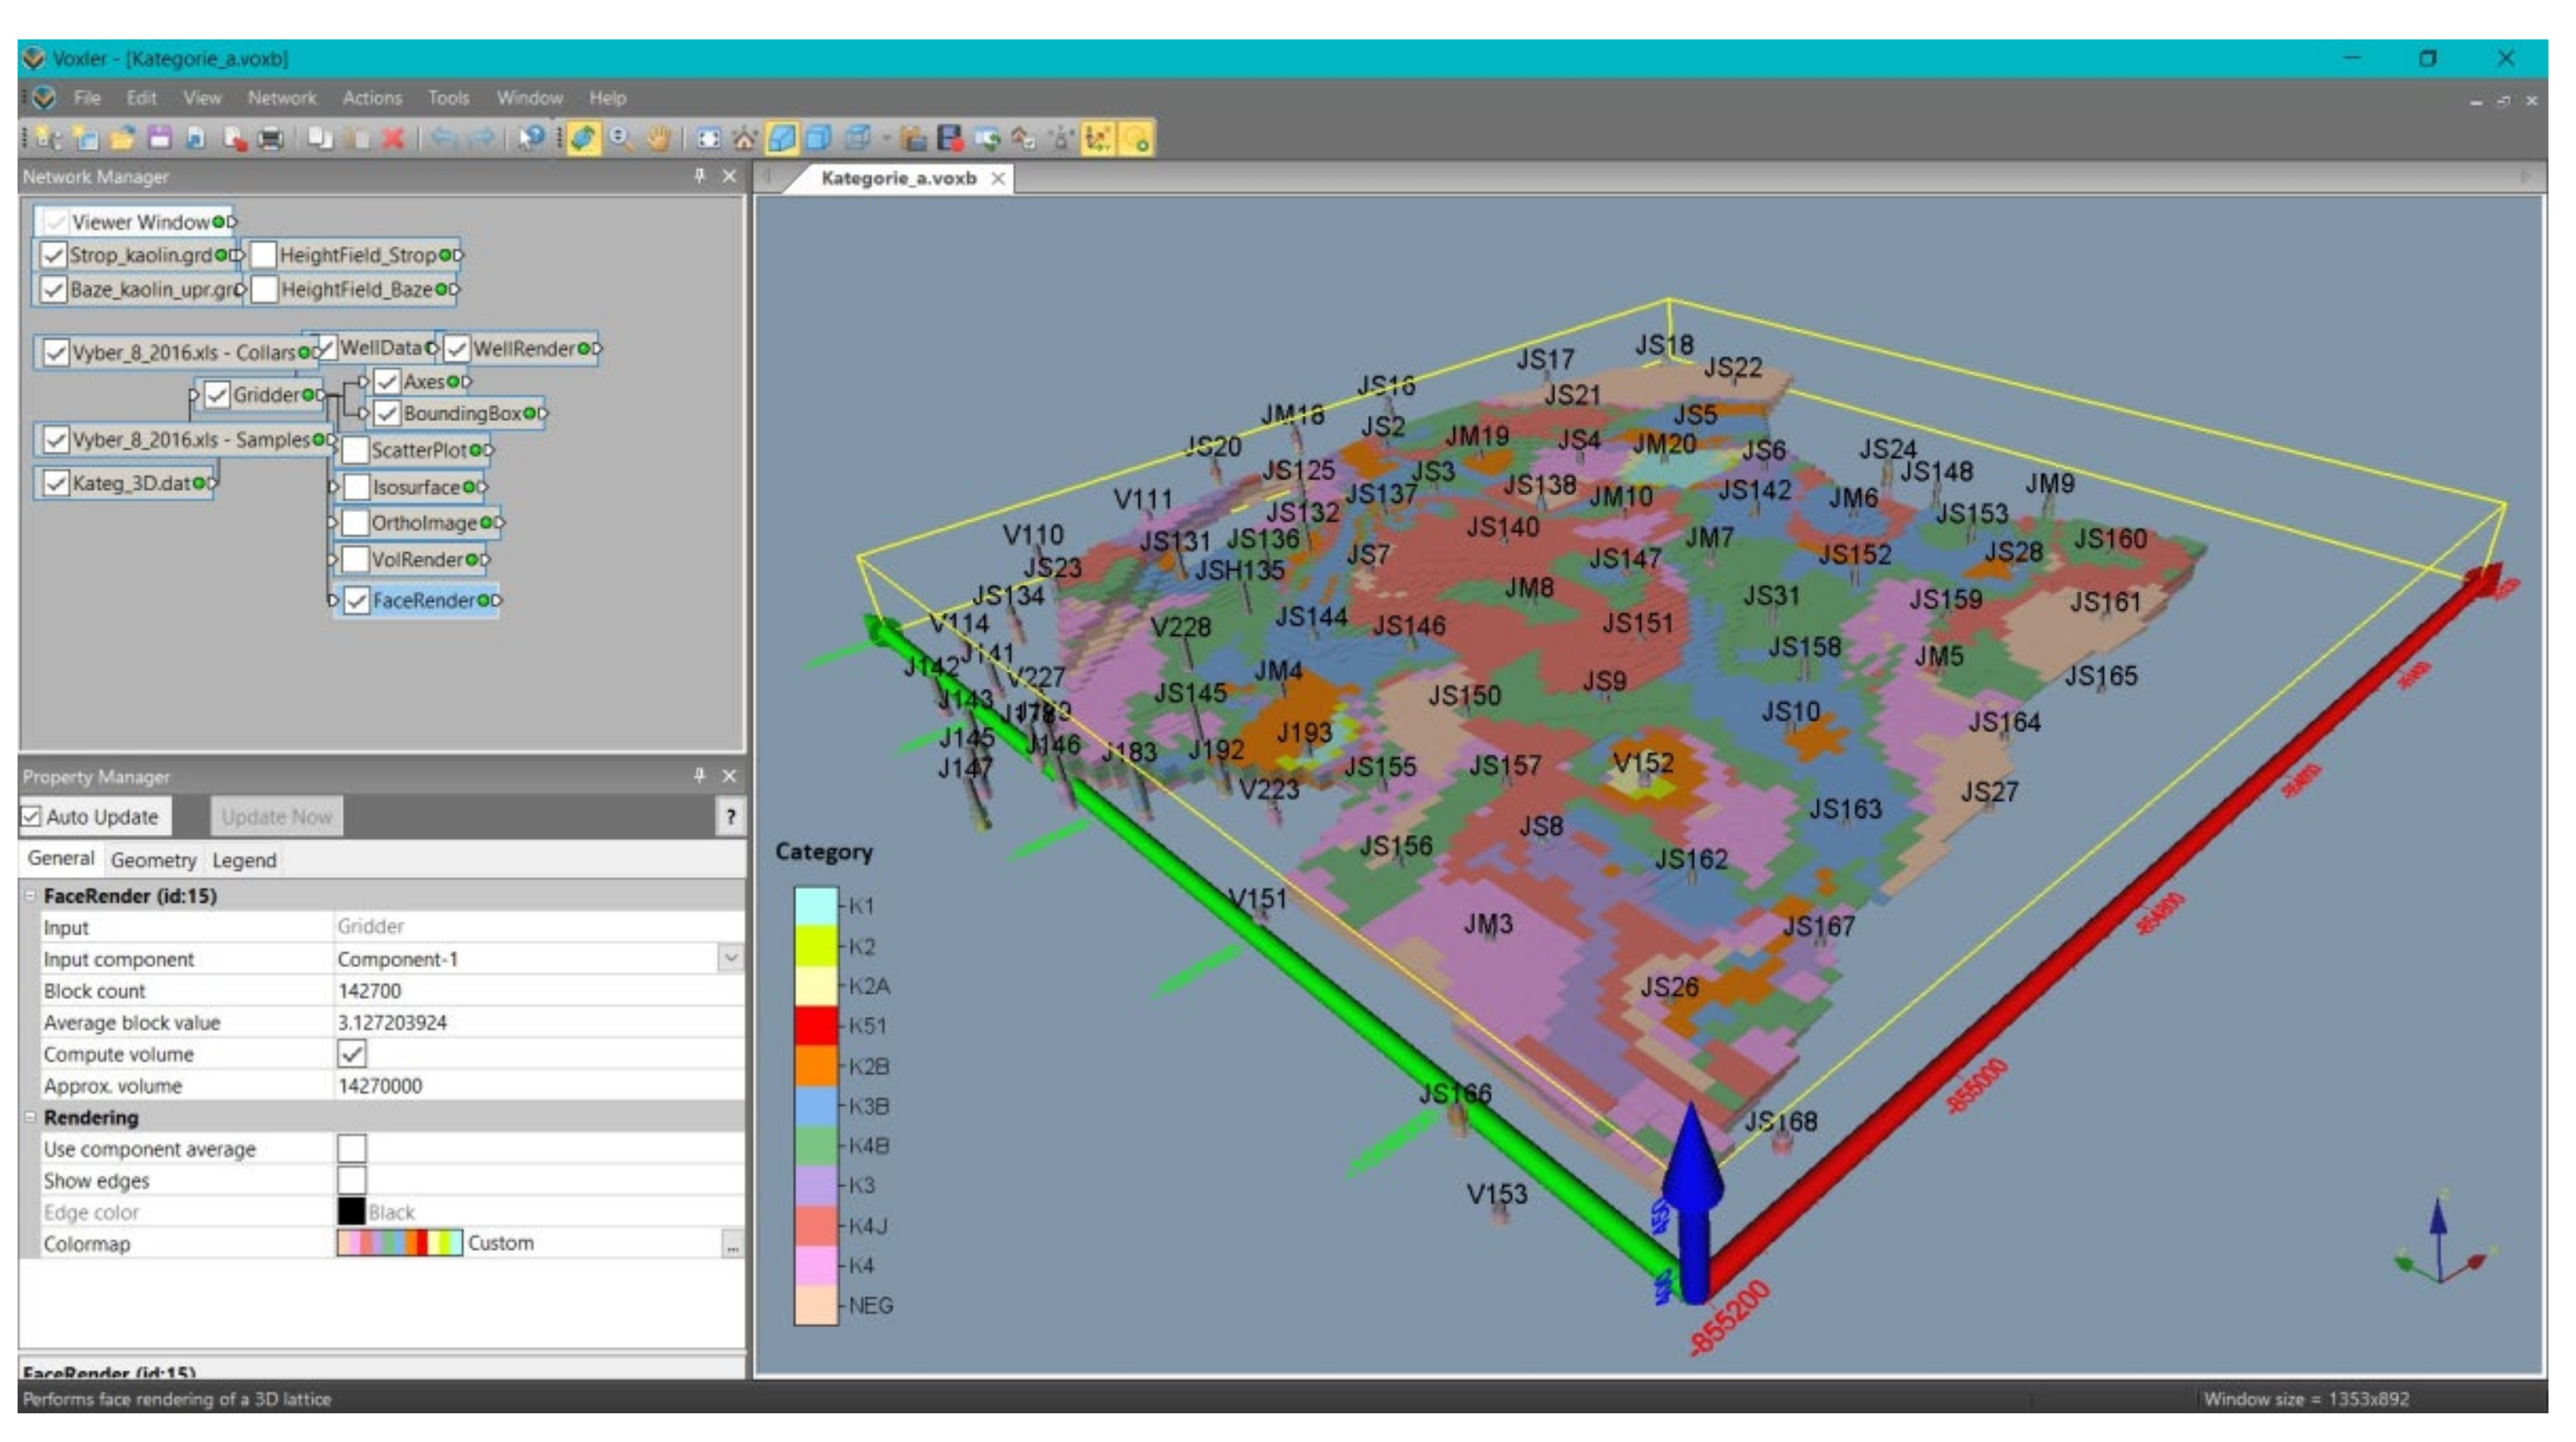
  • Three-dimensional visualization of categories of blocks of reserves in the Voxler software environment. The fourth module of the program Kaolin_Viz performs various ways of visualization of categories of the block of reserves in 3D in the Voxler environment.
  • Possible extension of the input data based on the exploratory mining and the return to Step 6. In the case of updating the input data based on the exploratory mining, the data must be processed as described in Steps 2–4. During ongoing mining activities, it is also necessary to update the grid of the top of the kaolin deposit (see Step 5). Afterwards, everything is prepared for the model update and its visualization as described in Steps 6–10.

3. Results and Discussion

This section demonstrates the resulting implementation of the kaolin deposit processing methodology in the Visual Studio 2019 [18] environment using the Voxler automation object model [20] and the Surfer automation object model [19] published by the Golden Software Company, for the kaolin deposit Jimlíkov-East, Karlovy Vary, Czech Republic.

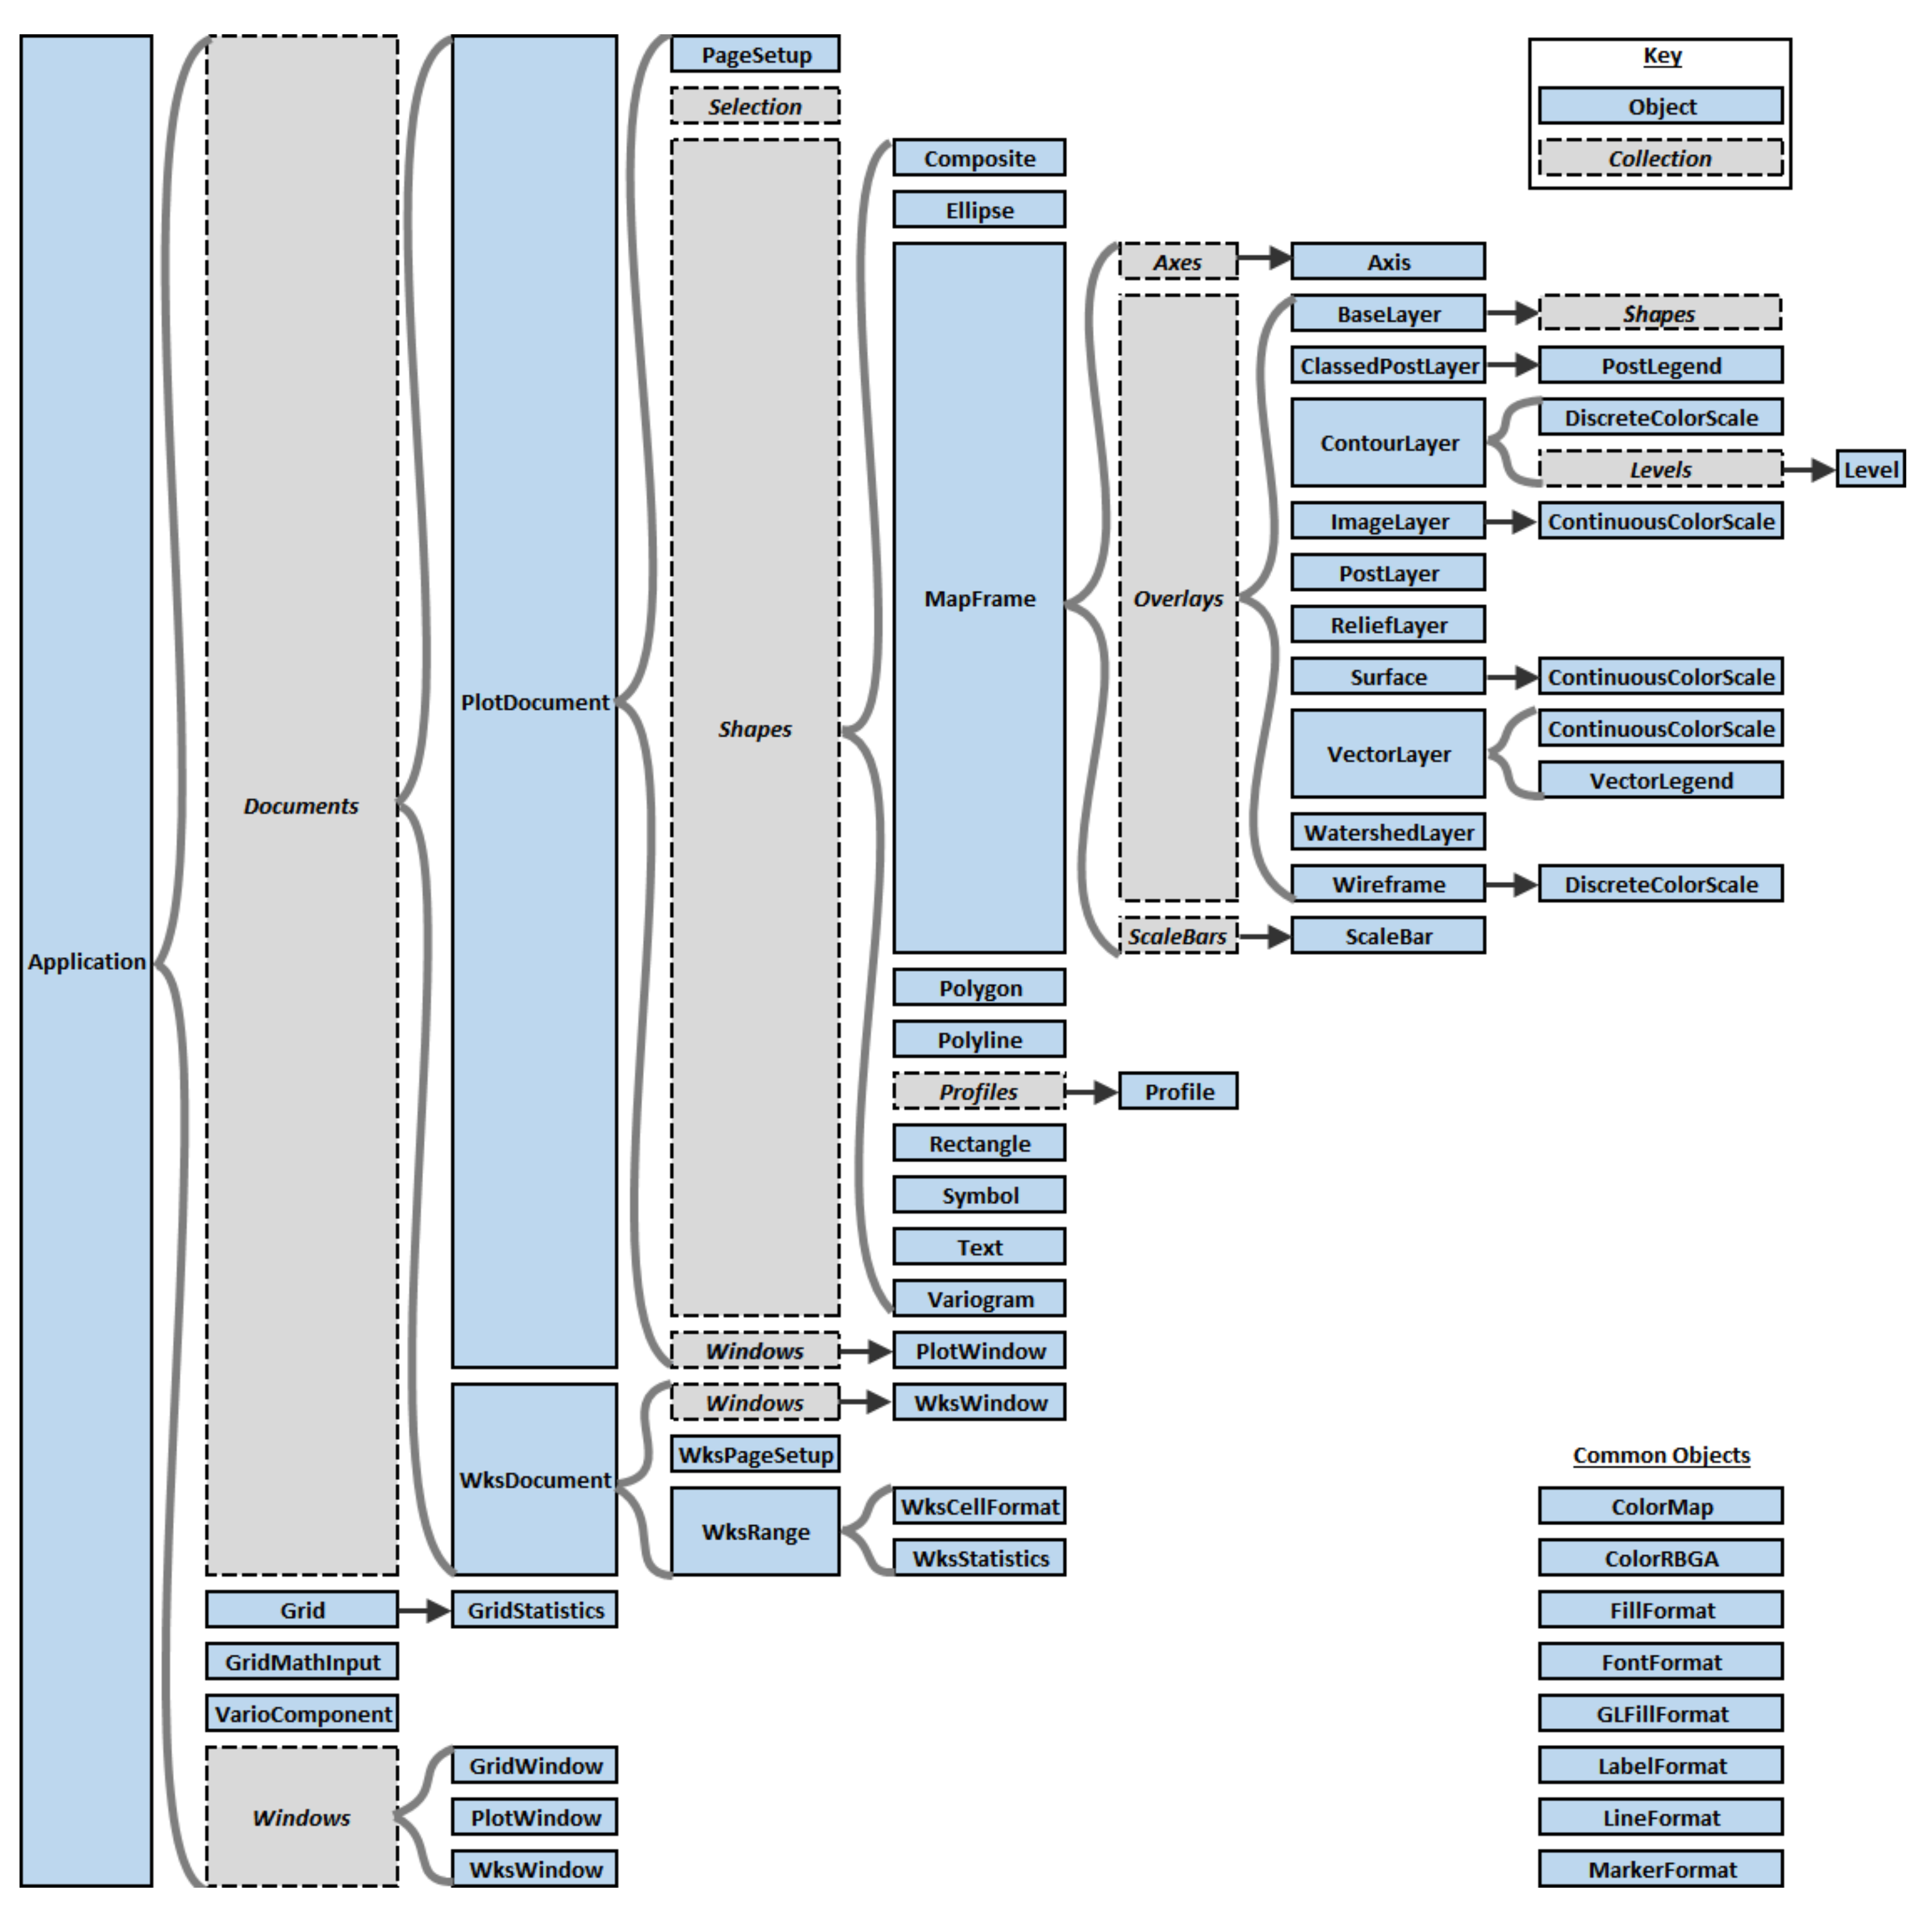
3.1. Working with Objects Voxler and Surfer in Visual Studio 2019

Voxler and Surfer can be called from any automation-compatible programming languages such as VB.NET. In our case, this approach is applied in the implementation of programs Kaolin_A and Kaolin_Viz in Visual Studio 2019 [18]. To utilize Voxler and Surfer in this environment, the implementation must include a reference to this application.
Figure 6 describes the Voxler automation model. The model presents a flow chart to create the type of considered module using automation and shows which objects provide access to other objects in the hierarchy. At the top of the hierarchy, the “Application” object is located, and all objects are directly accessible from this root object. However, to access objects located deeper in the hierarchy, one has to traverse from the “Application” object through one or more layers of sub-objects. The “CommandApi” object contains all properties of the various modules in the Voxler program. “CommandApi” refers to accessing the commands from the “Application” programming interface. Using the “CommandApi” object requires accessing the property with the “Construct method”, specifying any settings with the “Option method”, and performing the action with the “Do” or “DoOnce” method.
In Figure 7, the Surfer automation object model is presented. This chart shows objects that provide access to other objects. Surfer groups most objects in collections. Collection of objects are containers for groups of related objects. Although these collections contain different types of data, they can be processed using similar techniques. Non-container objects are very specific for Surfer. Several objects presented in Figure 7 share common features (e.g., “PlotDocument” provides “SaveAs”, “Activate”, and “Close” methods). The online Surfer help is the complete reference for all Surfer automation objects, their properties, and their methods.

3.2. Program Kaolin_A

The updated input data (see Section 2, Steps 2–5) is further processed by the program Kaolin_A. Figure 8 shows the application window for entering input parameters. It is necessary to check the input parameters of the directories and files specified in the initialization file. It is also important to check the input parameters for 3D interpolation—anisotropy, grid geometry and selection of samples specified in the initialization file.
We chose the interpolation method of inverse distances with a significant length of the X- and Y-axes (in this example it is 200 m) and minimal length of the Z-axis (in this example it is 2 m) of a spatial ellipse of anisotropy (Figure 9) and sampling (Figure 10). This is because we could not find generic laws of spatial distribution in the monitored technological parameters, due to the origins of the raw material. The specified geometry parameters for the 3D gridding are presented in Figure 11.
Different input parameters of the Kaolin_A program calculation allow to create different variants of the model. By comparing the predictions of different model variants with the results of mining after commencing of works, it will be possible to select the optimal variant of the model. For each variant, the input parameters are defined in the initialization text file, which is the input for the Kaolin_A program. These parameters are displayed after the program execution (see Figure 8, Figure 9, Figure 10 and Figure 11).
The program Kaolin_A limits 3D grids of the bottom and the top of the kaolin deposit with the help of the “Math” object. Moreover, the “Math” object exports (if the “Export 2D grids” button is checked—see Figure 8) 2D grids in the format grd (Surfer) of individual horizontal layers of all technological parameters to the directory specified in the initialization file for further processing by the program Kaolin_Viz.
The following VB.NET code sample (Figure 12) using the Voxler automation object exports the resulting grids of the monitored technological parameters to the directory specified in the initialization file.
Figure 13, Figure 14 and Figure 15 demonstrate 3D visualization of the monitored technological parameters. These results are outputs of the Kaolin_A software in the Voxler environment.

3.3. Program Kaolin_Viz

The program Kaolin_A creates 2D grids output in the format grd (Surfer) of individual horizontal layers of all technological parameters (see Section 2, Step 6). Afterwards, these data are further processed by the program Kaolin_Viz.
Figure 16 demonstrates a window for entering user’s input parameters. It is required to check the input parameters of the directories and files entered in the initialization file, the input parameters for categorizing inventory blocks, the inventory estimates and the visualization entered in the initialization file. By changing the input parameters for categorizing inventory blocks in the initialization file, different usability conditions can be set (different from the values listed in Table 1). In this way, variant stock estimates can be created according to the currently entered usability conditions.
The program Kaolin_Viz contains four modules. The buttons for starting the individual program modules (Figure 17) are displayed after entering the input parameters (Figure 16) and pressing the “OK” button.
After starting the first module with the button “Categorization of blocks—calculation of grids 2D, transfer to 3D”, the categorization of blocks of reserves is performed, based on the grid kaolin outwash, Al2O3, Fe2O3, TiO2, and Fe2O3 + TiO2 exported by Kaolin_A and the entered parameters of categories of reserves in 2D and their transfer to 3D. A text file is generated (input for the “Displaying the blocks of categories in 3D” in the Voxler environment). Additionally, the first module creates the resulting stock of the deposit (text file). An example of part of this file is demonstrated in Figure 18.
It is necessary to run this first module to create the grids used in the other three models.
The second module of the program Kaolin_Viz performs the visualization of horizontal cuts in 2D in the Surfer environment (button “Displaying of the horizontal cuts specified layers”). Before starting, it is possible to enter the values Zmin and Zmax (both in meters above sea level) of the layers to be processed in the frame “Horizontal cuts—visualization parameters” (Figure 16) and then confirm these values by pressing the button “OK”. Figure 19 shows a visualization of one of the 85 horizontal cuts generated in the Surfer environment.
The third module of the program Kaolin_Viz provides the visualization of the vertical sections in 2D in the Surfer environment. Before starting, it is possible to enter the values of the geometry of the network of vertical cuts to be processed in the frame “Vertical cuts” (Figure 16), and then to confirm these values by pressing the button “OK”. Figure 20 and Figure 21 demonstrate a visualization of the 9 XZ and 9 YZ vertical cuts, respectively, generated in the Surfer environment.
The fourth Kaolin_Viz module provides several visualization options of the blocks of categories in 3D in the Voxler environment by pressing the button “Display the blocks categories in 3D”. Figure 22 is an example of one of the available visualization of categories of blocks of reserves in 3D generated by module 4 of the program Kaolin_Viz in the Voxler environment.
The following example contains a part of VB.NET code (Figure 23) with the Surfer automation model to visualize horizontal cuts of the kaolin deposit, specifically by plotting positions and names of drill holes.
The estimation of kaolin reserves is commonly calculated in a simplistic way, which does not reflect the state-of-the-art computational methods developed and published in the technical literature. For instance, regarding the area considered in this paper, the most recent recalculations of the kaolin reserves have been performed by the method of geological blocks [21]. The method is based on the fact that the volume of stocks is equal to the product of the block area and the average thickness of the raw material. The mass is equal to the product of the volume and the density determined in the applicable conditions of usability. Blocks of stocks were determined based on the deposit evaluation of archive drill holes. The basic rule for interpolation was determined as 1/3 of the distance between the balance and negative drill holes for balance (economic) reserves, 1/2 of the distance between the balance and non-balance drill holes for balance (economic) reserves and 1/2 of the distance between non-balance and negative drill holes for non-balance (potentially economic) reserves [21]. It is obvious that such imprecisely defined boundaries of geological blocks lead to an inaccurate estimate of the volume of blocks and thus to an inaccurate estimation of reserves. Additionally, the rough method of determining the kaolin outwash content, Al2O3 content, Fe2O3 content and TiO2 content (arithmetic average of the average values of these parameters in the wells located in the geological block) for the entire geological block leads to an inaccurate categorization of reserves.
For a more economical usage of the reserves novel methods are needed. The proposed methodological procedure and newly created software provide a way to achieve this goal. When we compare the estimates of reserves by the method of geological blocks [21] with the results based on our study, it is clear that the proposed methodological procedure and newly created software provide a much more reliable reflection of reality in the resulting model. A comparison of the reserves calculated by the geological block method [21] with the results of our study per type of kaolin shows that the volume of “kaolin for production of pottery“ (categories K1, K2, K2A and K51) is 30% higher in the current study. The volume of “kaolin for the production of ceramics after reducing the TiO2 content” (categories K2B, K3B and K4B) is 96% higher in the current study and the volume of “kaolin for other ceramic industry” (categories K3, K4J and K4) is 81% higher in the current study.
The approach presented in this study has the following advantages relative to the quality of the material extracted and the possible end use:
  • Detailed and precise spatial definition of categories of reserves (see Table 1), based on precisely determined spatial distribution of kaolin outwash content, Al2O3 content, Fe2O3 content and TiO2 content—implementation by the Kaolin_A program;
  • The possibility to perform variant inventory estimates according to the entered input parameters and usability conditions—implementation by repeated launching of the Kaolin_A and Kaolin_Viz programs;
  • Various ways of detailed visualization of the model in 3D (in the Voxler environment) and in the form of sections in 2D (in the Surfer environment)—implementation by the Kaolin_Viz program;
  • The possibility of immediate updating of the model according to data from additional exploration and/or mining;
  • The possibility of targeted selective kaolin extraction according to the required stock category for different processing purposes (see Table 1).

4. Conclusions

The kaolin deposit modelling methodology (see Section 2) specifies the individual steps of the methodological procedure from the acquisition of the necessary input data from archival documentation, through the application of modern algorithms for creating a 3D bearing model, to inventory estimates and deposit visualization in 2D and 3D (including inventory categories). This methodology, together with the developed software (see Section 3), allows the creation of variant models of the kaolin deposit using different input parameters of the calculation and/or different usability conditions. It also allows quick updates of these models when adding input data from ongoing mining.
Section 3 also shows the various outputs (Figure 13, Figure 14, Figure 15, Figure 18, Figure 19, Figure 20, Figure 21 and Figure 22) of a model variant with the setting of input parameters according to Figure 8, Figure 9, Figure 10 and Figure 11 and with the set usability conditions according to Table 1.
Comparison of variants of kaolin deposit models with results of mining after its start will allow to select the optimal setting of input parameters of the calculation. According to the model with the input parameters set in this way, the model will lead to an optimal selective extraction of kaolin of the required quality.

Author Contributions

Conceptualization, František Staněk; Methodology, Marcela Jarošová and František Staněk; Resources, Marcela Jarošová; Software, Marcela Jarošová and František Staněk; Validation, František Staněk; Writing—original draft, Marcela Jarošová. All authors have read and agreed to the published version of the manuscript.

Funding

This research was funded by the Technology Agency of the Czech Republic (Project No. TE02000029—Competence Centre for Effective and Ecological Mining of Mineral Resources).

Institutional Review Board Statement

Not applicable.

Informed Consent Statement

Not applicable.

Data Availability Statement

The data presented in this study are available on request from the corresponding author.

Conflicts of Interest

The authors declare no conflict of interest.

References

  1. Geology.cz, Czech Republic. Available online: https://www.youtube.com/watch?v=U3KuCpVg6Vk (accessed on 18 May 2021).
  2. Pruett, R.J. Kaolin deposits and their uses: Northern Brazil and Georgia, USA. Appl. Clay Sci. 2016, 131, 3–13. [Google Scholar] [CrossRef]
  3. Koneshloo, M.; Chiles, J.P. Modelling of the kaolin deposits and reserve classification challenges of Charentes Basin, France. Int. J. Min. Environ. Issues 2010, 1, 55–63. [Google Scholar]
  4. Sobolevskyi, R.; Vaschuk, A.; Tolkach, O.; Korobiichuk, V.; Levytskyi, V. A procedure for modeling the deposits of kaolin raw materials based on the comprehensive analysis of quality indicators. East. Eur. J. Enterp. Technol. 2017, 3, 54–66. [Google Scholar] [CrossRef] [Green Version]
  5. Kogel, J.E. Mining and Processing Kaolin. Elements 2014, 10, 189–193. [Google Scholar] [CrossRef]
  6. Zhang, X.; Zhang, J.; Tian, Y.; Li, Z.; Zhang, Y.; Xu, L.; Wang, S. Urban geological 3D modeling based on papery borehole log. ISPRS Int. J. Geo-Inf. 2020, 9, 389. [Google Scholar] [CrossRef]
  7. Hou, Z.W.; Qin, C.Z.; Zhu, A.X.; Liang, P.; Wang, Y.J.; Zhu, Y.Q. From manual to intelligent: A review of input data preparation methods for geographic modeling. ISPRS Int. J. Geo-Inf. 2019, 8, 376. [Google Scholar] [CrossRef] [Green Version]
  8. Li, X.; Yuan, F.; Zhang, M.; Jia, C.; Jowitt, S.M.; Ord, A.; Zheng, T.; Hu, X.; Li, Y. Three-dimensional mineral prospectivity modeling for targeting of concealed mineralization within the Zhonggu iron orefield, Ningwu Basin, China. Ore Geol. Rev. 2015, 71, 633–654. [Google Scholar] [CrossRef]
  9. Battalgazy, N.; Madani, N. Categorization of Mineral Resources Based on Different Geostatistical Simulation Algorithms: A Case Study from an Iron Ore Deposit. Nat. Resour. Res. 2019, 28, 1329–1351. [Google Scholar] [CrossRef]
  10. Li, C.; Liu, B.; Guo, K.; Li, B.; Kong, Y. Regional Geochemical Anomaly Identification Based on Multiple-Point Geostatistical Simulation and Local Singularity Analysis—A Case Study in Mila Mountain Region, Southern Tibet. Minerals 2021, 11, 1037. [Google Scholar] [CrossRef]
  11. Liu, L.; Li, J.; Zhou, R.; Sun, T. 3D modeling of the porphyry-related Dawangding gold deposit in south China: Implications for ore genesis and resources evaluation. J. Geochem. Explor. 2016, 164, 164–185. [Google Scholar] [CrossRef]
  12. Hosseini, S.A.; Asghari, O. Multivariate Geostatistical Simulation on Block-Support in the Presence of Complex Multivariate Relationships: Iron Ore Deposit Case Study. Nat. Resour. Res. 2019, 28, 125–144. [Google Scholar] [CrossRef]
  13. Li, N.; Song, X.; Li, C.; Xiao, K.; Li, S.; Chen, H. 3D Geological Modeling for Mineral System Approach to GIS-Based Prospectivity Analysis: Case Study of an MVT Pb–Zn Deposit. Nat. Resour. Res. 2019, 28, 995–1019. [Google Scholar] [CrossRef]
  14. Paithankar, A.; Chatterjee, S. Grade and Tonnage Uncertainty Analysis of an African Copper Deposit Using Multiple-Point Geostatistics and Sequential Gaussian Simulation. Nat. Resour. Res. 2018, 27, 419–436. [Google Scholar] [CrossRef]
  15. Tao, J.; Yuan, F.; Zhang, N.; Chang, J. Three-Dimensional Prospectivity Modeling of Honghai Volcanogenic Massive Sulfide Cu–Zn Deposit, Eastern Tianshan, Northwestern China Using Weights of Evidence and Fuzzy Logic. Math. Geosci. 2021, 53, 131–162. [Google Scholar] [CrossRef]
  16. Mao, X.; Ren, J.; Liu, Z.; Chen, J.; Tang, L.; Deng, H.; Bayless, R.C.; Yang, B.; Wang, M.; Liu, C. Three-dimensional prospectivity modeling of the Jiaojia-type gold deposit, Jiaodong Peninsula, Eastern China: A case study of the Dayingezhuang deposit. J. Geochem. Explor. 2019, 203, 27–44. [Google Scholar] [CrossRef]
  17. Dagasan, Y.; Erten, O.; Renard, P.; Straubhaar, J.; Topal, E. Multiple-point statistical simulation of the ore boundaries for a lateritic bauxite deposit. Stoch. Environ. Res. Risk Assess. 2019, 33, 865–878. [Google Scholar] [CrossRef]
  18. Microsoft MSDN Library. Available online: https://docs.microsoft.com/cs-cz/visualstudio/?view=vs-2019 (accessed on 8 June 2021).
  19. Explore the Depths of Your Data—Surfer. Available online: http://www.goldensoftware.com/products/surfer/features (accessed on 8 June 2021).
  20. Power Forward into 3rd Visualization—Voxler. Available online: http://www.goldensoftware.com/products/voxler/features (accessed on 8 June 2021).
  21. Tvrdý, J.; Bartošová, J.; Burdová, A. Závěrečná Zpráva Geologického úkolu Jimlíkov-Východ (Přehodnocení Ložiska Keramického Kaolinu a Cihlářské Suroviny Jimlíkov-Sever v Dobývacím Prostoru Jimlíkov II; GET 13/157; GET: Prague, Czech Republic, 2014; (Unpublished work). [Google Scholar]
  22. Remy, N.; Boucher, A.; Wu, J. Applied Geostatistics with SGeMS: A User’s Guide, 1st ed.; Cambridge University Press: Cambridge, UK, 2009; p. 264. [Google Scholar]
  23. Jadrníček, P. Závěrečná Zpráva Božičany; Archiv Geofondu: Prague, Czech Republic, 1960; (Unpublished work). [Google Scholar]
  24. Křelina, B.; Skopový, J.; Vaníček, P.; Macourek, K.; Kautský, J.; Milický, V. Závěrečná Zpráva Jimlíkov; Archiv Geofondu: Prague, Czech Republic, 1969; (Unpublished work). [Google Scholar]
  25. Skopový, J.; Radimský, V.; Slíva, K.; Macourek, K.; Andres, E.; Kautský, J.; Milický, V.; Konzálová, M. Závěrečná Zpráva Božičansko Sever; Archiv Geofondu: Prague, Czech Republic, 1976; (Unpublished work). [Google Scholar]
  26. Hrzina, P.; Macourek, K.; Skopový, J.; Jícha, J.; Raus, M. Závěrečná Zpráva Jimlíkov II; Archiv Geofondu: Prague, Czech Republic, 1985; (Unpublished work). [Google Scholar]
  27. Tvrdý, J.; Kabát, F.; Fulková, J.; Jícha, J.; Macourek, K.; Milický, V. Závěrečná Zpráva Jimlíkov-Sever; Archiv Geofondu: Prague, Czech Republic, 1986; (Unpublished work). [Google Scholar]
  28. Neumann, J.; Uhrová, J.; Fulková, J.; Kautský, J.; Hrzina, P.; Buček, T.; Štrouf, R. Závěrečná Zpráva Jimlíkov-Sever II; Archiv Geofondu: Prague, Czech Republic, 1992; (Unpublished work). [Google Scholar]
  29. Deutsch, C.V.; Journel, A.G. GSLIB—Geostatistical Software Library and User’s Guide, 2nd ed.; Oxford University Press: New York, NY, USA, 1998; p. 369. [Google Scholar]
Figure 1. Available historical drill holes of the area of interest based on a geological map according to [21].
Ijgi 10 00788 g001
Figure 2. Deposit demarcation and exploratory drill holes used in our computations.
Ijgi 10 00788 g002
Figure 3. Part of the data for next processing.
Ijgi 10 00788 g003
Figure 4. Example of visualization of data transferred to the SGeMS environment—the example presented depicts the visualization of kaolin outwash.
Ijgi 10 00788 g004
Figure 5. Histogram of frequencies of parameters Al2O3, Fe2O3, TiO2 and kaolin outwash (wt %), and their basic statistical characteristics.
Ijgi 10 00788 g005
Figure 6. Voxler automation model [20], including objects (yellow boxes), methods, as well as properties (gray boxes).
Ijgi 10 00788 g006
Figure 7. Surfer automation object model [19], including collection objects (gray boxes) and objects (blue boxes).
Ijgi 10 00788 g007
Figure 8. Window of program Kaolin_A for setting the calculation parameters.
Ijgi 10 00788 g008
Figure 9. Specified anisotropy parameters for the 3D gridding (object “Gridder”) taken from the initialization file.
Ijgi 10 00788 g009
Figure 10. Specified sample selection parameters for 3D gridding (object “Gridder”) taken from the initialization file.
Ijgi 10 00788 g010
Figure 11. Specified parameters of the grid geometry for 3D gridding (object “Gridder”) taken from the initialization file.
Ijgi 10 00788 g011
Figure 12. Example of program code using Voxler automation model.
Ijgi 10 00788 g012
Figure 13. Three-dimensional visualization of the Al2O3 content—Plotting the 3D grid using VolRender.
Ijgi 10 00788 g013
Figure 14. Three-dimensional visualization of the Fe2O3 content—Plotting the 3D grid using ScatterPlot.
Ijgi 10 00788 g014
Figure 15. 3D visualization of the TiO2 content—Plotting the 3D grid using FaceRender.
Ijgi 10 00788 g015
Figure 16. Window of program Kaolin_Viz for setting the calculate parameters.
Ijgi 10 00788 g016
Figure 17. Window of the program Kaolin_Viz after the confirmation of input parameters.
Ijgi 10 00788 g017
Figure 18. Sample part of the resulting stock of the deposit.
Ijgi 10 00788 g018
Figure 19. Visualization of a horizontal section 418 m a.s.l. in the Surfer environment.
Ijgi 10 00788 g019
Figure 20. Visualization of vertical section XZ 1007700 in the Surfer environment.
Ijgi 10 00788 g020
Figure 21. Visualization of vertical section YZ 854600 in the Surfer environment.
Ijgi 10 00788 g021
Figure 22. Three-dimensional visualization of categories of blocks of reserves (FaceRender).
Ijgi 10 00788 g022
Figure 23. Code sample using the Surfer object model.
Ijgi 10 00788 g023
Table 1. Categorization of ceramic kaolin in the Karlovy Vary region [21].
Category
(Class)
Kaolin
Outwash
[wt %]
Al2O3
[wt %]
Fe2O3
[wt %]
TiO2
[wt %]
Fe2O3 + TiO2
[wt %]
Usage
K1>15>36<0.9<0.3<1.1Kaolin for production
of pottery
K2>15>36<1.1<0.4<1.2
K2A>1534–36-<0.5<1.2
K51>10>36-<0.3<1.0
K2B>15>36->0.4<1.6Kaolin for production of ceramics after reducing the TiO2 content
K3B>15>36->0.5<2.0
K4B>15>34->0.5<2.5
K3>15>34-<0.5<1.6Kaolin for other ceramicindustry
K4J>35>34--<5.0
K4>15---<3.0
K5(NEG)>10--->3.0Inappropriate kaolin
Publisher’s Note: MDPI stays neutral with regard to jurisdictional claims in published maps and institutional affiliations.

