Article

Escaping from Cities during the COVID-19 Crisis: Using Mobile Phone Data to Trace Mobility in Finland

1
Digital Geography Lab, Department of Geosciences and Geography, University of Helsinki, FI-00014 Helsinki, Finland
2
Helsinki Institute of Sustainability Science, Institute of Urban and Regional Studies, University of Helsinki, FI-00014 Helsinki, Finland
*
Author to whom correspondence should be addressed.
ISPRS Int. J. Geo-Inf. 2021, 10(2), 103; https://0-doi-org.brum.beds.ac.uk/10.3390/ijgi10020103
Submission received: 28 November 2020 / Revised: 15 February 2021 / Accepted: 19 February 2021 / Published: 23 February 2021

Abstract

:
The coronavirus disease 2019 (COVID-19) crisis resulted in unprecedented changes in the spatial mobility of people across societies due to the restrictions imposed. This also resulted in unexpected mobility and population dynamics that created a challenge for crisis preparedness, including the mobility from cities during the crisis due to the underlying phenomenon of multi-local living. People changing their residences can spread the virus between regions and create situations in which health and emergency services are not prepared for the population increase. Here, our focus is on urban–rural mobility and the influence of multi-local living on population dynamics in Finland during the COVID-19 crisis in 2020. Results, based on three mobile phone datasets, showed a significant drop in inter-municipal mobility and a shift in the presence of people—a population decline in urban centres and an increase in rural areas, which is strongly correlated to secondary housing. This study highlights the need to improve crisis preparedness by: (1) acknowledging the growing importance of multi-local living, and (2) improving the use of novel data sources for monitoring population dynamics and mobility. Mobile phone data products have enormous potential, but attention should be paid to the varying methodologies and their possible impact on analysis.

1. Introduction

Human mobility plays an integral part in the global outbreak of the coronavirus disease 2019 (COVID-19) pandemic. First, the mobility of people is a prerequisite for face-to-face social interactions between people and, thus, it is a mediator of virus transmission, both globally and locally [1,2]. Second, most-prevailing COVID-19 containment and mitigation measures by authorities to protect society focus on restricting mobility and spatial behaviour of people. In many countries, the measures that were applied included movement restrictions within and between countries, the closure of public facilities, such as schools and libraries, and temporarily closing workplaces, and retail and entertainment facilities. People were strongly encouraged to stay at their homes, but regional lockdowns and curfews were also put in place. Initial studies indicate the effectiveness of abovementioned spatial measures on curbing the pandemic, in particular cancelling public events, restricting private gatherings, closure of schools and self-isolation at home [3,4].
The mobility restrictions reduced movements of people at all levels from global travel to local activities such as daily commuting between home and work [5,6,7]. Put differently, not only did this reduced the overall mobility of people at large [8], but it also changed the existing structures of mobility flows within societies [9]. The most drastic reduction in mobility flows and the presence of people occurred within typically busy urban mobility hubs such as metro stations [10] and dense urban centres [11,12]. By forcing people to stay at home and to work remotely means shrinkage of the morning mobility flows from rural and suburban areas towards city centres, and the opposite evening flows. Instead, movements were more bound to one’s local community [10]. Furthermore, the containment measures might create new unexpected mobility flows from dense urban areas towards rural regions [13].
In fact, not much attention has been paid to the mobility of people from urban to rural areas in the context of the COVID-19 crisis, nor to the underlying phenomenon of multi-local living—living in more than one place and having multiple homes as “anchor points” in their lives [14]. The multi-local living is a globally growing phenomenon taking place for a range of reasons—from leisure practices, work- and educational-related necessities to familial matters (e.g., extended families, children separated from parents) [14]. For example, on average, some 15% of households in Europe own a secondary property [15]; while it is 13% in the U.S. [16], and in China over 20% of urban households (16% of rural households) own multiple homes [17]. While multi-local living is a diverse and heterogeneous phenomenon [14,18,19], it is far more complex than seasonal residence [20] and vacation-related second home tourism in the country [21].
People having multiple homes have more flexible lifestyles, but these are also more complex, because they have the option (sometimes also required) to reside in different homes at different times. Seasonal and weekend residences are the most visible examples of the urban–rural mobility flows [20,21,22]. However, these new mobility patterns and dynamic fluctuation of inhabitants lead to challenges for governance, policymaking, and planning. Local and national governments and administrative bodies need to have an overview of de facto inhabitants to provide adequate public services, yet they rely on “static” population information based on the assumption that people have only one home. Furthermore, amid societal disruptions, such as the nation-wide calls for remote working and the growing fear of infection in crowded urban centres during the COVID-19 crisis, can potentially cause unexpected mobility flows as people with multiple homes can choose which home to reside in. Not knowing these mobility flows and actual whereabouts of people causes a challenge for emergency management and planning. In the COVID-19 case, people changing their residences may not only spread the virus between regions, but also create situations in which health and emergency services have not prepared for the increase of inhabitants.
Against this background, our first aim is to explain how the first wave of the COVID-19 outbreak and the government’s actions to control infection rates in Finland affected the mobility between urban and rural areas, and the temporary residential choices of people in particular. Finland has an extensive network of secondary homes, and most of them have good mobile network coverage, allowing remote working that was recommended by the government. Hence, our hypothesis is that Finns moved to their second homes from bigger cities despite government instructions not to move from their homes. For that, we use big data approach to examine changes in mobility flows and the de facto distribution of the population in Finland using countrywide mobile phone-based data products. Our second aim is to address the importance of input data and discuss the applicability of aggregated mobile phone-based data products by mobile network operators for crisis management and for social good, in general.
Next, we contextualise our case study by describing multi-local living and COVID-19 in Finland (Section 2.1), how mobile phone data are used for COVID-19 research (Section 2.2), and what kind of different mobile phone data products are available (Section 2.3).

2. Background

2.1. Case Finland—Multi-Local Living and the COVID-19 Crisis

Multi-local living is a widespread phenomenon in Finland as in all Nordic countries, where roughly half of all Nordic households have access to a second home [23]. In Finland (population 5.5. million), some 24% of households own secondary homes [15], whereas multi-local living is tightly connected to seasonal residences—there are half a million summer cottages in the country [24]. In many rural municipalities, seasonal residence is multiplying the size of the temporary population during the summer, and rough estimates suggest approximately 1.5 million additional people live in rural areas in the summer compared to winter [20]. Overall, a recent study reveals that millions of Finns practice multi-local living for different reasons [25].
Finland was hit by the emergence of COVID-19 in March 2020 (as were other countries in Europe). After the World Health Organization (WHO) declared the outbreak to be a pandemic on 11 March 2020 [26], national governments gave a set of guidelines that included avoiding international travel, encouraging remote work, and avoiding any leisure-related domestic mobility. Given the significant number of people with multiple homes and the country’s highly developed IT sector offering ideal remote working opportunities, the setting provides a lucrative chance to escape from cities. Soon after, the media started reporting about people moving to their second homes despite government recommendations to prevent the potential overload of health services in rural municipalities, which created an extensive public discussion on the topic [13]. As an extreme measure, the Finnish government made a decision to restrict all non-necessary travel to and from the most populous region of Uusimaa, including the capital of Helsinki, which had become the national epicentre of the virus outbreak [27]. The lockdown lasted for two and a half weeks (28 March–15 April 2020). After the lockdown, the Finnish government continued to advise people to avoid moving to their secondary homes and any other leisure-related travel. Recent study estimates that over a million employees in Finland worked remotely during the first wave of COVID-19 and almost half of the all employees would prefer remote working, in general [28]. This gives flexibility for households to be more mobile and reside in secondary homes both during the pandemic and post-pandemic period.

2.2. Human Mobility, Mobile Phone Data, and COVID-19

Flexible lifestyles and mobility of people that shape the dynamics of spatial distribution of population is challenging to examine with traditional data sources (e.g., surveys and registers) to understand dynamic social phenomena, such as multi-local living. In the last two decades, mobile phone data have made it possible to reveal human mobilities and the structures of dynamic mobility flows across spatial scales at unprecedented detail [29,30]. Papers published in the well-established literature have identified mobility patterns from mobile phone data to understand a wide range of social processes and phenomena. This includes understanding the dynamic structures of urban mobility and population distribution [31], accessibility to services [32], functional regions and the urban-rural linkages [33], socio–spatial inequalities [34], the spread of infectious diseases [35], risk exposure assessment [36], and in crisis management and planning [37]. Furthermore, research on mobility patterns in relation to multi-local living has been limited by traditional data collection, but mobile phone data can capture both temporal variations of individual activity spaces [38,39], seasonal residence mobility [22], and multi-local living in different countries [40].
The COVID-19 crisis has demonstrated clearly the importance of mobile phone data for crisis management and response purposes. Mobile phone data are generated near real-time, and allow for metrics to support decision-making at multiple levels, for understanding the spatial dynamics of the epidemics, and preventing the spread of the virus [41,42]. Several studies have already applied mobile phone data to study the COVID-19 crisis from the perspective of the effects of confinement measures and mobility restrictions [6,8,43,44], the role of socioeconomic markers in explaining areal variability in infections [45], changes in travel distances and times [9,40,46], and changes in population distribution [7], or national mobility [47].
Despite these use cases, the use of mobile phone data to support pandemic response continue to present several challenges. These include the varying spatial and temporal resolutions of each data source [48] and difficulties to integrate them to reveal mobility dynamics on relevant scales [35]. Furthermore, access to data, the capacity to process complex data and establish the necessary interdisciplinary teams and collaborations, lack of political will, and concerns about data privacy and protection have remained challenges, and hindered widespread use of mobile phone data in operational decision making [42,49].

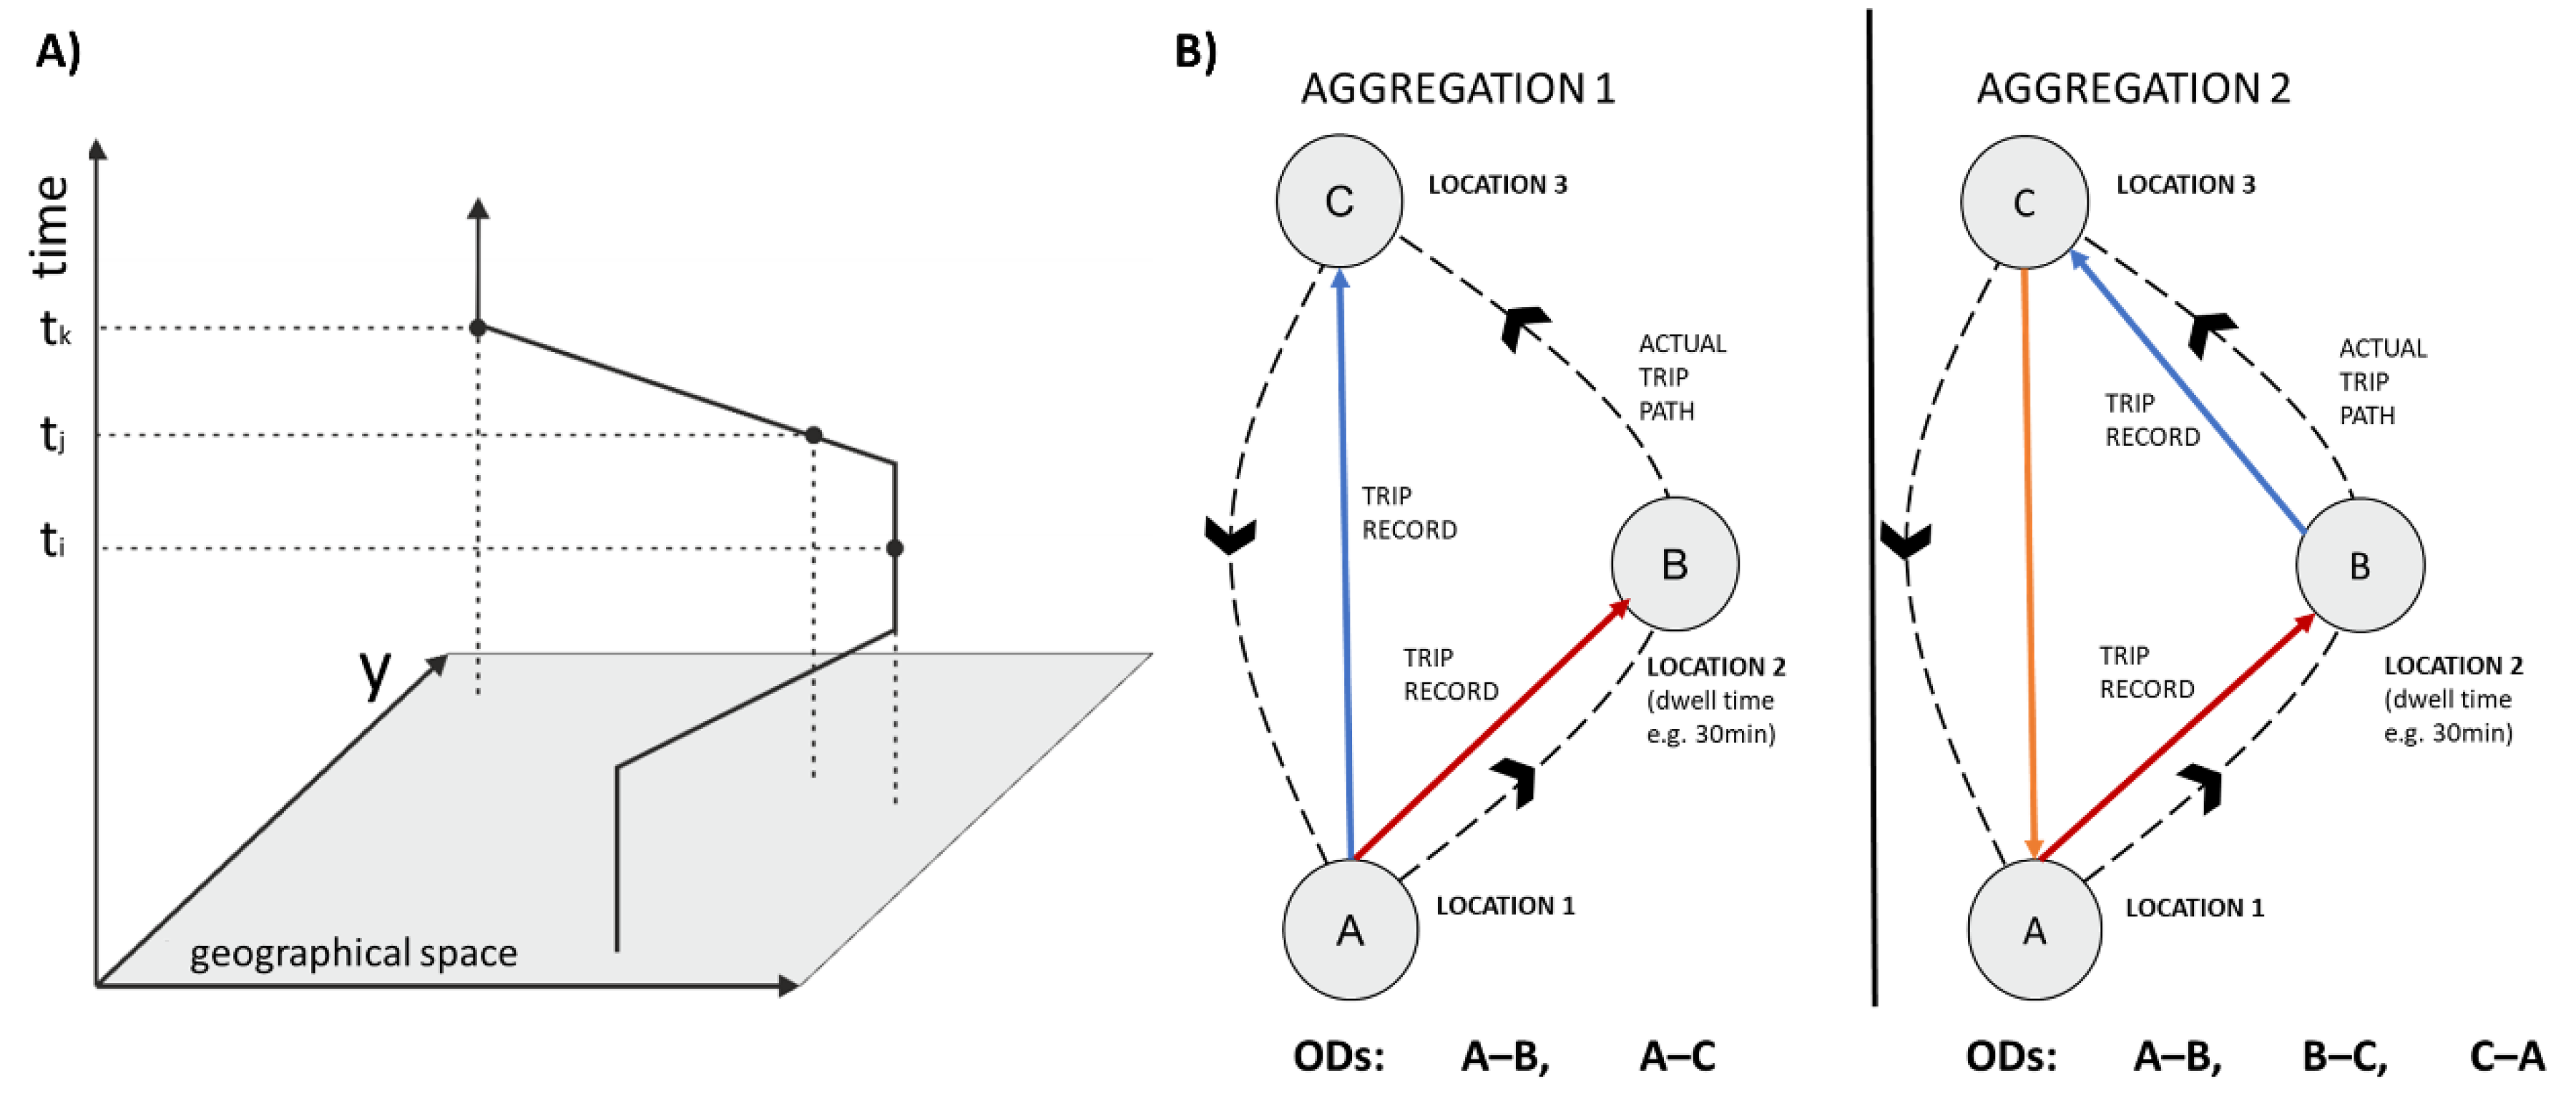
2.3. Definition of Presence, Activity, and Movement in Mobile Phone Data

Recently, mobile network operators have started to provide their own aggregated data products that allow us to overcome some of the challenges mentioned above. Yet, data products with undisclosed methodologies create new challenges, such as what exactly data represent as well as the compatibility of terminology. Mobile phone data from the network, regardless of their characteristics, can be broadly divided into two types, based on how data represent people—presence and mobility. How these have been defined and measured, however, varies by data products and data providers. We use the traditional geographical concept of the space–time path [50] to illustrate the differences.
Definition of presence strives for capturing of people’s whereabouts. Mobile phone data are generally processed from individual level space–time trajectories, thinking them as a series of location snapshots (Figure 1A). In the raw, individual level mobile phone data, each location snapshot is recorded when a mobile phone continuously connects to a base station. Therefore, a snapshot of a space-time trajectory at a given location and a moment in time is seen as a measure of (physical) presence. The snapshots do not necessarily imply stationary being in one location, but simply a momentary location. In aggregated mobile phone data, a measure of presence (also referred to as activity) is constituted by being aggregated over a certain time threshold within a spatial unit. The time threshold, which constitutes a measure of presence in aggregated datasets, therefore, has an important role in shaping the data as it influences which aggregated snapshots are identified as valid presence locations. The thresholds vary between operators and studies [42] examples being 20 minutes in our datasets, one hour in [47] and two hours in [7].
There are also varying practices relating to how mobility is defined in aggregated mobile phone datasets, which relate to varying purposes of presenting either individual trips (also referred to as movements) or more general mobility (Figure 1B). When the aggregated dataset strives to capture trips, a measure of trip can simply be defined as continuous sequence of valid presence locations in a space-time path. The aim of these datasets therefore is to capture all individual trips and the “origins” change according to the presence locations. However, if the purpose is to capture more general mobility, the “origin” is typically constant within 24 hours, such as the night location (e.g., [46]) or early morning location (e.g. [44]). In this case, the “origins” are more realistic representations of people’s home locations, allowing broader analyses of origin areas within a country. However, in these datasets, not all trips are recorded; when one commutes daily to another city, the return trips are not captured due to constant “origins”.
Regardless of the mobility definition, the time threshold to define the valid presence locations of people has an important role as it directly influences how the “destinations” in mobility datasets appear. When the selected time threshold is short, more trips are divided into multiple records, which complicates the identification of true travel chains. This means that “destinations” reveal that a person has been in a certain location momentarily, but not whether the place has been the end or a passing place of the trip or how long the person has stayed. These variations in definitions and aggregation practices set challenges for data validity evaluations and comparisons between multiple datasets provided by different mobile network operators.

3. Materials and Methods

3.1. Data

We used three anonymised and aggregated data products derived from mobile network data generated by two mobile network operators. Telia Finland via Telia Crowd Insights and Elisa are the two largest telecommunications companies in Finland having roughly one-third of the market share each [51]. The datasets were not openly available, but both operators provided their aggregated datasets for the COVID-19 research. The two datasets from Telia include: (1) activity location data and (2) origin–destination (OD) mobility data for the period 1 February–30 March, 2020, including three missing days (12 February, 13 February, and 25 February) in the dataset. Both datasets cover all of Finland and the number of people have been weighted to represent the total population based on the operator’s market share in individual’s place of residence (municipality).
First, the activity location data indicates the daily presence of individuals at the municipality level—once a person spends at least 20 minutes within one mobile network base station during given day, then one of her/his activity locations and thus his/her presence is counted in the municipality where the given base station is located. An individual’s presence is only counted in one municipality if they do not move beyond that municipality during the day, whereas their presence is counted in several municipalities if they spend over 20 minutes in each of several municipalities. The dataset does not reveal the place of residence of these people, and although it does not reveal actual movement between municipalities, it does reflect the overall mobility of people.
Second, the origin–destination mobility data indicates individual’s trips that are aggregated to daily mobility flows between municipalities. Each trip is defined as an individual’s movement between the two consecutive municipalities that are considered to be one’s activity locations (spent time over 20 min) for each day. Here, one long-distance travel instance can potentially be counted as several shorter trips, if the given trip includes some longer (>20 min) breaks during travel. Thus, long-distance travel may be underrepresented in the dataset and should be acknowledged while explaining the findings. The dataset does not reveal the place of residence of these people.
The third dataset by Elisa is another activity location dataset at the postal code area level from the Hospital District of Helsinki and Uusimaa (HUS) that is geographically more accurate than the municipality level. The data include 369 postal code areas from 24 municipalities. The dataset is from the period 1 January–31 May 2020 (22 weeks), including some missing days (19 January–10 February, 5 March and 7 April). The number of people were weighted to represent the entire population based on the operator’s market share in an individual’s place of residence in a postal code area. Similar to the Telia data, an individual’s activity location in a postal code area is considered once they spend at least 20 min there. In contrast to the first dataset by Telia, this dataset also has information on the distribution of people present in a postal code area by their place of residence in the postal code area. Place of residence is found for each day and defined as a postal code area with most time spent during the night hours on that day.

3.2. Methodology

We used Telia activity location data to understand changes in people’s presence at the municipal level. For that, we calculated the baseline value for each municipality as the average presence of people during the first seven days of February, and compared it against the daily variation in people’s presence during the first COVID-19 outbreak in Finland in March 2020. The daily presence of people was contrasted with the important days in March when the government in Finland announced guidelines and binding measures to restrict mobility to control the virus outbreak.
For studying the urban–rural linkage and the effect of multi-local living in the context of the first wave of COVID-19 in March 2020, we conducted four analyses. First, we correlated the differences from the baseline between the working day population and the weekend population during the last week of March in case of the 30 largest cities in Finland. Second, we correlate the difference in the working day population against the number of summer cottages by municipality per 1000 inhabitants as an indication for multi-local living. Third, to explore the mobility of people to their secondary rural homes, we examined the mobility flows from origin–destination (OD) data by Telia in the case of seasonal residence-dominated municipalities, Lohja and Sysmä. Lohja, a municipality with 46,000 inhabitants, is in Uusimaa and has a strong regional commuting pattern to the national capital, Helsinki, while it is also the fourth largest municipality regarding the number of summer cottages (n = 8500) in Finland [24]. Sysmä, a municipality with 3650 inhabitants, is in central Finland, and is the second largest municipality in terms of the relative proportion of summer cottages (n = 3900) compared to residential buildings.
Finally, to understand the urban–rural linkage and the effect of multi-local living in population presence during the lockdown of Uusimaa and gradual restriction relaxing, we analysed the third dataset, obtained from Elisa. Given its longer pre-COVID period and the fact that the first week of Telia data were missing from the Elisa data, we calculated the baseline value for each postal code area as the average presence of people during the period 6 January–14 March, 2020 (i.e., 10 weeks). As both reference periods included only “normal” pre-pandemic weeks, the difference in reference periods should not have biased our results. We also did not make comparisons between the datasets. First, we calculated a weekly average population presence for each postal code area for each of the 22 studied weeks and calculated the difference from the baseline value. Next, we clustered the weekly differences in the presence of population across the 22 weeks, per postal code area, into five clusters, using K-means clustering with 1000 iterations and 300 different centroid seeds. We tested multiple numbers of clusters, but chose five clusters as the optimal level for dividing study units into meaningful clusters regarding their the different mobility trends. Lower cluster numbers omitted meaningful differences in trends, while higher cluster numbers did not reveal any new clusters with a distinct trend.

4. Results

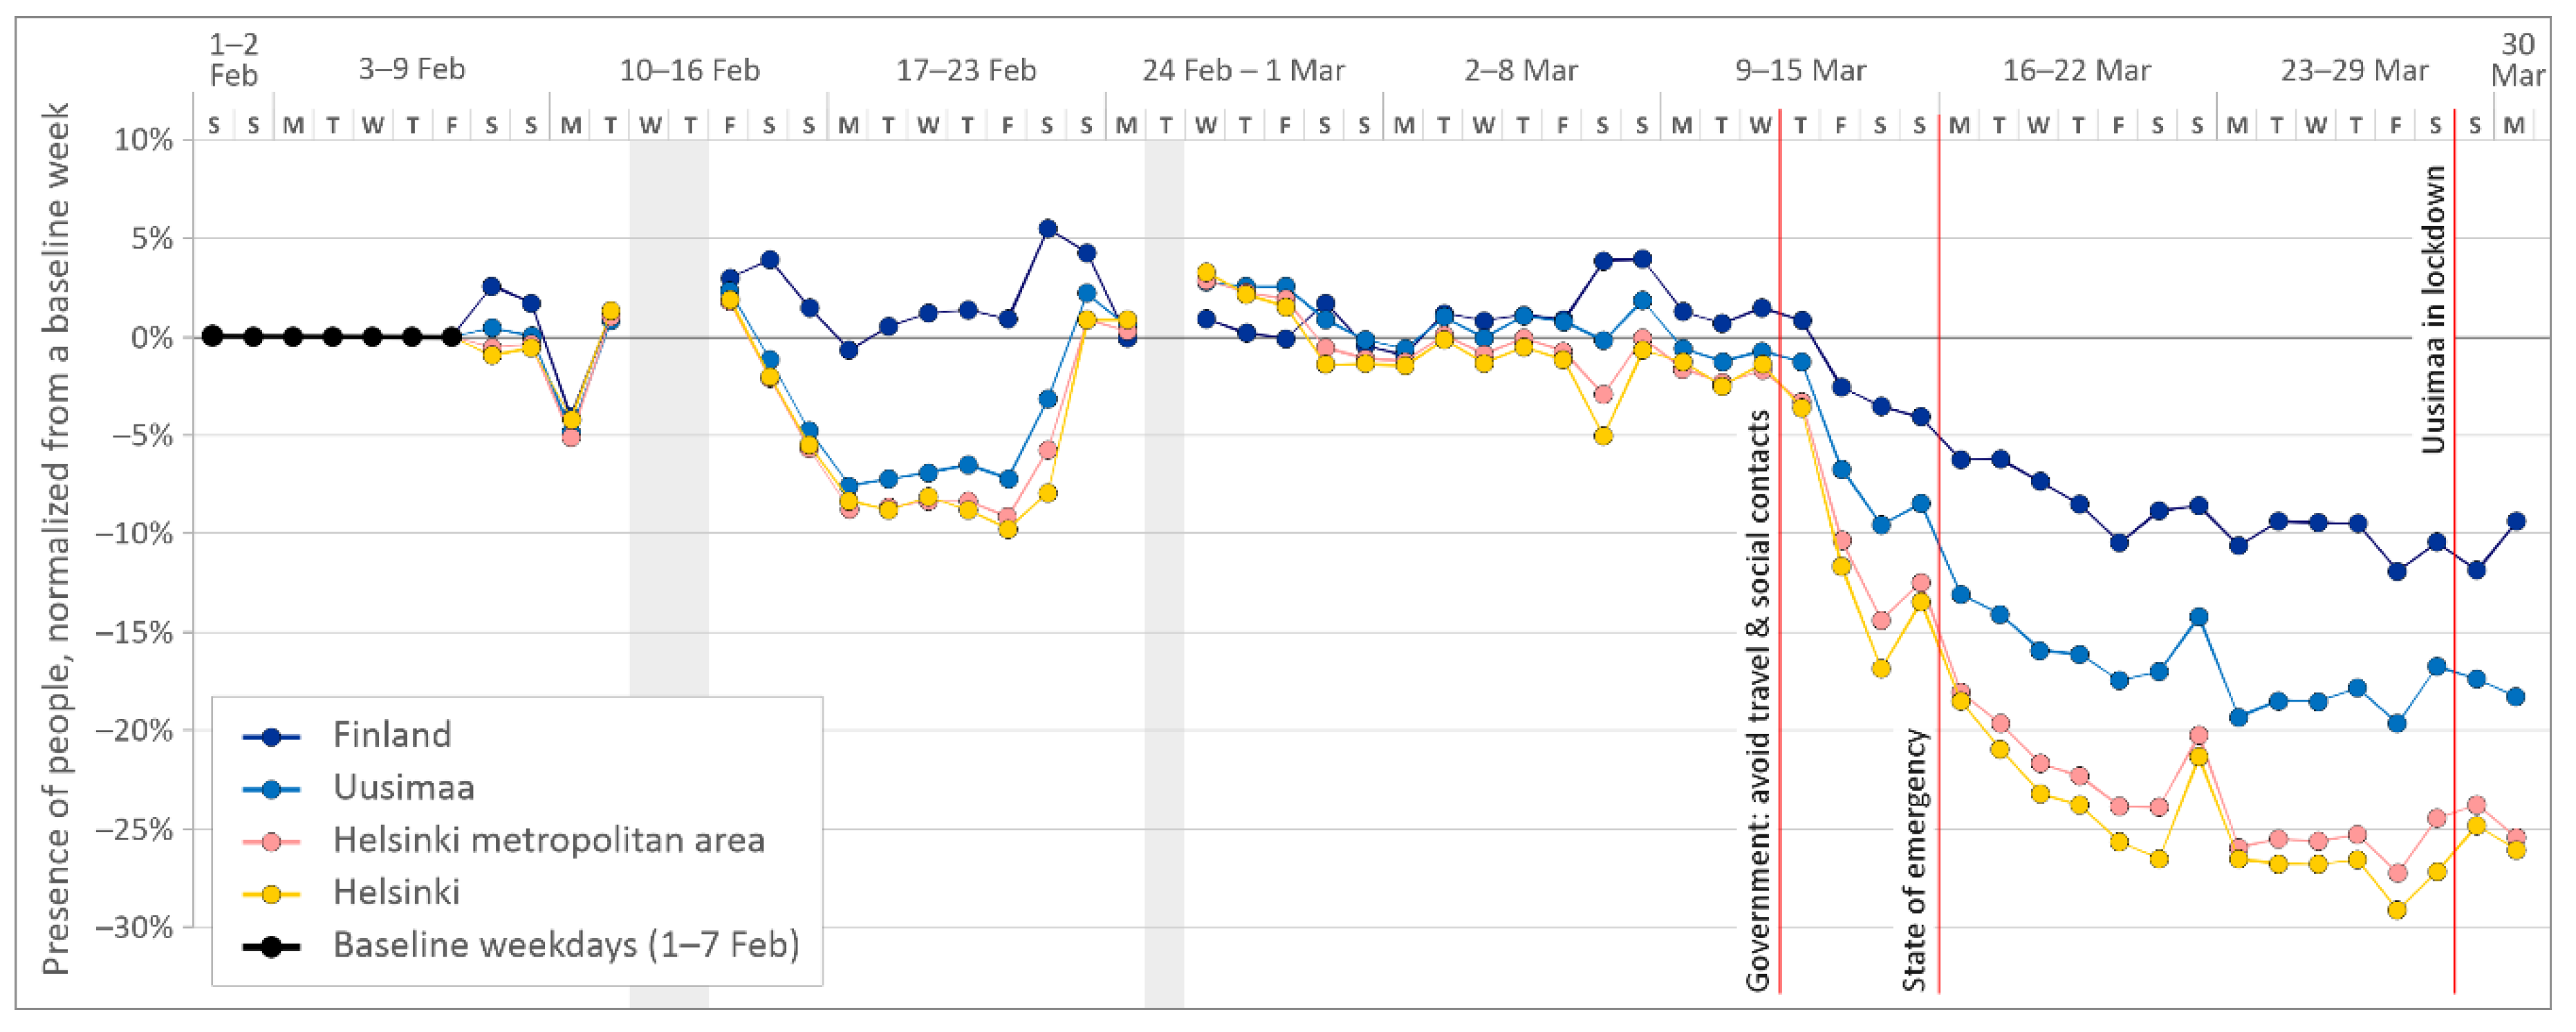
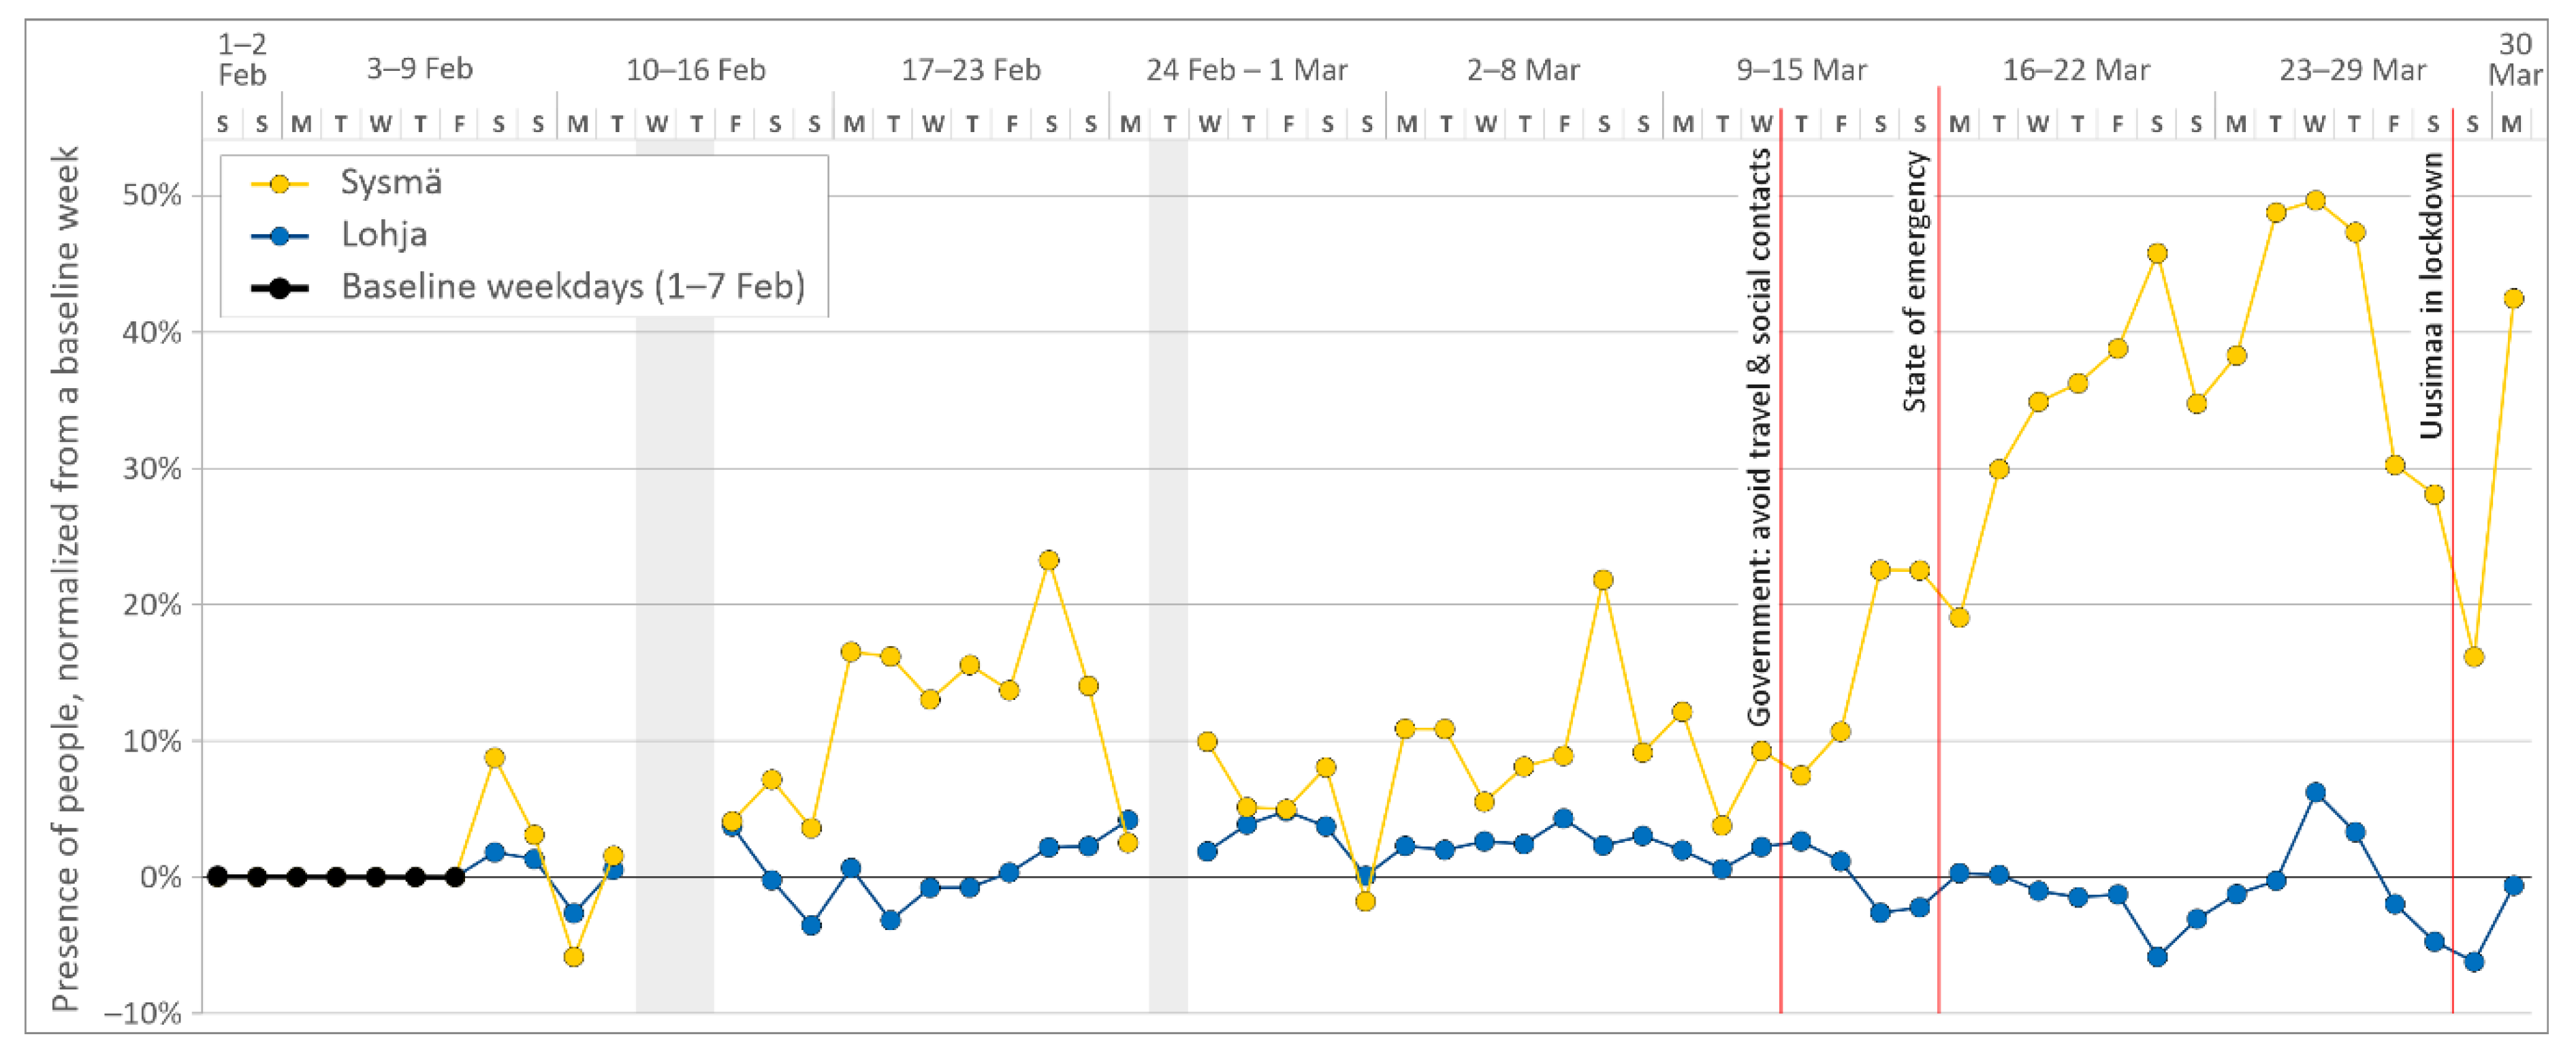
4.1. Decrease in Overall Mobility in Finland

The activity location data reveal the decrease of overall inter-municipality mobility in Finland from the second week of March (Figure 2). The most rapid decline in mobility occurred on 12 March after the recommendation by the government to avoid travel and to promote working remotely. The recommendation was a clear turning point and the later recommendations and binding restrictions had less influence on mobility. The overall inter-municipality mobility in the country decreased by 10% (average of week 13) from the baseline at the end of March, and for the Uusimaa region, the decrease was 18%. The decrease was more drastic for both Helsinki and its metropolitan area (HMA): 27% and 25%, respectively. Interestingly, the mobility in the Uusimaa region had already declined before the decision to close the region from all non-necessary inbound and outbound travel on 28 March took effect.
The presence of people on the first day of the state of emergency in Finland on 18.3 reveals two phenomena (Figure 3). First, people were still in northern Finland (Lapland) given the high season for winter holidays. Second, there was a population decrease in southern Finland and in larger urban areas. Ten days later, when the Uusimaa lockdown came into force, people left northern Finland and the presence of people in urban areas continued to decrease further.

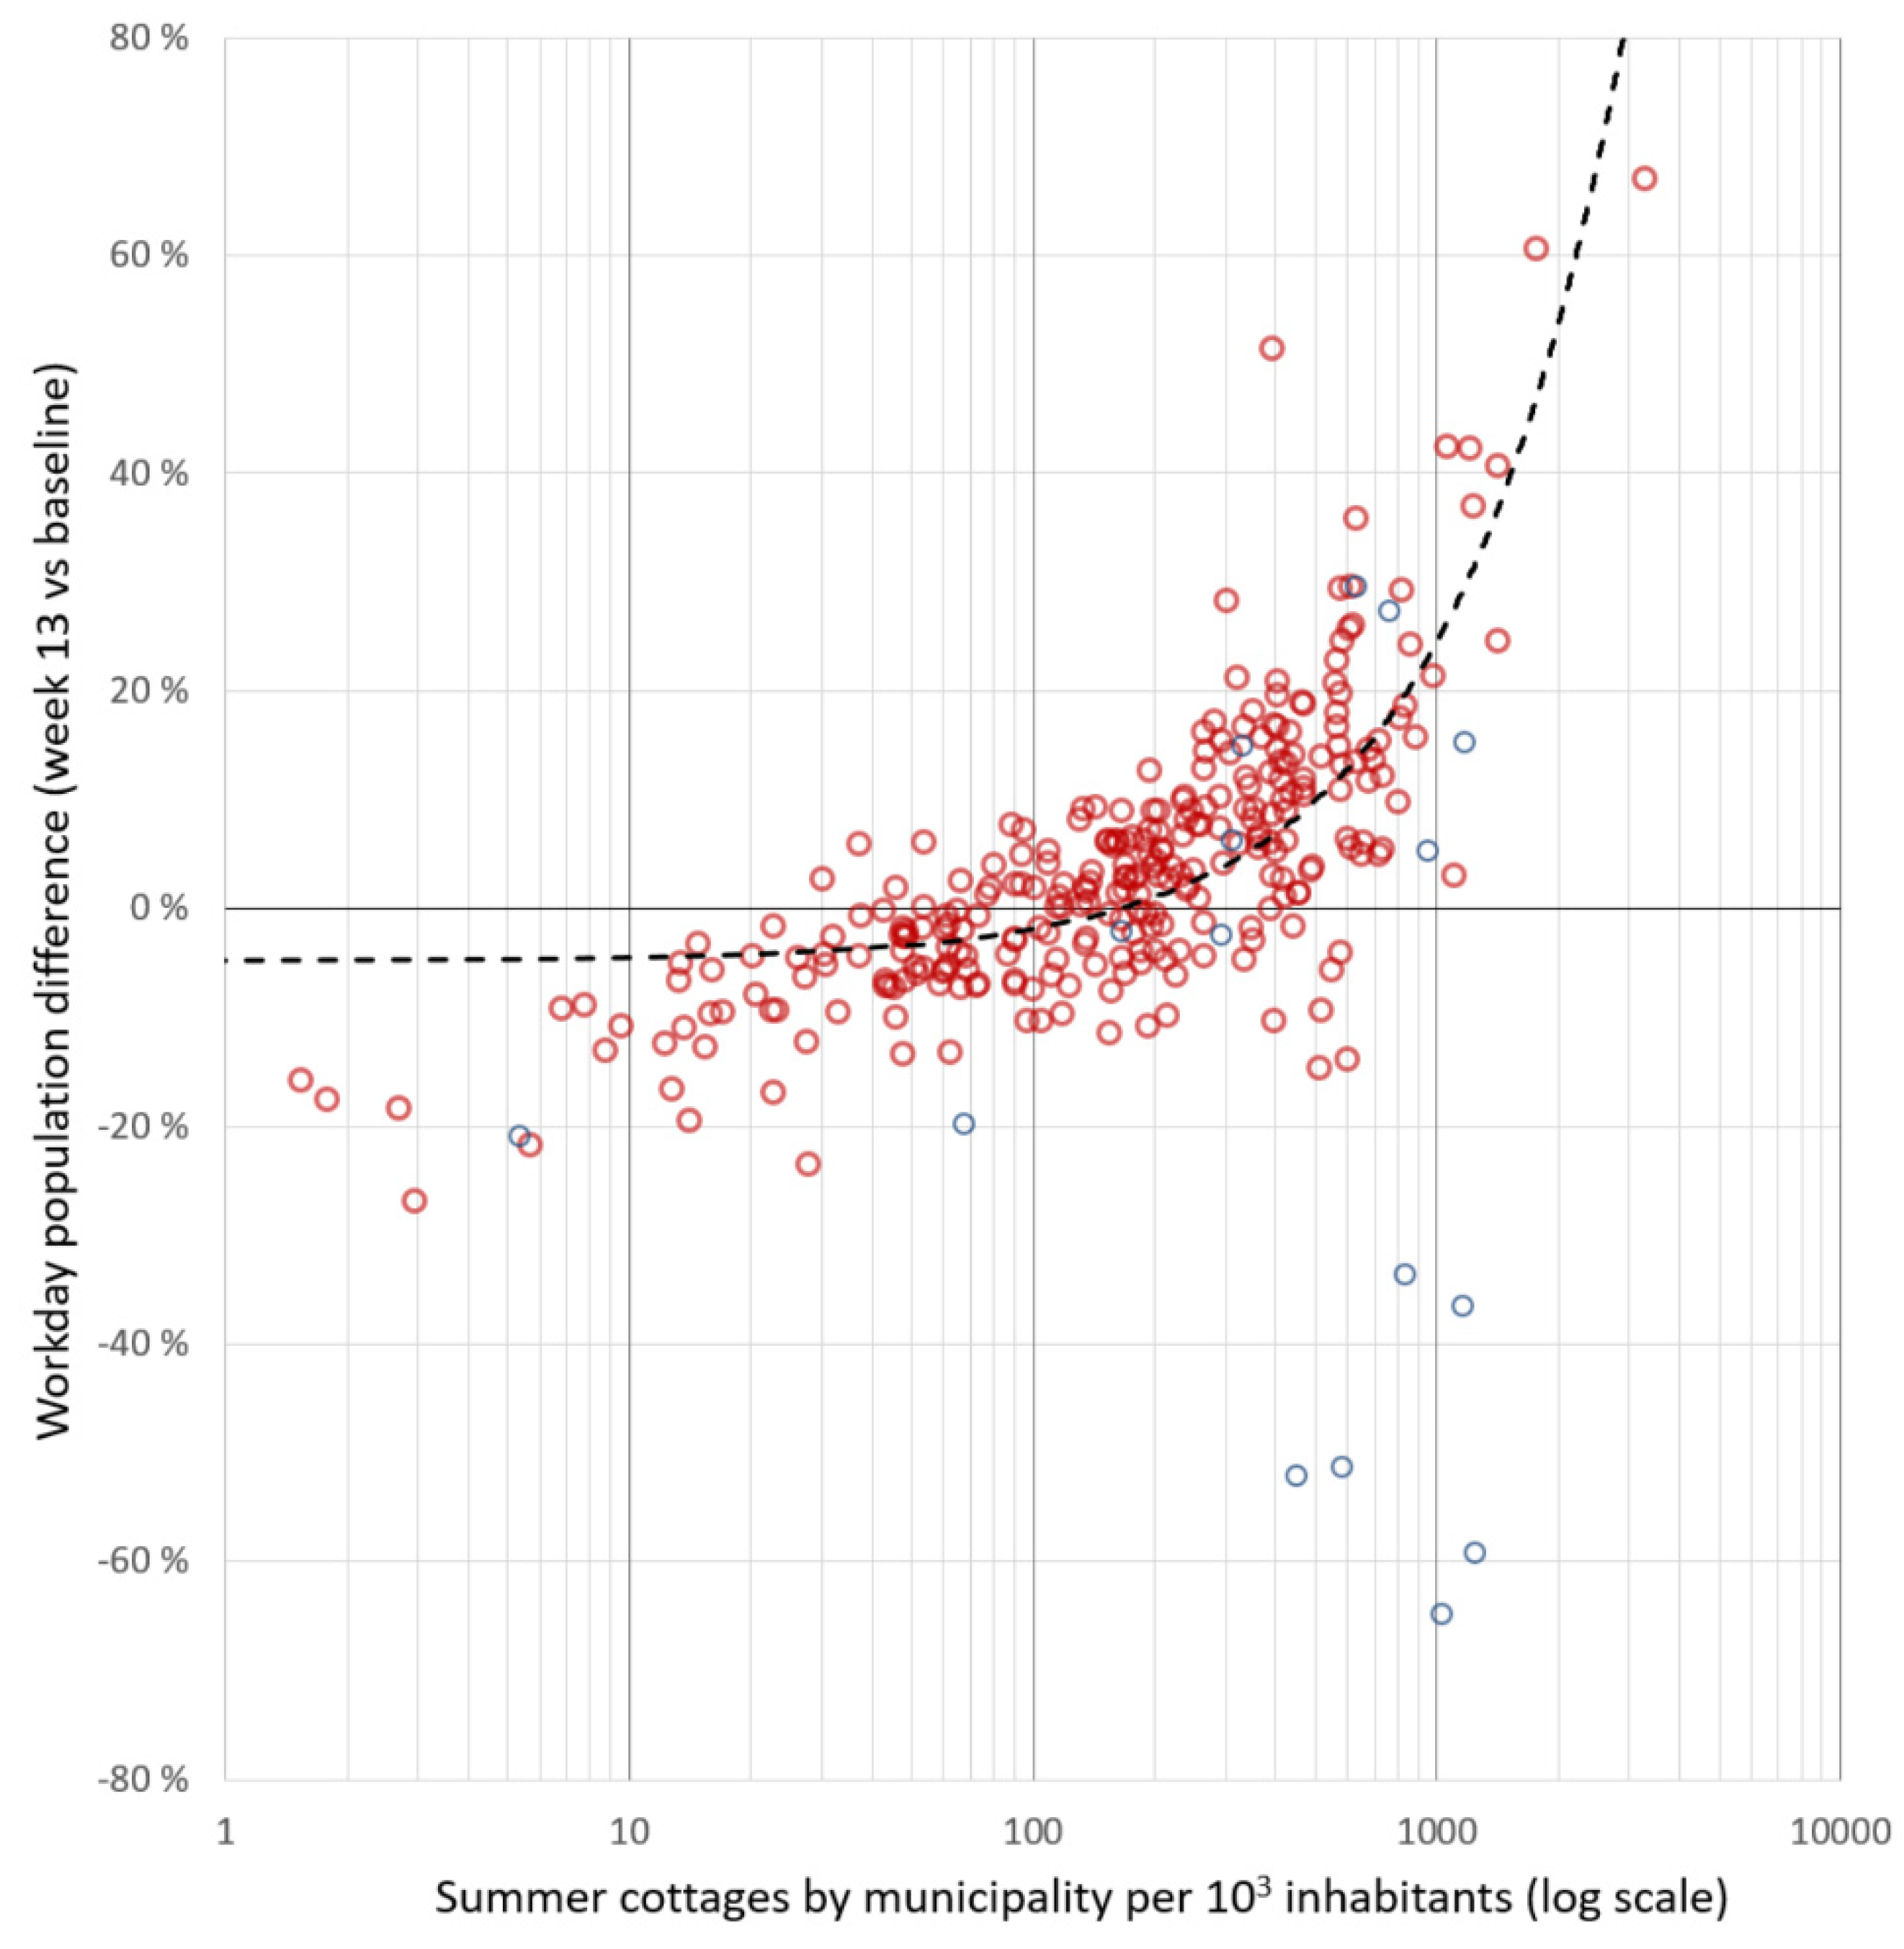
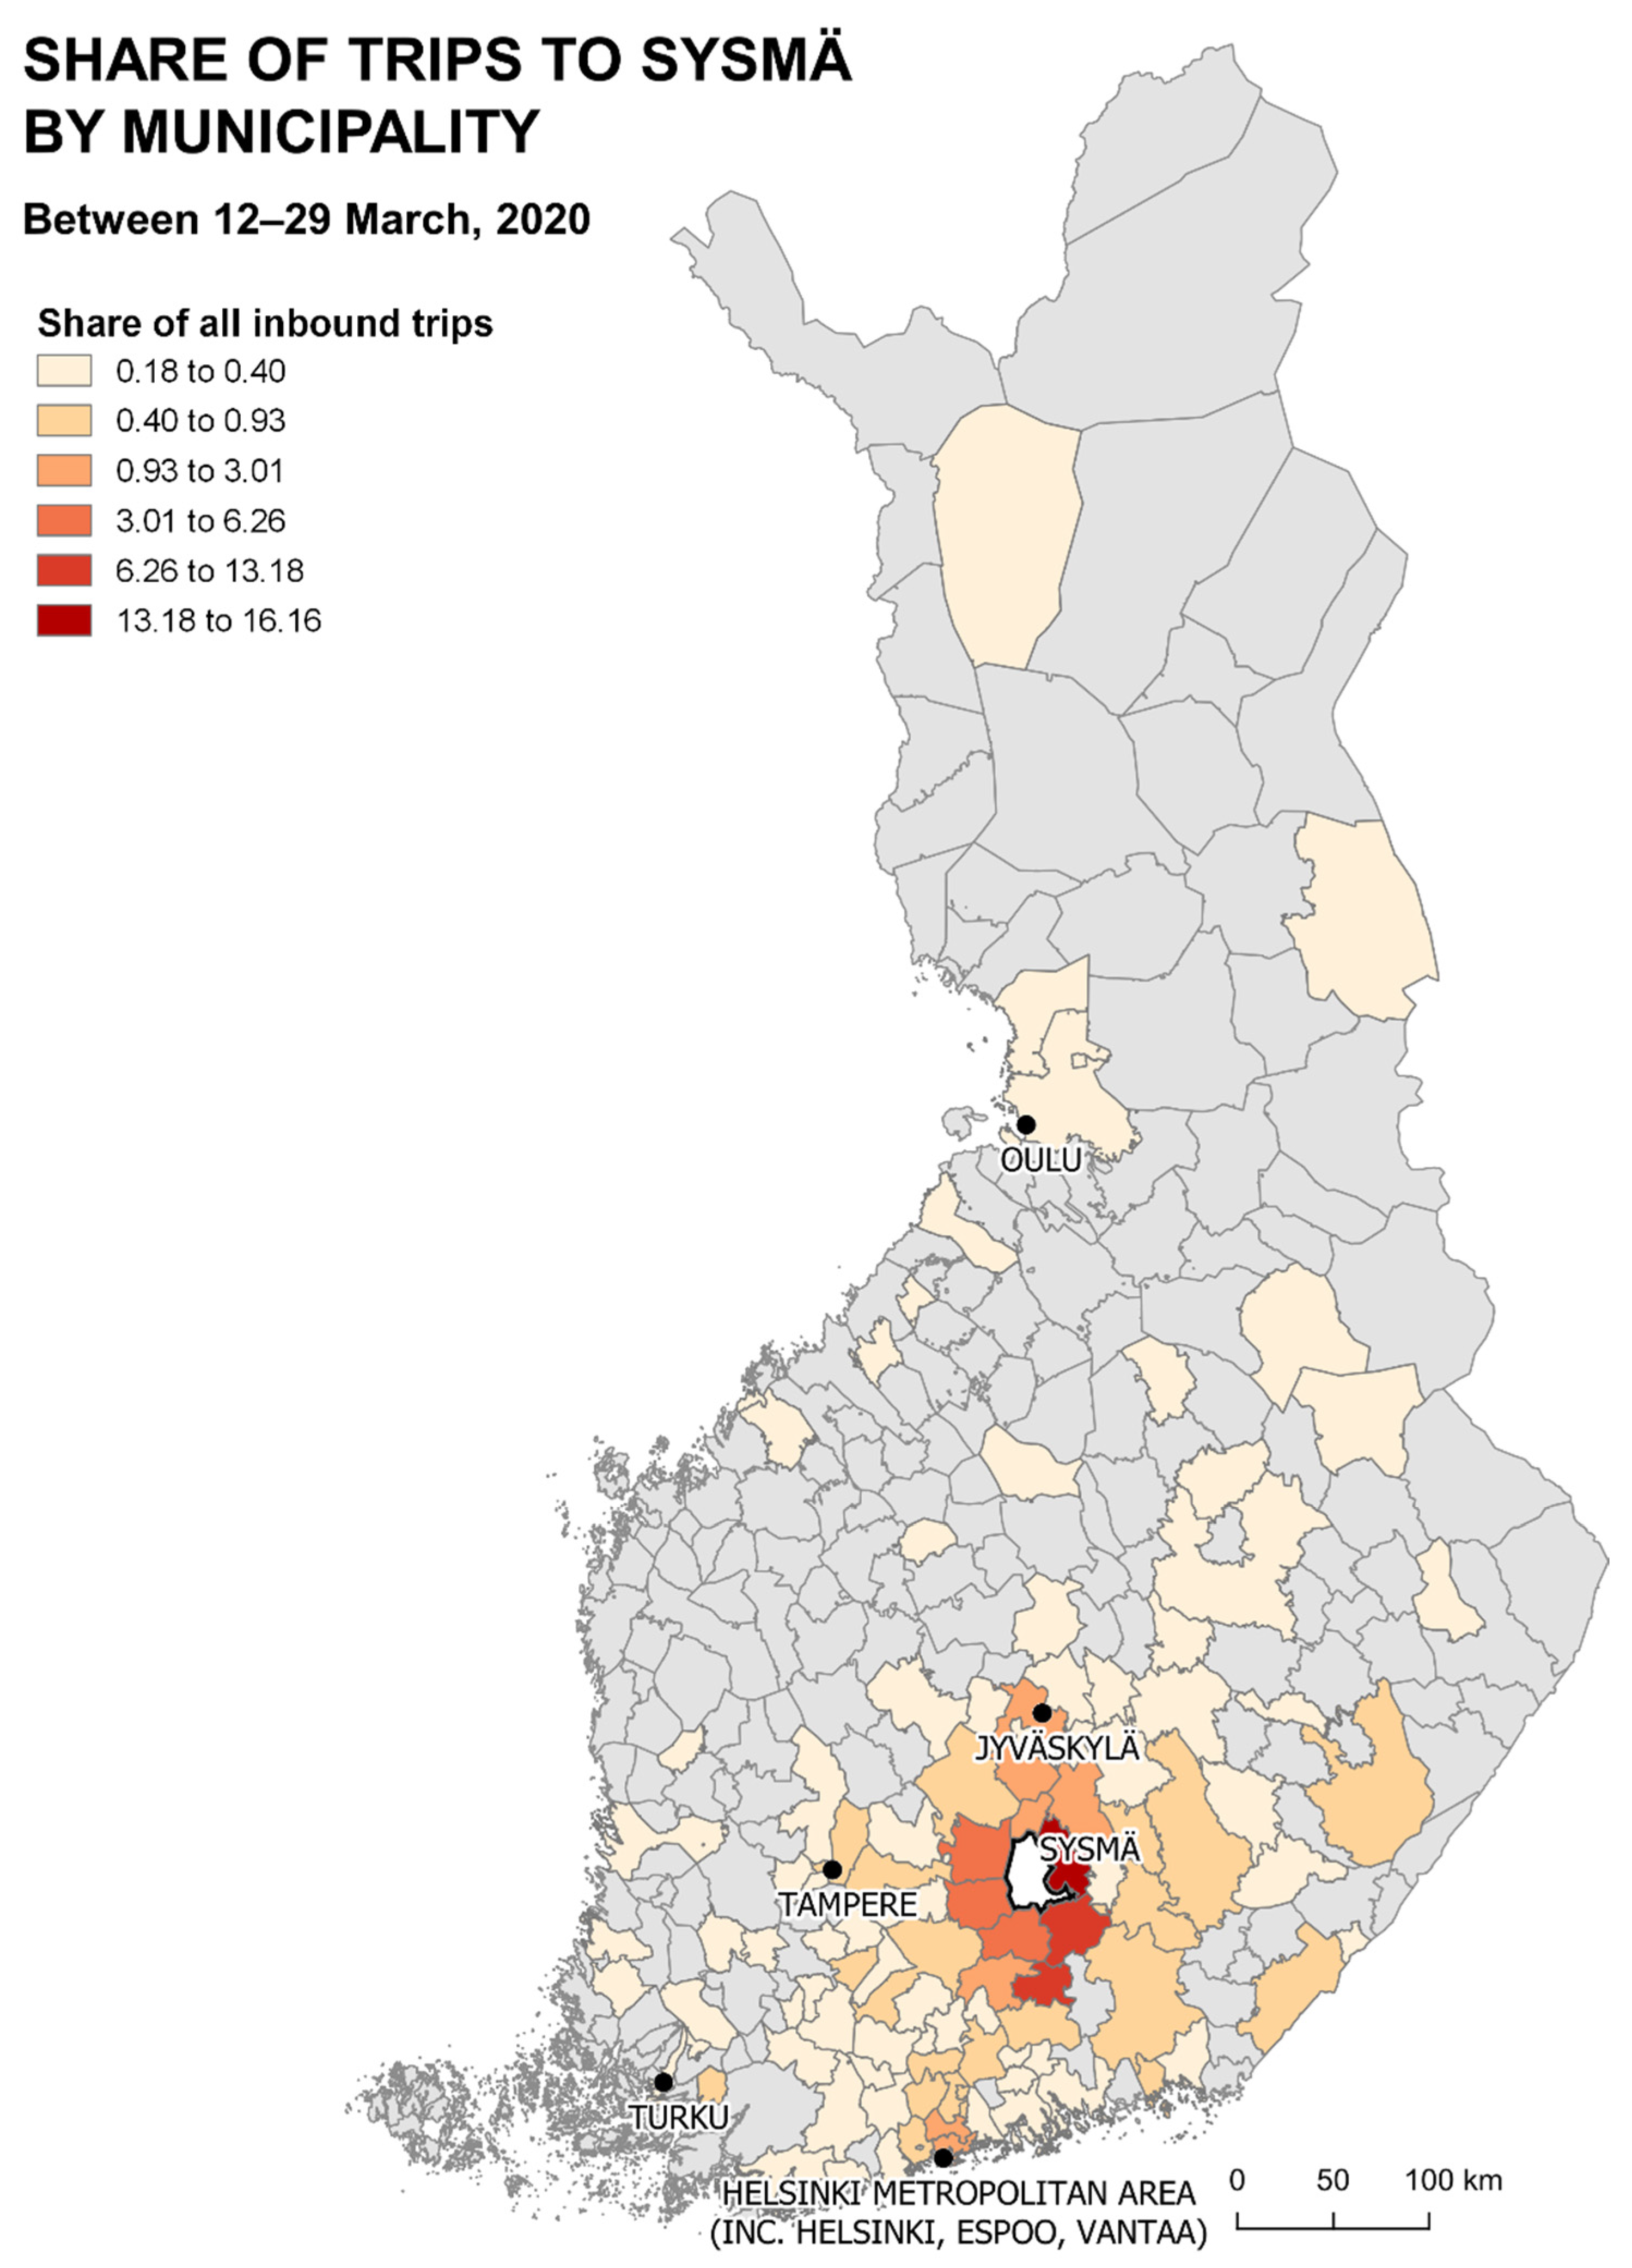
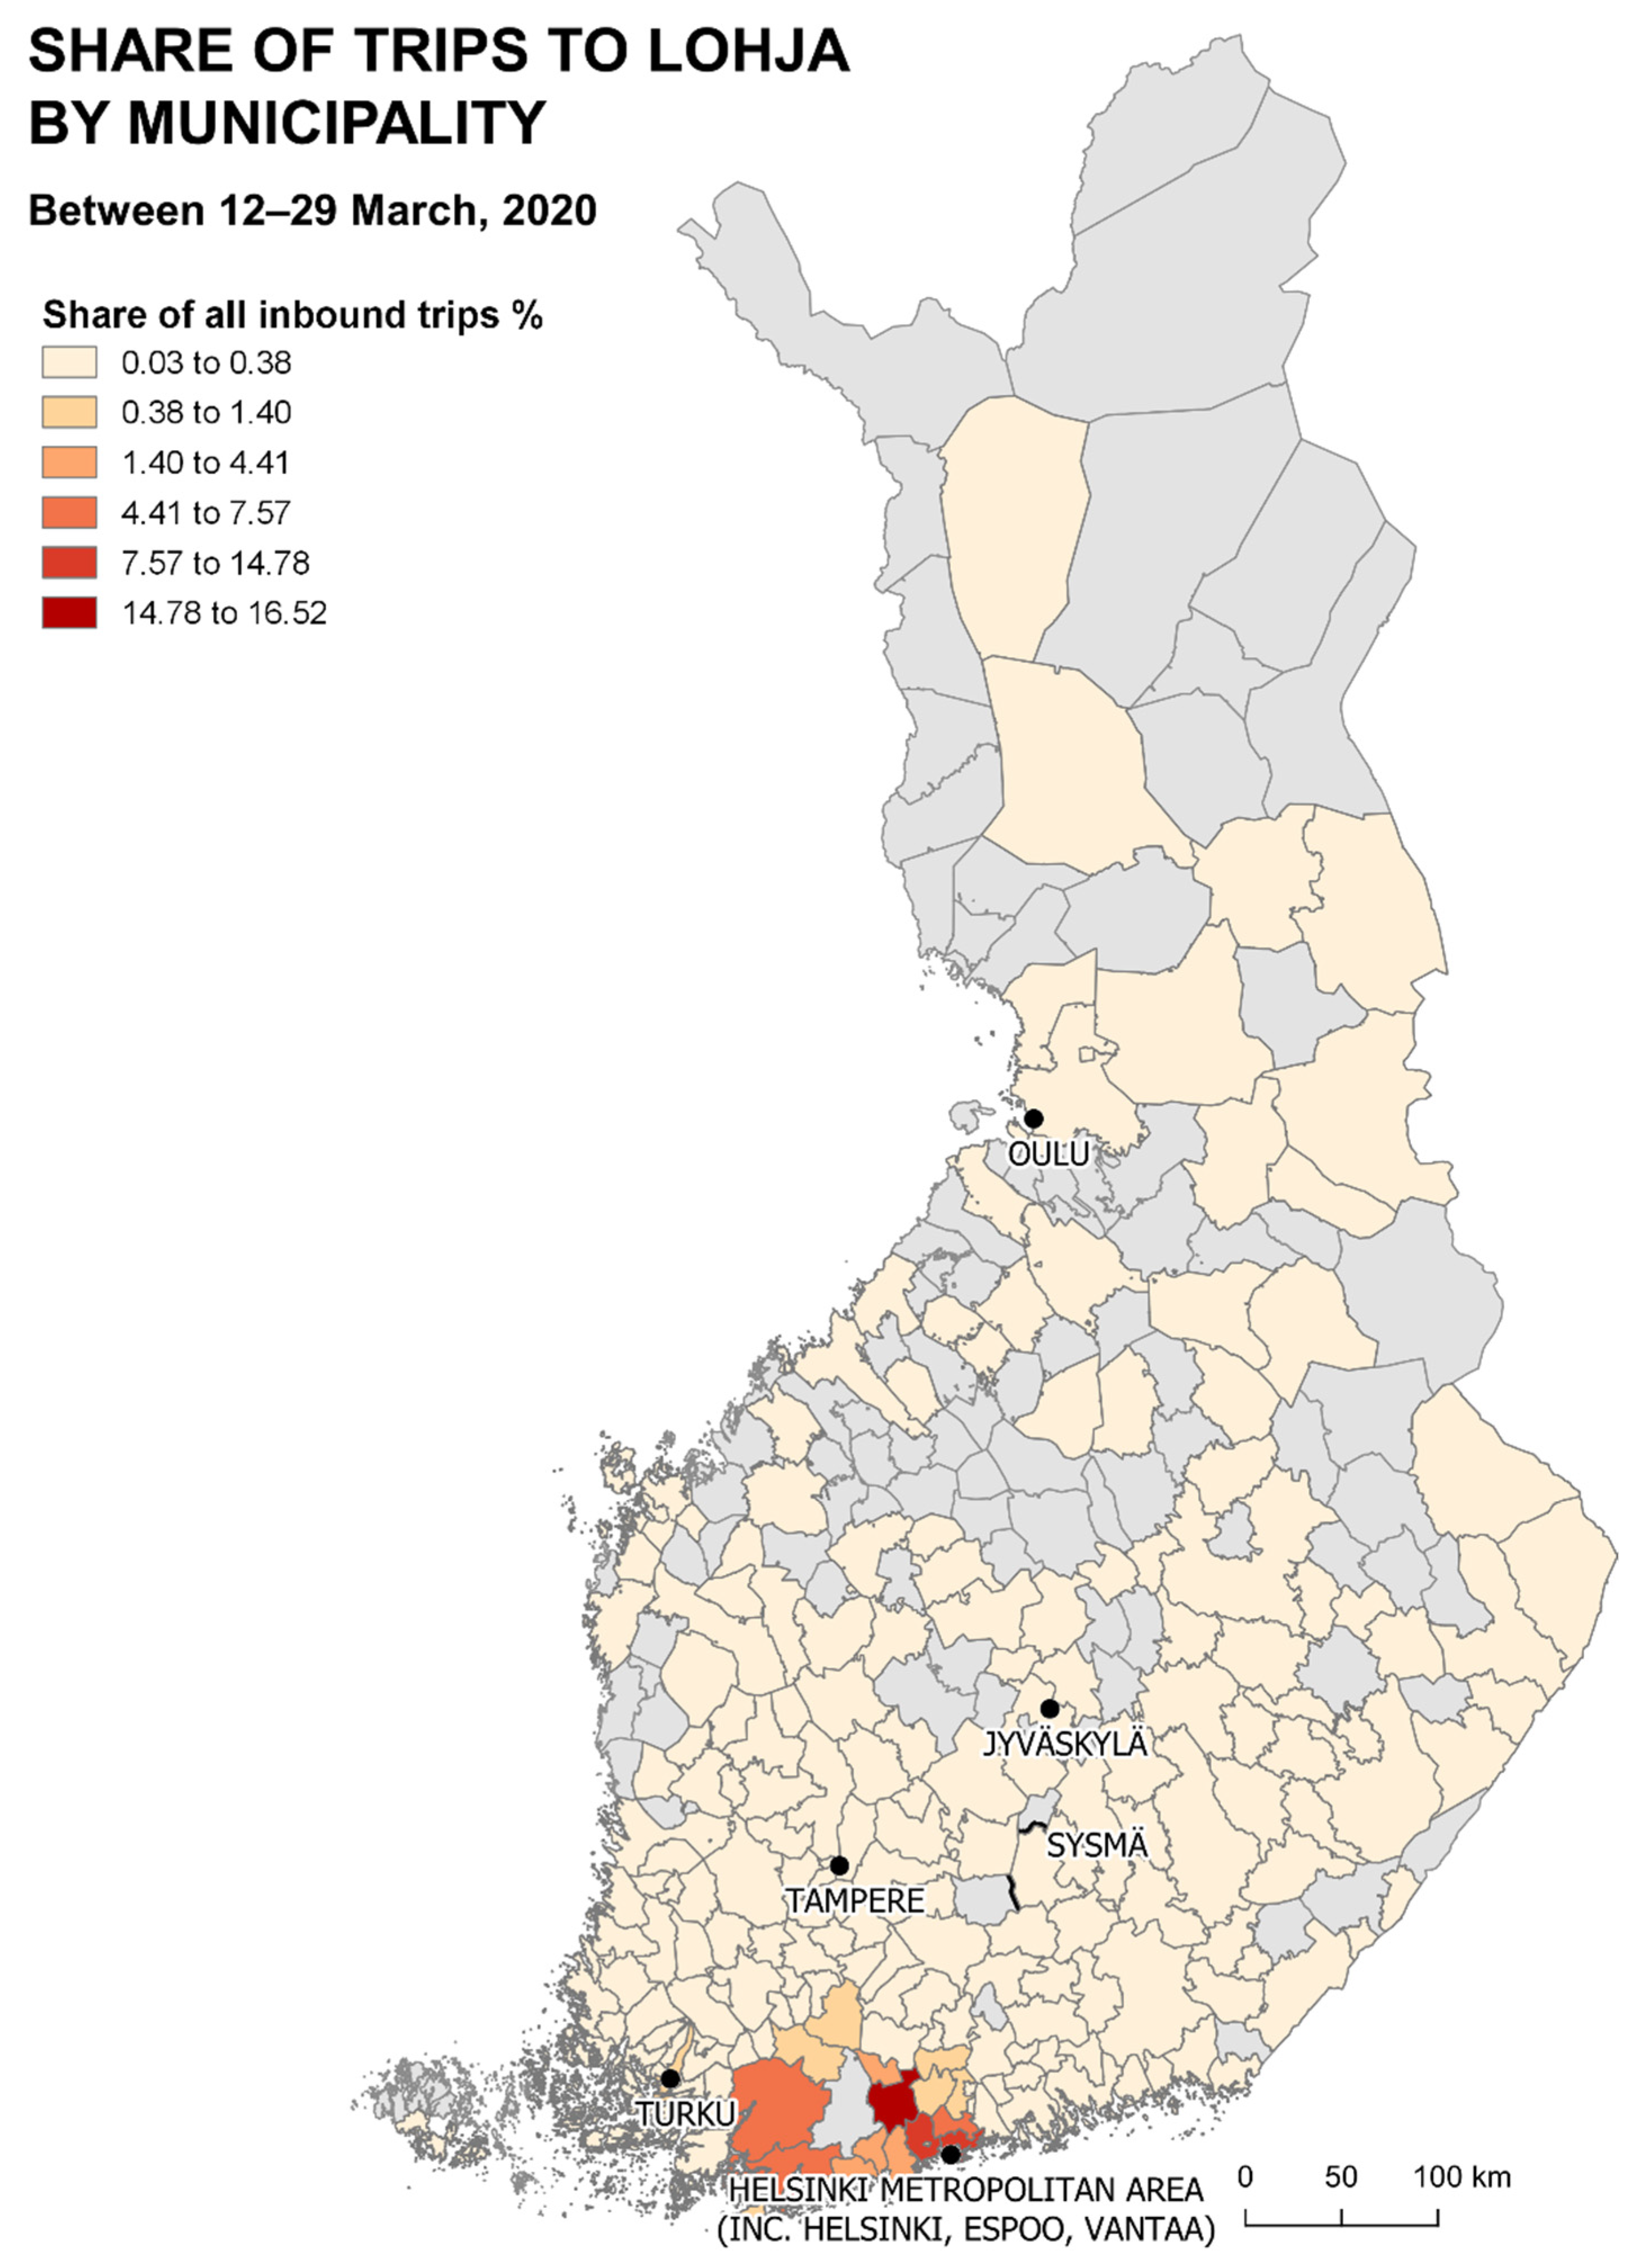
4.2. Escape from Cities to the Country

The number of people in the 30 largest municipalities (i.e., cities) in Finland declined during the last week of March compared to the baseline, both during workdays as well as weekends. The decline in the presence of people has a strong and negative correlation (R = –0.71) with the daily incoming commuting flow by municipality (Figure 4). That is, the bigger the city, the more the presence of people decreased. For example, Helsinki, the largest city regarding inhabitants and incoming commuters lost 27% of its usual population visiting on a daily basis. The other five largest cities, Vantaa, Espoo and Tampere have also lost its daily population due to smaller daily commuting flows, –27%, –22%, and –20%, respectively. Oulu, the fifth biggest city is an exception (–8%) as the municipality includes a vast geographical area including commuter settlements and, thus, has relatively less commuters coming from neighbouring municipalities. On the other hand, some of the top 30 municipalities (Kouvola, Salo, and Lohja) have remained approximately with the same number of people or have even gained workday population. In fact, in addition to its urban centre, these municipalities have a significant amount of summer cottages as these are among the top ten municipalities with most summer cottages in Finland.
Figure 4 and Figure 5 indicate the movement of people from larger urban settlements to more rural municipalities along the coast and in central Finland. The exception here are the municipalities of the Åland archipelago, where ferry traffic was put on hold and people were unable to move there. The linear correlation between the relative change in the presence of people from the baseline and the relative distribution of summer cottages per 1000 official inhabitants is positive and strong (R = 0.75). That is, the more summer cottages per official inhabitants in a municipality, the more presence of people increased. On average, some 370 additional people for every 1000 summer cottages in a municipality arrived to a municipality by the end of March in Finland.
As an example of people moving to their secondary homes, we focus on Sysmä and Lohja—two well-known seasonal residence municipalities. The two municipalities had different patterns regarding the dynamics of the presence of people and the incoming mobility flow. In addition to typical weekend visits to seasonal residences, people also stayed there during the winter holiday season (15 February–8 March, 2020), and shortly after people started to move back to their seasonal residences after the COVID-19-related announcements by the government on 12 March. (Appendix A, Figure A1). Moreover, the mobility flows of incoming people by municipality of origin changed compared to the baseline week (Appendix B, Figure A2 and Figure A3). For example, compared to the baseline, people from the HMA visiting Lohja decreased 4%, 34%, and 41% for weeks 11–13, accordingly, yet in Sysmä, it increased by 22%, 96%, and 120%, respectively. Overall, people from the HMA accounted for 10% of all movements to Lohja in week 13 and 3% to Sysmä, respectively.

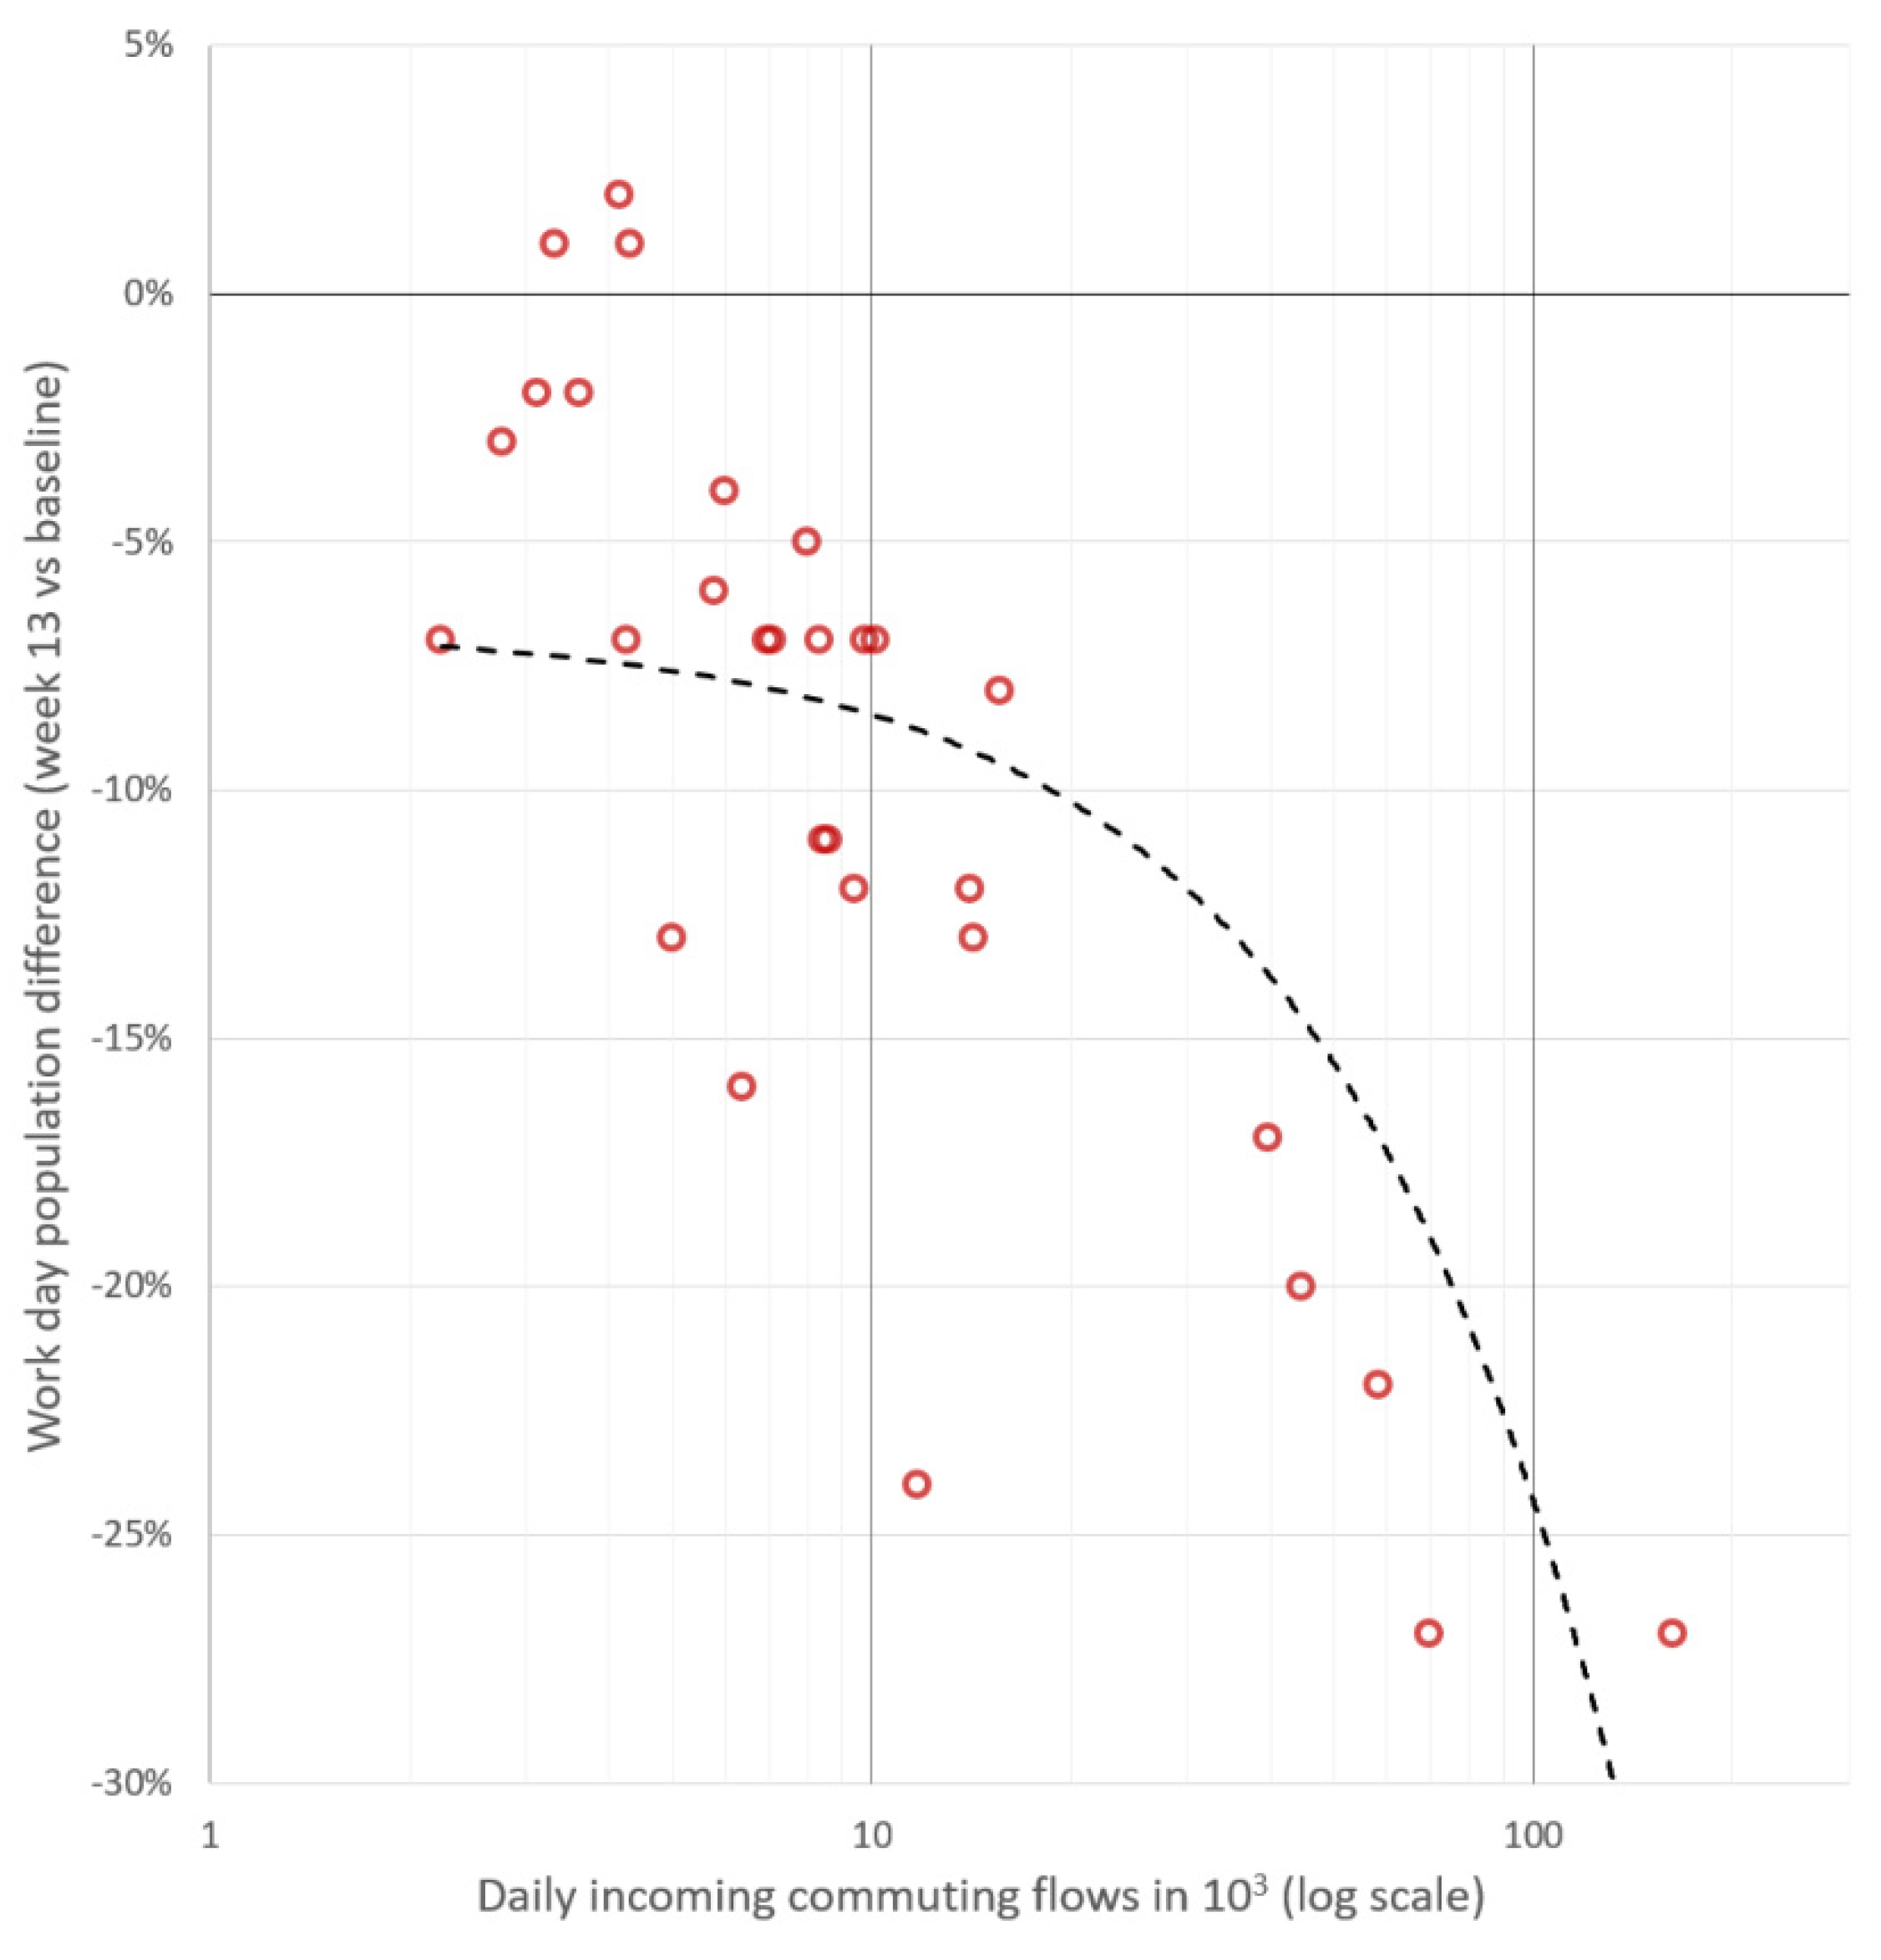
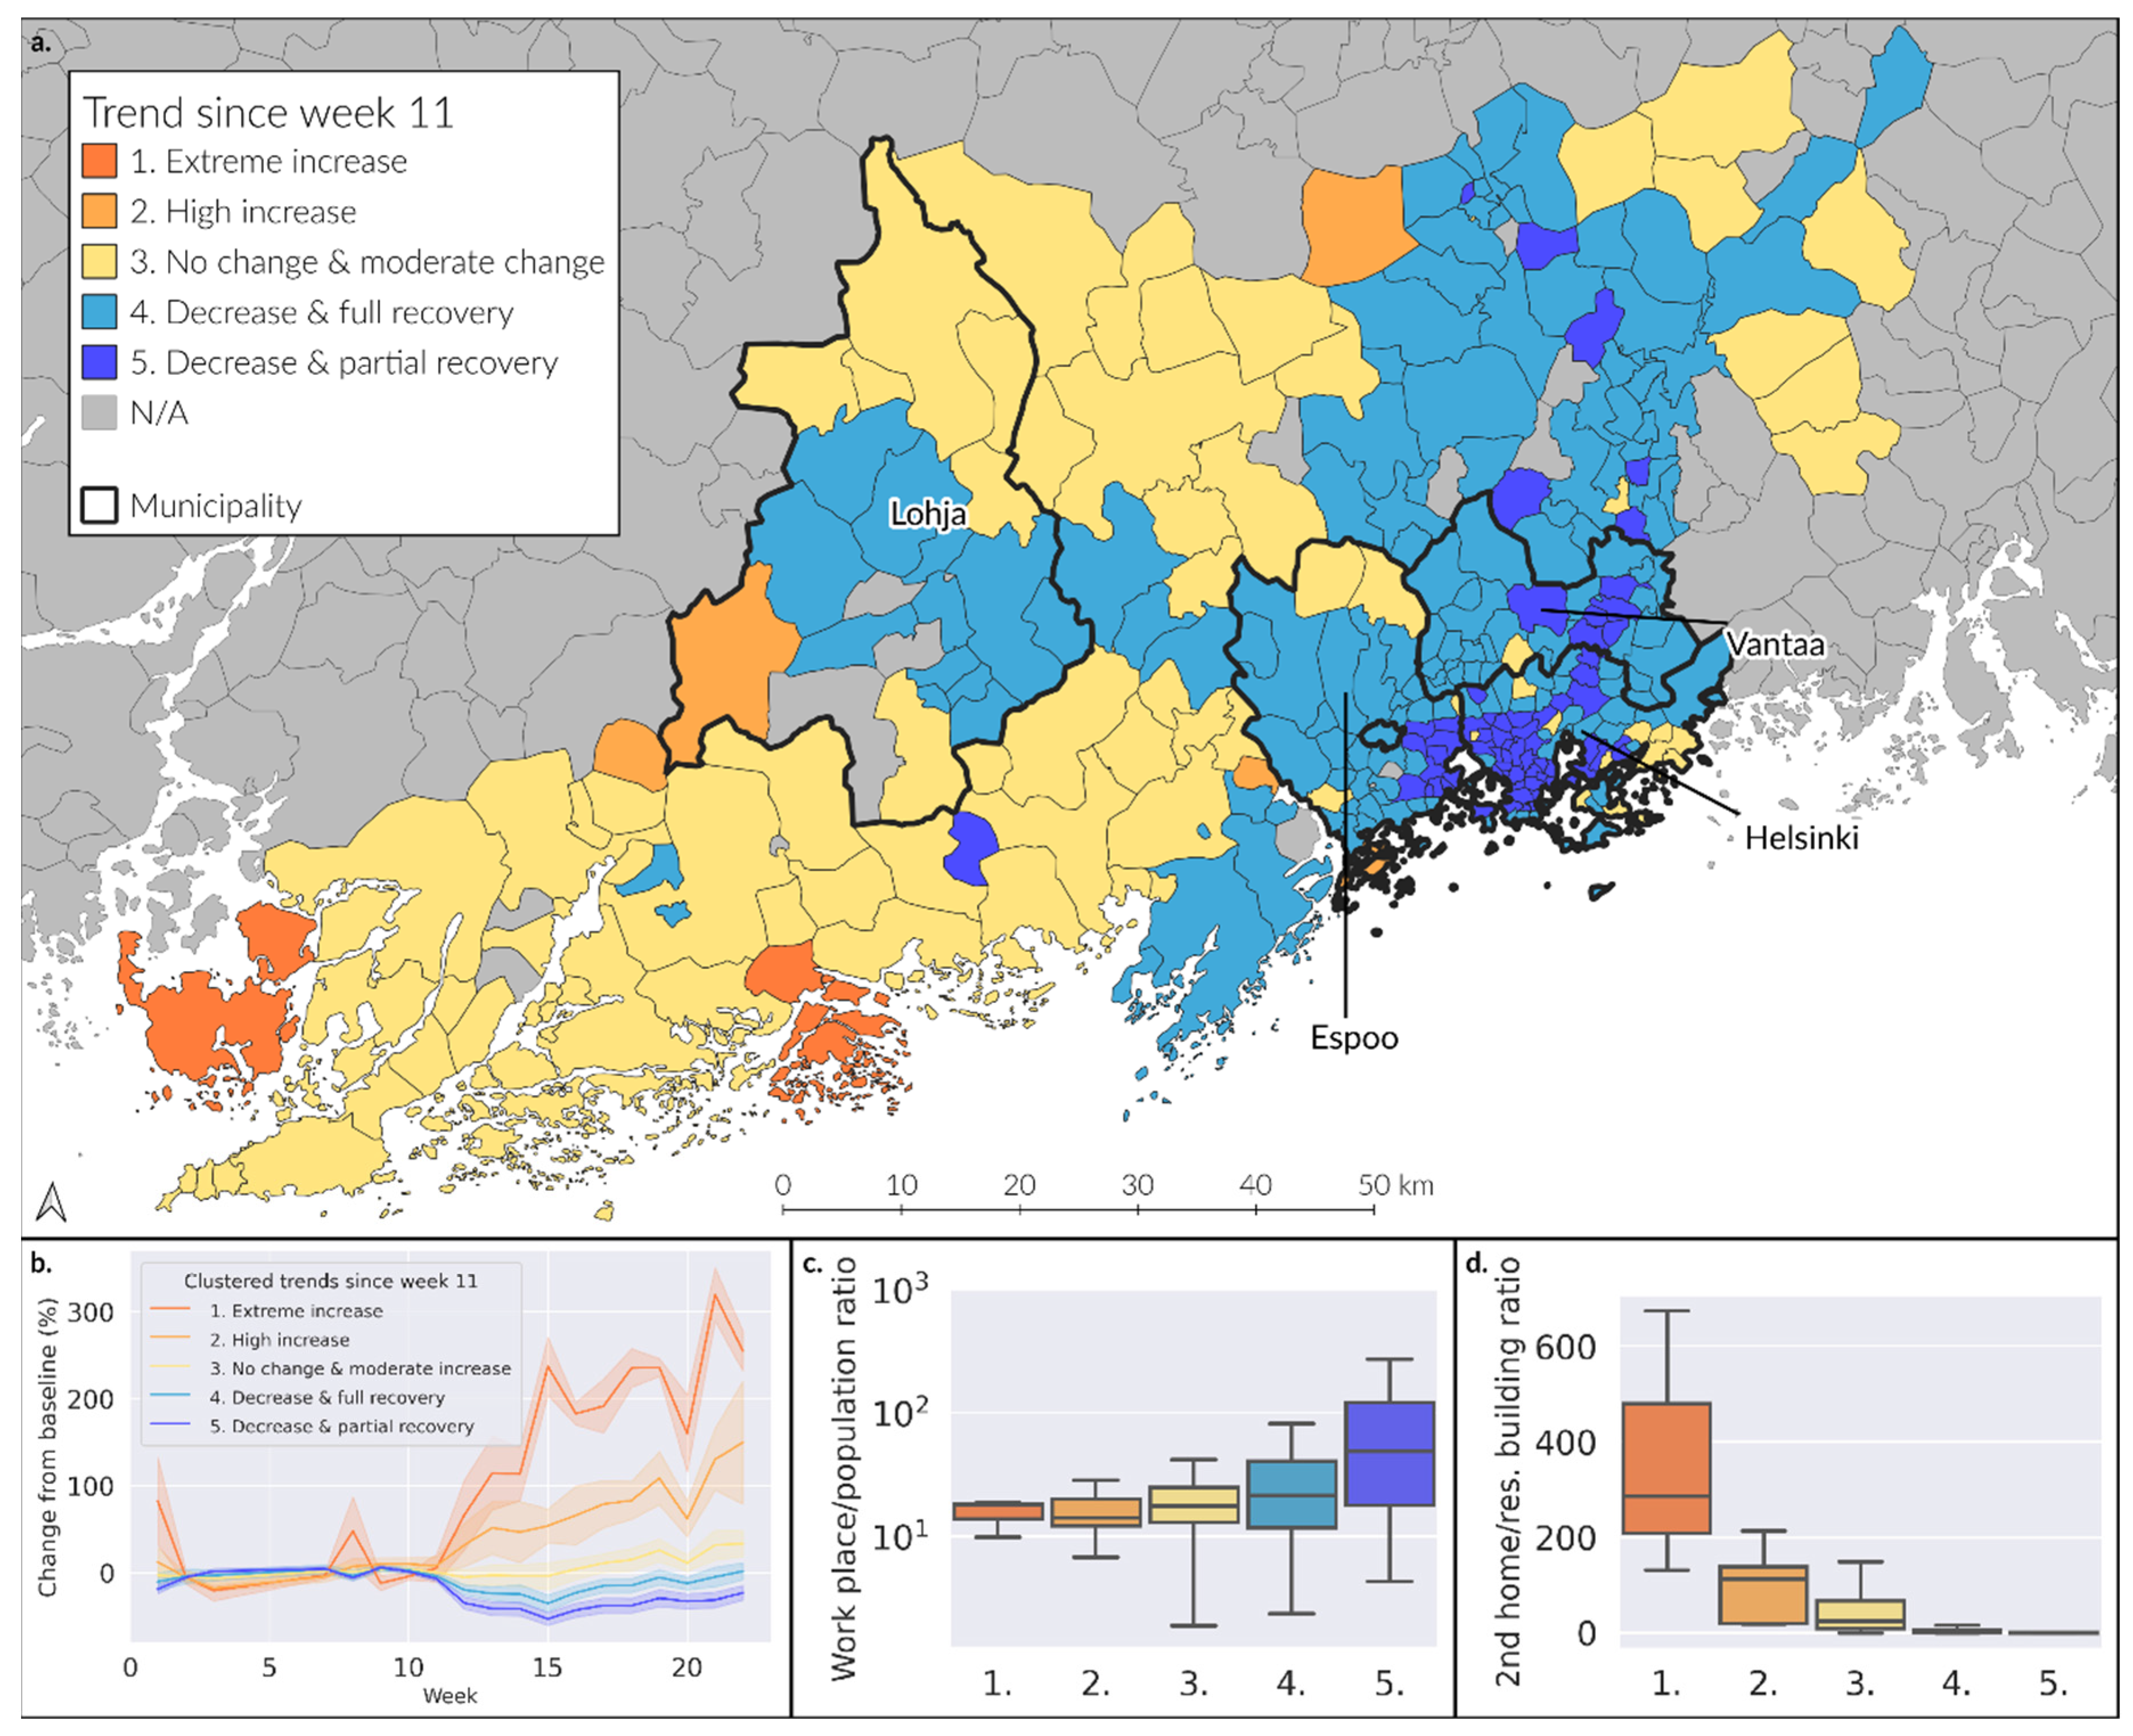
4.3. The Escape from Cities and the Recovery around Helsinki

Our third dataset from the HUS district (including the Helsinki metropolitan area) reveals temporal dynamics of the presence of people both spatially more accurately at postal code area level, as well as temporally, with a longer period to evaluate the gradual recovery process from the COVID-19 crisis until the end of May.
Clustering postal code areas, according to time series of the weekly relative presence of people from the baseline (average of weeks 1–10), shows results that confirm the findings until week 13—people escape from core urban centres and move to their secondary homes (Figure 6). Furthermore, a longer time period reveals some rural areas with extreme (Cluster 1) and high increase (Cluster 2) of the presence of people since week 11 despite the Uusimaa lockdown and restrictions requiring people to stay at home. In most non-urban core areas (Cluster 3), the dynamic population remained stable, yet started to increase steadily after the Uusimaa lockdown since week 15 and the presence of people increased by over 30% compared to the baseline, on average. Urbanised areas and areas with major transport corridors (Cluster 4) lost their dynamic population, and by the end of the Uusimaa lockdown, the presence of people had decreased by 30% from the baseline, on average. Yet, by the end of May, the dynamic population recovered to the baseline level. In contrast, urban core areas (Cluster 5; e.g., areas in Helsinki, Espoo, Vantaa) experienced a significant decrease of dynamic population. By week 15, the presence of people in these areas decreased by 60% from the baseline, on average. By the end of May, these urban areas had only partially recovered their dynamic populations.
The development of the presence of people in an area is strongly linked to workplaces and secondary homes (Figure 6c,d). Workplaces are concentrated in areas having the most decrease in dynamic population (Cluster 4 and 5), whereas the most increase in populations were in areas that had a concentration of secondary homes (Clusters 1–3). Finally, one of our example municipalities, Lohja, is a vivid example of a municipality with decreasing presence of people at municipality level (Appendix A), while having significant intra-municipality differences regarding changes in population. There were decreases between –28.8% and –64.0% in urbanised postal code areas while there was a significant increase (between 17.5 % and 122.4 %) in a well-known area for seasonal residence, despite the overall decrease of mobility at municipality level.

5. Discussion

5.1. Multi-Local Living and Crisis Management

Increasing human mobilities and technological developments contribute to the diversifying lifestyles of people, including remote working and multi-local living around the world. For crisis preparedness, this causes a challenge—how to plan and manage emergencies when the mobility flows of people can be unexpected and the actual whereabouts of people change rapidly. A social phenomenon of people with multiple homes and mobility flows from urban to rural areas demonstrates this situation, in the COVID-19 crisis, in Finland.
Our results showed that the COVID-19 outbreak in spring 2020 resulted in a rapid decline of overall mobility in Finland, which is confirmed by individual level findings [40] and follows the general global trend [8,52]. We further observed a significant reduction of mobility in core urban centres similar to other countries [10]. At the same time, results clearly indicate mobility flows from urban areas to less populated rural areas, whereas, most importantly, we found a strong correlation between the increase of people and the presence of secondary homes. By the end of March, we saw up to a 70% increase in population in municipalities that are well known for seasonal residence. In the case of the Lohja municipality, in some postal code areas, their populations doubled and trebled during the Uusimaa lockdown and the state of emergency period during the spring 2020.
There are, however, some uncertainties in our results regarding our used methodology in defining the presence of people. Inherently defined presence in used data products (i.e., present if being at least 20 min continuously within a coverage area of one mobile network base station) can cause false positive outcomes in identifying presence if the speed of movement is low enough. On the other hand, even short stopovers divide long-distance trips into several shorter trip records in OD-trip data and, thus, underrepresent actual long-distance trips to some extent. In addition, the lack of longitudinal data from pre-COVID times do not allow us to separate the COVID-19 inflicted change from the yearly seasonal increase of second-home mobility in Finland in the spring and summertime.
Despite the abovementioned uncertainties, we found strong evidence in our hypothesis. Finns moved to their second homes from larger cities despite government instructions not to move from their homes and, thus, did not follow government regulations during the state of emergency. However, it is not that straightforward, as multi-local living takes several forms [14]. While a second home living in Finland tends to relate to vacation residences and summer cottages, there are also other types of second home living. For instance, people may have urban secondary homes due to work or study activities, and in the event of a crisis, may prefer to isolate themselves in their rural homes, leaving the urban hotspots with a high infection probability for a safer environment.
Regardless of the reason for multi-local living, it causes a challenge for crisis management. People changing their residence not only increase the probability of inter-regional virus spreading, but also create pressure on health and emergency services that have not been prepared for the significant increase of inhabitants in times of crises. The increase in seasonal population and escape from cities for the summer is expected in regions with a high number of secondary homes [20,21]. However, a significant increase of population at an unusual time of year, such as in the case of COVID-19 in Finland, could increase the service needs in an unexpected manner. Even a small increase in the absolute population in rural municipalities can overload services during the emergency.
To date, there is little evidence on how mobility (e.g., urban–rural) flows may have played a role in virus transmission between different regions in Finland. However, in the case of COVID-19, our study has highlighted the need to improve crisis preparedness in the future—to acknowledge the growing importance of multi-local living better, and to be able to plan the services based on need. New data resources are needed to monitor the situation, as static data on one place of residence and workplace per person are not enough for situational awareness. New data sources, such as mobile phone data, allow for better preparation for emergencies and monitoring them [8,10]. Furthermore, information about the effectiveness of restrictions and a recovery process is crucial—our results from the Uusimaa region suggest that the dynamic population in the densest urban centres had not recovered by mid-May. This indicates a more permanent shift to remote working and the growth of multi-local living, demonstrated by the sky-rocketing demand for secondary homes on the Finnish real estate market during the summer and autumn 2020 [53].

5.2. Feasibility of Mobile Phone Data in Crisis Management

Finally, our study demonstrated how mobile phone data could be used to provide important insights across spatial scales and prolonged time periods that are able to support situational awareness [35,42,49]. In particular, we demonstrated how inherently dynamic social phenomenon of multi-local living could be revealed and timely monitored with data products of mobile network operators. Providing these insights is valuable for a rapid crisis management and, thus, timeliness of such data products is the key strength of big data analytics compared to traditional data collection options, such as conducting surveys and using registers. Nevertheless, several challenges in using given data products remain, including data access and privacy protection addressed by recent studies [49], and additional challenges emerge due to undisclosed methodologies, such as diversity of datasets, incoherent terminologies, population representativeness, and differences in what exactly data are representing.
Our results with three aggregated and anonymised mobile phone data products demonstrate these challenges. Datasets having varying methodologies in defining and measuring activity location, OD-trip, and the place of residence, in addition to the varying use of terminology, can have significant effects on the results, as we show. For example, OD-trip data and activity location data, including place of residence, can reveal different things. OD-trip data reveal all trips, but origins can be skewed to locations near the destination while activity location data capture the actual origin areas of the people better, but not all trips, especially daily two-way trips. Another example of a challenge is the repetitiveness of data, when data products are weighted to represent the total population based on the mobile phone operator’s market share information. In this study, we focused on general mobility patterns, but in analyses focusing on specific groups of people, the data representativeness could cause challenges if some demographic groups prefer certain mobile phone operators to others, but unbiased distribution is assumed.
The origin–destination trip data is a good example of incoherent terminologies and differences of what data exactly represents. Once the revealed mobility tracks of people are aggregated and assigned between spatial units, should we define OD-trip data as trips between origin and destination or, alternatively, should we consider the given data as aggregated and disconnected segments of trips? Given that purposes behind revealed mobility remain unknown, this issue requires more emphasis in mobile phone data research, in addition to defining place of residence and activity locations (stops) more consistently. These are important issues, because they can affect the decision-making in crisis management and planning. Finally, given the well-known issue of ecological fallacy [54], different spatial aggregation levels of data products also influence results. As our example from Lohja showed, a coarse spatial scale may hide internal variations within a larger area. Furthermore, once data products are created, they cannot be reliably aggregated or disaggregated to other spatial levels. Not the least, longitudinal comparability of data products is crucial for being able to set the baseline as a proxy for normal times, but also to understand the recovery process of a society after crisis better.
That being said, mobile phone data products will certainly be valuable sources of information for evidence-based decision-making in a dynamic society. However, we call for more attention to standardization of methodology and terminology of data products between mobile network operators, and acknowledging existing scientific knowledge produced in mobile phone data research for social good.

Author Contributions

Conceptualization, Elias Willberg, Olle Järv, Tuomas Väisänen, and Tuuli Toivonen; methodology, Elias Willberg, Olle Järv, Tuomas Väisänen, and Tuuli Toivonen; software, Elias Willberg, Olle Järv, Tuomas Väisänen; validation, Elias Willberg, Olle Järv, Tuomas Väisänen, and Tuuli Toivonen; formal analysis, Elias Willberg, Olle Järv, Tuomas Väisänen, and Tuuli Toivonen; investigation, Elias Willberg, Olle Järv, Tuomas Väisänen, and Tuuli Toivonen; resources, Olle Järv, and Tuuli Toivonen; data curation, Elias Willberg, Olle Järv, Tuomas Väisänen; writing—original draft preparation, Elias Willberg, Olle Järv; writing—review and editing, Elias Willberg, Olle Järv, Tuomas Väisänen, and Tuuli Toivonen; visualization, Elias Willberg, Olle Järv, Tuomas Väisänen; supervision, Olle Järv and Tuuli Toivonen; project administration, Olle Järv and Tuuli Toivonen; funding acquisition, Olle Järv and Tuuli Toivonen. All authors have read and agreed to the published version of the manuscript.

Funding

E.W. was funded by the Finnish Cultural Foundation Science Workshop funding and the Amer Foundation, Finland (Sporttia Stadiin/Urban Exerciser project). O.J. was funded by the Kone Funding (no 201608739) and Academy of Finland (no 331549). T.V. was funded by Emil Aaltonen Foundation. T.T. was funded by the University of Helsinki and Osk. Huttunen Foundation (visiting fellow at Clare Hall College, Cambridge).

Institutional Review Board Statement

Not applicable. Original datasets are already aggregated to spatial units and do not include any individual level information.

Informed Consent Statement

Not applicable. Original datasets are already aggregated to spatial units and do not include any individual level information.

Data Availability Statement

3rd Party Data.

Acknowledgments

We would like to thank Telia Finland and Elisa for providing anonymised and aggregated mobile phone data for the study. We would also like to thank Claudia Bergroth for making Figure 1A.

Conflicts of Interest

The authors declare no conflict of interest.

Appendix A

Figure A1. The varying presence of people at municipality level compared to the baseline weekdays (1–7 February 2020) in the municipality of Lohja and Sysmä.
Ijgi 10 00103 g0a1

Appendix B

Figure A2. Incoming trips to Sysmä by municipality on 12–29 March, 2020, based on Telia trip data.
Ijgi 10 00103 g0a2
Figure A3. Incoming trips to Lohja by municipality on 12–29 March, 2020, based on Telia trip data.
Ijgi 10 00103 g0a3

References

  1. Giles, J.R.; Erbach-Schoenberg, E.; Tatem, A.J.; Gardner, L.; Bjørnstad, O.N.; Metcalf, C.J.E.; Wesolowski, A. The duration of travel impacts the spatial dynamics of infectious diseases. Proc. Natl. Acad. Sci. USA 2020, 117, 22572–22579. [Google Scholar] [CrossRef] [PubMed]
  2. Prothero, R.M. Disease and mobility: A neglected factor in epidemiology. Int. J. Epidemiol. 1977, 6, 259–267. [Google Scholar] [CrossRef]
  3. Askitas, N.; Tatsiramos, K.; Verheyden, B. Lockdown strategies, mobility patterns and COVID-19. arXiv 2020, arXiv:2006.00531. [Google Scholar]
  4. Chinazzi, M.; Davis, J.T.; Ajelli, M.; Gioannini, C.; Litvinova, M.; Merler, S.; Vespignani, A. The effect of travel restrictions on the spread of the 2019 novel coronavirus (COVID-19) outbreak. Science 2020, 368, 395–400. [Google Scholar] [CrossRef] [PubMed] [Green Version]
  5. Aloi, A.; Alonso, B.; Benavente, J.; Cordera, R.; Echániz, E.; González, F.; Sañudo, R. Effects of the COVID-19 Lockdown on Urban Mobility: Empirical Evidence from the City of Santander (Spain). Sustainability 2020, 12, 3870. [Google Scholar] [CrossRef]
  6. Glaeser, E.; Gorback, C.; Redding, S. How Much does COVID-19 Increase with Mobility? Evidence from New York and Four Other U.S. Cities. Natl. Bur. Econ. Res. 2020. [Google Scholar] [CrossRef]
  7. Jia, J.S.; Lu, X.; Yuan, Y.; Xu, G.; Jia, J.; Christakis, N.A. Population flow drives spatio-temporal distribution of COVID-19 in China. Nature 2020, 582, 389–394. [Google Scholar] [CrossRef]
  8. Santamaria, C.; Sermi, F.; Spyratos, S.; Iacus, S.M.; Annunziato, A.; Tarchi, D.; Vespe, M. Measuring the impact of COVID-19 confinement measures on human mobility using mobile positioning data. A European regional analysis. Saf. Sci. 2020, 132, 104925. [Google Scholar] [CrossRef] [PubMed]
  9. Jeffrey, B.; Walters, C.E.; Ainslie, K.E.C.; Eales, O.; Ciavarella, C.; Bhatia, S.; Riley, S. Anonymised and aggregated crowd level mobility data from mobile phones suggests that initial compliance with covid-19 social distancing interventions was high and geographically consistent across the UK. Wellcome Open Res. 2020, 5, 1–10. [Google Scholar] [CrossRef]
  10. Heiler, G.; Reisch, T.; Hurt, J.; Forghani, M.; Omani, A.; Hanbury, A.; Karimipour, F. Country-wide mobility changes observed using mobile phone data during COVID-19 pandemic. arXiv 2020, arXiv:2008.10064. [Google Scholar]
  11. Green, J. Location Data in Action: Heatmaps Help Track COVID-19 Across the Globe. 2020. Available online: https://xmode.io/location-data-in-action-heatmaps-help-track-coronavirus-across-the-globe/ (accessed on 25 November 2020).
  12. Wisniewska, A.; Ehrenberg-Shannon, B.; Britain on the Move even before Johnson Eased Lockdown, Data Show. 12 May 2020. Available online: https://www.ft.com/content/cc70d690-99a6-4056-9ebe-d0b39c40a359 (accessed on 25 November 2020).
  13. Yle. Saariston mökkikauden Avaus Aikaistui Koronan Takia—Kustavin Kunnanjohtaja: “Melko Runsaasta määrästä ihmisiä on kysymys.” 2020. Available online: https://yle.fi/uutiset/3-11271741 (accessed on 16 November 2020).
  14. Schier, M.; Hilti, N.; Schad, H.; Tippel, C.; Dittrich-Wesbuer, A.; Monz, A. Residential Multi-Locality Studies—The Added Value for Research on Families and Second Homes. Tijdschr. Voor Econ. En Soc. Geogr. 2015, 106, 439–452. [Google Scholar] [CrossRef]
  15. Wind, B.; Dewilde, C.; Doling, J. Secondary property ownership in Europe: Contributing to asset-based welfare strategies and the ‘really big trade-off. ’ Int. J. Hous. Policy 2020, 20, 25–52. [Google Scholar] [CrossRef] [Green Version]
  16. Choi, H.-S.; Hong, H.; Kubik, J.; Thompson, J. When Real Estate is the Only Game in Town; National Bureau of Economic Research: Cambridge, MA, USA, 2014. [Google Scholar] [CrossRef]
  17. Huang, Y.; Yi, D.; Clark, W.A.V. Multiple home ownership in Chinese cities: An institutional and cultural perspective. Cities 2020, 97, 102518. [Google Scholar] [CrossRef]
  18. Stiman, M. Second homes in the city and the country: A reappraisal of vacation homes in the twenty-first century. Int. J. Hous. Policy 2020, 20, 53–74. [Google Scholar] [CrossRef]
  19. Brunetti, M.; Torricelli, C. Second homes in Italy: Every household’s dream or (un)profitable investments? Hous. Stud. 2017, 32, 168–185. [Google Scholar] [CrossRef]
  20. Adamiak, C.; Pitkänen, K.; Lehtonen, O. Seasonal residence and counterurbanization: The role of second homes in population redistribution in Finland. GeoJournal 2017, 82, 1035–1050. [Google Scholar] [CrossRef]
  21. Back, A.; Marjavaara, R. Mapping an invisible population: The uneven geography of second-home tourism. Tour. Geogr. 2017, 19, 595–611. [Google Scholar] [CrossRef]
  22. Silm, S.; Ahas, R. The Seasonal Variability of Population in Estonian Municipalities. Environ. Plan. A Econ. Space 2010, 42, 2527–2546. [Google Scholar] [CrossRef]
  23. Müller, D.K. Second Homes in the Nordic Countries: Between Common Heritage and Exclusive Commodity. Scand. J. Hosp. Tour. 2007, 7, 193–201. [Google Scholar] [CrossRef]
  24. Statistics Finland. Kesämökit 2019. 2019. Available online: https://www.stat.fi/til/rakke/2019/rakke_2019_2020-05-27_kat_001_fi.html (accessed on 11 November 2020).
  25. SYKE. Elinvoimainen ja kestävä Monipaikkainen Suomi. 2021. Available online: https://www.syke.fi/fi-FI/Tutkimus__kehittaminen/Tutkimus_ja_kehittamishankkeet/Hankkeet/Elinvoimainen_ja_kestava_monipaikkainen_Suomi_VN_TEAS_Monipaikkaisuus (accessed on 22 January 2021).
  26. WHO. Director-General’s Opening Remarks at the Media Briefing on COVID-19—11 March 2020. 2020. Available online: https://www.who.int/director-general/speeches/detail/who-director-general-s-opening-remarks-at-the-media-briefing-on-covid-19---11-march-2020 (accessed on 1 November 2020).
  27. Finnish Government. Movement Restrictions to Uusimaa—the Government Decided on Further Measures to Prevent the Spread of the Coronavirus Epidemic. 2020. Available online: https://valtioneuvosto.fi/en/-//10616/uudellemaalle-liikkumisrajoituksia-hallitus-paatti-uusista-lisatoimista-koronaepidemian-leviamisen-estamiseksi (accessed on 1 November 2020).
  28. Yle. Poll: Solid Support for Continued Telecommuting Post-Pandemic. 2020. Available online: https://yle.fi/uutiset/osasto/news/poll_solid_support_for_continued_telecommuting_post-pandemic/11293365 (accessed on 22 January 2021).
  29. Wang, Z.; He, S.Y.; Leung, Y. Applying mobile phone data to travel behaviour research: A literature review. Travel Behav. Soc. 2018, 11, 141–155. [Google Scholar] [CrossRef]
  30. Silm, S.; Järv, O.; Masso, A. Tracing human mobilities through mobile phones. In Handbook of Research Methods and Applications for Mobilities; Büscher, M., Freudendal-Pedersen, M., Kesselring, S., Kristensen, N.G., Eds.; Edward Elgar Publishing: Cheltenham, UK, 2020; pp. 182–192. [Google Scholar] [CrossRef]
  31. Louail, T.; Lenormand, M.; Cantu Ros, O.G.; Picornell, M.; Herranz, R.; Frias-Martinez, E.; Barthelemy, M. From mobile phone data to the spatial structure of cities. Sci. Rep. 2014, 4, 1–12. [Google Scholar] [CrossRef] [Green Version]
  32. Järv, O.; Tenkanen, H.; Salonen, M.; Ahas, R.; Toivonen, T. Dynamic cities: Location-based accessibility modelling as a function of time. Appl. Geogr. 2018, 95, 101–110. [Google Scholar] [CrossRef]
  33. Novak, J.; Ahas, R.; Aasa, A.; Silm, S. Application of mobile phone location data in mapping of commuting patterns and functional regionalization: A pilot study of Estonia. J. Maps 2013, 9, 10–15. [Google Scholar] [CrossRef]
  34. Järv, O.; Müürisepp, K.; Ahas, R.; Derudder, B.; Witlox, F. Ethnic differences in activity spaces as a characteristic of segregation: A study based on mobile phone usage in Tallinn, Estonia. Urban Stud. 2015, 52, 2680–2698. [Google Scholar] [CrossRef]
  35. Wesolowski, A.; Buckee, C.O.; Engø-Monsen, K.; Metcalf, C.J.E. Connecting mobility to infectious diseases: The promise and limits of mobile phone data. J. Infect. Dis. 2016, 214 (Suppl. S4), S414–S420. [Google Scholar] [CrossRef] [PubMed]
  36. Dewulf, B.; Neutens, T.; Lefebvre, W.; Seynaeve, G.; Vanpoucke, C.; Beckx, C.; Van de Weghe, N. Dynamic assessment of exposure to air pollution using mobile phone data. Int. J. Health Geogr. 2016, 15, 14. [Google Scholar] [CrossRef] [Green Version]
  37. Cinnamon, J.; Jones, S.K.; Adger, W.N. Evidence and future potential of mobile phone data for disease disaster management. Geoforum 2016, 75, 253–264. [Google Scholar] [CrossRef]
  38. Järv, O.; Ahas, R.; Witlox, F. Understanding monthly variability in human activity spaces: A twelve-month study using mobile phone call detail records. Transp. Res. Part C Emerg. Technol. 2014, 38, 122–135. [Google Scholar] [CrossRef]
  39. Jiang, S.; Ferreira, J.; Gonzalez, M.C. Activity-Based Human Mobility Patterns Inferred from Mobile Phone Data: A Case Study of Singapore. IEEE Trans. Big Data 2016, 3, 208–219. [Google Scholar] [CrossRef] [Green Version]
  40. Järv, O.; Tominga, A.; Müürisepp, K.; Silm, S. The impact of COVID-19 on daily lives of transnational people based on smartphone data: Estonians in Finland. J. Locat. Based Serv. 2021. [Google Scholar] [CrossRef]
  41. Grantz, K.H.; Meredith, H.R.; Cummings, D.A.T.; Metcalf, C.J.E.; Grenfell, B.T.; Giles, J.R.; Wesolowski, A. The use of mobile phone data to inform analysis of COVID-19 pandemic epidemiology. Nat. Commun. 2020, 11, 1–8. [Google Scholar] [CrossRef]
  42. Oliver, N.; Oliver, N.; Lepri, B.; Lepri, B.; Sterly, H.; Lambiotte, R.; Vinck, P. Mobile phone data for informing public health actions across the COVID-19 pandemic life cycle. Sci. Adv. 2020, 6, eabc0764. [Google Scholar] [CrossRef]
  43. Carlitz, R.D.; Makhura, M.N. Life under lockdown: Illustrating tradeoffs in South Africa’s response to COVID-19. World Dev. 2021, 137, 105168. [Google Scholar] [CrossRef] [PubMed]
  44. Zhou, Y.; Xu, R.; Hu, D.; Yue, Y.; Li, Q.; Xia, J. Effects of human mobility restrictions on the spread of COVID-19 in Shenzhen, China: A modelling study using mobile phone data. Lancet Digit. Health 2020, 2, e417–e424. [Google Scholar] [CrossRef]
  45. Lamb, M.R.; Kandula, S.; Shaman, J. Differential COVID-19 case positivity in New York City neighborhoods: Socioeconomic factors and mobility. Influenza Respir. Viruses 2020. [Google Scholar] [CrossRef]
  46. Yabe, T.; Tsubouchi, K.; Fujiwara, N.; Wada, T.; Sekimoto, Y.; Ukkusuri, S.V. Non-Compulsory Measures Sufficiently Reduced Human Mobility in Tokyo during the COVID-19 Epidemic. Sci. Rep. 2020, 10, 18053. [Google Scholar] [CrossRef] [PubMed]
  47. Pepe, E.; Bajardi, P.; Gauvin, L.; Privitera, F.; Lake, B.; Cattuto, C.; Tizzoni, M. COVID-19 outbreak response, a dataset to assess mobility changes in Italy following national lockdown. Sci. Data 2020, 7, 1–7. [Google Scholar] [CrossRef]
  48. Järv, O.; Tenkanen, H.; Toivonen, T. Enhancing spatial accuracy of mobile phone data using multi-temporal dasymetric interpolation. Int. J. Geogr. Inf. Sci. 2017, 31, 1630–1651. [Google Scholar] [CrossRef]
  49. Poom, A.; Järv, O.; Zook, M.; Toivonen, T. COVID-19 is spatial: Ensuring that mobile Big Data is used for social good. Big Data Soc. 2020, 7, 205395172095208. [Google Scholar] [CrossRef]
  50. Hägerstrand, T. What About People in Regional Science? Pap. Reg. Sci. Assoc. 1970, 24, 7–24. [Google Scholar] [CrossRef]
  51. Traficom. Matkaviestinverkon Liittymät. 2020. Available online: https://www.traficom.fi/fi/tilastot/matkaviestinverkon-liittymat (accessed on 11 November 2020).
  52. Huang, X.; Li, Z.; Jiang, Y.; Li, X.; Porter, D. Twitter reveals human mobility dynamics during the COVID-19 pandemic. PLoS ONE 2020, 15, e0241957. [Google Scholar] [CrossRef]
  53. Yle. Sales of Holiday Cabins Hit 30-Year High. 2020. Available online: https://yle.fi/uutiset/osasto/news/sales_of_holiday_cabins_hit_30-year_high/11648075 (accessed on 25 November 2020).
  54. Tranmer, M.; Steel, D.G. Using census data to investigate the causes of the ecological fallacy. Environ. Plan. A 1998, 30, 817–831. [Google Scholar] [CrossRef] [PubMed] [Green Version]
Figure 1. Illustration of a space–time trajectory consisting of a series of presence snapshots (A). The snapshots can be aggregated into trip records in multiple ways in mobile phone datasets, which can lead to differences in the resulting origin–destination (OD) pairs (B).
Ijgi 10 00103 g001
Figure 2. The varying presence of people at the municipality level compared to the baseline weekdays (1–7 February) in Helsinki, Helsinki metropolitan area (four municipalities), Uusimaa (26 municipalities), and in Finland (311 municipalities).
Ijgi 10 00103 g002
Figure 3. The relative change in the number of people spending time in the municipality on (a) 18 and (b) 28 March, 2020 compared to the baseline week. Black dots indicate the largest cities while the white squares indicate the mainland municipalities with the highest relative share of summer cottages.
Ijgi 10 00103 g003
Figure 4. The correlation between daily incoming commuting flows (per 1000 commuters, log scale) and the change in workday presence of people from the baseline in case of the 30 largest municipalities in Finland.
Ijgi 10 00103 g004
Figure 5. The linear correlation between the increase of people compared to the baseline workdays and the relative amount of summer cottages per 1000 inhabitants at municipality level (R = 0.75). the municipalities of the Åland archipelago are shown in blue dots.
Ijgi 10 00103 g005
Figure 6. The spatial distribution of postal code areas in the Hospital District of Helsinki and Uusimaa (HUS) region by cluster type (a) based on the temporal dynamics of the presence of people from the baseline (6 January–14 March, 2020) (b). Box plots indicate the distribution of postal code areas by cluster type regarding the ratio of workplaces to population (c) and the ratio of second homes to residential buildings (d).
Ijgi 10 00103 g006
Publisher’s Note: MDPI stays neutral with regard to jurisdictional claims in published maps and institutional affiliations.

