
Study on Fractal Characteristics of Migration-Population Flow—Evidence from Egypt


1
School of Architecture, Southeast University, Nanjing 210096, China
2
Department of Arabic, Faculty of Arts, Alexandria University, Alexandria 11445, Egypt
*
Author to whom correspondence should be addressed.
ISPRS Int. J. Geo-Inf. 2021, 10(2), 45; https://0-doi-org.brum.beds.ac.uk/10.3390/ijgi10020045
Submission received: 2 December 2020
/
Revised: 16 January 2021
/
Accepted: 18 January 2021
/
Published: 21 January 2021
(This article belongs to the Special Issue Geographic Complexity: Concepts, Theories, and Practices)
Abstract
:Population migration is a major event of optimizing the allocation of production factors and a key way to construct regional relations and promote spatial reconstruction. However, there are few papers published on population migration that have a direct impact on the sustainable development of deserts owing to the more sensitive and complex man–earth relationship. Therefore, it is important to study the laws and characteristics of population migration in such regions. The study of Egypt by Zipf’s law shows that the spatial distribution of migration population size conforms to the law of power function with fractal characteristics of different types. The migration population is generally in a “Pareto” state in spatial distribution. Decentralization power is the leading driving force of spatial distribution, and scale-free regional distribution shows significant spatial agglomeration and gradient. Limited by research scope and “heavy tail” factors, Zipf’s law is not completely applicable. The spatial pattern and flow field characteristics of the migration population are analyzed in this paper by the conversion from “structural fractal” to “spatial fractal” based on scale-free geographic projection, providing the reference for the formulation of population governance policies and spatial planning strategies in Egypt and more desert countries.
1. Introduction
1.1. Background
Population migration is considered to be an event to re-allocate factors of production in space. The migration and movement of population in a specific space, to some extent, promotes the re-agglomeration and diffusion of social and economic factors [1]. With the booming of urbanization and industrialization, the migration population has become an important link between regions for interconnection and interaction. Population migration drives the social economy, urban transportation, regional culture, and other elements to move and communicate in space, constituting the vigor and vitality of a nation. The emergence and growth of the migration population has played a vital role in accelerating economic development, promoting urbanization and industrialization, and optimizing the geographical allocation of labor resources.
According to the statistics in the Global Deserts Outlook released by the United Nations Environment Programme in 2006, the global desertification covers about 33.7 million square kilometers, more than 25% of the total land area, and the population living in deserts has been up to 500 million. In recent years, desertification of land in the world has shown an accelerating trend and the area of deserts has further expanded under the influence of the interference and destruction by human activities and other factors with global climate change, excessive development and utilization of groundwater, and rapid growth of the population. To this end, the United Nations calls on governments worldwide to attach importance to the special value of deserts, take active actions to use deserts, and govern the desert space in a reasonable way.
There is no strict definition of “desert country” in academic circles at present, but we can judge a “desert country” according to some characteristics. In general, the following conditions to make the judgment are essential, including a large area of desert, great constraints on national development, location in arid and semi-arid areas, hot and dry climate, scarce rainfall and water resources, and low vegetation coverage. According to incomplete statistics, there are about 50 countries with deserts in the world, including 27 identified as “desert countries”. It should be noted that China and the United States have a large area of deserts, but they account for a small proportion of the national territorial area, while most of the land is non-arid. For India, Mexico, New Zealand, Ethiopia, Greece, Argentina, Botswana, Bulgaria, Colombia, Kenya, Pakistan, South Sudan, Senegal, Serbia, South Africa, Venezuela, and other countries, there are also deserts, but most of them are located in warm temperate or tropical climate zones with abundant rainfall, and drylands or deserts have weak constraints on national development, so they are not regarded as “desert countries”, but only countries with deserts.
The ecological environment is fragile and likely to change when disturbed by human activities in drylands and deserts, where the relationships between population and most countries are in a stage of rapid urbanization and industrialization, so land and environment are more sensitive and complex. Population move takes place when an individual or a family seeks a new place of residence to meet their specific needs, and their income and lifestyle are subject to change in the course [2]. Those relocated constitute a significant part of the mobile and migration population. People in drylands and deserts generally live in poor conditions with low income, so when permitted by traffic conditions and policies, population migration turns into a rational choice for people in drylands and deserts to seek the best living and production environment. Migration has a critical impact not only on the well-being of the residents, but also on the sustainable development of the overall eco-socio-economic complex system in drylands and deserts. Therefore, it is of great academic value and of important practical significance for the optimization of eco-socio-economic management policies in drylands and deserts to conduct investigation of the characteristics and laws, reasons, and comprehensive impacts of migration in drylands and deserts.
1.2. Literature Review
As an important representation and carrier of regional social and economic activities, population flow has become very common with the improvement of the level of economic and social development and the improvement of transportation infrastructure conditions, and it promotes the fast flow and optimization of material, capital, information, technology, and other factors in the regional production network. Migration of population is an important manifestation of the flow space, and it has received long-term attention from multiple disciplines such as geography, sociology, planning, demography, and economics. Scholars have paid great attention to the research on the spatial behavior of population mobility and have made a lot of achievements in the macro pattern and micro location characteristics of population flow and the reasons for their appearance. In terms of theoretical research, laws of migration [3], push–pull theory [4], the gravity model [5,6], and the life cycle-mobility model [7] have been put forward; in terms of empirical research, scholars have conducted extensive case studies on the spatial pattern [8,9], characteristics [10,11], causes [12,13] and influencing factors [14,15,16,17], network complexity [18,19,20], relationship of the population migration and urbanization [21,22] with the regional economic development [23,24,25], population policy response and spatial planning strategy [26,27], and other areas.
The research on sustainable development of drylands and deserts has received long-term and sustained attention. The existing research results mainly focus on the land use, changes in coverage, land use planning and its implementation evaluation, sustainable development of oasis cities, population growth, and human activities in drylands and deserts. The achievements made in the research include dynamic tracking of land use and coverage changes in multi temporal and spatial scales [28,29], establishment of land use dynamic simulation and urban expansion prediction models [30,31], analysis of the impact of urbanization and income level on vegetation coverage [32], simulation and planning of land use changes based on the conversion of land use-mondo model [33], investigation of the impact of property rights on land use change patterns [34], the impact of land use and coverage changes on regional sustainable development and regional development policies [35], analysis of the role of land use planning in the sustainable development of drylands and deserts [36], and research on the sustainability of garden city development in deserts [37].
Population is a key factor to determine the sustainable development of natural and social systems in drylands and deserts arid regions. Human activities determine land use patterns and forms, so the number, distribution, and migration of population have been a continuous challenge for the development in drylands and deserts. A number of high-level academic achievements have been made in the study of human activities/population dynamics and their impacts in drylands and deserts. Believing that population growth and climate warming constitute the principal driving forces of development and change in sub-Saharan Africa, Burian analyzed and evaluated the relationship between community population growth, population density, land use, and family adaptability based on the example of northwest Kenya [38]. Guillermo Heider held that water is a key resource that affects decision-making in drylands, so from the perspective of hydrology and ecological science, he analyzed the land use of semi-arid areas by former Hispanics living in central Argentina, and discussed the spatial distribution and mobility of population in drylands [39]. According to the analysis by GIS (Geographic Information System) and geographic detector, Rufino believed that human activities and population dynamics are the main causes of land use changes in Brazil’s semi-arid areas, and areas around major cities are undergoing more dramatic changes and are under greater pressure [40]. Taking Jinta Oasis in China as an example, Shanzhong Qi analyzed that the sustained growth of population and livestock leads to serious environmental degradation problems in the oasis, such as land pollution, desertification, degradation of water environment, and vegetation degradation [41]. Population mobility is an important representation and carrier of social and economic activities in the region.
Zipf’s law is more accurate than the traditional quantitative method in judging the scale-free area and its division of the migration population flow size distribution, and it can better explain the spatial characteristics of the size distribution of the migration population flow based on the conditions of the scale-free area, the slope value, and other parameters and their changes, providing new quantitative means and methods for studying the spatial distribution law of the migration population. However, there is rare empirical research on whether the spatial distribution of the migration population satisfies Zipf’s law, except an exploratory study conducted by Qi Wei [42] and Wang Xuming [43] by Zipf’s law on the size distribution of migration population in China. Drylands and deserts are facing more severe tests of natural environment, and whether the spatial distribution of the migration population in drylands and deserts meets Zipf’s law still needs further empirical test.
Population migration is essentially the “projection” of the microscopic decision-making of the actors on the macro-geographical space on the spatial layout, which is a highly complex integration process and the result of social, economic, and geographical elements. Scholars around the world have now conducted systematic research on the spatial pattern of population migration, influencing factors and mechanisms, network models, spatial effects, and social effects, but most of the results are based on distance models, gravity models, and spatial interaction models. Owing to certain limitations in model parameter settings, the parameter differences often lead to large deviations in empirical research results. From the perspective of research methods, inter-provincial and inter-city population migration networks are becoming increasingly complex with the development of urbanization and regionalization, as well as faster population migration in a larger size, so it is necessary to provide a new method for analysis of the spatial law of population migration. From the perspective of the study area, there are still few research results on the spatial law of migration population in desert countries or regions, and further empirical research is needed to determine whether the spatial distribution characteristics of the migration population in desert countries are the same as in non-desert countries.
1.3. Aim and Question
On the micro level, individual migration changes with the environment, and its decision-making is random and disordered. On the macro level, however, is the decision-making orderly on the whole? Does the geographic data of migration population have fractal characteristics? Is there a law of regularity and stability? How is it reasonable to distribute the migration population in space? The migration decision made by a person or a family as a micro individual is quite random and disorderly, so migration may not show an obvious spatial law at the micro level, but there may be a geographical statistical law at the macro level. That is, individual behavior is disordered, dynamic, and asymmetric at the micro level, but it may show orderly and static laws or even simple laws with certain symmetry. Empirical research has now proven that the urban and regional population is subject to Zipf’s law [44,45,46]. As a process variable of the total population, the migration population has become a socio-economic and geographical phenomenon, and the spatial distribution and organization rules of population immigration and emigration should also satisfy a certain hierarchical distribution pattern, so the rank-size distribution model can be employed to explore the spatial pattern and characteristics of migration-population flow. If the spatial distribution of the migration population size is subject to Zipf’s law, this indicates that a large number of individuals and families distributed in the residential areas of villages and towns interact with and adapt to each other during migration and flow (imitating and following or rejecting and keeping away), and a new structure, schema, nature, and rule that the micro structure does not have will come out at the macro level in cities, provinces, and economic regions at a higher level.
We hold the opinion that, compared with stock data such as general population and permanent resident population, migration population is a typical data of flow, and they may be the same or significantly different in geographic spatial distribution, and as drylands and deserts are unique spatial systems, the migration population there may also be the same or significantly different in spatial distribution. They all require further empirical research. With the expansion of population flow in desert countries, especially the rapid increase in inter-regional population migration, inter-provincial population flow has become a key driver to promote regional spatial restructuring as well as accelerate and reshape the national economic geographic pattern, urbanization process, and spatial system. Therefore, it is of great theoretical and practical significance to accurately and timely grasp the scale and structure of inter-provincial migratory population and its spatial rules for guiding the spatial planning of urbanization construction in desert countries, the formulation of spatial governance and population management policies, as well as social and economic stability and sustainable development.
Therefore, in this research, we try to answer the following two questions. First, the spatial distribution of the total population in cities and regions conforms to the rank-size rule, and does the migration population comply with the same rule? Second, what impact will the special climate and harsh living conditions in drylands and deserts have on the spatial distribution of the migration population size? Unfortunately, there is no in-depth research or discussion on these issues in the existing literature.
To this end, this paper, by taking Egypt as an example, attempts to explore the spatial characteristics and laws of population migration in drylands and deserts depending on the empirical analysis of official census data, so as to provide reference for the formulation of population flow management policies and planning in drylands and deserts, and lay a foundation for the study of dynamic mechanism and comprehensive impact of population mobility in drylands and deserts.
2. Study Area
2.1. Egypt Is A Typical Desert Country
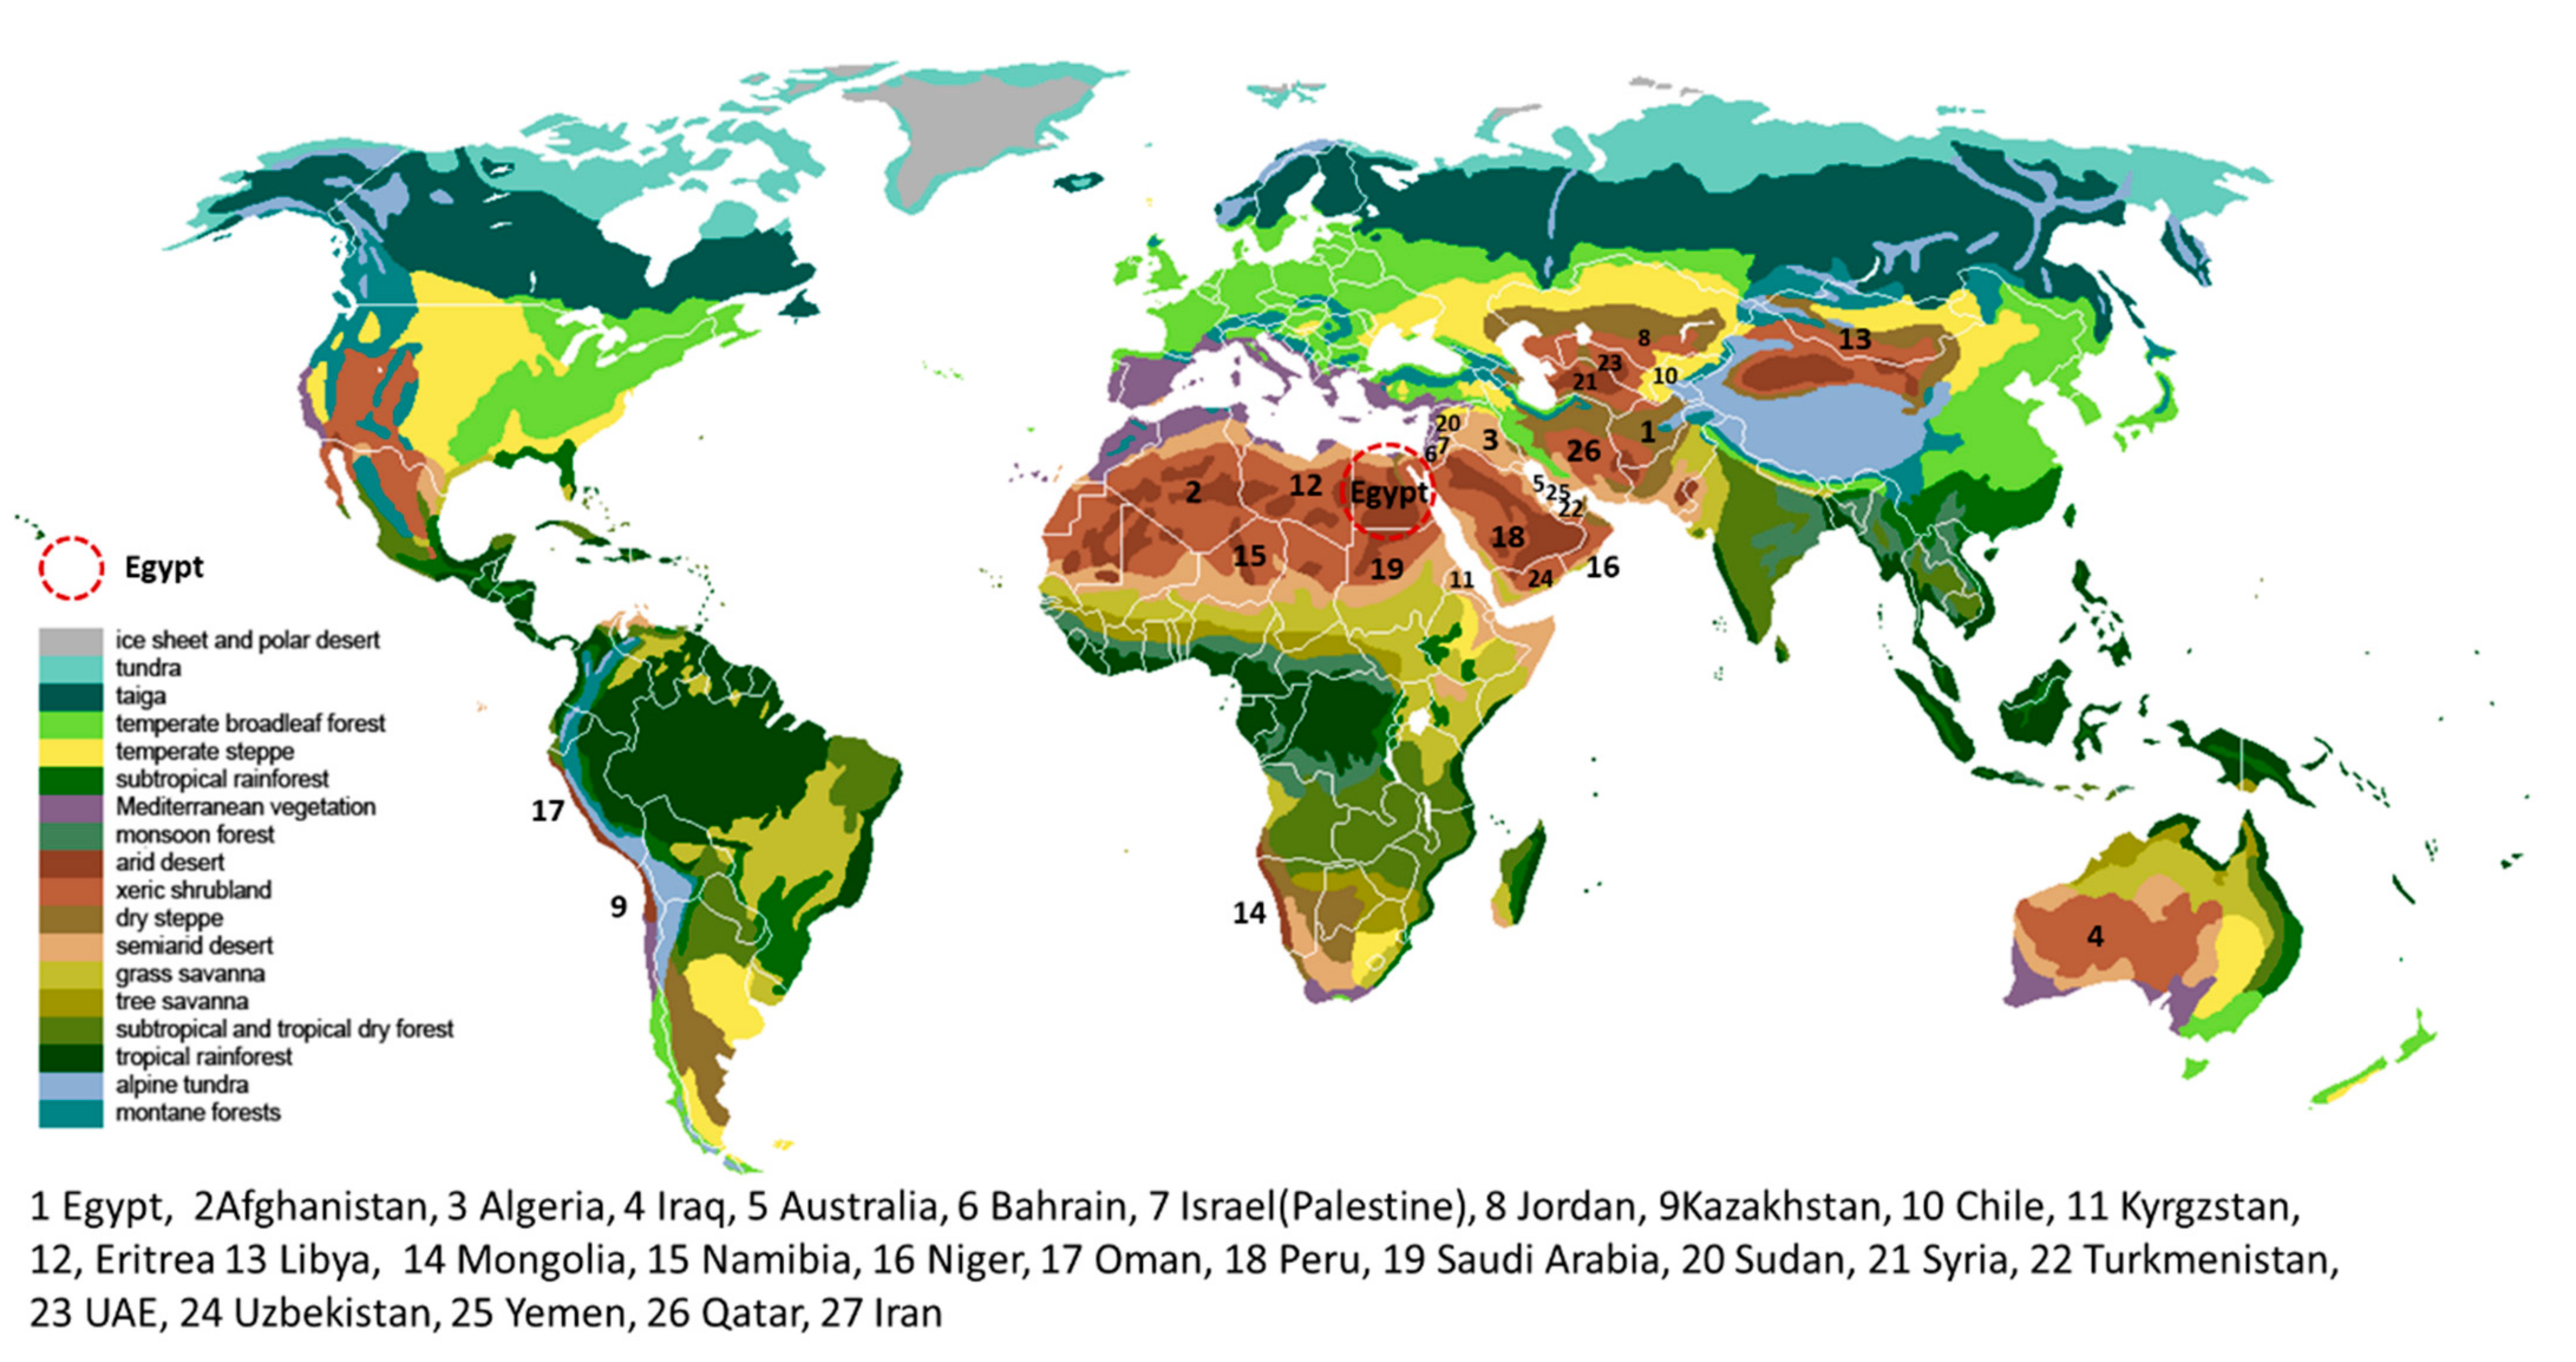
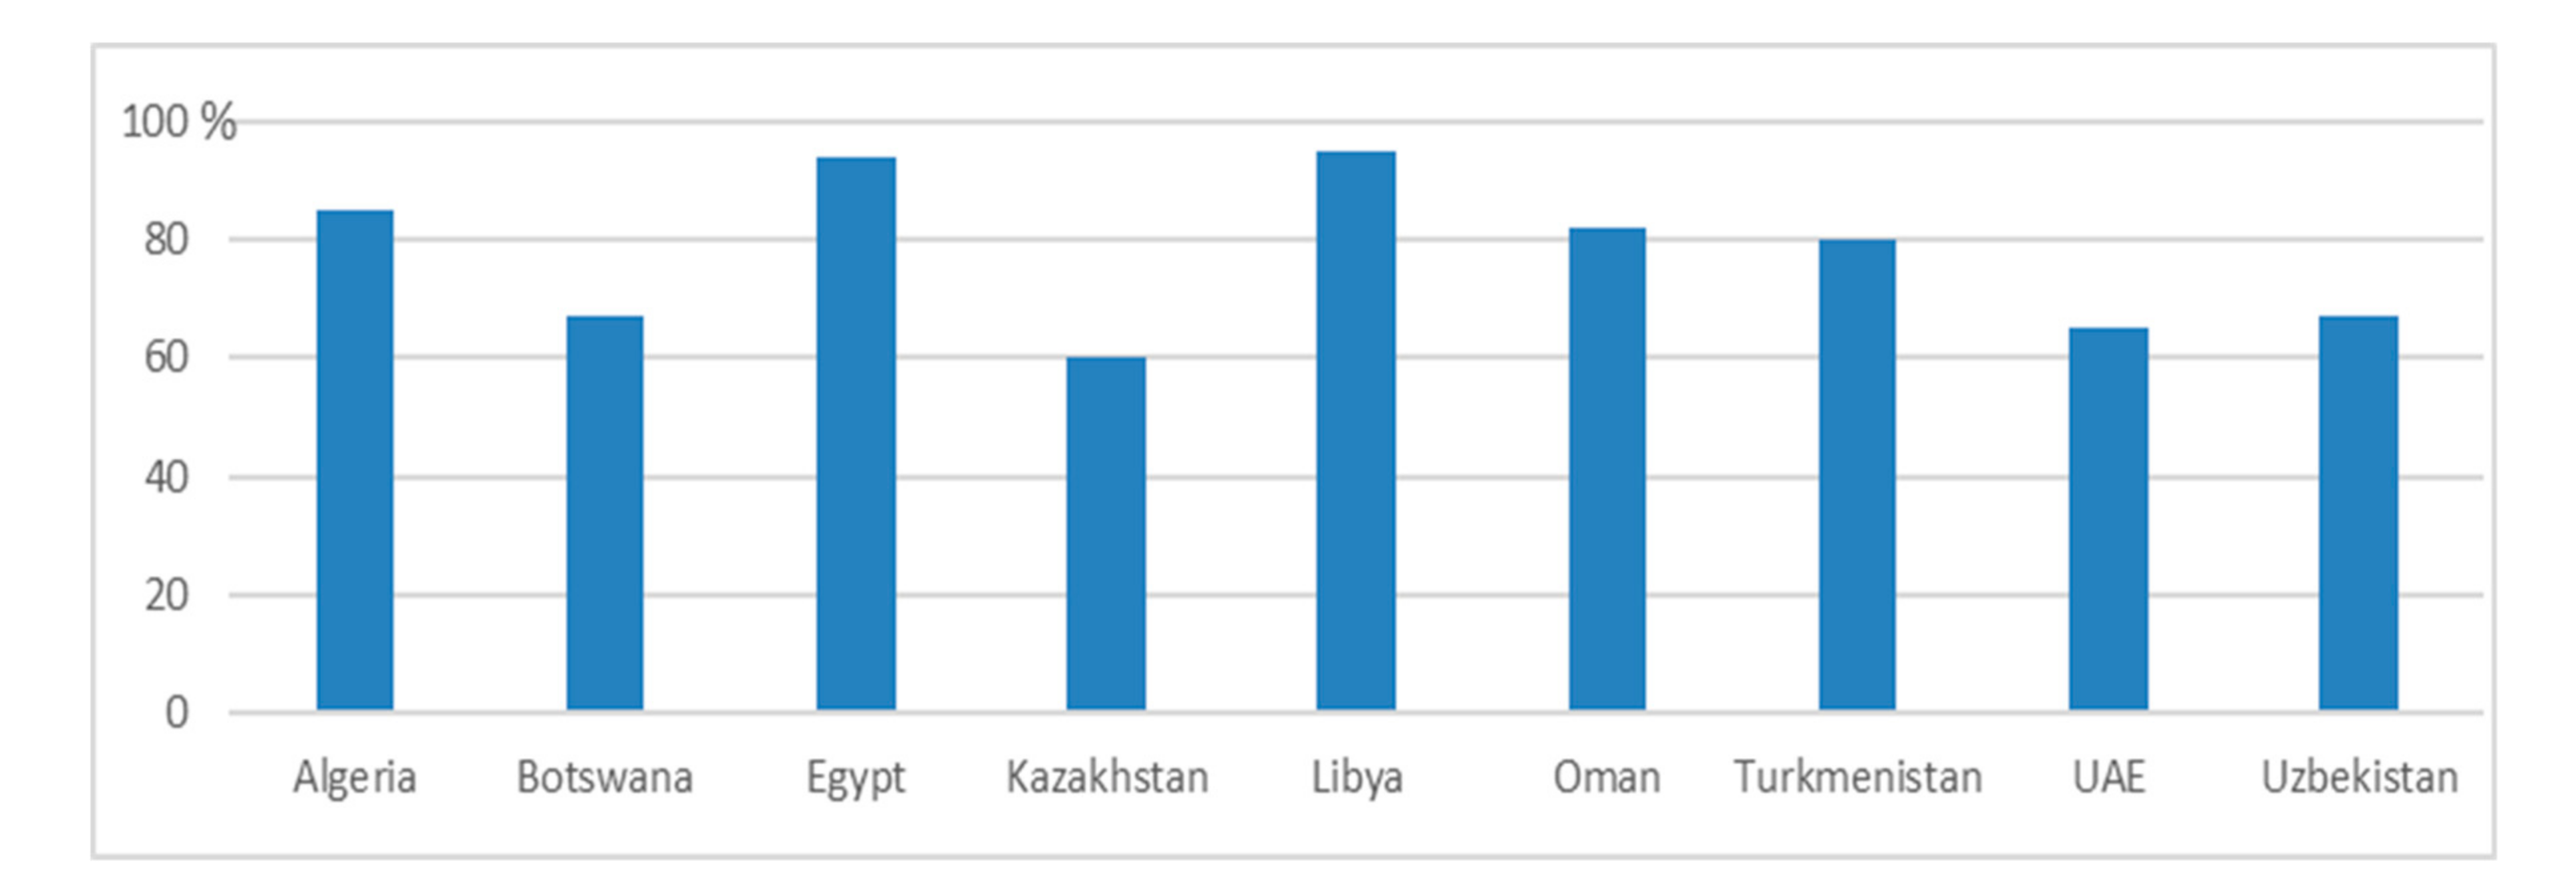
Egypt is a typical “desert country” crossing Asia and Africa, covering an area of 1.0145 million km2, 94% of which is desert, except for limited oases on both sides of the Nile and the delta where the Nile enters the sea. According to the comparative analysis of 27 “desert countries” in terms of land area, population size, per capita gross domestic product (GDP), and desert coverage, Egypt has a large desert area with a very high proportion of land desertification, and it ranks first in population size and land area, but lags behind in per capita GDP, quite typical and representative among desert countries (Figure 1 and Figure 2 and Table 1).
As a desert country, Egypt has a very fragile ecological environment. The Egyptian government has always attached great importance to the protection of drylands and deserts. Further, as a major developing country in the world, Egypt is active in promoting desert utilization and desert control in terms of economic development and urban construction, including pushing desert land improvement with the help of the Aswan Dam, and promoting the construction of new towns such as New Cairo, New Capital, and Sadt depending on the desert areas, which have had a complex impact on the population, industry, ecology, and other factors in the desert area. Special research on population growth and distribution, migration, and its characteristics and spatial effects in Egypt will not only provide policy recommendations for spatial governance and desert utilization planning in Egypt, but will also provide reference for desert countries such as Libya, Algeria, Saudi Arabia, and UAE for scientific and rational utilization of deserts and formulation of the national development strategy.
2.2. Research on Population Dynamics and Migration in Egypt Attracts Attention
There have been exploratory studies on the dynamics and distribution of the Egyptian population now, which have analyzed population growth and distribution and evaluated population policies in Egypt based on census or statistical data. Keith Sutton analyzed the population growth of Cairo based on the Egypt 1996 census of population, finding that the annual population growth of 2.74% in 1976–1986 was closely related to the planning and policies, which was mainly attributed to the master plan of Cairo in 1970 and 1983; the urban population of Cairo dropped sharply and the suburban population continued to grow in 1986–1996, but migrants to the suburbs did not congregate in new towns planned for construction under the influence of many factors, such as spontaneous urbanization, Cairo Ring Road, peripheral informal settlements, and the suggestion to plan the Cairo–Alexandria urban corridor [47]. Stewart, using the GIS tool, analyzed the urban and spatial structure of population in Greater Cairo by quantitative evaluation of the population density change pattern in the urban administration region of Greater Cairo in 1986–1996 [48]. Dalia M. Ibrahiem, using the Johansen cointegration method, vector error correction model (VECM), generalized impulse response function, and variance decomposition technology (Dalia M. Ibrahiem used the Johansen cointegration approach, vector error correction model (VECM), generalized impulse response functions, and variance decomposition technique), analyzed the causal relationship between road energy consumption, economic growth, urbanization, and population growth in Egypt during 1980–2011 [49]. Ghanem and Samar Khairy established a multi-equation model based on Co2 emissions, air pollution morbidity, mortality, Egyptian labor productivity, and other indexes, and analyzed the relationship between Egyptian population growth and the environment in 1950–2010 and its impact on sustainable development [50].
The Egyptian government has attached great importance to international and domestic migration and has carried out corresponding population censuses and statistics in recent years. Inspired by the research of Barry McCormick and Jackline Wahba on the geographical inequality of return international migration in Egypt [51], studies on Egypt’s international migration, migration psychology, and domestic migration mechanisms and effects have been gradually appearing. Tamer Afifi, based on expert interviews, migration questionnaires, and statistical data analysis of the Central Agency for Public Mobilization and Statistics, tried to establish the relationship between Egyptian international migration and desertification (including soil degradation, soil salinity, soil erosion, and sand dunes) [52]. Harry Pettit focused on the emotional life of young Egyptian migrants and made a comparative analysis of Egyptian and Dutch migrants by ethnography [53]. Believing migration is a major living strategy of a family, Arouri Mohamed studied the push as well as pull effects of wealth inequality on Egyptian migrants by means of gravity models [54]. Ma ZhiShan and Zhao Sidong reveals the spatial pattern of the migration population in Egypt, based on the provinces as the spatial nodes of population migration, a “source–flow–sink” analysis framework was established by “source–sink” theory and flow field theory [55].
To sum up, the study on population dynamics and migration in Egypt is making robust progress, and a number of valuable research results have been achieved, but there are still some deficiencies, mainly embodied in two dimensions. First, on the spatial scale, these studies mainly focus on the regional space of Greater Cairo or the overall space of the country, which is too micro or too macro, with a lack of comprehensive consideration of multi-scale spatial units in different economic regions, provinces, and cities in Egypt. Second, in the field of research, they mainly focus on population growth dynamics and its impact, international migration, migration effect, and the like, lacking special investigation of the spatial effect of population flow or the spatial distribution of regional migration size, offering weak support for the formulation of Egypt’s population development strategic planning and space policy. The spatial characteristics of migration population in Egypt are analyzed in this paper on the two spatial scales of province and economic region based on the government’s census data of Egypt for empirical research, which helps deepen the understanding of the spatial distribution characteristics of population and the spatial law of population migration in drylands and deserts.
3. Research Methods and Data Sources
3.1. Research Methods
The term fractal is used to describe an object displaying self-similarity at different scales. This self-similarity can be measured by either the power-law exponent or Zipf’s law, which is a popular method for characterizing the fractal nature of geographic features [55,56,57]. Fractal is an important feature of complex systems, which has been observed in many empirical studies [58,59,60]. Zipf’s law was first put forward by German scholar Auerbach [61] in 1913 when he studied the distribution law of rank-size distribution of cities in Europe and the United States, and the model was improved and expanded by Gershon Alperovich [62], Steven Brakman [63], Guérin-Pace [64], Chen Yanguang [65,66,67], and other scholars, making the equation more scientific. Zipf’s law is mainly used for quantitative analysis of the hierarchical structure relationship between rank and size of the research object. Conformance to Zipf’s law shows that the research object is in the best state and the dynamic balance between order and disorder of spatial organization is achieved. Zipf’s parameters are the basis to judge the spatial complexity and self-organized criticality. If the rank-size double logarithmic scatter plot is “linear”, it represents the spatial fractal of the research object. Under the condition of meeting the requirements of goodness of fit, it can be determined as monofractal if the scatter diagram can only form one line, or as multifractal if it can form multiple lines by segmentation [68,69]. The power index (1) and logarithm (2) with strong universality are as follows. In the formula, TPi and TRi represent the total population size and rank of the i-th city, TP1 represents the total population size of the first city (city 1), and q1 represents the elastic coefficient (constant). Empirical studies in many countries have proven that the urban population size is subject to Zipf’s law [70,71], including America [72,73,74], China [75,76,77], Canada [78], Germany [79], Denmark [80], Croatia [81], Netherlands [82], Polish [83], Malaysia [84], India [85], South Africa [86], and Turkey [87].
In the formula for studying the migration population, and represent the size and rank of migration population in the i-th space cell, respectively, and represents the size of migration population in the first space cell. In Zipf’s law, is the scale of the complex driving scattered and centralized spatial distribution of the migration population and its absolute value represents the law of spatial distribution pattern of migration population size. Specifically,= 1 indicates that the migration population is optimally distributed in a natural state, which is the ideal distribution pattern as well as state to be pursued by policy and plan makers. < 1 indicates that the spatial pattern of size distribution is in logarithmic normal distribution, predominant with more intermediate rank nodes, but not very prominent in high-rank cities or provinces in size, and that it has a limited demonstration and driving effect (radiation from the city) on the region, thus the spatial distribution is dispersed and balanced. A smaller value implies a more dispersed and balanced distribution, indicating that the spatial distribution of migration population is decentralized. > 1 indicates that the spatial pattern of size distribution is in Pareto distribution, especially prominent in high-rank cities. In this case, there are few intermediate rank nodes, and the migration population mainly concentrate in the top “head” cities or regions, indicating that the spatial distribution of the migration population is decentralized. A larger absolute value of implies more concentrated spatial distribution of the migration population size. = 0 indicates that the migration population is equally distributed across cities or regions, and →∞ indicates that the migration population is completely concentrated in a certain region or city, which are two rare cases in reality as they are extreme distribution patterns [88].
To facilitate the comparison between different regions, this paper subdivides the spatial distribution patterns of migration population size according to the study of Zhou Caiping [89] based on the value of , and holds that the optimal distribution is the best state under which resources can be used in a rational and orderly manner to promote the benign development of nature–society–economy (Table 2).
3.2. Research Steps
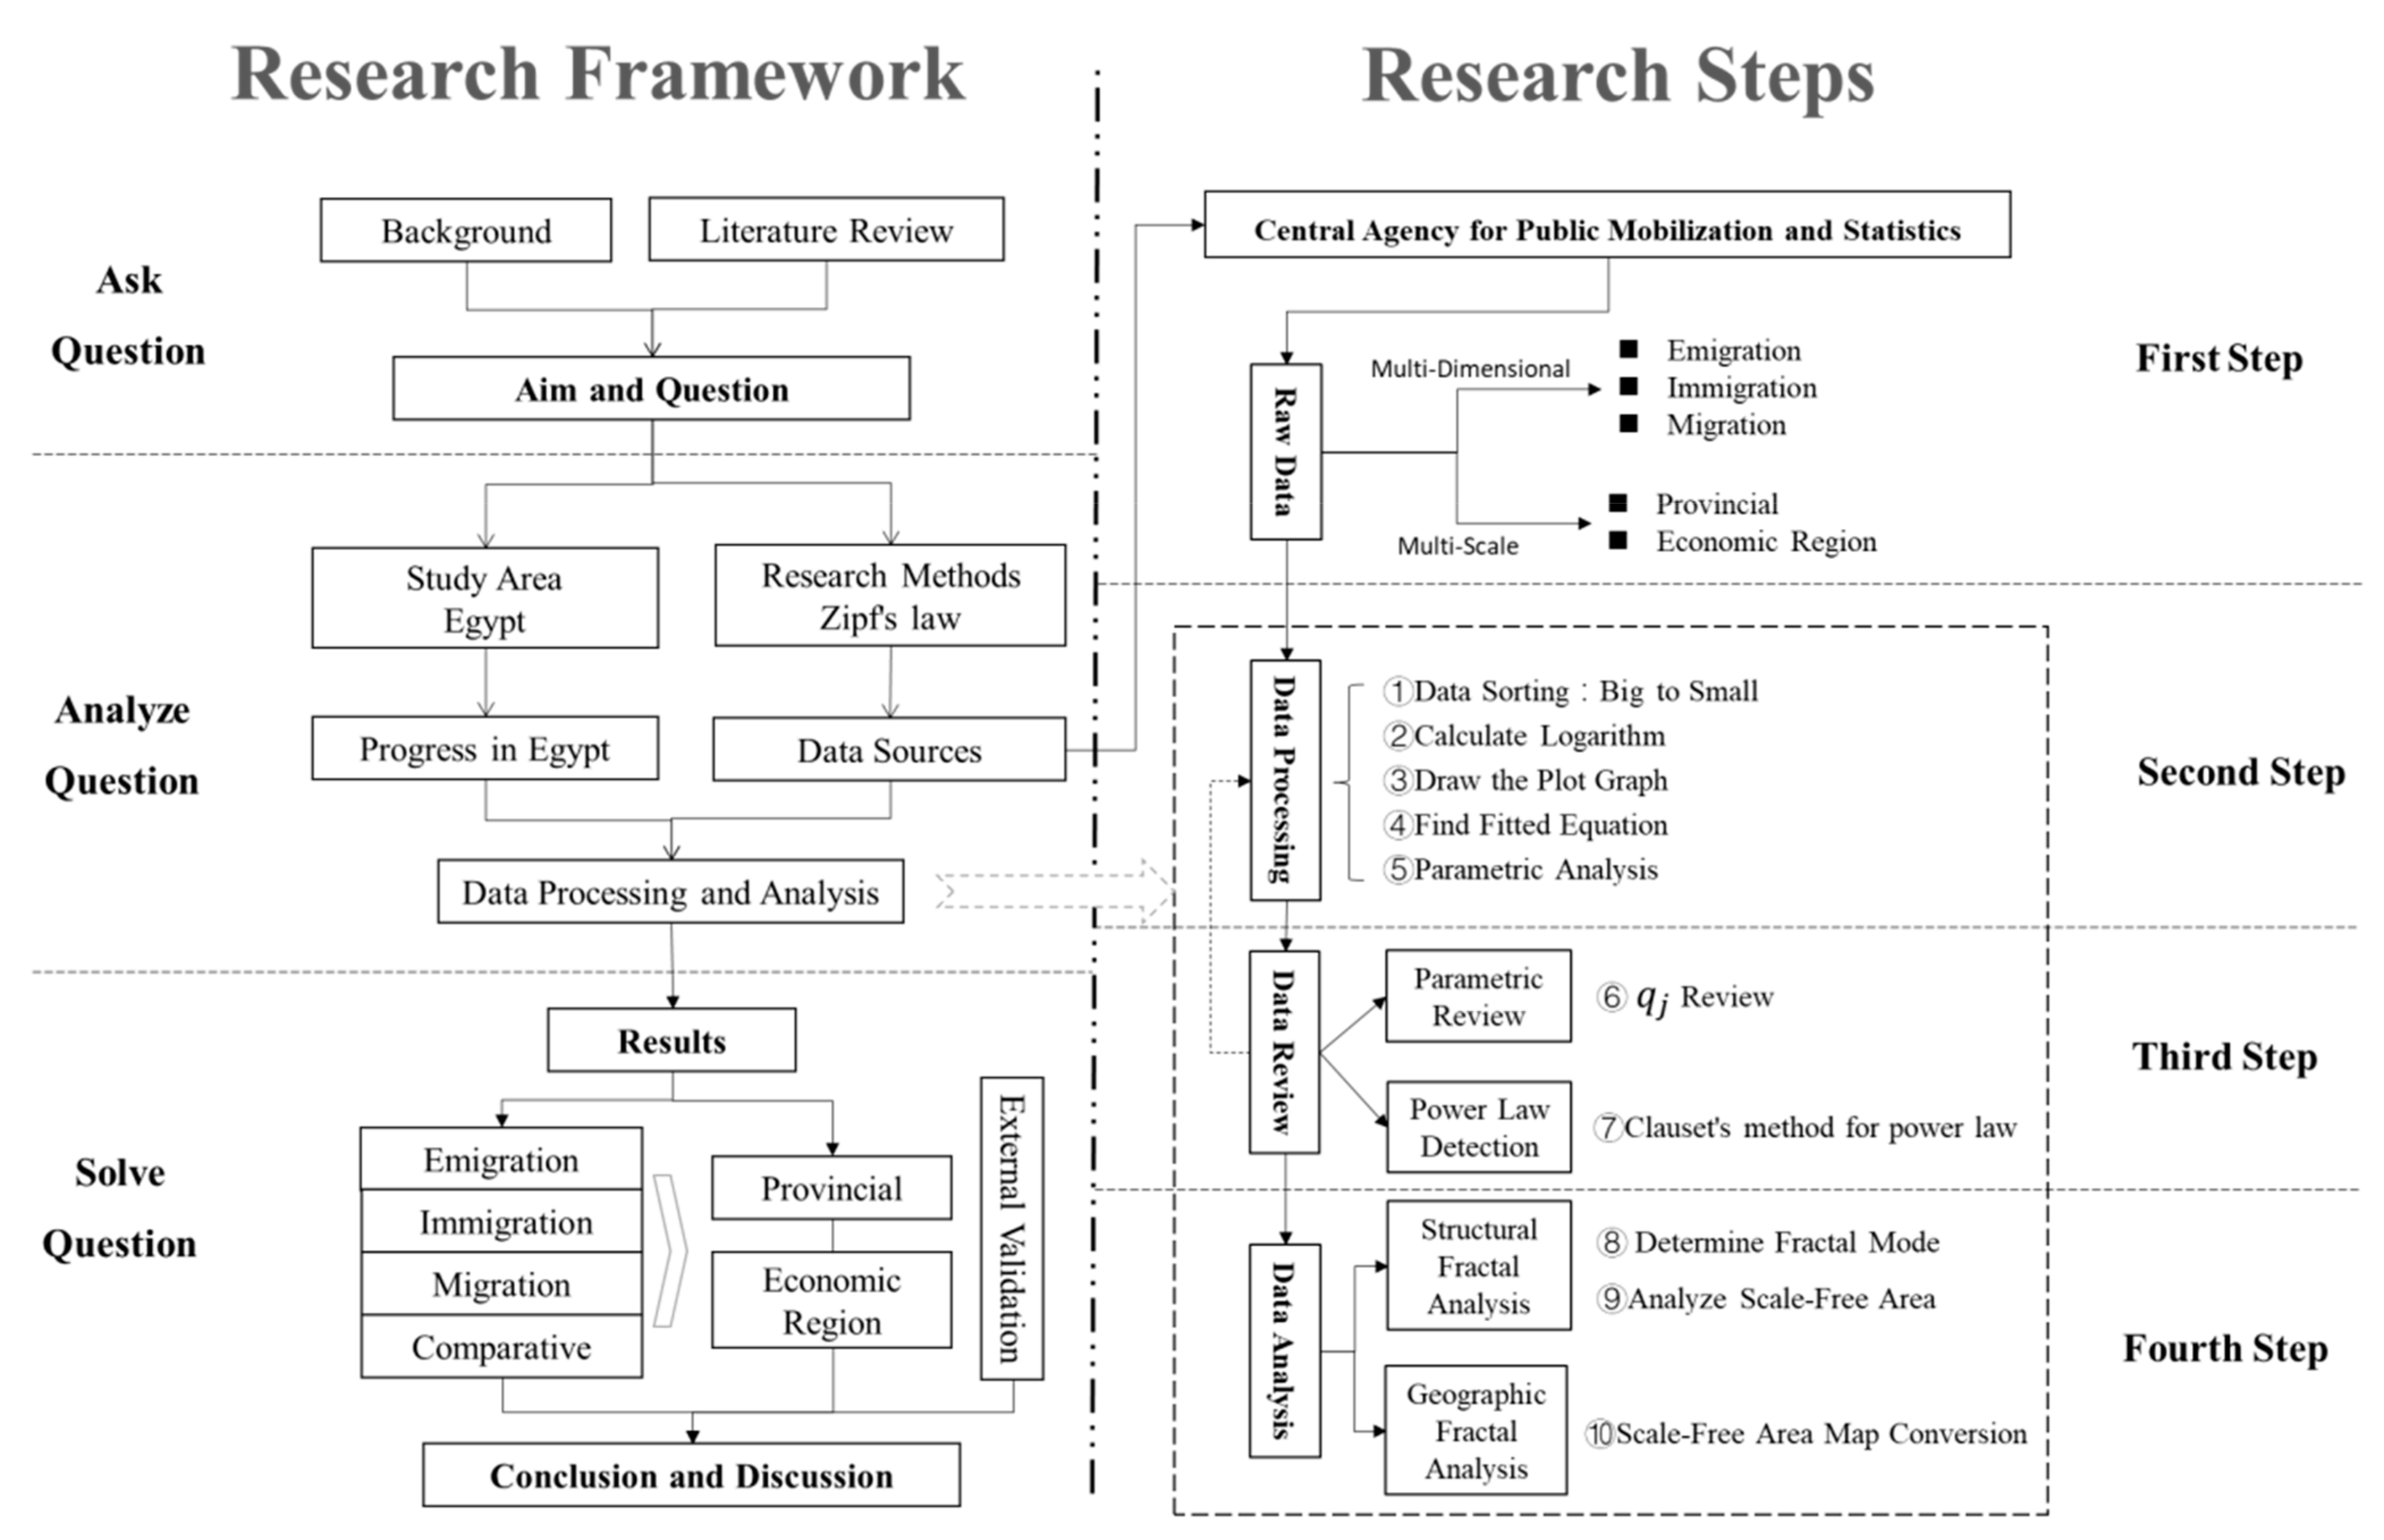
Figure 3 shows logical framework and research steps of this paper. The former includes three levels of ask question, analyze question, and solve question, while the latter presents the four main research steps. First, according to the background and literature analysis, we put forward the research aims and questions. Second, we choose Egypt as the study area to collect, process, and analyze the migration-population data by the research method of Zipf’s law. Third, we conducted the multi-dimensional and multi-scale analysis of Egypt’s migration population and, finally, reached some conclusions with the help of external validation discussions. The main research steps are as follows.
The first step is to download the census statistics of migration population in Egypt from the official website of Central Agency for Public Mobilization and Statistics, and communicate on data collection and representational significance via e-mail and telephone for abnormal or missing data.
The second step is to sort the sizes (①) of migration population from 27 provinces and 7 economic regions into descending order from two perspectives of previous residence (population emigration) and current residence (population immigration) and two spatial scales of province and economic region, and draw the logarithmic scatter plot of migration population rank and size (② and ③); that is, Zipf’s law schema. If the scattered points on the coordinate map form an approximately straight line, it indicates that the spatial distribution of the migration population size complies with Zipf’s law. Scale-free areas correspond to straight lines. According to the coverage of the research object by the scale-free areas, they are divided into local monofractal, overall monofractal, complete monofractal, bifractal, and other forms. The next step is to perform the linear fitting of the double logarithmic curves (④) according to Formula (2), calculate the absolute value of the slope (⑤), establish the dynamic relationship between the micro-complex behavior of the migration population and the macro-simplification law, and analyze the “structural fractal” law of the spatial distribution of the size and grade of the migration population from the macroscopic statistics.
The third step is data review, including parametric review and power law detection. The value of should meet the requirements of Table 2 (⑥), otherwise it will be further tested according to Clause’s method (⑦) [90]. In order to distinguish between exponential distribution and power-law distribution, we will learn and use the methods of Hanel [91] and Gabaix [92] to test again, and then give the final conclusion. Good linear fitting, if possible, indicates that the spatial distribution of migration population size presents fractal laws. If it fails the review, we need to repeat the second step again after data processing. As Clause said, there must be some lower bound (that is, ) to the power-law behavior. It would probably be acceptable in this case for to err a little on the high side (though not too much), but estimates that are too low could have severe consequences. Clause found it possible to give results accurate to about 1% or better provided . In our paper, we adjusted this value based on the data of Egyptian population migration and set it to 7. Therefore, when processing data, we give up data less than 7. To strengthen our case for the power law, we would like to rule out the competing exponential distribution, if possible. We cannot of course compare the power-law fit of our data with fits to every competing distribution, of which there is an infinite number. By combining R2-value calculations with respect to the power law and exponential distribution plausible competing distributions, we can in this way make a good case for or against the power-law form for our data.
The fourth step includes structural fractal analysis (⑧) and geographic fractal analysis (⑩). Accurate identification and analysis of the scale-free area are the key (⑨). The presence of a scale-free area indicates that the spatial distribution of the migration population size is monofractal. According to the parameters such as goodness of fit and scale-free area coverage, the monofractal can be further divided into complete monofractal (the scale-free area covers all subjects), overall monofractal (the scale-free area covers most of subjects), and local monofractal (the scale-free area only covers a small percentage of subjects); if there are two scale-free areas, this indicates that the spatial distribution of the migration population size is in biracial, and two communities have been formed. Based on the linear fitting results and the parameters such as slope and goodness of fit, define the scope and composition of the scale-free area by the fitting error method, and conduct a spatial analysis of the subjects in the scale-free area, in order to study the geographic spatial distribution pattern of the migration population; further, transform the “structural fractal” into the “spatial fractal” and reveal the fractal law of the spatial distribution of the migration population in Egypt, so as to provide a theoretical basis for the formulation of management policies, spatial governance strategies, and spatial planning strategies for the floating population.
It should be noted here that, owing to the complexity in reality and the influence of many factors such as complex system development and immature fractal structure evolution, no subjects would perfectly conform to Zipf’s law, that is, there are one or more scale-free areas. Linear fitting of the double logarithmic curves may give rise to the following cases: completely linear, mostly linear, linear in a certain segment, and linear in two or more segments, representing that the migration population has achieved complete fractal, overall fractal, partial fractal, monofractal, bifractal, and even multi-fractal in spatial distribution, respectively. Therefore, in the case of incomplete fractal, it is necessary to measure the slope value of linear fitting on the whole and measure the slope value of linear fitting in the scale-free area separately. The latter is more accurate. Accurate location of the scale-free area is the premise to accurately picture the spatial fractal of the migration population and determine the fractal dimensions. The common methods to determine the scale-free area at present include artificial determination, correlation coefficient test, coefficient of reinforcement, fitting error method, fractal-dimension value error, and self-similarity ratio. The fitting error method is used in this paper, that is, priority is given to choosing the one with the largest R2 as the optimal solution when there is a reasonable number of fitted individuals by comparing their R2 values through multiple linear fittings. Subjects covered by piecewise fractal or local fractal are set to 7 as the threshold value in 27 provinces and 7 economic regions of Egypt. Otherwise, it tends to fall into the problem of local optimization. Linear fitting in this paper covers three levels. The first is all fitting, requiring R2 ≥ 0.90 (including rounded value, the same as below). Otherwise, it will be regarded as non-conforming upon testing. The second is overall fitting, that is, from the parts failing to pass the all-fitting test, those appearing to have “linear” characteristics are taken for linear fitting, and it is required that more than 80% of the total subjects participate in the fitting test with R2 ≥ 0.90. Otherwise, it will also be regarded as non-conforming. The third is piecewise fitting or local fitting, that is, from the parts failing to pass all and overall fitting tests, one or two appearing to have “linear” characteristics are taken for linear fitting with R2 ≥ 0.95 (including rounded value, the same below). Otherwise, it will be regarded as non-conforming upon testing. For those failing to pass the fitting test at all three levels, it is determined that their spatial distribution does not conform to Zipf’s law. If the double logarithmic scatter plots have obvious “linear” characteristics, but their goodness of fit fails to pass the test, they are deemed as quasi fractal, including quasi monofractal, quasi bifractal, and other forms in this paper.
3.3. Data Sources and Processing
The data used in this paper mainly come from the Statistical Yearbook-Housing, Statistical Yearbook-Population and General Indicators, Egypt in Figures-Population published by the Central Agency for Public Mobilization and Statistics, and data collection of migration population (including current and previous residence) and total population in Egypt in 2017. The sum of the populations of the current residence and the original residence in the same province represents the total population migration, and the absolute value of the difference between the two is the net migration population. According to the above research steps, the double logarithmic scatter plots of population immigration and emigration on the two spatial scales of province and economic region were drawn, and linear fitting was performed (Figure A1, Figure A2, Figure A3, Figure A4 and Figure A5, Table A1, Table A2 and Table A3). For the data with the “heavy-tailed” phenomenon, learn and use the method of Clause, Hanel, and Gabaix to further verify exponential fitting (Table A4 and Table A5).
4. Results
4.1. Emigration: Previous Residence
4.1.1. Provincial Spatial Scale
According to the analysis in Figure A1, the spatial distribution of the migration population size at the spatial scale of province in Egypt generally conforms to Zipf’s law. However, there are certain differences in the level of fractal development between provinces, where monofractal, bifractal, complete fractal, overall fractal, local fractal, and other forms are developed. From the overall perspective, Egypt is in complete monofractal. The double logarithmic scatter plot of the total migration population is remarkably linear with a linear fitting slope of 1.3158 (absolute value, the same as below), and the spatial distribution tends to be centralized.
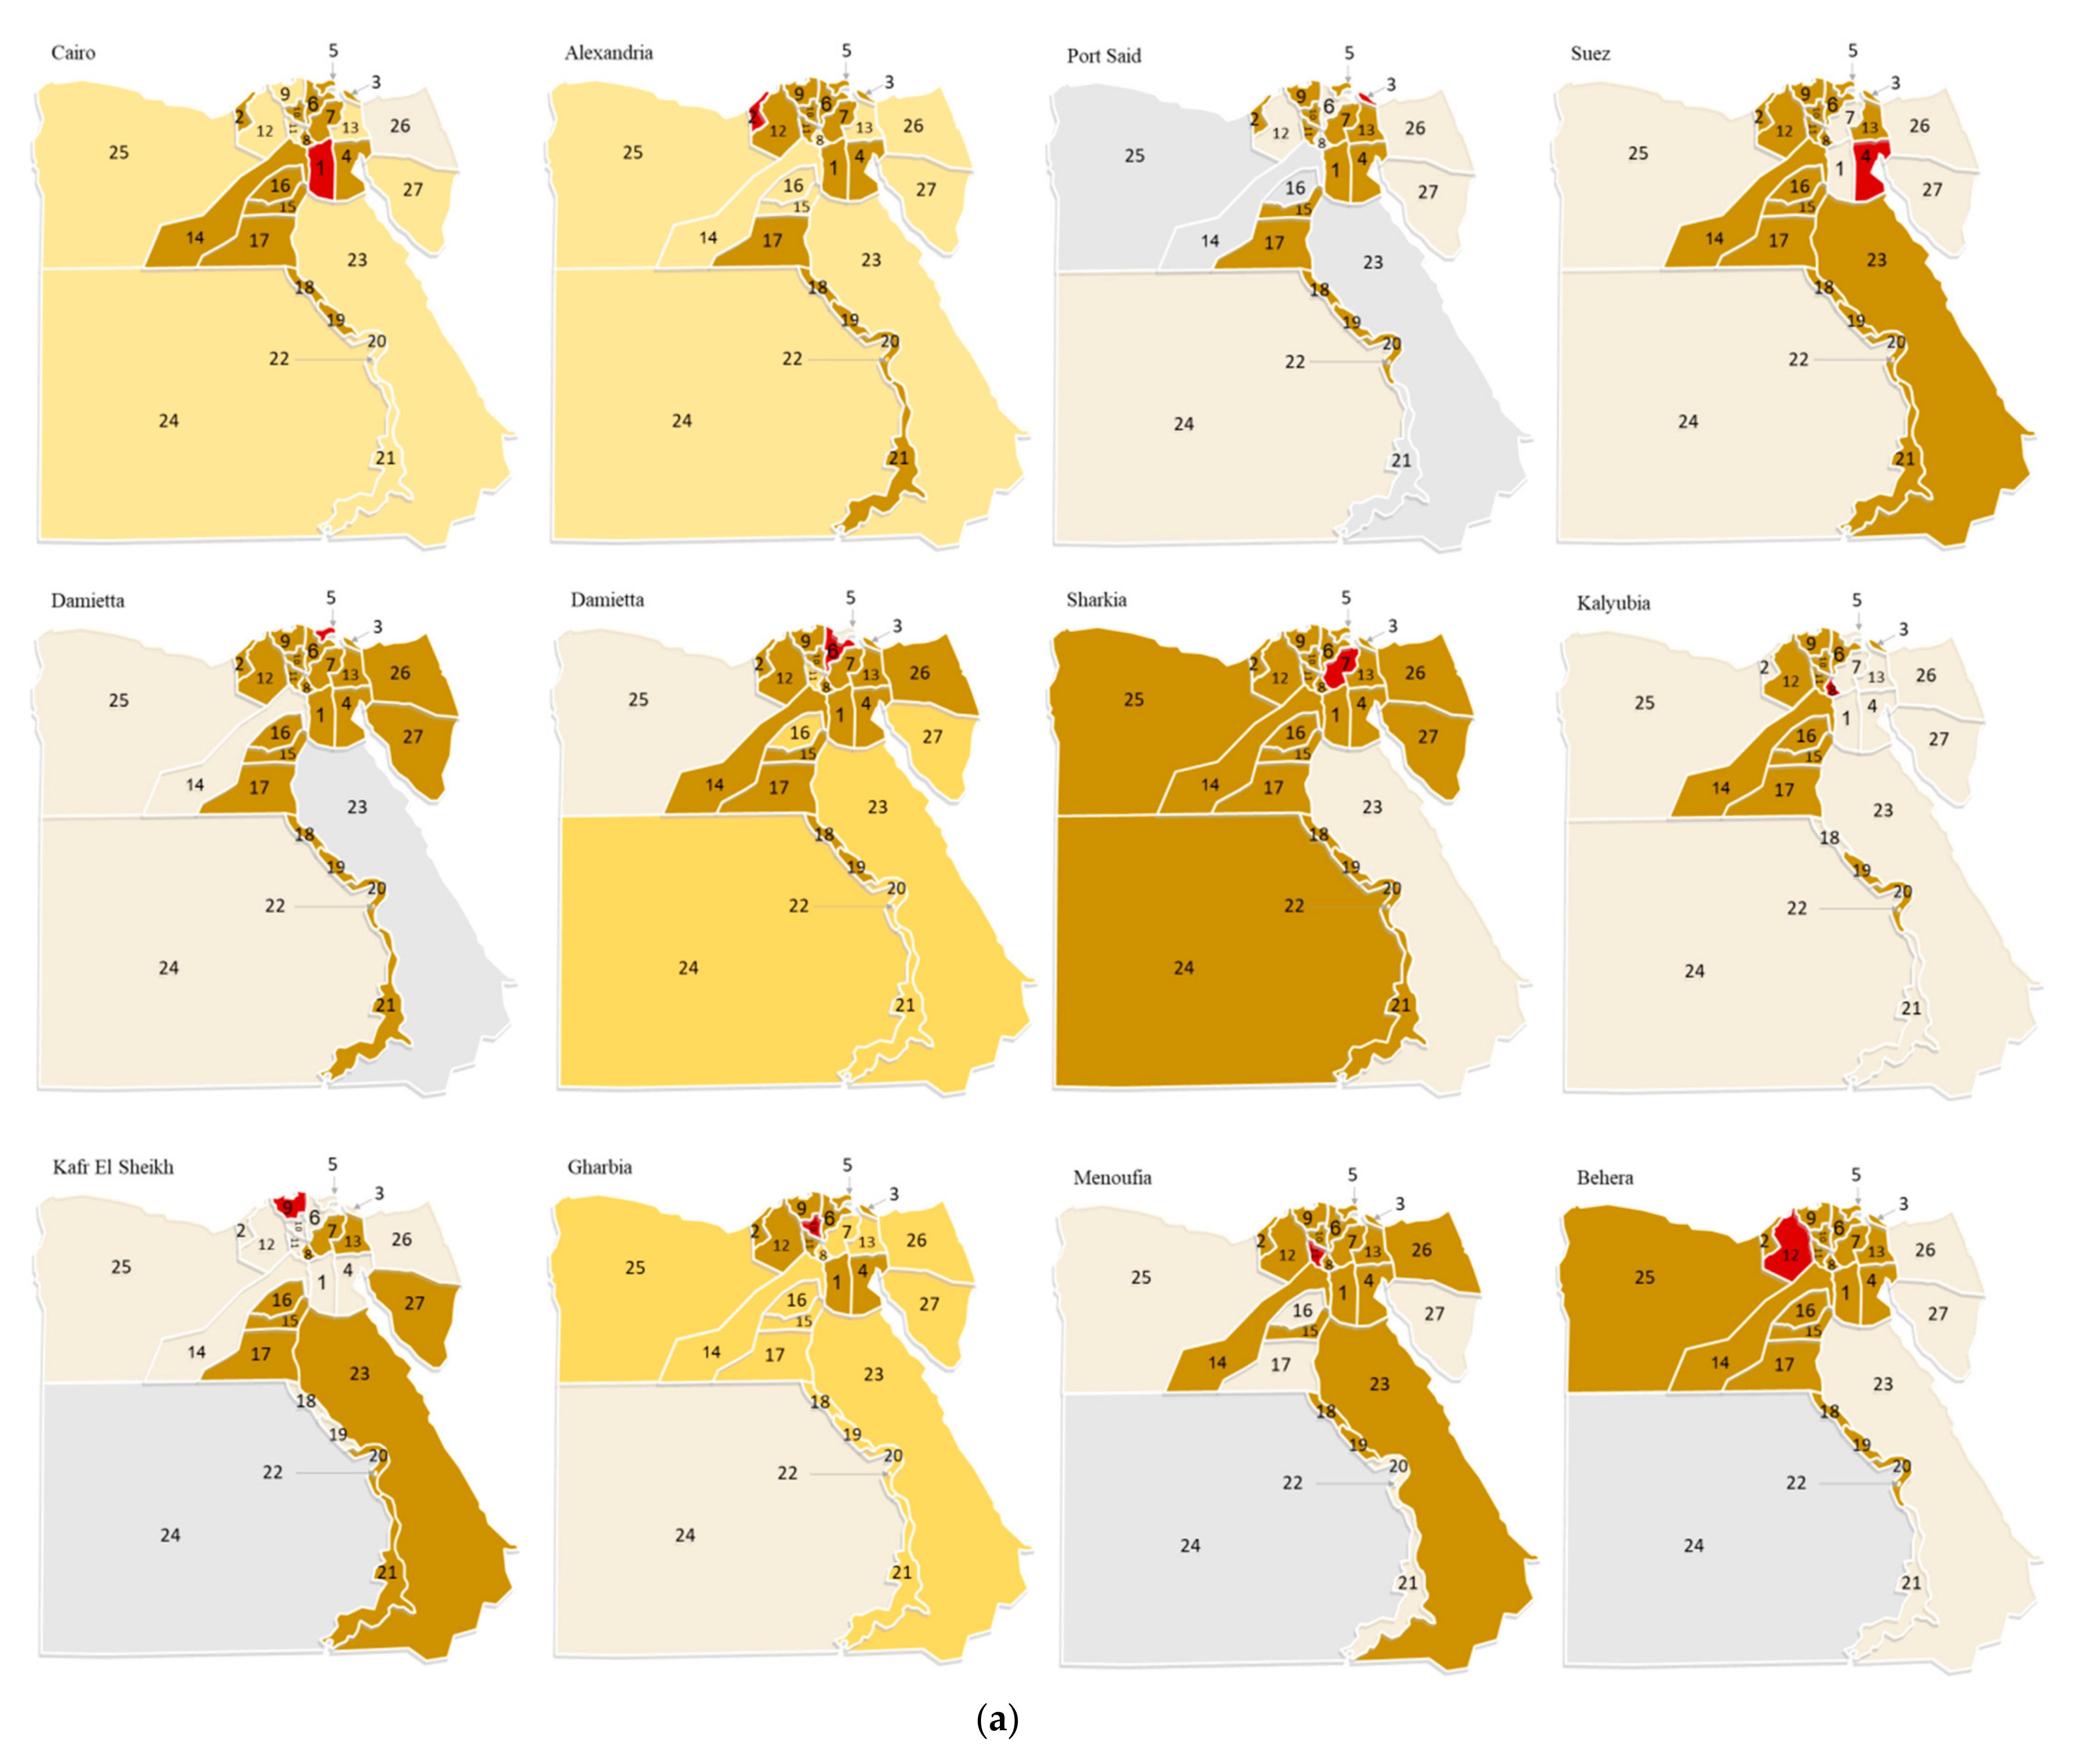
From the perspective of fractal types, Menia is completely monofractal and has matured according to the double logarithmic scatter plot of the migration population and the goodness of fit index; Port Said, Suez, Damietta, Menoufia, Behera, Beni-Suef, Fayoum, Asyout, Suhag, Aswan, Luxor, El Wadi El Gidid, and South Sinai are in overall monofractal, not mature with room for improvement; Kalyubia, Kafr El Sheikh, Red Sea, and Matrouh are in local monofractal, and quite immature as key areas for spatial governance and planning guidance; and Dakahlia is in bifractal, with two communities developed. Qena and North Sinai failed the test of R2 > 0.95 and they are in overall quasi monofractal; none of the second scale-free area of Cairo, Alexandria, Sharkia, the first scale-free area of Gharbia, and two scale-free areas of Ismailia and Giza, passed the test of R2 > 0.95, and they are in quasi bifractal. Provinces in bifractal are all well-developed, mainly located in the vicinity of Cairo, while those in monofractal are in southern and western Egypt. Provinces on monofractal and bifractal are distributed in a core-periphery ring (Figure 4).
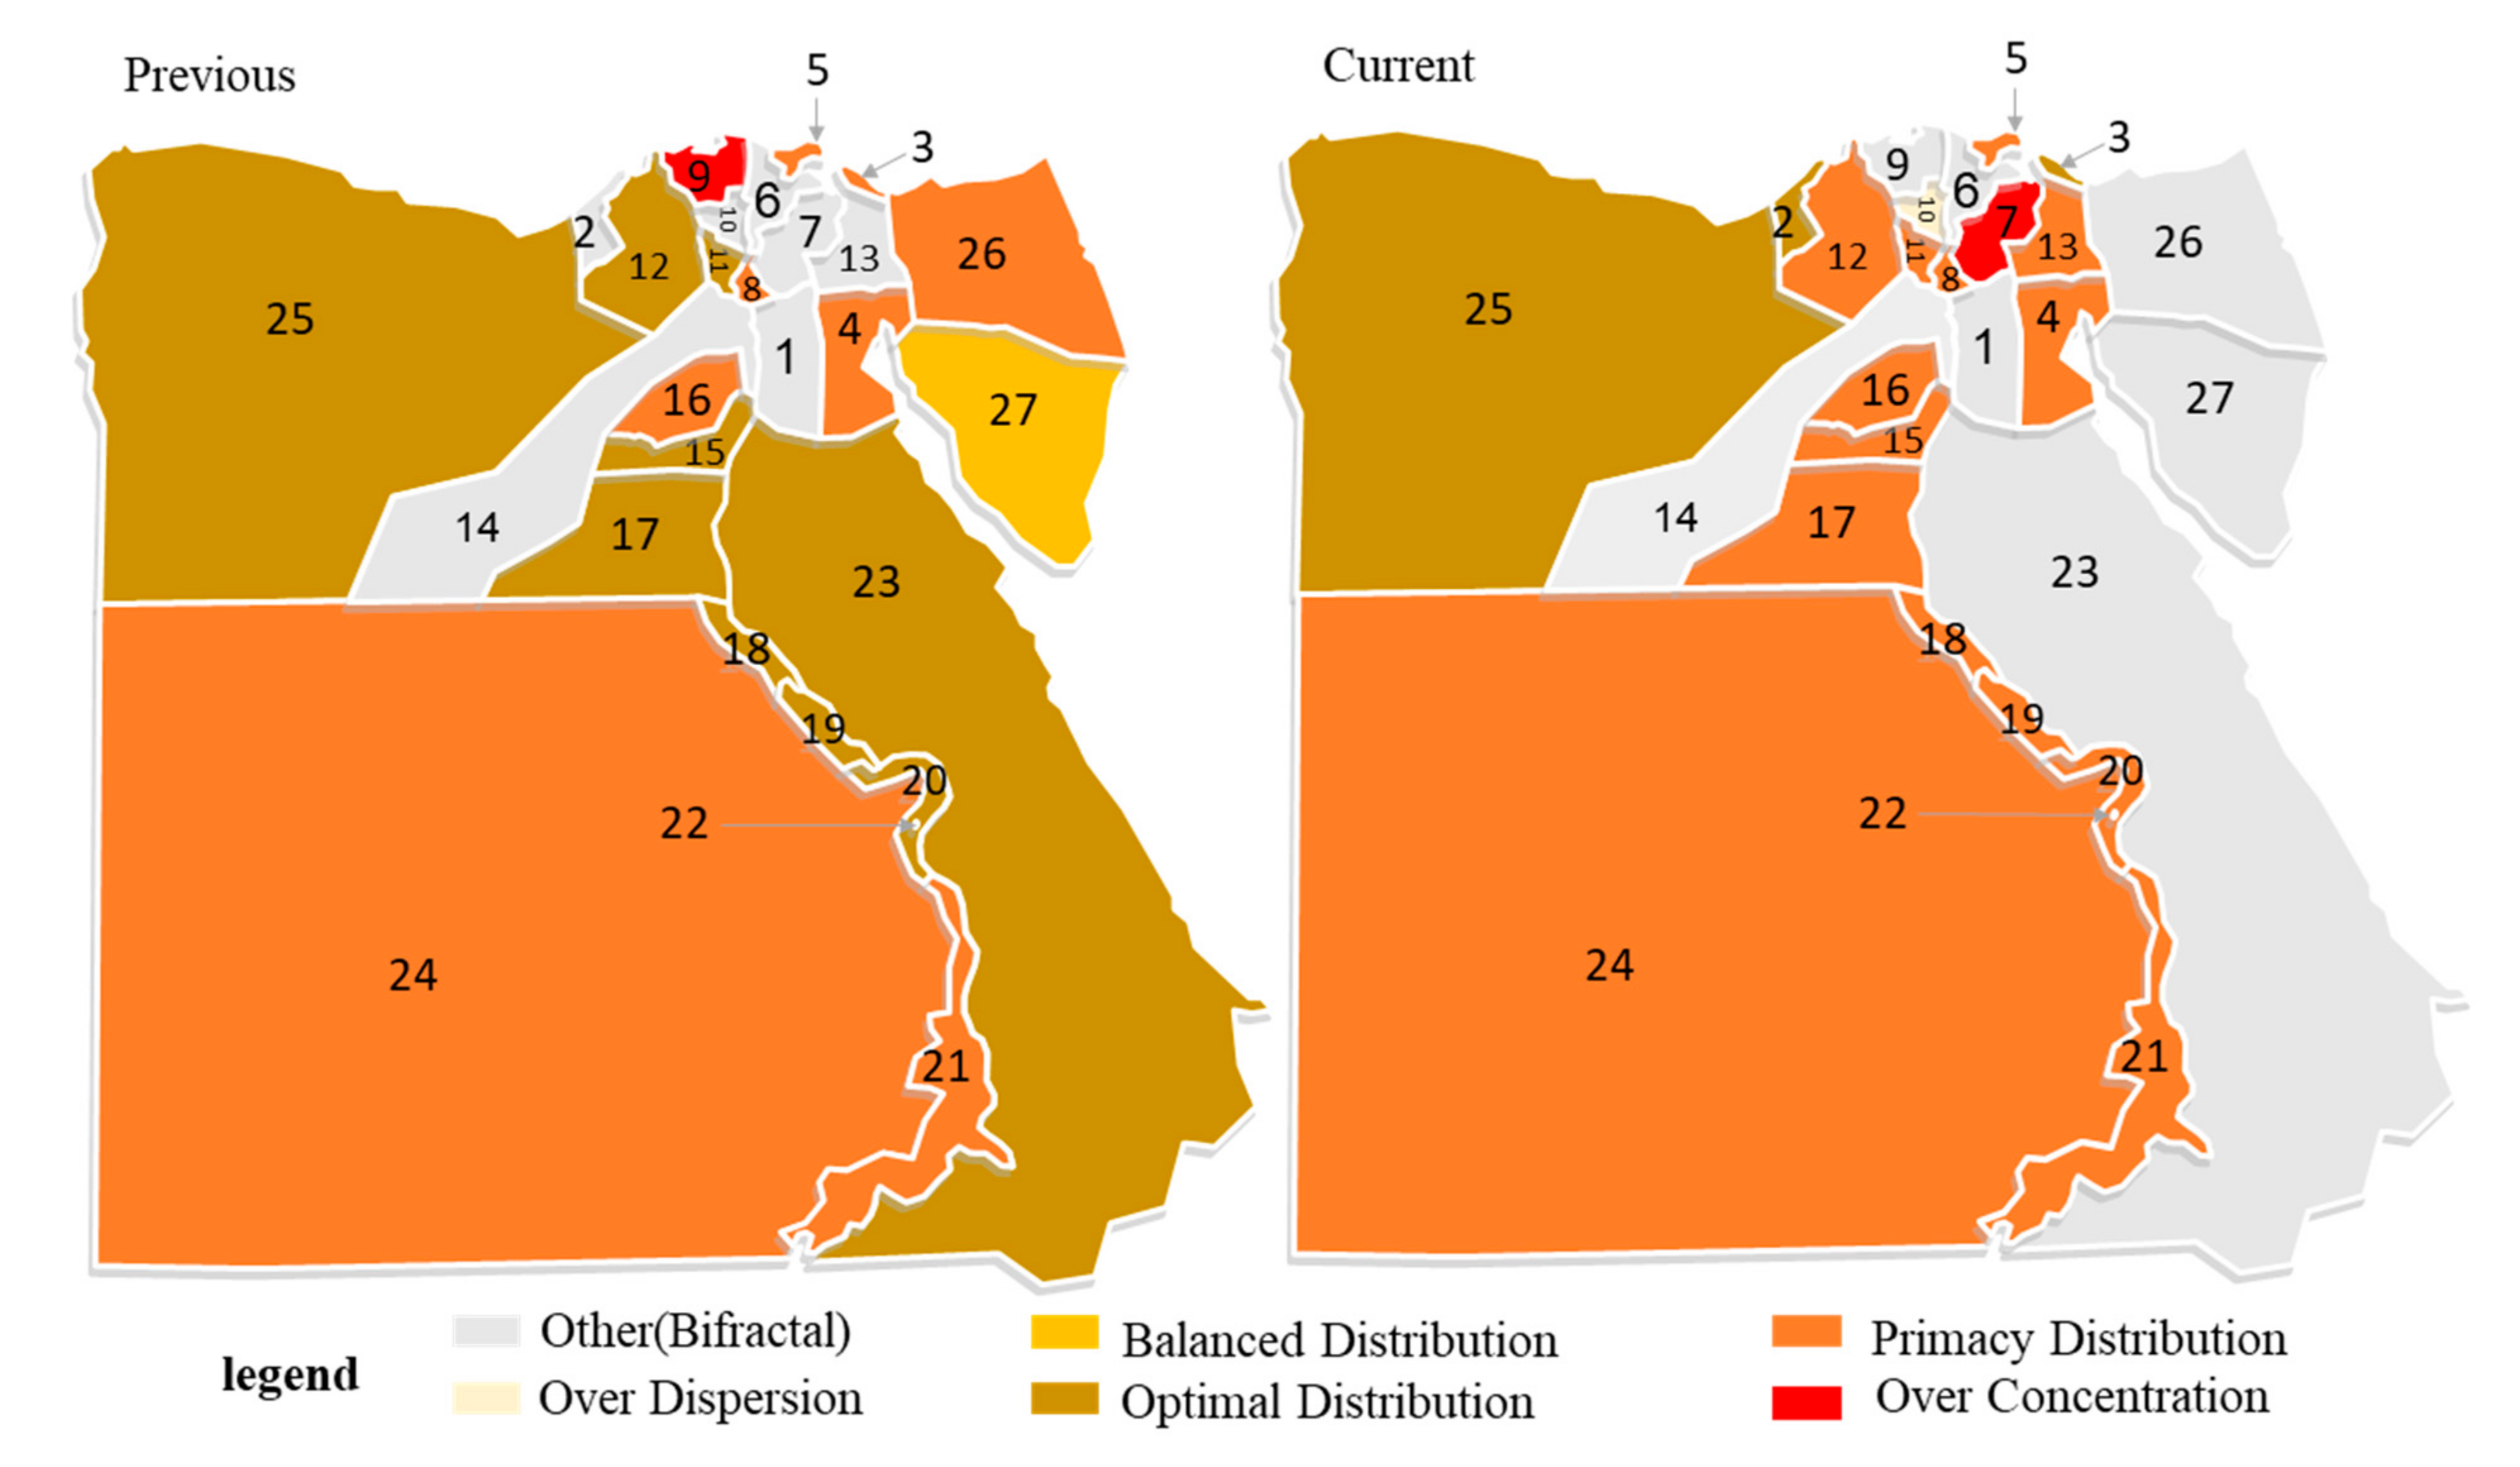
From the perspective of spatial pattern, there are 10 provinces in “optimal distribution” according to the linear fitting slope of the double logarithmic scatter plot of the migration population, concentrated in the west bank of the Red Sea in Southeast Egypt and the northwestern region; followed by 8 in “primacy distribution”, distributed in a scattered way; there are in “balanced distribution” and “over concentration”, and none in “over dispersion” (Figure 5). Port Said, Suez, Damietta, Kalyubia, Kafr El Sheikh, Menoufia, Behera, Beni-Suef, Fayoum, Menia, Asyout, Suhag, Qena, Aswan, Luxor, El Wadi El Gidid, Matrouh, and North Sinai, as well as the first scale-free area of Cairo, Alexandria, Gharbia, Ismailia, and Giza, are in the “normal” state. Balance power is the dominant driving force of spatial distribution. Red Sea, South Sinai, Dakahlia, andSharkia, as well as the second scale-free area of Cairo, Alexandria, Dakahlia, Sharkia, and Gharbia, are in the “Pareto” state, and decentralization power is the dominant driving force of spatial distribution. It should be noted that Kafr El Sheikh is in the “over concentration” state, and there is an urgent need to develop new policy guidance and optimize spatial distribution.
From the perspective of the composition and spatial distribution of the scale-free area, the provinces included in the scale-free area are closely related to the economic development level, and the scale-free area shows the characteristics of concentrated and contiguous distribution. Specifically, the monofractal extends southwards along the Nile River and the Suez Canal and stretching along Cairo-Alexandria urban corridor, with Cairo and its surrounding provinces as the source of development. The provinces with narrow scale-free areas including Port Said, Kalyubia, Matrouh, and North Sinai are spatially distributed like a “tadpole”, with Cairo as the head and the Nile River as the tail. For the scale-free areas of Suez, Kafr El Sheikh, Menoufia, Beni-Suef, Damietta, Qena, Aswan, Luxor, and El Wadi El Gidid on the east bank of the Nile River, and those of Sharkia, Menia, Asyout, and Suhag on the west bank, they are all concentrated and developed continuously. For the bifractal provinces, the spatial distribution of the first scale-free area and the second scale-free area is characterized by the core-periphery pattern, which expands in a ring shape around Cairo, Alexandria, Dakahlia, Sharkia, Gharbia, Ismailia, and Giza (Figure 6).
4.1.2. Economic Region Spatial Scale
According to the analysis in Figure A2, the spatial distribution of the migration population size at the spatial scale of economic region in Egypt barely conforms to Zipf’s law, but there are certain differences in the level of fractal development between economic regions. From the overall perspective, Egypt is in the quasi fractal state. The double logarithmic scatter plot of the total migration population shows linear characteristics, but the fractal is immature with goodness of fit pf R2 = 0.9145 < 0.95, but its linear fitting slope of 1.5745, indicating “primacy distribution”, and the spatial distribution show a strong tendency towards centralization.
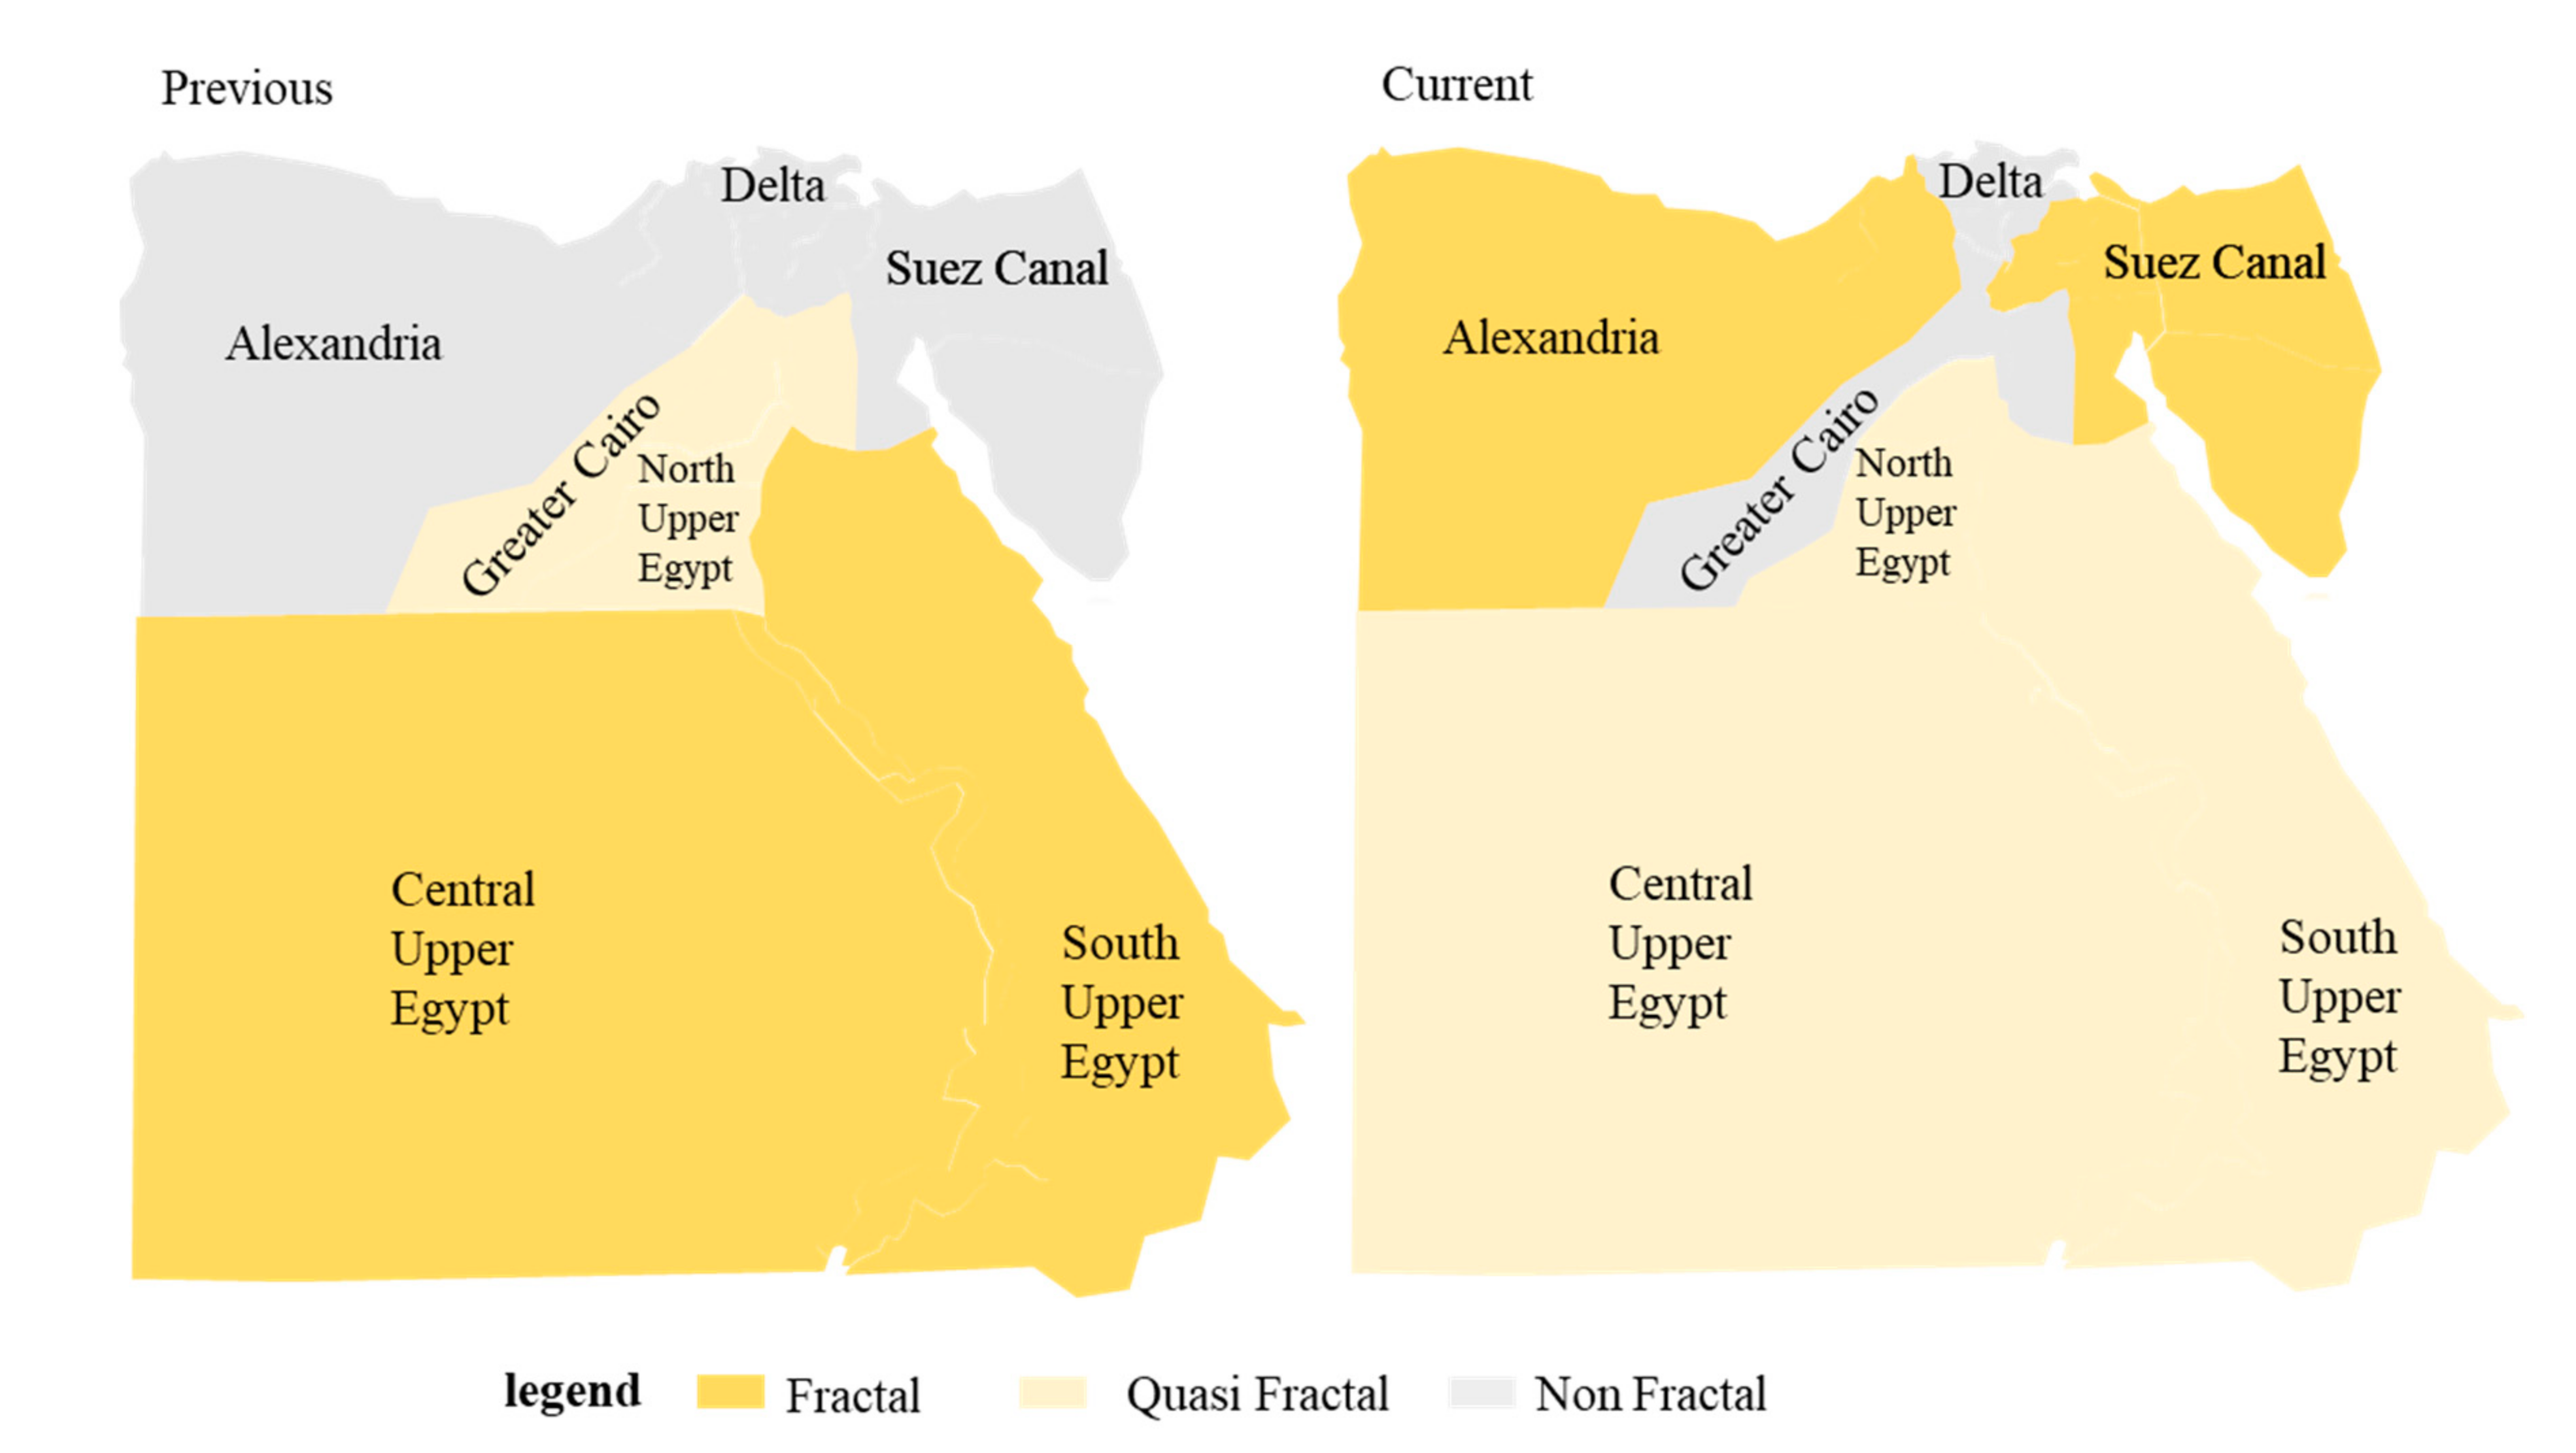
From the perspective of fractal types, Central Upper Egypt and South Upper Egypt are in fractal; Greater Cairo and North Upper Egypt are in quasi fractal; while Alexandria, Suez Canal, and Delta are in non-fractal. From the perspective of geographic spatial distribution, the pattern of fractal-quasi fractal-non-fractal is gradually distributed from south to north with characteristics of gradual gradient from north to south (Figure 7).
From the perspective of spatial pattern, Central Upper Egypt, South Upper Egypt, North Upper Egypt, and Greater Cairo are all in “optimal distribution”. However, Central Upper Egypt has a slope of less than 1 with a slight advantage in balance power. The other three have a slope of greater than 1, with a comparative advantage in decentralization power.
4.2. Immigration: Current Residence
4.2.1. Provincial Spatial Scale
According to the analysis in Figure A3, the spatial distribution of the migration population size at the spatial scale of province in Egypt generally conforms to Zipf’s law, but there are certain differences in the level of fractal development between provinces, where monofractal, bifractal, complete fractal, overall fractal, local fractal, and other forms are developed. From the overall perspective, the double logarithmic scatter plot of the total migration population in Egypt is segmented. The slope of the full-sample linear fitting is 1.3550, but the goodness of fit is only 0.7138 < 0.9, failing to pass the test. By identifying scale-free areas, the subjects are divided into two segments for linear fitting. The first scale-free area has a slope of 0.5807 with the goodness of fit up to 0.9844, satisfying the test requirements and showing that the spatial distribution of the community is getting decentralized in the “over dispersion” state; the second scale-free area has a slope of 8.43 with the goodness of fit up to 0.9743, satisfying the test requirements and showing the trend of centralization in the spatial distribution of the community. The spatial analysis in Figure 8 shows that the first and second scale-free areas are concentrated and contiguous in geographic space, forming a core-periphery spatial structure along the Nile River in a highly concentrated spatial pattern.
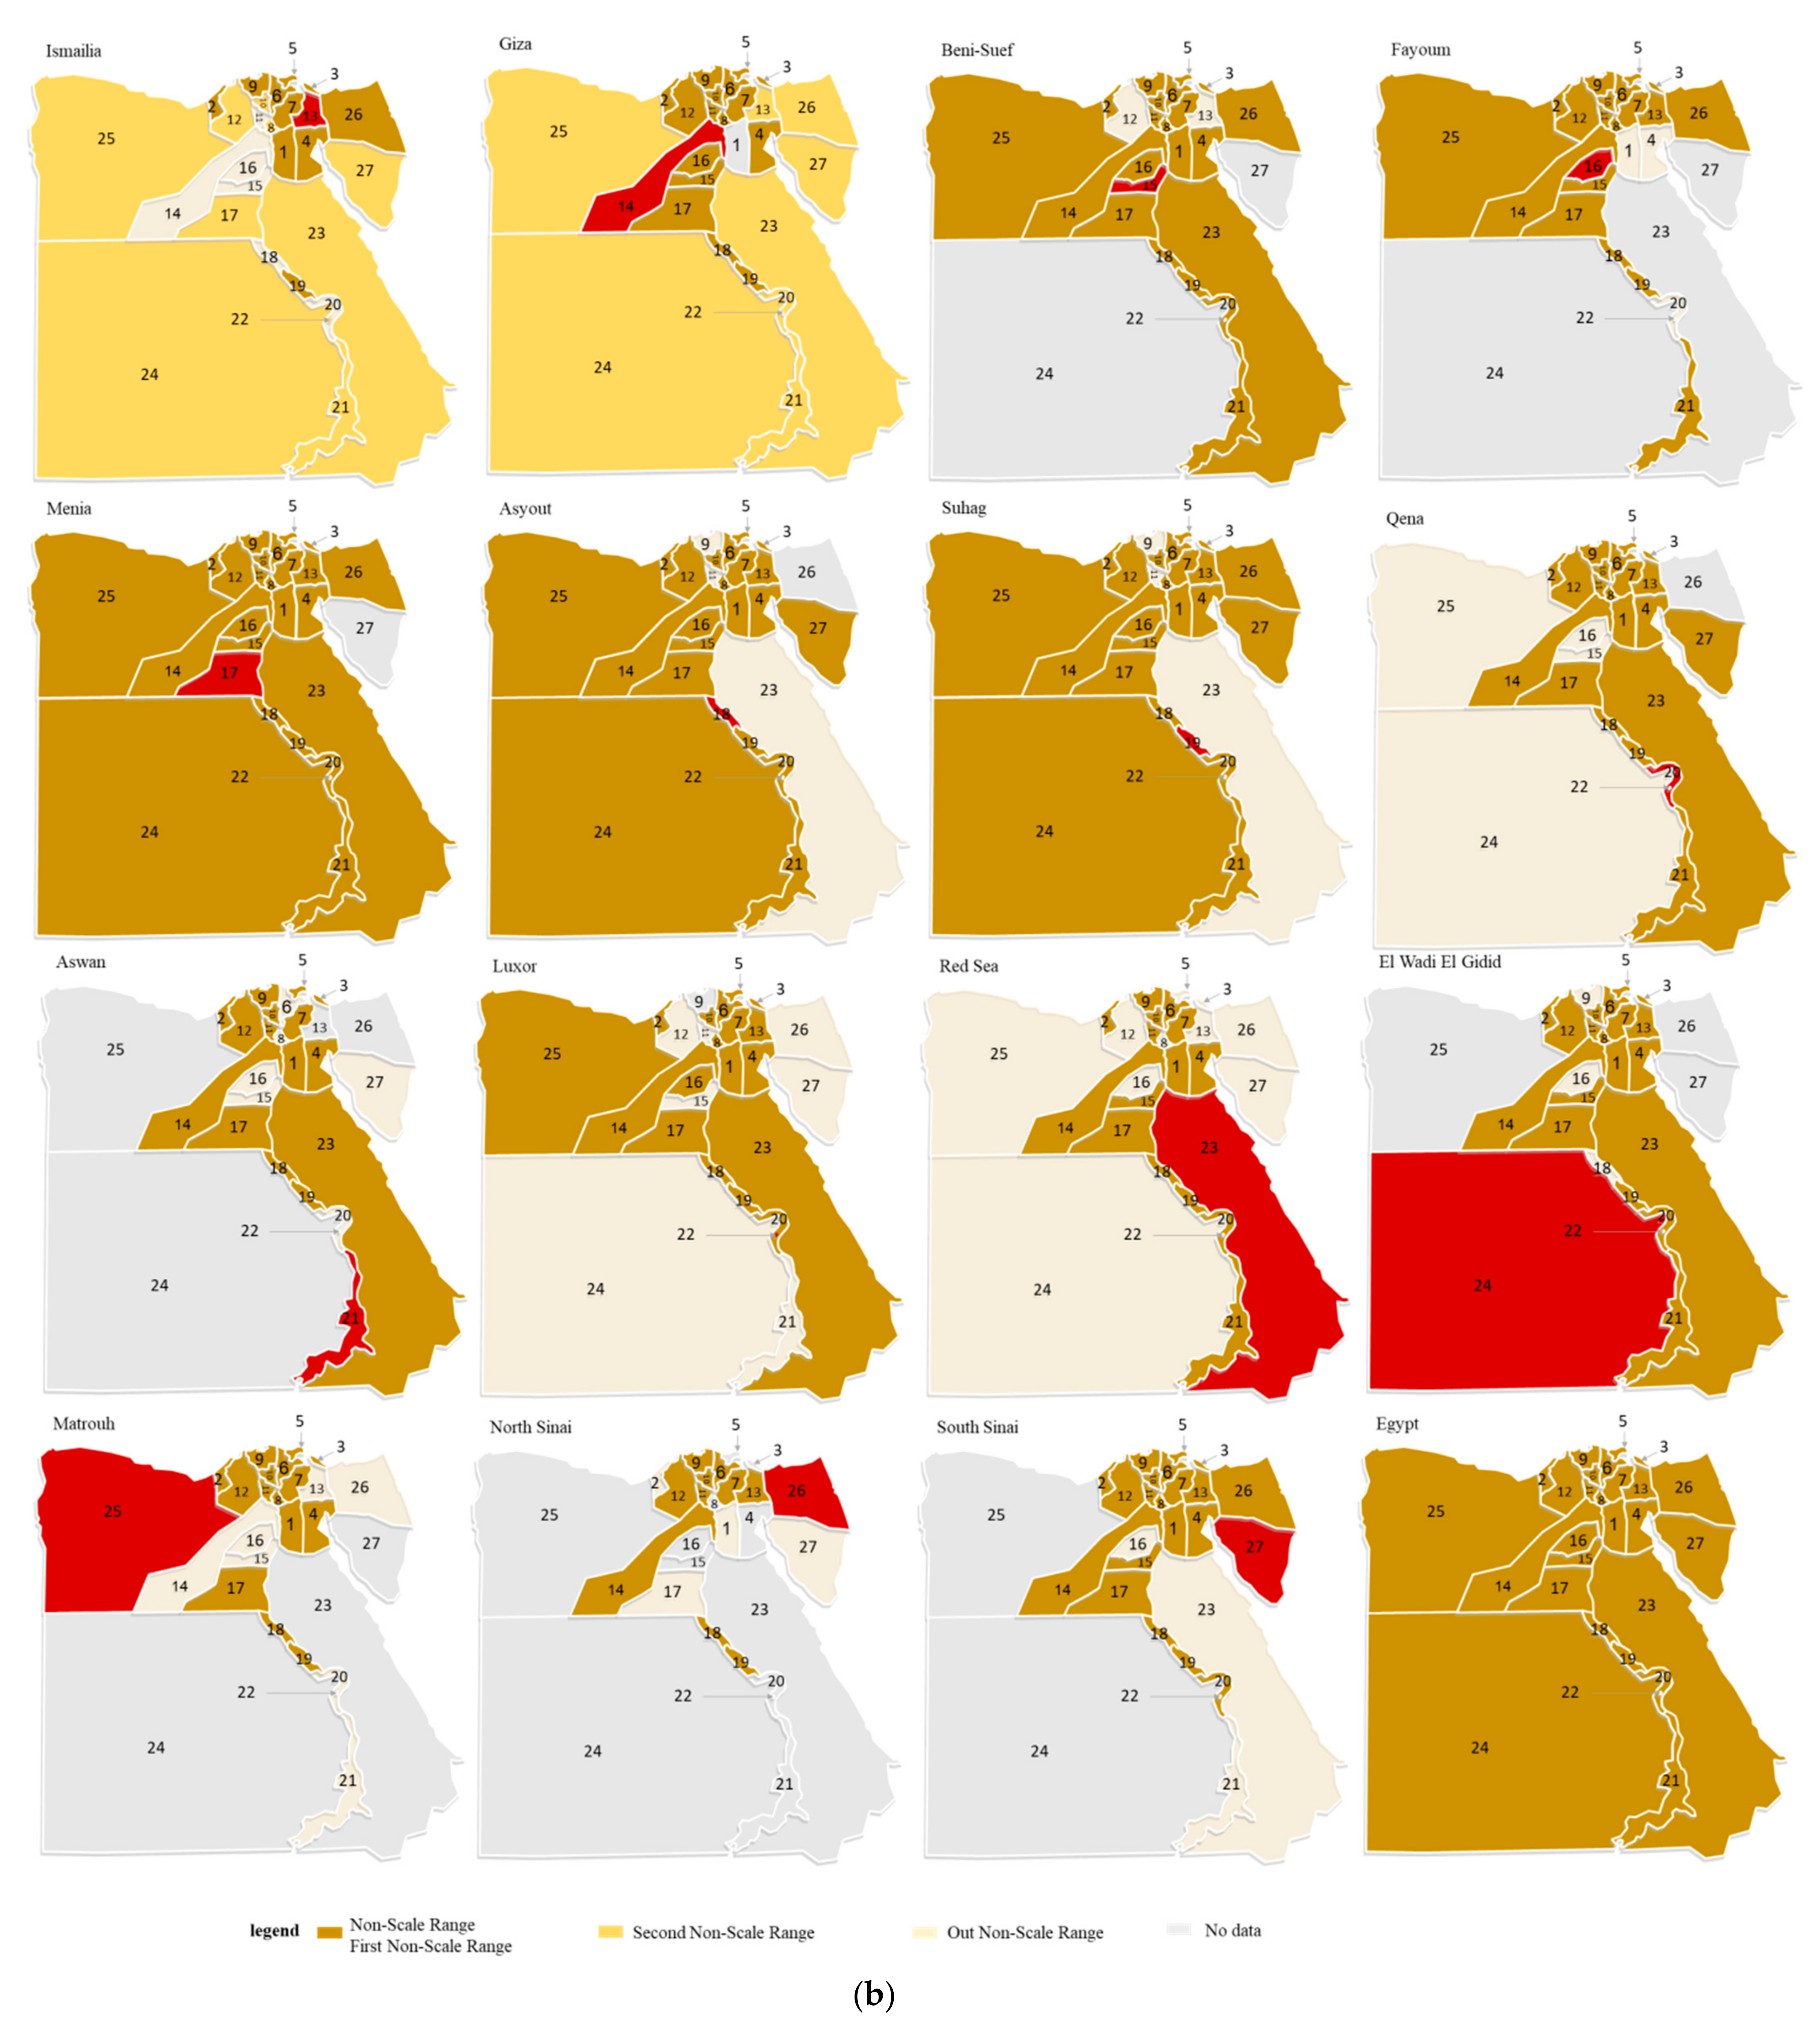
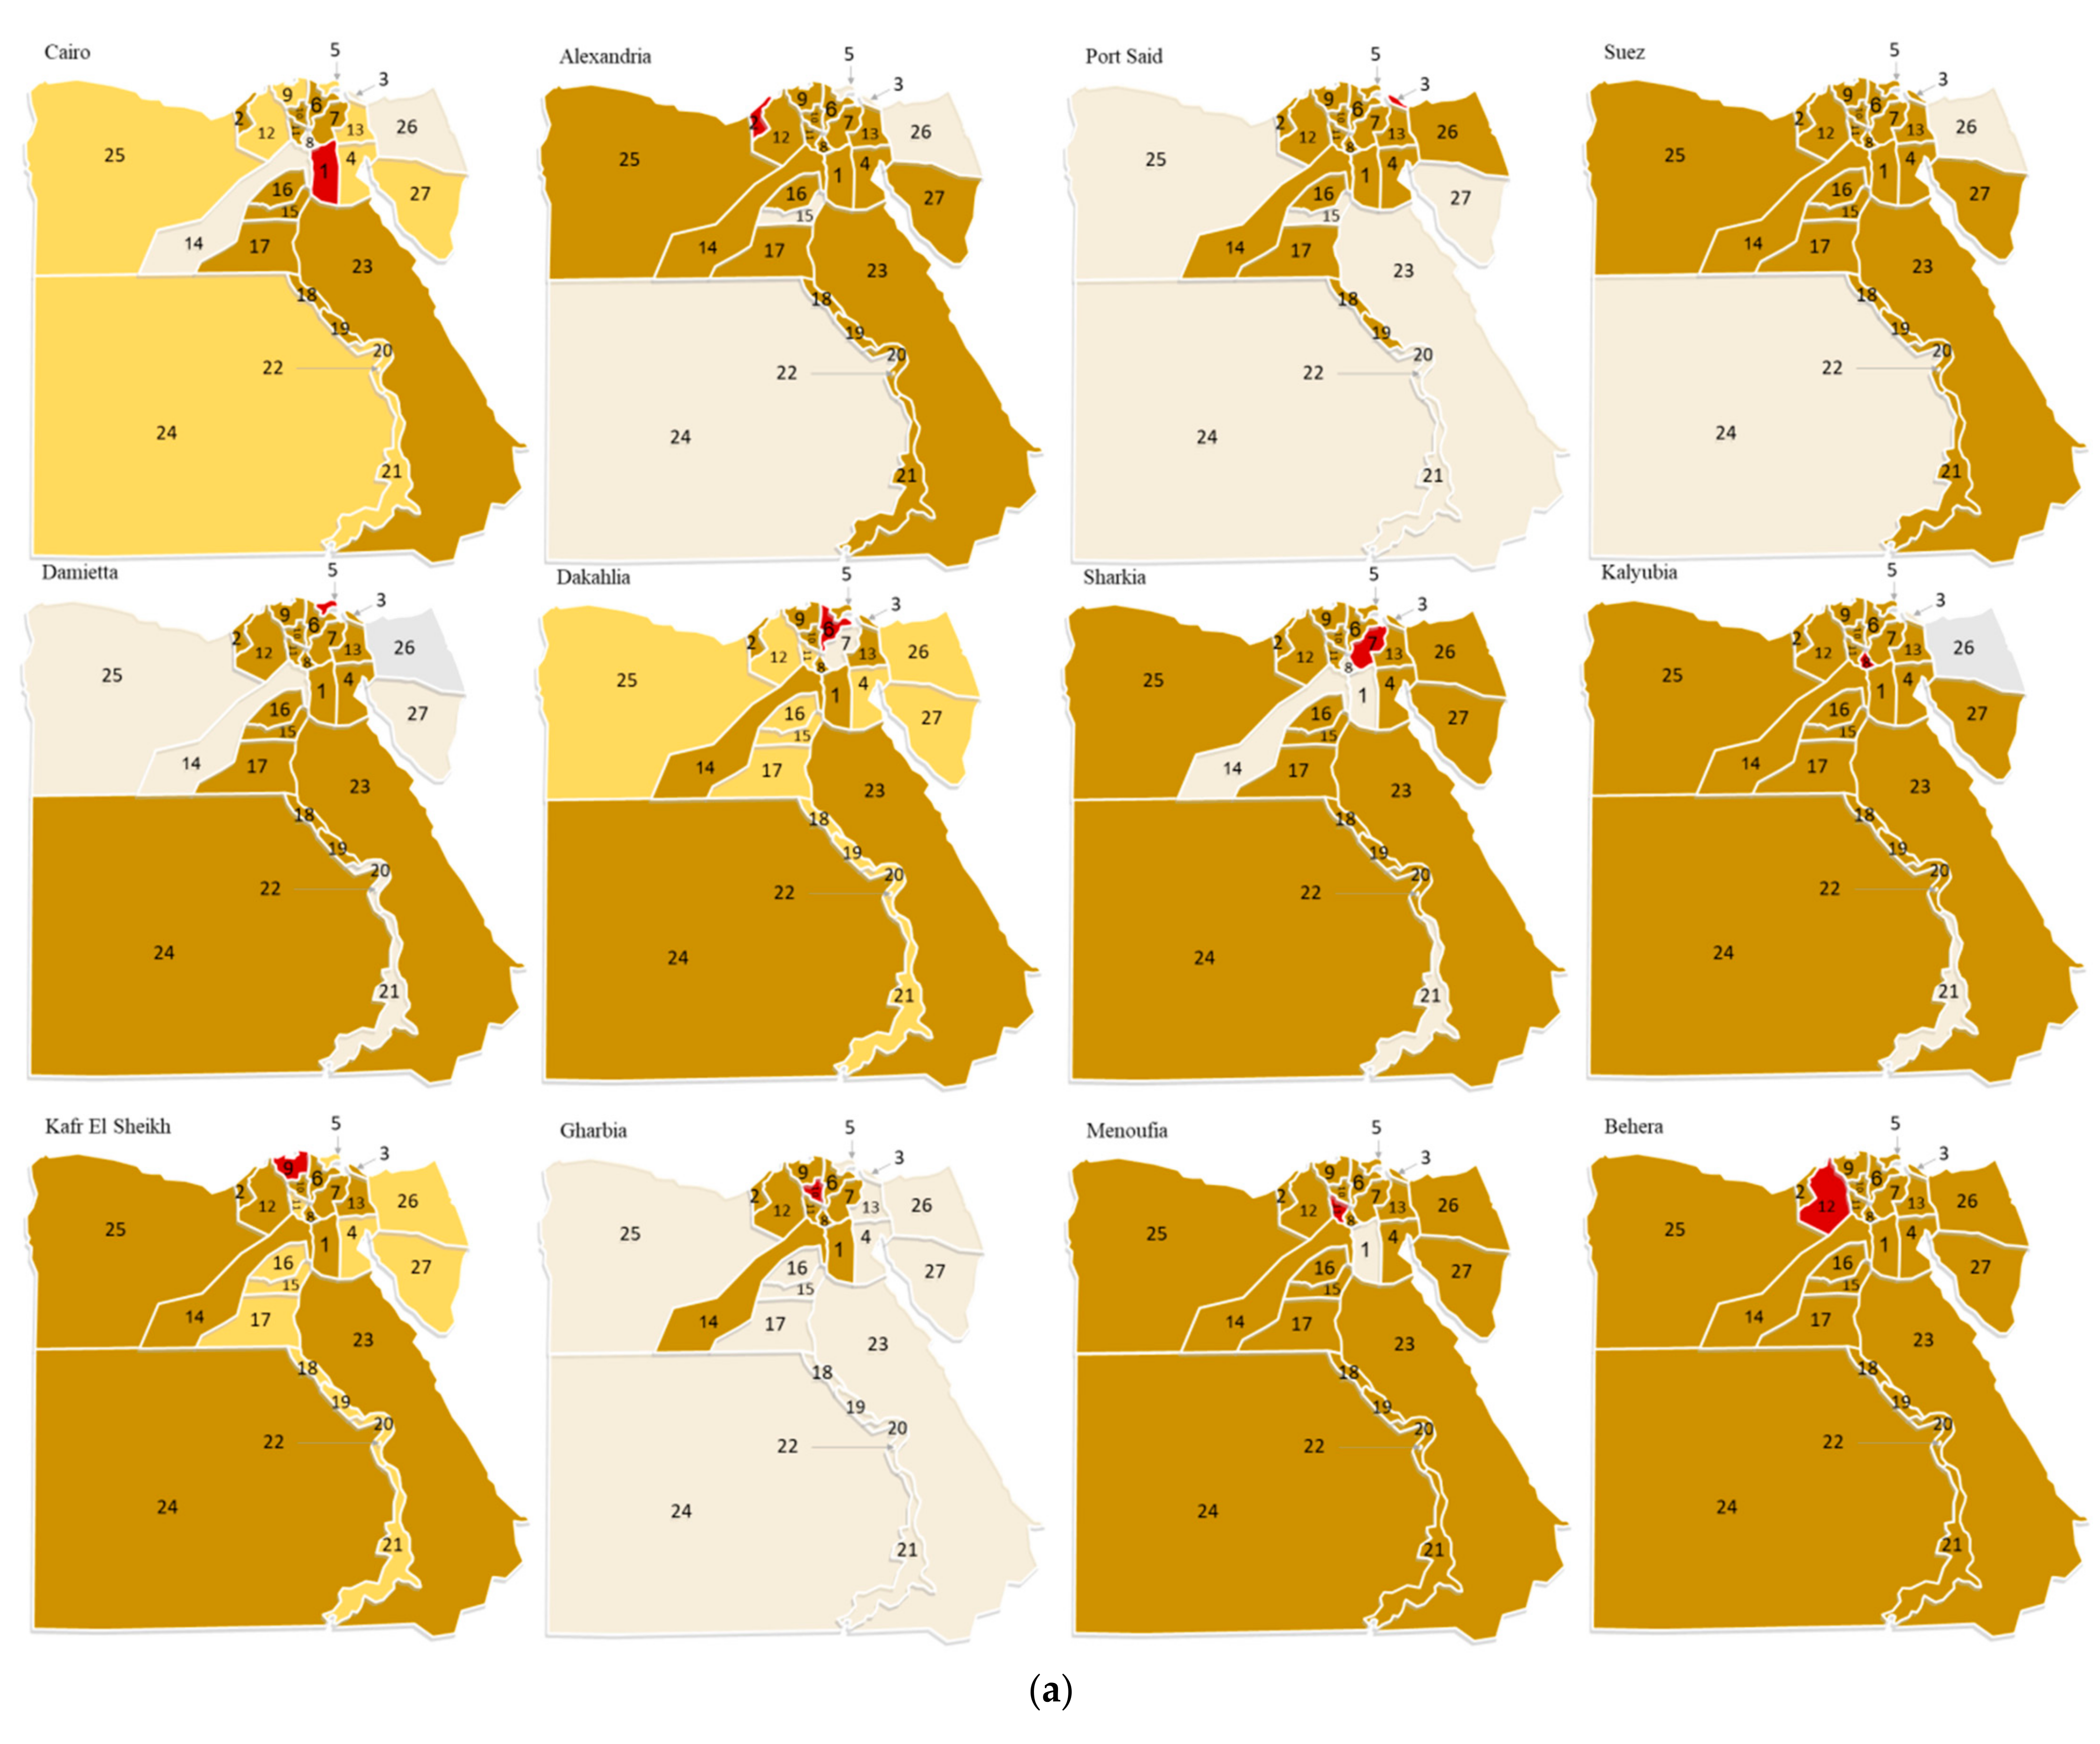
From the perspective of fractal types, Asyout is in complete monofractal and has matured according to the double logarithmic scatter plot of the migration population and the goodness of fit index. Alexandria, Suez, Damietta, Sharkia, Kalyubia, Menoufia, Behera, Ismailia, Beni-Suef, Fayoum, Menia, Suhag, Qena, Aswan, Luxor, El Wadi El Gidid, Matrouh, and Port Said are in overall monofractal, and they are not yet mature, with room for improvement; Gharbia is in local monofractal, and it is very immature as a key area for spatial governance and planning guidance; Giza failed to pass the test of R2 > 0.95 and it is in overall quasi monofractal; Cairo, Dakahlia, Kafr El Sheikh, Red Sea, South Sinai, and North Sinai are in bifractal, with two communities developed, and they all passed the test of R2 > 0.95; there is no quasi bifractal. From the perspective of spatial projection analysis, bifractals are concentrated in the southeast of the Nile and the Suez Canal, not too correlative with the level of economic development (Figure 4).
From the perspective of spatial pattern, 15 provinces are in “primacy distribution” according to the linear fitting slope value of the double logarithmic scatter plot of the migration population, concentrated along the Nile River, the Suez Canal, and the Cairo-Alexandria urban corridor; 3 are in “optimal distribution”, located in Northwest Egypt; Sharkia is in “over concentration”; while Gharbia and Giza are in “over dispersion”. It is urgent to formulate new policies to guide and optimize spatial distribution. There is no province in “balanced distribution” (Figure 5). Sharkia, Kalyubia, Gharbia, and Giza, as well as the first scale-free area of Cairo, Dakahlia, Kafr El Sheikh, Red Sea, and South Sinai, are in the “normal” state, and balance power is the dominant driving force of spatial distribution; Alexandria, Port Said, Suez, Menoufia, Behera, Ismailia, Beni-Suef, Fayoum, Menia, Asyout, Suhag, Qena, Aswan, Luxor, El Wadi El Gidid, Matrouh, and North Sinai, as well as the second scale-free area of Cairo, Dakahlia, Kafr El Sheikh, Red Sea, and South Sinai, are in the “Pareto” state, and decentralization power is the dominant driving force of spatial distribution.
From the perspective of member composition and spatial distribution, scale-free areas are extensive, and characterized by centralized and contiguous distribution. They extend southwards along the Nile River and Suez Canal and stretching east-west along the Cairo–Alexandria urban corridor, with Cairo and its surrounding provinces as the source of development. Specifically, for Port Said and Gharbia in local monofractal, the scale-free areas are highly concentrated in Cairo and its surrounding regions, not extending outward along the Nile. The scale-free areas of Alexandria, Suez, and Fayoum in overall monofractal are concentrated and contiguous along the coast and the river. The scale-free areas of Damietta, Ismailia, and Qena are not included in the northeast and northwest regions of Egypt, while Sharkia, Kalyubia, Menoufia, Behera, Beni-Suef, Menia, Asyout, Suhag, Aswan, and Luxor are almost fully covered. The first scale-free area of Cairo is symmetrical in its north and south, and the second scale-free area is symmetrical on its left and right. The scale-free areas are generally “fan-shaped” in spatial distribution. The first scale-free area of Dakahlia is scattered, and the second is concentrated in the north of Cairo and extends south along the Nile Oasis. The second scale-free area of Kafr El Sheikh is concentrated in the Oasis Province along the Nile River and at both ends and on the east of the Suez Canal. The rest of the provinces are completely covered by the first scale-free area. Both the first and the second scale-free areas of the Red Sea are scattered. The first scale-free area of North Sinai is concentrated in Cairo and its surrounding regions, while most of the members of the second scale-free area are concentrated on the east bank of the Nile in southern Egypt. The first scale-free area of South Sinai is concentrated in southern and northern Cairo, while the members of the second scale-free area are scattered.
4.2.2. Economic Region Spatial Scale
According to the analysis in Figure A4, the spatial distribution of the migration population size at the spatial scale of economic region in Egypt barely conforms to Zipf’s law, but there are certain differences in the level of fractal development between economic regions. From the overall perspective, Egypt is in the quasi fractal state. The double logarithmic scatter plot of the total migration population shows linear characteristics, but the fractal is immature with goodness of fit R2 = 0.9241 < 0.95, but its linear fitting slope is 1.1587, indicating “primacy distribution”, and the spatial distribution shows a certain tendency towards agglomeration.
From the perspective of fractal types, Alexandria and Suez Canal are in fractal; Central Upper Egypt, South Upper Egypt, and North Upper Egypt are in quasi-fractal; and no fractals appear in Greater Cairo and Delta. From the perspective of geographical spatial distribution, bifractals are on the east and west, and quasi fractals are in the south of Egypt. Cairo and well-developed regions in its north are in non-fractal, characterized by gradient distribution from east to west (Figure 7).
From the perspective of spatial pattern, Alexandria, Suez Canal, North Upper Egypt, and South Upper Egypt are all in “primacy distribution”, with a slope greater than 1.5, and there is a strong power of centralization; Central Upper Egypt is in “optimal distribution” with a slope of 1.2711, and has a comparative advantage in decentralization power.
4.3. Migration: Total and Net Quantity
4.3.1. Provincial Spatial Scale
According to the analysis in Figure A5, the spatial distributions of the total and net migration populations in Egypt conform to Zipf’s law on the provincial spatial scale, and both are in overall monofractal. From the perspective of the total migration population, the fitting slope is 0.9900, indicating “optimal distribution”, and the spatial distribution shows a slight tendency towards decentralization; from the perspective of net migration population, the fitting slope is 1.4452, indicating “primacy distribution”, and the spatial distribution shows a strong tendency towards agglomeration.
4.3.2. Economic Region Spatial Scale
According to the analysis in Figure A5, the spatial distribution of the migration population size at the spatial scale of economic region barely conforms to Zipf’s law. The two are still immature in fractal development with goodness of fit R2 ≈ 0.92 < 0.95, both in quasi monofractal. From the perspective of the total migration population, the fitting slope is 1.3341, indicating “optimal distribution”; from the perspective of net migration population, the fitting slope is 1.5745, indicating “primacy distribution”, and the spatial distribution shows a strong tendency towards agglomeration.
4.4. Comparative Analysis between Previous and Current Residence
4.4.1. Provincial Spatial Scale
According to the analysis in Figure 4, provinces with the same fractal pattern account for about 63%, including Cairo and Dakahlia in bifractal and Port Said, Suez, Damietta, Kalyubia, Menoufia, Behera, Beni-Suef, Fayoum, Menia, Asyout, Suhag, Aswan, Luxor, ElWadi, ElGidid, and Matrouh in monofractal, indicating that they are basically developing in synchronization. Alexandria and Sharkia are in bifractal from the previous perspective, but in monofractal from the current perspective. Kafr El Sheikh, Gharbia and Red Sea are in single bifractal from the previous perspective, but in bifractal from the current perspective. Ismailia is in quasi bifractal from the previous perspective, but in monofractal from the current perspective. Giza is in quasi bifractal from the previous perspective, but in quasi monofractal from the current perspective. Qena is in quasi monofractal from the previous perspective, but in monofractal from the current perspective. North Sinai and South Sinai are in quasi monofractal from the previous perspective, but in bifractal from the current perspective. The two different perspectives reflect that the factors that affect their population immigration and emigration may vary, thus the spatial fractal development of size structure is not synchronous. Port Said, ElWadi ElGidid, Matrouh, Damietta, Kalyubia, and Fayoum have a larger slope from the previous perspective than from the current perspective, with a stronger tendency towards centralization, but Menoufia, Behera, Beni-Suef, Suez, Menia, Asyout, Suhag, Aswan, and Luxor are just the opposite.
4.4.2. Economic Region Spatial Scale
According to the analysis in Figure 7, Delta and North Upper Egypt are in different fractal patterns, as the former is in non-fractal, while the latter is in quasi fractal, indicating that they are basically developing in synchronization. Alexandria and Suez are in non-bifractal from the previous perspective, but in fractal from the current perspective. Central Upper Egypt and South Upper Egypt are in fractal from the previous perspective, but in quasi fractal from the current perspective. Greater Cairo is in quasi fractal from the previous perspective, but in non-fractal from the current perspective. Different fractal patterns in two perspectives reflect that the factors that affect their population immigration and emigration may vary, thus the spatial fractal development of size structure is not synchronous. The slope of all economic regions from the current perspective is larger than from the previous perspective, with a stronger tendency towards centralization.
5. Discussion
5.1. Geographical Data of Migration Population Has Fractal Characteristics
The rank-size distribution of population immigration and emigration in Egypt complies with the power function law, and the spatial distribution of the migration population size meets the Zipf’s law on the whole. The double logarithmic scatter plots of total migration, net migration, population immigration, and emigration of Egypt all show “linear” characteristics, and most of them pass the test of Zipf’s law. However, there are some differences in the fractal development level in different provinces, giving rise to a variety of forms including complete monofractal, overall monofractal, local monofractal, bifractal, quasi monofractal, and quasi bifractal. In the data of Central Agency for Public Mobilization and Statistics, classified statistics were conducted for the relocation reasons of 1% of the migrants, including work, study, marriage, divorce and widowhood, companion, and others. Marriage is the top reason for migration, accounting for 32.66%; work and companion are about equal, accounting for about 26%; the proportion of study is close to that of others, accounting for more than 6.6%; while divorce and widowhood account for the lowest percentage, only 1.13% [55].
The reasons of population migration in Egypt are generally complex, with great differences among provinces. Population migration is affected by social factors such as marriage, companion, study, and divorce and widowhood, besides economic factors such as work, income, and wealth inequality [54]. It is also in connection with natural factors such as water resources and environmental carrying capacity [52]. Driven by these factors, the migration population in Egypt has formed a unique fractal pattern with the differences mentioned above. Limited by the length and theme of this paper, we will analyze the influencing factors and driving mechanism in the following works, which will be the focus of future research.
According to the mathematical statistical analysis of the migration population in Egypt and the spatial analysis results of its geographic projection, as well as the economic, social, and urban–rural development level in the country, the spatial distribution of Egypt’s migration population size, under certain conditions of time and space, shows the development law of “local single fractal development → overall monofractal/complete monofractal evolution → bifractal/local monofractal degradation”. That is, the spatial distribution of the migration population size takes the lead in showing the law of “local monofractal” in some areas, followed by gradual spatial stretch and expansion of the scale-free area, and the fractal pattern evolves to the overall monofractal and the complete monofractal, while leading to gradual spatial differentiation and contraction of the scale-free area under the combined action of many factors, with the fractal pattern degenerating into bifractal or even partial monofractal.
The fractal pattern and the spatial pattern of population immigration and emigration generally have a tendency for homogeneity, showing that the development of the two is synchronized; but the geographic projections of fractal patterns are significantly different in geographical distribution characteristics, reflecting that the development of spatial distribution law is asynchronous. More than 60% of the subjects share the same fractal pattern in population immigration and emigration, indicating that they’re basically developing in synchronization. From the perspective of previous–current, there are many combinations of fractal patterns, such as bifractal–monofractal, monofractal–bifractal, quasi bifractal–monofractal, quasi bifractal–quasi monofractal, quasi monofractal–monofractal, and quasi monofractal–bifractal, reflecting that the factors that affect their population immigration and emigration may vary, thus the spatial fractal development of size structure is not synchronous.
The slope of the rank-size rule-based double logarithm curve with linear fitting shows the law of the spatial distribution of the migration population flow size, and the linear fitting slope of most subjects is greater than 1, indicating that the spatial distribution of the size of migration-population flow is generally in the state of “Pareto”, and the decentralization power acts as a primary factor driving the spatial distribution. The linear fitting slope of 90% of the provinces and 85% of the economic regions in the monofractal perspective, and all the second scale-free areas in the bifractal perspective are greater than 1, indicating that the spatial distribution of the migration population flow shows a tendency towards centralization on the whole, and it is in the “Pareto” pattern in general, with a greater deviation in spatial distribution, prominent high-rank spatial units, fewer middle-rank nodes, and concentrated power greater than decentralized power. The linear fitting slope of more than 80% of the first scale-free area is less than 1 from the perspective of bifractal, indicating that the spatial distribution of the migration population flow size is in the “normal” state, and the decentralized power determines the regional pattern of population flow in high-rank spatial units. It is worth noting that population emigration and immigration of Kafr El Sheikh are in the “over concentration” state, the population emigration of Gharbia and Giza immigration is in “over dispersion” state, and the migration space is excessively centralized or decentralized, which desperately requires the formulation of reasonable policies to guide and optimize the spatial distribution pattern of population flow.
There are similarities as well as differences when compared with the research results of Qi Wei [42] and Wang Xuming [43]. According to the census data in 1990, 2000, and 2010, Qi Wei found that the rank-size distribution of China’s urban migration population also conformed to typical power function rule (with the goodness of fit over 0.98), showing a high-rank oriented aggregation feature. gradually increasing from 0.81 to 1.03 indicates that China’s high position ordered cities have outstanding advantages in absorbing migration population. The agglomeration power was stronger than dispersive power, leading to the continuous enhancement of such polarization characteristics. Qi Wei also found that the urban migration population in China was mainly in monofractal. Although fractal gradually degraded in its degree, there was no bifractal or monofractal, different from the case in Egypt. Wang Xuming found that the distribution of population migration size or relative migration intensity in China were dominated by a shifted power-law relation. His calculations indicate that the distribution of the relative migration intensity is governed by a shifted power-law relation, and that the distribution of migration distances is dominated by a truncated power-law relation.
Overall, the migration populations in China and Egypt are concentrated to high-rank spatial units, which is in line with Zipf’s law. With the improvement of development level, they are all undergoing fractal degradation, for example, developed regions such as Cairo and Alexandria are mostly in bifractal. The difference is that there are more monofractal cases in China and more bifractal, quasi fractal, and even non-fractal in Egypt. These phenomena may be the result of the deserts and the imbalance [52] of economic development between provinces in Egypt, and its specific mechanism still needs further study.
5.2. Distance Is the Key Factor in Determining Geographic Fractal
The scope and expansion of the scale-free area mirror the development degree and direction of the spatial distribution of the population flow size. With the help of the spatial analysis of the expansion, contraction, and differentiation of the members of the scale-free area, it is possible to grasp the essence of the law of the spatial distribution of the migration population flow size, and to explore the spatial characteristics of the immigration and emigration region selection. Characterized by significant spatial gathering, the scale-free areas are concentrated and geographically distributed in centralized contiguous regions. The monofractal develops from Cairo and its surrounding regions, and expands and differentiates along the Nile River, Suez Canal, and Cairo–Alexandria urban corridor; the scale-free area of bifractal develops into two independent regional communities, and community members are geographically “clustered”.
Population migration can be regarded as a combination of space cognition and decision making in essence. The “anchor point theory” proposed by Australian geographer Reginald Golledge provides a good theoretical framework for the study on spatial decision-making of population migration. According to Reginald Golledge, people always have knowledge of surrounding nodes after they have known one, followed by starting from a new one to know other nodes around it [93]. In the decision-making of population migration destination, two types of highly recognized provinces or economic regions will be given priority: the first is their own breeding place and its surrounding nodes, with high perception and regional identity; the second is star regions at the national level, namely high-level nodes, including regional centers with a high level of economic development and rich historical and cultural accumulation, as well as national capitals. The first law of geography states that the scale of population migration is inversely proportional to distance [94], and the highly agglomerated distribution of concentrated and contiguous scale-free areas reflects that geographical distance is still an important factor or proxy variable that affects population migration and its fractal characteristics.
5.3. Use of a Power-Law to Fit a Distribution May Not Always Be Suitable
The spatial distribution of migration population size generally complies with Zipf’s law on the two spatial scales of province and economic region, and the former has a higher level of development than the latter. On the spatial scale of province, most of the subjects have passed the goodness of fit test, and a few failing the test have also achieved quasi fractal. On the spatial scale of economic region, all the rank-size rule-based double logarithmic scatter plots of the migration population flow size in the economic regions show “linear” characteristics. Although most of the subjects failed to pass the goodness of fit test, their lowest value of goodness of fit is over 0.75, indicating that there is a fractal trend, except that its development is not yet mature.
These results suggest that the use of a power-law to fit a distribution may not always be suitable. Although Zipf’s law provides a new method of research on migration population, and the essentials of the population migrations may be captured by this modeling, it also has a certain scope of application and cannot be applied to all occasions. At the economic region, the fractal level of the spatial distribution of the Egyptian migration population is not high, and lacking sufficient research scope may be a key obstacle [47]. It is possible for a small number of analysis units that the empirical distribution will closely follow a power law, which reflects the fact that it is genuinely harder to rule out the power law if we have very little data. For this reason, high R2-values should be treated with caution when the number of analysis units is small.
As Clauset [90] and Chen Yanguang [88] said, in the fractal of the provincial migration population, the “heavy tail” is also an influencing factor that cannot be ignored. What is more, some provinces have degenerated from power law distribution to exponential distribution. In general, we find that it is extremely difficult to tell the difference between the power law and exponential distribution behavior. The specific problem of the indistinguishability of power laws and exponentials has also been discussed by Malevergne, Pisarenko, and Sornette [95]. Indeed, over realistic ranges of migrants value, the two distributions are very close, so it appears unlikely that any test would be able to tell them apart unless we had an extremely large data set. Therefore, accurate identification still requires more data to carry out empirical research, which is the direction of our efforts in the future.
6. Conclusions
Based on the classical theory of rank-size distribution and its parameter significance, this paper explores the spatial distribution law of migration and floating population size in drylands and deserts, and conducts empirical research on Egypt as an example. The main conclusions reached are as follows: (1) the spatial distribution of migration-population flow in Egypt is in accordance with the law of power function on the whole on the two spatial scales of province and economic region within two dimensions of immigration and emigration. (2) The fractal development presents asynchronous characteristics in the same dimension, shaping a variety of forms including perfectly monofractal, overall monofractal, local monofractal, bifractals, quasi monofractal, and quasi bifractals, and showing a development law of “local monofractal development → overall monofractal/perfectly monofractal evolution → bifractals/local monofractal degradation”. (3) The slope of the rank-size rule-based double logarithm curve with linear fitting is generally greater than 1, indicating that the spatial distribution of the size of migration-population flow is generally in the state of “Pareto”, and the decentralization power acts as a primary factor driving the spatial distribution. (4) The geographic projections of the members in the scale-free zone stretch along the Nile River and the Suez Canal, and the members of the same community are concentrated and contiguous with significant spatial agglomeration and gradient, forming a characteristic of ring-shaped distribution from “core to periphery” and axial gradient distribution from “east to west and south to north”. (5) The fractal development of the provincial scale is at a much higher level than that of the economic region. The fractal model of the migration population flow size under the dimensions of immigration and emigration shows a tendency of homogeneity on the provincial scale only. There are more than 60% of provinces with synchronous fractal development.
It is worth noting that the spatial distribution of the migration population in some provinces of Egypt is malformed, so it is necessary to accelerate the formulation of population development policies and spatial governance planning for economically developed and densely populated provinces to guide the spatial distribution of new migration population in an orderly manner. For example, the slope values of Kafr El Sheikh, Fayoum, and El Wadi El Gidid from the perspective of emigration, and those of Sharkia, Aswan, Beni-Suef, and Luxor from the perspective of immigration, are all too large, while the slopes of Gharbia and Giza from the immigration perspective are too small, indicating the spatial distribution of the migration population in these provinces is unreasonable, and it is required to establish policies or take actions for improvement in time. Besides the inter provincial economic differences, we should also take into account the pressure of the existing population size and the carrying capacity of desert environment for the regulation of migration population, so as to make differentiated population diversion and drainage policies. For example, Cairo, Alexandria, Luxor, and other provinces should give priority to solving the problem of population stock, with the focus on population dispersion. On the contrary, provinces like Giza and Kalyubia should take reasonable measures to resettle the new population and ease the environmental pressure for orderly guidance of incremental population.
The rules and problems found in this article with Egypt as the study area are applicable to all desert countries, including Algeria, Australia, Kazakhstan, Kyrgzstan, Libya, Namibia, Saudi Arabia, UAE, and so on. Of course, there will be changes in the fractal characteristics of migration population and more diversified problems to face under the influence of natural conditions, economic development stages, and cultural and institutional factors. Therefore, we call for more empirical research and the formulation of reasonable policy recommendations and scientific planning strategies based on the research results.
In conclusion, this paper believes that Zipf’s law is applicable to the study on migration and spatial distribution of the migration population. Compared with simple spatial analysis of population immigration and emigration, Zipf’s law reflects the size structure of the migration population flow and its spatial pattern difference, and it can also segment the migration population flow in scale-free areas. By further employing geographic projection and spatial analysis methods to study the range of members of each community, the differences in internal structure, and the changes in the geographical spatial distribution of the entire migratory population flow size structure, this paper converts the size level “structural fractal” into the geographically differentiated “spatial fractal”, providing a theoretical basis for the formulation of spatial governance policies and spatial planning strategies.
It is not straightforward to say with certainty whether a particular data set has a power-law distribution. Clauset has argued that the common practice of identifying and quantifying power-law distributions by the approximately straight-line behavior of a histogram on a doubly logarithmic plot should not be trusted; such straight-line behavior is a necessary, but by no means sufficient condition for true power-law behavior. Clauset proposed a new technical method that was recommended by the reviewers. Unfortunately, because of multiple factors such as the inaccessibility of intellectual property rights and the small amount of data, we cannot completely follow his method for research, and can only learn and use this method to further verify some of the data. Fortunately, this has not had a fatal impact on our understanding of the migration patterns and laws of Egypt and more desert countries.
Restricted by many factors, the study of this paper also has some shortcomings. Specifically, this paper only relates to the distribution law of the migration population size at one time point in 2017 in Egypt, lacking comparative studies between different years; it has some limitations as there is no analysis of the temporal and spatial evolvement tendency and its mechanism. When applied to the establishment of regional population development policies or spatial governance plans, the conclusions reached need to be adjusted and optimized based on more updated census data. Our research method still needs further improvement, although it often appears in papers. In order to avoid erroneous results caused by the flaws of the method, this article has studied the methods of scholars such as Clauset and Chen for further verification, but it still needs more evidence.
Author Contributions
Conceptualization, Xingping Wang; methodology, Sidong Zhao; investigation, Xingping Wang, Sidong Zhao, and Zhishan Ma; data curation, Sidong Zhao and Zhishan Ma; writing—original draft preparation, Sidong Zhao; writing—review and editing, Xingping Wang; project administration, Xingping Wang; funding acquisition, Xingping Wang. All authors have read and agreed to the published version of the manuscript.
Funding
The research is funded by the National Key Research and Development Plan “Research Cooperation and Exemplary Application in Planning of Overseas Industrial Parks” (No. 2016YFE0201000) and the Introduction Plan of High-End Foreign Experts in 2019 “Comparison of urbanization model and spatial planning system in the Belt and Road Area” (No. G20190010128).
Data Availability Statement
The data used in this paper mainly come from the Statistical Yearbook-Housing published by the Central Agency for Public Mobilization and Statistics. The raw data used in 3.3 can be obtained through https://www.capmas.gov.eg/Pages/Publications.aspx?page_id=5109&Year=23448.
Acknowledgments
The authors acknowledge the Central Agency for Public Mobilization and Statistics for facilitating access to Planning image analysis and other data of Egypt. At the same time, all the authors are very grateful for the valuable comments provided by the three reviewers, as well as Yiran Yan and Anna Lu for their selfless dedication to this article.
Conflicts of Interest
The authors declare no conflict of interest.
Appendix A

Table A1.
Double logarithm regression equation and parameters of previous residence perspective.
| Provinces | All | Non-Scale Range | |
|---|---|---|---|
| First | Second | ||
| Egypt | y = −1.3158x + 12.927, R2 = 0.9788 | ||
| Cairo | y = −1.4411x + 11.484, R2 = 0.652 | y = −0.4369x + 10.055, R2 = 0.989 | y = −5.0755x + 22.046, R2 = 0.9294 |
| Alexandria | y = −1.8607x + 11.041, R2 = 0.7249 | y = −0.9783x + 9.7353, R2 = 0.9905 | y = −8.286x + 30.072, R2 = 0.9124 |
| Port Said | y = −1.7256x + 8.6634, R2 = 0.8817 | y = −1.5669x + 8.6315, R2 = 0.9807 | |
| Suez | y = −1.4932x + 8.5701, R2 = 0.8395 | y = −1.572x + 9.0448, R2 = 0.9827 | |
| Damietta | y = −1.7249x + 8.5281, R2 = 0.9365 | y = −1.5464x + 8.2547, R2 = 0.9675 | |
| Dakahlia | y = −1.7376x + 9.8787, R2 = 0.8437 | y = −1.3859x + 9.4823, R2 = 0.964 | y = −5.2482x + 20.333, R2 = 0.9702 |
| Sharkia | y = −1.454x + 10.154, R2 = 0.7777 | y = −0.8025x + 9.2042, R2 = 0.966 | y = −4.605x + 19.418, R2 = 0.9247 |
| Kalyubia | y = −2.1107x + 12.04, R2 = 0.7522 | y = −1.8536x + 12.214, R2 = 0.9699 | |
| Kafr El Sheikh | y = −1.8636x + 9.3505, R2 = 0.848 | y = −4.0777x + 15.658, R2 = 0.9863 | |
| Gharbia | y = −1.7797x + 9.6651, R2 = 0.8303 | y = −0.8031x + 8.3753, R2 = 0.9358 | y = −3.2112x + 13.805, R2 = 0.9758 |
| Menoufia | y = −1.8017x + 9.7431, R2 = 0.8604 | y = −1.3458x + 9.0631, R2 = 0.9752 | |
| Behera | y = −1.8569x + 10.147, R2 = 0.6703 | y = −1.1892x + 9.1297, R2 = 0.9554 | |
| Ismailia | y = −1.9403x + 10.21, R2 = 0.8382 | y = −0.9512x + 8.9085, R2 = 0.9385 | y = −6.9579x + 25.186, R2 = 0.9201 |
| Giza | y = −1.9275x + 12.481, R2 = 0.7886 | y = −0.9773x + 10.839, R2 = 0.944 | y = −8.6463x + 32.607, R2 = 0.9188 |
| Beni−Suef | y = −1.5429x + 8.3172, R2 = 0.9267 | y = −1.4023x + 8.103, R2 = 0.9769 | |
| Fayoum | y = −1.9578x + 9.1911, R2 = 0.9249 | y = −2.3328x + 10.199, R2 = 0.9509 | |
| Menia | y = −1.4379x + 8.6447, R2 = 0.9582 | ||
| Asyout | y = −1.6464x + 8.9695, R2 = 0.9271 | y = −1.4669x + 8.695, R2 = 0.956 | |
| Suhag | y = −1.7235x + 9.2828, R2 = 0.8933 | y = −1.4769x + 8.8963, R2 = 0.9631 | |
| Qena | y = −1.642x + 8.4421, R2 = 0.8628 | y = −1.3694x + 8.0254, R2 = 0.928 | |
| Aswan | y = −1.7799x + 8.7121, R2 = 0.9027 | y = −1.7044x + 8.799, R2 = 0.9646 | |
| Luxor | y = −1.5664x + 7.7752, R2 = 0.9190 | y = −1.4451x + 7.714, R2 = 0.9506 | |
| Red Sea | y = −1.5001x + 9.7428, R2 = 0.6982 | y = −0.9256x + 8.8688, R2 = 0.9550 | |
| ElWadi ElGidid | y = −1.6801x + 8.608, R2 = 0.8876 | y = −2.0763x + 9.6857, R2 = 0.9618 | |
| Matrouh | y = −1.7127x + 8.6756, R2 = 0.7094 | y = −1.1891x + 8.0503, R2 = 0.9638 | |
| North Sinai | y = −2.5988x + 9.5084, R2 = 0.8193 | y = −1.7251x + 8.5873, R2 = 0.9360 | |
| South Sinai | y = −0.9525x + 7.3836, R2 = 0.8874 | y = −0.8211x + 7.1852, R2 = 0.9522 | |
Table A2.
Double logarithm regression equation and parameters of current residence perspective.
| Provinces | All | Non-Scale Range | |
|---|---|---|---|
| First | Second | ||
| Cairo | y = −1.9202x + 12.461, R2 = 0.7516 | y = −0.6461x + 9.9449, R2 = 0.9536 | y = −2.8252x + 15.46, R2 = 0.9757 |
| Alexandria | y = −1.8882x + 11.159, R2 = 0.7189 | y = −1.4121x + 10.414, R2 = 0.9608 | |
| Port Said | y = −1.5571x + 10.196, R2 = 0.8816 | y = −1.1493x + 9.6023, R2 = 0.9716 | |
| Suez | y = −1.6334x + 10.524, R2 = 0.9271 | y = −1.7271x + 10.854, R2 = 0.9619 | |
| Damietta | y = −1.6063x + 10.386, R2 = 0.9043 | y = −1.5196x + 10.414, R2 = 0.9791 | |
| Dakahlia | y = −1.7153x + 10.057, R2 = 0.7894 | y = −0.898x + 9.0357, R2 = 0.9466 | y = −4.5185x + 18.076, R2 = 0.9642 |
| Sharkia | y = −1.9601x + 10.95, R2 = 0.9258 | y = −2.5387x + 12.553, R2 = 0.9882 | |
| Kalyubia | y = −1.8803x + 9.5979, R2 = 0.9676 | y = −1.7901x + 9.4569, R2 = 0.9849 | |
| Kafr El Sheikh | y = −1.953x + 10.376, R2 = 0.8005 | y = −0.9697x + 8.9918, R2 = 0.9502 | y = −5.1457x + 19.61, R2 = 0.9617 |
| Gharbia | y = −1.774x + 9.8234, R2 = 0.8340 | y = −0.5367x + 8.3227, R2 = 0.9555 | |
| Menoufia | y = −1.9655x + 10.179, R2 = 0.9234 | y = −2.259x + 10.955, R2 = 0.9595 | |
| Behera | y = −2.035x + 10.352, R2 = 0.9291 | y = −1.9553x + 10.224, R2 = 0.9502 | |
| Ismailia | y = −1.6233x + 8.7208, R2 = 0.8958 | y = −1.6086x + 8.8792, R2 = 0.9515 | |
| Giza | y = −1.4941x + 9.2068, R2 = 0.8093 | y = −0.5442x + 7.3717, R2 = 0.9443 | |
| Beni−Suef | y = −2.085x + 9.9794, R2 = 0.9399 | y = −2.0149x + 9.8688, R2 = 0.9542 | |
| Fayoum | y = −2.0727x + 9.8407, R2 = 0.9592 | y = −1.9293x + 9.6233, R2 = 0.9816 | |
| Menia | y = −1.8802x + 10.285, R2 = 0.8947 | y = −1.7559x + 10.085, R2 = 0.9635 | |
| Asyout | y = −1.5455x + 9.8179, R2 = 0.9661 | ||
| Suhag | y = −1.3674x + 9.7215, R2 = 0.9346 | y = −1.5257x + 10.206, R2 = 0.9659 | |
| Qena | y = −1.887x + 9.864, R2 = 0.9063 | y = −1.541x + 9.3468, R2 = 0.9759 | |
| Aswan | y = −1.6587x + 8.6376, R2 = 0.9103 | y = −2.259x + 10.215, R2 = 0.9753 | |
| Luxor | y = −1.8149x + 8.2318, R2 = 0.9441 | y = −2.0784x + 8.8999, R2 = 0.977 | |
| Red Sea | y = −1.1185x + 6.6284, R2 = 0.8726 | y = −0.5883x + 5.7921, R2 = 0.9671 | y = −2.5416x + 10.528, R2 = 0.9762 |
| ElWadi ElGidid | y = −1.401x + 6.1218, R2 = 0.9368 | y = −1.6185x + 6.6048, R2 = 0.9578 | |
| Matrouh | y = −1.2897x + 6.8193, R2 = 0.8428 | y = −1.1217x + 6.7657, R2 = 0.9661 | |
| North Sinai | y = −2.1179x + 8.8854, R2 = 0.8597 | y = −1.4497x + 7.9977, R2 = 0.9596 | y = −4.295x + 14.995, R2 = 0.9837 |
| South Sinai | y = −1.3274x + 6.4733, R2 = 0.7432 | y = −0.4051x + 5.3883, R2 = 0.9643 | y = −3.2354x + 11.632, R2 = 0.9662 |
Table A3.
Double logarithm regression equation and parameters of residence.
| Economic Region | Previous | Current |
|---|---|---|
| Greater Cairo | y = −1.3274x + 12.708, R2 = 0.9285 | y = −1.7162x + 12.177, R2 = 0.8372 |
| Alexandria | y = −1.0906x + 10.573, R2 = 0.844 | y = −1.9511x + 11.312, R2 = 0.9575 |
| Suez Canal | y = −1.3778x + 10.866, R2 = 0.8551 | y = −1.8215x + 11.644, R2 = 0.9696 |
| Delta | y = −1.5822x + 10.759, R2 = 0.7604 | y = −1.5847x + 11.393, R2 = 0.8386 |
| North Upper Egypt | y = −1.1548x + 9.4668, R2 = 0.9087 | y = −1.8213x + 10.649, R2 = 0.929 |
| Central Upper Egypt | y = −0.9468x + 8.9529, R2 = 0.9574 | y = −1.2711x + 9.5109, R2 = 0.9004 |
| South Upper Egypt | y = −1.1114x + 10.175, R2 = 0.9753 | y = −1.5728x + 10.649, R2 = 0.9271 |
Table A4.
Index equation for data review of previous residence.
| Provinces | Exponential Fitting Equation | Gabaix’s Double Logarithmic Equation | Fractal Types |
|---|---|---|---|
| Alexandria | y = 0.1291e5.017x, R2 = 0.9482 | y = −1.3248x + 10.179, R2 = 0.9528 y = −5.0344x + 20.716, R2 = 0.974 | Bifractals power law |
| Port Said | y = 0.2717e4.308x, R2 = 0.9839 | y = −1.3313x + 9.556, R2 = 0.8465 | Exponential distribution |
| Damietta | y = 0.282e4.2252x, R2 = 0.9672 | y = −1.3725x + 9.7234, R2 = 0.8671 | Exponential distribution |
| Gharbia | y = 0.5706e3.4957x, R2 = 0.9472 | y = −1.4583x + 9.0016, R2 = 0.7848 | Exponential distribution |
| Giza | y = 0.0231e6.8991x, R2 = 0.9951 | y = −1.0916x + 8.3725, R2 = 0.953 | Monofractal power law |
| Qena | y = 0.0972e5.2512x, R2 = 0.9619 | y = −2.1131x + 10.376, R2 = 0.902 | Exponential distribution |
| Matrouh | y = 0.5797e3.3953x, R2 = 0.9936 | y = −1.4121x + 7.0392, R2 = 0.8736 | Exponential distribution |
Table A5.
Index equation for data review of current residence.
| Provinces | Exponential Fitting Equation | Gabaix’s Double Logarithmic Equation | Fractal Types |
|---|---|---|---|
| Port Said | y = 0.2676e4.0399x, R2 = 0.9598 | y = −1.4625x + 8.2661, R2 = 0.9698 | Monofractal power law |
| Suez | y = 0.5488e3.625x, R2 = 0.9779 | y = −1.465x + 8.7067, R2 = 0.9786 | Monofractal power law |
| Kalyubia | y = 0.0032e8.7817x, R2 = 0.9764 | y = −1.9653x + 11.574, R2 = 0.6602 | Exponential distribution |
| Kafr El Sheikh | y = 0.4126e3.7293x, R2 = 0.9479 | y = −2.0188x + 9.657, R2 = 0.8757 | Exponential distribution |
| Menoufia | y = 0.1857e4.6402x, R2 = 0.9767 | y = −1.8379x + 9.756 R2 = 0.8431 | Exponential distribution |
| Behera | y = 0.2614e4.364x, R2 = 0.9883 | y = −1.6558x + 9.7598, R2 = 0.6905 | Exponential distribution |
| Aswan | y = 0.2592e4.1266x, R2 = 0.9442 | y = −1.9994x + 9.2411, R2 = 0.9516 | Monofractal power law |
| Luxor | y = 0.2083e4.4891x, R2 = 0.9530 | y = −1.3183x + 7.3393, R2 = 0.9577 | Monofractal power law |
| Red Sea | y = 0.3394e4.2229x, R2 = 0.9904 | y = −1.2866x + 9.1306, R2 = 0.6705 | Exponential distribution |
| Matrouh | y = 0.4026e3.8311x, R2 = 0.9881 | y = −1.2586x + 7.7037, R2 = 0.799 | Exponential distribution |
Figure A1.
Double logarithm curve fitting of previous residence perspective (province). Remarks: In the explanation of the formula in the figure, the formula in the upper right corner contains all samples, the upper left corner or lower left corner contain the sample in the (first) non-scale range, and the lower right corner contains the sample in the second non-scale range. The same is true in the following figure.

Figure A2.
Double logarithm curve fitting of previous residence perspective (economic region).

Figure A3.
Double logarithm curve fitting of current residence perspective (province).

Figure A4.
Double logarithm curve fitting of the current residence perspective (economic region).

Figure A5.
Double logarithm curve fitting of total and net quantity.
References
- De Haas, H. Migration and Development: A Theoretical Perspective. Int. Migr. Rev. 2010, 44, 227–264. [Google Scholar] [CrossRef] [PubMed] [Green Version]
- Stillwell, J.; Daras, K.; Bell, M.; Lomax, N. The Image Studio: A Tool for Internal Migration Analysis and Modelling. Appl. Spat. Anal. Policy 2014, 1, 5–23. [Google Scholar] [CrossRef]
- Ravenstein, E.G. The Laws of Migration. J. Stat. Soc. 1885, 48, 167–235. [Google Scholar] [CrossRef]
- Heberle, R. The Causes of Rural-Urban Migration a Survey of German Theories. The Am. J. Sociol. 1938, 43, 932–950. [Google Scholar] [CrossRef]
- Zipf, G.K. The P1P2 /D Hypothesis: On Intercity Movement of Persons. Am. Sociol. Rev. 1946, 11, 677–686. [Google Scholar] [CrossRef]
- Wilson, A.G. Entropy in Urban and Regional Modelling; London Pion: London, UK, 1970. [Google Scholar]
- Plane, D.A.; Henrie, C.J.; Perry, M.J. Migration up and down the Urban Hierarchy and across the Life Course. Acad. Sci. USA 2005, 102, 15313–15318. [Google Scholar] [CrossRef] [PubMed] [Green Version]
- Davis, K.F.; D’Odorico, P.; Laio, F.; Ridolfi, L. Global Spatio-Temporal Patterns in Human Migration: A Complex Network Perspective. PLoS ONE 2013, 8, e53723. [Google Scholar] [CrossRef] [Green Version]
- Cao, Y.Y. Evolution and Characteristics of Spatial Economic Structure in Ningxia Province. J. Arid Land Resour. Environ. 2010, 24, 10–14. [Google Scholar]
- Liu, S.H.; Hu, Z.; Deng, Y.; Wang, Y.J. The Regional Types of China’s Floating Population: Identification Methods and Spatial Patterns. J. Geogr. Sci. 2011, 21, 35–48. [Google Scholar] [CrossRef] [Green Version]
- Qiao, L.Y.; Li, Y.R.; Liu, Y.S.; Yang, R. The Spatio-Temporal Change of China’s Net Floating Population at County Scale from 2000 to 2010. Asia Pac. Viewp. 2016, 57, 365–378. [Google Scholar] [CrossRef]
- Liang, Z.; Ma, Z.D. China’s Floating Population: New Evidence from the 2000 Census. Popul. Dev. Rev. 2004, 30, 467–478. [Google Scholar] [CrossRef]
- Liang, Z.; Li, Z.; Ma, Z.D. Changing Patterns of the Floating Population in China, 2000-2010. Popul. Dev. Rev. 2014, 4, 695–716. [Google Scholar] [CrossRef] [PubMed] [Green Version]
- Wu, J.W.; Yu, Z.; Wei, Y.D.; Yang, L.Q. Changing Distribution of Migrant Population and Its Influencing Factors in Urban ChinA: Economic Transition, Public Policy, and Amenities. Habitat Int. 2019, 94, 102063. [Google Scholar] [CrossRef]
- Wang, L.C.; Xue, C.X. Spatio-Temporal Characteristics and Influencing Factors of Urban Floating Population in China From 2011 to 2015. Chin. J. Popul. Resour. Environ. 2019, 4, 359–373. [Google Scholar] [CrossRef]
- Levytska, O.; Mulska, O.; Ivaniuk, U.; Kunytska-lliash, M.; Vasyltsic, T.; Lupak, R. Modelling the Conditions Affecting Population Migration Activity in the Eastern European Region: The Case of Ukraine. Tem. J. Technol. Educ. Manag. Inform. 2020, 2, 507–514. [Google Scholar] [CrossRef]
- Shumway, J.M.; Otterstrom, S.M. Spatial Patterns of Migration and Income Change in the Mountain West:The Dominance of Service-Based, Amenity-Rich Counties. Prof. Geogr. 2010, 53, 492–502. [Google Scholar] [CrossRef]
- Sobolevsky, S.; Szell, M.; Campari, R.; Couronne, T.; Smoreda, Z.; Ratti, C. Delineating Geographical Regions with Networks of Human Interactions in an Extensive Set of Countries. PLoS ONE 2013, 8, e81707. [Google Scholar] [CrossRef] [Green Version]
- Hawelka, B.; Sitko, I.; Beinat, E.; Sobolevsky, S.; Kazakopoulos, P.; Ratti, C. Geo-Located Twitter as Proxy for Global Mobility Patterns. Cartogr. Geogr. Inf. Sci. 2014, 41, 260–271. [Google Scholar] [CrossRef] [Green Version]
- Porat, I.; Benguigui, L. Global Migration Topology Analysis and Modeling of Bilateral Flow Network 2006–2010. EPL 2016, 115, 18002. [Google Scholar] [CrossRef]
- Salvati, L.; Serra, P.; Bencardino, M.; Carlucci, M. Re-Urbanizing the European City: A Multivariate Analysis of Population Dynamics during Expansion and Re-Cession Times. Eur. J. Popul. 2018, 4, 1–28. [Google Scholar]
- Shi, Q.J.; Liu, T. Glimpsing China’s Future Urbanization from the Geography of a Floating Population. Environ. Plan. 2019, 51, 817–819. [Google Scholar] [CrossRef] [Green Version]
- Fan, C.C. Interprovincial Migration, Population Redistribution, and Regional Development in China: 1990 and 2000 Census Comparisons. The Prof. Geogr. 2005, 57, 295–311. [Google Scholar] [CrossRef]
- Liu, C.; Otsubo, K.; Wang, Q.X.; Ichinose, T.; Ishimura, S. Spatial and Temporal Changes of Floating Population in China Between 1990 and 2000. Chin. Geogr. Sci. 2007, 2, 3–13. [Google Scholar] [CrossRef]
- Cully, M. More Than Additions to Population: The Economic and Fiscal Impact of Immigration. Aust. Econ. Rev. 2012, 45, 344–349. [Google Scholar] [CrossRef]
- Luo, J.J.; Zhang, X.L.; Wu, Y.Z.; Shen, L.Y.; Xing, X.S. Urban Land Expansion and the Floating Population in China: For Production or for Living? Cities 2018, 74, 219–228. [Google Scholar] [CrossRef]
- Gao, D.J.; Peng, J.L.; Zi, L. Study on the Relationship between the Population Migration and Region Economy Based on the Framework of VAR Model:A Case Study of Chongqing. Northwest Popul. J. 2020, 110, 50–53. [Google Scholar]
- Hoffman, M.T.; Skowno, A.; Bell, W.; Mashele, S. Long-Term Changes in Land Use, Land Cover and Vegetation in the Karoo Drylands of South Africa: Implications for Degradation Monitoring. Afr. J. Range Forage Sci. 2018, 35, 209–221. [Google Scholar] [CrossRef]
- Liu, Z.F.; He, C.Y.; Yang, Y.J.; Fang, Z.H. Planning Sustainable Urban Landscape under the Stress of Climate Change in the Drylands of Northern ChinA: A Scenario Analysis Based on LUSD-Urban Model. J. Clean. Prod. 2020, 244. [Google Scholar] [CrossRef]
- Liu, Z.F.; Yang, Y.J.; He, C.Y.; Tu, M.Z. Climate Change Will Constrain the Rapid Urban Expansion in Drylands: A Scenario Analysis with the Zoned Land Use Scenario Dynamics-Urban Model. Sci. Total Environ. 2019, 651, 2772–2786. [Google Scholar] [CrossRef]
- He, C.Y.; Li, J.W.; Zhang, X.L.; Liu, Z.F.; Zhang, D. Will Rapid Urban Expansion in, the Drylands of Northern China Continue: A Scenario Analysis Based on the Land Use Scenario Dynamics-Urban Model and the Shared Socioeconomic Pathways. J. Clean. Prod. 2017, 165, 57–69. [Google Scholar] [CrossRef]
- Jenerette, G.D.; Miller, G.; Buyantuev, A.; Pataki, D.E.; Gillespie, T.; Pincetl, S. Urban Vegetation and Income Segregation in Drylands: A Synthesis of Seven Metropolitan Regions in the South-Western United States. Environ. Res. Lett. 2013, 8. [Google Scholar] [CrossRef] [Green Version]
- Liu, Z.F.; Verburg, P.H.; Wu, J.G.; He, C.Y. Understanding Land System Change Through Scenario-Based Simulations: A Case Study from the Drylands in Northern China. Environ. Manag. 2017, 59, 1–15. [Google Scholar] [CrossRef] [PubMed]
- Mcpeak, J.G.; Little, P.D. Land Use and Tenure Insecurity in the Drylands of Southern Ethiopia. J. Dev. Stud. 2019, 55, 1307–1324. [Google Scholar] [CrossRef]
- Gong, B.H.; Liu, Z.F. Assessing Impacts of Land Use Policies on Environmental Sustainability of Oasis Landscapes with Scenario Analysis: The Case of Northern China. Landsc. Ecol. 2020. [Google Scholar] [CrossRef]
- Rubio, M.C.; Sales, R.; Abraham, E.; Rubio, M.F.; Diaz, F.; Rubio, C. Land Use Planning in Drylands: Participatory Processes in Diagnosing the Physical-Biological Subsystem. Appl. Spat. Anal. Policy 2020. [Google Scholar] [CrossRef]
- El Amrousi, M.; Paleologos, E.K.; Caratelli, P. Are Garden Cities in the Desert Sustainable? The Oasis City of Al Ain in the Emirate of Abu Dhabi. Int. Rev. Spat. Plan. Sustain. Dev. A Plan. Strateg. Des. Concepts 2018, 6, 79–94. [Google Scholar]
- Burian, A.; Karaya, R.; Wernersson, J.E.V.; Egberth, M.; Likirwa, B.; Nyberg, G. A Community-Based Evaluation of Population Growth and Agro-Pastoralist Resilience in Sub-saharan Drylands. Environ. Sci. Policy 2018, 92, 323–330. [Google Scholar] [CrossRef]
- Heider, G.; Jobbagy, E.G.; Tripaldi, A. Use of Semi-Arid Space by Prehispanic Population: The Role of Dune Landscapes as Eco-Refuges in Central Argentina. Boletín Soc. Geol. Mex. 2019, 71, 229–248. [Google Scholar] [CrossRef]
- Rufino, I.A.A.; Da Silva, S.T. Change Analysis of Population Dynamics and Climate Variability in the Brazilian Semi-arid Region: A Methodological Approach. Bol. Ciênc. Geod. 2017, 23, 166–181. [Google Scholar] [CrossRef]
- Qi, S.Z.; Zheng, Z.P. Environmental Hazards from Population Pressure in the Jinta Oasis, Arid Northwestern China. Nat. Hazards 2013, 65, 985–989. [Google Scholar] [CrossRef]
- Qi, W.; Liu, S.H. Research on the Rank-Size Distribution Rule of China’s Urban Floating Population. Geogr. Res. 2015, 34, 1981–1993. [Google Scholar]
- Wang, X.M.; Hao, R.; Zhao, N.; Huo, J. Statistical Characteristics of Dynamics for Population Migration Driven by the Economic Interests. Physica, A. Stat. Mech. Appl. 2016, 451, 123–134. [Google Scholar]
- Chen, Y.G. A Wave-Spectrum Analysis of Urban Population Density: Entropy, Fractal, and Spatial Localization. Discret. Dyn. Nat. Soc. 2008, 4, 47–58. [Google Scholar] [CrossRef] [Green Version]
- Newman, T.J.; Antonovics, J.; Wilbur, H.M. Population Dynamics with a Refuge: Fractal Basins and the Suppression of Chaos. Theor. Popul. Biol. 2002, 62, 121–128. [Google Scholar] [CrossRef] [PubMed] [Green Version]
- Kim, J.; Kramer, T.A. Adjustable Discretized Population Balance Equations: Numerical Simulation and Parameter Estimation for Fractal Aggregation and Break-Up. Colloids Surf. A Physicochem. Eng. Asp. 2007, 292, 173–188. [Google Scholar] [CrossRef]
- Sutton, K.; Fahmi, W. Cairo’s Urban Growth and Strategic Master Plans in the Light of Egypt’s 1996 Population Census Results. Cities 2001, 18, 135–149. [Google Scholar] [CrossRef]
- Stewart, D.J.; Yin, Z.Y.; Bullard, S.M.; Maclachlan, J.T. Assessing the Spatial Structure of Urban and Population Growth in the Greater Cairo Area, Egypt: A GIS and Imagery Analysis Approach. Urban Stud. 2004, 41, 95–116. [Google Scholar] [CrossRef]
- Ibrahiem, D.M. Road Energy Consumption, Economic Growth, Population and Urbanization in Egypt: Cointegration and Causality Analysis. Environ. Dev. Sustain. 2018, 20, 1053–1066. [Google Scholar] [CrossRef]
- Ghanem, S.K. The Relationship between Population and the Environment and Its Impact on Sustainable Development in Egypt Using a Multi-Equation Model. Environ. Dev. Sustain. 2018, 20, 305–342. [Google Scholar] [CrossRef]
- McCormick, B.; Wahba, J. Return International Migration and Geographical Inequality: The Case of Egypt. J. Afr. Econ. 2003, 12, 500–532. [Google Scholar] [CrossRef] [Green Version]
- Afifi, T. The Environmental Root Causes Triggering Economic Migration: The Case of Egypt. In Environment, Forced Migration and Social Vulnerability; Springer: Berlin/Heidelberg, 2010. [Google Scholar]
- Pettit, H.; Ruijtenberg, W. Migration as Hope and Depression: Existential Im/Mobilities in and beyond Egypt. Mobilities 2019, 14, 730–744. [Google Scholar] [CrossRef] [Green Version]
- Arouri, M.; Cuong, N.V. Wealth Inequality and Inter-Governorate Migration: Evidence from Egypt. Prog. Dev. Stud. 2020, 20, 119–139. [Google Scholar] [CrossRef]
- Ma, Z.; Zhang, S.; Zhao, S. Study on the Spatial Pattern of Migration Population in Egypt and Its Flow Field Characteristics from the Perspective of “Source-Flow-Sink”. Sustainability 2021, 13, 350. [Google Scholar] [CrossRef]
- Gao, P.C.; Liu, Z.; Liu, G.; Zhao, H.R.; Xie, X.X. Unified Metrics for Characterizing the Fractal Nature of Geographic Features. Ann. Am. Assoc. Geogr. 2017, 1, 1315–1331. [Google Scholar] [CrossRef]
- Jiang, B.; Yin, J.J. Ht-Index for Quantifying the Fractal or Scaling Structure of Geographic Features. Ann. Assoc. Am. Geogr. 2014, 104, 530–541. [Google Scholar] [CrossRef]
- Mukhopadhyay, B.; Mukherjee, P.K.; Bhattacharya, D.; Sengupta, S. Delineation of Arsenic-Contaminated Zones in Bengal Delta, IndiA: A Geographic Information System and Fractal Approach. Environ. Geol. 2006, 49, 1009–1020. [Google Scholar] [CrossRef]
- Barmaki, M.D.; Rezaei, M.; Madadi, S. Use of Fractal Dimensions Analysis in Geographic Information System and Remote Sensing Techniques to Iden-Tify Groundwater Prospective Zones in the Anar-Dashtegol Anticline, Iran. Carbonates Evaporites 2019, 35, 4. [Google Scholar] [CrossRef]
- Jarraya, M.; Guermazi, A.; Niu, J.B.; Duryea, J.; Lynch, J.A.; Roemer, F.W. Multi-Dimensional Reliability Assessment of Fractal Signature Analysis in an Outpatient Sports Medicine Population. Ann. Anat.—Anat. Anz. 2015, 202, 57–60. [Google Scholar] [CrossRef]
- Ayres, R. Tourism as a Passport to Development in Small States: Reflections on Cyprus. Int. J. Soc. Econ. 2000, 27, 114–133. [Google Scholar] [CrossRef]
- Alperovich, G. The Size Distribution of Cities: On the Empirical Validity of the Rank-Size Rule. J. Urban. Econ. 1984, 16, 232–239. [Google Scholar] [CrossRef]
- Brakman, S.; Garretsen, H.; Van Marrewijk, C.; Van Den Berg, M. The Return of Zipf: Towards a Further Understanding of the Rank-Size Distribution. J. Reg. Sci. 1999, 39, 183–213. [Google Scholar] [CrossRef]
- Guerin-Pace, F. Rank-Size Distribution and the Process of Urban Growth. Urban Stud. 1995, 32, 551–562. [Google Scholar] [CrossRef]
- Chen, Y.G.; Wang, J.J. Recursive Subdivision of Urban Space and Zipf’s law. Phys. A Statal Mech. Appl. 2014, 395, 392–404. [Google Scholar] [CrossRef] [Green Version]
- Chen, Y.G. The Mathematical Relationship between Zipf’s Law and the Hierarchical Scaling Law. Phys. A Statal Mech. Appl. 2012, 391, 3285–3299. [Google Scholar] [CrossRef] [Green Version]
- Chen, Y.G. Zipf’s Law, Hierarchical Structure, and Cards-Shuffling Model for Urban Development. Discret. Dyn. Nat. Soc. 2012. [Google Scholar] [CrossRef]
- Benguigui, L.; Daoud, M. Is the Suburban Railway System a Fractal? Geogr. Anal. 2010, 23, 362–368. [Google Scholar] [CrossRef]
- White, R.; Engelen, G. Urban Systems Dynamics and Cellular Automata: Fractal Structures between Order and Chaos. Chaos Solitons Fractals 1994, 4, 563–583. [Google Scholar] [CrossRef]
- Benguigui, L.; Blumenfeld-Lieberthal, E. The End of a Paradigm: Is Zipf’s Law Universal? J. Geogr. Syst. 2011, 13, 87–100. [Google Scholar] [CrossRef]
- Jiang, B.; Yin, J.J.; Liu, Q.L. Zipf’s Law for All the Natural Cities around the World. Int. J. Geogr. Inf. Sci. 2015, 29, 498–522. [Google Scholar] [CrossRef]
- Ioannides, Y.M.; Overman, H.G. Zipf’s Law for Cities: An Empirical Examination. Reg. Sci. Urban. Econ. 2003, 33, 127–137. [Google Scholar] [CrossRef] [Green Version]
- Jiang, B.; Jia, T. Zipf’s Law for All the Natural Cities in the United States: A Geospatial Perspective. Int. J. Geogr. Inf. Sci. 2011, 25, 1269–1281. [Google Scholar] [CrossRef]
- González-Val, R. Deviations from Zipf’s Law for American Cities: An Empirical Examination. Urban Stud. 2011, 48, 1017–1035. [Google Scholar] [CrossRef] [Green Version]
- Fang, L.; Li, P.; Song, S.F. China’s Development Policies and City Size Distribution: An Analysis Based on Zipf’s Law. Urban Stud. 2017, 54, 2818–2834. [Google Scholar] [CrossRef]
- Ye, X.Y.; Xie, Y.C. Re-Examination of Zipf’s Law and Urban Dynamic in China: A Regional Approach. Ann. Reg. Sci. 2012, 49, 135–156. [Google Scholar] [CrossRef]
- Peng, G.H. Zipf’s Law for Chinese Cities: Rolling Sample Regressions. Phys. A Stat. Mech. Appl. 2010, 389, 3804–3813. [Google Scholar] [CrossRef]
- Lalanne, A. Zipf’s Law and Canadian Urban Growth. Urban Stud. 2014, 51, 1725–1740. [Google Scholar] [CrossRef]
- Giesen, K.; Sudekum, J. Zipf’s Law for Cities in the Regions and the Country. J. Econ. Geogr. 2011, 11, 667–686. [Google Scholar] [CrossRef] [Green Version]
- Knudsen, T. Zipf’s Law for Cities and Beyond: The Case of Denmark. Am. J. Econ. Sociol. 2001, 60, 123–146. [Google Scholar] [CrossRef]
- Josic, H.; Basic, M. Reconsidering Zipf’s Law for Regional Development: The Case of Settlements and Cities in Croatia. Misc. Geogr. 2018, 22, 22–30. [Google Scholar] [CrossRef] [Green Version]
- Bergs, R. The Detection of Natural Cities in The Netherlands snocturnal Satellite Imagery and Zipf’s Law. Rev. Reg. Res.-Jahrb. Fur Reg. 2018, 38, 111–140. [Google Scholar] [CrossRef]
- Cielik, A.; Teresiński, J. Does Zipf’s Law Hold for Polish Cities? Misc. Geogr. 2016, 20, 5–10. [Google Scholar] [CrossRef] [Green Version]
- Kwok, T.S. Zipf’s Law and Urban Growth in Malaysia. Urban Stud. 2007, 44, 1–14. [Google Scholar]
- Basu, B.; Bandyapadhyay, S. Zipf’s Law and Distribution of Population in Indian Cities. Indian J. Phys. 2009, 83, 1575–1582. [Google Scholar] [CrossRef]
- Morudu, H.D. Developing Annual Population and Gross Domestic Product Estimates for Local Municipality Development Mod-Els in South Africa: Applications of Zipf’s Rule from 2001 to 2013. S. Afr. Geogr. J. 2016, 98, 367–385. [Google Scholar] [CrossRef]
- Kundak, S.; Dkmeci, V. A Rank-Size Rule Analysis of The City System at The Country and Province Level in Turkey. ICONARP Int. J. Archit. Plan. 2018, 6, 77–98. [Google Scholar] [CrossRef] [Green Version]
- Chen, Y.G. Scale Symmetric Spatial Complexity of Fractal Urban System; Science Press: Beijing, China, 2008. [Google Scholar]
- Zhou, C.P.; Ge, D.M. Disparity of Tourism Scale and a Research on its System for Rank- Scale Distribution—Take Zhejiang Province for Example. Econ. Geogr. 2010, 30, 345–350. [Google Scholar]
- Clauset, A.; Shalizi, C.R.; Newman, M.E.J. Power-Law Distributions in Empirical Data. SIAM Rev. 2009, 51, 661–703. [Google Scholar] [CrossRef] [Green Version]
- Hanel, R.; Corominas-Murtra, B.; Liu, B.; Thurner, S. Fitting Power-Laws in Empirical Data with Estimators That Work for All Exponents. PLoS ONE 2017, 12, e0170920. [Google Scholar] [CrossRef] [Green Version]
- Gabaix, X.; Ibragimov, R. Rank-1/2: A Simple Way to Improve the OLS Estimation of Tail Exponents. J. Bus. Econ. Stat. 2011, 29, 24–39. [Google Scholar] [CrossRef] [Green Version]
- Xiao, D.Q. Cognitive Geography: People-Oriented Geographic Information Science; Science Press: Beijing, China, 2013. [Google Scholar]
- Tobler, W. A Computer Movie Simulating Urban Growth in the Detroit Region. Econ. Geogr. 1970, 46, 234–240. [Google Scholar] [CrossRef]
- Malevergne, Y.; Pisarenko, V.; Sornette, D. Empirical Distributions of Log-Returns: Between the Stretched Exponential and the Power Law? Quant. Financ. 2005, 5, 379–401. [Google Scholar] [CrossRef]
Figure 1.
Study area: Egypt and desert countries.

Figure 2.
Comparative analysis of the proportion of land desertification in typical desert countries.
Figure 2.
Comparative analysis of the proportion of land desertification in typical desert countries.

Figure 3.
Logical framework and research steps.

Figure 4.
Analysis of fractal types clustering space (province). Remarks: The number represents the name of the province, and the following pictures are the same. (1) Cairo, (2) Alexandria, (3) Port Said, (4) Suez, (5) Damietta, (6) Dakahlia, (7) Sharkia, (8) Kalyubia, (9) Kafr El Sheikh, (10) Gharbia, (11) Menoufia, (12) Behera, (13) Ismailia, (14) Giza, (15) Beni-Suef, (16) Fayoum, (17) Menia, (18) Asyout, (19) Suhag, (20) Qena, (21) Aswan, (22) Luxor, (23) Red Sea, (24) ElWadi ElGidid, (25) Matrouh, (26) North Sinai, and (27) South Sinai.

Figure 5.
Spatial analysis of distribution patterns (province).

Figure 6.
Analysis of scale-free area for previous residence perspective (province).


Figure 7.
Spatial analysis of fractal types in economic region (previous and current).

Figure 8.
Analysis of scale-free area for current residence perspective (province).


Table 1.
Basic information of typical desert countries in the world.
| Country | Area (million km2) | Population (million) | GDP per Capita ($) | |
|---|---|---|---|---|
| 1 | Egypt | 1.00 | 98.58 | 2508 |
| 2 | Afghanistan | 0.65 | 29.70 | 679 |
| 3 | Algeria | 2.38 | 42.20 | 4279 |
| 4 | Iraq | 0.44 | 38.12 | 5415 |
| 5 | Australia | 7.69 | 2.51 | 51,581 |
| 6 | Bahrain | 0.0007 | 1.50 | 22,333 |
| 7 | Israel (Palestine) | - | - | - |
| 8 | Jordan | 0.089 | 10.31 | 4108 |
| 9 | Kazakhstan | 2.73 | 18.39 | 9271 |
| 10 | Chile | 0.76 | 18.75 | 16,100 |
| 11 | Kyrgzstan | 0.20 | 6.40 | 1267 |
| 12 | Eritrea | 0.12 | 5.97 | 1060 |
| 13 | Libya | 1.76 | 6.68 | 7235 |
| 14 | Mongolia | 1.57 | 32.00 | 3975 |
| 15 | Namibia | 0.82 | 2.41 | 6031 |
| 16 | Niger | 1.27 | 21.47 | 430 |
| 17 | Oman | 0.31 | 4.69 | 15,565 |
| 18 | Peru | 1.29 | 31.24 | 7002 |
| 19 | Saudi Arabia | 2.25 | 33.41 | 23,712 |
| 20 | Sudan | 1.88 | 40.78 | 808 |
| 21 | Syria | 0.19 | 16.91 | - |
| 22 | Turkmenistan | 0.49 | 5.62 | 7669 |
| 23 | UAE | 0.084 | 9.40 | 68,000 |
| 24 | Uzbekistan | 0.45 | 33.38 | 1500 |
| 25 | Yemen | 0.56 | 28.5 | 944 |
| 26 | Qatar | 0.221 | 2.64 | 69,026 |
| 27 | Iran | 164.5 | 81.69 | 5220 |
Table 2.
Criteria and mechanism of spatial distribution determined by Zipf’s law.
| Spatial Pattern | Distribution | Power | ||
|---|---|---|---|---|
| 1 | <0.6 | Over Dispersion | Normal | Centralization |
| 2 | 0.6–0.9 | Balanced Distribution | ||
| 3 | 0.9–1.5 | Optimal Distribution | Normal-Pareto | Balance |
| 4 | 1.5–2.5 | Primacy Distribution | Pareto | Decentralization |
| 5 | >2.5 | Over Concentration |
Publisher’s Note: MDPI stays neutral with regard to jurisdictional claims in published maps and institutional affiliations. |
© 2021 by the authors. Licensee MDPI, Basel, Switzerland. This article is an open access article distributed under the terms and conditions of the Creative Commons Attribution (CC BY) license (http://creativecommons.org/licenses/by/4.0/).
Share and Cite
MDPI and ACS Style
Zhao, S.; Wang, X.; Ma, Z. Study on Fractal Characteristics of Migration-Population Flow—Evidence from Egypt. ISPRS Int. J. Geo-Inf. 2021, 10, 45. https://0-doi-org.brum.beds.ac.uk/10.3390/ijgi10020045
AMA Style
Zhao S, Wang X, Ma Z. Study on Fractal Characteristics of Migration-Population Flow—Evidence from Egypt. ISPRS International Journal of Geo-Information. 2021; 10(2):45. https://0-doi-org.brum.beds.ac.uk/10.3390/ijgi10020045
Chicago/Turabian StyleZhao, Sidong, Xingping Wang, and Zhishan Ma. 2021. "Study on Fractal Characteristics of Migration-Population Flow—Evidence from Egypt" ISPRS International Journal of Geo-Information 10, no. 2: 45. https://0-doi-org.brum.beds.ac.uk/10.3390/ijgi10020045
Note that from the first issue of 2016, this journal uses article numbers instead of page numbers. See further details here.