
Spatial Patterns of COVID-19 Incidence in Relation to Crime Rate Across London


1
Department of Geography, College of Science, Swansea University, Swansea SA2 8PP, UK
2
School of Geography and Planning, Sun Yat-sen University, Guangzhou 510275, China
3
Academy of China Open Economy Studies, University of International Business and Economics, Beijing 100029, China
4
Department of Urban and Rural Planning, School of Architecture, Tianjin University, Tianjin 300072, China
*
Author to whom correspondence should be addressed.
ISPRS Int. J. Geo-Inf. 2021, 10(2), 53; https://0-doi-org.brum.beds.ac.uk/10.3390/ijgi10020053
Submission received: 20 December 2020
/
Revised: 22 January 2021
/
Accepted: 24 January 2021
/
Published: 27 January 2021
Abstract
:COVID-19 containment policies are not only curbing the spread of COVID-19 but also changing human behavior. According to the routine activity theory, owing to lockdown, the closure of entertainment sites (e.g., pubs and bars), an increase in stay-at-home time, and an increase in police patrols are likely to influence chance of committing a crime. In this study, we aimed to further examine the spatial association of COVID-19 infection rate and crime rate. Particularly, we empirically validated the speculation that increase in COVID-19 cases is likely to reduce crime rate. In the empirical study, we investigated whether and how COVID-19 infection rate is spatially associated with crime rate in London. As the spatial data used are mainly areal data, we adopted a spatial regression mode (i.e., the “random effects eigenvector spatial filtering model”) to investigate the spatial associations after controlling for the socioeconomic factors. More specifically, we investigated the associations for all the four crime categories in three consequent months (March, April, and May of 2020). The empirical results indicate that 1) crime rates of the four categories have no statistically significant associations with COVID-19 infection rate in March; 2) violence-against-the-person rate has no statistically significant association with COVID-19 infection rate; and 3) robbery rate, burglary rate, and theft and handling rate have a statistically significant and negative association with COVID-19 infection rate in both April and May.
1. Introduction
Global crises (e.g., global warming, financial crisis, and pandemic) have been reshaping the world. To draw proper responses and interventions, it is of great significance to first understand how the environment and society have been fundamentally influenced by such crises. Compared to global warming or financial crisis, COVID-19 pandemic that has a short-term but significant impact on environment and society requires faster responses. Unlike the last global pandemic, the “1918 flu” that occurred one century ago, COVID-19 occurred in a highly globalized modern society in which the interactions between people, society, and environment have become extremely complex. This leads to a number of important questions as a result, including whether and how the above interactions have to be reconsidered accordingly during and after pandemic. From a sociological perspective, it is of interest to investigate how COVID-19 is changing human behavior and how this may affect the approaches of urban governance. Particularly, compared with rural areas, urban areas are worth in-depth investigations, as they are main hotspots of COVID-19 infections, also with more complex interacting systems and more intensified human activities. After the COVID-19 outbreak, a large number of emerging studies focused on the prediction of COVID-19 spread [1,2] and on identifying influential factors [3,4]. Meanwhile, the COVID-19 pandemic has greatly influenced urban environments and urban society. The large lockdown in urban areas has caused a series of chain reactions, such as the reduced air pollution [5] and the simultaneously increased housing waste [6]. Containment policies have great impact on people’s lifestyles as well [7]. The closure of public places (e.g., pubs, bars, schools) and working from home are dramatically changing people’s daily routine. Owing to stay-at-home and social distancing measures, public gatherings have dramatically dropped; meanwhile, police patrols have largely increased. According to the routine activity theory, the occurrence of crime is expectedly influenced by the change of daily routine as the result of this pandemic [8,9,10]. For instance, as people spend more time at home and less time on streets, it is likely to curb both violent crime (e.g., robbery) and property crime (e.g., burglary and thief). Moreover, as the impact of daily route activities on the occurrence of crime is likely to differ by category, the outbreak of the pandemic might have distinct effects on the occurrence of different crime categories. A number of countries, regions, or cities have reported a decline in total crimes after the outbreak of COVID-19 [8,9,10]. In recent months, a few studies found declines in some crime categories are associated with COVID-19 policies [8,9,10]. Surprisingly, in Spain and Portugal, thefts have decreased by 90.2% from the second half of March 2019 to the same period of 2020 [9]. Containment policies may also impact crime occurrence through changing human behavior. For instance, in the wake of official responses to COVID-19, mass lockdowns, and stay-at-home orders issued by state governments throughout the U.S., there has been a decline in crime [10].
Moreover, the effects of COVID-19 containment policies on crime are found to vary from one category to another [11,12,13]. For instance, in Los Angeles, there is a significant decline in the incidence of robbery, shoplifting, theft, and battery, whilst there is no significant decline in the incidence of vehicle theft, burglary, assault with a deadly weapon, intimate partner assault, and homicide [12]. Similarly, Gerell et al. [13] found that assaults, pickpocketing, and burglary in Sweden have decreased significantly, while personal robberies and narcotics crime remained unchanged during the past spreading period of COVID-19. Payne et al. [14] found social distancing regulations are temporally correlated with reductions in certain violent crimes since social distancing is likely to have significantly limited interpersonal activities, especially in locations where violence is usually prevalent. Specifically, they found that rates of common, serious, and sexual assaults had declined to their lowest level in a number of years in Queensland, Australia [14]. Particularly, some studies investigated the drop in crime cases induced by the pandemic by comparing the observed real number of crime cases with a newly predicted number from an assumed non-pandemic normal time model based on historical data [12,14]. They used time-series models to predict the number of crime cases in the scenario of no COVID-19 prevention policies [12,14]. Additionally, Felson et al. [15] investigated the impact of containment policies on burglary incidence by taking land use into account. They found that burglaries in Detroit increased in urban blocks with mixed land use but not in blocks dominated by residential land use [15].
Furthermore, some of those studies used routine activity theory to explain the impact of COVID-19 policies on crime trends. For example, commercial burglary increased during the COVID-19 lockdown because businesses were forced to close, and owners and employees were no longer present to act as capable guardians [16]. Assault may decline as there are fewer opportunities for motivated offenders and suitable targets to converge in certain locations, such as alcohol outlets (bars, pubs, etc.) or schools (fights) [16]. Similarly, Boman and Gallupe [10] offer an explanation on the contribution of COVID-19 policies to crime prevention across the United State. Since about half of crime in the U.S. is committed by young offenders, the fundamental reason why crime is down across the U.S. is probably because government-mandated lockdowns have temporarily removed the peer group as a viable means of providing available offenders [10].
Most relevant studies focused on the temporal variations in crime incidence in relation to COVID-19 incidence [8,10,11]. Those studies took no account of other socioeconomic factors affecting occurrence of crime. Although a recent study focused on spatial variations in crime trend, the influential factors fail to account for the extent of COVID-19 infection [17]. To abridge the research gaps, we investigated the spatial association of COVID-19 infection rate and crime rates after controlling for socioeconomic factors. In this study, we used the crime data and the COVID-19 data covering 3 months (March, April, and May of 2020) across the districts of London (i.e., 32 districts). Particularly, this study aimed to examine whether increase in COVID-19 cases is associated with decreased crime incidence. We speculate that increase in COVID-19 cases is likely to reduce crime rate because: (1) increasing COVID-19 cases enhance the fear of COVID-19, which could facilitate the implementation of COVID-19 containing policies according to the protection motivation theory (PMT) [18]; (2) areas with a higher infection rate are likely to be allocated with more police forces, which could curb crime incidence as well [19]. Therefore, we conducted a study to empirically validate this speculation. As a large number of previous studies uncovered that crime is spatially associated with socioeconomic factors such as poverty, unemployment, education level, and so forth [20,21,22,23,24,25], we need to examine the association of COVID-19 infection rate and crime rate over space after controlling the socioeconomic factors. Moreover, as the data we used are the areal data, spatial regression models (e.g., random effects eigenvector spatial filtering models) were deployed to investigate the spatial association between COVID-19 infection rate and crime rate. Compared with conventional spatial regression models (e.g., spatial lag model, spatial error model, and spatial Durbin model), random effects eigenvector spatial filtering models can effectively reduce model misspecification errors and increase model accuracy. Random effects eigenvector spatial filtering models have been reported to outperform all among spatial regression models in empirical studies [26,27].
2. Data and Research Methods
In this section, data on crime, COVID-19 cases, and socioeconomic factors are firstly introduced. This is then followed by how to explore the spatial association between two variables (COVID-19 infection rate and crime rate) without controlling for socioeconomic factors. Finally, this section presents how to explore their spatial association after considering socioeconomic factors. More specifically, the variables to be considered in our models and the spatial regression model devoted to the model estimation are briefly presented.
2.1. Case Study and Data
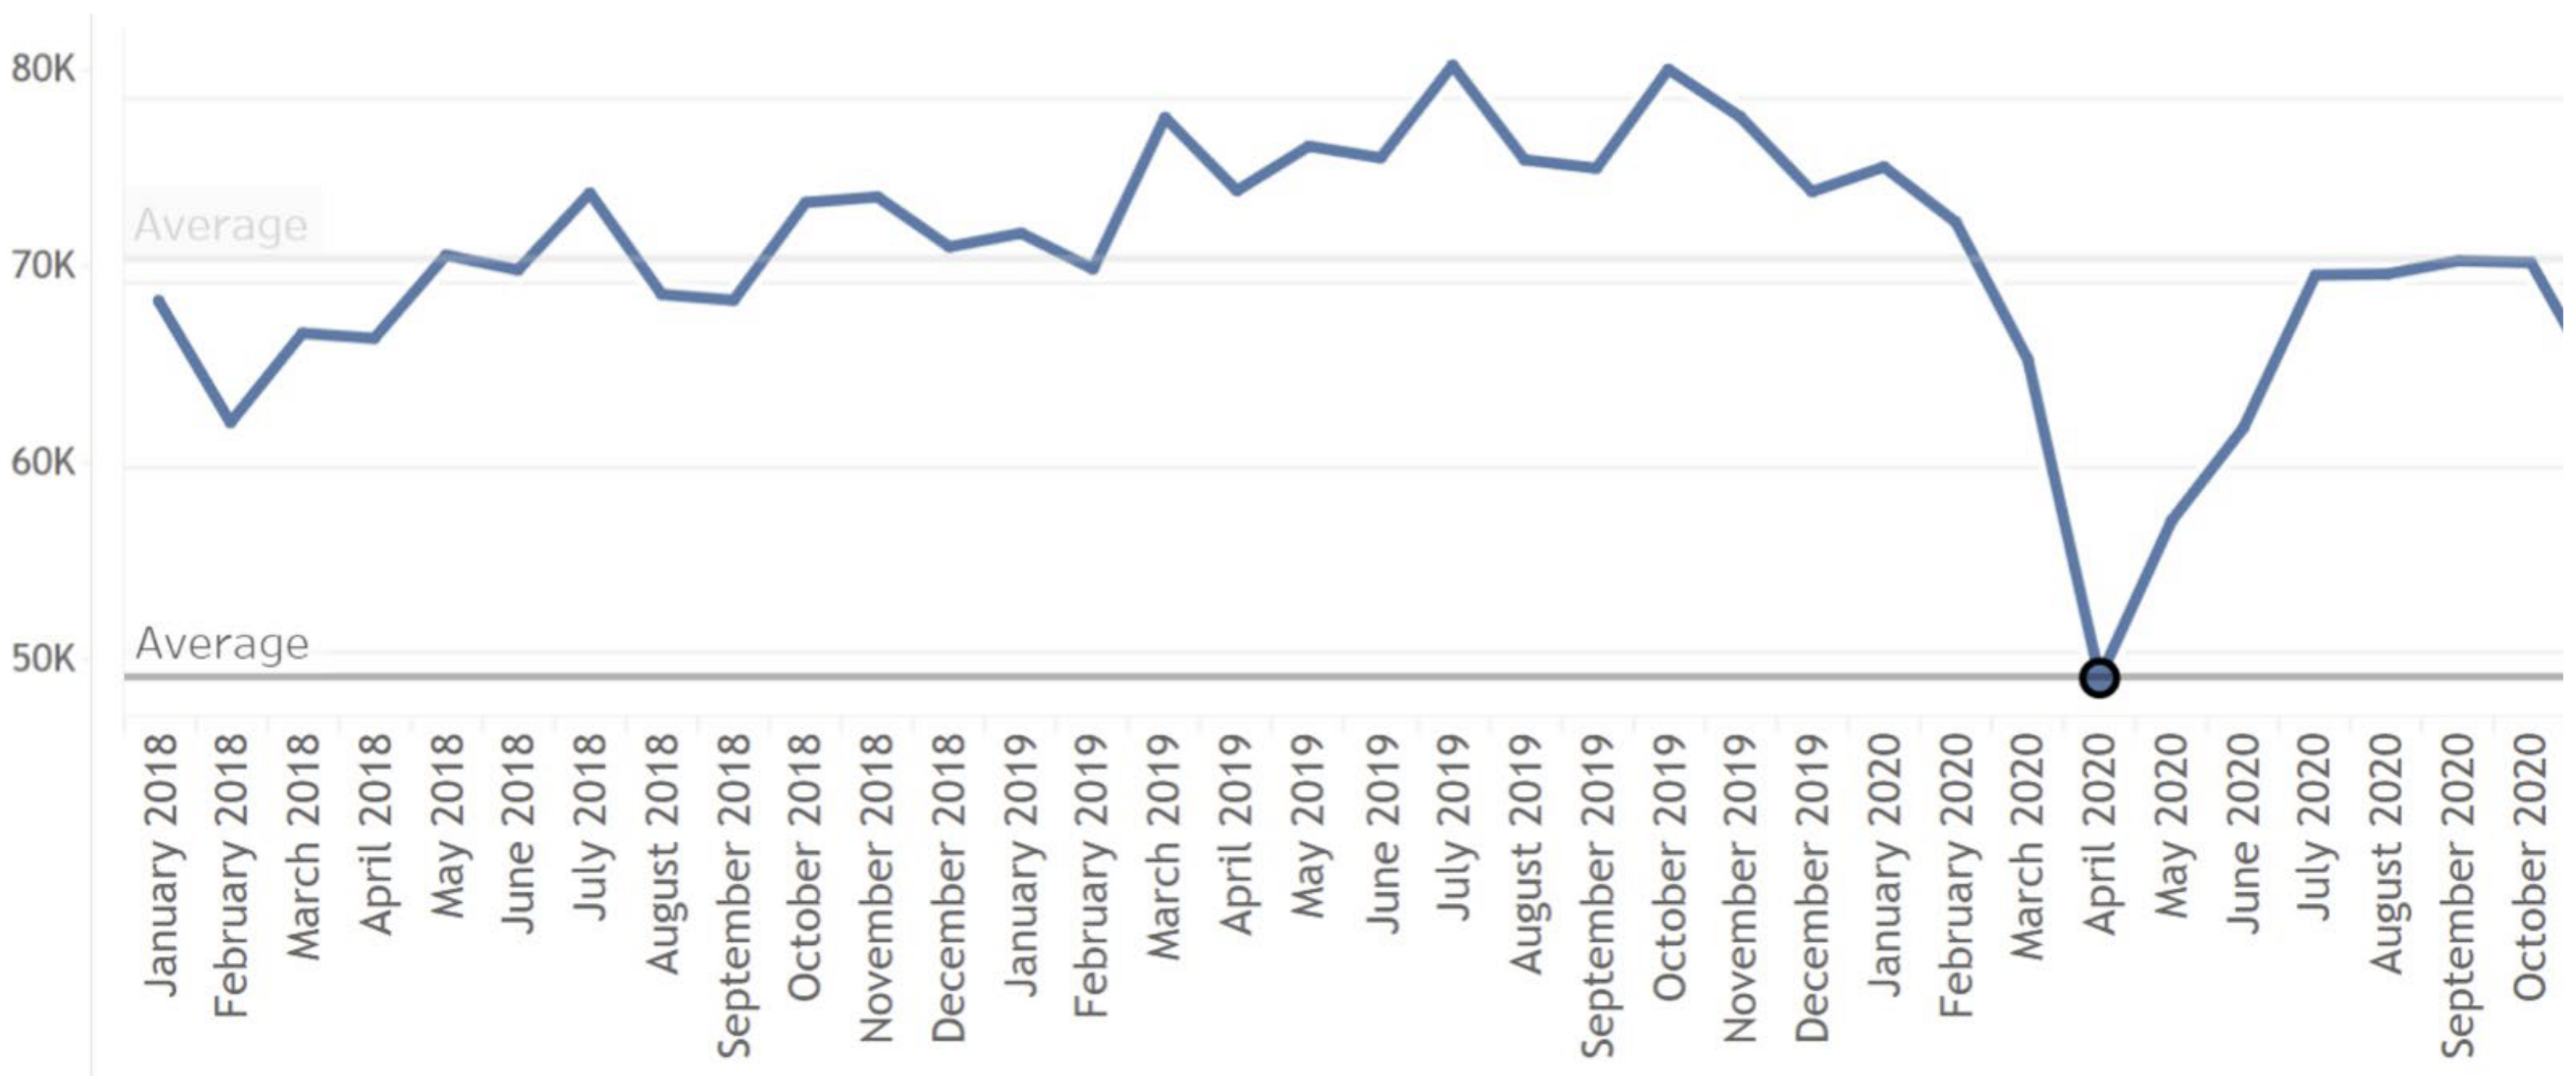
Monthly number of crime cases in London is available from the Metropolitan Police (https://www.met.police.uk/sd/stats-and-data/met/crime-data-dashboard/). We compared the monthly number of crime cases between 2020 and two previous years. Table 1 shows the monthly number of crime cases between March to August (i.e., 6 months) in 2018, 2019, and 2020. In each month, the number of crime cases decreased from 2019 to 2020 (see Table 1). Monthly number of crime cases in 2020 was smaller than that in 2018 as well. We conducted a paired t-test to compare the half year average monthly number of crime cases between the half year of 2018, 2019, and 2020. In Table 1, as the p-value of t-test was below 0.01, the half year average monthly number of crime cases in 2020 was statistically significantly lower than those in 2018 and 2019. In this study, we focused on the association of the variables of COVID-19 infection rate and crime rate across Greater London. Specifically, we took account of crimes from March to May 2020 since those three months had the smallest number of crimes in our dataset (see Figure 1). The outbreak of COVID-19 pandemic in the UK started from the end of March 2020, and the first wave of the pandemic in London was from March as well. In the meantime, the crime counts in those three months were also lower than the following months (see Figure 1). Particularly in London, April saw the smallest number of crimes with the largest number of COVID-19 cases (see Figure 1). Crime cases occurred from March to May of 2020 experienced a substantial drop in comparison with those occurred in the same period of 2019. This indicates that the decrease in city-level crime cases is likely to be associated with the increase of COVID-19 infections.
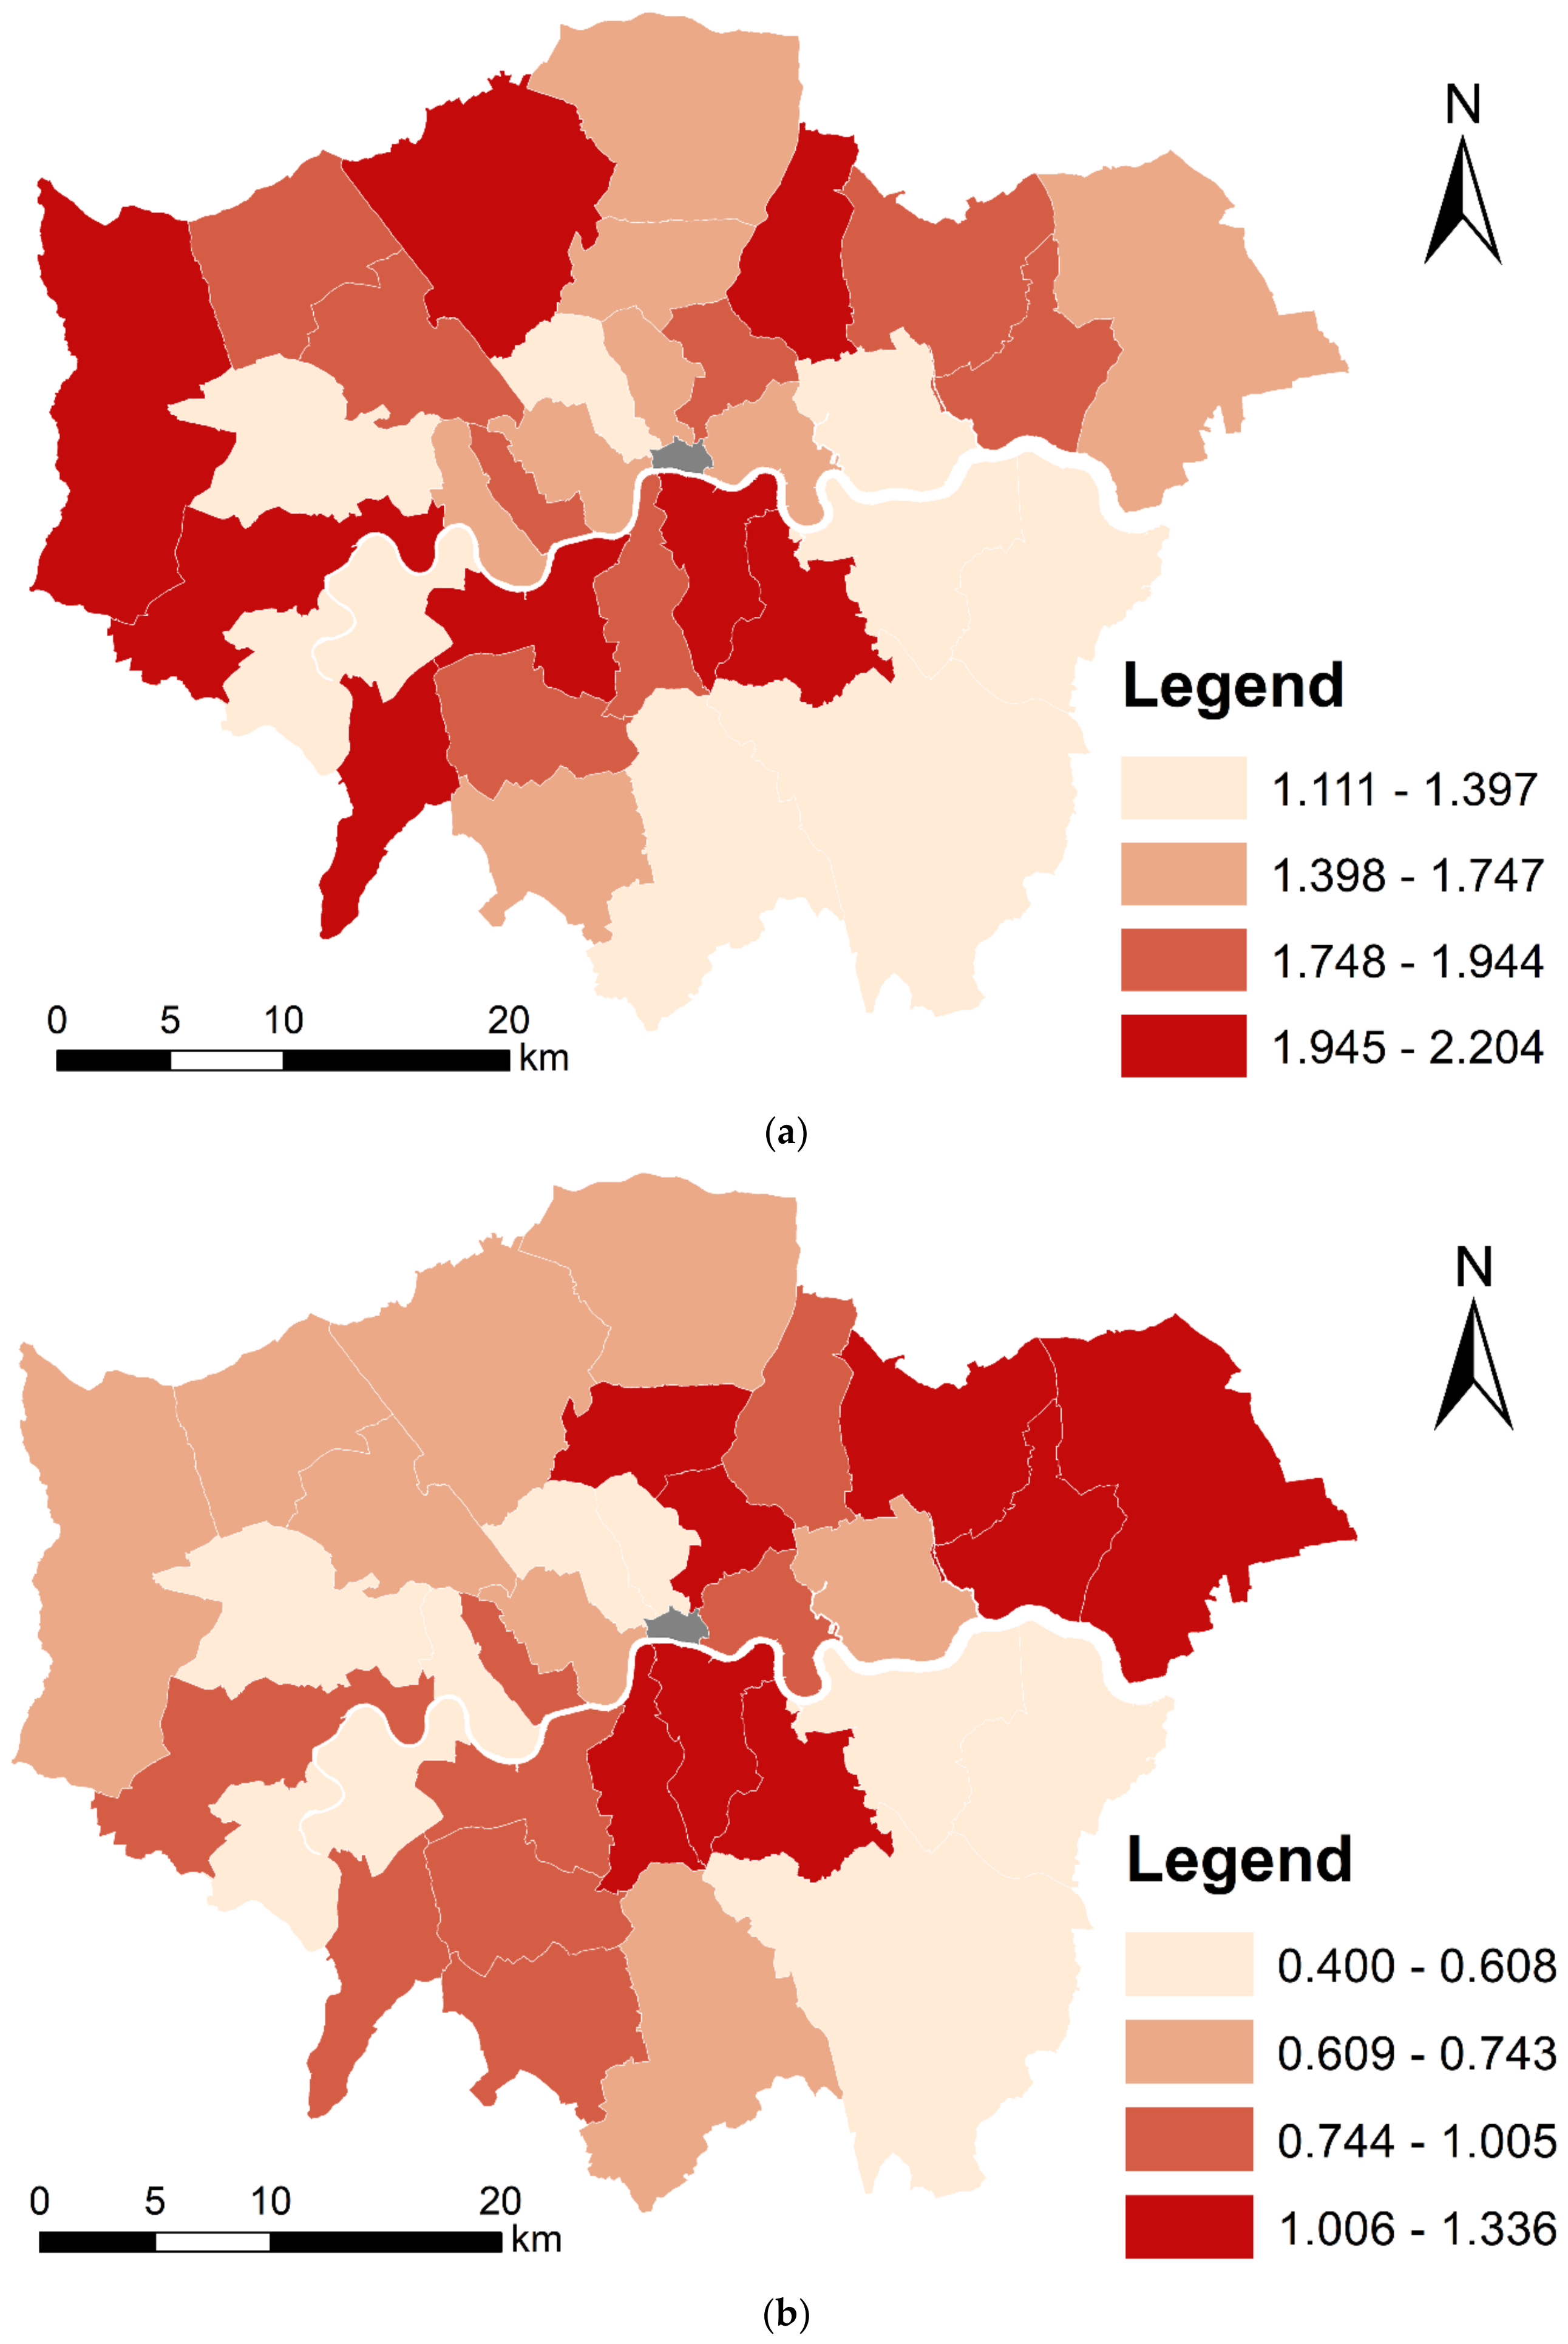
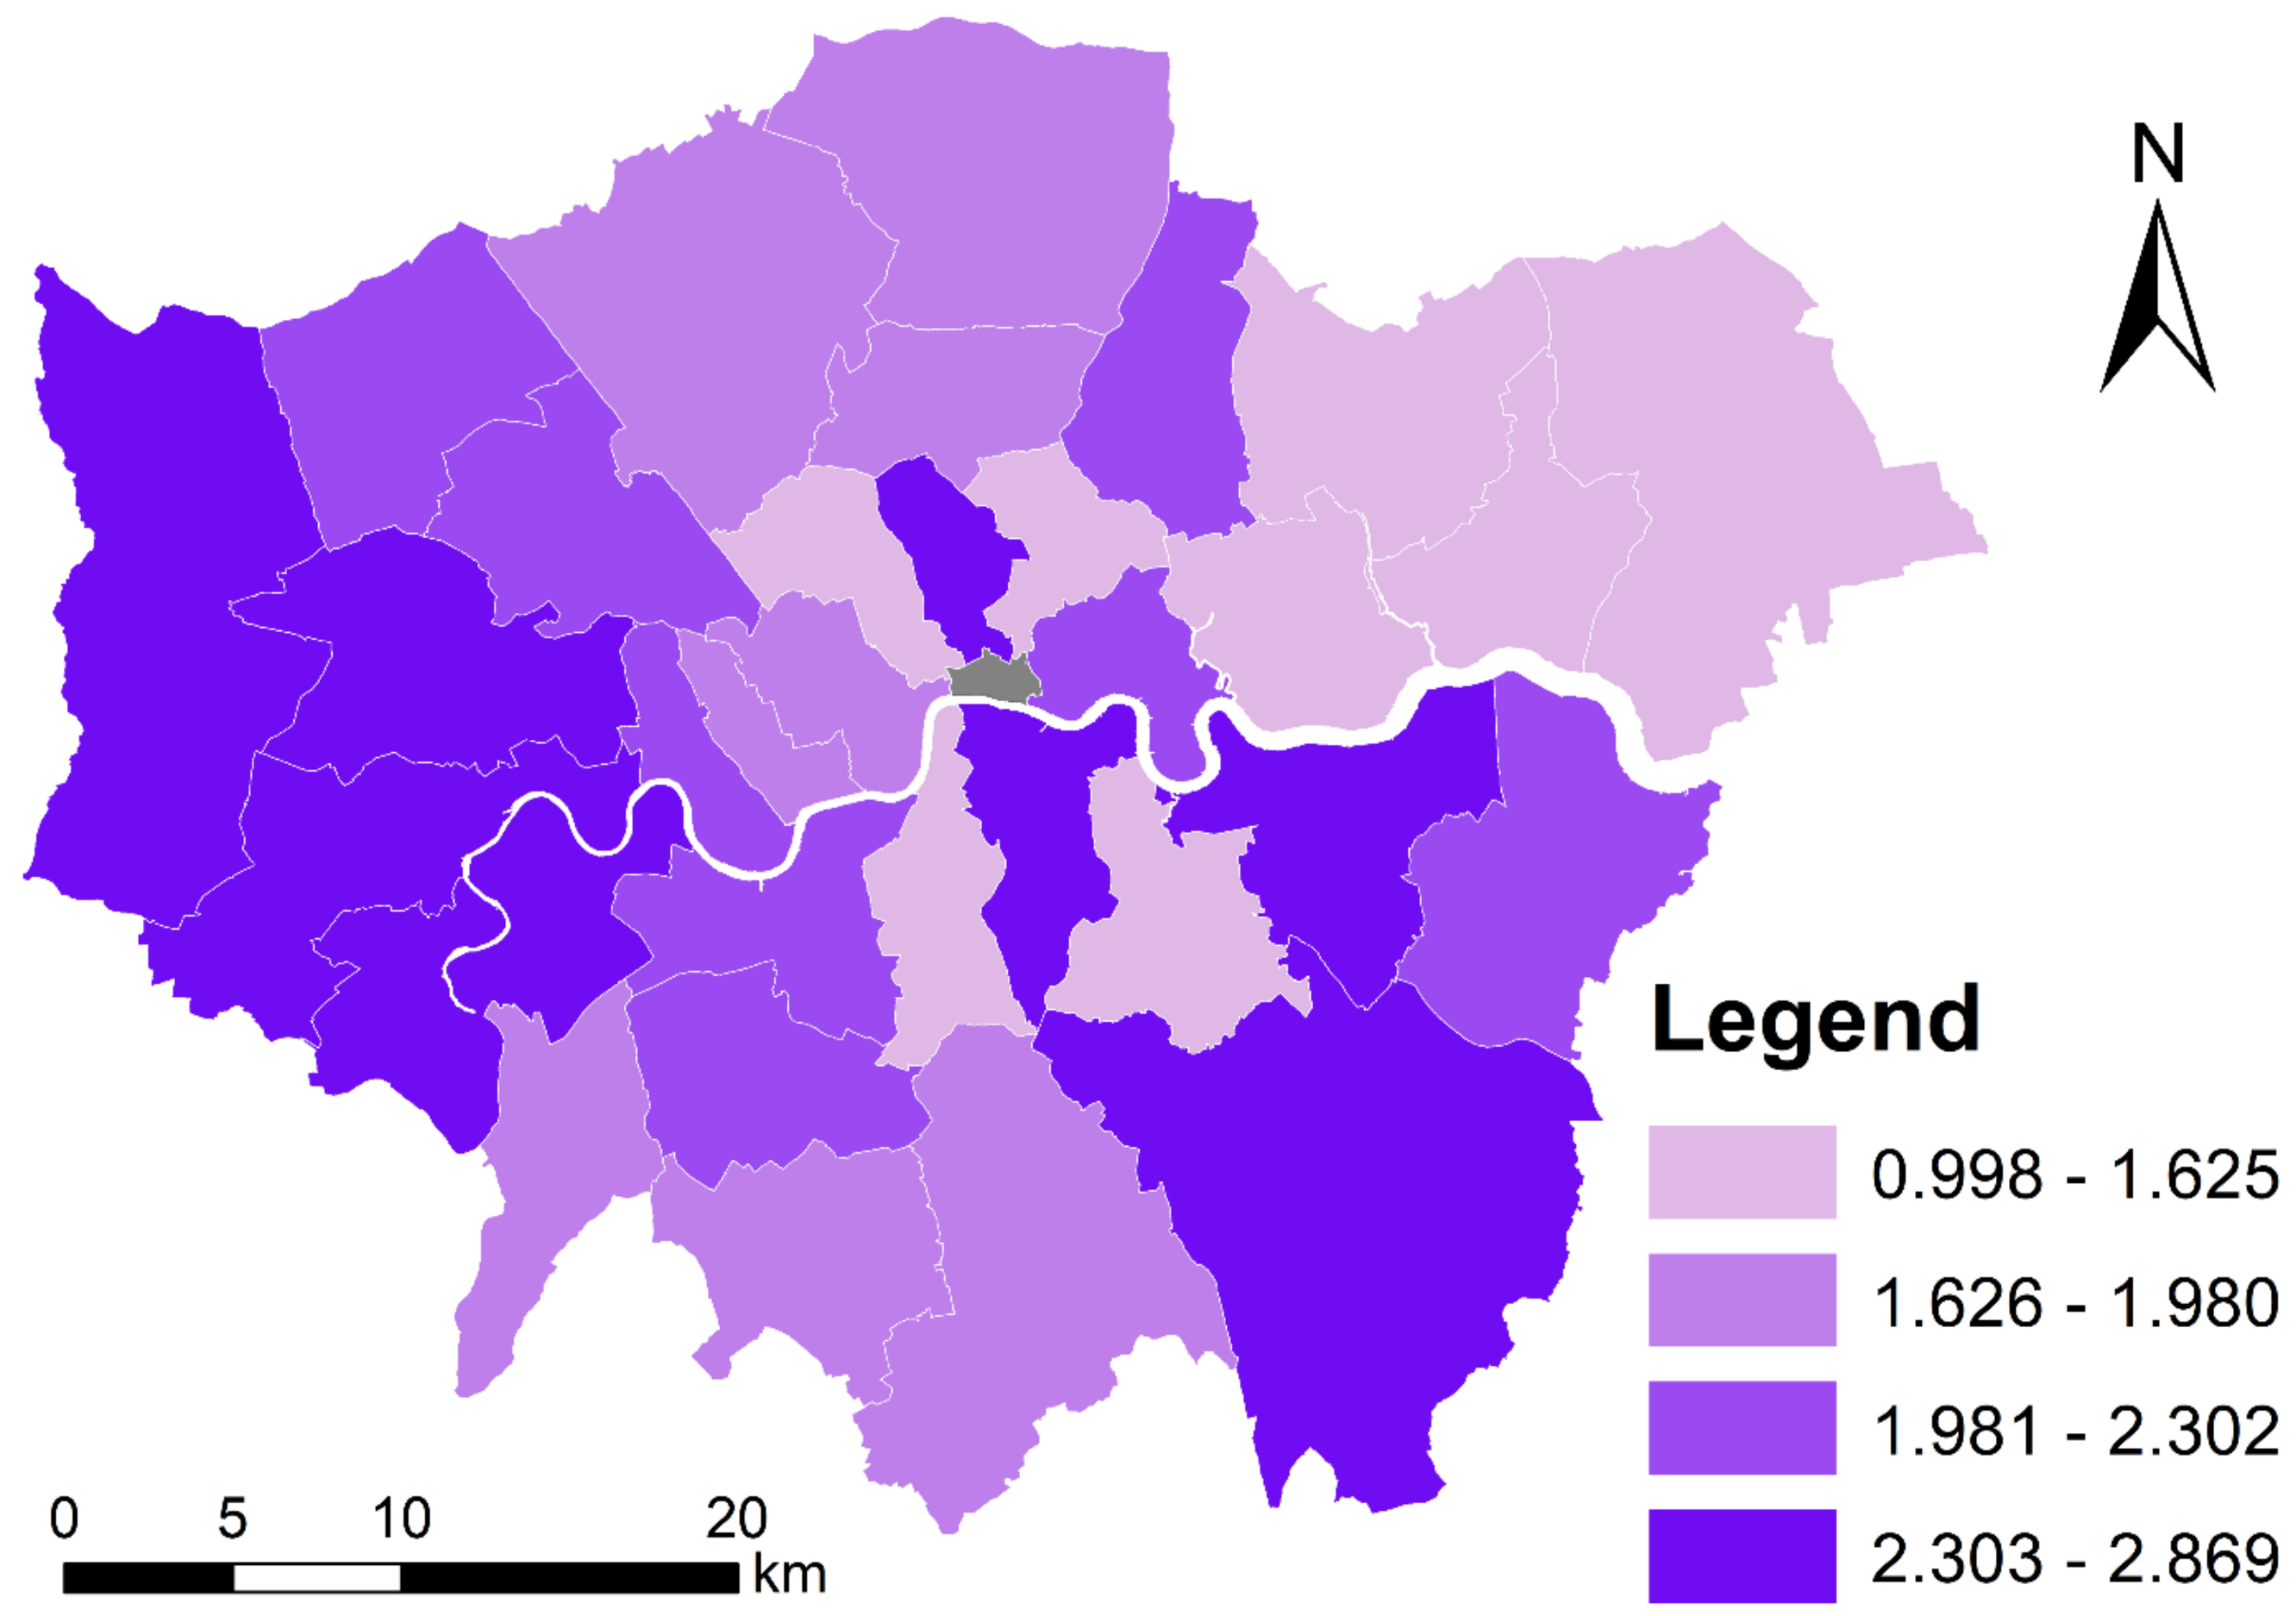
The historical crime data were downloaded from the official Datastore (https://data.london.gov.uk/dataset/recorded_crime_summary). The original crime data are available from the data.police.uk (https://data.police.uk/data/archive/). Although the original crime data are at the street level, our analysis was performed at district level. This is because the occurrence of zero crime case in some finer grained units (e.g., streets or census areas) is likely to produce biased results of analysis. Figure 2 maps district-level crime rate (per 1000 persons) across London in April 2020. It is noted that one district (City of London) is excluded in this study as it has a relatively small number of residents. The most up-to-date demographic data, including population, income, and employment data, were downloaded from the Office for National Statistics (https://www.ons.gov.uk/peoplepopulationandcommunity/populationandmigration/populationestimates/datasets/populationestimatesforukenglandandwalesscotlandandnorthernireland), the Tower Hamlets (https://www.towerhamlets.gov.uk/Documents/Borough_statistics/Income_poverty_and_welfare/income_2019_l.pdf), and the London Datastore (https://data.london.gov.uk/dataset/model-based-unemployment-estimates) respectively. COVID-19 data was downloaded from the London Datastore (https://data.london.gov.uk/dataset/coronavirus--covid-19--cases). Figure 3 maps district-level COVID-19 infection rate (cases per 1000 persons) across London in April 2020.
2.2. Spatial Clustering of Crime Rate
To explore the spatial clustering of crime rate over months, we applied univariate Moran’s I test, which is known as a measure of spatial autocorrelation. A positive Moran’s I test value means a positive spatial autocorrelation, thereby high (low) values are likely to be surrounded by high (low) values as well. A p-value is produced to indicate the statistical significance of the spatial autocorrelation.
2.3. Spatial Association of Crime Rate and COVID-19 Infection Rate
In this study, we first explored spatial association of crime rate and COVID-19 infection rate without controlling for socioeconomic factors. Specifically, we can use bivariate Moran’s I test to explore spatial association of crime rate and COVID-19 infection rate. The observed Moran’s I value is used to quantify the spatial association between two variables. Specifically, a positive association (a positive Moran’s I value) indicates high (low) values of one variable is surrounded by high (low) values of the other variable, whilst a negative association (a negative Moran’s I value) indicates high (low) values of one variable is surrounded by low (high) values of the other variable.
2.4. Modeling of Crime Rate
To further examine the association of COVID-19 infection rate and crime rate, we applied regression analysis controlling for socioeconomic factors.
2.4.1. Model Variables
In this study, we selected four crime categories as typical crime categories: violence-against-the-person, robbery, burglary, and theft and handling. They are distinct and representative types among all crime categories. Violence-against-the-person and robbery are violence-related types, whilst burglary and theft and handling are property-related types. Violence-against-the-person, robbery, and theft and handling are the most popular crime types in London. Besides, robbery is a typical violent crime which usually occurs on streets. Although some studies suggested replacing population-standardized measure with area-standardized measure due to the possible presence of ecological fallacy or modifiable areal unit problems [28], this study selected population-standardized crime rate because most of the explanatory variables are population-standardized measures (see Table 2a). The rate of new COVID-19 cases (the number of new COVID-19 cases per population) was used to represent COVID-19 infection rate. In addition to COVID-19 infection rate, socioeconomic factors were considered as the explanatory variables to be controlled (see Table 2b). The socioeconomic factors were used as confounding factors in this study. Moreover, as the observations of crime rate (i.e., VAP_R, ROB_R, BUG_R, and TH_R) are unlikely to follow a normal distribution according to Shapiro–Wilk normality test, we conducted a logarithmic transformation of those observations to reduce skewness. Therefore, we replaced crime rates (i.e., VAP_R, ROB_R, BUG_R, and TH_R) with natural logarithm of crime rates (i.e., Ln_VAP_R, Ln_ROB_R, Ln_BUG_R, and Ln_TH_R) as the explanatory variables eventually in this study (see Table 2a). In this study, each regression model was set up based on 32 observations (32 districts).
2.4.2. Model Estimation
In this study, spatial regression models were estimated to analyze crime rate based on areal data. We used the random effects eigenvector spatial filtering (RE-ESF) model to investigate the association of variables. Moran’s eigenvector-based spatial regression approach is called eigenvector spatial filtering (ESF) [29] in regional science, and ESF with a small number of eigenvectors (e.g., small L) can greatly reduce model misspecification errors and increase model accuracy [30,31]. Furthermore, a specification called random effects ESF (RE-ESF) had been recently developed to enhance model estimation because of its usefulness for spatial dependence analysis considering spatial confounding [26,32]. As a new type of spatial regression models, RE-ESF model has been recently applied to geospatial analysis [29,30].
3. Empirical Results and Discussion
We report the results of our empirical study in this section with some further discussions. Firstly, we exhibit results on exploratory spatial data analysis. Subsequently, the model estimation results and the contributions of explanatory variables are discussed. The estimates of all the models used in this study were all implemented in R. Specifically, an R package named “spmoran” was developed to implement estimates of eigenvector spatial filtering (ESF) models (https://cran.r-project.org/web/packages/spmoran/index.html). Besides, the implementations of univariate and bivariate Moran’s I tests can be performed in the open software GeoDa (https://spatial.uchicago.edu/geoda).
3.1. Spatial Clustering of Crime Rate
We calculated the univariate Moran’s I tests of rates of the four crime categories from March 2020 to May 2020. Table 3 shows the univariate Moran’s I testing results for the three months separately in which the computed Moran’s I values can be found. We implemented an inference with 999 permutations in each Moran’s I test, thereby yielding a pseudo p-value to indicate the statistical significance. As Table 3 shows, for all the three months, the spatial autocorrelation of crime rate in London was statistically significant and positive for the two crime categories (i.e., burglary and theft and handling). This indicates that spatial clustering of burglary and theft and handling cases existed during all the three months across London.
3.2. Spatial Association of Crime Rate and COVID-19 Infection Rate
Firstly, we explored the spatial association between COVID-19 infection rate and crime rate by performing bivariate Moran’s I tests. Specifically, we performed the bivariate Moran’s I tests of COVID-19 infection rate and rates of the four crime categories for the three months separately. Table 4 shows bivariate Moran’s I testing results for three months separately in which the bivariate Moran’s I values can be seen. Similarly, we implemented an inference with 999 permutations in each Moran’s I test, thereby yielding a pseudo p-value to indicate the statistical significance. As Table 4 shows, the infection-crime spatial association is statistically significant and negative for both the crime categories of burglary and theft and handling and for the two months of April and May.
3.3. Modelling of Crime Rate: Regression Model Estimation
We further examined the infection–crime correlation over space, controlling for socioeconomic factors. As one district (City of London) was excluded in this study due to a relatively small number of residents, 32 observations (32 districts) were used in the model estimation. In our regression models, the response variables are natural logarithm of violence-against-the-person rate (Ln_VAP_R), natural logarithm of robbery rate (Ln_ROB_R), natural logarithm of burglary rate (Ln_BUG_R), and natural logarithm of theft and handling rate (Ln_TH_R) respectively. The explanatory variables are Asian percent (A_P), Black percent (B_P), young people percent (YP_P), median household income (INC_M), unemployment rate (UNE_R), and rate of new COVID-19 cases (NCC_R). Specifically, we estimated models for all the four crime categories and the three months (4 categories × 3 months = 12 models).
Table 5 shows estimation results for the spatial regression models (i.e., RE-ESF models). R-squared and Akaike information criterion (AIC) were used to measure model performance. In addition, variance inflation factor (VIF) values for all the explanatory variables were below five, which indicated that no serious multicollinearity existed in the models estimated. Specifically, the RE-ESF models estimated show that (1) crime rates of the four categories had no statistically significant associations with COVID-19 infection rate in March; (2) violence-against-the-person rate had no statistically significant association with COVID-19 infection rate; and (3) robbery rate, burglary rate, and theft and handling rate were all reported to have a statistically significant and negative association with COVID-19 infection rate in both April and May. Particularly, COVID-19 infection rate was negatively associated with burglary rate and theft nad handling rate after controlling for socioeconomic factors in April and May. This is consistent with the above finding without taking account of socioeconomic factors; spatial association of COVID-19 infection rate and crime rate was statistically significant and negative for all the three crime categories (robbery, burglary, and theft and handling) and the two months (April and May) (see Section 3.1).
In addition, we found that socio-demographic factors play different roles in explaining different crime categories. Specifically, the percent of Black population exhibited a statistically significant and positive association with all the four crime categories in March and April. Median household income was found to have a statistically significant and positive association with burglary rate and theft and handling rate in March. Unemployment rate had a statistically significant and positive association with burglary rate in March.
3.4. Discussions
In this study, empirical results indicate in April and May increasing COVID-19 infection rate associated with a decline in robbery rate, burglary rate, and theft and handling rate across London. Previous studies found a decline in the incidence of crime after the implementation of COVID-19 containment policies, which is consistent with results of this study. However, this study derived some different findings with previous studies in certain specific crime categories. For instance, a study found that, in Los Angeles, there was a significant decline in the incidence of robbery, shoplifting, theft, and battery, whilst there was no significant decline in the incidence of vehicle theft, burglary, assault with a deadly weapon, intimate partner assault, and homicide [12]. However, in this study, the increase of the number of COVID-19 cases was found to be associated with the decline in the incidence of burglary. Another study found that, in Sweden, assaults, pickpocketing, and burglary decreased significantly, while personal robberies and narcotics crime were unchanged [13]. Although one of the findings of Gerell et al. [13]—the decline in the incidence of burglary—is consistent with results of this study, its other finding that personal robberies were unchanged is inconsistent with our findings.
According to routine activity theory, there are several reasons behind the discussions of COVID-19 infection rate and crime rate. First, the incidence of residential crime (e.g., burglary and theft) decreases because people have spent much more time staying at home. Second, as Boman and Gallupe [10] explained, public crime is likely to decrease because the young people who are thought be to main offenders lose the opportunity to constitute peer groups after alcohol outlets (bars, pubs, etc) and schools (fights) have been closed due to the large lockdown. Third, owning to increasing police patrols in support of COVID-19 social distancing measures, people are less likely to commit crime on streets (e.g., robbery, commercial burglary, or commercial theft). In London, stricter lockdown measures are likely applied to the districts with a higher COVID-19 infection rate, leading to an increase in stay-at-home time periods and police patrols. The longer the residents stay at home or the more the police patrols there are, the less people are likely to commit a crime (e.g., burglary, robbery, or theft). In addition, since COVID-19 began to outbreak in London since the second half of March in 2020, a lot of people failed to adapt themselves to COVID-19 containment policies (e.g., social distancing measures). Meanwhile, police patrols have not dramatically increased in the most districts of London. Therefore, COVID-19 infection rate and crime rate are found not to be associated in March across London.
4. Conclusions and Future Work
In this paper, we examined the spatial association between the two variables of COVID-19 infection rate and crime rate across Greater London. The results empirically validated the speculation that the increase in COVID-19 cases is likely to reduce local crime rate. Although the bivariate Moran’s I test results indicate that the COVID-19 infection rate appears to be positively associated with the crime rates of all the four crime categories, we found that these associations differ from one crime category to another after controlling for socioeconomic factors. Specifically, the empirical results indicate that (1) the crime rates of the four categories have no statistically significant associations with the COVID-19 infection rate in March; (2) one crime group, the violence-against-the-person rate, has no statistically significant association with the COVID-19 infection rate; and (3) the other three crime groups, to be explicit, robbery, burglary, and theft and handling rates, have a statistically significant and negative association with COVID-19 infection rate in both April and May.
There are some limitations in this study. First, this study focused mainly on exploring spatial association rather than spatiotemporal association, since local socioeconomic data are not updated on a monthly basis. Second, as the data used are aggregate data, there might exist some ecological fallacies. More specifically, the issue of modifiable areal unit (MAUP) often exists in geographical research. Results might change if areal units are changed. Third, the proposed theoretical explanations on research results and such reported associations lack a validation by realistic human mobility and behavior changes that are supposed to be induced by COVID-19 containment policies. However, this validation cannot be added at present due to the lack of necessary data on real-time human activities. Fourth, our empirical study has only worked on one city, London. Repeating similar studies in more cities across the UK and Europe will enhance the understanding of association between COVID-19 and crime in urban areas. Fifth, exiting studies lack explorations on smaller cities and cities in developing countries, as their situations may be different from the megacity London.
In the future, some further aspects could be considered. First, we would examine the association over space and time simultaneously if monthly updated socioeconomic data could be available in the near future. Second, we would attempt to investigate how COVID-19 containment policies affect human mobility and behavior, which might become measurable by using some emerging new data sources such as cell phone location data or social media data. Third, we would further attempt to examine the impact of human mobility and behavior changes on criminal behavior after the implementation of COVID-19 containment policies. Fourth, we would attempt to extend the study to more cities in the UK or Europe in support of comparative studies. Fifth, since the vast majority of developing countries do not release their spatially fine-grained crime and COVID-19 data, repeating this study and its research methods in developing countries may still be difficult at present. We would attempt to include more cases in developing countries once relevant data become available in the future.
Author Contributions
Conceptualization, Yeran Sun, Ying Huang, Ke Yuan and Yu Wang; Formal analysis, Yeran Sun and Ying Huang; Funding acquisition, Yu Wang; Investigation, Ying Huang; Methodology, Yeran Sun and Yu Wang; Resources, Ying Huang and Yu Wang; Validation, Yeran Sun and Ting On Chan; Visualization, Yeran Sun and Ting On Chan; Writing—original draft, Yeran Sun, Ying Huang and Ke Yuan; Writing—review & editing, Yeran Sun and Ting On Chan. All authors have read and agreed to the published version of the manuscript.
Funding
This work is supported by the Independent Innovation Fund of Tianjin University (Grant No.2020XRY-0010), China.
Acknowledgments
We are thankful to the anonymous reviewers for their valuable comments.
Conflicts of Interest
The authors declare no conflict of interest.
References
- Kucharski, A.J.; Russell, T.W.; Diamond, C.; Liu, Y.; Edmunds, J.; Funk, S.; Eggo, R.M.; Sun, F.; Jit, M.; Munday, J.D.; et al. Early dynamics of transmission and control of COVID-19: A mathematical modelling study. Lancet Infect. Dis. 2020, 20, 553–558. [Google Scholar] [CrossRef] [Green Version]
- Giordano, G.; Blanchini, F.; Bruno, R.; Colaneri, P.; Di Filippo, A.; Di Matteo, A.; Colaneri, M. Modelling the COVID-19 epidemic and implementation of population-wide interventions in Italy. Nat. Med. 2020, 26, 855–860. [Google Scholar] [CrossRef] [PubMed]
- Zhang, C.H.; Schwartz, G.G. Spatial disparities in coronavirus incidence and mortality in the United States: An ecological analysis as of May 2020. J. Rural Health 2020, 36, 433–445. [Google Scholar] [CrossRef] [PubMed]
- Hu, T.; Yue, H.; Wang, C.; She, B.; Ye, X.; Liu, R.; Zhu, X.; Guan, W.W.; Bao, S. Racial Segregation, Testing Site Access, and COVID-19 Incidence Rate in Massachusetts, USA. Int. J. Environ. Res. Public Health 2020, 17, 9528. [Google Scholar] [CrossRef]
- Muhammad, S.; Long, X.; Salman, M. COVID-19 pandemic and environmental pollution: A blessing in disguise? Sci. Total Environ. 2020, 728, 138820. [Google Scholar] [CrossRef]
- Zambrano-Monserrate, M.A.; Ruano, M.A.; Sanchez-Alcalde, L. Indirect effects of COVID-19 on the environment. Sci. Total Environ. 2020, 728, 138813. [Google Scholar] [CrossRef]
- Pietrobelli, A.; Pecoraro, L.; Ferruzzi, A.; Heo, M.; Faith, M.; Zoller, T.; Antoniazzi, F.; Piacentini, G.; Fearnbach, S.N.; Heymsfield, S.B. Effects of COVID-19 lockdown on lifestyle behaviors in children with obesity living in Verona, Italy: A longitudinal study. Obesity 2020, 28, 1382–1385. [Google Scholar] [CrossRef]
- Ashby, M.P. Initial evidence on the relationship between the coronavirus pandemic and crime in the United States. Crime Sci. 2020, 9, 1–16. [Google Scholar] [CrossRef]
- Redondo, S.; Gonçalves, R.A.; Nistal, J.; Soler, C.; Moreira, J.S.; Andrade, J.; Andrés-Pueyo, A. Corrections and Crime in Spain and Portugal during the Covid-19 Pandemic: Impact, Prevention and Lessons for the Future. Vict. Offenders 2020, 1–30. [Google Scholar] [CrossRef]
- Boman, J.H.; Gallupe, O. Has COVID-19 changed crime? Crime rates in the United States during the pandemic. Am. J. Crim. Justice 2020, 45, 537–545. [Google Scholar] [CrossRef]
- Mohler, G.; Bertozzi, A.L.; Carter, J.; Short, M.B.; Sledge, D.; Tita, G.E.; Uchida, C.D.; Brantingham, P.J. Impact of social distancing during COVID-19 pandemic on crime in Los Angeles and Indianapolis. J. Crim. Justice 2020, 68, 101692. [Google Scholar] [CrossRef] [PubMed]
- Campedelli, G.M.; Aziani, A.; Favarin, S. Exploring the Immediate Effects of COVID-19 Containment Policies on Crime: An Empirical Analysis of the Short-Term Aftermath in Los Angeles. Am. J. Crim. Justice 2020, 1–24. [Google Scholar] [CrossRef] [PubMed]
- Gerell, M.; Kardell, J.; Kindgren, J. Minor covid-19 association with crime in Sweden. Crime Sci. 2020, 9, 1–9. [Google Scholar] [CrossRef] [PubMed]
- Payne, J.; Morgan, A.; Piquero, A.R. COVID19 and Social Distancing Measures in Queensland Australia are Associated with Short-Term Decreases in Recorded Violent Crime. J. Exp. Criminol. 2020, 1–25. [Google Scholar] [CrossRef]
- Felson, M.; Jiang, S.; Xu, Y. Routine activity effects of the Covid-19 pandemic on burglary in Detroit, March, 2020. Crime Sci. 2020, 9, 10. [Google Scholar] [CrossRef]
- Hodgkinson, T.; Andresen, M.A. Show me a man or a woman alone and I’ll show you a saint: Changes in the frequency of criminal incidents during the COVID-19 pandemic. J. Crim. Justice 2020, 69, 101706. [Google Scholar] [CrossRef]
- Campedelli, G.M.; Favarin, S.; Aziani, A.; Piquero, A.R. Disentangling community-level changes in crime trends during the COVID-19 pandemic in Chicago. Crime Sci. 2020, 9, 21. [Google Scholar] [CrossRef]
- Adunlin, G.; Adedoyin, A.C.A.; Adedoyin, O.O.; Njoku, A.; Bolade-Ogunfodun, Y.; Bolaji, B. Using the protection motivation theory to examine the effects of fear arousal on the practice of social distancing during the COVID-19 outbreak in rural areas. J. Hum. Behav. Soc. Environ. 2020, 1–5. [Google Scholar] [CrossRef]
- Klick, J.; Tabarrok, A. Using terror alert levels to estimate the effect of police on crime. J. Law Econ. 2020, 48, 267–279. [Google Scholar] [CrossRef] [Green Version]
- Loukaitou-Sideris, A. Hot spots of bus stop crime: The importance of environmental attributes. J. Am. Plan. Assoc. 1999, 65, 395–411. [Google Scholar] [CrossRef]
- Sherman, L.; Gartin, P.; Burger, M. Hot spots of predatory crime: Routine activities and the criminology of place. Criminology 1989, 27, 27–55. [Google Scholar] [CrossRef]
- Weisburd, D.; Bushway, S.; Lum, C.; Yang, S.M. Trajectories of crime at places: A longitudinal study of street segments in the city of Seattle. Criminology 2004, 42, 283–321. [Google Scholar] [CrossRef]
- Uittenbogaard, A.C.; Ceccato, V. Space–time clusters of crime in Stockholm, Sweden. Rev. Eur. Stud. 2012, 4, 148–156. [Google Scholar] [CrossRef]
- Helbich, M.; Arsanjani, J.J. Spatial eigenvector filtering for spatiotemporal crime mapping and spatial crime analysis. Cartogr. Geogr. Inf. Sci. 2014, 42, 134–148. [Google Scholar] [CrossRef]
- Pope, M.; Song, W. Spatial Relationship and Colocation of Crimes in Jefferson County, Kentucky. Appl. Geogr. 2015, 1, 243–250. [Google Scholar] [CrossRef]
- Murakami, D.; Griffith, D.A. Random effects specifications in eigenvector spatial filtering: A simulation study. J. Geogr. Syst. 2015, 17, 311–331. [Google Scholar] [CrossRef]
- Sun, Y.; Hu, X.; Huang, Y.; On Chan, T. Spatial Patterns of Childhood Obesity Prevalence in Relation to Socioeconomic Factors across England. ISPRS Int. J. Geoinf. 2020, 9, 599. [Google Scholar]
- Sohn, D. Residential crimes and neighbourhood built environment: Assessing the effectiveness of crime prevention through environmental design (CPTED). Cities 2016, 52, 86–93. [Google Scholar] [CrossRef]
- Griffith, D.A. Spatial Autocorrelation and Spatial Filtering: Gaining Understanding through Theory and Scientific Visualization; Springer Science & Business Media: Berlin/Heidelberg, Germany, 2003. [Google Scholar]
- Tiefelsdorf, M.; Griffith, D.A. Semiparametric filtering of spatial autocorrelation: The eigenvector approach. Environ. Plan. A 2007, 39, 1193–1221. [Google Scholar] [CrossRef]
- Murakami, D.; Griffith, D.A. Eigenvector spatial filtering for large data sets: Fixed and random effects approaches. Geogr. Anal. 2019, 51, 23–49. [Google Scholar] [CrossRef] [Green Version]
- Chun, Y.; Griffith, D.A.; Lee, M.; Sinha, P. Eigenvector Selection with Stepwise Regression Techniques to Construct Eigenvector Spatial Filters. J. Geogr. Syst. 2016, 18, 67–85. [Google Scholar] [CrossRef]
Figure 1.
Monthly crime counts in London from January 2018 to October 2020 (source: Metropolitan Police).
Figure 1.
Monthly crime counts in London from January 2018 to October 2020 (source: Metropolitan Police).

Figure 2.
District-level crime rates (cases per 1000 persons) across London in April 2020. (a) Violence-against-the-person rate (values grouped into quantiles); (b)Theft and handling rate (values grouped into quantiles)
Figure 2.
District-level crime rates (cases per 1000 persons) across London in April 2020. (a) Violence-against-the-person rate (values grouped into quantiles); (b)Theft and handling rate (values grouped into quantiles)

Figure 3.
District-level COVID-19 infection rates (cases per 1000 persons) across London in April 2020 (Note: values grouped into quantiles).
Figure 3.
District-level COVID-19 infection rates (cases per 1000 persons) across London in April 2020 (Note: values grouped into quantiles).


Table 1.
Paired t-test of COVID-19 infection rate and crime rate for three months.
| Crime Cases | March | April | May | June | July | August | Mean |
|---|---|---|---|---|---|---|---|
| 2018 | 67,232 | 66,953 | 71,461 | 70,653 | 74,819 | 69,332 | 70,075 |
| 2019 | 78,906 | 74,947 | 77,354 | 76,721 | 81,740 | 76,618 | 77,714.3 |
| 2020 | 65,819 | 48,570 | 57,083 | 62,112 | 70,377 | 71,156 | 62,519.5 |
| t-test | 2018 vs. 2020 0.031 * | ||||||
| p-value | 2019 vs. 2020 0.002 ** | ||||||
Note: Significance codes: ‘**’ 0.01; ‘*’ 0.05.
Table 2.
Introduction and descriptive statistics of variables considered in this study. (a) Response variables; (b) Explanatory variables.
Table 2.
Introduction and descriptive statistics of variables considered in this study. (a) Response variables; (b) Explanatory variables.
| (a) | |||||||
| Variables | Full Names | March 2020 | April 2020 | May 2020 | |||
| Mean | SD | Mean | SD | Mean | SD | ||
| VAP_R | Violence-against-the-person rate (cases per 1000 persons) | 1.96 | 0.4 | 1.71 | 0.29 | 1.98 | 0.36 |
| ROB_R | Robbery rate (cases per 1000 persons) | 0.3 | 0.18 | 0.12 | 0.06 | 0.15 | 0.06 |
| BUG_R | Burglary rate (cases per 1000 persons) | 0.6 | 0.17 | 0.41 | 0.13 | 0.43 | 0.13 |
| TH_R | Theft and handling rate (cases per 1000 persons) | 1.71 | 1.44 | 0.82 | 0.25 | 1.01 | 0.3 |
| (b) | |||||||
| Variables | Full Names | Time | Mean | SD | |||
| A_P | Asian percent | 2018 | 17.82 | 12.39 | |||
| B_P | Black percent | 2018 | 11.35 | 6.18 | |||
| YP_P | Young people percent | 2019 | 10.93 | 1.05 | |||
| INC_M | Median household income (1000£) | 2019 | 31.38 | 4.98 | |||
| UNE_R | Unemployment rate (1000 persons/hectare) | 2019 | 4.57 | 0.75 | |||
| NCC_R | Rate of new COVID-19 cases (cases per 1000 persons) | March 2020 | 1.12 | 0.3 | |||
| April 2020 | 1.98 | 0.47 | |||||
| May 2020 | 0.49 | 0.18 | |||||
Table 3.
Univariate Moran’s I test of crime rate for three months. (a) March 2020 (N = 32); (b) April 2020 (N = 32); (c) May 2020 (N = 32).
Table 3.
Univariate Moran’s I test of crime rate for three months. (a) March 2020 (N = 32); (b) April 2020 (N = 32); (c) May 2020 (N = 32).
| (a) | ||||
| Moran’s I | VAP_R | ROB_R | BUG_R | TH_R |
| Value | 0.012 | 0.120 . | 0.180 * | 0.301 ** |
| (b) | ||||
| Moran’s I | VAP_R | ROB_R | BUG_R | TH_R |
| Value | −0.063 | −0.055 | 0.306 ** | 0.288 * |
| (c) | ||||
| Moran’s I | VAP_R | ROB_R | BUG_R | TH_R |
| Value | 0.001 | −0.177 | 0.313 ** | 0.358 ** |
Note: Significance codes: ‘***’ 0.001; ‘**’ 0.01; ‘*’ 0.05; ‘.’ 0.1.
Table 4.
Bivariate Moran’s I test of COVID-19 infection rate and crime rate for three months. (a) March 2020 (N = 32); (b) April 2020 (N = 32); (c) May 2020 (N = 32).
Table 4.
Bivariate Moran’s I test of COVID-19 infection rate and crime rate for three months. (a) March 2020 (N = 32); (b) April 2020 (N = 32); (c) May 2020 (N = 32).
| (a) | ||||
| Moran’s I | VAP_R | ROB_R | BUG_R | TH_R |
| NCC_R | 0.043 | 0.025 | −0.008 | −0.029 |
| (b) | ||||
| Moran’s I | VAP_R | ROB_R | BUG_R | TH_R |
| NCC_R | 0.002 | −0.101 | −0.174 * | −0.278 ** |
| (c) | ||||
| Moran’s I | VAP_R | ROB_R | BUG_R | TH_R |
| NCC_R | −0.058 | 0.003 | −0.245 * | −0.301 ** |
Note: Significance codes: ‘***’ 0.001; ‘**’ 0.01; ‘*’ 0.05; ‘.’ 0.1.
Table 5.
Estimation results for the regression models. (a) Dependent variable: Ln_VAP_R; (b) Dependent variable: Ln_ROB_R; (c) Dependent variable: Ln_BUG_R; (d) Dependent variable: Ln_TH_R.
Table 5.
Estimation results for the regression models. (a) Dependent variable: Ln_VAP_R; (b) Dependent variable: Ln_ROB_R; (c) Dependent variable: Ln_BUG_R; (d) Dependent variable: Ln_TH_R.
| (a) | |||
| Independent Variables | Coefficient | ||
| March | April | May | |
| Intercept | −0.036 | 0.595 | 0.127 |
| A_P | 0.003 | 0.002 | 0.001 |
| B_P | 0.016 | 0.012 * | 0.012 |
| YP_P | 0.001 | −0.015 | 0.015 |
| INC_M | 0.006 | −0.009 | −0.002 |
| UNE_R | 0.098 . | 0.077 . | 0.076 |
| NCC_R | −0.159 | −0.074 | −0.167 |
| Adjusted R-squared | 0.356 | 0.564 | 0.499 |
| AIC | 31.925 | 15.024 | 20.925 |
| (b) | |||
| Independent Variables | Coefficient | ||
| March | April | May | |
| Intercept | −3.981 . | 0.696 | −3.023 . |
| A_P | 0.015 . | 0.014 . | 0.006 |
| B_P | 0.054 * | 0.052 * | 0.027 |
| YP_P | −0.016 | −0.155 | 0.095 |
| INC_M | 0.055 . | −0.024 | 0.012 |
| UNE_R | 0.112 | −0.025 | −0.037 |
| NCC_R | −0.257 | −0.640 ** | −1.328 ** |
| Adjusted R-squared | 0.604 | 0.637 | 0.456 |
| AIC | 75.273 | 77.159 | 65.081 |
| (c) | |||
| Independent Variables | Coefficient | ||
| March | April | May | |
| Intercept | −3.800 *** | −0.756 | 0.193 |
| A_P | −0.001 | 0.003 | 0.001 |
| B_P | 0.017 * | 0.027 * | 0.006 |
| YP_P | 0.050 | −0.057 | −0.053 |
| INC_M | 0.057 *** | 0.017 | 0.000 |
| UNE_R | 0.177 ** | 0.044 | 0.004 |
| NCC_R | −0.040 | −0.351 ** | −1.217 *** |
| Adjusted R-squared | 0.672 | 0.538 | 0.837 |
| AIC | 23.120 | 47.928 | 26.563 |
| (d) | |||
| Independent Variables | Coefficient | ||
| March | April | May | |
| Intercept | −1.110 | −0.617 | 0.467 |
| A_P | 0.011 | 0.007 | 0.0004 |
| B_P | 0.039 . | 0.024 * | 0.005 |
| YP_P | −0.083 | −0.025 | −0.018 |
| INC_M | 0.067 * | 0.019 | 0.002 |
| UNE_R | 0.049 | 0.066 | 0.011 |
| NCC_R | −0.518 | −0.334 *** | −1.011 *** |
| Adjusted R-squared | 0.434 | 0.551 | 0.739 |
| AIC | 77.905 | 43.516 | 31.165 |
Significance codes: ‘***’ 0.001; ‘**’ 0.01; ‘*’ 0.05; ‘.’ 0.1.
Publisher’s Note: MDPI stays neutral with regard to jurisdictional claims in published maps and institutional affiliations. |
© 2021 by the authors. Licensee MDPI, Basel, Switzerland. This article is an open access article distributed under the terms and conditions of the Creative Commons Attribution (CC BY) license (http://creativecommons.org/licenses/by/4.0/).
Share and Cite
MDPI and ACS Style
Sun, Y.; Huang, Y.; Yuan, K.; Chan, T.O.; Wang, Y. Spatial Patterns of COVID-19 Incidence in Relation to Crime Rate Across London. ISPRS Int. J. Geo-Inf. 2021, 10, 53. https://0-doi-org.brum.beds.ac.uk/10.3390/ijgi10020053
AMA Style
Sun Y, Huang Y, Yuan K, Chan TO, Wang Y. Spatial Patterns of COVID-19 Incidence in Relation to Crime Rate Across London. ISPRS International Journal of Geo-Information. 2021; 10(2):53. https://0-doi-org.brum.beds.ac.uk/10.3390/ijgi10020053
Chicago/Turabian StyleSun, Yeran, Ying Huang, Ke Yuan, Ting On Chan, and Yu Wang. 2021. "Spatial Patterns of COVID-19 Incidence in Relation to Crime Rate Across London" ISPRS International Journal of Geo-Information 10, no. 2: 53. https://0-doi-org.brum.beds.ac.uk/10.3390/ijgi10020053
Note that from the first issue of 2016, this journal uses article numbers instead of page numbers. See further details here.