
A Perception Model for Optimizing and Evaluating Evacuation Guidance Systems

1
Aerospace Information Research Institute, Chinese Academy of Sciences, Beijing 100094, China
2
University of Chinese Academy of Sciences, Beijing 100049, China
3
Zhejiang-CAS Application Center for Geoinformatics, Jiaxing 314199, China
*
Author to whom correspondence should be addressed.
ISPRS Int. J. Geo-Inf. 2021, 10(2), 54; https://0-doi-org.brum.beds.ac.uk/10.3390/ijgi10020054
Submission received: 5 December 2020
/
Revised: 19 January 2021
/
Accepted: 25 January 2021
/
Published: 28 January 2021
(This article belongs to the Special Issue Geospatial Methods in Social and Behavioral Sciences)
Abstract
:To overcome the difficulties of quantitatively optimizing and evaluating evacuation guidance systems, we proposed a perception model based on virtual reality (VR) experiments and the social force model (SFM). We used VR and eye tracking devices to carry out experiments. The VR experiment data was mainly used for three purposes: to determine the parameter values of the perception model, to optimize the evacuation guidance system by quantitative analysis, and to validate the perception model. Additionally, we compared the VR experimental and model simulation results before and after the optimization to quantitatively assess the improvement in the optimized evacuation guidance system. The results showed that our model can effectively simulate the perception behaviors of evacuees on the evacuation guidance system and it can quantitatively evaluate different evacuation guidance system schemes. The model simulations showed that the optimized evacuation guidance system improved the evacuation efficiency, with the average escape time and distance of the two starting positions reduced by 37% and 28%, respectively.
1. Introduction
An evacuation guidance system is a guidance system that can provide road and exit information for evacuees during public emergencies [1,2]. The types of scenarios and emergencies [3], sign designs [4], and layouts [5] are important factors affecting the effectiveness of human evacuation behavior. The reasonable design of evacuation guidance systems can improve evacuation efficiency and reduce the risk of casualties and property losses [2,6]. Consequently, the evaluation and optimization of evacuation guidance systems is important for improving evacuation efficiency [3,5].
Some researchers have used wireless sensor networks to modify static guidance systems into dynamic intelligent systems [4,7]. These intelligent guidance systems can adjust the directions of signs to show the current safest path. Some researchers have used questionnaire surveys to explore the influence of sign information on the guidance effect of the system [8] and evacuees’ perception and acceptance of it [9]. Many scholars have used experimental methods, including real and virtual reality (VR) experiments, to deliberate the effectiveness of evacuation guidance systems. Real experiments must be conducted in real scenarios to observe the influence of environmental factors, such as smoke and light [10], on path finding. However, real evacuation experiments have high risk and low repeatability, making them difficult to implement in large application scenarios. Virtual reality experiments can solve these problems. With the vigorous development of the VR industry, many scholars have used VR devices to carry out escape experiments to study the influence of the location [1,11], color [12], and layout [13] of an evacuation guidance system on its guidance effect. In recent years, an increasing number of many scholars have employed crowd simulations, including agent-based models [2,14,15], cellular automata (CA) [16], building information models (BIMs) [5,6,17,18], particle swarm optimization (PSO) [19,20], genetic-algorithm-based model [6], and other models [21,22], to explore evacuation guidance systems.
The social force model (SFM) is a classic emergency evacuation model [23] that can effectively simulate social behavior with psychological attributes, such as panic. The existing research related to the SFM mainly focuses on qualitatively studying the influence of sign locations, colors, and text on the movement direction, speed, and evacuation efficiency [2,14]. Quantifying the interactions between evacuation signs and evacuees is a very important premise for evaluating and optimizing evacuation guidance systems. Unfortunately, few studies have done this. Khaled Nassar used the SFM to model pedestrian movement and collected the data on sign visibility and legibility to determine the optimal locations for the placement of signs [15]. However, the model parameters were artificially specified.
This study aimed to propose a perception model that can be used in practice instead of VR experiments, to optimize and evaluate evacuation guidance systems. First, the VR equipment and the eye tracker were used to conduct VR evacuation experiments. Second, based on the VR experimental data, the parameters of the perception model were determined, the evacuation guidance system was optimized, and the perception model was validated. Finally, the optimized evacuation guidance system was quantitatively evaluated by model simulations.
2. Data and Methods
2.1. Framework for Optimizing and Evaluating Evacuation Guidance Systems
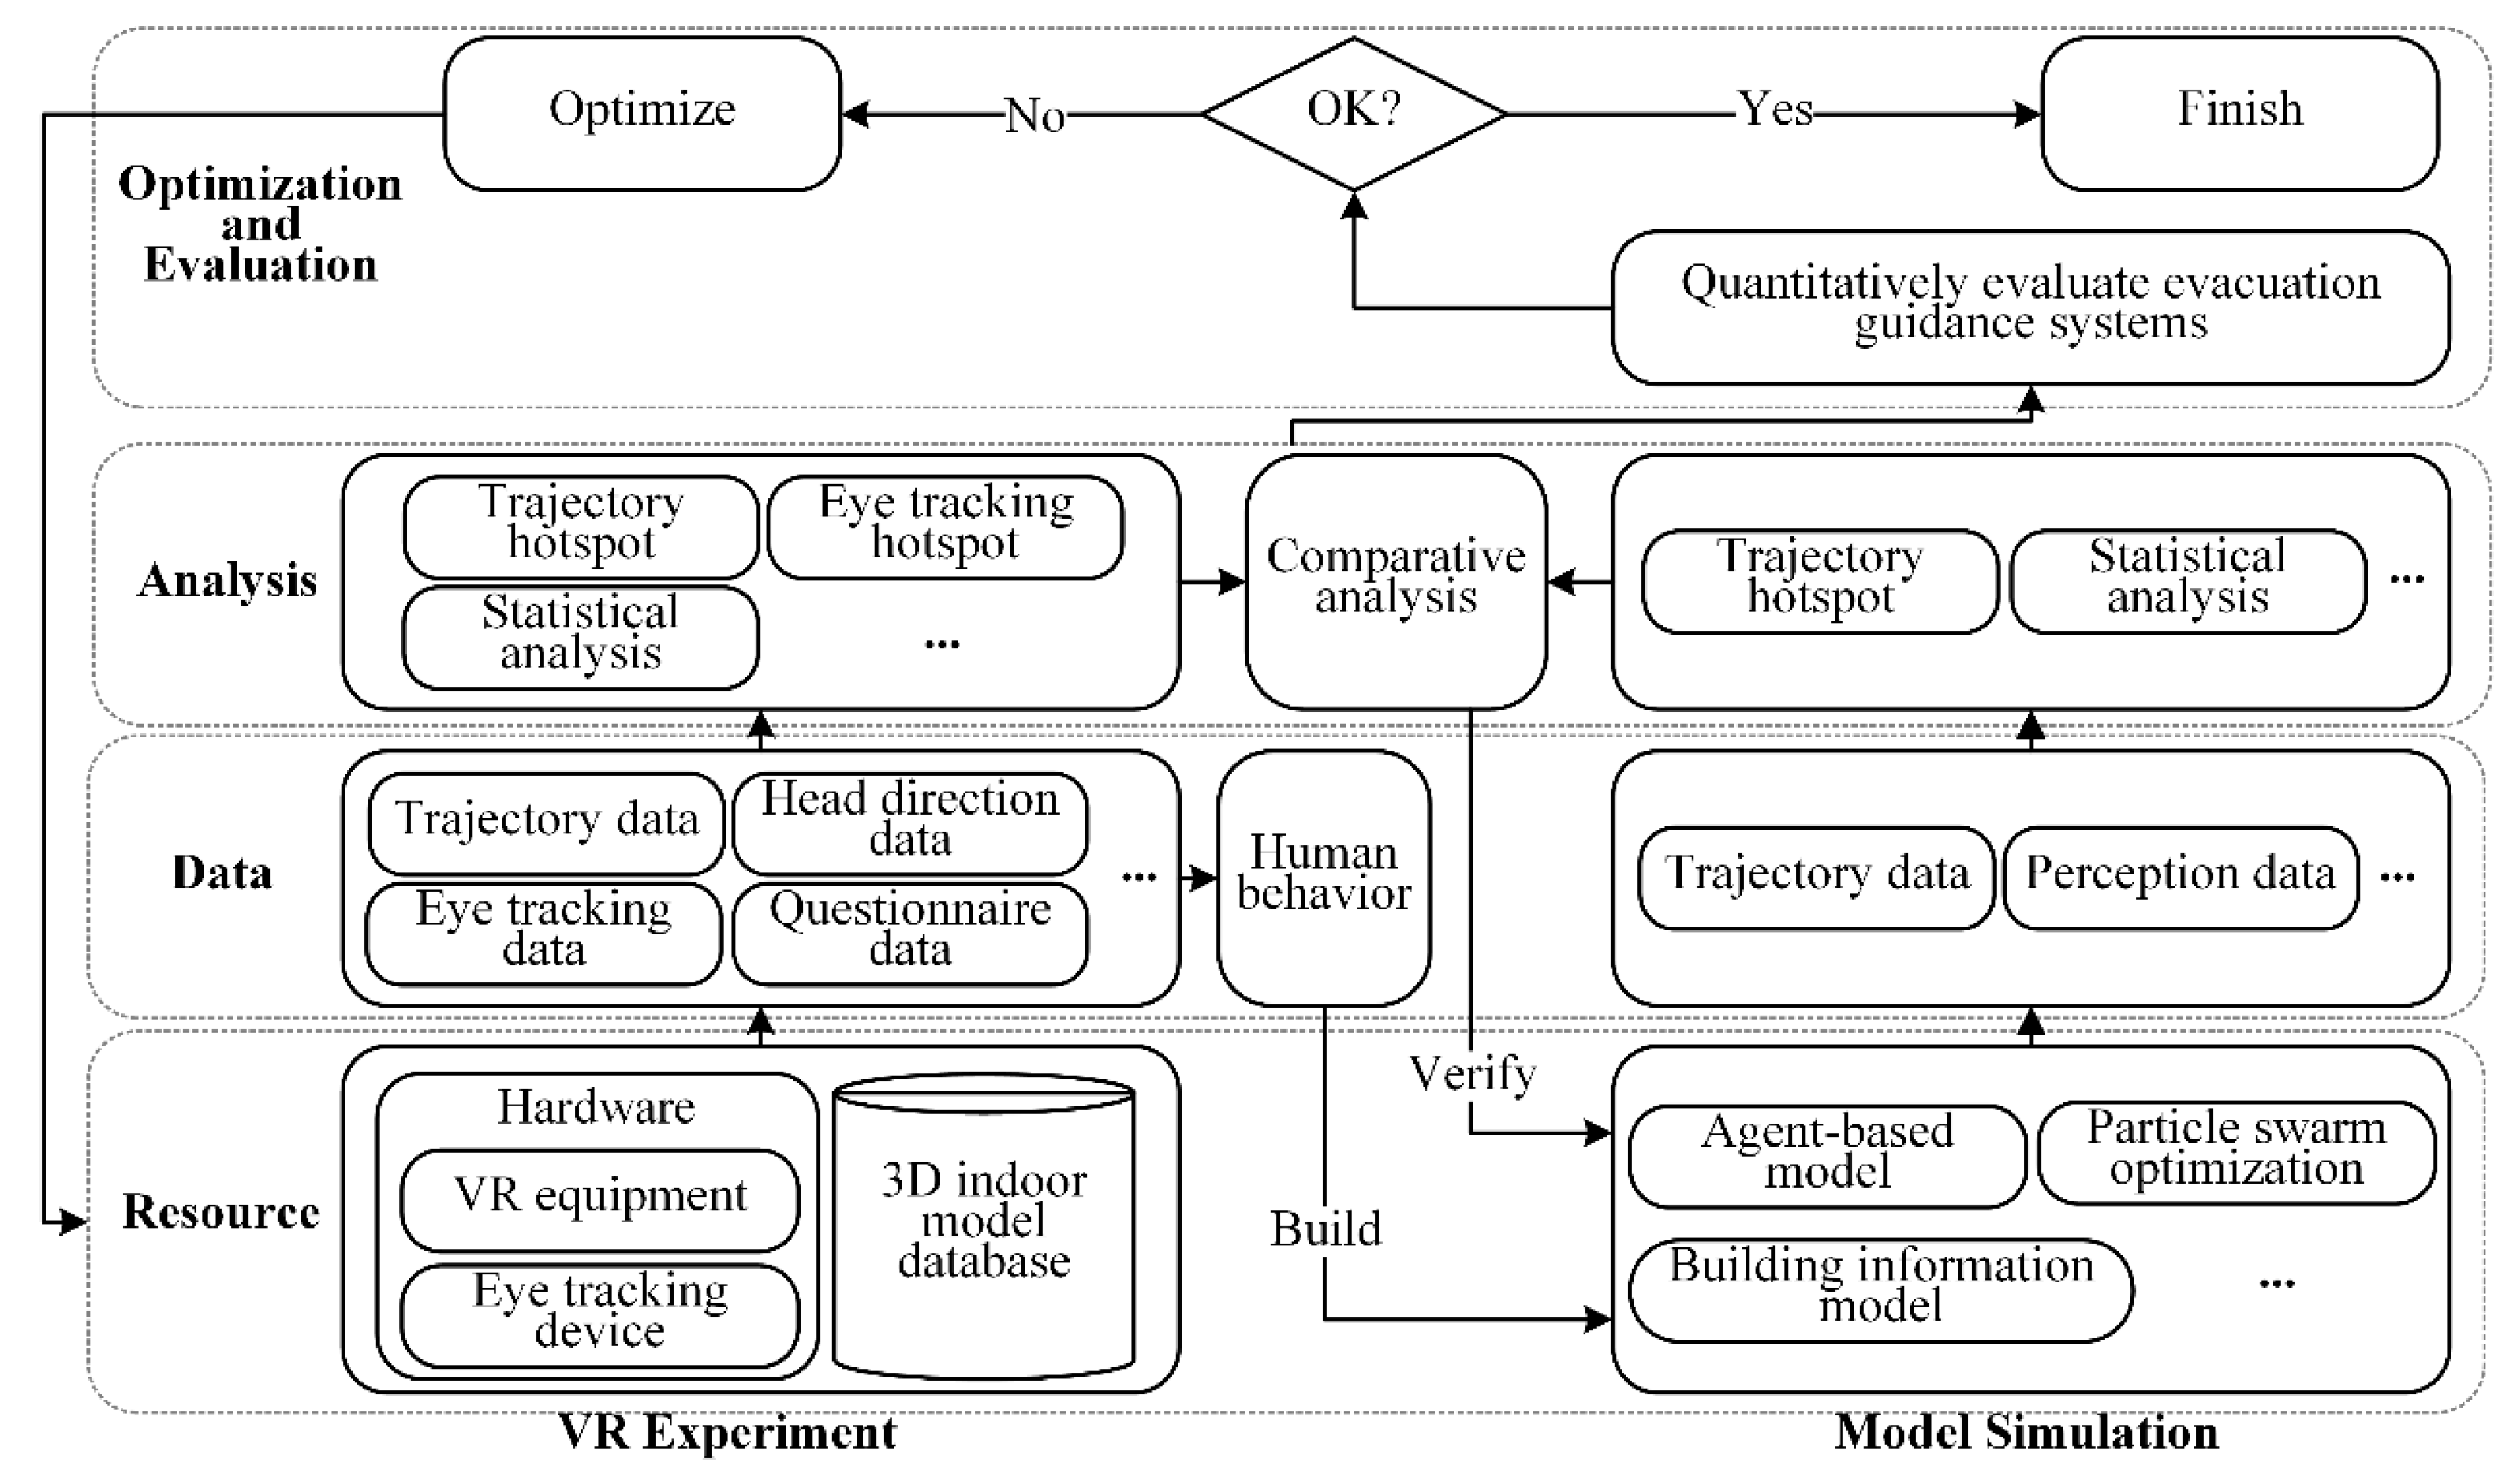
A framework for optimizing and evaluating evacuation guidance systems was proposed, which includes four layers: resource, data, analysis, and optimization and evaluation as shown in (Figure 1). The resource layer includes a variety of data acquisition methods, such as VR experiments and model simulations. The available data types are escape trajectory data, head direction data, eye tracking data, and other related data. These data can be used to direct model construction and optimize evacuation guidance systems, and the validity of models can be verified by comparing the experimental results with the model simulation results. Finally, the validated model can be used to evaluate the efficiency of evacuation guidance systems.
2.2. Experimental Environment
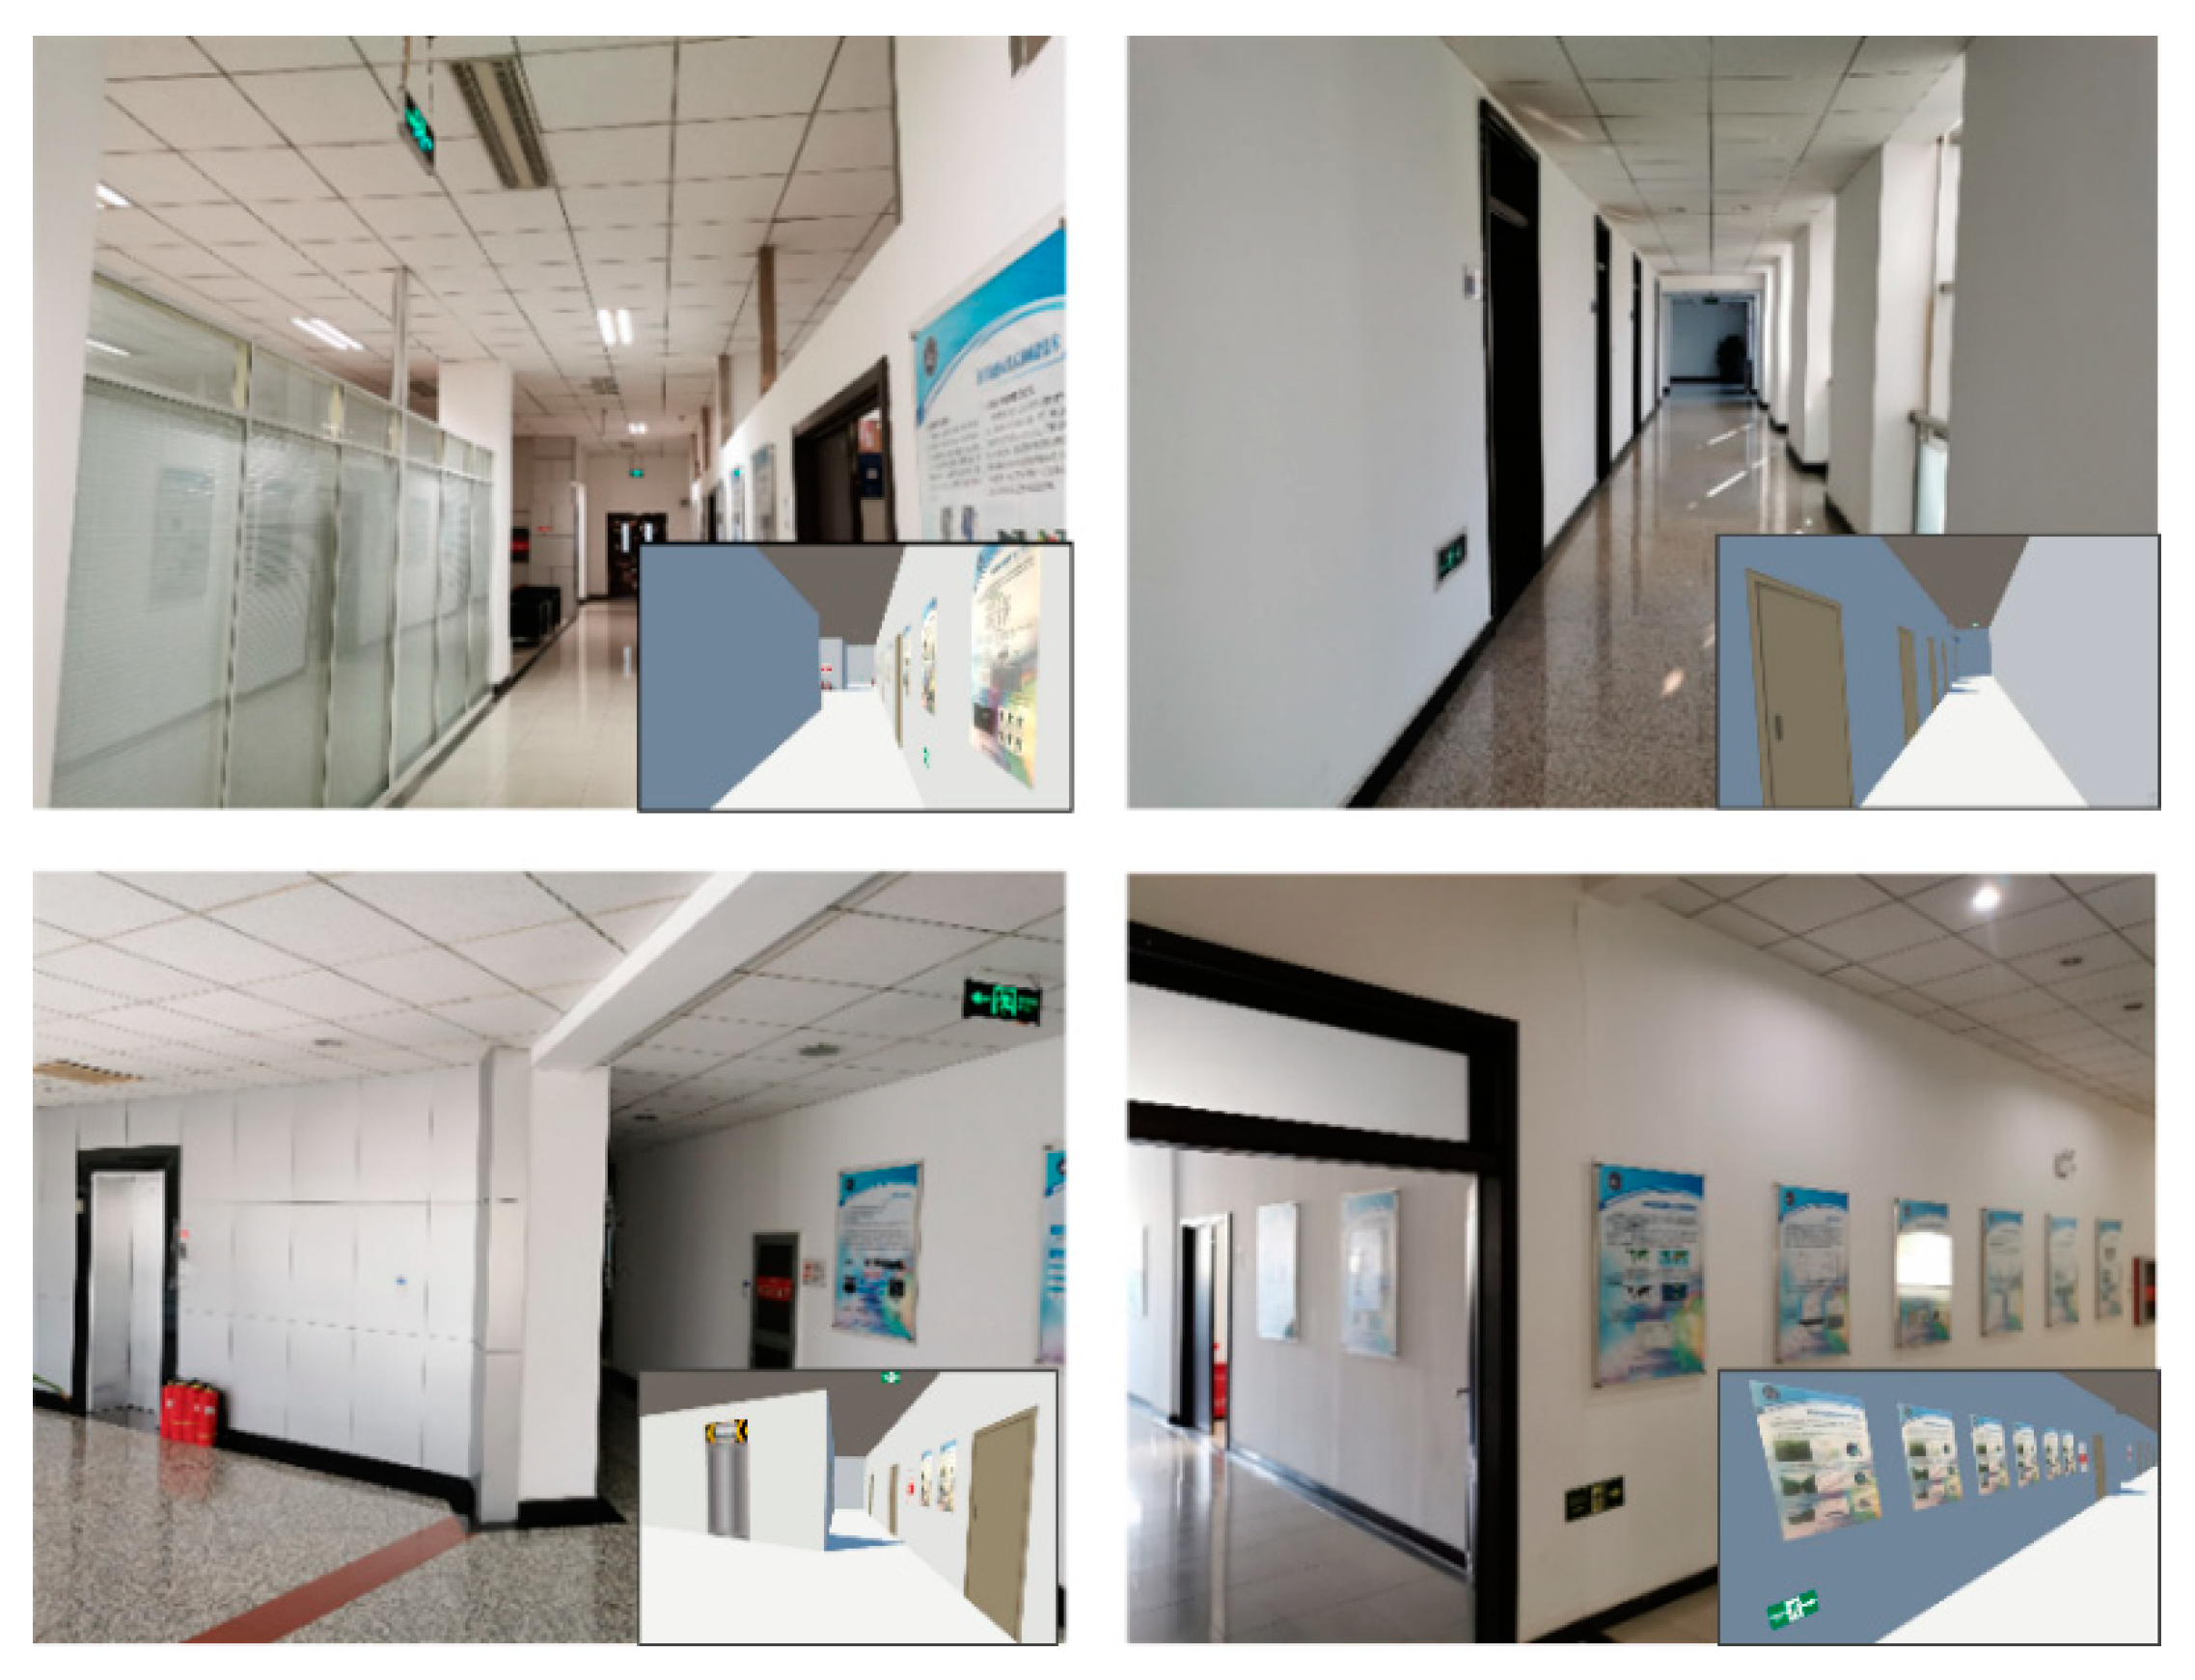
We used an HTC VIVE, an aGlass DKII, and the game engine Unity3D to carry out the VR experiments. The aGlass DKII was connected to the HTC VIVE through a USB cable and fixed in the HTC VIVE. Trajectory data and head direction data were obtained in the unity engine through the HTC VIVE develop API. The eye ray was obtained in the unity engine through the aGlass DKII develop API. In the unity engine, a collider component could be attached to obstacles such as walls. Then, the collision of the eye ray with obstacles, which was referred to as the eye tracking data, could be collected by using the ray cast API of the unity. All data were three-dimensional spatial coordinates. With the HTC VIVE, the position and orientation were tracked by combining an IMU and a lighthouse laser system with a refresh rate 90 Hz [24]. For the aGlass DKII, the sampling error was less than 0.5 degrees, and the delay was less than 5 ms. The tracking speed was 120–380 Hz. Considering the combination of the two devices and the accuracy requirements, we collected the data at a frequency of 90 Hz. We used 3D Max to model an indoor virtual environment consistent with a real environment, including the evacuation guidance system. In this paper, we constructed our VR experimental environment based on an office (Figure 2).
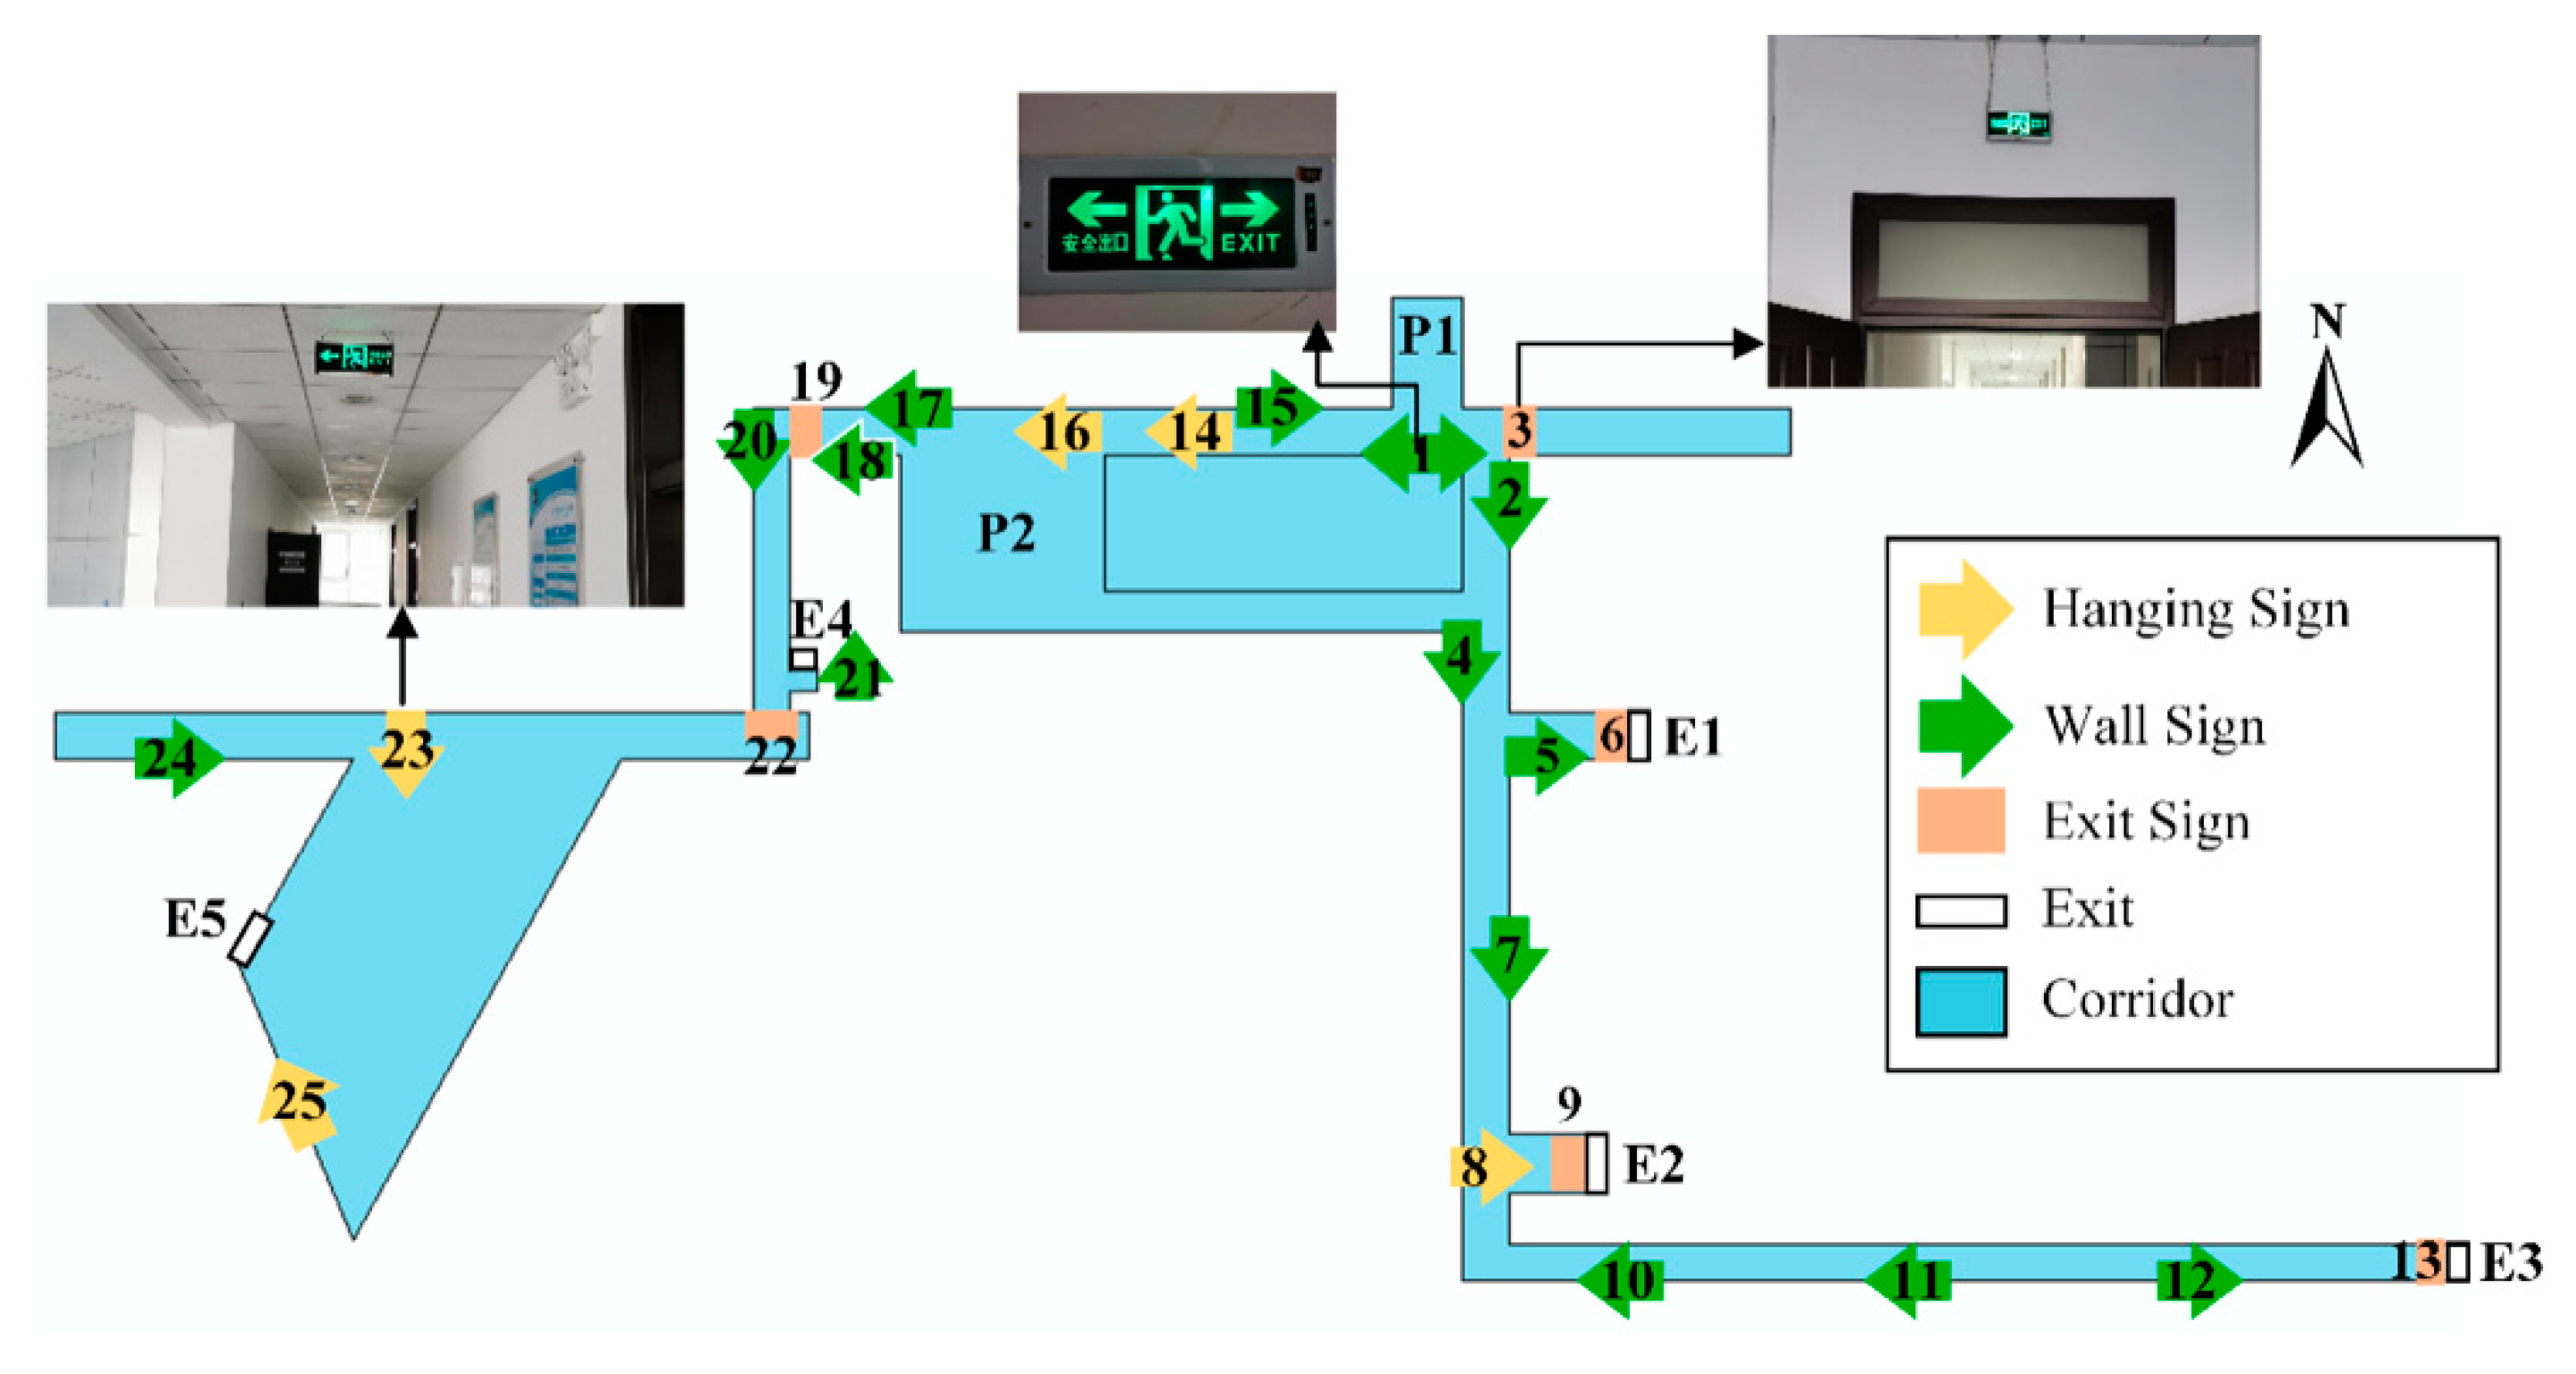
The office has three exits in the east and two exits in the west that are sufficient and evenly distributed (Figure 3).
2.3. Experimental Design
There were 25 evacuation signs in the research area, including 14 wall signs, 5 hanging signs, and 6 exit signs. Each sign was 0.25 m long and 0.135 m wide, the height of each wall sign was 0.6 m, and the hanging signs and exit signs were 3 m tall. For statistical convenience, this paper divided the evacuation signs into two types: wall signs and hanging signs. The exit signs are classified as hanging signs with single-sided direction information. The location and quantity of the original evacuation signs were in line with the condition of the real research area. In addition, the size and interval conformed to the standard for fire safety evacuation signs installation [25]. However, the locations of the signs were not perfect, and some signs indicated unreasonable directions. For example, there was no sign on the south wall of P2, and sign 1 and sign 15 could confuse evacuees (Figure 3).
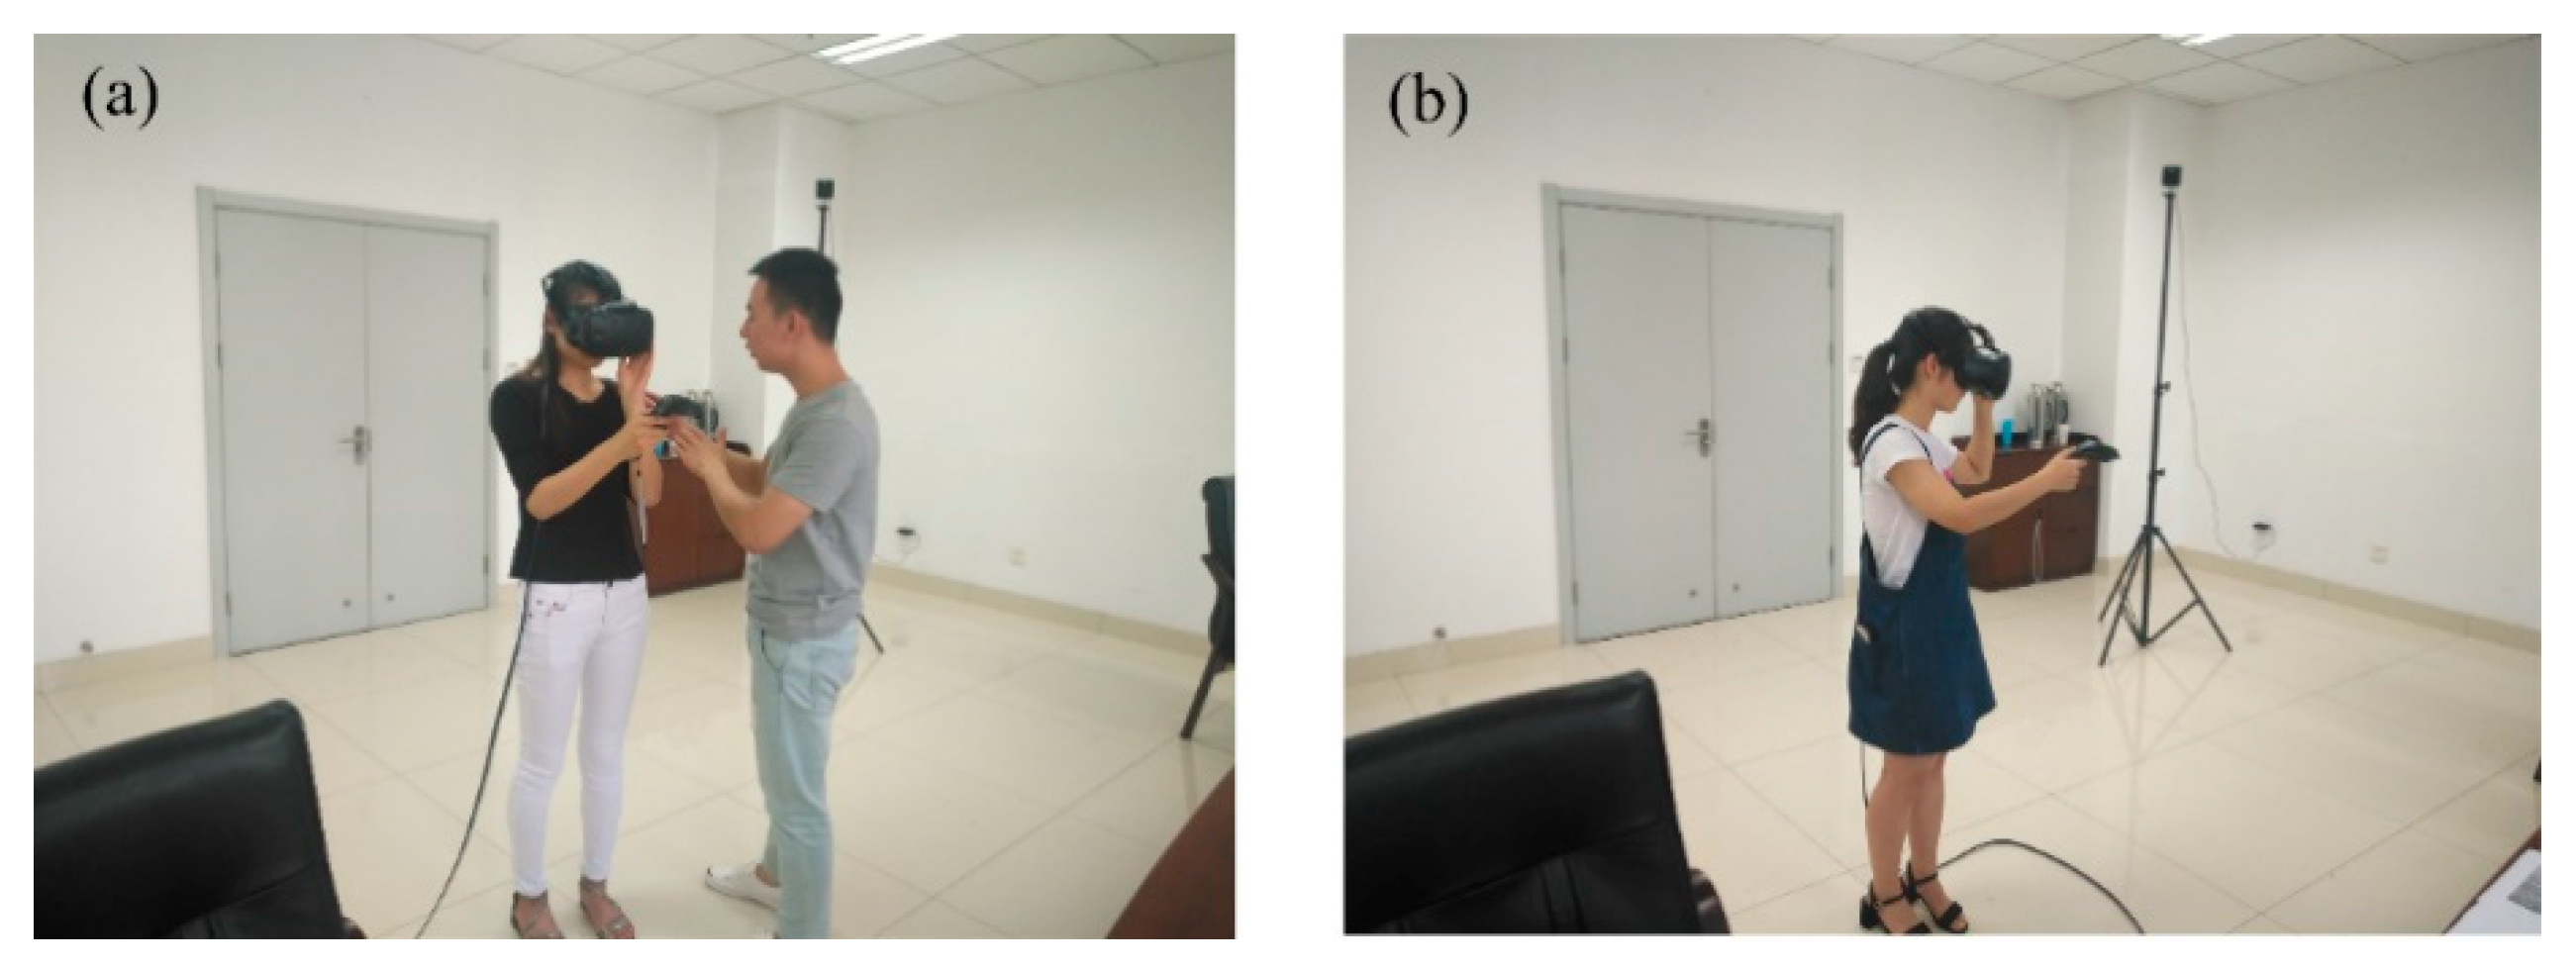
In the process of the experiment, we first chose proper shortsighted lenses for the participants to ensure that they could see the signs clearly. Then, we told them how to use the HTC VIVE and gave them some security considerations. Finally, we reminded the participants that this experiment was an emergency evacuation experiment and that they needed to find an exit as soon as possible, but the participants were not directly informed to observe the evacuation signs. The participants used the controller to walk in the virtual environment, and they could freely observe the environment throughout the VR headsets. We set the escape speed to 1.5 m/s [23]. Only one participant could carry out the VR experiment at a time. We encouraged the participants to conscientiously finish the experiment by offering some rewards, and we increased their tension by setting off a fire alarm. The process is shown in Figure 4.
We conducted two sets of VR experiments. The layout of the evacuation guidance system was consistent with the real environment in experiment 1 but was optimized during experiment 2. A total of 89 participants were invited to participate in experiment 1, including 49 males and 40 females. The ages of the participants were between 22 and 29 years old. In experiment 2, 78 participants between 22 and 32 years old were invited, with 42 males and 36 females. A total of 115 valid data points were collected in experiment 1 and 82 were collected in experiment 2. All participants had basic knowledge of the emergency escape process and normal or corrected vision. The participants in experiment 1 were different from those in experiment 2, but all participants escaped from P1 and P2 (Figure 3) in experiment 1 and experiment 2, respectively. If the evacuation paths did not overlap, we considered both to be valid data. If the paths overlapped, and in the questionnaire the participant confirmed he/she recognized the environment in the second evacuation, we considered the second evacuation data invalid.
2.4. Formulation of the Perception Model
The social force model is a classic emergency evacuation model based on interesting phenomena from reality. It combines real physical forces and virtual psychological forces to simulate escape behavior. The SFM consists of three forces: a self-driving force, a repulsive force between pedestrians, and a repulsive force between pedestrians and obstacles such as walls [23].
The process for controlling the SFM in the desired direction is very simple. People always move toward a target exit or in a fixed direction. However, in an escape scene, the desired direction of a given human depends on the information indicated by the local environment. To solve this problem, this paper constructed a perception model based on the SFM that enables evacuees to dynamically adjust their desired direction according to the perceived direction information. This model allows agents to act autonomously in complex scenarios. We hypothesized that an evacuee would take the initiative to look for an evacuation sign in the process of escaping and follow the direction of the sign. Evacuees should continue searching for signs and following signs until they find the exit. In this study, we define two basic mathematical concepts regarding the decision point and the evacuation sign. Then, we elaborate on the three algorithms used in the perception model: the evacuation sign search algorithm, decision point search algorithm, and desired velocity update algorithm (Figure 5).
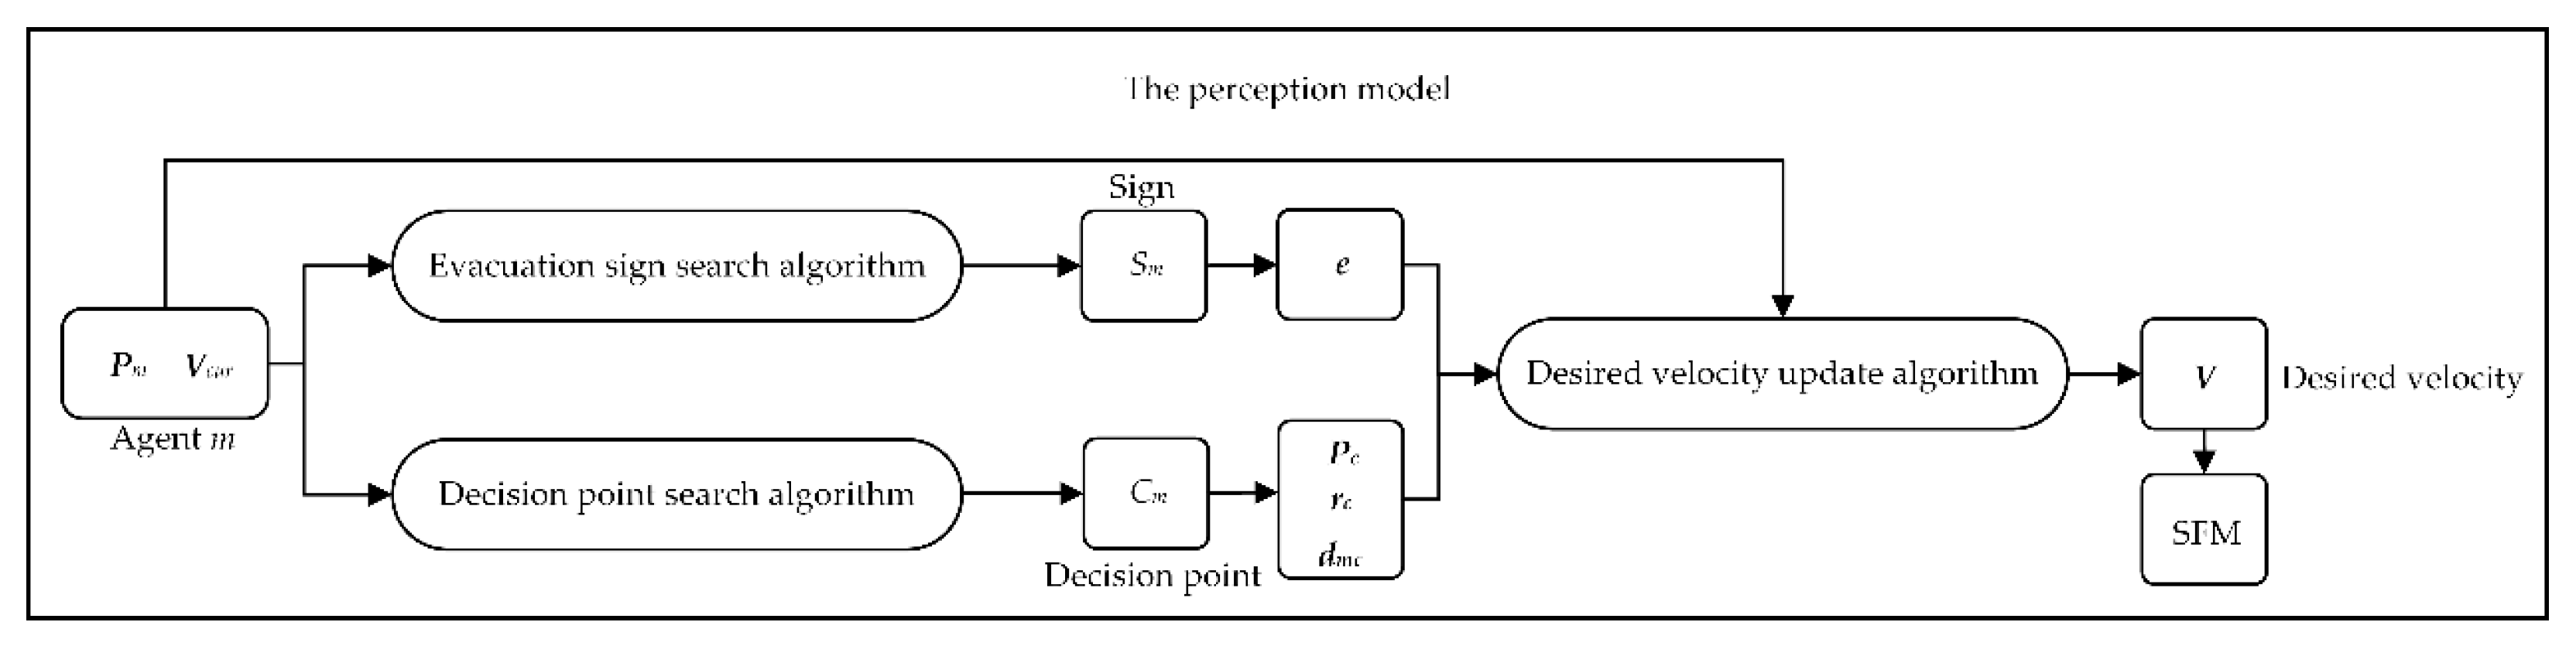
Figure 5 shows the framework of the perception model, which was constructed from 3 algorithms. According to the current position and the velocity of agent m, we use the evacuation sign search algorithm to find the nearest sign that the agent can perceive and obtain the sign direction . At the same time, we use the decision point search algorithm to find the nearest decision point and obtain the position , the radius rc of the decision point, and the distance between the agent and the decision point. Combined with the above data and the desired velocity update algorithm, we propose the perception model based on the social force model.
2.4.1. Decision Point Model
Behaviors at decision points are key issues related to the self-driving movements of agents in an indoor environment, including the choice of which road to take and when and how to change to the desired direction. Specifically, assuming that the agent is in an unfamiliar environment, he or she will randomly choose a direction when coming to a decision point without any prior information. The agent should have already made a choice before he or she enters the area of the decision point. When he or she enters the area, he or she smoothly changes from the desired direction to the chosen direction. After the agent leaves the decision point, he or she should walk along the road until the next decision point is reached.
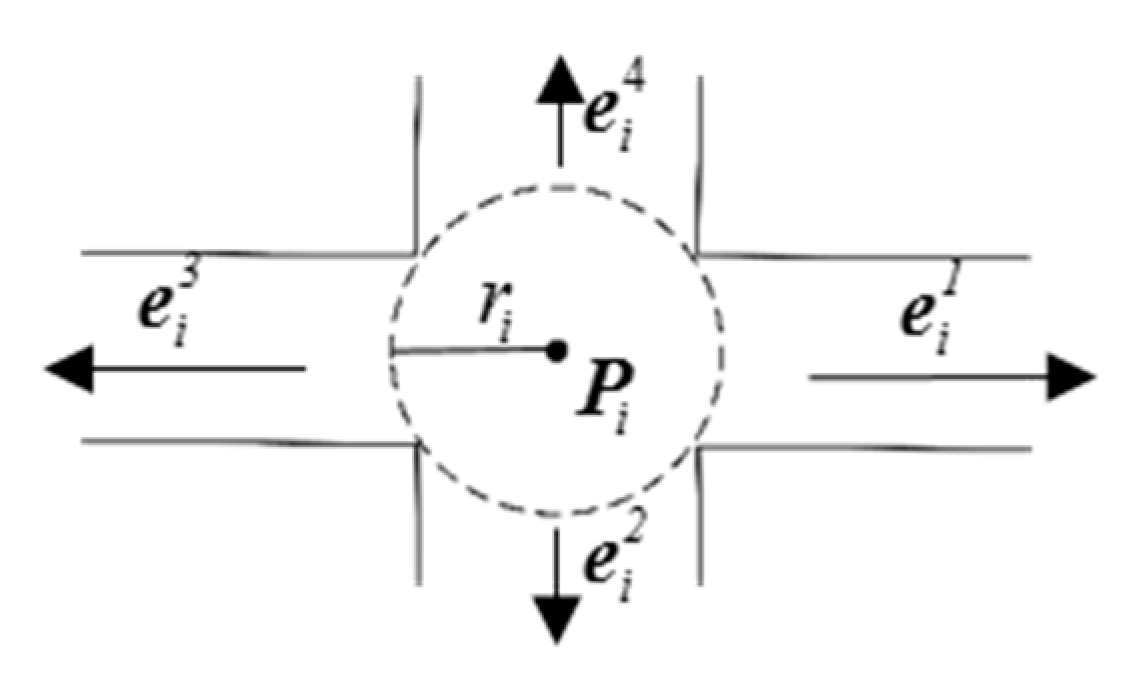
Based on this idea, the decision point model was built. The center of a decision point i is represented by the 2-D position . The decision point has directions, of which is the k’th direction. The area of the decision point is simplified as a round area with radius . For example, a decision point with four directions (Figure 6).
Some special decision point types exist. We define the road end as a decision point with only one direction, which enables the agent to turn back at the end of the road. In a corridor, a fake decision point with two directions could be defined to make the evacuation sign take effect immediately. The indoor open area is divided into multiple decision points, and each decision point is located in front of a road and points to the other roads. By using all these decision point types, the behavior of the agent is smart and realistic.
2.4.2. Evacuation Sign Model
The eye tracking data collected from the VR experiments show that pedestrians are willing to find and follow evacuation signs when evacuating in unfamiliar environments. Somehow, due to interference from environmental effects, prevailing panic, and other semantic information, the agent cannot perceive all evacuation signs along his or her evacuation path.
In model simulations, the modeling of evacuation signs is about how the agent searches for them, when the agent can perceive them, and how the agent behaves in terms of following their instructions. Specifically, the agent may continue searching for evacuation signs during an evacuation and try to perceive the nearest evacuation sign. An evacuation sign can be perceived only if it is in the line of sight of the agent, the distance is not too long, and the angle between its normal direction and the agent is under some constraints. The evacuation sign instructs the agents which direction to choose at the nearest decision point.
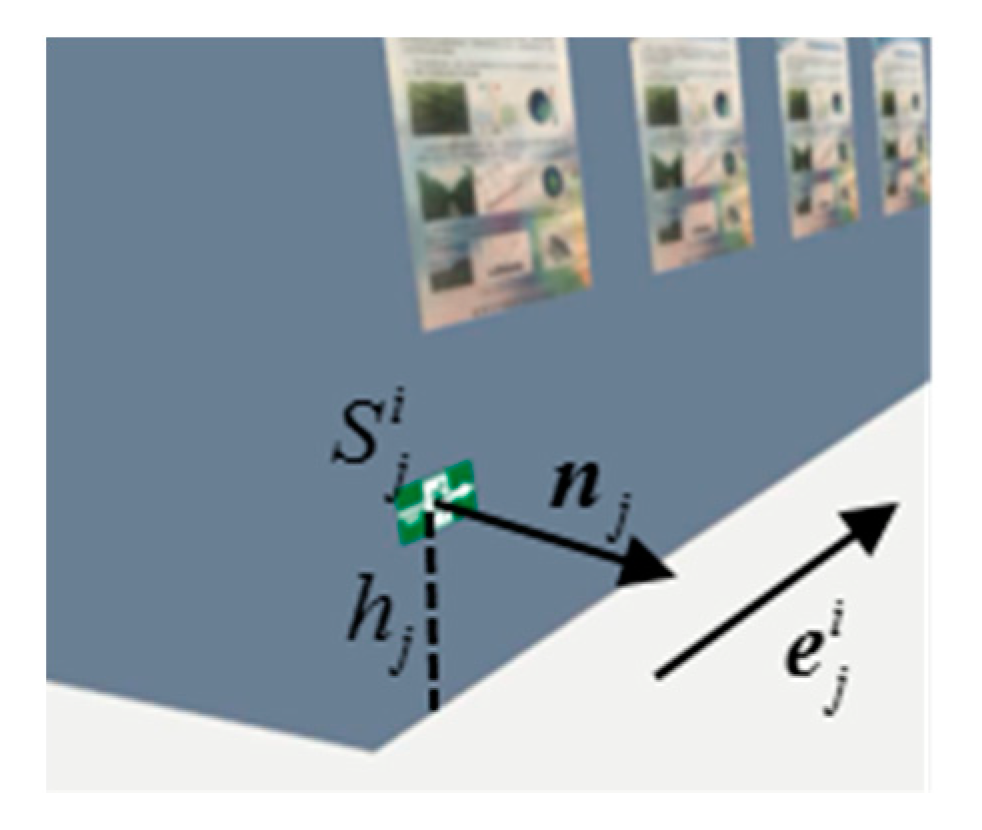
Accordingly, the evacuation sign model is proposed. The indicated direction of the j’th sign for the i’th decision point is called , for which is the location, is the normal direction, is the height, and is the evacuation direction (Figure 7). After the decision point and sign models are built, we can mathematically define the behavior of the agent under the effect of the evacuation sign system.
2.4.3. Evacuation Sign Search Algorithm
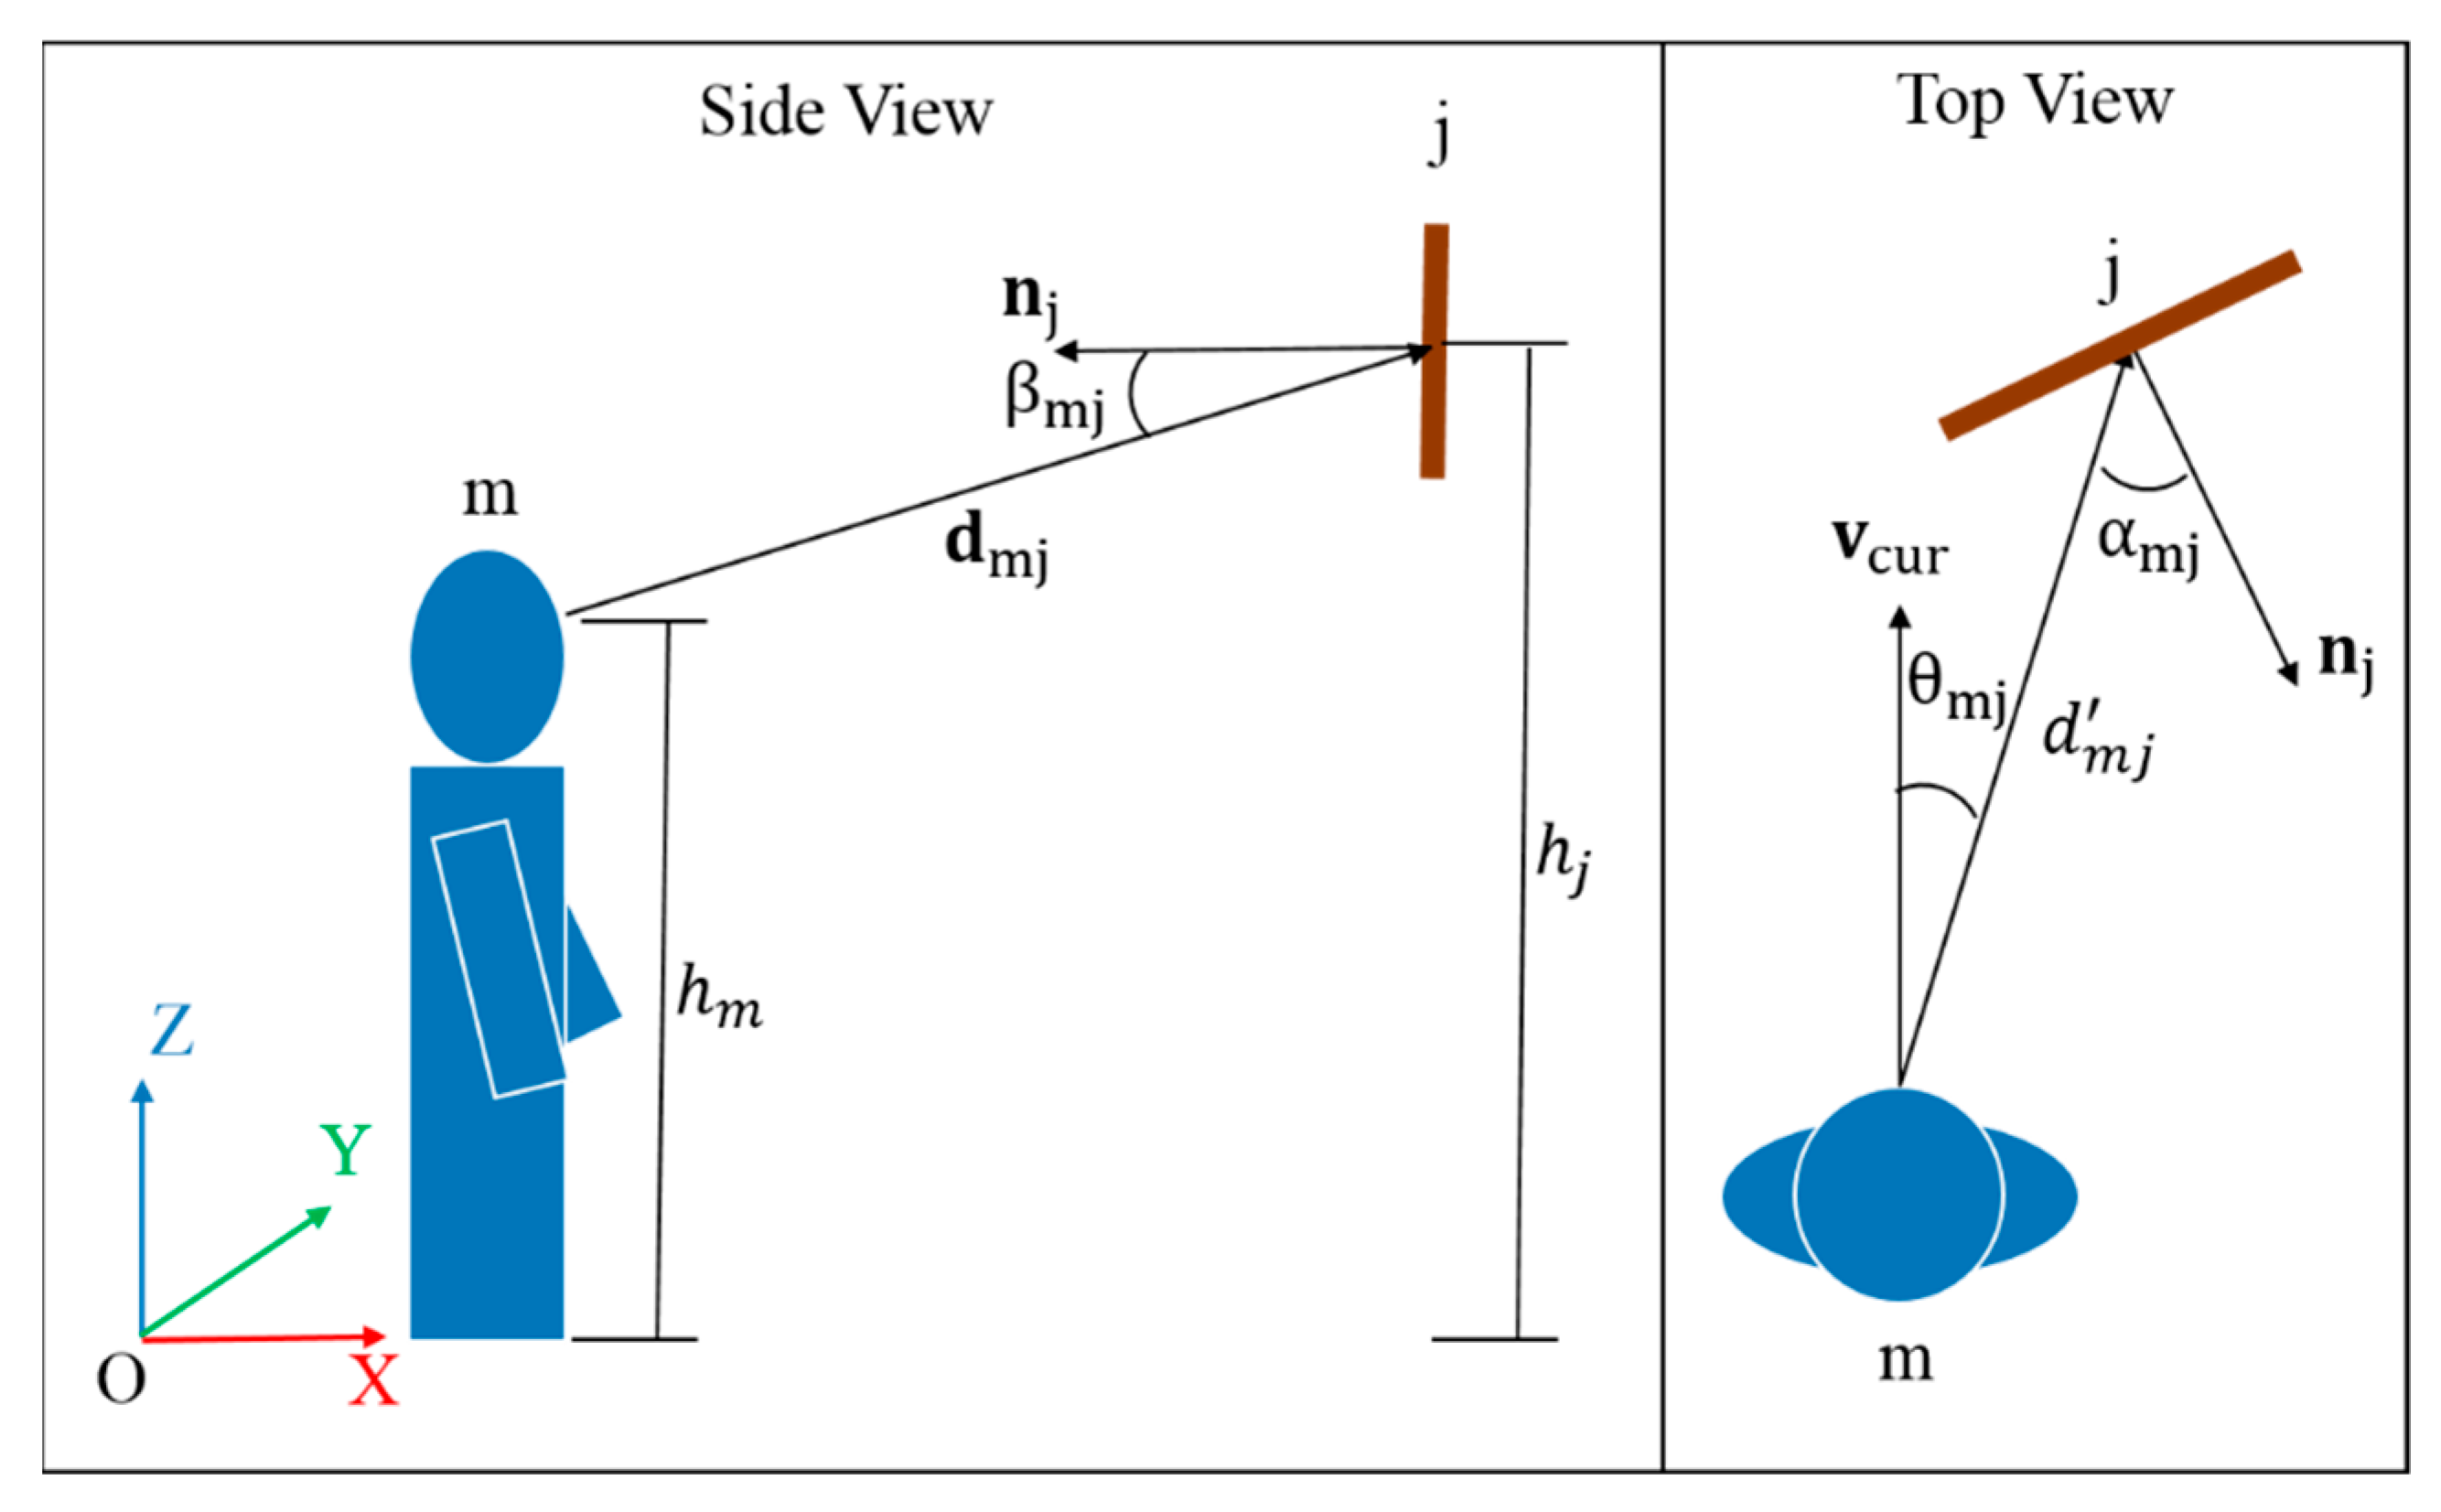
The evacuation sign search algorithm describes the conditions under which an agent can perceive an evacuation sign. Figure 8 shows that agent m perceives an evacuation sign . Since there is no predetermined direction in the SFM, the direction of the current velocity is used as the heading direction. is the vector from the eyes of m to the center of . is the projection of on the XOY plane (Figure 8). Agent m can perceive evacuation sign when the following conditions are met:
- (1)
- is not blocked by walls or other obstacles.
- (2)
- .
- (3)
- The time to observe is longer than a threshold .
- (4)
- is in the sight of m. This means that the angle between and , which is , satisfies .
- (5)
- The horizontal angle between dmj and , which is , satisfies .
- (6)
- The vertical angle between and , which is , satisfies .
Taking all the evacuation signs that satisfy the above conditions as a set , the agent will follow the instructions of the nearest sign Sm ∈ S.
2.4.4. Decision Point Search Algorithm
We assume that regardless of the condition, the agent can always perceive whether he or she is at a decision point or not. Therefore, as long as conditions 1 and 4 in the evacuation sign search algorithm are satisfied, that is, the decision point is not blocked by obstacles, it is considered that the decision point can be perceived. If all decision points that meet the conditions are taken as a set , agent m will automatically select the nearest decision point and adjust the direction of his or her desired velocity.
2.4.5. Desired Velocity Update Algorithm
After perceiving an evacuation sign, the agent will remember the information but will not immediately adjust his or her desired velocity. When the agent enters the area of a decision point, that is, when the distance between the agent and the decision point center is less than the decision point radius, the agent adjusts his or her desired velocity according to the direction indicated by the sign. If the agent does not see the sign about the decision point, he or she will randomly choose a non-coming direction in which to adjust the desired velocity. One problem is that if the desired velocity is changed directly, the agent will turn abruptly and be more likely to hit the wall than if the velocity is changed indirectly. We hope that the agents can adjust their directions smoothly. Therefore, we construct the following desired velocity update algorithm.
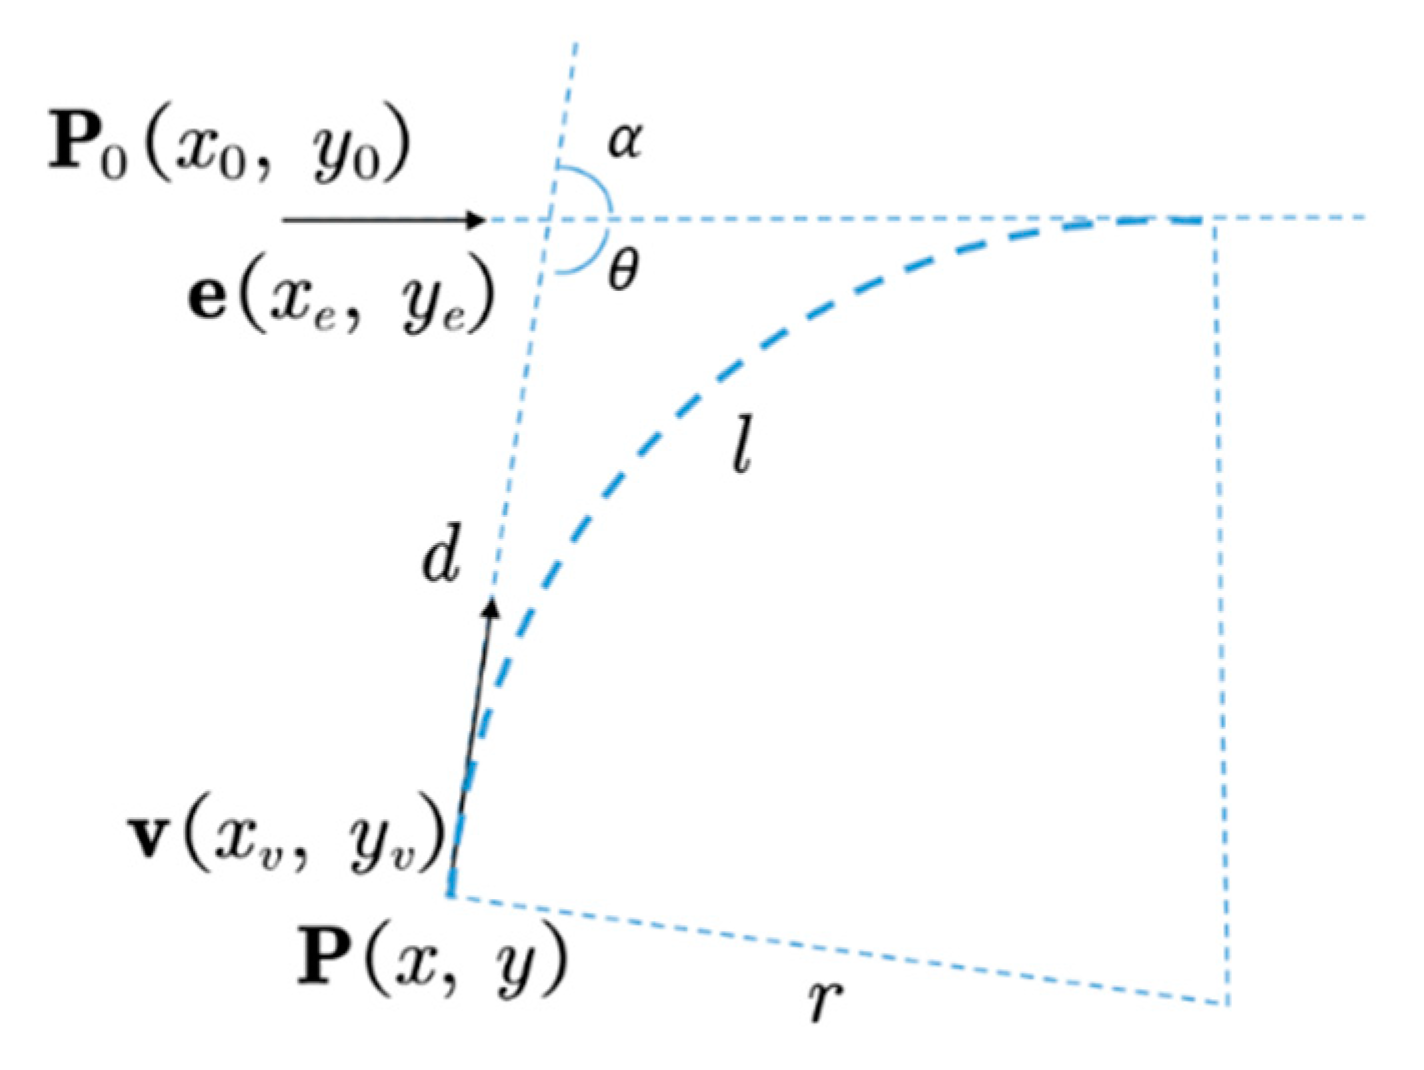
As Figure 9 shows, the current position of an agent is P, v is his or her desired velocity, is the decision point center, and is the evacuation direction of the decision point. We expect the agent to move along arc l to achieve a natural turn. The desired velocity at the next moment is related to the current position of the agent, the central position and direction of the decision point, and the desired velocity at the last moment. To obtain the form of the function f, the following calculations are carried out.
The relationship between angular speed and linear velocity is as follows:
If we calculate and , we can obtain . Because :
According to the cross product and dot product of and , we have:
Let the equation of the line be , and −A/B is the slope of the line , which equals , then:
The equation of the line can be written as , and P0 is a point on the line, so:
The distance from to the line is:
Therefore, we can calculate ω. Since there is a reaction time between the desired velocity and the current velocity in the SFM, the direction of the desired velocity turns after the reaction time. Therefore, the new formula of the desired velocity is as follows:
The rotation matrix is:
In addition, there are two situations for which the desired velocity is updated. For a dead end (a decision point with only one direction), if the distance between the agent and the center of the decision point is less than a threshold , the direction of the agent is reversed immediately so that the agent can turn around autonomously. In other cases, the desired velocity remains constant.
Considering all the cases above, we can construct a model to adjust the desired velocity of the agent. If the distance between the agent and the nearest decision point is , then:
In conclusion, whether the evacuee can perceive an evacuation sign depends on some parameters, including the maximum perception distance , perception time , viewing angles of the agent and , horizontal angles of the sign and , and vertical angles of the sign and . However, these parameters are unknown. We believe that a sign perception process starts from noticing the sign to fully understanding the sign information. From the perspective of eye tracking data, the process starts from the first eye tracking point to the last eye tracking point. Therefore, the sign perception time is the time span between these two points. Based on the relative position between evacuees and evacuation signs at the time the last eye tracking point was obtained, we can calculate the perception distance and perception angle range. Assuming uniform linear motion between two timestamps of the trajectory data, we use linear interpolation on the trajectory data to align the eye tracking data. In the next section, the trajectory data and the eye tracking data are combined to calculate these parameters.
3. Results
3.1. Emergency Sign Perception Parameter
In this section, the eye tracking data and the trajectory data are quantitatively analyzed to obtain the parameter thresholds mentioned above.
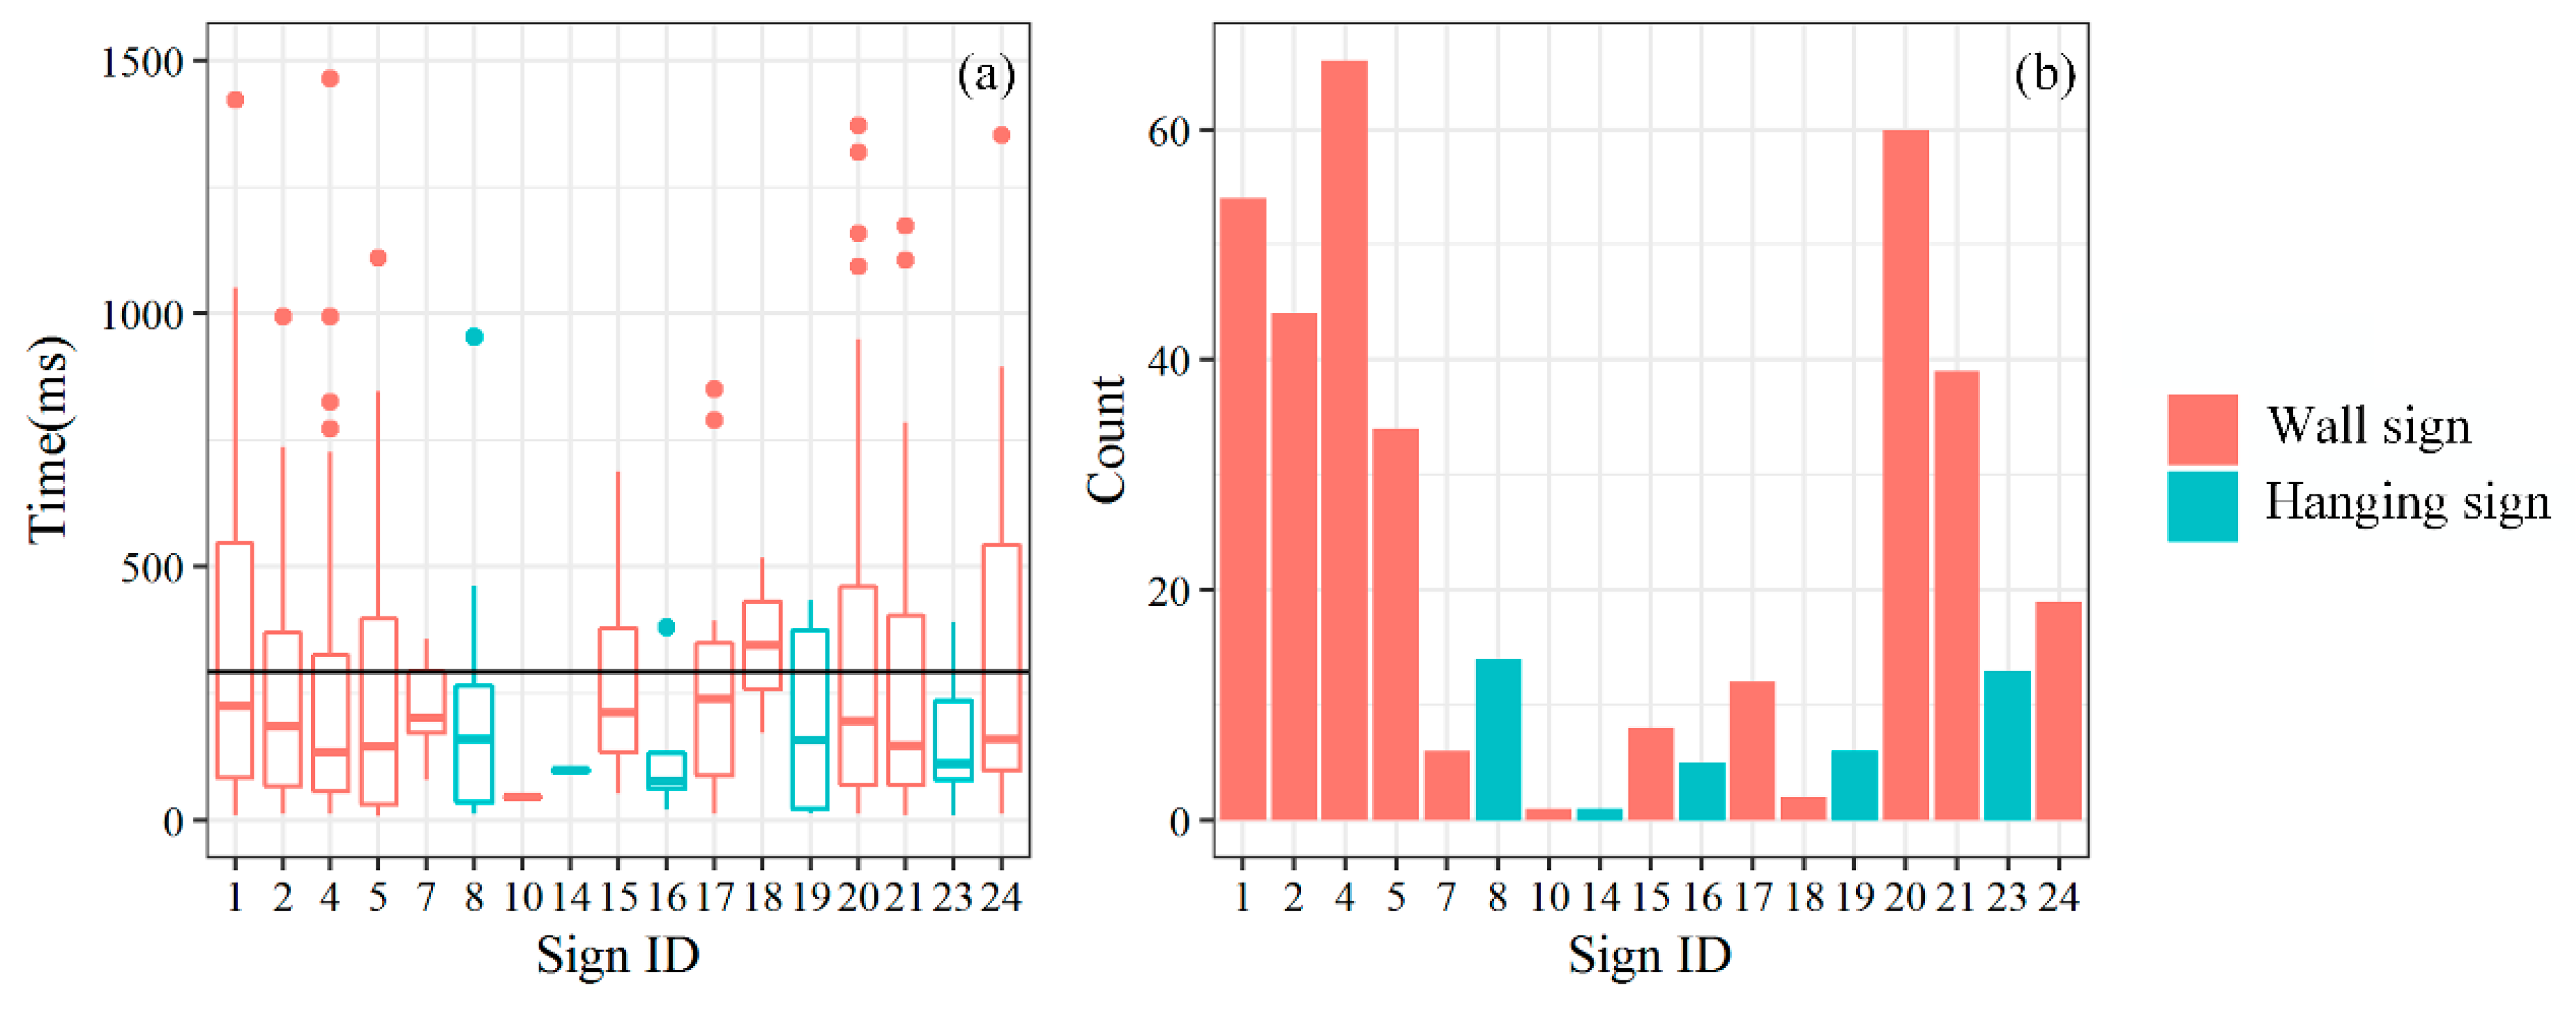
Figure 10 shows the perception times and frequencies of all evacuation signs. Except for sign 11 and sign 12, which no one perceived, the remaining 12 wall signs were all perceived, and 4 of the 5 hanging signs and 1 of the 6 exit signs were perceived. From the statistical analysis, we found that the average perception time for the evacuation signs was 291 ms, and most signs’ perception times were less than 500 ms (Figure 10a). Comparing the perception times of wall signs and hanging signs, we found that the average perception time of hanging signs was relatively low. Most likely, this was because the hanging signs were perpendicular to the escape directions, so they were easier to see clearly. Figure 10b shows the number of times each sign was perceived, the wall signs were perceived 345 times and the hanging signs were perceived 39 times. This demonstrates that wall signs had a higher perception rate than hanging signs during the simulated emergency. This result is consistent with [2]. The two peaks in Figure 10b are signs leading to the best escape routes from P1 and P2.
Figure 11 takes 5 degrees as an interval for calculating the horizontal and vertical angles between evacuees and evacuation signs when the signs are perceived. Figure 11a shows a statistical histogram of the horizontal angles. We assumed that the horizontal angle meant no difference no matter the people on the left of the sign (negative angle) or on the right of the sign (positive angle). Thus, the absolute values are shown in Figure 11. In general, the perception frequency decreased with increasing horizontal angle. However, two peaks appeared near 45° and 75°. The data of the two peaks occurred mostly on signs 2, 4, and 5. On the one hand, these signs were near decision points, which means that the participants could observe the sign across the decision point from the other road at certain angles. On the other hand, these signs were on the major evacuation path starting from P1, which means that the observation frequency was high. Thus, these certain angles became two peaks. Note that the wall signs were perceived in a wide angle range, while the hanging signs were perceived at a low angle. This could indicate that wall signs are easier to observe from different angles than hanging signs. Figure 11b shows a statistical histogram of the vertical angles. Because hanging signs are usually higher than eye level, while wall signs are usually lower than eye level, and the vertical angles of the two types of signs were distributed in two completely different regions. We believed that the intervals with too few observations were not statistically significant. Therefore, all intervals with fewer than five perceptions were excluded. According to statistics, the range of the horizontal angle was [0°, 85°], the vertical angle range of the hanging signs was [15°, 30°], and the vertical angle range of the wall signs was [−50°, −10°].
Figure 12 shows the distances at which evacuees observed the signs, and the vertical axis is the probability density of different distances. The data basically conformed to the normal distribution, with a mean of 3.22 m and a variance of 0.93 . Taking the 95% confidence interval, we obtained a maximum perception distance of approximately 5.15 m. We considered that under critical situations, evacuees can perceive evacuation signs when the distances were less than the maximum threshold.
3.2. Optimization of Evacuation Guidance Systems
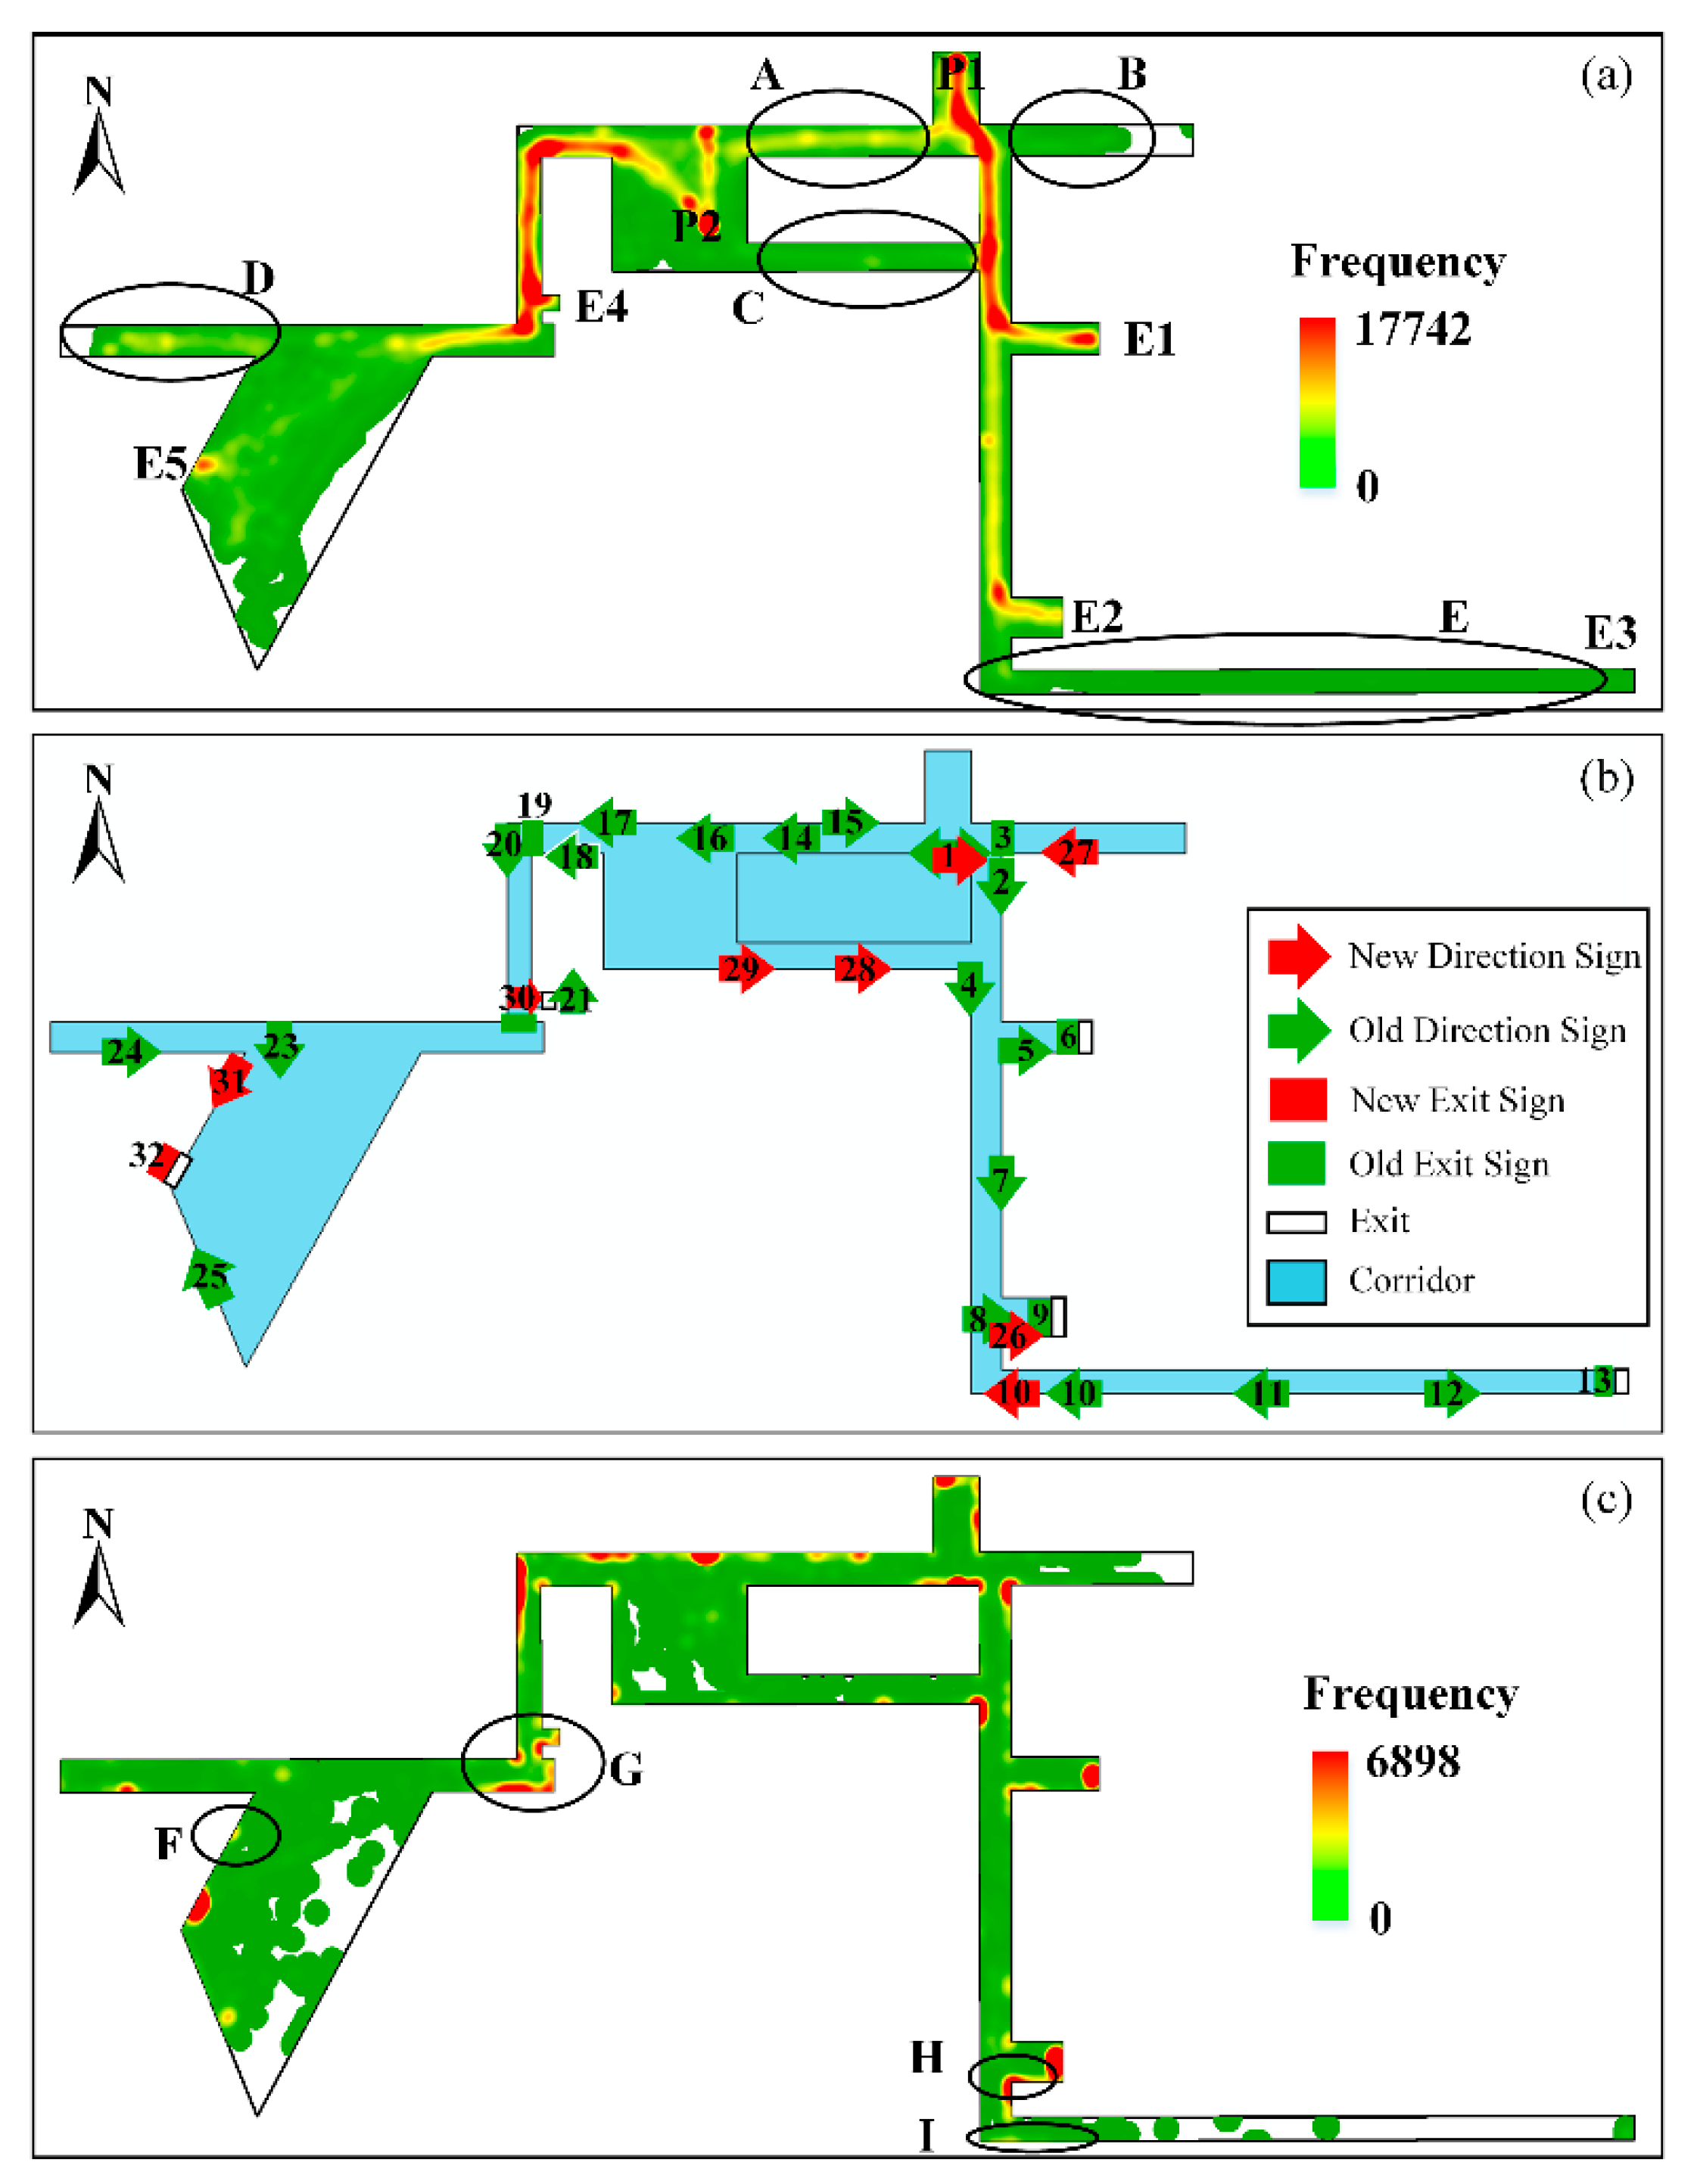
By analyzing the hotspot chart of escape trajectories and eye tracking data, we found the deficiencies in the existing evacuation guidance systems and conducted optimization. Figure 13a shows a hotspot chart of the escape trajectories, and the participants started from P1 or P2. By analyzing the escape trajectories, we found detour behavior and then optimized the corresponding areas. Figure 13c shows the eye tracking data. Participants started from P1 and P2, respectively, and the two starting positions had different paths to the nearest exits. So, the red area on the left was mainly the hot path starting from P2, while the red area on the right was mainly the hot path starting from P1. However, the two hot paths were not contiguous. Compared with Figure 13b, the frequencies of the eye tracking data at locations with signs were higher than those at other locations. On the other hand, adding signs in some areas with high-frequency eye tracking data but without evacuation signs could optimize the guidance system. Theoretically, the nearest exit to P1 was E1 and that of P2 was E4. However, we could see that some evacuees did not follow the best path to the nearest exit. A few evacuees did not see exit E4 and ultimately escaped from exit E5, which wasted time. Therefore, we added sign 30 pointing to exit E4 in area of interest G. Figure 13a shows, there were some evacuees in area A that started from P1 because sign 1 was bidirectional. Therefore, we changed sign 1 to a single-direction sign pointing to the right. Area B was a dead end, so we added sign 27, hoping that evacuees entering area B could see the sign and turn around as soon as possible. Area D was also a dead end but sign 23 was a hanging sign. From the previous analysis, the perception rate of the hanging sign was low. Therefore, we added a wall sign 31 pointing to exit E5 in area of interest F, hoping that evacuees could see this sign and move directly to the exit to avoid entering area D. The lack of a sign in area C caused confusion when evacuees passed through the corridor, so we added sign 28 and sign 29 in the area of interest. Area E was a long corridor, and some evacuees entered the corridor when they missed exit E2, which increased the escape time. Therefore, we added sign 26 and moved sign 10 to the areas of interest according to the eye tracking data. Finally, there was no exit sign on the door at E5, so we added sign 32.
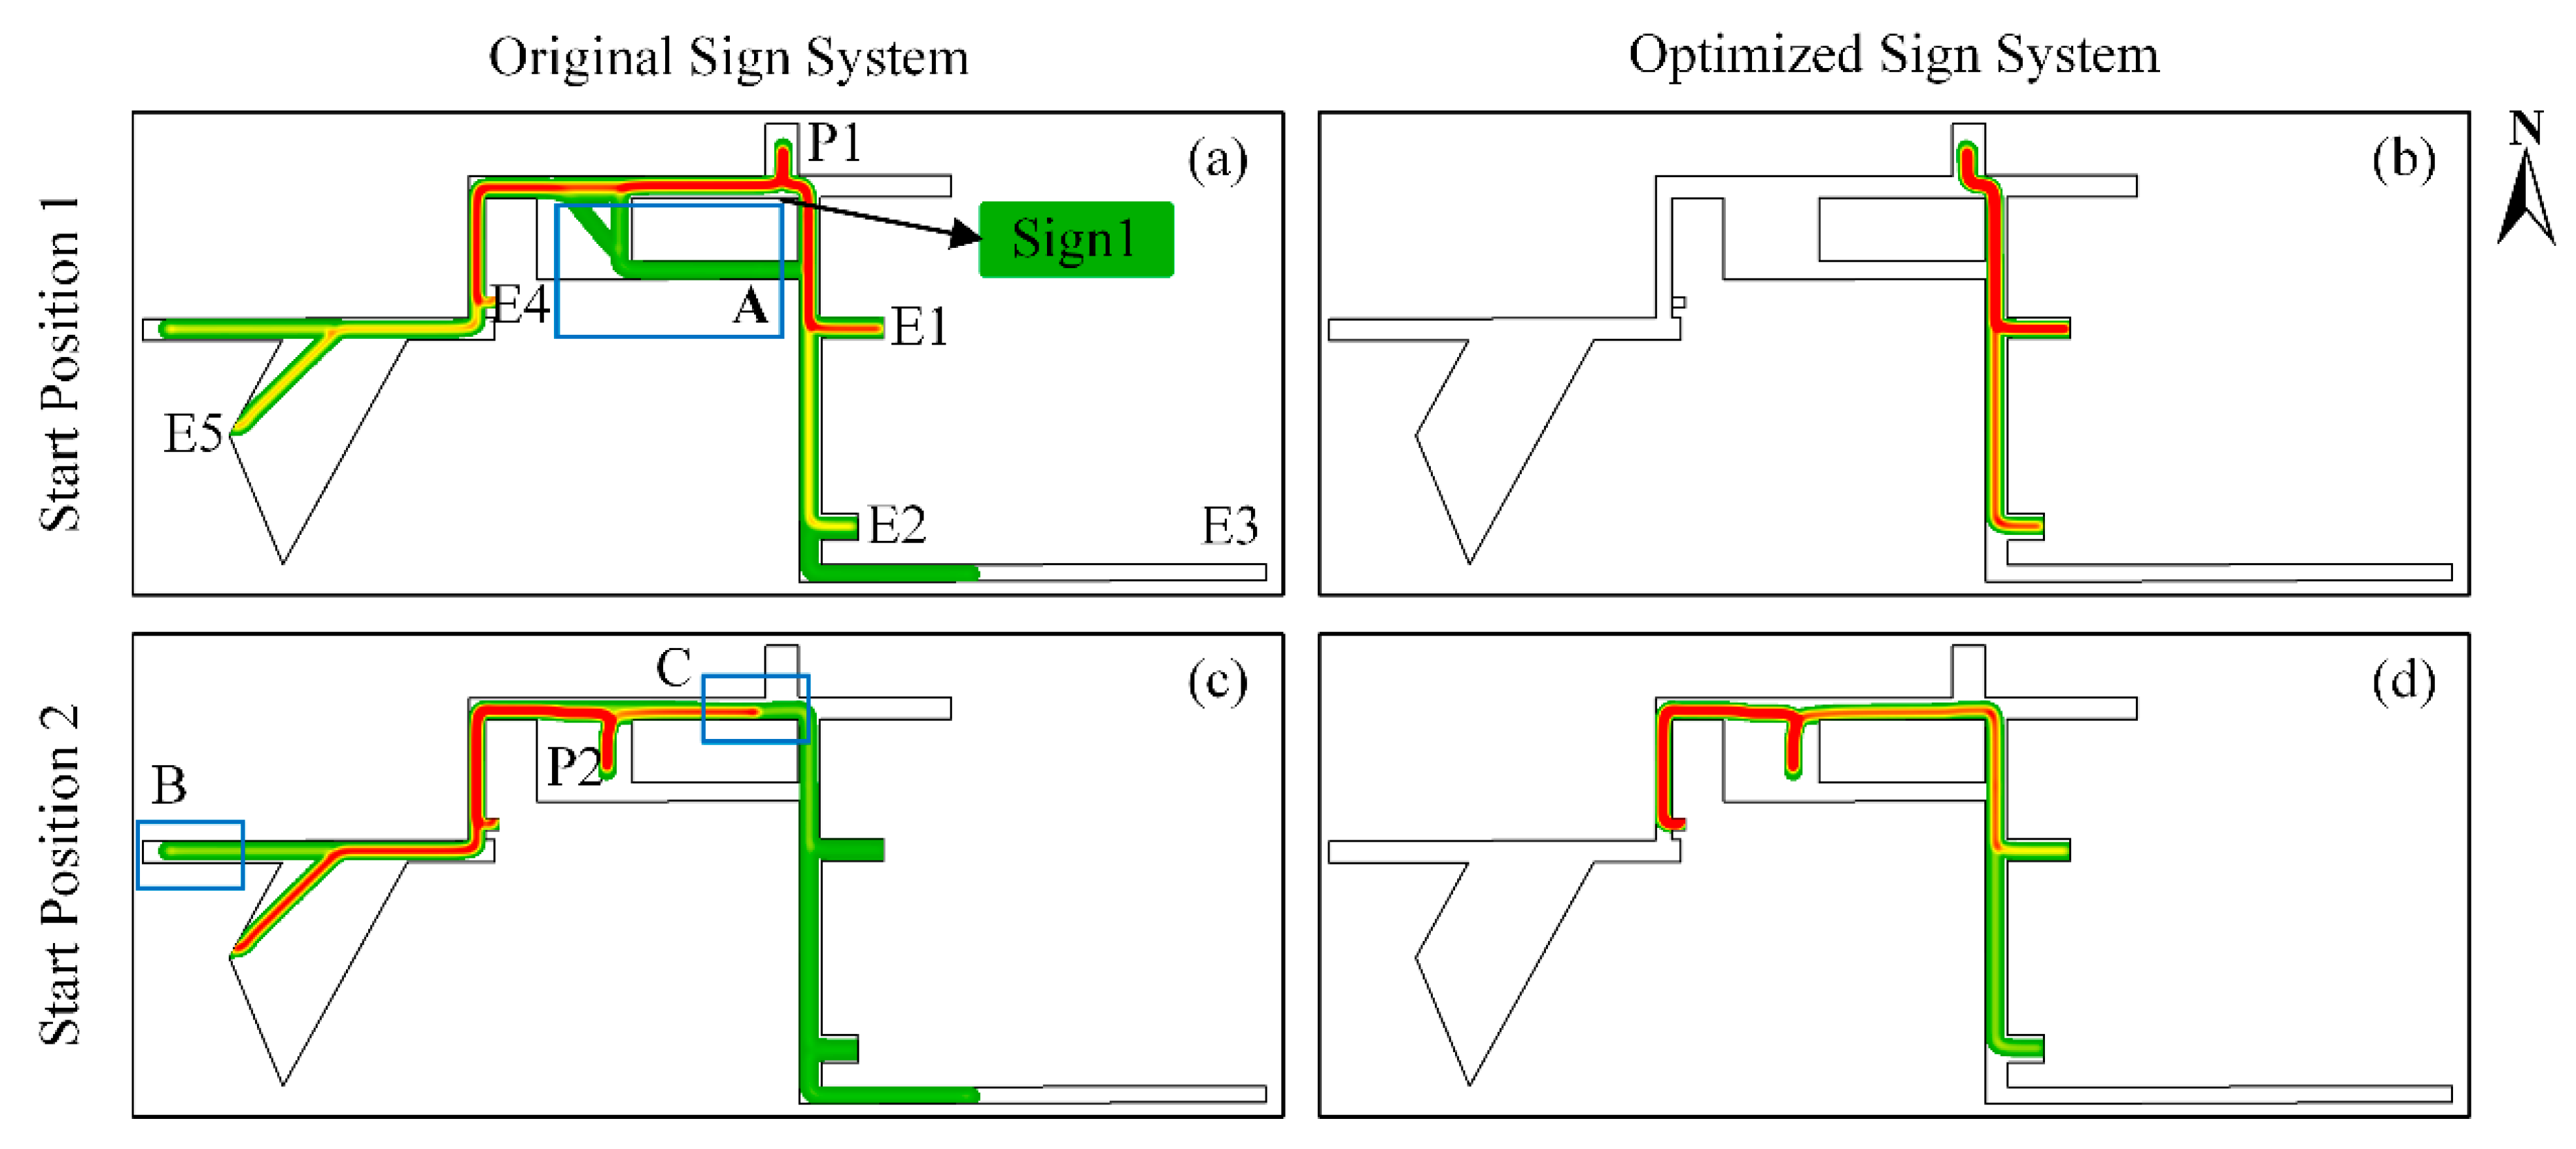
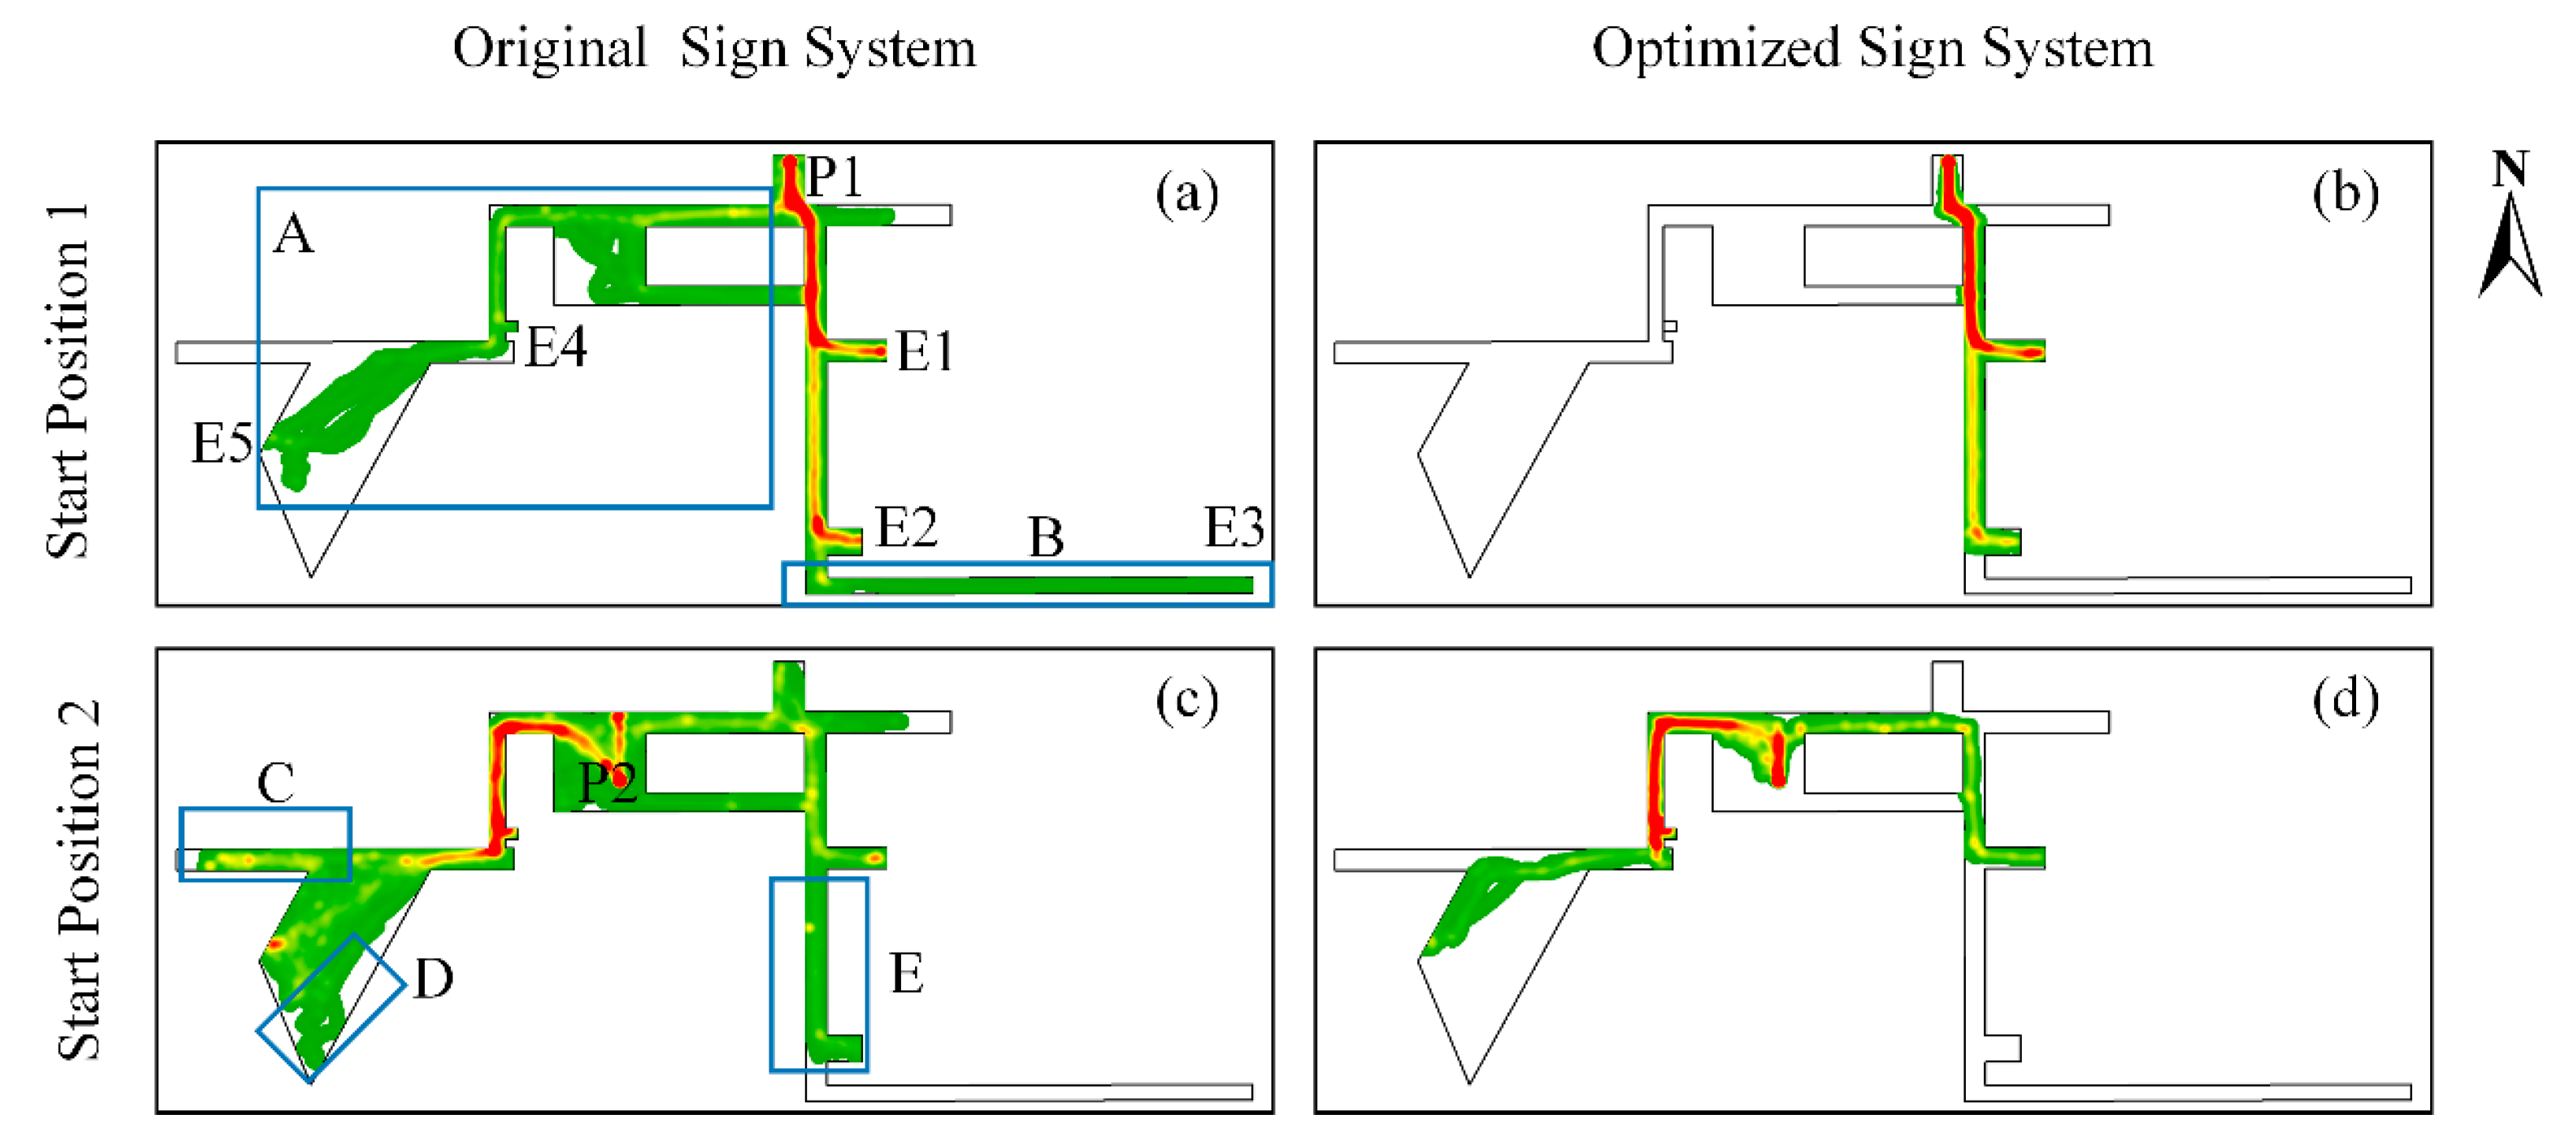
Figure 14 shows the comparison of the trajectory hotspot charts before and after optimization of the evacuation guidance system. Participants escaped from P1 in Figure 14a,b and escaped from P2 in Figure 14c,d. Comparing Figure 14a,b, we found that after the optimization procedure, almost all evacuees starting from P1 escaped from the nearest exit E1. Evacuees did not take a detour to area A. Comparing Figure 14c and Figure 14d, we can see that evacuees starting from P2 avoided detouring in area C. In the optimized evacuation guidance system, evacuees from P2 (Figure 14d) were divided into left and right routes. Most evacuees chose the left route and escaped from E4, and a small number of evacuees missed E4 and ultimately escaped from E5. All evacuees who chose the right route escaped from E1. Interestingly, some evacuees did not find the nearest exit E1 and escaped from E2 (Figure 14b,c), while no evacuees escaped from E2 in Figure 14d. We believe this is related to the influence of ignorance of signs during emergencies as illustrated in [26]. This phenomenon has been proven with eye tracking experiments, showing that the normal sign detection probability is approximately 79% with no surrounding people.
3.3. Model Simulation of an Emergency Evacuation
We simulated the evacuation process using the perception model in a virtual environment with an original guidance system and an optimized guidance system. Similar to the VR experiments, we performed the model simulation using P1 and P2 as starting points 50 times each. Figure 15 shows the hotspot charts of the simulated trajectories. A comparison with Figure 14 shows that the model simulation results were basically the same as the results of the VR experiments, whether for the original guidance system or the optimized guidance system. Specifically, approximately half of the agents chose the left route, and half of the agents chose the right route since sign 1 was a bidirectional evacuation sign (Figure 15a). Most evacuees on the left escaped from E4, some escaped from E5, and a few escaped from E1 and E2 after detouring in area A. After optimization of the evacuation guidance system (Figure 15b), evacuees starting from P1 almost all escaped from E1, and a few escaped from E2, and this was consistent with the verified VR experiment 2 results. The agents starting from P2 in the original guidance system were also divided into two routes (Figure 15c), where more agents chose the left route than the right route. In area C, some agents turned around after perceiving sign 1, lengthening the escape route. Note that some agents turned around at a certain distance from the dead end in area B, which was consistent with the VR experiments. After optimization (Figure 15d), most agents escaped from E4, and a few agents escaped from E1 and E2 on the right. The turn-around behavior in area C disappeared after the optimization of sign 1.
To quantitatively evaluate the difference between the spatial distributions of the trajectory data of the VR experiments and the model simulations, the frequency values of eight hotspot charts in Figure 14 and Figure 15 were extracted. After the areas with no data were excluded, the data were grouped into four paired data, and each pair was the value of the same pixel from the VR experiment and the model simulation, respectively. The Pearson correlation coefficient test was employed on these data. The results (Table 1) show that the Pearson correlation coefficient were all positive, meaning that the four paired datasets were positively correlated. The values of 0.47–0.67 could be regarded as very high considering that the trajectories were affected by complicating factors. The p-values indicate that the results were statistically significant. Thus, we consider the spatial distribution of the trajectory of the perception model and the VR experiment to be basically the same.
The average escape time and distance of the VR experimental results and model simulation results are listed in Table 2. By comparing the results, we can see that the escape times and distances in P1 were consistent, while in P2, there were some differences. We believed this was related to random behavior. For example, some evacuee detour behaviors were not reflected in the model simulation results, as seen by comparing Figure 14 and Figure 15. T-tests and F-tests were performed on these results, and only 5 p-values (most were P2 in the original sign system) out of 16 were statistically significant, which rejected the null hypothesis that the two samples were same. The difference was mainly produced by a few participants wandering in the office building, which prolonged the average length of the trajectory and the average time of evacuation. We believed it was affected by behaviors (such as panic, etc.) that we cannot model in the perception model. However, the ratio of wandering participants was low, which means this was probably not a common pattern and the difference was acceptable. Thus, in terms of evacuation time and distance, we think that the VR experiment results and model simulation results were basically the same. Besides, although the absolute values of the results were different, the trends of the escape times and distances for the model simulations fit the results of the VR experiments well. Thus, we can quantitatively evaluate the improvement achieved by the optimized evacuation guidance system through model simulation. Comparing the results before and after the optimization procedure, the average escape time and distance of the optimized guidance system were obviously better than those of the original guidance system. The average escape time and distance of P1 and P2 were reduced by 37% and 28%, respectively.
Single agent model simulations were conducted for comparison with the VR experiment, which was limited by the hardware condition. However, the model proposed in the paper was also able to simulate the multi-agent scenarios, which were more common in reality. Thus, a simulation of 100 agents was performed to show this capability. The simulation results showed that the evacuation efficiency with the optimized sign system was greatly improved. It took 54 s for all the 100 agents to escape with the original sign system, while it only took 34 s in the optimized sign system. The time reduction was 37%, which was identified with the result of the single agent model simulation. Note that the trajectories of the agents showed great diversity under the joint driving force of SFM and the perception model. Especially in the open area, the agents can move around to avoid others instead of sticking to the course shown in the single agent simulation (Figure 15).
4. Discussion and Conclusions
Evacuation guidance systems are important in building evacuation. Limited work has been conducted on models for quantitatively optimizing and evaluating evacuation guidance systems. This paper proposed a perception model to be used in practice instead of the VR experiments, to optimize and evaluate evacuation guidance systems. A framework of optimizing and evaluating processes was provided. VR experiments were conducted to determine the parameter values of the perception model, to improve the evacuation guidance system by qualitative analysis, and to validate the perception model. The simulation results showed that the agents in the perception model had the ability to perceive signs in virtual environments and escape from the scene according to the evacuation guidance system. The main findings of this paper are as follows:
- (a)
- The average perception time for the evacuation signs was 291 ms, and most sign perception times were less than 500 ms in emergency evacuations. The horizontal angle range of the signs was [0°, 85°], the vertical angle range of the hanging signs was [15°, 30°], and the vertical angle range of the wall signs was [−50°, −10°]. The maximum perception distance was approximately 5.15 m.
- (b)
- The wall signs had a higher perception rate than the hanging signs, but the average perception time of the hanging signs was lower.
- (c)
- We optimized the evacuation guidance system in the research area, by adding seven signs, changing a sign’s direction, and moving a sign’s location.
- (d)
- The perception model proposed in this paper can quantitatively evaluate an evacuation guidance system before and after optimization, with the average escape time and distance of P1 and P2 reduced by 37% and 28%, respectively.
In this study, we found that evacuees moved according to the information of the perceived signs. This behavior was in line with that presented by Libi Fu et al. [27]. Besides, people tended to evacuate via the nearest exit as pointed out by Kobes et al. [28]. In the escape process, evacuees would follow the sign information if they perceived the sign. However, a perception rate existed, which indicated that the evacuee may ignore the sign within the visual range [9,26]. It was found in this paper that the wall signs yielded a higher perceptual rate than the hanging signs just as the result in [2,29]. Ding studied the effectiveness of evacuation signs based on eye tracking experiments and analyzed the perception time of different signs. The results showed that the perception time of hanging signs was less than that of wall signs [30]. This was consistent with our result. Filippidis stated that a horizontal angle >85° would make a sign invisible similar to the horizontal angle presented in this paper [30]. Wong performed experiments in a corridor to determine the perception distance [31], which was longer than that in this paper. There were two reasons that may account for this difference: First, the participants were directly informed to perceive the sign in their experiment but not in this paper. Second, the participants were concentrating on observing the sign in their experiment but were distracted by interior factors, such as panic, and external factors, such as decoration in the scene in our experiments.
Note that the research background of this paper is emergency evacuations. We believe that the perception parameters of escape behaviors during emergencies are different from those in normal situations. Therefore, the perception parameters proposed in this paper are for emergency situations. In addition, this paper only studies the optimization and evaluation method of evacuation sign systems but cannot propose setting schemes. The heterogeneity of pedestrians is not considered in this paper. In future research, the refined expressions of observation parameters, group behaviors, and interactions between people and environmental factors (such as light and smoke) should be thoroughly studied, as these factors are of great significance for improving the effectiveness of the model.
Author Contributions
Lin Huang designed the VR experiments, proposed the model, performed analysis and wrote the paper. Jianhua Gong and Wenhang Li conceived the study. All authors have read and agreed to the published version of the manuscript.
Funding
This research was funded by Pilot Fund of Frontier Science and Disruptive Technology of Aerospace Information Research Institute, Chinese Academy of Sciences (No. E0Z21101), the National Key Research and Development Program of China (No. 2019YFC1511304), the National Natural Science Foundation of China (No. 41971361), the Jiashan science and technology plan project (No.2018A08) and the National Key Research and Development Program of China (No. 2017YFB0503602).
Institutional Review Board Statement
We store and calculate the data only for research purposes and have an approval from administration of the Aerospace Information Research Institute, Chinese Academy of Sciences.
Informed Consent Statement
All the participants in virtual reality experiments provide informed consent. We do not reveal the identity or any other private information.
Data Availability Statement
The data are not publicly available due to privacy.
Acknowledgments
We are grateful to the members of the VGE research group for their stirring discussions and the reviewers for their helpful comments on this manuscript.
Conflicts of Interest
The authors declare no conflict of interest.
References
- Vilar, E.; Rebelo, F.; Noriega, P. Indoor Human Wayfinding Performance Using Vertical and Horizontal Signage in Virtual Reality. Hum. Factors Ergon. Manuf. 2014, 24, 601–605. [Google Scholar] [CrossRef]
- Yuan, Z.; Jia, H.; Zhang, L.; Bian, L. A social force evacuation model considering the effect of emergency signs. Simulation 2017, 94, 723–737. [Google Scholar] [CrossRef]
- Dubey, R.K.; Thrash, T.; Kapadia, M.; Hoelscher, C.; Schinazi, V.R. Information Theoretic Model to Simulate Agent-Signage Interaction for Wayfinding. Cogn. Comput. 2019. [Google Scholar] [CrossRef] [Green Version]
- Kim, H.; Lee, G.; Cho, J. Prototype development and test of a server-independent smart exit sign system: An algorithm, a hardware configuration, and its communication reliability. Autom. Constr. 2018, 90, 213–222. [Google Scholar] [CrossRef]
- Fu, M.; Liu, R. An approach of checking an exit sign system based on navigation graph networks. Adv. Eng. Inform. 2020, 46, 101168. [Google Scholar] [CrossRef]
- Fujita, Y.; Kurokawa, H. Genetic-Algorithm-Based Evacuation Sign Arrangement Method Using Multi-Agent Simulation. J. Signal Process. 2019, 23, 181–184. [Google Scholar] [CrossRef]
- Jung, J.; Kwon, J.; Mfitumukiza, J.; Jung, S.; Cha, J. IoT Enabled Smart Emergency LED Exit Sign controller Design using Arduino. Int. J. Adv. Smart Converg. 2017, 6, 76–81. [Google Scholar] [CrossRef] [Green Version]
- Olander, J.; Ronchi, E.; Lovreglio, R.; Nilsson, D. Dissuasive exit signage for building fire evacuation. Appl. Ergon. 2017, 59, 84–93. [Google Scholar] [CrossRef]
- Lawrence, P.J.; Xie, H.; Filippidis, L.; Galea, E.R.; Blackshields, D. Experimental Analysis of the Effectiveness of Emergency Signage and its Implementation in Evacuation Simulation. Fire Mater. 2012, 36, 367–382. [Google Scholar]
- Fujii, K.; Sano, T.; Ohmiya, Y. Influence of lit emergency signs and illuminated settings on walking speeds in smoky corridors. Fire Saf. J. 2020, 103026. [Google Scholar] [CrossRef]
- Guilei, S. Research on Location of Emergency Sign Based on Virtual Reality and Eye Tracking Technology. In Advances in Human Factors in Wearable Technologies and Game Design; Springer: Cham, Switzerland, 2020. [Google Scholar]
- Kinateder, M.; Warren, W.H.; Schloss, K.B. What color are emergency exit signs? Egress behavior differs from verbal report. Appl. Ergon. 2018, 75, 155–160. [Google Scholar] [CrossRef] [PubMed]
- Tang, C.H.; Wu, W.T.; Lin, C.Y. Using virtual reality to determine how emergency signs facilitate way-finding. Appl. Ergon. 2009, 40, 722–730. [Google Scholar] [CrossRef] [PubMed]
- Ma, P.; Jiang, Y.; Zhu, J.; Chen, B. The effect of escape signs on the pedestrians evacuation. Phys. A Statal Mech. Its Appl. 2019, 534, 121133. [Google Scholar] [CrossRef]
- Nassar, K. Sign Visibility for Pedestrians Assessed with Agent-Based Simulation. Transp. Res. Rec. J. Transp. Res. Board 2011, 2264, 18–26. [Google Scholar] [CrossRef]
- Liu, M.; Zheng, X.; Cheng, Y. Determining the effective distance of emergency evacuation signs. Fire Saf. J. 2011, 46, 364–369. [Google Scholar] [CrossRef]
- A, K.Y.; B, C.K.; C, J.P.; B, X.S. BIM-Controlled Signage System for Building Evacuation. Procedia Eng. 2015, 118, 284–289. [Google Scholar]
- Motamedi, A.; Wang, Z.; Yabuki, N.; Fukuda, T.; Michikawa, T. Signage visibility analysis and optimization system using BIM-enabled virtual reality (VR) environments. Adv. Eng. Inform. 2017, 32, 248–262. [Google Scholar] [CrossRef]
- Li, Y.; Yu, Z.; Chen, Y. Evacuation dynamic and exit optimization of a supermarket based on particle swarm optimization. Phys. A Stat. Mech. Its Appl. 2014, 416, 157–172. [Google Scholar] [CrossRef]
- Chen, C.Y. The design of smart building evacuation system. Int. J. Control Theory Appl. 2012, 5, 73–80. [Google Scholar]
- Filippidis, L.; Lawrence, P.J.; Galea, E.R.; Blackshields, D. Simulating the Interaction of Occupants with Signage Systems. Fire Saf. Sci. 2009, 9, 389–400. [Google Scholar] [CrossRef]
- Abdelghany, A.; Abdelghany, K.; Mahmassani, H.; Alhalabi, W. Modeling framework for optimal evacuation of large-scale crowded pedestrian facilities. Eur. J. Oper. Res. 2014, 237, 1105–1118. [Google Scholar] [CrossRef]
- Helbing, D.; Farkas, I.; Vicsek, T. Simulating Dynamic Features of Escape Panic. Nature 2000, 407, 487–490. [Google Scholar] [CrossRef] [PubMed] [Green Version]
- Niehorster, D.C.; Li, L.; Lappe, M. The Accuracy and Precision of Position and Orientation Tracking in the HTC Vive Virtual Reality System for Scientific Research. i-Perception 2017, 8, 204166951770820. [Google Scholar] [CrossRef] [PubMed] [Green Version]
- Beijing Municipal Commission of Planning and Natural Resources. Available online: http://ghzrzyw.beijing.gov.cn/biaozhunguanli/bz/jzsj/202002/t20200221_1665858.html (accessed on 1 November 2013).
- Zhu, Y.; Chen, T.; Ding, N.; Chraibi, M.; Fan, W.C. Follow the evacuation signs or surrounding people during building evacuation, an experimental study. Phys. A Stat. Mech. Its Appl. 2020, 560, 125156. [Google Scholar] [CrossRef]
- Libi, F.; Shuchao, C.; Weiguo, S.; Jie, F. The influence of emergency signage on building evacuation behavior: An experimental study. Fire Mater. 2018, 43, 22–33. [Google Scholar]
- Kobes, M.M.; Helsloot, I.I.; Vries, D.B.B.; Post, J.J. Exit choice, (pre-)movement time and (pre-)evacuation behaviour in hotel fire evacuation — Behavioural analysis and validation of the use of serious gaming in experimental research. Procedia Eng. 2010, 3, 37–51. [Google Scholar] [CrossRef] [Green Version]
- Ding, N. The effectiveness of evacuation signs in buildings based on eye tracking experiment. Nat. Hazards 2020, 103, 1201–1218. [Google Scholar] [CrossRef]
- Filippidis, L.; Galea, E.R.; Gwynne, S.; Lawrence, P.J. Representing the Influence of Signage on Evacuation Behavior within an Evacuation Model. J. Fire Prot. Eng. 2006. [Google Scholar] [CrossRef]
- Wong, L.T.; Lo, K.C. Experimental study on visibility of exit signs in buildings. Build. Environ. 2007, 42, 1836–1842. [Google Scholar] [CrossRef]
Figure 1.
Framework for optimizing and evaluating evacuation guidance systems.

Figure 2.
Real and virtual research area with an evacuation guidance system.

Figure 3.
Layout of the evacuation guidance system.

Figure 4.
Experimental process. (a) The staff explained the experimental requirements and precautions to the participants. (b) The participants independently completed the experiment.
Figure 4.
Experimental process. (a) The staff explained the experimental requirements and precautions to the participants. (b) The participants independently completed the experiment.

Figure 5.
Framework of the perception model.

Figure 6.
A decision point model with four directions.

Figure 7.
The evacuation sign model.

Figure 8.
Schematic diagram of perception.

Figure 9.
Desired velocity update algorithm.

Figure 10.
Perception times (a) and frequencies (b) of evacuation signs.

Figure 11.
Visual angles of evacuation signs: horizontal angles (a) and verticle angles (b).
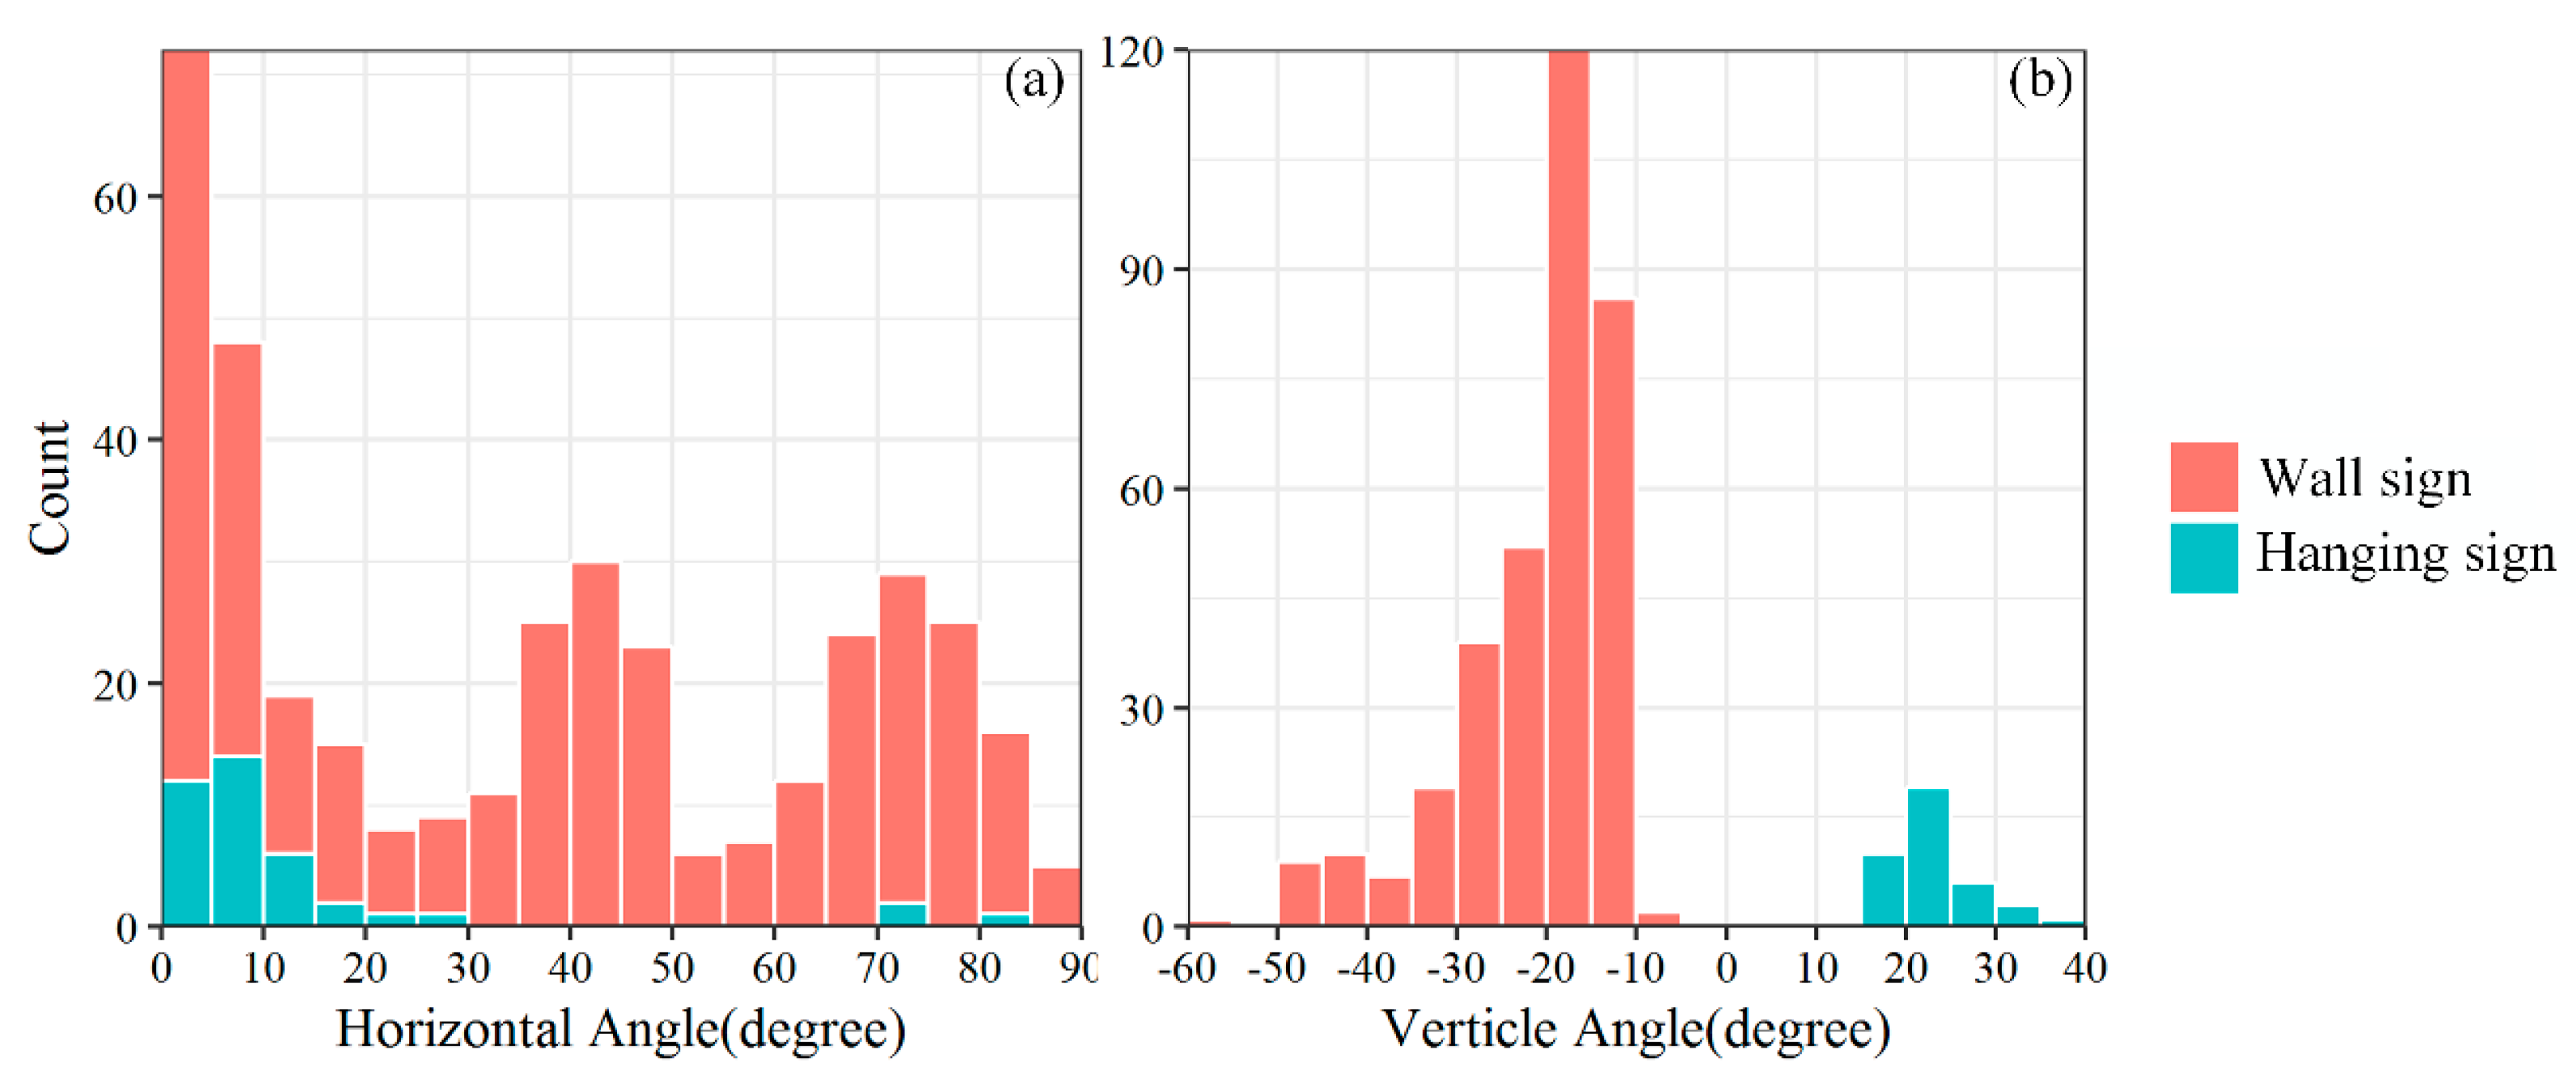
Figure 12.
Visual distances of evacuation signs.
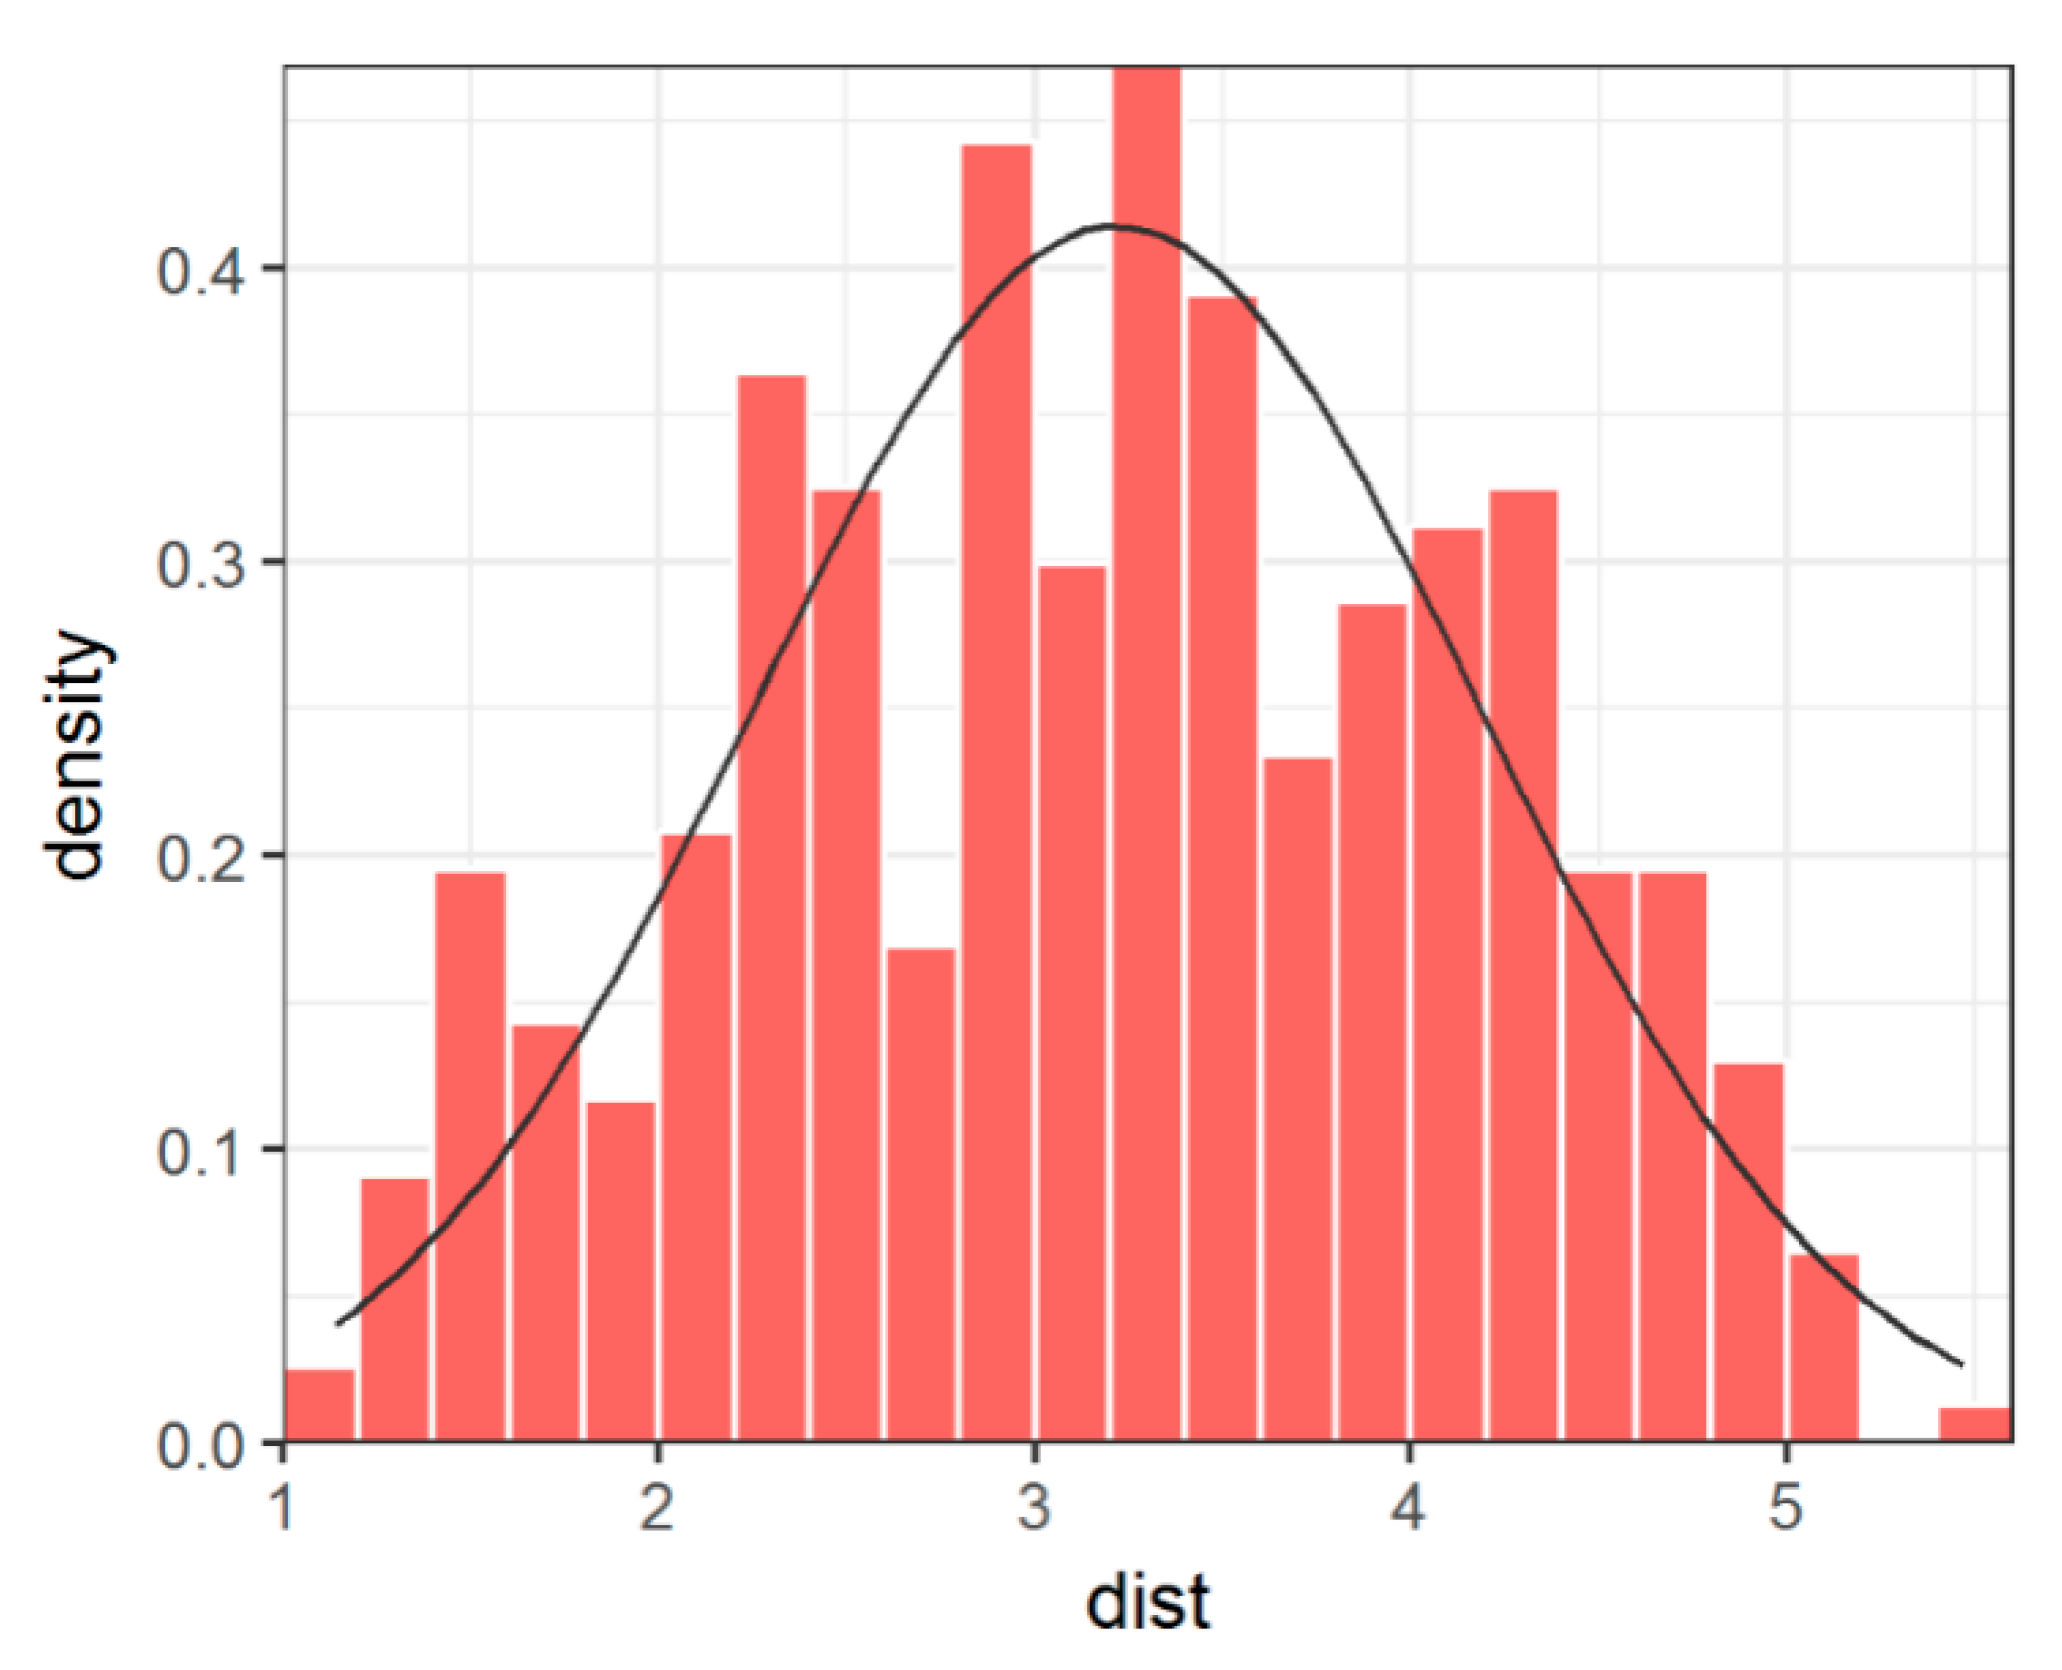
Figure 13.
(a) Hotspot chart of escape trajectories, (b) setup of the optimized sign system, and (c) hotspot chart of eye tracking data.
Figure 13.
(a) Hotspot chart of escape trajectories, (b) setup of the optimized sign system, and (c) hotspot chart of eye tracking data.

Figure 14.
Comparison of trajectory hotspot charts before and after optimization of the VR experiments. (a) Experimental environment with the original sign system, where participants start from P1; (b) Experimental environment with the optimized sign system, where participants start from P1; (c) Experimental environment with the original sign system, where participants start from P2; (d) Experimental environment with the optimized sign system, where participants start from P2.

Figure 15.
Comparison of trajectory hotspot charts before and after optimization of the model simulation. (a) Simulation result with the original sign system, and participants starting from P1; (b) Simulation result with the optimized sign system, and participants starting from P1; (c) Simulation result with the original sign system, and participants starting from P2; (d) Simulation result with the optimized sign system, and participants starting from P2.

Table 1.
Pearson correlation coefficient test of the trajectory spatial distribution between the VR experiments and the model simulations.
Table 1.
Pearson correlation coefficient test of the trajectory spatial distribution between the VR experiments and the model simulations.
| Position | Pearson Correlation Coefficient | p-Value |
|---|---|---|
| P1 of the original sign system | 0.479 | <0.05 |
| P2 of the original sign system | 0.526 | <0.05 |
| P1 of the optimized sign system | 0.639 | <0.05 |
| P2 of the optimized sign system | 0.676 | <0.05 |
Table 2.
Comparison of the time and distance of the VR experiments and the model simulations.
| Position | Resource | Time (s) | p-Value of t-Test | p-Value of F-Test | Distance (m) | p-Value of t-Test | p-Value of F-Test |
|---|---|---|---|---|---|---|---|
| P1 | Original VR | 41.2 | 0.48 | 0.73 | 57.51 | 0.89 | 0.47 |
| Original Model | 38.78 | 56.85 | |||||
| Optimized VR | 28.67 | 0.12 | 0.16 | 38.89 | 0.24 | 0.79 | |
| Optimized Model | 24.5 | 35.92 | |||||
| P2 | Original VR | 59.91 | <0.05 * | <0.05 * | 78.57 | <0.05 * | <0.05 * |
| Original Model | 40.8 | 59.69 | |||||
| Optimized VR | 33.95 | 0.09 | 0.04 * | 43.71 | 0.87 | 0.2 | |
| Optimized Model | 29.57 | 43.16 |
* Statistically significant at 95% confidence interval.
Publisher’s Note: MDPI stays neutral with regard to jurisdictional claims in published maps and institutional affiliations. |
© 2021 by the authors. Licensee MDPI, Basel, Switzerland. This article is an open access article distributed under the terms and conditions of the Creative Commons Attribution (CC BY) license (http://creativecommons.org/licenses/by/4.0/).
Share and Cite
MDPI and ACS Style
Huang, L.; Gong, J.; Li, W. A Perception Model for Optimizing and Evaluating Evacuation Guidance Systems. ISPRS Int. J. Geo-Inf. 2021, 10, 54. https://0-doi-org.brum.beds.ac.uk/10.3390/ijgi10020054
AMA Style
Huang L, Gong J, Li W. A Perception Model for Optimizing and Evaluating Evacuation Guidance Systems. ISPRS International Journal of Geo-Information. 2021; 10(2):54. https://0-doi-org.brum.beds.ac.uk/10.3390/ijgi10020054
Chicago/Turabian StyleHuang, Lin, Jianhua Gong, and Wenhang Li. 2021. "A Perception Model for Optimizing and Evaluating Evacuation Guidance Systems" ISPRS International Journal of Geo-Information 10, no. 2: 54. https://0-doi-org.brum.beds.ac.uk/10.3390/ijgi10020054
Note that from the first issue of 2016, this journal uses article numbers instead of page numbers. See further details here.