Article

Mapping Allochemical Limestone Formations in Hazara, Pakistan Using Google Cloud Architecture: Application of Machine-Learning Algorithms on Multispectral Data

1
Intelligent Information Processing Lab, National Centre of Artificial Intelligence, University of Engineering and Technology (UET), Peshawar 25000, Pakistan
2
Department of Mining Engineering, University of Engineering and Technology (UET), Peshawar 25000, Pakistan
3
Department of Electrical Engineering, University of Engineering and Technology (UET), Peshawar 25000, Pakistan
4
National Centre of Excellence in Geology, University of Peshawar, Peshawar 25000, Pakistan
*
Author to whom correspondence should be addressed.
ISPRS Int. J. Geo-Inf. 2021, 10(2), 58; https://0-doi-org.brum.beds.ac.uk/10.3390/ijgi10020058
Submission received: 8 December 2020 / Revised: 23 January 2021 / Accepted: 27 January 2021 / Published: 1 February 2021

Abstract

:
Low-resolution Geological Survey of Pakistan (GSP) maps surrounding the region of interest show oolitic and fossiliferous limestone occurrences correspondingly in Samanasuk, Lockhart, and Margalla hill formations in the Hazara division, Pakistan. Machine-learning algorithms (MLAs) have been rarely applied to multispectral remote sensing data for differentiating between limestone formations formed due to different depositional environments, such as oolitic or fossiliferous. Unlike the previous studies that mostly report lithological classification of rock types having different chemical compositions by the MLAs, this paper aimed to investigate MLAs’ potential for mapping subclasses within the same lithology, i.e., limestone. Additionally, selecting appropriate data labels, training algorithms, hyperparameters, and remote sensing data sources were also investigated while applying these MLAs. In this paper, first, oolitic (Samanasuk), fossiliferous (Lockhart and Margalla) limestone-bearing formations along with the adjoining Hazara formation were mapped using random forest (RF), support vector machine (SVM), classification and regression tree (CART), and naïve Bayes (NB) MLAs. The RF algorithm reported the best accuracy of 83.28% and a Kappa coefficient of 0.78. To further improve the targeted allochemical limestone formation map, annotation labels were generated by the fusion of maps obtained from principal component analysis (PCA), decorrelation stretching (DS), X-means clustering applied to ASTER-L1T, Landsat-8, and Sentinel-2 datasets. These labels were used to train and validate SVM, CART, NB, and RF MLAs to obtain a binary classification map of limestone occurrences in the Hazara division, Pakistan using the Google Earth Engine (GEE) platform. The classification of Landsat-8 data by CART reported 99.63% accuracy, with a Kappa coefficient of 0.99, and was in good agreement with the field validation. This binary limestone map was further classified into oolitic (Samanasuk) and fossiliferous (Lockhart and Margalla) formations by all the four MLAs; in this case, RF surpassed all the other algorithms with an improved accuracy of 96.36%. This improvement can be attributed to better annotation, resulting in a binary limestone classification map, which formed a mask for improved classification of oolitic and fossiliferous limestone in the area.

1. Introduction

Limestone is a significant resource available in Pakistan [1] and is used to produce cement, concrete, road base, and dimension stone products [2]. Since conventional exploration/prospecting practices are costly, time-consuming, are limited by physical access to hilly terrains, and prone to accumulating errors, remote sensing has been widely utilized in lithological/geological mapping [3,4,5,6,7,8,9,10]. Most minerals respond to near infrared (NIR), shortwave infrared (SWIR), and thermal infrared (TIR) wavelengths [11,12,13]. Sedimentary rock units such as dolomite, quartzite, and limestone mainly respond to the TIR bands [14,15]. However, limestone also reflects the visible and NIR electromagnetic radiations while absorbing SWIR [16]. A variety of remote sensing data sources are available from non-commercial (e.g., Landsat-8, ASTER, Sentinel-2) to commercial (SPOT, AVIRIS, WorldView–3) satellites. The spectral bands of ASTER L1T, Sentinel-2 MSI, Landsat-8/7 data sources have been useful for geological mapping and mineral exploration. The ASTER sensor has CaCO3 absorption in SWIR and TIR bands [16], while SWIR bands of Sentinel [17] and SWIR and TIR bands of Landsat-8 [5,7,18,19,20,21,22,23] have also been useful in identifying and discriminating carbonate minerals. Individual bands in remote sensing images can produce detailed maps; however, it is a time-consuming process requiring manual comparison and interpretation through the naked eye and substantial expert knowledge [24]. Conventionally, band ratios, derived on a trial and error basis, have been useful to map geology; e.g., ASTER bands 14/13 have been used for limestone mapping [16,25]. However, environmental factors, instrumental limitations, and mixed albedo from different lithologies invite robust data mining and machine-learning algorithms (MLAs) to reveal relevant patterns for generating reliable geological maps [26].
Accuracies of machine-learning algorithms (MLAs) rely on careful selection of data labels, which can be flawed due to lower spatial resolution, misregistration, update delay, or lithological complexity [27]. Since data labeling/annotation is a significant challenge in achieving reliable mapping accuracy through MLAs [27], post-classification field surveys must support classification accuracy. Algorithms prone to noise, such as classification and regression tree (CART) [28], must be used with care compared to random forest (RF), which is relatively less sensitive, more generalized, and therefore, widely used for geological mapping [29,30]. However, CART can also outperform RF if training data are noise-free and labels are accurate [28].
Data annotation/labels can be improved through fusion maps obtained by applying unsupervised techniques such as principal component analysis (PCA), Crosta technique, DS, and unsupervised clustering [31,32,33]. The Crosta technique or feature-oriented principal component analysis (FPCA) enables one to select principal components (PC), having significant spectral information about the specific targets, by analyzing the eigenvector loadings obtained from PCA [34]. A variant of K-means clustering known as the X-means clustering algorithm (in the GEE API) also reports the optimum number of clusters based on a criterion such as Bayesian information criterion (BIC) or Akaike information criterion (AIC) during classification [35].
The grains of all limestone are broadly known as allochems, resulting from the in-place crystallization of calcium carbonates [36]. Allochems are further classified into four types (1) ooids, (2) peloid, (3) intraclasts, known as non-skeletal allochems, and (4) fossils (i.e., remains of flora and fauna) as skeletal allochems [36,37]. Different carbonate concentrations and rock sources indicate the amount of absorption in the SWIR bands [7]. Since limestone has significant compositional variations [38,39], leading to a different quality of products [38,39], Google’s cloud computing capabilities [40,41], freely available satellite data, and MLAs [42,43] can be used for mapping limestone formations through a combination of MLAs applied on different datasets.
Recently, an SVM algorithm was applied on DEM from ALOS/PALSAR and Landsat-8 OLI with an overall accuracy (OA) of 85% for mapping dolomite, limestone, and eight other lithologies; while 97.62% user accuracy (CA) was reported for mapping limestone [11]. Contrary to limestone differentiation from rock types with distinctive chemical compositions, this research contributes to mapping rock subtypes due to subtle differences (i.e., sub-classification of limestones). Furthermore, GEE platform was used to achieve this objective; CART, RF, NB, and SVM MLAs were trained with reliable data labels and applied to ASTER, Landsat-8, and Sentinel-2 datasets. A two-step classification approach is presented, i.e., a binary limestone classification step and then using this as a mask to subclassify it into its subtypes, i.e., allochemical limestone formations at District Haripur, Hazara, Pakistan. MLAs’ accuracy was improved by hyperparameter tuning and careful selection of data labels (obtained after fusion of four unsupervised techniques applied to ASTER, Landsat-8, and Sentinel-2 data) during the binary limestone classification. The algorithm with the best accuracy for multispectral data, supported by field validation, was reported for differentiating subtleties between oolitic and fossiliferous formations at District Haripur, Hazara, Pakistan. Though all limestone-bearing formations can be utilized as a resource for the cement industry, the study could be useful to map the region’s dimension stone resources based on indirect indications of surface field features. The bedded feature is suitable for dimension stone resources and is associated with oolitic limestone of Samana Suk formations in this region, whereas the fossiliferous limestone formations could be less suitable due to their nodular field feature in this region.

2. Location of the Region

The area under study extends to around 2760 km2 from Tarbela Dam in Khyber Pakhtunkhwa to Lehtrar in the Rawalpindi District of Punjab, Pakistan, as shown in Figure 1. The Hazara map [44] is available from 34°21′4.7268″ N, 73°0′0.8172″ E to 33°43′6.8448″ N, 73°30′6.5592″ E on a scale of 1:63,360 or 1 inch to 1 mile. While the GSP map 43C/9 covers the region between 34°0′0″ N, 72°30′0″ E and 33°45′0″ N, 72°45′0″ E on a scale of 1:50,000. However, a geological map was not available for the region of interest between these two maps, as shown in Figure 1. There are three cement quarries in this region, i.e., Dewan Cement Factory, Bestway Hattar, and Bestway Farooqia, and it is a potential site for new cement factories.

3. Geology of the Region

The location understudy is predominantly composed of the following limestone-bearing formations: Samana Suk, Kawagarh, Lockhart, Margalla Hill, and the Chorgali formations [45]. The Samana Suk formation is medium- to thick-bedded limestone as a product of shallow marine carbonate platform settings [46,47,48], while Kawagarh is a thin-bedded deep marine micritic limestone that overlies the Samana Suk formation [49,50]. The Palaeocene Lockhart Limestone, Eocene Margalla Hill Limestone, and Chorgali formation are predominantly nodular fossiliferous limestone with a variable amount of shale intercalations formed in shallow carbonate depositional environment [51,52]. The oldest formation exposed in the study area is the Precambrian Hazara formation, which is confined in the western part of the study area and is striking approximately northeast–southwest. The overlying stratigraphic succession, predominantly composed of the earlier-mentioned limestone-bearing Mesozoic and Paleogene formations, follows the same striking trend. The Hazara formation is predominantly composed of slate, shale, and claystone with subordinate siltstone and sandstone beds. This study’s objective was to use MLA for mapping dominant limestone-bearing formations of an unmapped area within the District Haripur of the Hazara Division in the Khyber-Pakhtunkhwa province of Pakistan. All these limestone-bearing formations can be utilized in the construction industry as raw material for cement and aggregate. The area under study is easily accessible by metaled roads; therefore, mapping these limestone units must serve as a baseline information for their utilization in the construction industry.

4. Material and Methods

4.1. Classification and Regression Tree (CART)

CART is an intuitive model in the form of an inverted tree-like formulation, requiring lesser data [53], where an input attribute with the least entropy/impurity on the output variable is selected as the root node at the top. A set of questions applied from the top downwards would predict the output class label as the leaf node at the bottom. The number of branches depend on the entropy of the subsets of data split on the root node, and the next node is chosen for each branch using a smaller subset of data; the tree grows until each branch terminates at the leaf node representing the output variable. Gini Index or information gain [53] is used to solve a set of two questions repeatedly to formulate CART, i.e., (1) choosing the placement of appropriate feature/variable in the hierarchy, (2) the condition for splitting the dataset on the selected variable. Each node on a branching junction represents a variable’s selection after a test, while each branch represents the test outcome. The variable selection and number of branches from each split on the selected variable are based on ID3 [54], Gini Index [55], Chi-square [56], or reduction in variance [57] algorithm. The entropy of the output variable represents the entropy of the complete dataset. The data are split on each input attribute, the combined entropy of each combination of a target and input variable is calculated. The ID3 uses entropy to calculate the homogeneity of a sample, an utterly homogeneous sample reports entropy as zero, while if the sample is equally divided, it has an entropy of one. The attribute with the most considerable information gain is selected as the decision node. A branch with entropy greater than zero needs further splitting, while a branch with entropy of zero is a leaf node. The data are divided into subsets of branches and ID3 runs recursively on non-leaf branches. Information gain I G ( T , a ) can be calculated using Equations (1) and (2) given below:
I G ( T , a )   =   H ( T ) H ( T | a )
H ( T )   =   i   =   1 J p i l o g 2 p i
Classification and regression tree (CART) can use the Gini method to solve binary classification problems; a higher Gini Index value represents a higher homogeneity. Gini Index of the complete dataset is calculated as:
G ( D ) =   1 i = 1 J e i 2
where e i represents the count of specific class labels divided by the total count of samples. The Gini value for all input variables is calculated in the next step, and the attribute with the least impurity is selected as a root node. For this purpose, subsets of data were made from binary splits of all input variables; if a variable A has v possible values, it is split into V   =   2 v 2 binary subsets. Gini indices of each of the V possible subsets of any input variable A   are calculated using the formula below:
G A ( D ) =     D 1 D G ( D 1 ) + D 2 D G ( D 2 )
where D 1 represents the number of tuples in a given attribute A   belonging to the subset, and D 2 represents the number of tuples in attribute A   not belonging to a given subset of an attribute A . The Gini Index of attribute A   is chosen by considering the best split among V possible splits, i.e., the split with a minimum G A ( D ) value. The best G A ( D ) value is calculated for each attribute, and the reduction in the impurity index of an attribute is derived by G ( A ) as:
G ( A )   =   G ( D ) G A ( D )
The attribute with the most significant reduction in impurity is selected as the tree’s decision node. The process repeats to select the best nodes, splitting branches down the tree until a leaf node is reached. Additionally, a criterion, such as the maximum number of nodes in the tree, could be set to threshold the splitting process from developing over-complicated tree structures and prevent overfitting. Similarly, minimum leaf population sets a lower bound on the number of leaf nodes to avoid oversimplified tree structures.
A minimum split cost can be set to stop splitting after a particular cost on the training set, or a minimum leaf population can be set to create nodes whose training set contains a minimum number of points [58]. Alternatively, the tree is pruned backward to reduce complexity and overfitting by reducing the size of a deep tree by removing tree sections to a point where the validation error is minimum.

4.2. Random Forest (RF)

Random forest is a supervised learning ensemble classifier/regressor that develops multiple decision trees and averages decisions from multiple decision trees to get an accurate and stable prediction. As discussed before, decision trees are built using entropy, information gain, and Gini Index. The forest of multiple decision trees is mostly trained using a bagging method. The process includes bagging the training set X with its labels Y , randomly B times with replacement to train B trees in the random forest f . After training, new samples can be classified or predicted by averaging accuracy from all individual classification or regression tree, f b = [ f 1     f B   ] . Mathematically,
f   =   1 B b   =   1 B f b ( x )
A random subset of variables at each step is used to build the decision tree via random sampling from the original dataset with replacement. The number of decision trees in a random forest also affects the results. Each decision tree in the forest works individually to predict output (label) from the predictor variables. A lower number of trees are susceptible to noise/outliers in the data than a larger number of trees [59]. The number of trees hyperparameter depends on the number of classes; if the number of classes is large, but the number of trees is too small, it will lower the predictive accuracy [60]. The higher the number of trees, the more samples are created for the given data, and the less biased the model is. However, since each tree’s training sample is drawn randomly by replacement, a parameter representing a maximum number of trees should be defined to avoid duplication of training samples from the data [59]. Each decision tree’s depth is characterized by the minimum size of terminal/leaf nodes parameters. The final output (label) is decided based on the majority votes of the individual decision trees.

4.3. Naïve Bayes (NB)

Naïve Bayes is a probabilistic algorithm that utilizes the Bayes theorem for classification and regression. Assuming the prior probability P( y j ) of “ j t h ” possible class; a given dataset with “ l ” predicting features x 1 . x l to differentiate between j t h class of output y j . The posterior probability of y 1 , i.e., P ( y j | x 1 , x 2 . , x l ) , for different values of these features, can be derived using the product of the prior P( y j ) and the likelihood of j t h class y j having different values for such features in a dataset, i.e.,   P ( x 1 , x 2 . , x l | y j ) . Mathematically:
P ( y j | x 1 , x 2 . , x l ) = P ( y j )   ·   P ( x 1 , x 2 . , x l | y j )   P ( x 1 , x 2 . , x l )
The denominator can be ignored for classification, since only relative probabilities matter, as the term is used in the calculation of posterior for all possible classes of   y j   .   Considering the most probable label “ y ”, the Bayes’ theorem may lead to estimation of some very complex and challenging probabilities, as the number of features and groups within each feature increases. Therefore, the naïve Bayes algorithm is used with a “naïve” assumption considering each feature x i being independent. Then, the naïve Bayes theorem in terms of the most likely label y can be written as the product of conditional probability for each possible feature value of all independent features and the prior P ( y ) :
a r g m a x y P ( c l a s s = y | x 1 , x 2 , . . , x l ) = a r g m a x y P ( c l a s s = y ) i = 1 l P ( x i | c l a s s = y )
The classification is performed in two phases: in the learning phase, the classifier trains its model by calculating the prior distribution P ( y ) = c ( y ) / n over each label type, where c ( y ) is the number of training instances with label y, and n is the total number of training samples/pixels. The conditional probabilities of features can be calculated as:
P ( X = x i | Y = y ) =   c ( x i   ,   y ) + λ   x i ( c ( x i , y ) + λ   )
where c ( x i   ,   y ) is the number of times a feature x i reported value y in the training samples. The laplace or additive smoothing factor “ λ ” (lambda) is used, which adds λ counts to every possible observation value to avoid receiving an estimate of zero. Laplace smoothing draws estimated probability distribution closer to a uniform distribution and ensures that estimated probabilities are always non-zero. The greater is lambda’s value, the closer one gets to a uniform distribution. The validation dataset can be used to determine a suitable value of λ . The classifier’s performance can be evaluated based on various parameters such as accuracy, error, precision, and recall.

4.4. Support Vector Machine (SVM)

A support vector machine (SVM) is used for regression, classification, and clustering, which uses the extreme cases in training data and draws a hyperplane (decision boundary), calculating support vectors, i.e., the distances between the nearest data points to the hyperplane from each class; the hyperplane is altered, maximizing the distance between the closest data points and the hyperplane. For a two-dimensional problem, this hyperplane is a line that separates the two classes lying on either side of the plane. For linear SVM, the hyperplane or the decision boundary is learned by transforming the problem using linear algebra. The equation for prediction of a new input using linear kernel is defined as the dot product of the input x and each support vector v i of n elements as given in Equation (10),
f ( x )   =   B ( 0 )   +   i = 1 n ( a i   *   ( x , v i ) )
This equation models the decision boundary by taking the inner products of an input vector x with all support vectors v i in training data. In the training phase, the coefficients B ( 0 ) and a i (for each input) are estimated from the training data. In SVM, kernels are used to project the data into higher-dimensional space to separate by a line. Linear, polynomial, and Radial Basis Function (RBF) kernels can also be used to draw separation lines in higher dimensions. The polynomial kernel is given by:
K ( x 1 , x 2 ) = ( g a m m a * x 1 T x 2 + C o e f 0 ) degree )
Additionally, an RBF kernel is by:
K ( x 1 , x 2 ) = e x p ( g a m m a * | x 1 x 2 | 2 )
Here, x 1   and x 2 are values for any two observations/points/pixels; C o e f 0 is used to “scale” the data. Increasing the “degree” parameter would make the model more complex to overfit the data. The gamma parameter defines how far the influence of a single training sample reaches; a low gamma value means “far”, and a higher value means “close” samples influence the separation line. The C and N u are regularization hyperparameters corresponding to the lower and upper bound on the number of misclassified samples and have different ranges, i.e., 0 to infinity and 0 to 1, respectively. Larger values of the cost parameter C allow for a smaller margin if all training samples are classified correctly, while a minimal value of C   will prefer a larger margin, even if some samples were misclassified.

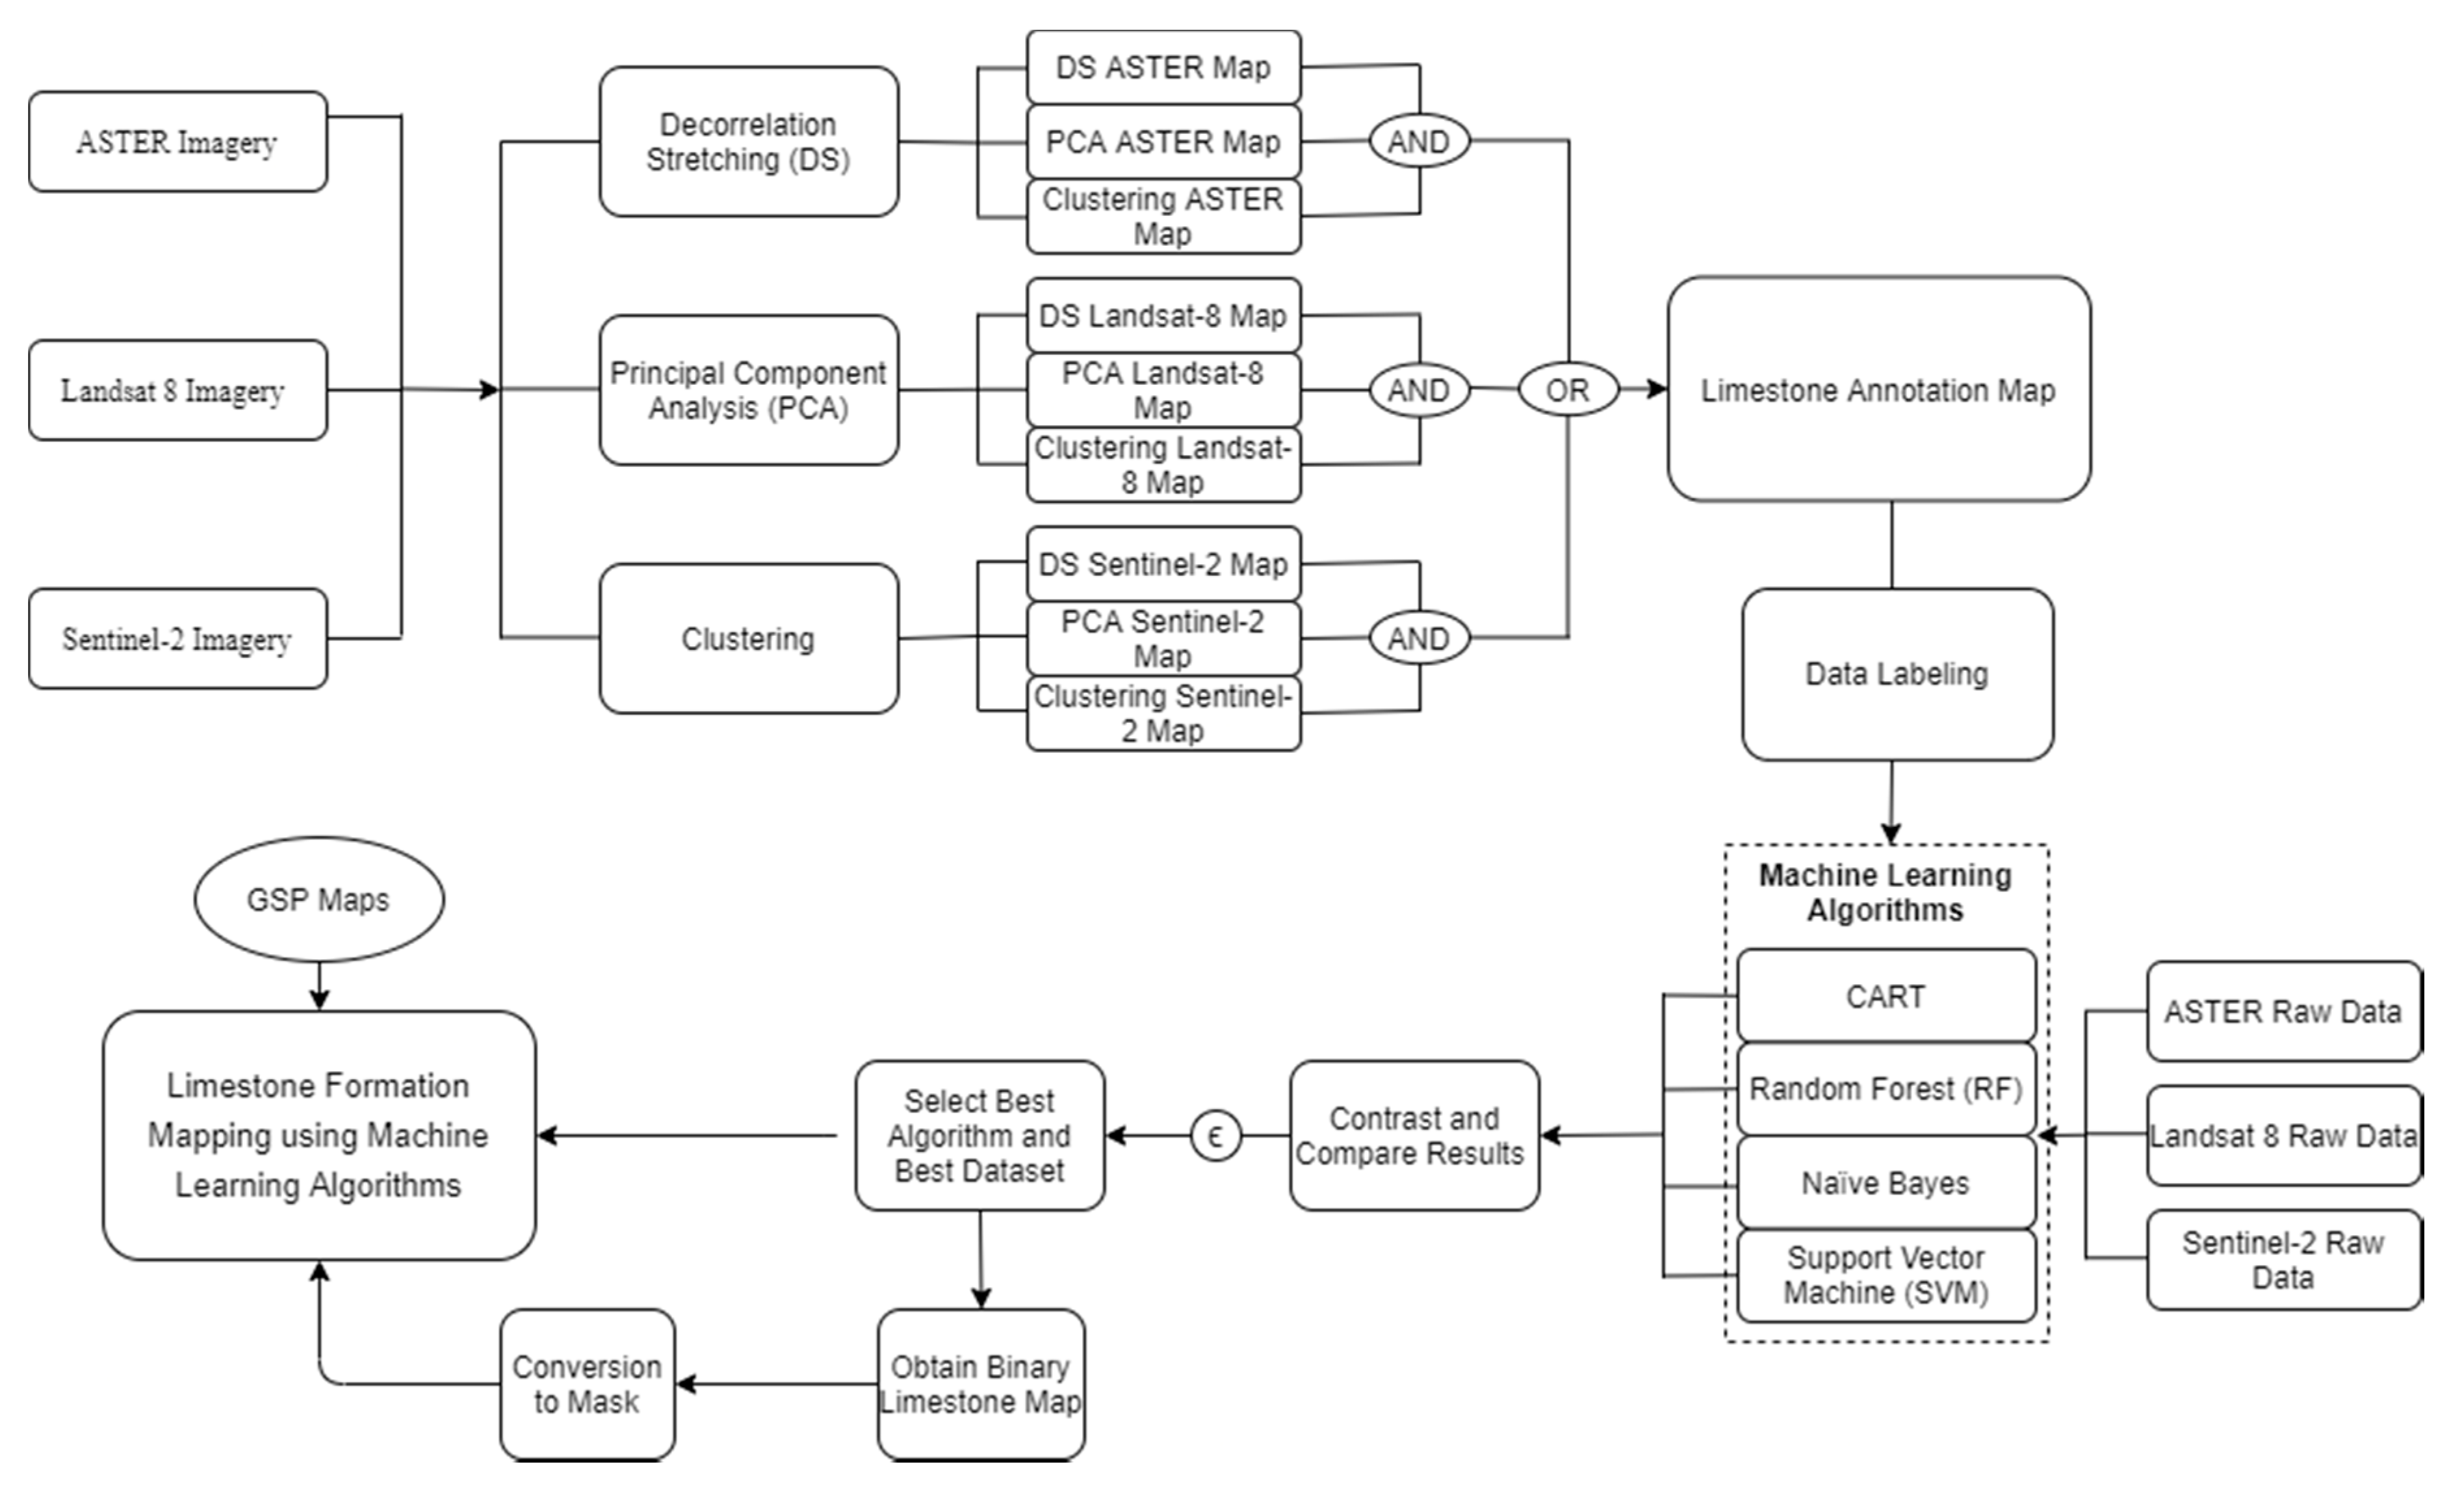
5. Mapping Allochemical Limestone Formations through MLAs

Initially, sample patches were taken from the GSP map to classify three lithotypes (i.e., two dominant allochemical types of limestone formations and Hazara slate and land covers) by applying four MLAs on three multispectral data sources using Google Earth Engine (GEE). Next, nine thematic maps were generated by applying PCA, DS, and X-means classification to ASTER, Sentinel-2, and Landsat-8 OLI. The three maps representing a common technique, but different data sources were fused with an AND operator, and the resultant three maps of each technique were fused with an OR operator to obtain the binary limestone labels. Selected patches from these labels were fed to CART, RF, NB, and SVM algorithms to perform binary limestone classification using the three data sources. Hyperparameters were explored to obtain better training results for limestone mapping. The maps obtained after applying different classifiers were validated by field visits along traverses (shown in Figure 1) across the strata strike, where Global Positioning System (GPS) coordinates were recorded with photographs of the outcrops. The binary limestone classification map was used as a mask to further sub-classify oolitic (Samanasukh) and fossiliferous (Lockhart, Margalla) limestone formations. Training patches were selected from field surveys, and the data source with the highest reported accuracy for the binary limestone mapping was fed to CART, RF, NB, and SVM algorithms. The detailed methodology of the study is summarized in Figure 2.

5.1. Multispectral Data Acquisition and Pre-Processing

Images were acquired using GEE with the least vegetation, cloud cover, noise, and shadows from the GEE database. No mosaicking was necessary, since, in GEE, strips of collected data are packaged into overlapping “scenes”, i.e., ASTER having a 60 × 60 km scene, Landsat-8 with 170 × 183 km, and Sentinel-2 with 290 × 290 km scenes were enough to cover the whole region. Data were selected for dry seasons to avoid vegetation; terrain, geometric, and radiometric corrections were also performed on the ASTER dataset. United States Geological Survey (USGS) Landsat-8 surface reflectance (SR) scenes were collected from the Collection 1 Tier 1 (T1) suite of Landsat-8 images, scaled and calibrated at the sensor level. Sentinel-2 level 2A corrected data were used with the bottom of atmosphere reflectance in cartographic geometry and atmospherically corrected using Sen2Cor processor and PlanetDEM. The scenes at different times were filtered with less than 5% cloud cover; a pixel-level median-based composite mosaic was used to obtain an image with the least vegetation, noise, and cloud cover where the median of each pixel in a band of the selected scenes was computed to compose the image for classification.

5.2. Limestone Formations and Hazara Formation Mapping

Initially, limestone allochemical formations, i.e., oolitic and fossiliferous, were mapped along with adjacent Hazara formation and other land covers (i.e., water, vegetation, fields, and buildings) by collecting training samples from the GSP Map 43C/9 and Hazara Map [44] (please see Figure 1), lying on either side of the region of interest, and MLAs such as SVM, NB, RF, and CART were applied to generate classification maps.

5.3. Fusion of DS, PCA, X-Mean Clustering Results for Limestone Annotation Map

To refine the training labels used in MLAs, ASTER, Sentinel-2, and Landsat-8 bands with established spectral sensitivity to limestone [5,7,16,17,18,19,20,21,22,23] were used to apply PCA, X-means clustering, and DS before fusion (please refer to 
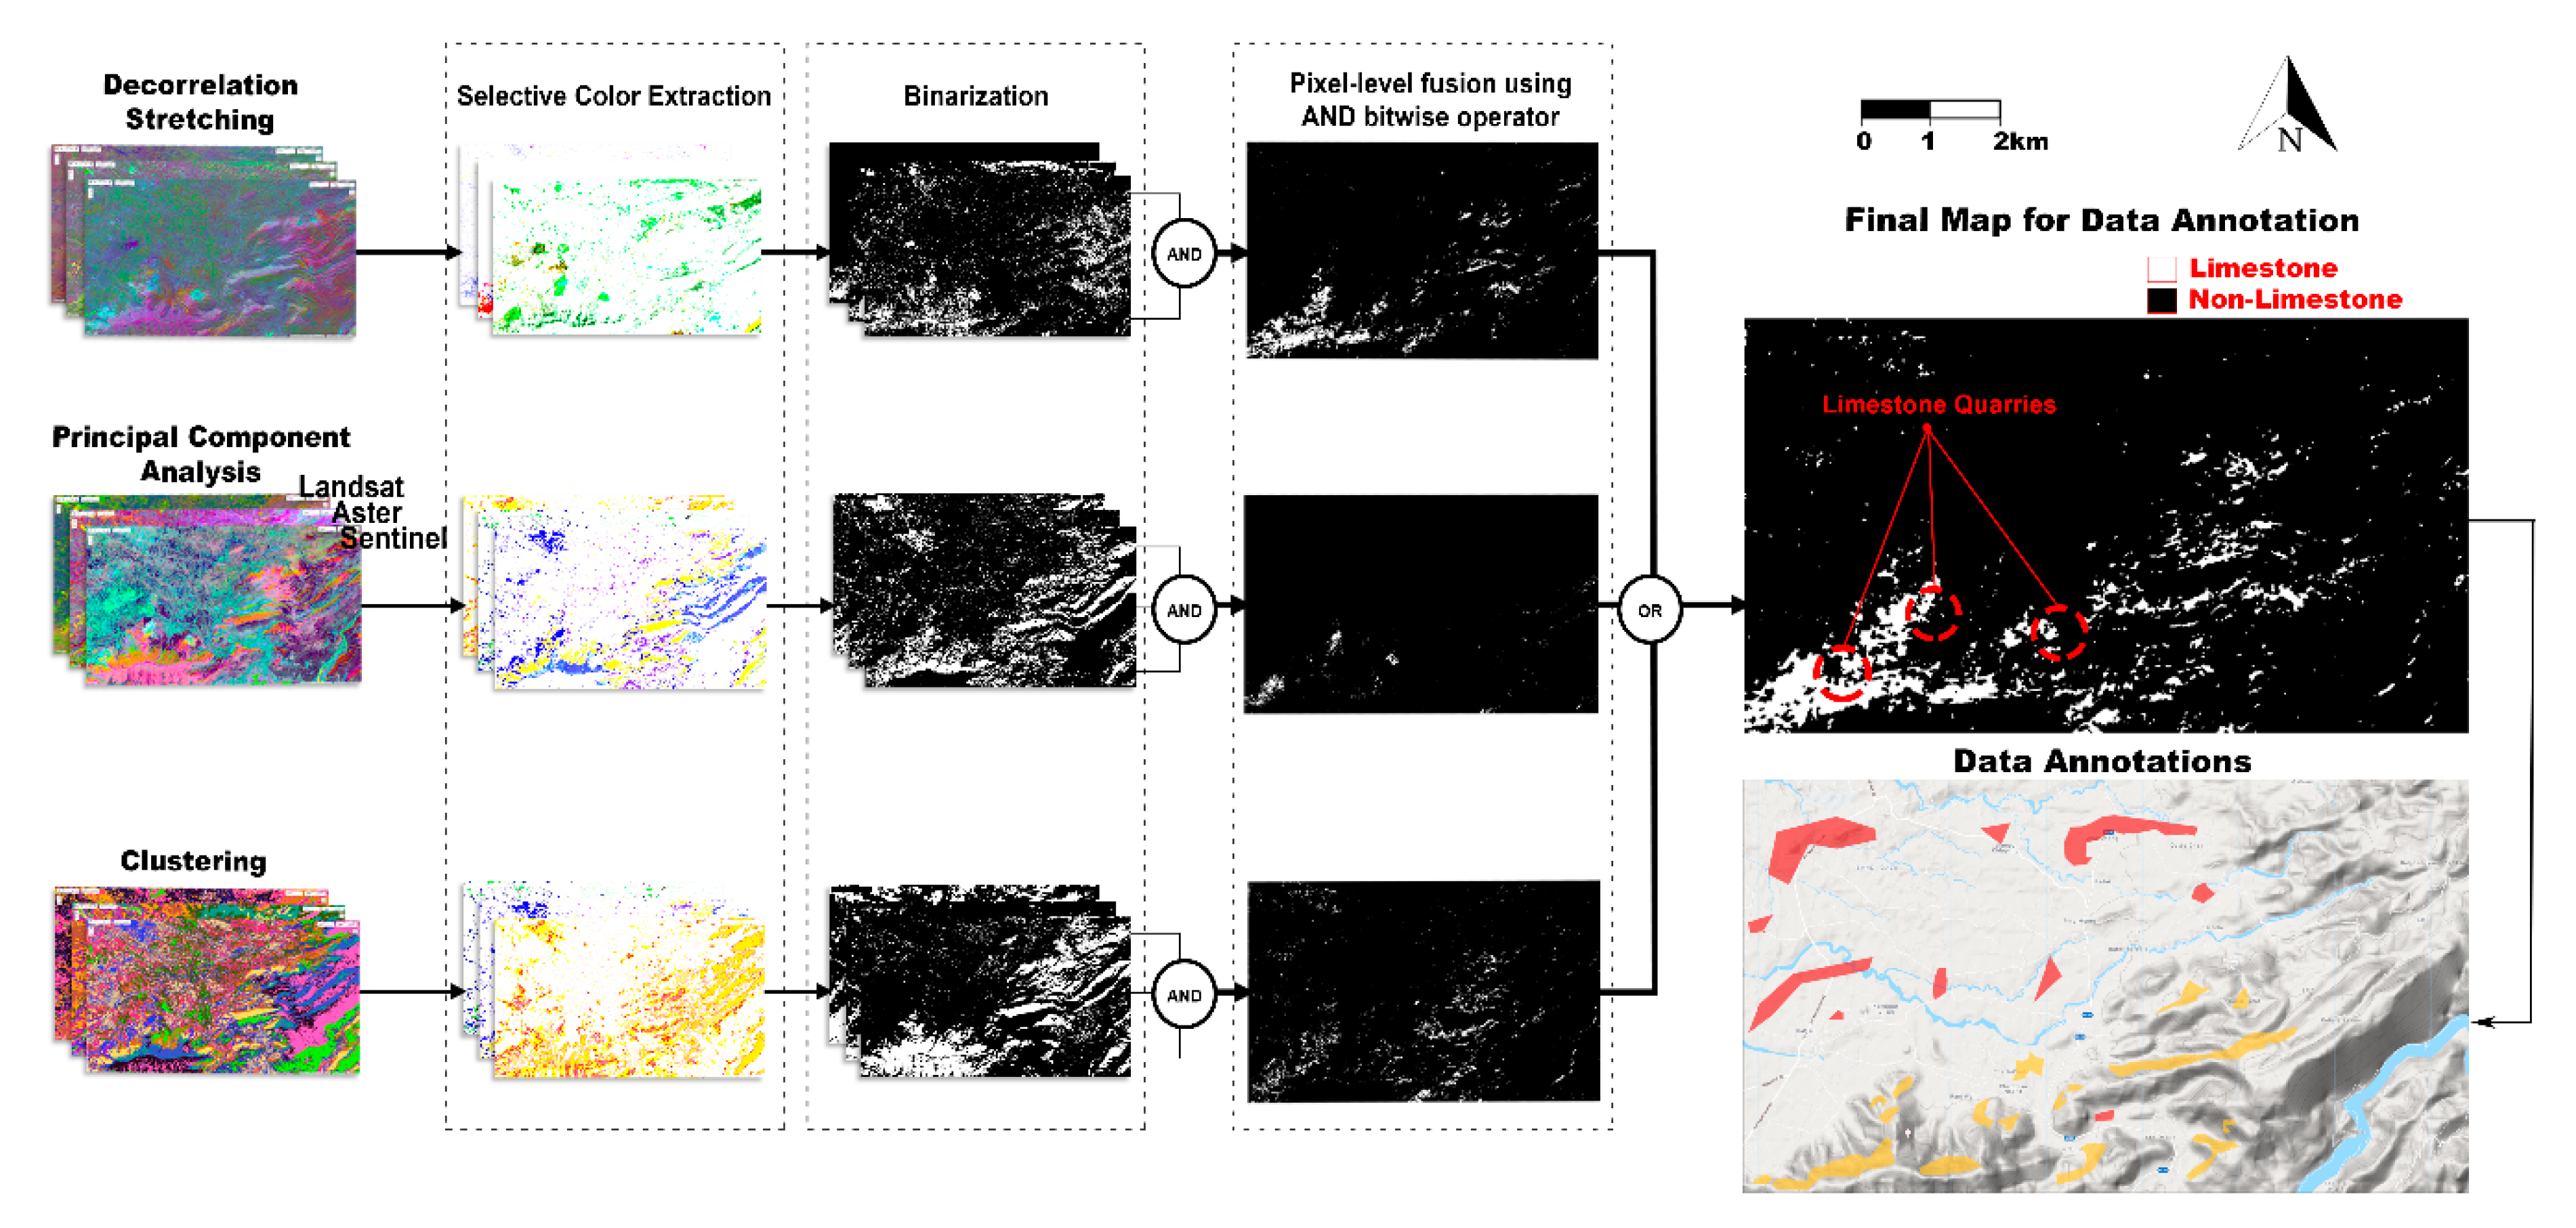
Table 1). Red-Green-Blue (RGB) based false color composite (FCC) images were made from the selected distinct components identified by the Crosta technique for the respective data sources, as shown in Table 1. Each principal component was visualized as a single image; the three best components for each dataset, which distinctively highlighted the known limestone quarry locations in the image, were selected using the Crosta technique.
During the X-means classification, all the available bands within the data were used to obtain clusters with similar spectral responses for each data source. Similarly, DS was applied on each data source, and FCC of all possible combinations of stretched bands was compared with known limestone locations on the field to select the best ASTER, Sentinel-2, and Landsat-8 bands.
A set of nine thematic maps was obtained from three techniques, i.e., PCA, DS, and Clustering, applied to each of the three data sources. In each map, regions with known limestone occurrences representing the same color were extracted to grayscale and then binarized using a threshold of 245 for a maximum pixel intensity of 255. Three maps, each representing a particular technique, i.e., PCA, DS, and clustering, were obtained using bitwise AND operation on the three maps from each data source but the same unsupervised technique. The AND operator retains limestone regions, commonly identified by the thematic maps obtained from applying the same technique to all three data sources. This fusion ruled out many false positive limestone indications due to ANDing by eliminating limestone regions not indicated by applying a specific technique to all three datasets.
Further, the OR operator’s application allowed for the union of the three binary maps obtained after the AND operator, integrating limestone indications reported by any of these three techniques. These three maps were fused using an OR operation on binary limestone pixels to obtain a final map for data annotation. The resultant image’s noise was filtered out using a 5 × 5 median filter, and limestone annotations were refined using a morphology filter with a 5 × 5 square structuring element. The final image was used to select data annotations for use in supervised classifications representing the most probable limestone indications while applying three unsupervised techniques to three data sources.

5.4. Mapping Limestone Using Machine-Learning Algorithms

Geometric polygons that represented limestone and others, were selected as labels from the fusion map obtained from the PCA, DS, and X-means. Samples of each dataset inside the yellow (limestone) and red (non-limestone) polygons were selected and randomly split into a 70:30 ratio as training and testing pixels. The number of pixels varied for each data source, i.e., 31273/6702, 31377/6582, and 31530/6620 train/test split for Landsat-8, Sentinel-2, and ASTER, were used respectively. Once labels were obtained for training, Landsat-8, ASTER L1T, and Sentinel-2 MSI data was fed to the CART, SVM, naïve Bayes, and RF classifier to generate binary limestone maps. Since limestone shows distinguishable characteristics near the SWIR range [5,7,16,17,18,19,20,21,22,23], SWIR bands of ASTER, Sentinel-2, and Landsat-8 (as given in Table 1) were used as input variables during training and validation of the ML algorithms for classification. The hyperparameters for all the four classifiers were tuned using grid search on a range of values chosen from the literature [11,61,62,63,64], as indicated in Table 2.
The overall (OA), user/consumer (CA), and producer (PA) accuracies were computed from the confusion matrix [65]. The OA is the percent of the total correctly mapped pixels out of the range of pixels in the error matrix. CA is the complement of commission errors, and PA the complement of omission errors associated with each class/category [65,66,67]. The Kappa coefficient measures the classification performance compared to randomly selected test values from the defined labels. It is an additional reliability metric, reporting corresponding values as −100 to 100% for worst to best classification results [65,68]. A Kappa coefficient value of 0 means that classification is no better than randomly assigned values.

5.5. Mapping Oolitic and Fossiliferous Limestone Formations in the Area

The resulting binary limestone map was used to obtain an image mask for the best data source reporting higher limestone accuracy. This enabled masking out non-limestone regions from the data, significantly reducing data mislabeling and misclassification of limestone formations. The region bounded by binary limestone classification map was used to discriminate Samanasuk (oolitic) and Margalla/Lockhart formations (fossiliferous) by application of CART, RF, NB, and SVM algorithms on the three data sources separately, using the best hyperparameters reported for binary limestone classification and validated by field observations.

6. Results and Discussion

The mean band spectra of limestone quarries and formations (Samanasuk, Lockhart, Margalla, Chorgali) against Hazara formation (slates), water, land, and vegetation are shown in Figure 3. Limestone indicated signature reflection at 1.6 μm and absorption at 2.3 μm, in agreement with a previously conducted study [11]. The mean band responses of slate can be easily distinguished from limestone formation spectra, indicating their spectral and compositional differences. Moreover, vegetation and land spectra were also in contrast to limestone and slate; thus, training/testing samples selected for limestone mapping were free from vegetation spectral signatures.
Initially, MLAs trained and validated approximately 2760 km2 area using labels from GSP maps and field knowledge, while reporting 83.28% as the best overall accuracy (OA) by the RF algorithm (please refer to Table 3). Further improvements in the results were investigated by obtaining data labels from the fusion of multi-source data after applying unsupervised techniques.
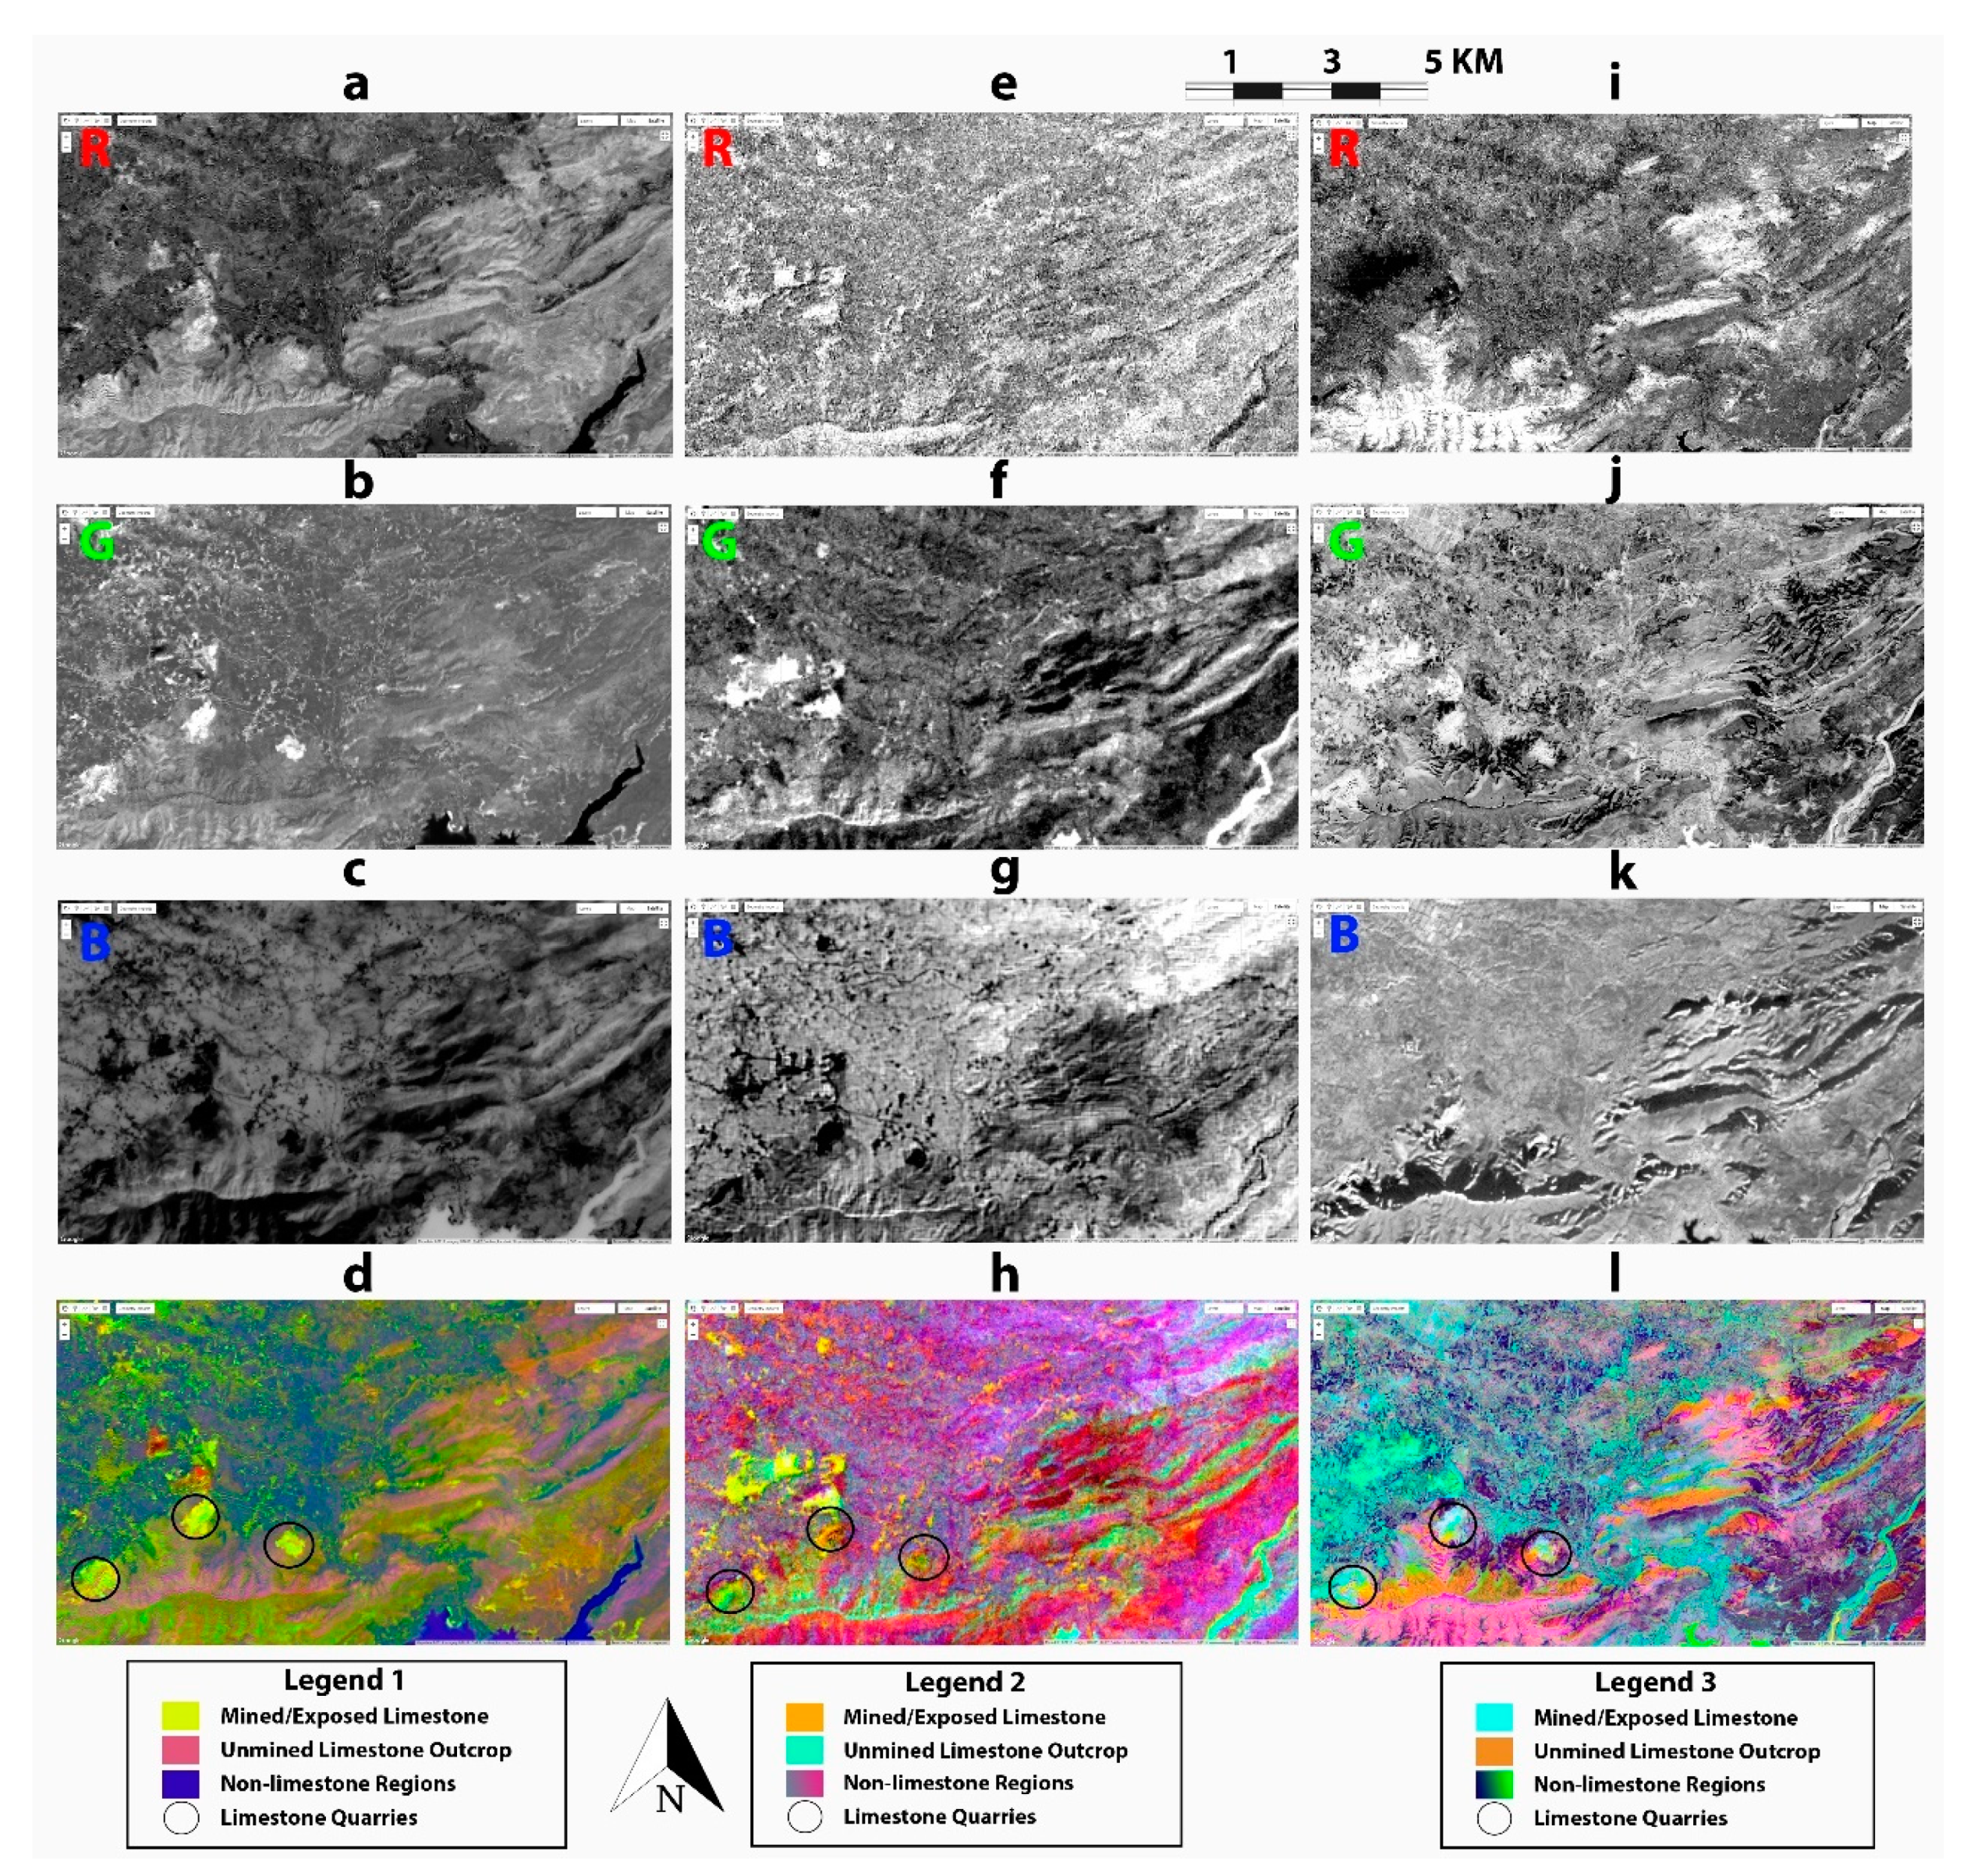
The results from PCA, X-means clustering, and DS applied on ASTER, Sentinel, and Landsat-8 datasets are presented in Figure 4 and Figure 5. Components retaining general information, i.e., vegetation and topography, were ignored (i.e., PC1, PC4, PC6 of Sentinel-2, PC1, PC3, PC6 of Landsat-8, and PC1, PC3, and PC5 of ASTER data). Components showing contrast in limestone were retained, i.e., PC6 and PC4 of ASTER showed limestone as bright due to positive loadings for SWIR8, TIR1, and TIR2 bands, while negative loadings of SWIR8 showed limestone as dark in PC2. Color composites of PC6, PC4, and PC2 shown in Figure 4 indicated limestone quarries in light green and other limestone outcrops in turquoise green color. Similarly, PC5, PC4 of Landsat-8 and PC5, PC3 of Sentinel-2 indicated limestone as bright, whereas it was shown as dark in PC2 for both data sources. In both cases, SWIR2 was receptive to limestone, FCC of PC5, PC4, and PC2 of Landsat-8 highlighted limestone quarries in lime color and unmined limestone regions green and purple. Similarly, FCC of PC5, PC3, and PC2 of Sentinel-2 highlighted limestone quarries in white color with traces of turquoise blue shades (see Figure 4). These spatial and spectral variations of colors represent variation within weathered limestone outcrops compared with freshly exposed limestone in cement quarries.
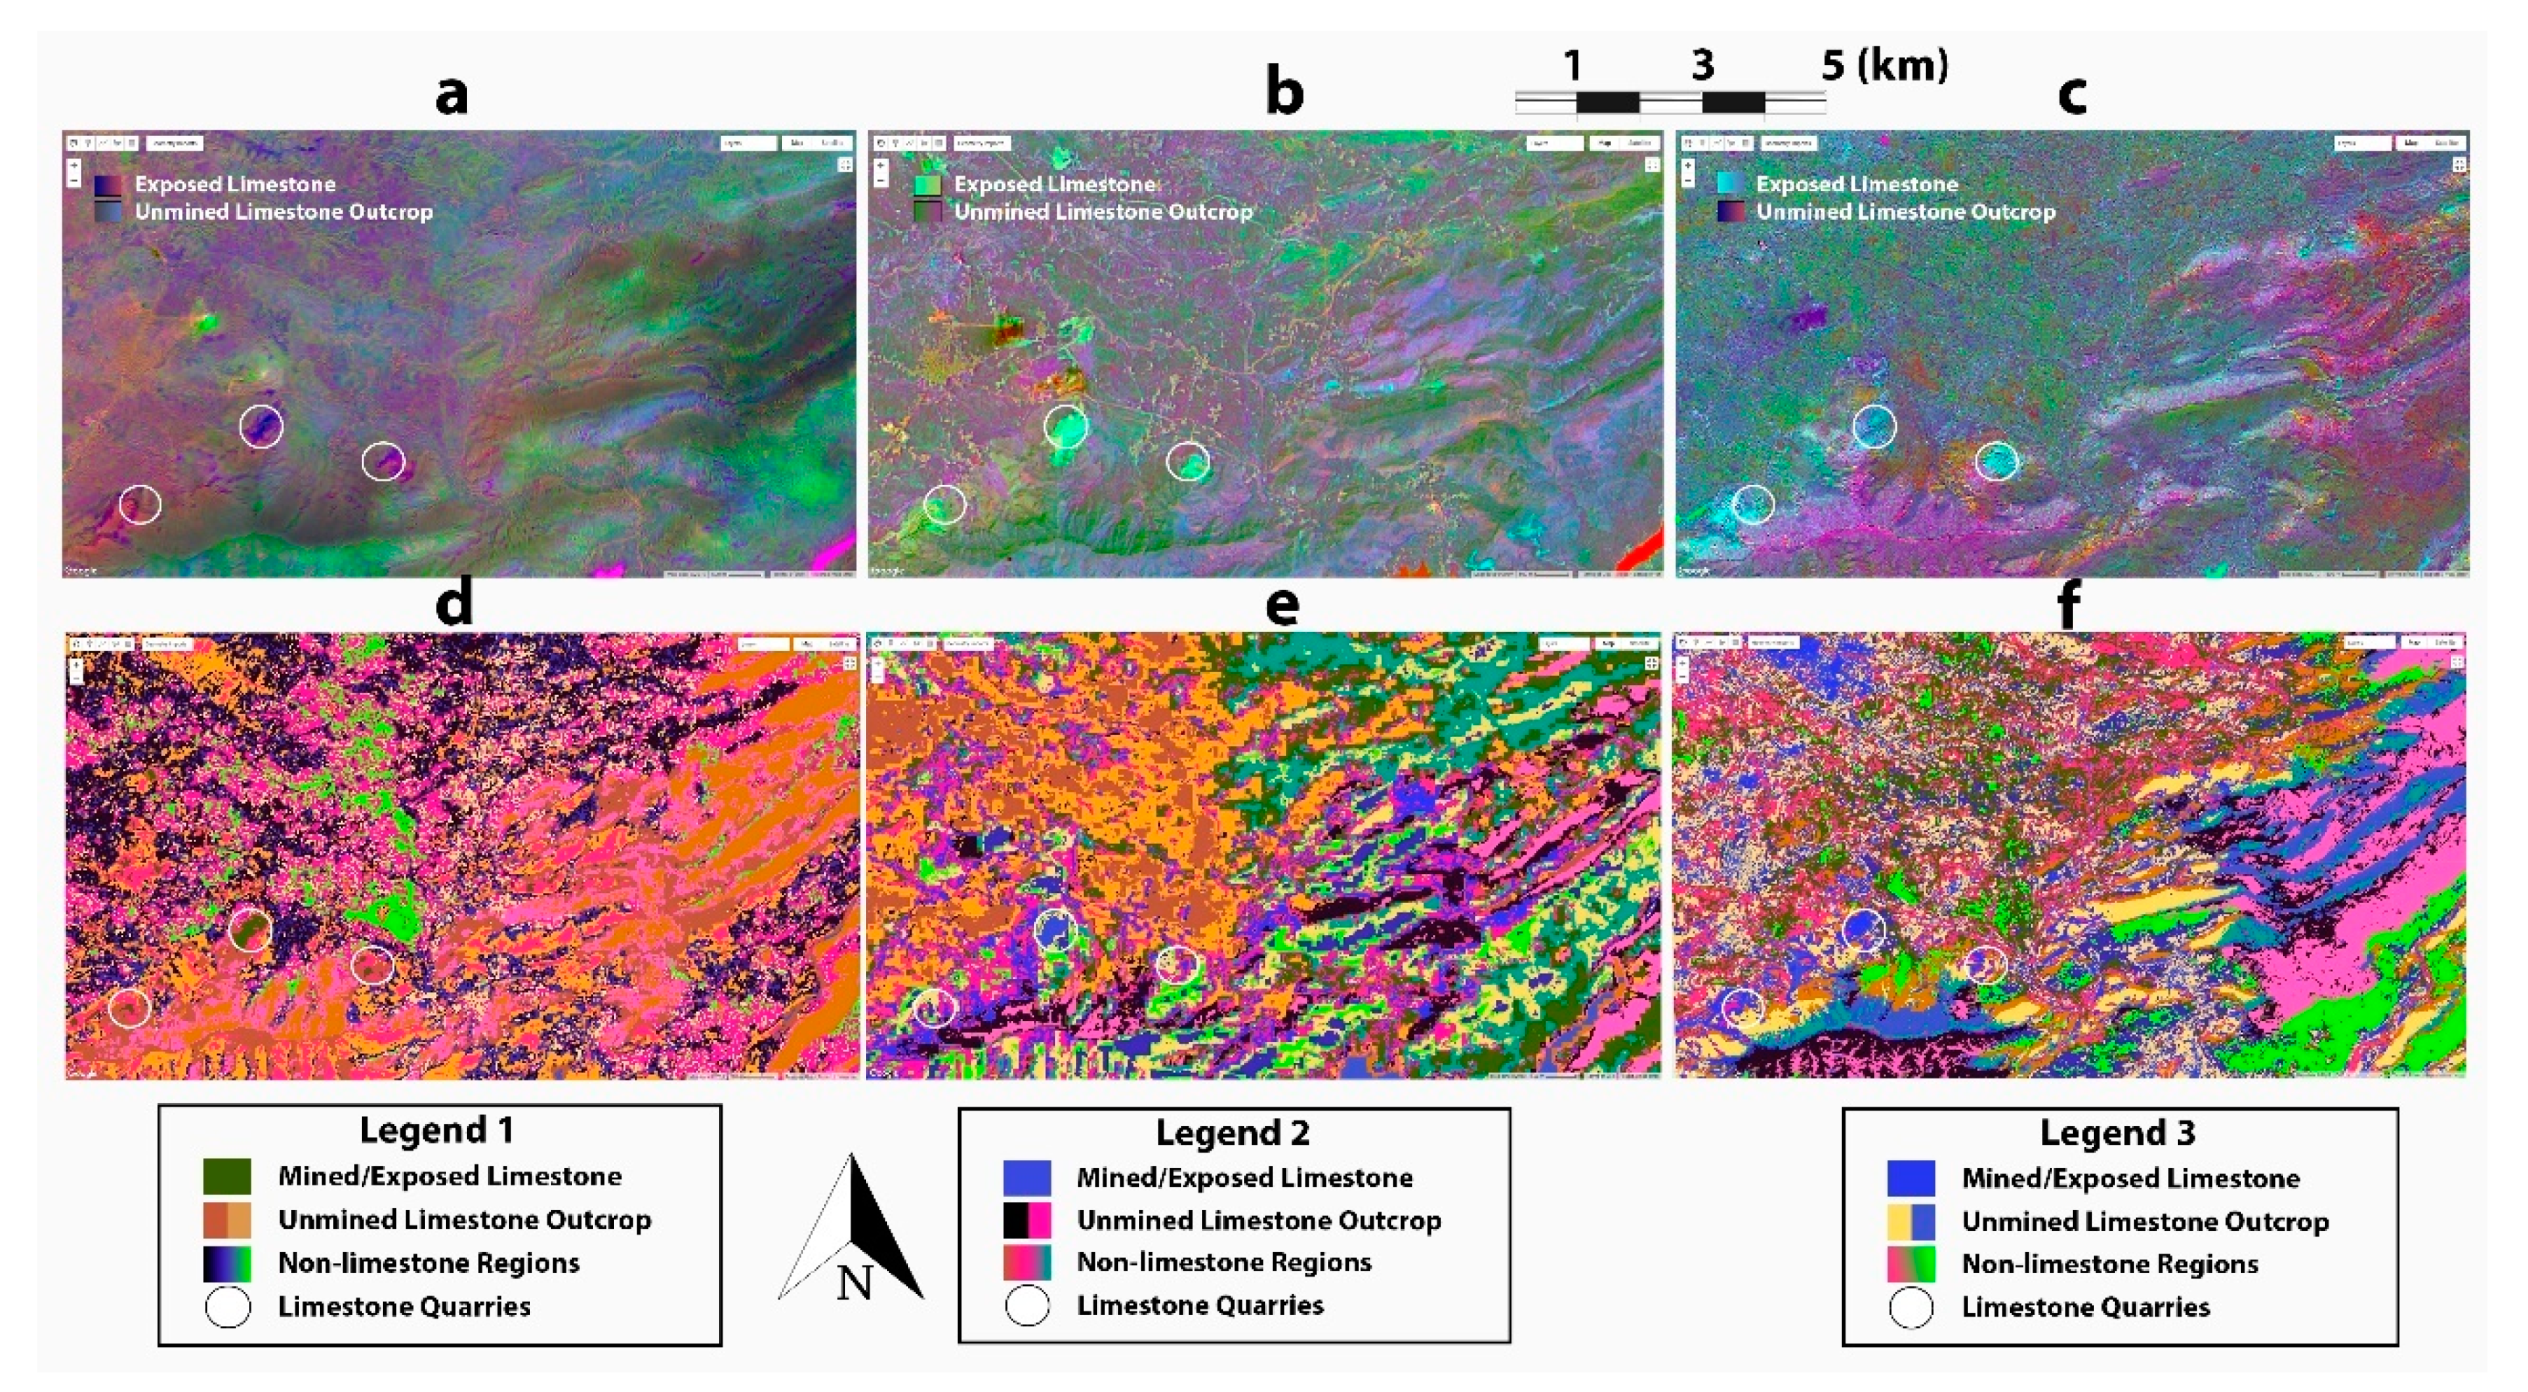
The results obtained using composites of Landsat-8, ASTER, and Sentinel stretched bands exposed the limestone region in navy blue, pale-green, and sky-blue colors, respectively (Figure 5). The upper and lower limits of the range of clusters for the X-means clustering algorithm was set to 2 and 30, respectively. The optimum number of clusters for Landsat-8, ASTER, and Sentinel-2 were identified as 21, 19, and 20, respectively. Limestone quarries were highlighted as dark green for Landsat-8, blue for ASTER, and Sentinel-2 (Figure 5). Surrounding limestone regions were golden-brown and pink for Landsat-8, pink and black for ASTER, and turquoise blue and cream in case of Sentinel-2 results, respectively (Figure 5).
Sentinel-2 had the highest spatial resolution among the datasets, thus reporting the highest number of clusters. Due to the variations between different limestone formations, possibly due to weathering effects or noise, they were clustered into several classes, each with a different spectral mean. The three significant formations in the area, Samanasuk (Oolitic) and Lockhart/Margalla (fossiliferous) were shown by the clustering algorithm as teal blue, basil green, lapis blue, fuchsia pink, and banana yellow colors (Figure 5f). This indicated distinctive spectral variations between these limestone formations; therefore, they were explored for further classification by more robust MLAs.
Limestone quarries of Dewan, Bestway Farooqia, and Bestway Hattar factories and limestone striking in the northeast/southwest direction were evident in all nine maps. The binary map obtained from the fusion of the nine maps shown in Figure 4d,h,l) and Figure 5 can be seen in Figure 6, which shows limestone regions in white and non-limestone in black. All three limestone quarries were identified, along with some limestone regions in the surrounding area and the northeast and east of the Hazara formation. The binary limestone map from fusion contained many false negatives but insignificant false positives; therefore, reliable for limestone label selection from regions besides limestone quarries, improving the classification models’ generalizability. Figure 6 also show the geometric polygons that represented limestone and others that were selected as labels from the fusion map obtained from the PCA, DS, and X-means to train the MLAs.
As shown in Table 4, after feeding these refined labels for binary classification, CART presented the best accuracies (>90.00%) for all three datasets outperforming the random forest algorithm. Table 4 shows the overall (OA), producer (PA), and user/consumer (CA) accuracies and Kappa coefficient (K) for the lithological classification using the CART, RF, NB, and SVM methods applied on Landsat-8, ASTER-L1T, and Sentinel-2 MSI datasets. One main reason could be that the composite had the least vegetation than other data sources. Due to better spatial resolution and a high level of vegetation, Sentinel-2 results were more detailed but had lower accuracy than Landsat-8. Therefore, while mapping allochemical limestone formations, the hyperparameters were tuned only for Landsat-8 data using the 6753 validation pixels, since it resulted in the best binary limestone classification accuracy.
Bachri et al. [11] reported 96.08% CA for limestone class while mapping ten different lithologies, including limestone in Moroccan Anti-Atlas using 228 training pixels and 51 testing pixels by SVM with an RBF kernel, with the C and gamma parameters set as 100 and 0.16. Hyperparameters for different MLAs that reported the best corresponding accuracies during this study are given in Table 5. In this case, the SVM reported 95.60% overall accuracy and 98.60% user accuracy for the polynomial kernel of degree 2, and the cost (C), gamma, and Coef0 of 2 × 10⁻⁵, 0.471, and 10, respectively, while the voting and margin decision procedure produced the same results. Linear kernel reported the best overall accuracy of 94.13% for C=10 compared to 93.04% for Nu=0.2; therefore, C hyperparameter was used instead of Nu. Higher accuracy for C and Nu’s lower values indicated very subtle differences in spectral signatures, such as the weathered limestone around the cement quarries. The linear kernel accuracy fluctuated between 91.13 and 94.13% within the given range of C/Nu hyperparameters. The gamma parameter’s effect was not prominent on model accuracy; however, best results were mostly obtained for a gamma value of 0.471. The sigmoid and RBF kernels of the SVM and NB algorithm reported lower accuracy, while Landsat-8 and Sentinel-2 responded with better accuracy than ASTER data. CART application on Landsat-8 OLI data reported the best results with the corresponding OA and CA of 99.63 and 99.69% and Kappa coefficient of 0.99, respectively (as shown in Table 4 and Table 5). Random forest as an ensemble of decision trees did not perform well compared to CART, which may be due to better annotation of data by fusion of images from the application of unsupervised methods discussed earlier.
RF algorithm’s cross-validation accuracy decreased with the increase in the number of trees, while CART accuracy increased with the increase in “maximum number of nodes” until it reached 20; beyond this, no change was observed in the accuracy. Random forest resulted in higher accuracies for a higher value for “number of maximum nodes” (i.e., 100). Since CART outperformed RF, SVM, and naïve Bayes algorithms, only the CART classifier map was retained for allochemical classification of limestone.
Finally, the binary limestone classification map of 99.63% accuracy (Figure 7A) was used as a base for the extraction of oolitic and fossiliferous limestone labels to map these limestone formations. Consequently, the Hazara formation (seen in Figure 7B) was masked out before this classification, hence decreasing the chances of misclassification. After masking Landsat-8 composites, accuracy was improved for both RF and CART algorithms; however, RF had the highest OA accuracy, i.e., 96.36%, with respective CA of fossiliferous, oolitic limestone as 97.49 and 94.64%, as given in Table 6 and Figure 7C. The limestone formation classification map validated the formation strike, i.e., in the northeast–southwest direction, in line with the field observations and published literature [69].
Therefore, the results suggest that limestone allochemical classification improved when the classification was performed in a limestone-only region obtained through masking Landsat-8 composite with CART binary classification map. The resultant classification was more reliable than the earlier case when the RF algorithm reported an overall accuracy of 83.28%, referred to in Table 3.
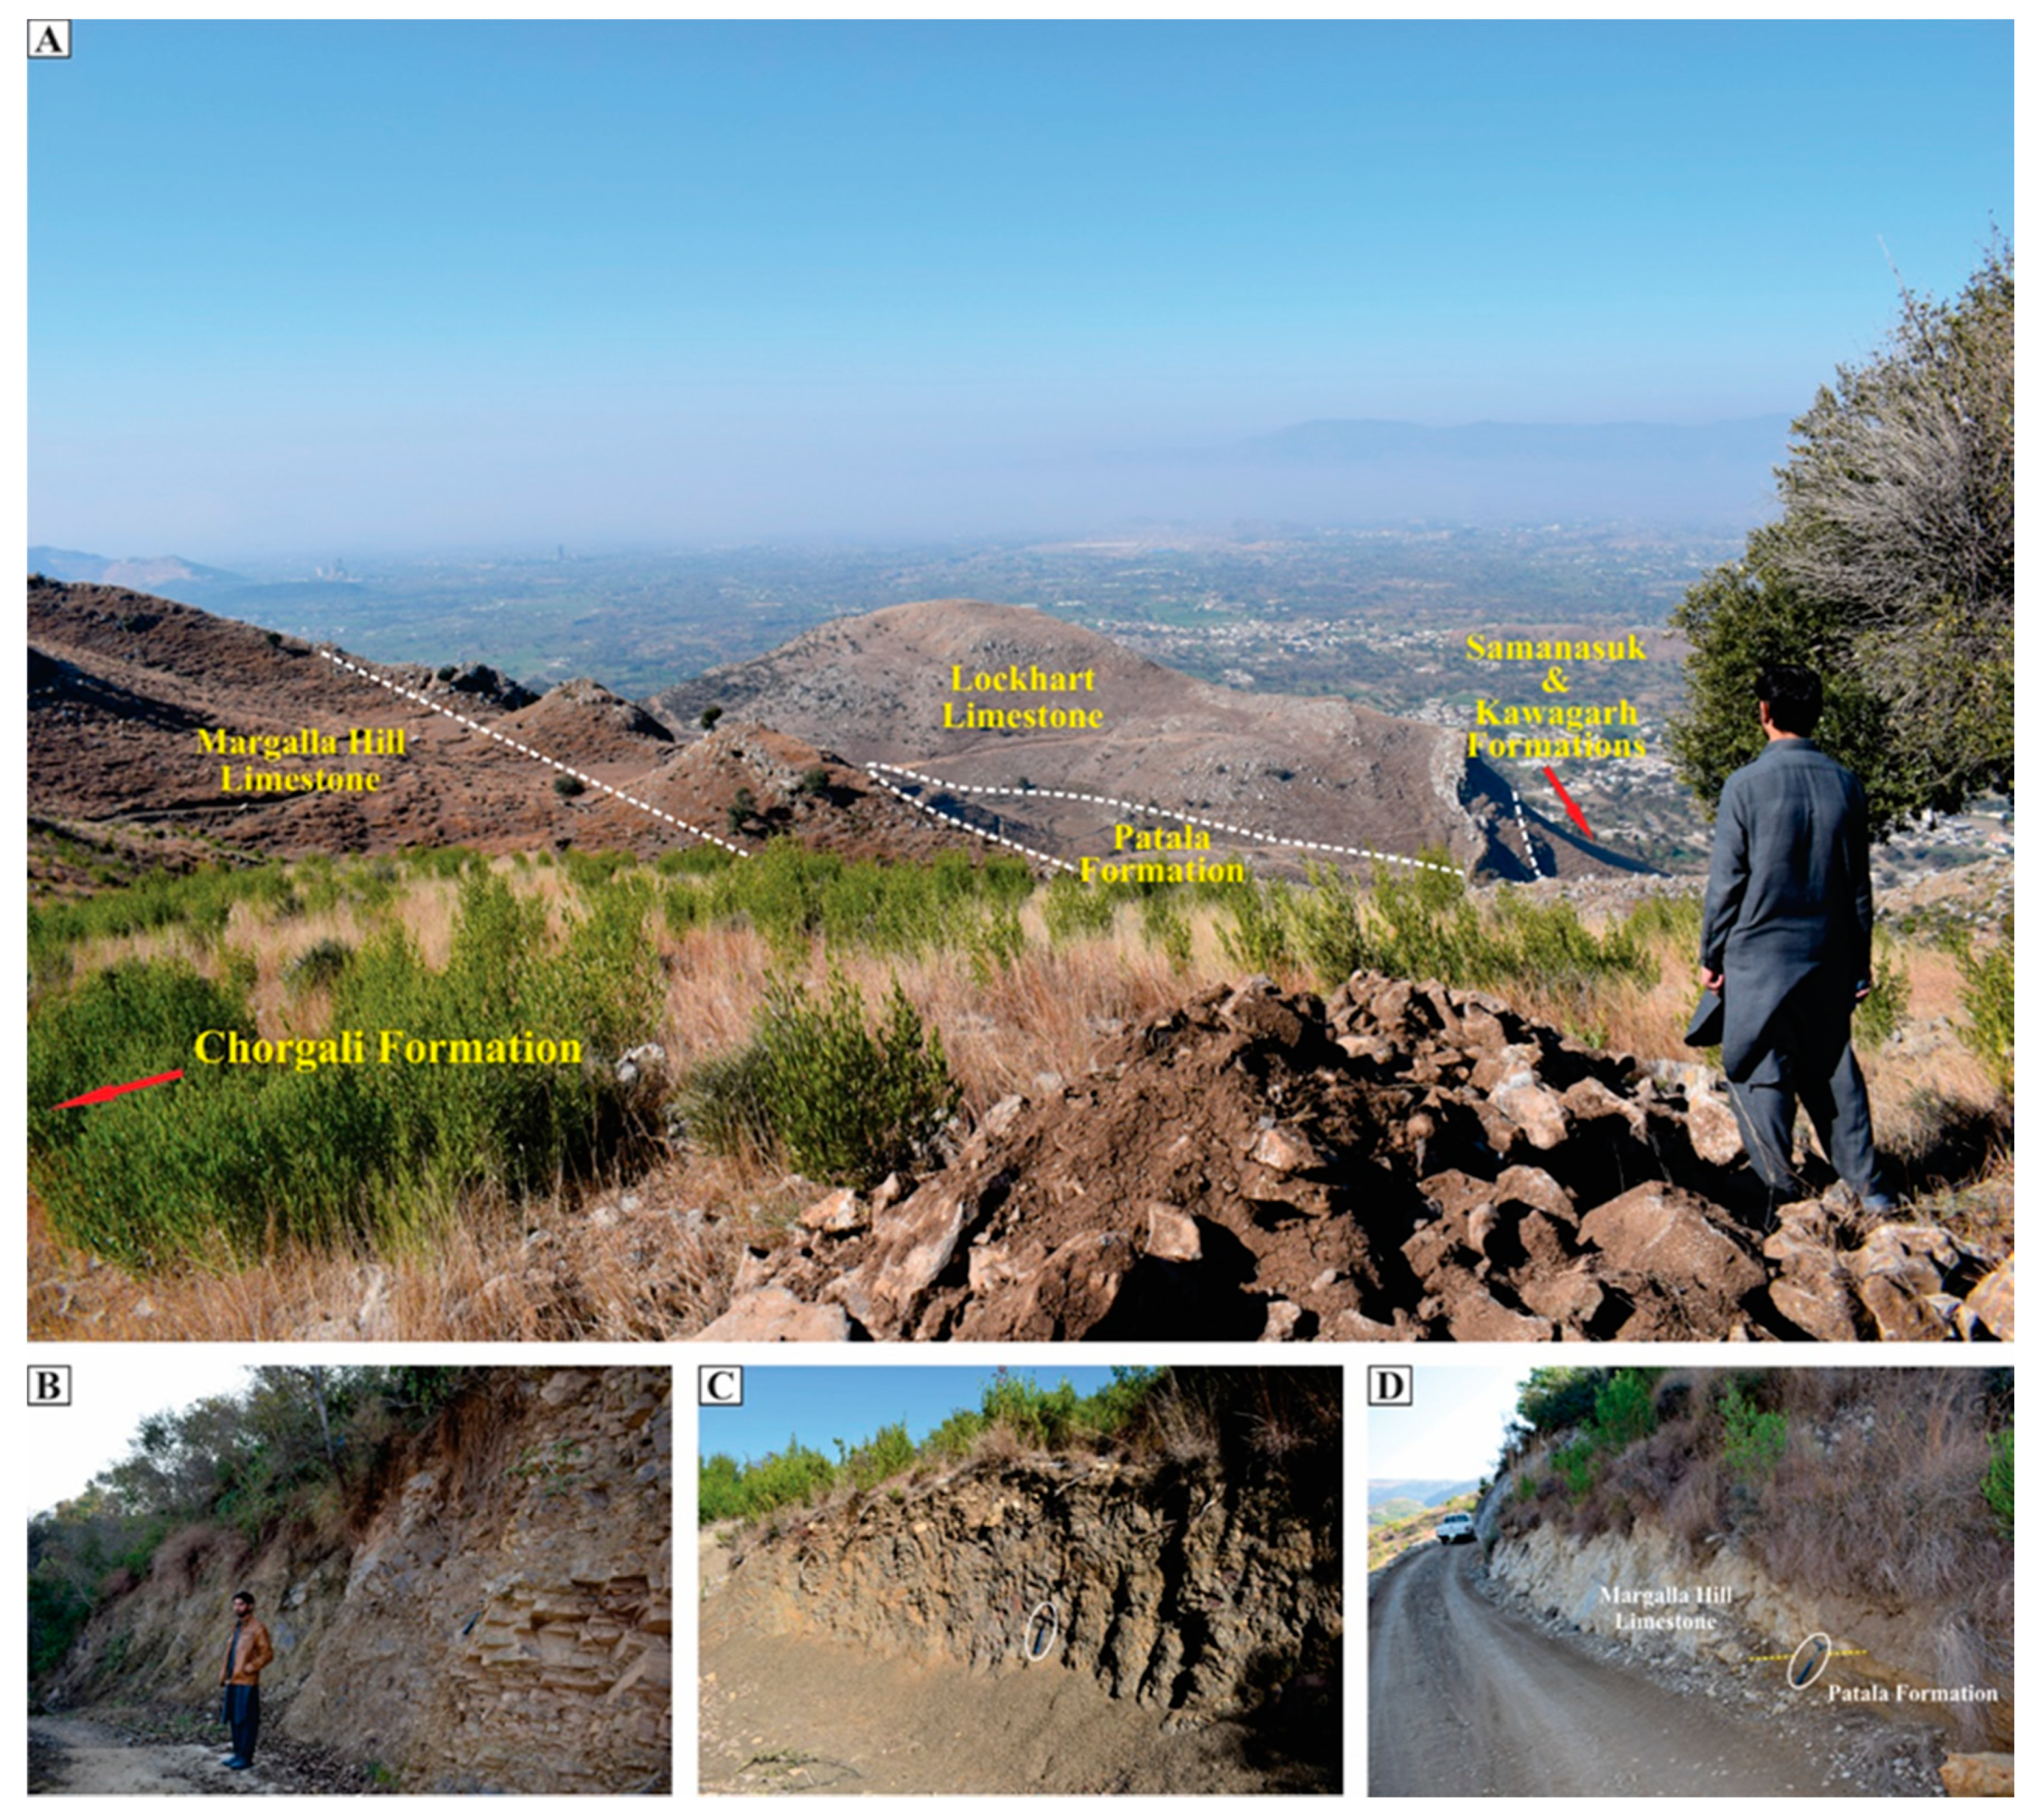
Field visits (shown in Figure 8) performed along the traverse shown in Figure 1 validated the binary limestone map reported by application of CART algorithm on Landsat-8. Several limestone-bearing formations with predominantly limestone lithology (i.e., Samana Suk formation, Lockhart and Margalla Hill limestones) and those with limestone and interbedded shale (i.e., Kawagarh, Patala, and Chorgali formations) were differentiated.

7. Conclusions

This study demonstrated that subtle differences in limestone’s allochemical compositions could be mapped through multispectral remote sensing (RS) data by applying MLAs through careful tuning of the hyperparameters and selecting suitable labels for remote sensing data. A high-accuracy oolitic and fossiliferous limestone formation map was generated using Landsat-8 OLI for regions having no or low-resolution geological maps within the Hazara Division of Pakistan. To summarize:
  • Unsupervised methods were useful to obtain refined data labels for training and validating the MLAs. In this case, selective color extraction and bitwise arithmetic image fusion were performed using an AND operator on ASTER, Landsat-8, and Sentinel-2 resulting from DS, PCA, and clustering, followed by an OR operator on the resultant DS, PCA, and clustering maps to extract reliable data labels for machine-learning algorithms.
  • The study demonstrated that identifying sub-classes within a rock type with subtle spectral differences could be improved if the binary classification map for that rock type is obtained in the intermittent step for using it as a mask to generate the final sub-classification map.
  • MLAs can vary performance in different circumstances, e.g., previously, SVM was reported as the best method for differentiating limestone from other rock types with 85% OA. CART reported the best accuracy with 99.63% OA during binary limestone classification using Landsat-8 data in this study. It took advantage of pure data labels, since the classification problem was highly distinguishable, i.e., limestone vs. landcover. On the contrary, the next step reported RF outperforming other ML algorithms with 96.36% OA when classification needed to differentiate subtle differences in limestone subclasses, i.e., oolitic and fossiliferous limestone. The results showed a significant correlation with the field validation in both cases.
  • Though both oolitic and fossiliferous limestone formations can be used in the cement or construction industry as aggregate, Samana Suk formation’s oolitic limestone map also indicated a dimension stone resource due to its bedded field feature compared to the nodular fossiliferous formations.
  • The work can be further extended to indirectly map rocks’ geotechnical properties through medium (multispectral) and high-resolution (hyperspectral) remote sensing data by application of MLAs and deep-learning techniques [70].

Author Contributions

Conceptualization: Muhammad Fawad Akbar Khan, Khan Muhammad; methodology: Muham-mad Fawad Akbar Khan, Khan Muhammad; software: Muhammad Fawad Akbar Khan, Shahab Ud Din; validation: Muhammad Hanif, Khan Muhammad, Shahab Ud Din, Muhammad Fawad Akbar Khan, Shahid Bashir; formal analysis and investigations: Muhammad Fawad Akbar Khan, Khan Muhammad, Shahab Ud Din, Muhammad Hanif; investigation, Muhammad Fawad Akbar Khan, Khan Muhammad; resources: Khan Muhammad, Shahid Bashir, Muhammad Fawad Akbar Khan, Shahab Ud Din; data curation, Muhammad Fawad Akbar Khan, Shahab Ud Din; writing—original draft preparation: Muhammad Fawad Akbar Khan, Khan Muhammad, Shahab Ud Din; writing—review and editing: Khan Muhammad, Muhammad Fawad Akbar Khan, Shahid Bashir, Shahab Ud Din, Muhammad Hanif; supervision: Khan Muhammad, Shahid Bashir. All authors have read and agreed to the published version of the manuscript.

Funding

This research was funded by the Higher Education Commission; grant number National Centre of AI” and “The APC was funded by Authors.

Institutional Review Board Statement

Not applicable.

Informed Consent Statement

Not applicable.

Data Availability Statement

All the codes and instruction for this manuscript can be found at the following GitHub repository, https://github.com/mfawadakbar/manuscript_2020_limestone.

Acknowledgments

The authors of the manuscript acknowledge the funds and support provided by the Higher Education Commission (HEC) of Pakistan under grant, National Centre of Artificial Intelligence.

Conflicts of Interest

The authors declare no conflict of interest.

References

  1. Renaud, K.M. USGS 2018 Minerals Yearbook—The Mineral Industry of Pakistan; Department of the Interior, US Geological Survey: Reston, VA, USA, 2016.
  2. Bliss, J.D.; Hayes, T.S.; Orris, G.J. Limestone: A Crucial and Versatile Industrial Mineral Commodity; Department of the Interior, US Geological Survey: Reston, VA, USA, 2015.
  3. Khan, S.D.; Mahmood, K.; Casey, J.F. Mapping of Muslim Bagh ophiolite complex (Pakistan) using new remote sensing, and field data. J. Asian Earth Sci. 2007, 30, 333–343. [Google Scholar] [CrossRef]
  4. Rajendran, S.; Nasir, S. Hydrothermal altered serpentinized zone and a study of Ni-magnesioferrite-magnetite-awaruite occurrences in Wadi Hibi, Northern Oman Mountain: Discrimination through ASTER mapping. Ore Geol. Rev. 2014, 62, 211–226. [Google Scholar] [CrossRef]
  5. Rajendran, S.; Nasir, S. ASTER spectral sensitivity of carbonate rocks-Study in Sultanate of Oman. Adv. Space Res. 2014, 53, 656–673. [Google Scholar] [CrossRef]
  6. Wright, J.; Lillesand, T.M.; Kiefer, R.W. Remote Sensing and Image Interpretation. Geogr. J. 1980, 146, 448. [Google Scholar] [CrossRef]
  7. Sanjeevi, S. Targeting Limestone and Bauxite Deposits in Southern India by Spectral Umixing of Hyperspectral Image Data. Int. Arch. Photogramm. Remote Sens. Spat. Inf. Sci. 2008, 37, 1189–1194. [Google Scholar]
  8. Van der Werff, H.; van der Meer, F. Sentinel-2A MSI and Landsat 8 OLI Provide Data Continuity for Geological Remote Sensing. Remote Sens. 2016, 8, 883. [Google Scholar] [CrossRef] [Green Version]
  9. Ibrahim, O.; Mamfe, V.; Nsofor, C.J.; Shar, J.T.; Sanusi, M.; Ozigis, M.S. Mineral Detection and Mapping Using Band Ratioing and Crosta Technique in Bwari Area Council, Abuja Nigeria. Int. J. Sci. Eng. Res. 2014, 5, 1100–1108. [Google Scholar]
  10. Yanshin, A.L.; Zyat’Kova, L.K. Remote sensing and the study of siberian mineral resources. Mapp. Sci. Remote Sens. 1985, 22, 278–290. [Google Scholar] [CrossRef]
  11. Bachri, I.; Hakdaoui, M.; Raji, M.; Teodoro, A.C.; Benbouziane, A. Machine learning algorithms for automatic lithological mapping using remote sensing data: A case study from Souk Arbaa Sahel, Sidi Ifni Inlier, Western Anti-Atlas, Morocco. ISPRS Int. J. Geo-Inf. 2019, 8, 248. [Google Scholar] [CrossRef] [Green Version]
  12. van der Meer, F.D.; van der Werff, H.M.; van Ruitenbeek, F.J.; Hecker, C.; Bakker, W.H.; Noomen, M.F.; van der Meijde, M.; Carranza, E.J.M.; De Smeth, J.B.; Woldai, T. Multi- and hyperspectral geologic remote sensing: A review. Int. J. Appl. Earth Obs. Geoinf. 2012, 14, 112–128. [Google Scholar] [CrossRef]
  13. Drury, S.A. Image interpretation in geology. Geocarto Int. 1987, 2, 48. [Google Scholar] [CrossRef]
  14. Zadeh, M.H.; Tangestani, M.H. Comparison of ASTER thermal data sets in lithological mapping at a volcano-sedimentary basin: A case study from southeastern Iran. Int. J. Remote Sens. 2013, 34, 8393–8407. [Google Scholar] [CrossRef]
  15. Ninomiya, Y.; Fu, B. Spectral indices for lithologic mapping with ASTER thermal infrared data applying to a part of Beishan Mountains, Gansu, China. In Proceedings of the IGARSS 2001. Scanning the Present and Resolving the Future. Proceedings. IEEE 2001 International Geoscience and Remote Sensing Symposium (Cat. No.01CH37217), Sydney, NSW, Australia, 9–13 July 2001; IEEE: New York, NY, USA, 2001; Volume 7, pp. 2988–2990. [Google Scholar]
  16. Rajendran, S.; Hersi, O.S.; Al-Harthy, A.; Al-Wardi, M.; El-Ghali, M.A.; Al-Abri, A.H. Capability of advanced spaceborne thermal emission and reflection radiometer (ASTER) on discrimination of carbonates and associated rocks and mineral identification of eastern mountain region (Saih Hatat window) of Sultanate of Oman. Carbonates Evaporites 2011, 26, 351–364. [Google Scholar] [CrossRef]
  17. Adiri, Z.; Lhissou, R.; El Harti, A.; Jellouli, A.; Chakouri, M. Recent advances in the use of public domain satellite imagery for mineral exploration: A review of Landsat-8 and Sentinel-2 applications. Ore Geol. Rev. 2020, 117, 1–16. [Google Scholar] [CrossRef]
  18. Rockwell, B.W.; Hofstra, A.H. Identification of quartz and carbonate minerals across northern Nevada using ASTER thermal infrared emissivity data—Implications for geologic mapping and mineral resource investigations in well-studied and frontier areas. Geosphere 2008, 4, 218. [Google Scholar] [CrossRef] [Green Version]
  19. Ramsey, J.; Gazis, P.; Roush, T.; Spirtes, P.; Glymour, C. Automated remote sensing with near infrared reflectance spectra: Carbonate recognition. Data Min. Knowl. Discov. 2002, 6, 277–293. [Google Scholar] [CrossRef]
  20. Hewson, R.D.; Cudahy, T.J.; Huntington, J.F. Geologic and alteration mapping at Mt Fitton, South Australia, using ASTER satellite-borne data. In Proceedings of the IGARSS 2001. Scanning the Present and Resolving the Future. Proceedings. IEEE 2001 International Geoscience and Remote Sensing Symposium (Cat. No.01CH37217), Sydney, NSW, Australia, 9–13 July 2001; IEEE: New York, NY, USA, 2001; pp. 724–726. [Google Scholar]
  21. Inzana, J.; Kusky, T.; Higgs, G.; Tucker, R. Supervised classifications of Landsat TM band ratio images and Landsat TM band ratio image with radar for geological interpretations of central Madagascar. J. Afr. Earth Sci. 2003, 37, 59–72. [Google Scholar] [CrossRef]
  22. Rowan, L.C.; Mars, J.C. Lithologic mapping in the Mountain Pass, California area using Advanced Spaceborne Thermal Emission and Reflection Radiometer (ASTER) data. Remote Sens. Environ. 2003, 84, 350–366. [Google Scholar] [CrossRef]
  23. Basavarajappa, H.T.; Jeevan, L.; Rajendran, S.; Manjunatha, M.C. Aster Mapping of Limestone Deposits and Associated Lithounits of Parts of Chikkanayakanahalli, Southern Part of Chitradurga Schist Belt, Dharwar Craton, India. J. Indian Soc. Remote Sens. 2019, 47, 693–703. [Google Scholar] [CrossRef]
  24. Xia, G.S.; Wang, Z.; Xiong, C.; Zhang, L. Accurate annotation of remote sensing images via active spectral clustering with little expert knowledge. Remote Sens. 2015, 7, 15014–15045. [Google Scholar] [CrossRef] [Green Version]
  25. Rajendran, S.; Nasir, S.; El-Ghali, M.; Alzebdah, K.; Al-Rajhi, A.S.; Al-Battashi, M. Spectral Signature Characterization and Remote Mapping of Oman Exotic Limestones for Industrial Rock Resource Assessment. Geosciences 2018, 8, 145. [Google Scholar] [CrossRef] [Green Version]
  26. Sgavetti, M.; Tramutoli, V.; Pompilio, L.A.; Longhi, I.; Adiri, Z.; Lhissou, R.; El Harti, A.; Jellouli, A.; Chakouri, M.; Alizai, F.A.; et al. Accuracy in mineral identification: Image spectral and spatial resolutions and mineral spectral properties. Ann. Geophys. 2006, 8, 261–270. [Google Scholar] [CrossRef]
  27. Pelletier, C.; Valero, S.; Inglada, J.; Champion, N.; Sicre, C.M.; Dedieu, G. Effect of training class label noise on classification performances for land cover mapping with satellite image time series. Remote Sens. 2017, 9, 173. [Google Scholar] [CrossRef] [Green Version]
  28. Bittencourt, H.R.; Clarke, R.T. Use of Classification and Regression Trees (CART) to Classify Remotely-Sensed Digital Images. Int. Geosci. Remote Sens. Symp. 2003, 6, 3751–3753. [Google Scholar] [CrossRef]
  29. Thamilselvan, P. A Comparative Study of SVM, RF and CART Algorithms for Image Classification. In Proceedings of the National Conference on Emerging Trends in Advanced Computing (ETAC), India; 2015; pp. 36–40. Available online: https://www.researchgate.net/publication/301560180_A_Comparative_Study_of_SVM_RF_and_CART_Algorithms_for_Image (accessed on 22 January 2021).
  30. Lary, D.J.; Alavi, A.H.; Gandomi, A.H.; Walker, A.L. Machine learning in geosciences and remote sensing. Geosci. Front. 2016, 7, 3–10. [Google Scholar] [CrossRef] [Green Version]
  31. Gharbia, R.; Azar, A.T.; Baz, A.H.E.; Hassanien, A.E. Image Fusion Techniques in Remote Sensing. arXiv 2014, arXiv:1403.5473. [Google Scholar]
  32. Othman, A.A.; Gloaguen, R. Integration of spectral, spatial and morphometric data into lithological mapping: A comparison of different Machine Learning Algorithms in the Kurdistan Region, NE Iraq. J. Asian Earth Sci. 2017, 146, 90–102. [Google Scholar] [CrossRef]
  33. Hazini, S.; Hashim, M. Comparative analysis of product-level fusion, support vector machine, and artificial neural network approaches for land cover mapping. Arab. J. Geosci. 2015, 8, 9763–9773. [Google Scholar] [CrossRef]
  34. Loughlin, W.P. Principal component analysis for alteration mapping. Photogramm. Eng. Remote Sens. 1991, 57, 1163–1169. [Google Scholar]
  35. Pelleg, D.; Moore, A. X-means: Extending K-means with Efficient Estimation of the Number of Clusters. In Proceedings of the 17th International Conference on Machine Learning, Stanford, CA, USA, 29 June–2 July 2000; Morgan Kaufmann: San Francisco, CA, USA, 2000; pp. 727–734. [Google Scholar]
  36. Folk, R.L. Practical petrographic classification of limestones. Am. Assoc. Pet. Geol. Bull. 1959, 43, 1–38. [Google Scholar]
  37. Kendall, C.G.S.C.; Flood, P. Classification of Carbonates. In Encyclopedia of Modern Coral Reefs. Encyclopedia of Earth Sciences Series; Hopley, D., Ed.; Springer: Dordrecht, The Netherlands, 2011; pp. 193–198. [Google Scholar]
  38. Zabidi, H.; Termizi, M.; Aliman, S.; Ariffin, K.S.; Khalil, N.L. Geological Structure and Geomorphological Aspects in Karstified Susceptibility Mapping of Limestone Formations. Procedia Chem. 2016, 19, 659–665. [Google Scholar] [CrossRef] [Green Version]
  39. Gatt, P.A. Model of limestone weathering and damage in masonry: Sedimentological and geotechnical controls in the Globigerina Limestone Formation (Miocene) of Malta. Xjenza J. Malta Chamb. Sci. 2006, 11, 30–39. [Google Scholar]
  40. Hansen, M.C.; Potapov, P.V.; Moore, R.; Hancher, M.; Turubanova, S.A.; Tyukavina, A.; Thau, D.; Stehman, S.V.; Goetz, S.J.; Loveland, T.R.; et al. High-resolution global maps of 21st-century forest cover change. Science 2013, 342, 850–853. [Google Scholar] [CrossRef] [Green Version]
  41. Xiong, J. Cloud Computing for Scientific Research; Scientific Research Publishing: Wuhan, China, 2018; ISBN 978-1-61896-561-5. [Google Scholar]
  42. Gorelick, N.; Hancher, M.; Dixon, M.; Ilyushchenko, S.; Thau, D.; Moore, R. Google Earth Engine: Planetary-scale geospatial analysis for everyone. Remote Sens. Environ. 2017, 202, 18–27. [Google Scholar] [CrossRef]
  43. Cracknell, M.J.; Reading, A.M. Geological mapping using remote sensing data: A comparison of five machine learning algorithms, their response to variations in the spatial distribution of training data and the use of explicit spatial information. Comput. Geosci. 2014, 63, 22–33. [Google Scholar] [CrossRef] [Green Version]
  44. Latif, M.A. Geological Map of S.E. Hazara and Parts of the Adjoining Districts of Rawalpindi and Muzaffarabad [Pakistan]; Geologische Bundesanstalt: Vienna, Austria, 1968. [Google Scholar]
  45. Saboor, A.; Haneef, M.; Hanif, M.; Swati, M.A.F. Sedimentological attributes of the Middle Jurassic peloids-dominated carbonates of eastern Tethys, lesser Himalayas, Pakistan. Carbonates Evaporites 2020, 35. [Google Scholar] [CrossRef]
  46. Hussain, H.S.; Fayaz, M.; Haneef, M.; Hanif, M.; Jan, I.U.; Gul, B. Microfacies and diagenetic-fabric of the Samana Suk Formation at Harnoi Section, Abbottabad, Khyber Pakhtunkhwa, Pakistan. J. Himal. Earth Sci. 2013, 45, 51. [Google Scholar]
  47. Saboor, A.; Ali, F.; Ahmad, S.; Haneef, M.; Hanif, M.; Imraz, M.; Ali, N.; Swati, M.A.F.; Zahid, M.; Sadiq, I. A preliminary account of the middle Jurassic plays in Najafpur village, southeastern Hazara, Khyber Pakhtunkhwa, Pakistan. J. Himal. Earth Sci. 2015, 48, 41–49. [Google Scholar]
  48. Alizai, F.A.; Hanif, M.; Zhang, S.; Latif, K.; Ahmad, S.; Jan, I.U.; Khan, H. Ooid Fabric in the Jurassic of the Indus Basin of Pakistan: Control on the Original Mineralogy. Curr. Sci. 2020, 119, 831–840. [Google Scholar]
  49. Rehman, M.U.; Ali, F. Muhammad Hayt Diagenetic Setting, Dolomitization and Reservoir Characterization of Late Cretaceous Kawagarh Formation. Int. J. Econ. Environ. Geol. 2017, 7, 64–79. [Google Scholar]
  50. Rehman, S.U.; Mahmood, K.; Ahsan, N.; Shah, M.M. Microfacies and depositional environments of upper cretaceous kawagarh formation from chinali and thoba sections Northeastern Hazara Basin, lesser Himalayas, Pakistan. J. Himal. Earth Sci. 2016, 49, 1–16. [Google Scholar]
  51. Hanif, M.; Imraz, M.; Ali, F.; Haneef, M.; Saboor, A.; Iqbal, S.; Ahmad, S. The inner ramp facies of the Thanetian Lockhart Formation, western Salt Range, Indus Basin, Pakistan. Arab. J. Geosci. 2014, 7, 4911–4926. [Google Scholar] [CrossRef]
  52. Awais, M.; Hanif, M.; Khan, M.Y.; Jan, I.U.; Ishaq, M. Relating petrophysical parameters to petrographic interpretations in carbonates of the Chorgali Formation, Potwar Plateau, Pakistan. Carbonates Evaporites 2019, 34, 581–595. [Google Scholar] [CrossRef]
  53. Gordon, A.D.; Breiman, L.; Friedman, J.H.; Olshen, R.A.; Stone, C.J. Classification and Regression Trees; Chapman and Hall/CRC: Boca Raton, FL, USA, 1984. [Google Scholar]
  54. Hssina, B.; Merbouha, A.; Ezzikouri, H.; Erritali, M. A comparative study of decision tree ID3 and C4.5. Int. J. Adv. Comput. Sci. Appl. 2014, 13–19. [Google Scholar] [CrossRef] [Green Version]
  55. Farris, F.A. The gini index and measures of inequality. Am. Math. Mon. 2010, 117, 851–864. [Google Scholar] [CrossRef] [Green Version]
  56. Berkson, J. Minimum Chi-Square, not Maximum Likelihood! Ann. Stat. 1980, 8, 457–487. [Google Scholar] [CrossRef]
  57. Maillardet, R.; Jones, O.; Robinson, A. Variance reduction. In Introduction to Scientific Programming and Simulation Using R; Chapman and Hall/CRC: Boca Raton, FL, USA, 2009; p. 606. [Google Scholar]
  58. Yohannes, Y.; Webb, P. Classification and Regression Trees, CART: A User Manual for Identifying Indicators of Vulnerability to Famine and Chronic Food Insecurity; International Food Policy Research Institute: Washington, DC, USA, 1999; ISBN 0896293378. [Google Scholar]
  59. Oshiro, T.M.; Perez, P.S.; Baranauskas, J.A. How Many Trees in a Random Forest? In Machine Learning and Data Mining in Pattern Recognition. MLDM 2012. Lecture Notes in Computer Science; Perner, P., Ed.; Springer: Berlin/Heidelberg, Germany, 2012; Volume 7376, pp. 154–168. [Google Scholar]
  60. Segal, M.R. Machine Learning Benchmarks and Random Forest Regression. UCSF Cent. Bioinform. Mol. Biostat. 2004. Available online: https://escholarship.org/uc/item/35x3v9t4 (accessed on 29 January 2021).
  61. Xiong, J.; Thenkabail, P.S.; Gumma, M.K.; Teluguntla, P.; Poehnelt, J.; Congalton, R.G.; Yadav, K.; Thau, D. Automated cropland mapping of continental Africa using Google Earth Engine cloud computing. ISPRS J. Photogramm. Remote Sens. 2017, 126, 225–244. [Google Scholar] [CrossRef] [Green Version]
  62. Dong, J.; Xiao, X.; Menarguez, M.A.; Zhang, G.; Qin, Y.; Thau, D.; Biradar, C.; Moore, B. Mapping paddy rice planting area in northeastern Asia with Landsat 8 images, phenology-based algorithm and Google Earth Engine. Remote Sens. Environ. 2016, 185, 142–154. [Google Scholar] [CrossRef] [Green Version]
  63. Huang, H.; Chen, Y.; Clinton, N.; Wang, J.; Wang, X.; Liu, C.; Gong, P.; Yang, J.; Bai, Y.; Zheng, Y.; et al. Mapping major land cover dynamics in Beijing using all Landsat images in Google Earth Engine. Remote Sens. Environ. 2017, 202, 166–176. [Google Scholar] [CrossRef]
  64. Carrasco, L.; O’Neil, A.W.; Daniel Morton, R.; Rowland, C.S. Evaluating combinations of temporally aggregated Sentinel-1, Sentinel-2 and Landsat 8 for land cover mapping with Google Earth Engine. Remote Sens. 2019, 11, 288. [Google Scholar] [CrossRef] [Green Version]
  65. Brown, D.G.; Lusch, D.P.; Duda, K.A. Supervised classification of types of glaciated landscapes using digital elevation data. Geomorphology 1998, 21, 233–250. [Google Scholar] [CrossRef]
  66. Othman, A.A.; Gloaguen, R. Improving lithological mapping by SVM classification of spectral and morphological features: The discovery of a new chromite body in the Mawat ophiolite complex (Kurdistan, NE Iraq). Remote Sens. 2014, 6, 6867–6896. [Google Scholar] [CrossRef] [Green Version]
  67. Grebby, S.; Naden, J.; Cunningham, D.; Tansey, K. Integrating airborne multispectral imagery and airborne LiDAR data for enhanced lithological mapping in vegetated terrain. Remote Sens. Environ. 2011, 115, 214–226. [Google Scholar] [CrossRef] [Green Version]
  68. Pignatti, S.; Cavalli, R.M.; Cuomo, V.; Fusilli, L.; Pascucci, S.; Poscolieri, M.; Santini, F. Evaluating Hyperion capability for land cover mapping in a fragmented ecosystem: Pollino National Park, Italy. Remote Sens. Environ. 2009, 113, 622–634. [Google Scholar] [CrossRef]
  69. Calkins, J.A.; Offield, T.W.; Abdullah, S.K.; Ali, S.T. Geology of the Southern Himalaya in Hazara, Pakistan, and Adjacent Areas; US Geological Survey: Reston, VA, USA, 1975.
  70. Shyu, M.; Chen, S.; Iyengar, S.S. A Survey on Deep Learning Techniques. ACM Comput. Surv. 2018, 51. [Google Scholar] [CrossRef]
Figure 1. The area under study with the locations of GSP maps and the region of interest where maps were not available. The blue line in the region of interest represents the traverse route taken to validate the classification results while Pt. 1: (72.94397E, 33.8592N), Pt. 2: (72.946938E, 33.860744N), Pt. 3: (72.95020E, 33.863123N), and Pt. 4: (72.9277E, 33.86615N) markers show the locations of field pictures.
Ijgi 10 00058 g001
Figure 2. Methodology of the study showing the process of image fusion and data annotation, supervised classification using three data sources for limestone and limestone formations mapping of Hazara District, Pakistan.
Ijgi 10 00058 g002
Figure 3. Mean spectral response of features of limestone, water, and vegetation extracted from Landsat-8 for Hattar, Khyber Pakhtunkhwa, Pakistan.
Ijgi 10 00058 g003
Figure 4. PC images of Landsat-8 (a) PC5 (limestone is shown as bright) (b) PC4 (limestone is shown as bright) (c) PC2 (limestone is shown as dark); ASTER (e) PC6 (limestone is shown as bright) (f) PC4 (limestone is shown as bright) (g) PC2 (limestone is shown as dark); Sentinel-2 (i) PC5 (limestone is shown as bright) (j) PC3 (limestone is shown as bright) (k) PC2 (limestone is shown as dark) and their FCCs (d) Landsat-8 FCC of PCs, (h) ASTER FCC of PCs, and (l) Sentinel-2 FCCs of PCs for the region of interest, i.e., Hattar, Khyber Pakhtunkhwa, Pakistan.
Ijgi 10 00058 g004
Figure 5. Decorrelation stretching of (a) Landsat-8, (b) ASTER, (c) Sentinel-2, and X-means clustering of (d) Landsat-8, (e) ASTER, and (f) Sentinel-2 datasets of Hattar, Khyber Pakhtunkhwa, Pakistan.
Ijgi 10 00058 g005
Figure 6. Method of image fusion uses selective color extraction and bitwise operation to extract common limestone indication from multiple data sources and multiple techniques to obtain reliable data annotation. The final map is also shown with the data annotations where yellow and red color geometric shapes represent limestone and landover pixels.
Ijgi 10 00058 g006
Figure 7. Final classification of “area under study” shown as three subfigures obtained from Landsat-8: (A) Limestone classification results by CART application on Landsat-8 composite, (B) limestone (oolitic and fossiliferous), and Hazara formation classification using random forest application on Landsat-8 composite, (C) limestone (oolitic and fossiliferous) formation map obtained using random forest application on Landsat-8 composite after using limestone binary classification map shown in “A” as a mask (this map is overlaid on terrain map with grey zones indicating slopes within the region).
Ijgi 10 00058 g007
Figure 8. Field photographs at locations indicated in Figure 1. (A) Showing different formations exposed in the study area (photo taken at 33.8592 N 72.94397 E and man height = 180 cm for scale). (B) Showing the Hazara Slates, i.e., a non-carbonate sequence (33.86615 N 72.9277 E; man height = 180 cm for scale). (C) Showing the Patala formation (33.863123 N 72.95020 E; hammer length (white circle) = 32 cm for scale). (D) Showing the contact between Patala formation and Margalla Hill limestone (33.860744 N 72.946938 E and hammer length (white circle) = 32 cm for scale).
Ijgi 10 00058 g008
Table 1. Summary of bands used in PCA, machine-learning algorithms (MLAs), and components retained by Crosta techniques for RGB based false color composite (FCC).
OperationsLandsat-8ASTERSentinel-2
Bands used in PCA2-4 and 7, 10, 114, 6-8 and 13, 142-4, 8, 11 and 12,
PCA components in FCCsPCs 5, 4, 2PCs 6, 4, 2PCs 5, 3, 2
Bands used in ML classification7, 10, 118, 13, 148, 11, 12
Table 2. Hyperparameters values tried for random forest (RF), CART, naïve Bayes (NB), and support vector machine (SVM) in every possible combination.
MLAHyperparameter Values Used in Optimization Using Grid Search
No. of TreesVariables/SplitMin. Leaf Pop.Max. Nodes
RF2, 4, 1001, 2, 32, 4, 1002, 4, 100
CART 1, 2, 4, 102, 4, 8, 20, 100
SVMKernelC/NuC/Nu rangeDegreesGammaCoef0
LinearC_SVMC = 1, 2, 4, 10, 100
Nu_SVMNu = 0.1, 0.2, 0.5, 0.7, 0.9
PolynomialC_SVMC = 2 × 10⁻⁵, 1, 2, 101, 2, 30.1, 0.2, 0.471, 81, 2, 10
RBFC_SVMC = 2 × 10⁻⁵, 0.002, 1, 2, 10 0.1, 0.2, 0.471, 8
SigmoidC_SVMC = 2 × 10⁻⁵, 1, 2, 10 0.1, 0.2, 0.471, 81, 2, 10
NBlambda
1 × 10⁻¹⁰, 2, 4
Table 3. CART and random forest (RF) overall (OA) and consumer (CA) accuracy for limestone formations classification using training data from the GSP maps.
AlgorithmOACA: Fossiliferous 1CA: Oolitic 2Hazara SlateKappa
RF83.28%93.79%75.25%91.35%0.78
CART80.10%93.88%73.20%90.78%0.74
1 Lockhart and Margalla hill formations; 2 Samanasuk formation.
Table 4. Comparison of CART, random forest, naive Bayes, and SVM accuracy for Landsat-8, Sentinel-2, and ASTER data.
DatasetAlgorithm OA (%)CA (%)PA (%)Kappa
Landsat-8CARTNon-Limestone99.6310098.3600.99
Limestone99.6999.75
RFNon-Limestone98.2396.471000.96
Limestone10096.57
NBNon-Limestone78.3876.0375.400.56
Limestone80.2680.79
SVMNon-Limestone95.6092.3098.6091.16
Limestone98.6093.37
Sentinel-2CARTNon-Limestone91.3790.3691.460.82
Limestone92.3091.30
RFNon-Limestone87.9383.5192.680.75
Limestone92.7792.77
NBNon-Limestone67.2467.1259.750.33
Limestone67.3273.91
SVMNon-Limestone83.3379.7786.580.66
Limestone87.0580.43
ASTER L1TCARTNon-Limestone96.0996.0796.070.92
Limestone96.1196.11
RFNon-Limestone95.1297.9192.150.90
Limestone92.6698.05
NBNon-Limestone80.4884.4474.500.60
Limestone77.3986.40
SVMNon-Limestone67.8062.6787.250.35
Limestone79.3648.54
Table 5. CART, random forest, naïve Bayes, and SVM overall, consumer, and producer accuracies and kappa coefficient using Landsat-8 data with optimum hyperparameters for binary limestone classification.
MLAOptimized HyparametersAccuracies
No. of TreesVar./SplitMin. Leaf Pop.Max. Nodes OACAOAKappa
RF222100 98.23%100%96.57%0.96
CARTNANA120 99.63%99.69%99.75%0.99
SVMKernelC/Nu rangeDegreesGammaCoef0
LinearC = 10 94.13%100%89.40%0.86
Nu = 0.2 93.04%98.52%88.74%0.86
PolynomialC = 2 × 10−520.4711095.60%98.60%93.37%0.91
RBF 1* * 59.34%57.63%100%0.098
Sigmoid 1* **55.31%55.31%100%0
NBLambda 1 78.38%80.26%80.79%0.56
1 Accuracy showed no response to change in hyperparameters.
Table 6. CART and random forest (RF) overall and consumer accuracies (OA and CA) and kappa coefficient for limestone formations classification with masking Landsat-8 composite.
AlgorithmOACA: Fossiliferous 1CA: Oolitic 2Kappa
RF96.36%97.49%94.64%0.92
CART95.38%97.02%92.95%0.90
1 Margalla/Lockhart formations and 2 Samanasuk formation.
Publisher’s Note: MDPI stays neutral with regard to jurisdictional claims in published maps and institutional affiliations.

