Machine Learning Approaches to Bike-Sharing Systems: A Systematic Literature Review


1
NOVA Information Management School (NOVA IMS), Universidade Nova de Lisboa, Campus de Campolide, 1070-312 Lisboa, Portugal
2
Instituto Universitário de Lisboa (ISCTE-IUL), ISTAR, 1649-026 Lisboa, Portugal
*
Author to whom correspondence should be addressed.
ISPRS Int. J. Geo-Inf. 2021, 10(2), 62; https://0-doi-org.brum.beds.ac.uk/10.3390/ijgi10020062
Submission received: 3 December 2020
/
Revised: 19 January 2021
/
Accepted: 28 January 2021
/
Published: 2 February 2021
Abstract
:Cities are moving towards new mobility strategies to tackle smart cities’ challenges such as carbon emission reduction, urban transport multimodality and mitigation of pandemic hazards, emphasising on the implementation of shared modes, such as bike-sharing systems. This paper poses a research question and introduces a corresponding systematic literature review, focusing on machine learning techniques’ contributions applied to bike-sharing systems to improve cities’ mobility. The preferred reporting items for systematic reviews and meta-analyses (PRISMA) method was adopted to identify specific factors that influence bike-sharing systems, resulting in an analysis of 35 papers published between 2015 and 2019, creating an outline for future research. By means of systematic literature review and bibliometric analysis, machine learning algorithms were identified in two groups: classification and prediction.
1. Introduction
Changes are taking place in the future development of the transport sector. To this aim, concrete plans are already in place, such as the Sustainable Development Goals (SDGs) [1], the New Urban Agenda [2] and the Organisation for Economic Co-operation and Development (OECD) Greening Transport [3], and adopted by United Nations member states since 2016.
To cope with these challenges, the New Urban Agenda and OECD Greening Transport set up the guidelines for a sustainable future that connects to the SDG11 Cities and Communities [4].
Bike-sharing systems (BSS) improve urban accessibility, multimodality in transportation and mobility sustainability, and more cities in the world are implementing such sharing modes to tackle increased expansion of urban mobility, air pollution and changes in urban mobility patterns and behaviour, trends exacerbated by the recent pandemic crisis.
Since 2016, more than 1000 bike-sharing systems are running in 60 countries [5], and many improvements have been made in bike-sharing systems. The latest systems allow real-time data collection using sensors and wireless communications, generating large quantities of data [6]. The collected data improve intelligent processes of data analytics through machine learning techniques.
The aim of this paper is to contribute, with literature evidence, to the sustainable implementation of bike-sharing systems. Particularly, this systematic literature review targets the identification of the most relevant machine learning techniques applied in bike-sharing analytics, with an impact on and contributions to cities’ mobility. Therefore, the broad analysis of this paper is useful to understand state-of-the-art solutions, as well as gaps in the current research.
Challenges in mobility nowadays aim to find the latest scientific contributions for the development of machine-learning-based techniques to provide solutions to tackle cities’ mobility phenomenon, particularly when dealing with bike-sharing systems. Based on the general overview described above, our study provides a systematic literature review (SLR) on this topic. The SLR research question was formulated as follows:
RQ1: What are the most promising machine learning techniques adopted by the community to better understand and improve bike-sharing systems in urban mobility?
To answer this question, an SLR methodology and qualitative analysis were used, as well as methods to assist in analysing the data.
The paper is structured as follows: Section 2 presents the SLR method that maps keyword identification search, repositories, bibliometric analysis and a bibliometric research tool for network analysis. In Section 3, we introduce our results, identifying the research themes and analysing keyword, author, title and abstract text occurrences, as well as the most cited publications and application, dimensions and methods. In Section 4, we discuss the results and identify research gaps and limitations. Finally, in Section 5, we raise our conclusions and draw lines for future work.
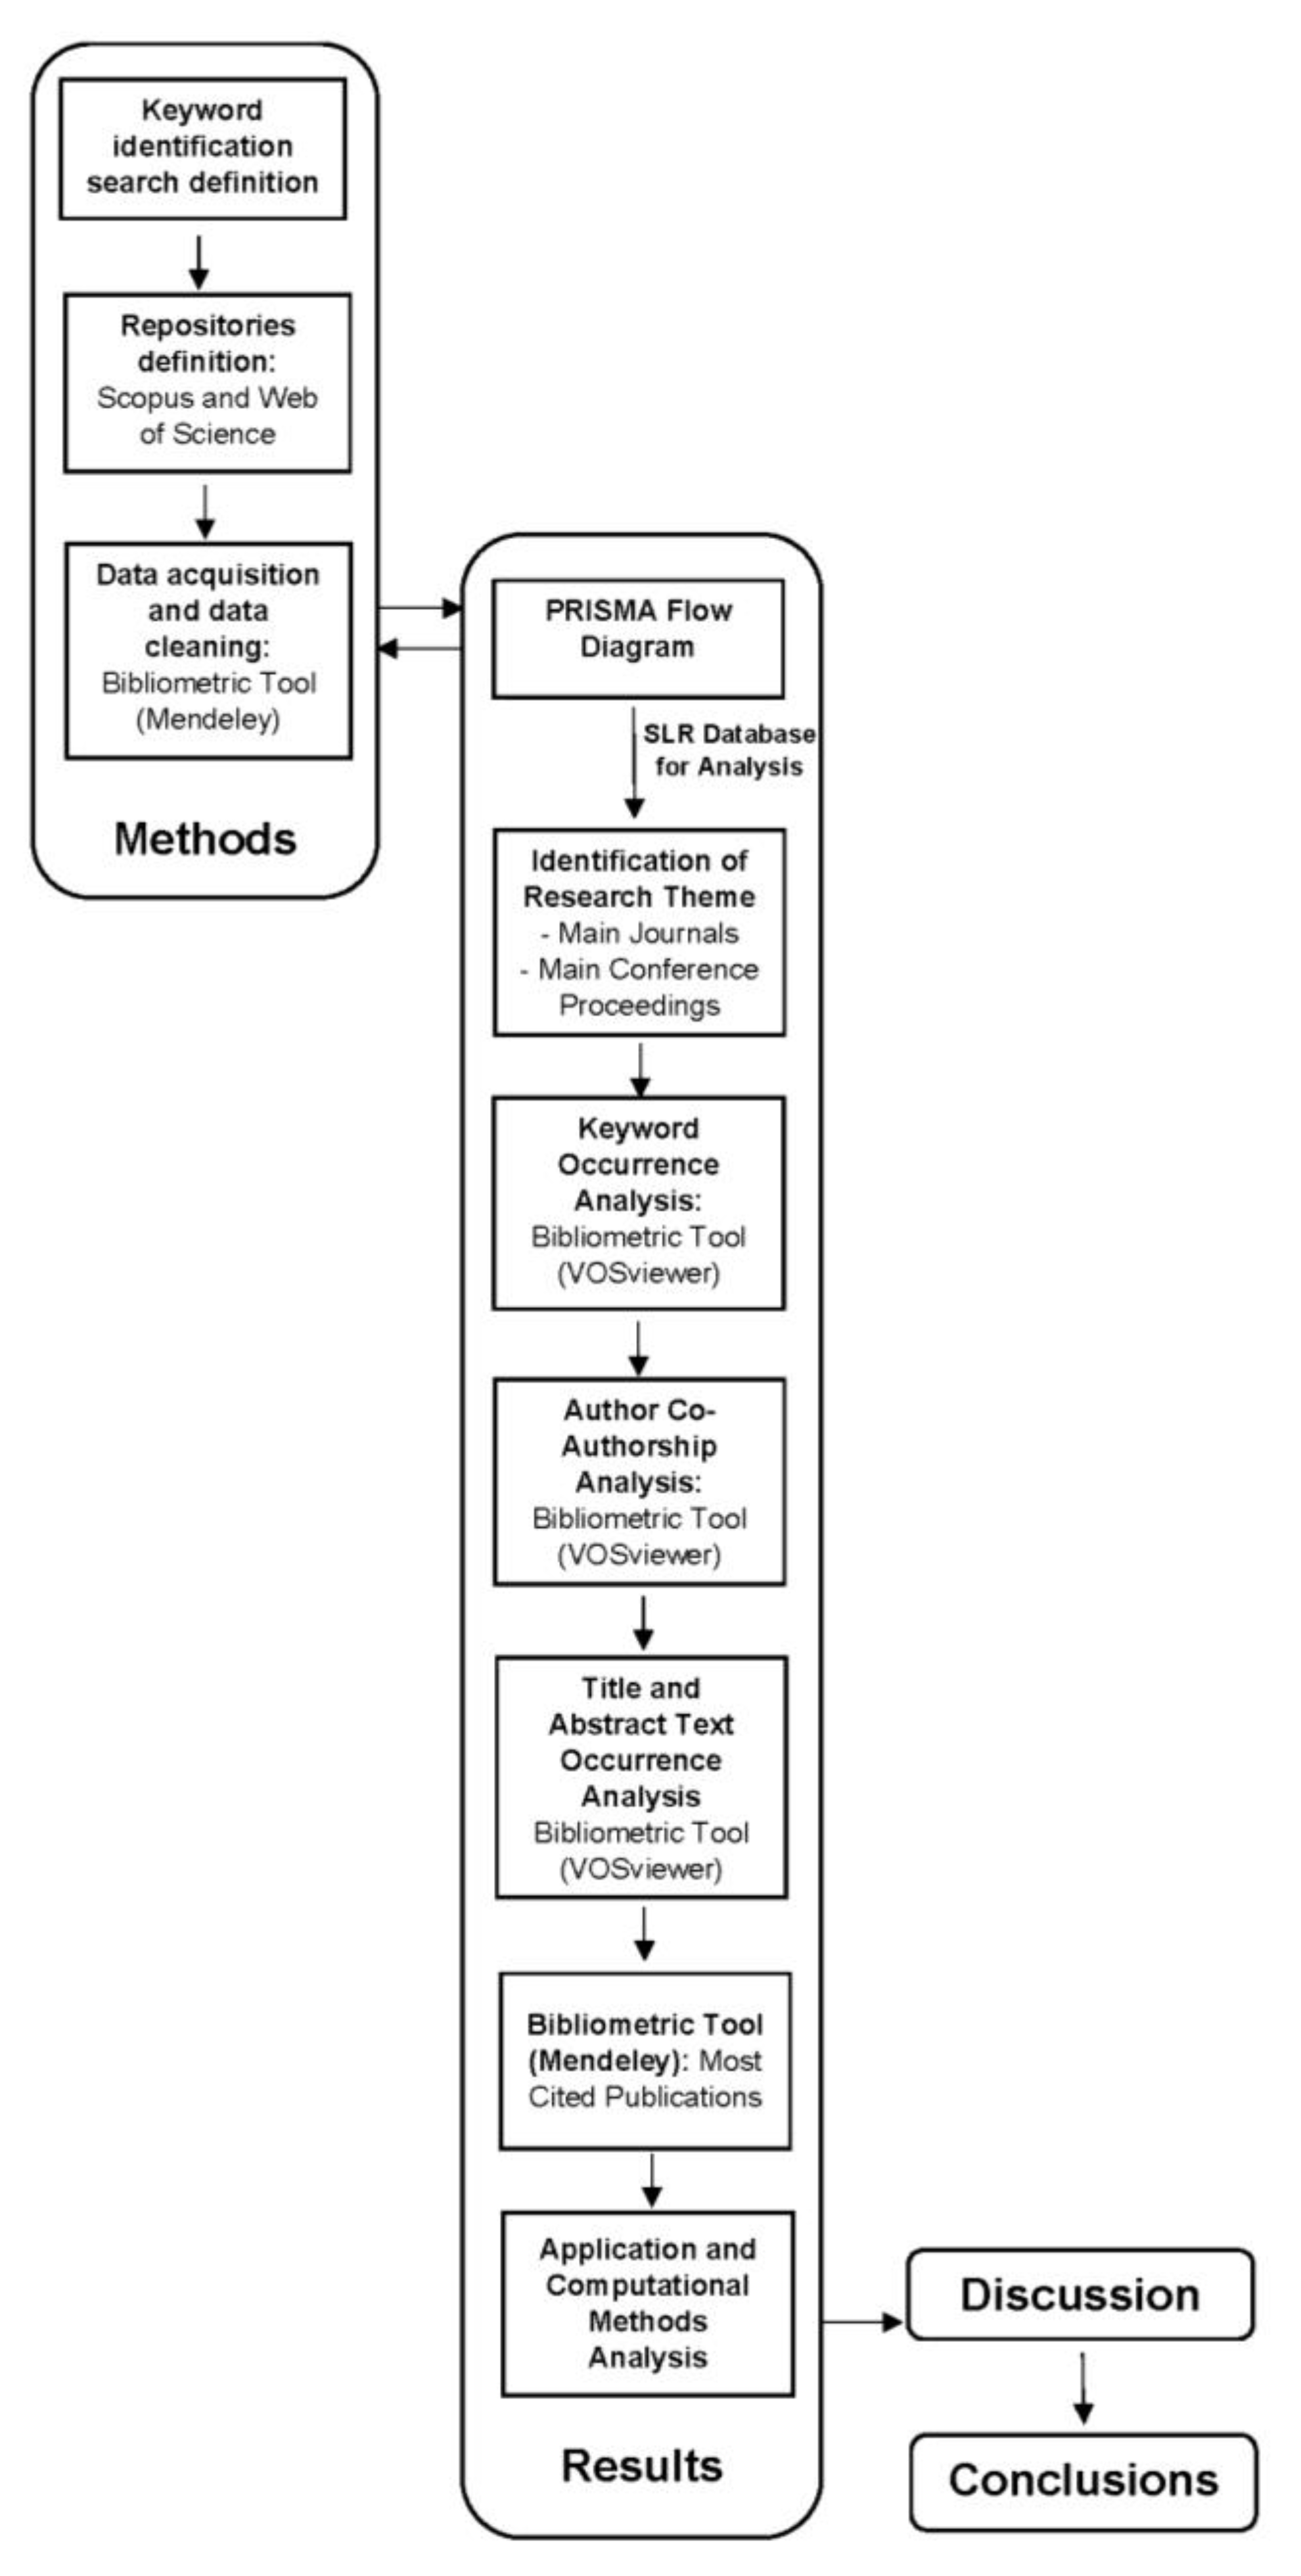
2. Method
The systematic literature review was performed by adopting the preferred reporting items for systematic reviews and meta-analyses (PRISMA) methodology [7], based on the PRISMA statement that consists of a checklist and a flow diagram.
The PRISMA checklist follows a structure with a title, abstract, introduction, methods, results, discussion and funding. For each section, there are specific items to be identified and described. The title and abstract follow an applicable structure. In the introduction, the rationale for the review and the questions to be addressed should be described. In methods, study characteristics, information sources, the search strategy including limits, the statement process for studies selected, eligibility criteria, data collection and data items are specified. Results provide screened results selection and characteristics of data extracted and the synthesis of results. The discussion involves a summary of findings, a discussion of the limitations and a general conclusion of results, with future work. The flow diagram is a four-phase flow diagram with the following phases: identification, screening, eligibility, and included.
We especially investigated the recommendations of two references. The first one, [8], helped to explore the stages of literature assessment, identifying the process (15 steps of the SLR), which we followed in our approach: step 1 is regarding the topic definition; step 2, formulation of the research question; step 3, identification of keywords; step 4, identification and search of electronic paper repositories; step 5, read and assess publications; step 6, data acquisition and data cleaning; steps 7–9, test and revise publications, resulting in step 10, production and revision of summary tables; step 11, draft methods; steps 12 and 13, evaluation and draft of key results and conclusions; step 14, draft introduction, abstract and references; and step 15, revise the paper till ready for submission.
The second study, [9], provided general guidelines that helped us develop the research question and scope of the SLR, on how to assess and address possible biases and synthesise the SLR results. According to such procedures, a time restriction on the publications was defined to scope the study: only papers published in the past five years, from 2015 to 2019, where included, and the search was performed in May 2020.
The process workflow consists of understanding all the stages of the study, as shown in Figure 1.
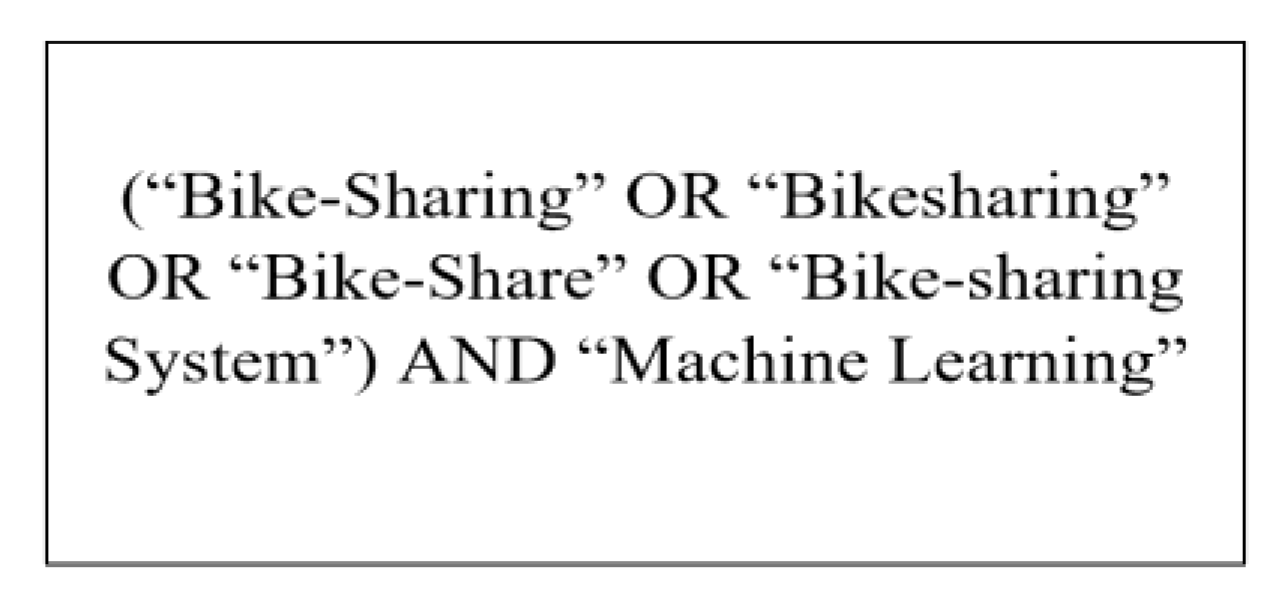
2.1. Keyword Identification and Search
An iterative search process was performed to identify publications that have in their titles, abstract or keywords the following expressions: bike-sharing (or bikesharing or bike-share or bike-sharing system) and machine learning, leading to the search query in Figure 2.
2.2. Repositories
The papers considered were searched in two electronic repositories, Scopus and Web of Science. The covered topics were multidisciplinary, including, transportation, computer science, engineering, mathematics, environmental science, telecommunications, geography and multidisciplinary sciences. Although both repositories were used, the analysis showed that most of the included publications from Web of Science were in Scopus as well.
2.3. Bibliometric Analysis
Our SLR data set for quantitative and qualitative analysis resulted from the adapted PRISMA methodology. The SLR data set was structured using the Mendeley [10] open source tool, which allowed us to extract metadata and eliminate duplicates. Having duplicates in a bibliometric analysis would make it more complex, and the relative importance of a particular keyword, author or publication would decrease. Regarding metadata, the following were extracted: authors, publication metadata, references and citations.
2.4. Bibliometric Research Tool for Network Analysis
Aiming at performing network analysis on our SLR data set, illustrating the relations and interactions between the network’s elements (nodes), we adopted the open source tool VOSviewer (https://www.vosviewer.com/). This tool was used to map, in a series of semantic networks, the keywords’ co-occurrence and co-authors’ co-occurrence in publications and allowed us to identify network properties, such as clusters and node centrality. Moreover, the tool calculates node links and weight, showing each node’s importance in the network. This allowed us to identify the main keywords, authors, co-authors and their respective relations, within the SLR data set, for quantitative analysis.
Several graphs were then created in VOSviewer [11] depicting network clustering and centrality. The size of nodes represents the degree of centrality: the larger the node, the more times it is mentioned in the SLR data set. In addition, the thickness of edges represents the number of times two connected nodes are mentioned together, indicating their relevance in relation to each other. By default, the networks are distributed from the largest to the smallest in the graph (see Figure 4 as an example).
This tool was used to analyse the data set on keywords’ co-occurrence and co-authors’ co-occurrence. In the case of keywords, combinations were filtered, occurring only once in the network. In the diagrams generated by the tool, the bigger the size of a node, the more frequently the keyword is used. The thickness of the links between the nodes represents the number of times pairs of keywords occur (the thicker the line is, the more often the pair of words is used). With respect to co-authors, the same concept was applied: the larger the node is, the more publications the author has (within this SLR database for quantitative analysis), and the thicker the line is between two authors, the more often they collaborate within the timespan of the SLR (thickness of the line represents the number of publications they have together).
3. Results
3.1. PRISMA Flow Diagram
A PRISMA flow diagram illustrates our process of SLR data set creation for further quantitative and qualitative analyses (Figure 3). The initial step in this approach identified publications through a database search, resulting in a total of 162 publications (Scopus: 140; Web of Science: 22). The main inclusion criteria for such publications were original research papers written in English and published in peer-reviewed journals and relevant conference proceedings in said time period. Review papers, position papers and reports were excluded. Subsequently, we removed duplicates (e = 20). Then we performed abstract screening. Step 1 excluded articles without abstracts and out of the scope of the research (e = 128). Step 2 excluded articles not related to transport (e = 9), and step 3 eliminated from our survey papers not related to urban mobility (e = 5). Finally, the full texts of the remaining 35 papers were read, assessed and fitted on the scope of the research. As such, in the full-text-screening phase, all papers were considered and were eligible for systematic review. Therefore, this eligibility phase excluded none of such remaining papers. From these, 24 were published in scientific journals, whereas 11 were published in conference proceedings.
3.2. Identification of Research Themes
The retained papers from journals and conference proceedings cover a wide spectrum of research fields, such as computer science, engineering, transportation, mathematics and environmental science, as shown in Table 1 and Table 2.
3.2.1. Main Journals
In this study of a total of 35 papers, we analysed 22 journal papers, including Transportation Research Part C: Emergent Technologies (5), IEEE Access (2), Journal of Transport Geography (1), Transportation (1) and Journal of Artificial Intelligence Research (1). As shown in Table 1, most journals are Q1-quartile-ranked (13), representing 68%, and the remaining (9) are Q2 articles.
The five main fields identified in the analysis were computer science, engineering, transportation, environmental science and mathematics.
The 22 selected articles’ publishers originate from five countries, with the largest set from the United Kingdom (7) and the Netherlands (5), followed by Germany (4), the United States of America (3) and Egypt (1). Top publishers identified are Elsevier Ltd. (6), Elsevier BV (3), Institute of Electrical and Electronic Engineers Inc. (2), Kluwer Academic Publishers (2) and Morgan Kaufmann Publishers, Inc. (1).
3.2.2. Main Conference Proceedings
The main conference proceedings identified in this study were Procedia Computer Science (2), Transportation Research Procedia (1), ACM (2), more specifically, the ACM International Conference Proceeding Series and the ACM International Joint Conference on Pervasive and Ubiquitous Computing (Proceedings of the 2016), and IEEE (7), specifically, the IEEE International Conference on Models and Technologies for Intelligent Transportation Systems, the IEEE Conference on Intelligent Transportation Systems, the IEEE International Conference on Big Data, Big Data and the IEEE/ACIS International Conference on Computer and Information Science.
Table 2 shows that the main research fields of the conference proceedings are computer science, engineering, mathematics and transportation, mostly published in the United States, with two published in the Netherlands.
3.3. Keyword Occurrence Analysis
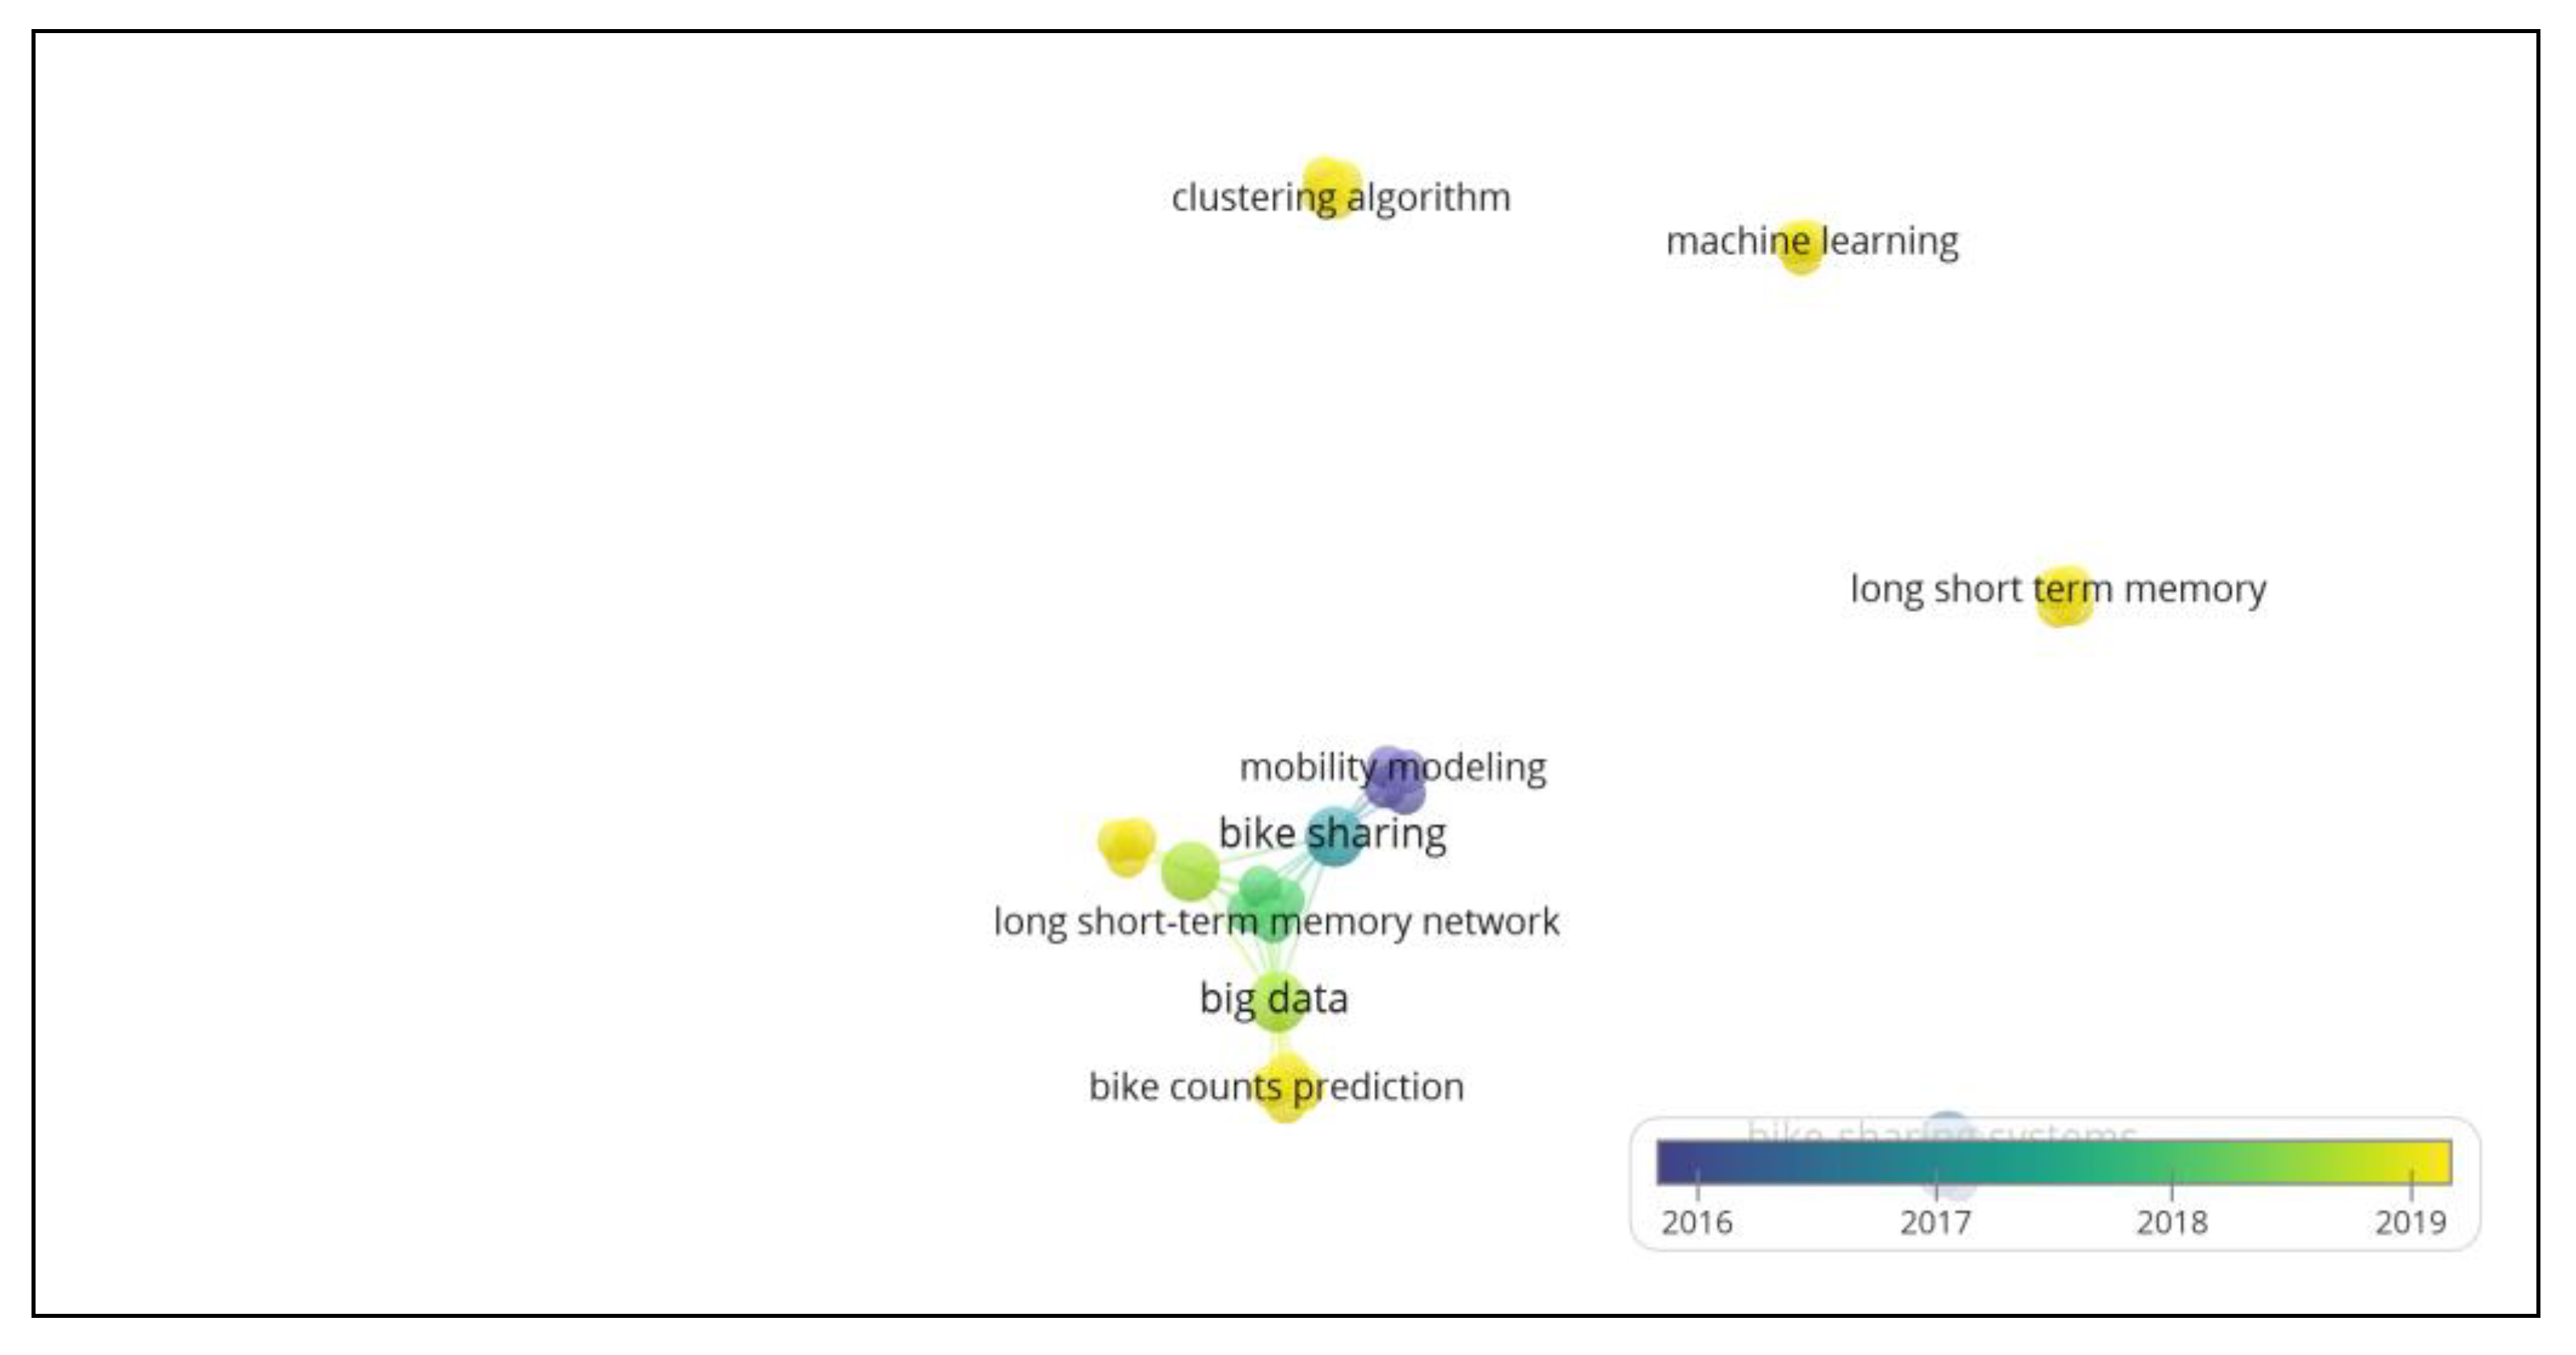
Keyword occurrence analysis was performed using the mentioned bibliometric research tool for network analysis, VOSviewer. The analysis was performed using a full counting method, encompassing 44 screened keywords, with a minimum threshold of 1 occurrence. Of the total 44, only 35 keywords were selected for the purpose of the analysis (Table 3). Most of the analysed keywords were related to machine learning techniques applied to bike-sharing systems. The top five identified terms were big data (2 occurrences, 10 total link strength), bike-sharing (2 occurrences, 10 total link strength), deep learning (2 occurrences, 9 total link strength), long short-term memory networks (1 occurrence, 6 total link strength) and sharing mobility (1 occurrence, 6 total link strength), all aligned with the keyword search.
In keyword co-occurrence analysis, 8 clusters (Figure 4 and Figure 5) were identified with 35 items and 77 links. The biggest nodes of each cluster in the network were identified as bike-sharing systems (red), long short-term memory (cyan), machine learning (brown), clustering algorithm (yellow), big data (green), deep learning (orange), sharing mobility (purple) and bike-sharing (blue).
The connections among the research themes identified by keyword co-occurrence are shown in Figure 4 and Figure 5. There is a large, interconnected network of keywords, as well as groups of keywords that occur together in individual articles, mostly in 2019. The keyword analysis showed fields of the research reinforcing the topics of machine learning and bike-sharing systems and identified machine learning techniques applied to bike-sharing systems, such as clustering algorithm and deep learning.
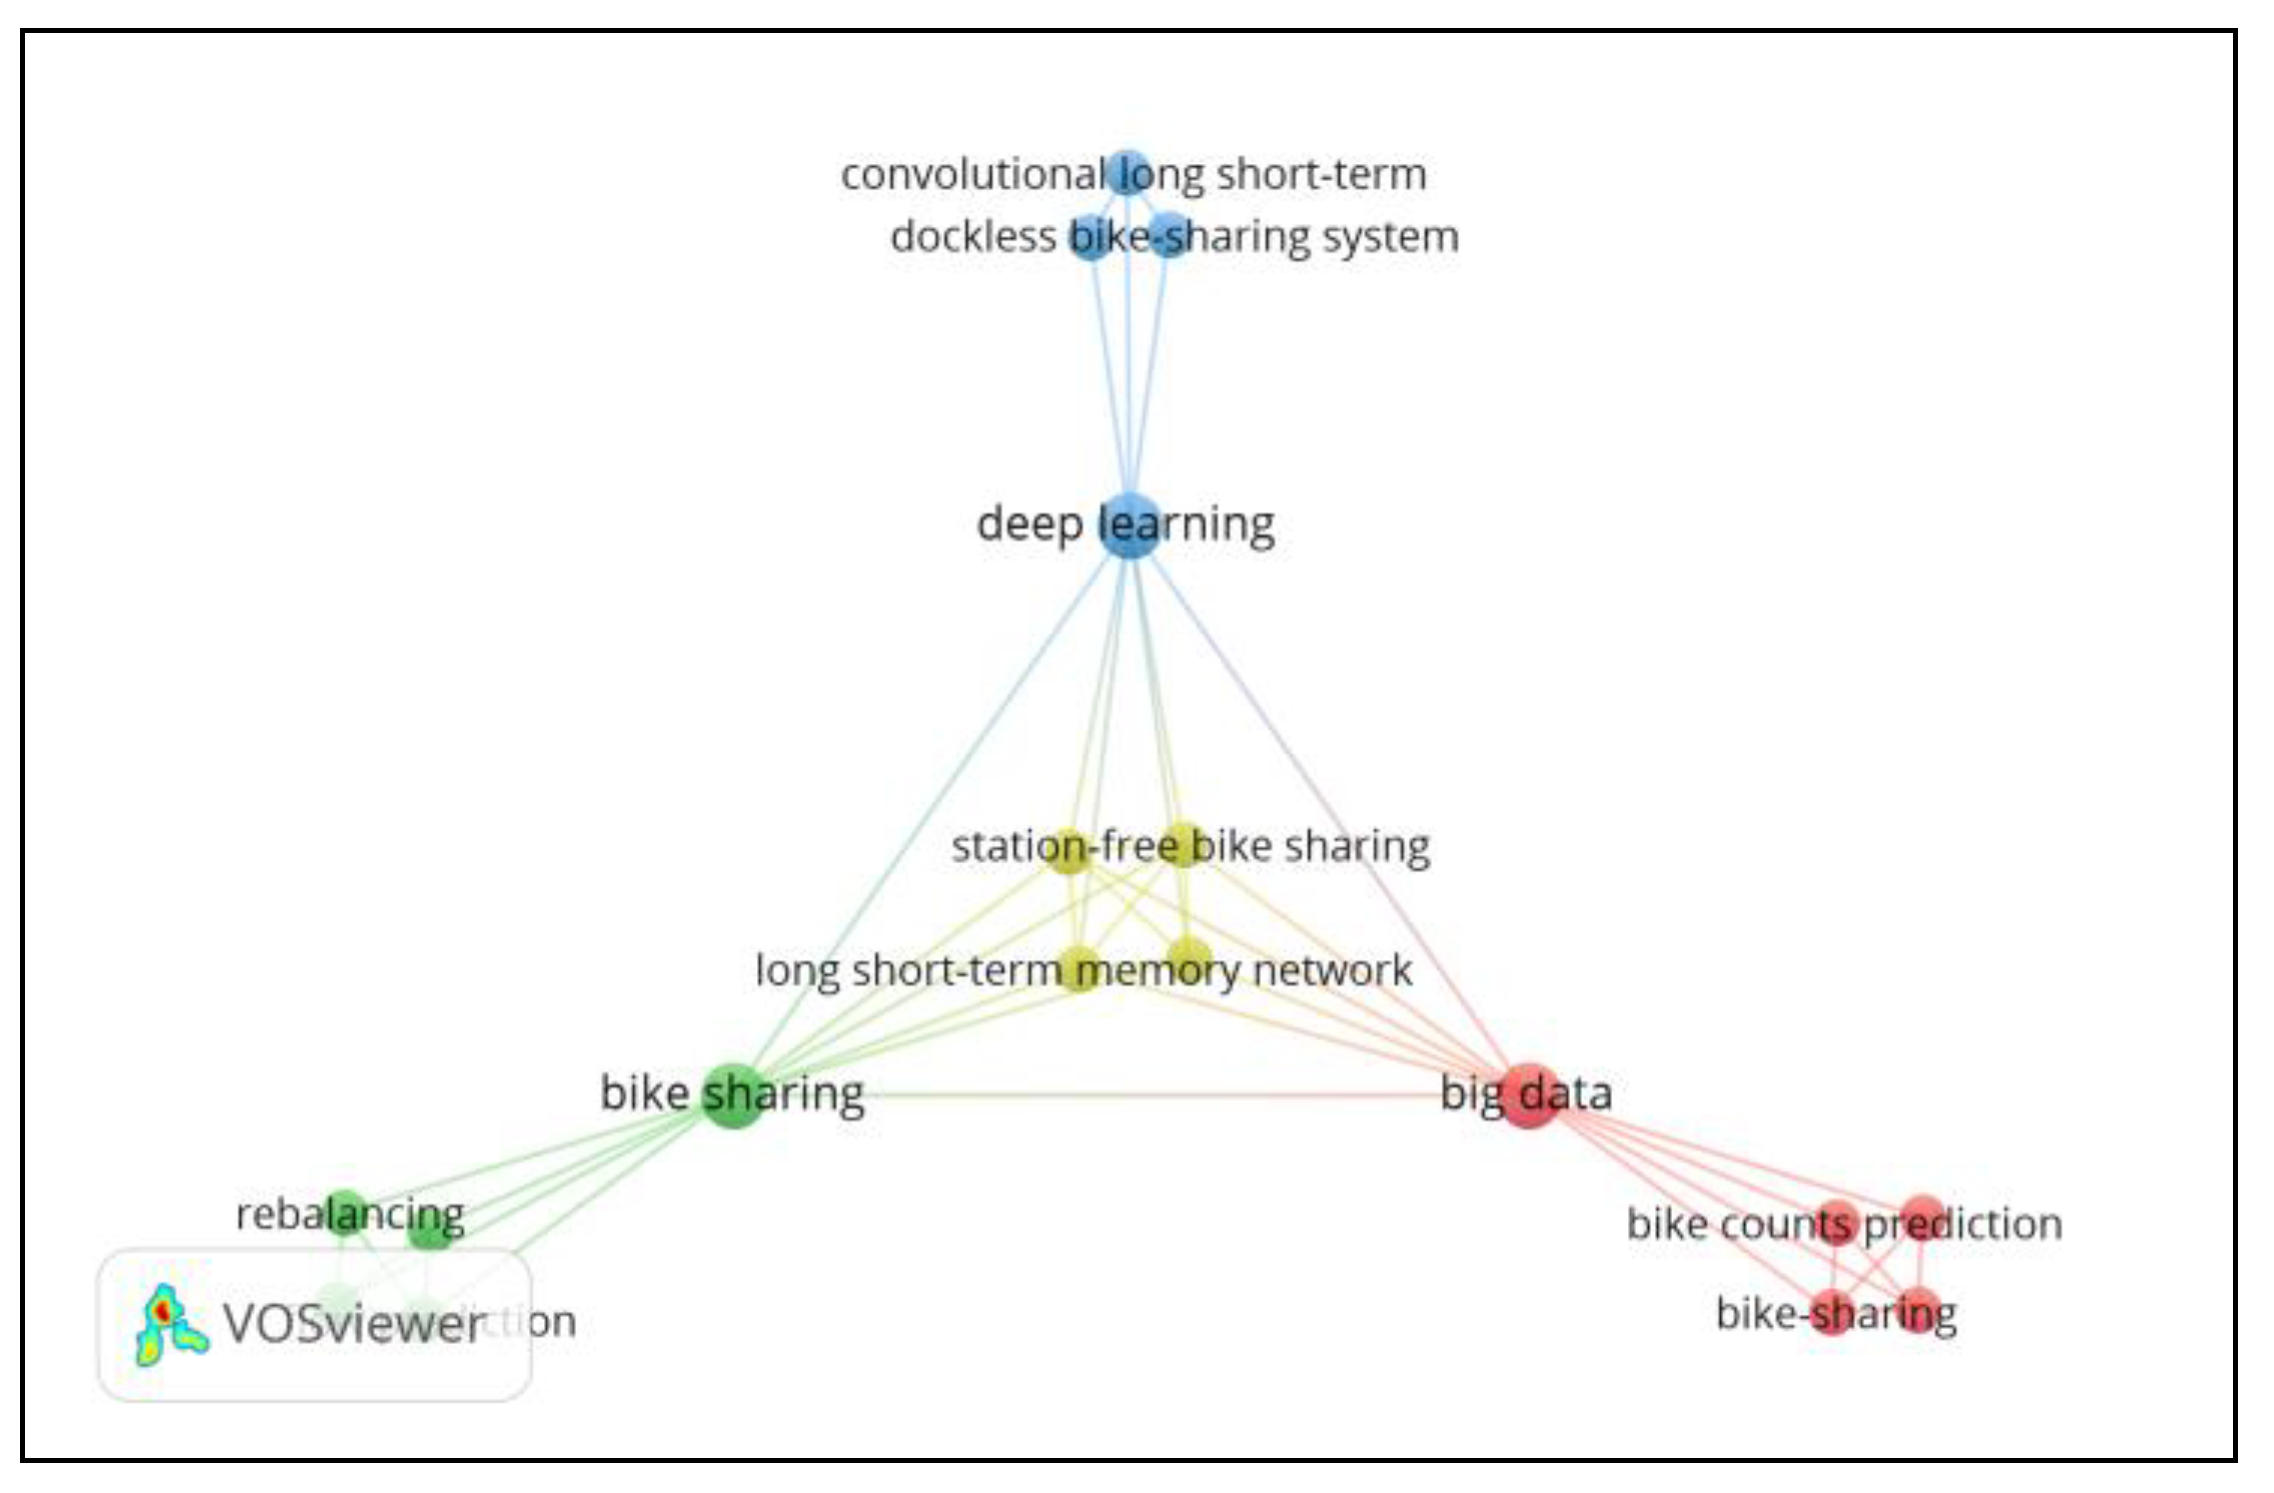
Looking closer at the interconnected network of Figure 6 (18 items, 4 clusters and 47 links), prediction algorithms, such as deep learning, convolutional long short-term and long short-term memory network, were identified regarding rebalancing, bike count prediction and flow prediction.
Finally, machine learning techniques applied to bike-sharing systems were clearly defined in the SLR analysis, showing two main trends: clustering (classification) and prediction.
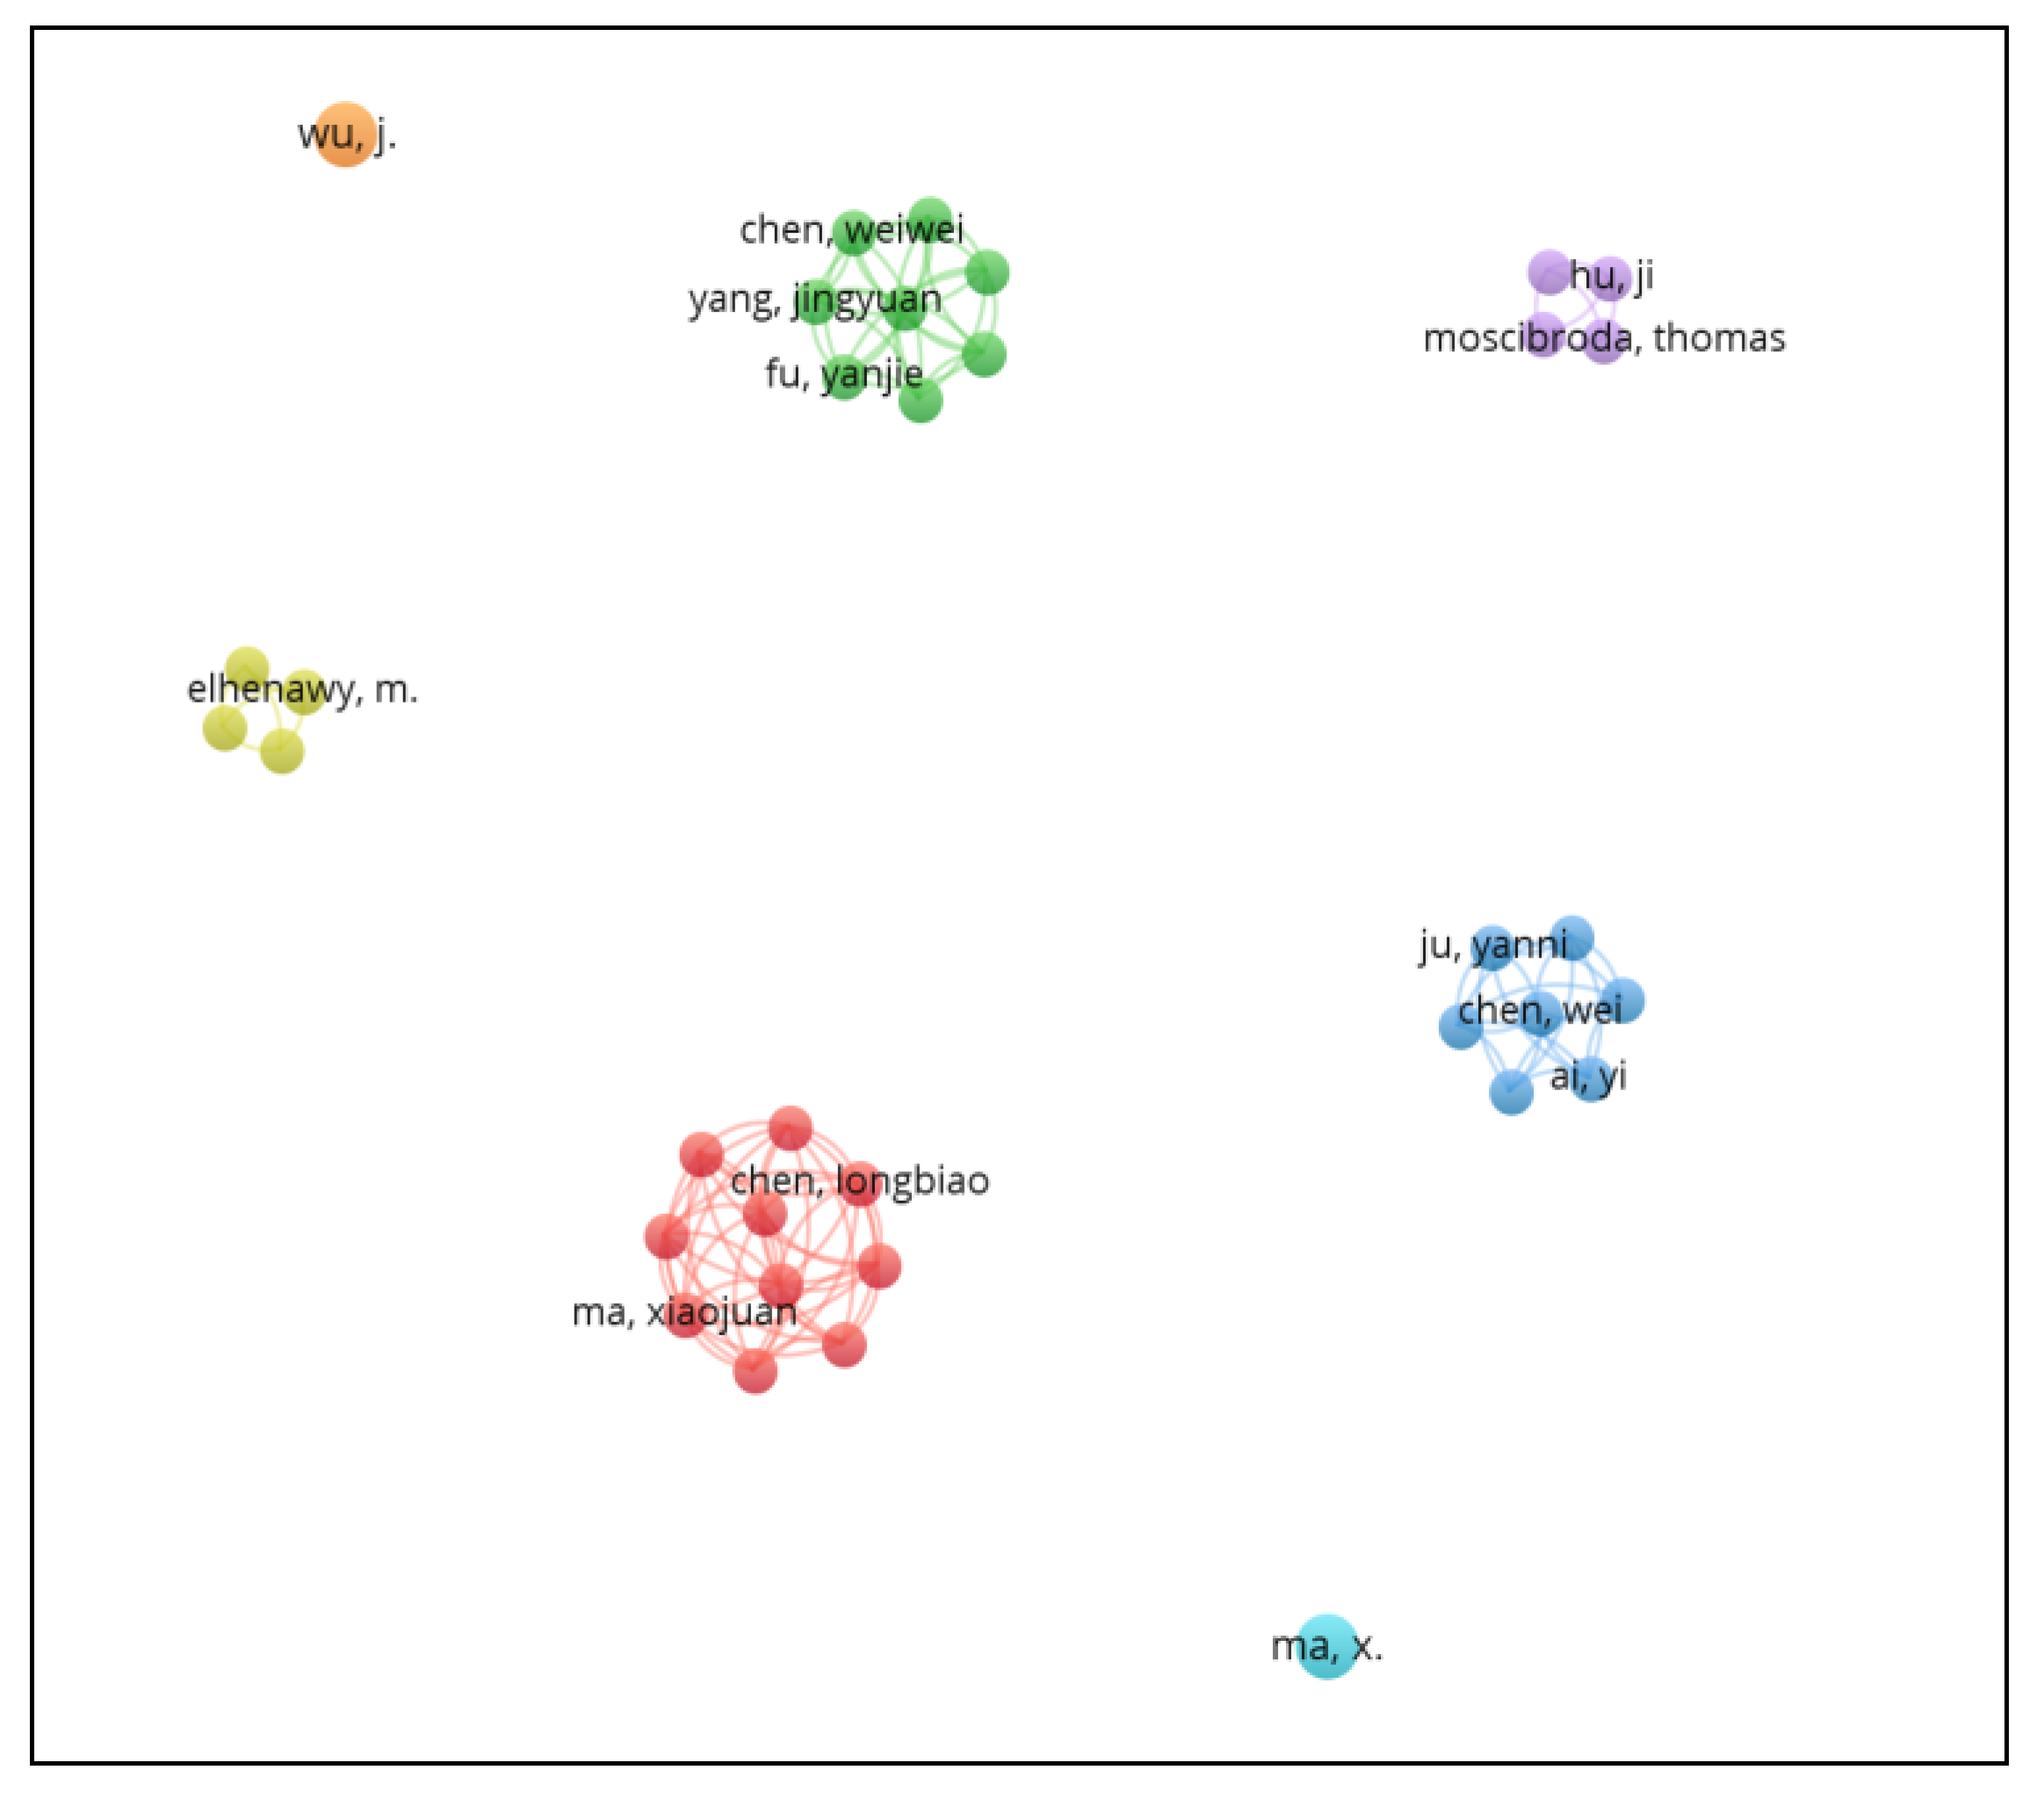
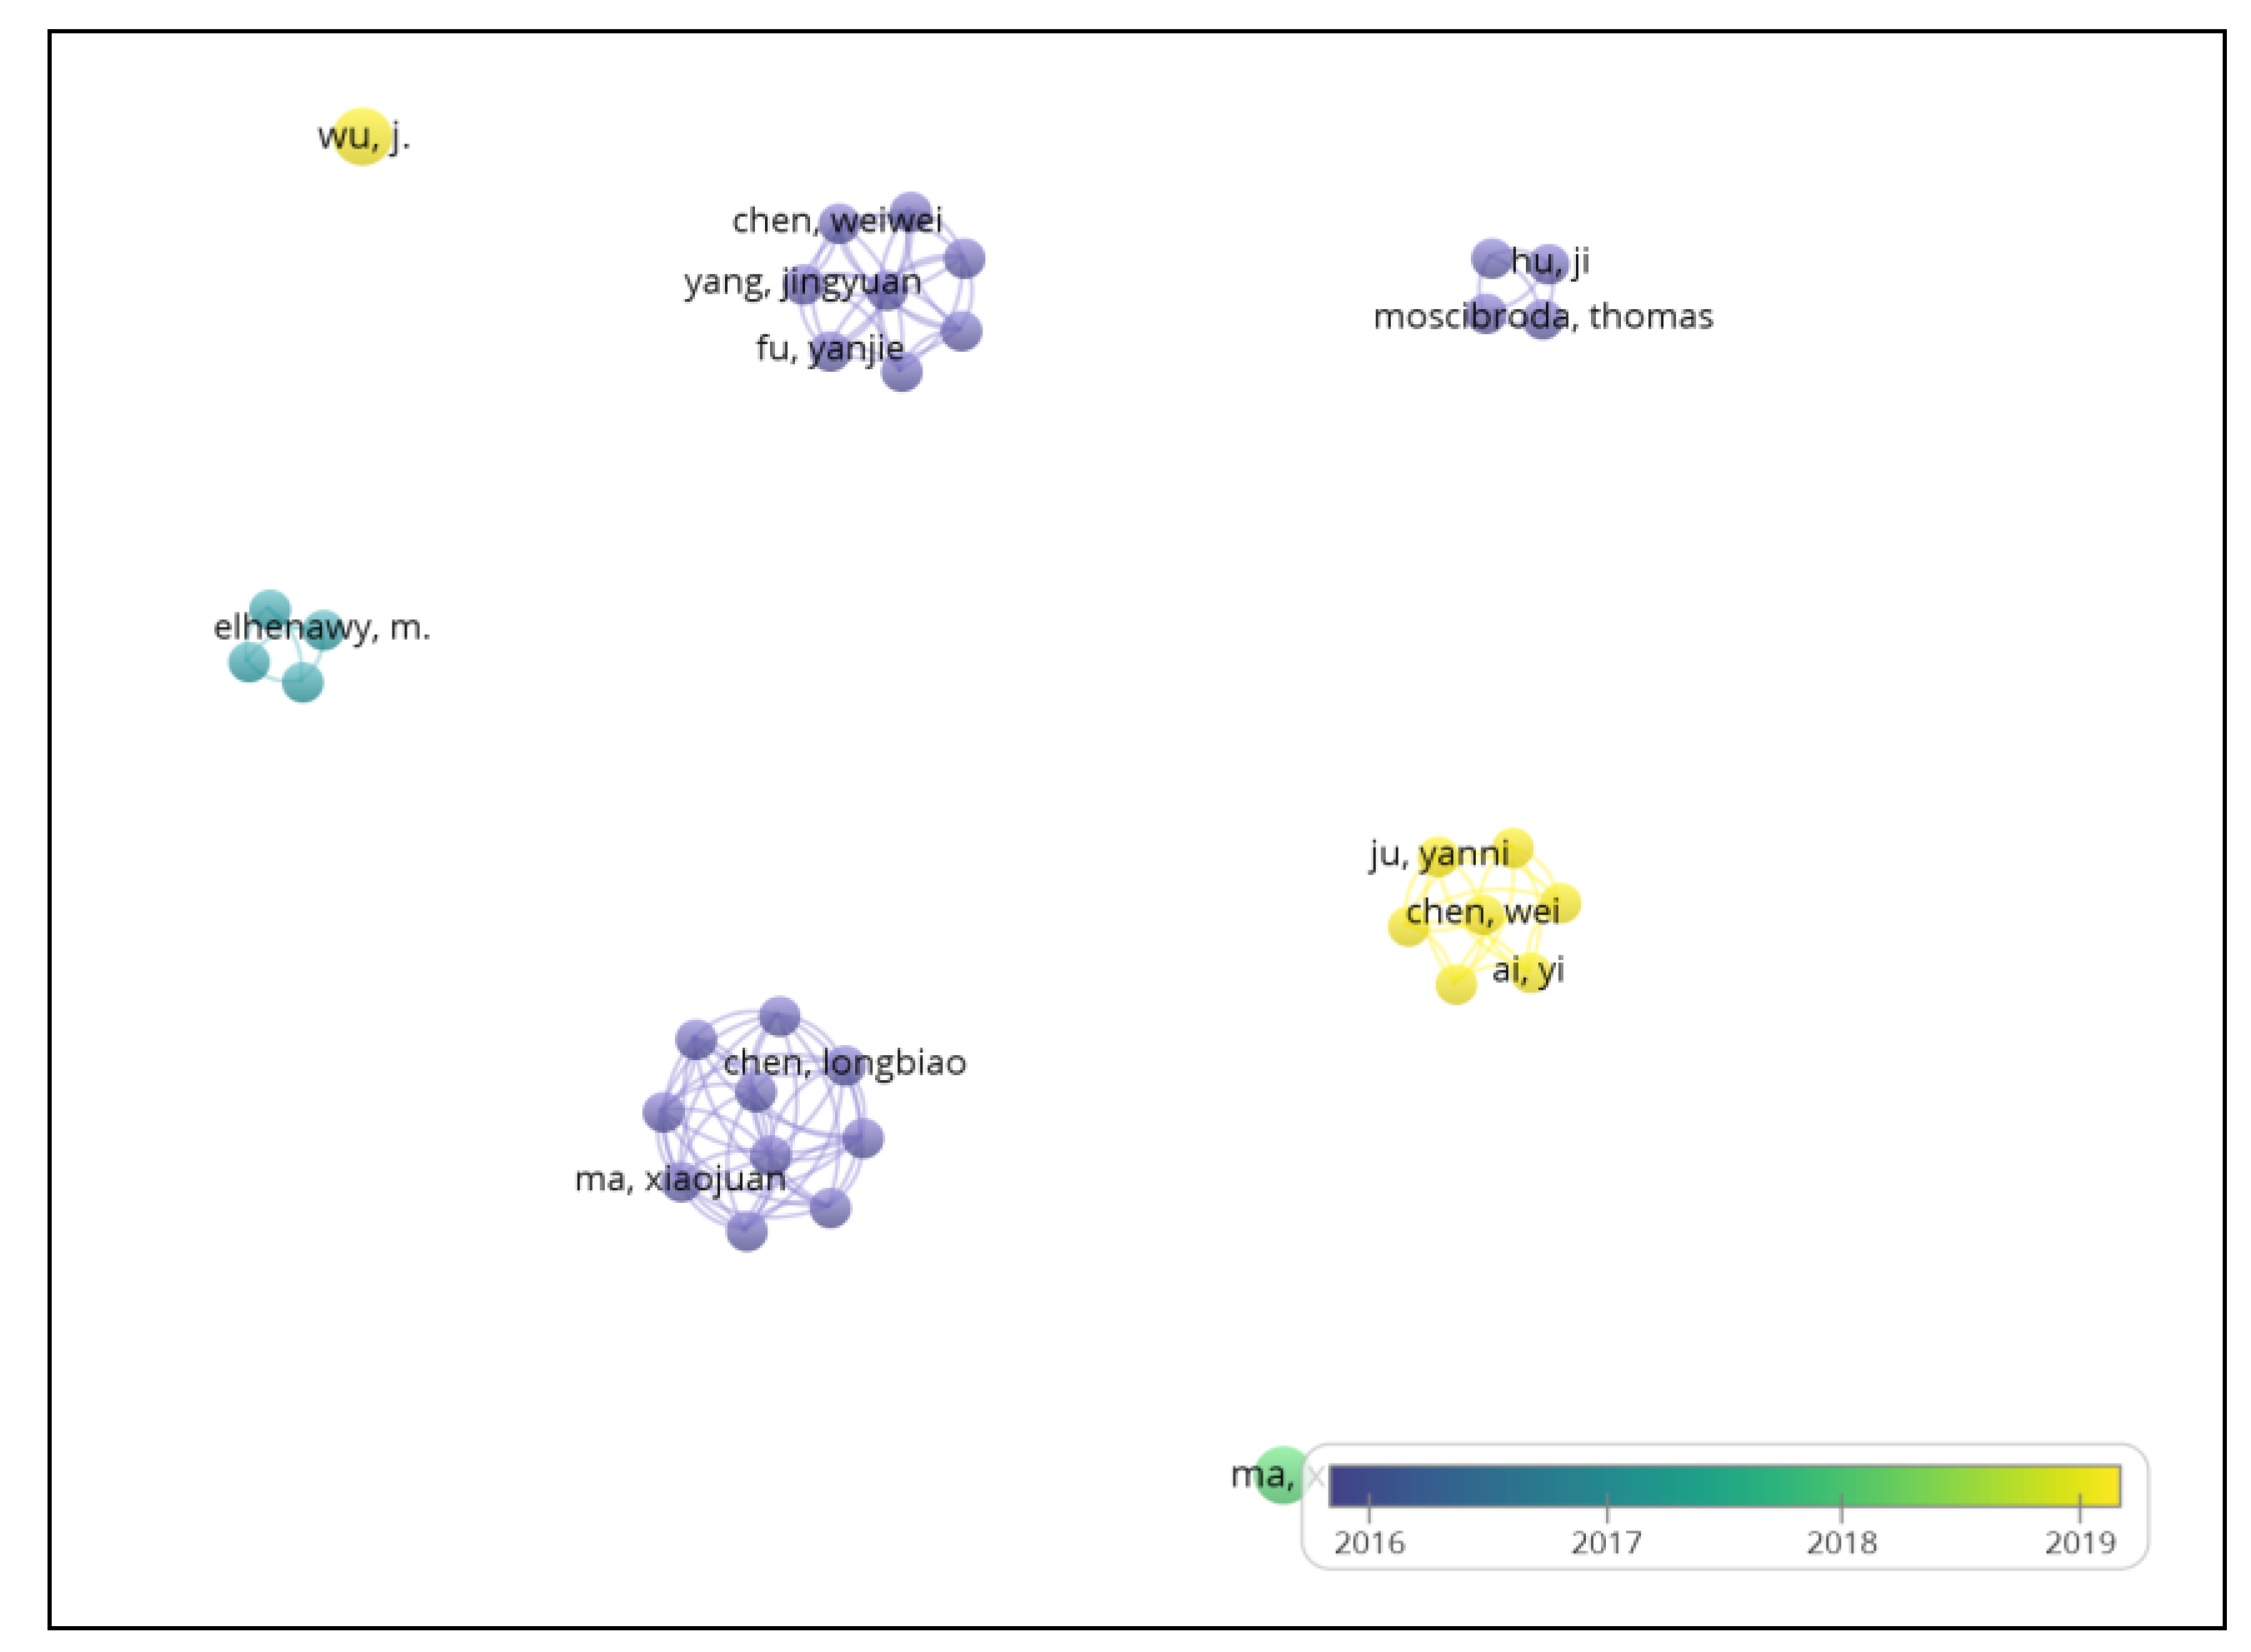
3.4. Author Co-Authorship Analysis
Author occurrence analysis was performed with the previously mentioned bibliometric research tool for network analysis, VOSviewer.
The analysis on authorship was performed using a full counting method, choosing the minimum threshold of 1, resulting in a total of 140 authors meeting the threshold, of which 35 authors were analysed (Figure 7).
The top 10 identified authors were Chen, L. [12], Jakubowicz, J. [12], Li, S. [12], Ma, X. [12], Nguyen, T. M. T. [12], Pang, G. [12], Wang, L. [12], Wu, Z. [12], Yang, D. [12] and Zhang, D. [12], all with a link strength of 9.
In author co-authorship analysis, 7 clusters were identified with 35 items and 106 links. Cluster 1 (red) corresponds to the top 10 author co-authorship ranked by link strength (Table 4), Cluster 2 (green) has 8 items identified (Chen, W. [13], Fu, Y. [13], Li, Q. [13], Liu, J. [13], Qu, M. [13], Xiong, H. [13], Yang, J. [13] and Zhong, H. [13]), Cluster 3 (blue) has seven items identified (Ai, Y. [14], Chen, W. [14], Gan, M. [14], Ju, Y. [14], Li, Z. [14], Yu, D. [14] and Zhang, Y. [14]), Cluster 4 (yellow) has four items identified (Elhenawy, M. [15], Ghanem, A. [15], House, L. [15] and Rakha, H. A. [15]), Cluster 5 (purple) has four items identified (Hu, J. [16], Moscibroda, T. [16], Shu, Y. [16] and Yang, Z. [16]), Cluster 6 (cyan) has one item (Ma, X. [17,18]) and Cluster 7 (orange) has one item, Wu, J [19,20].
Cluster 3 and Cluster 7 correspond to authors who published articles in 2019. Cluster 4 corresponds to authors with publications in 2017 and 2018; as for the remaining authors, articles were published in 2016.
Figure 8 shows that the top 10 author co-authorship were published in 2016, showing that the academic community had strong ties in 2016.
The highest number of relevant articles were published from 2017 to 2019, showing that the academic community got broader with more researchers involved and more interested in machine learning techniques applied to bike-sharing systems, as shown in Section 3.5.
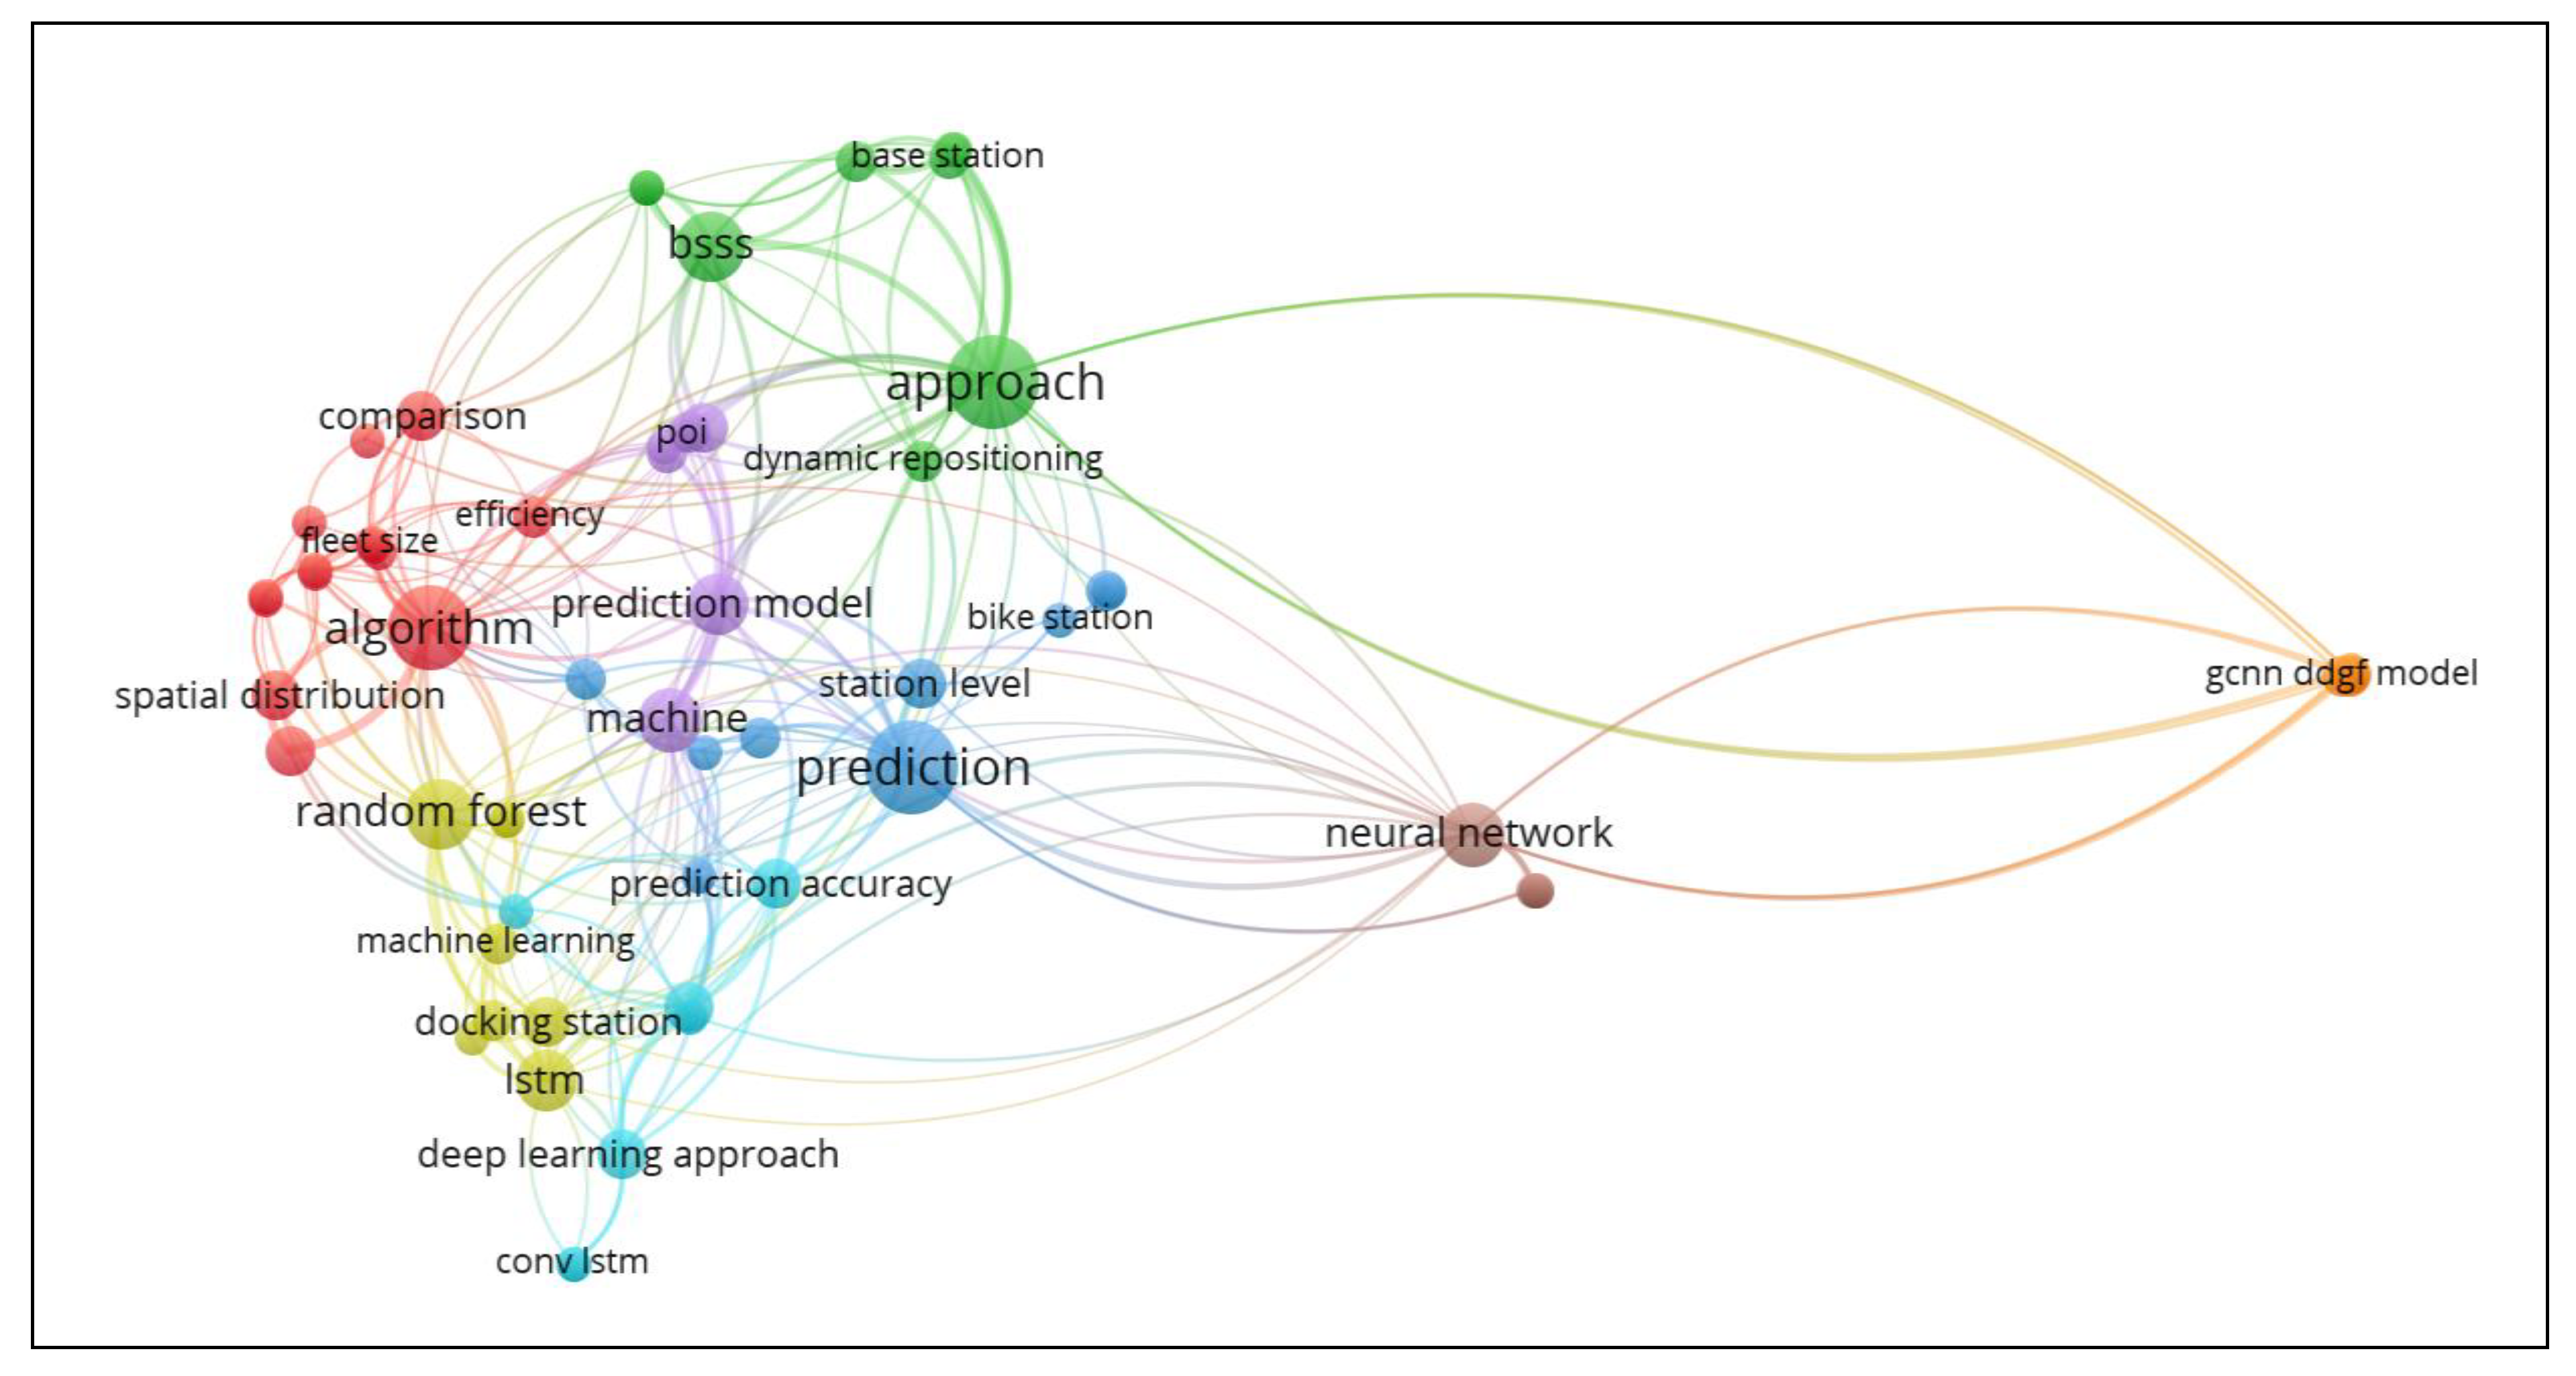
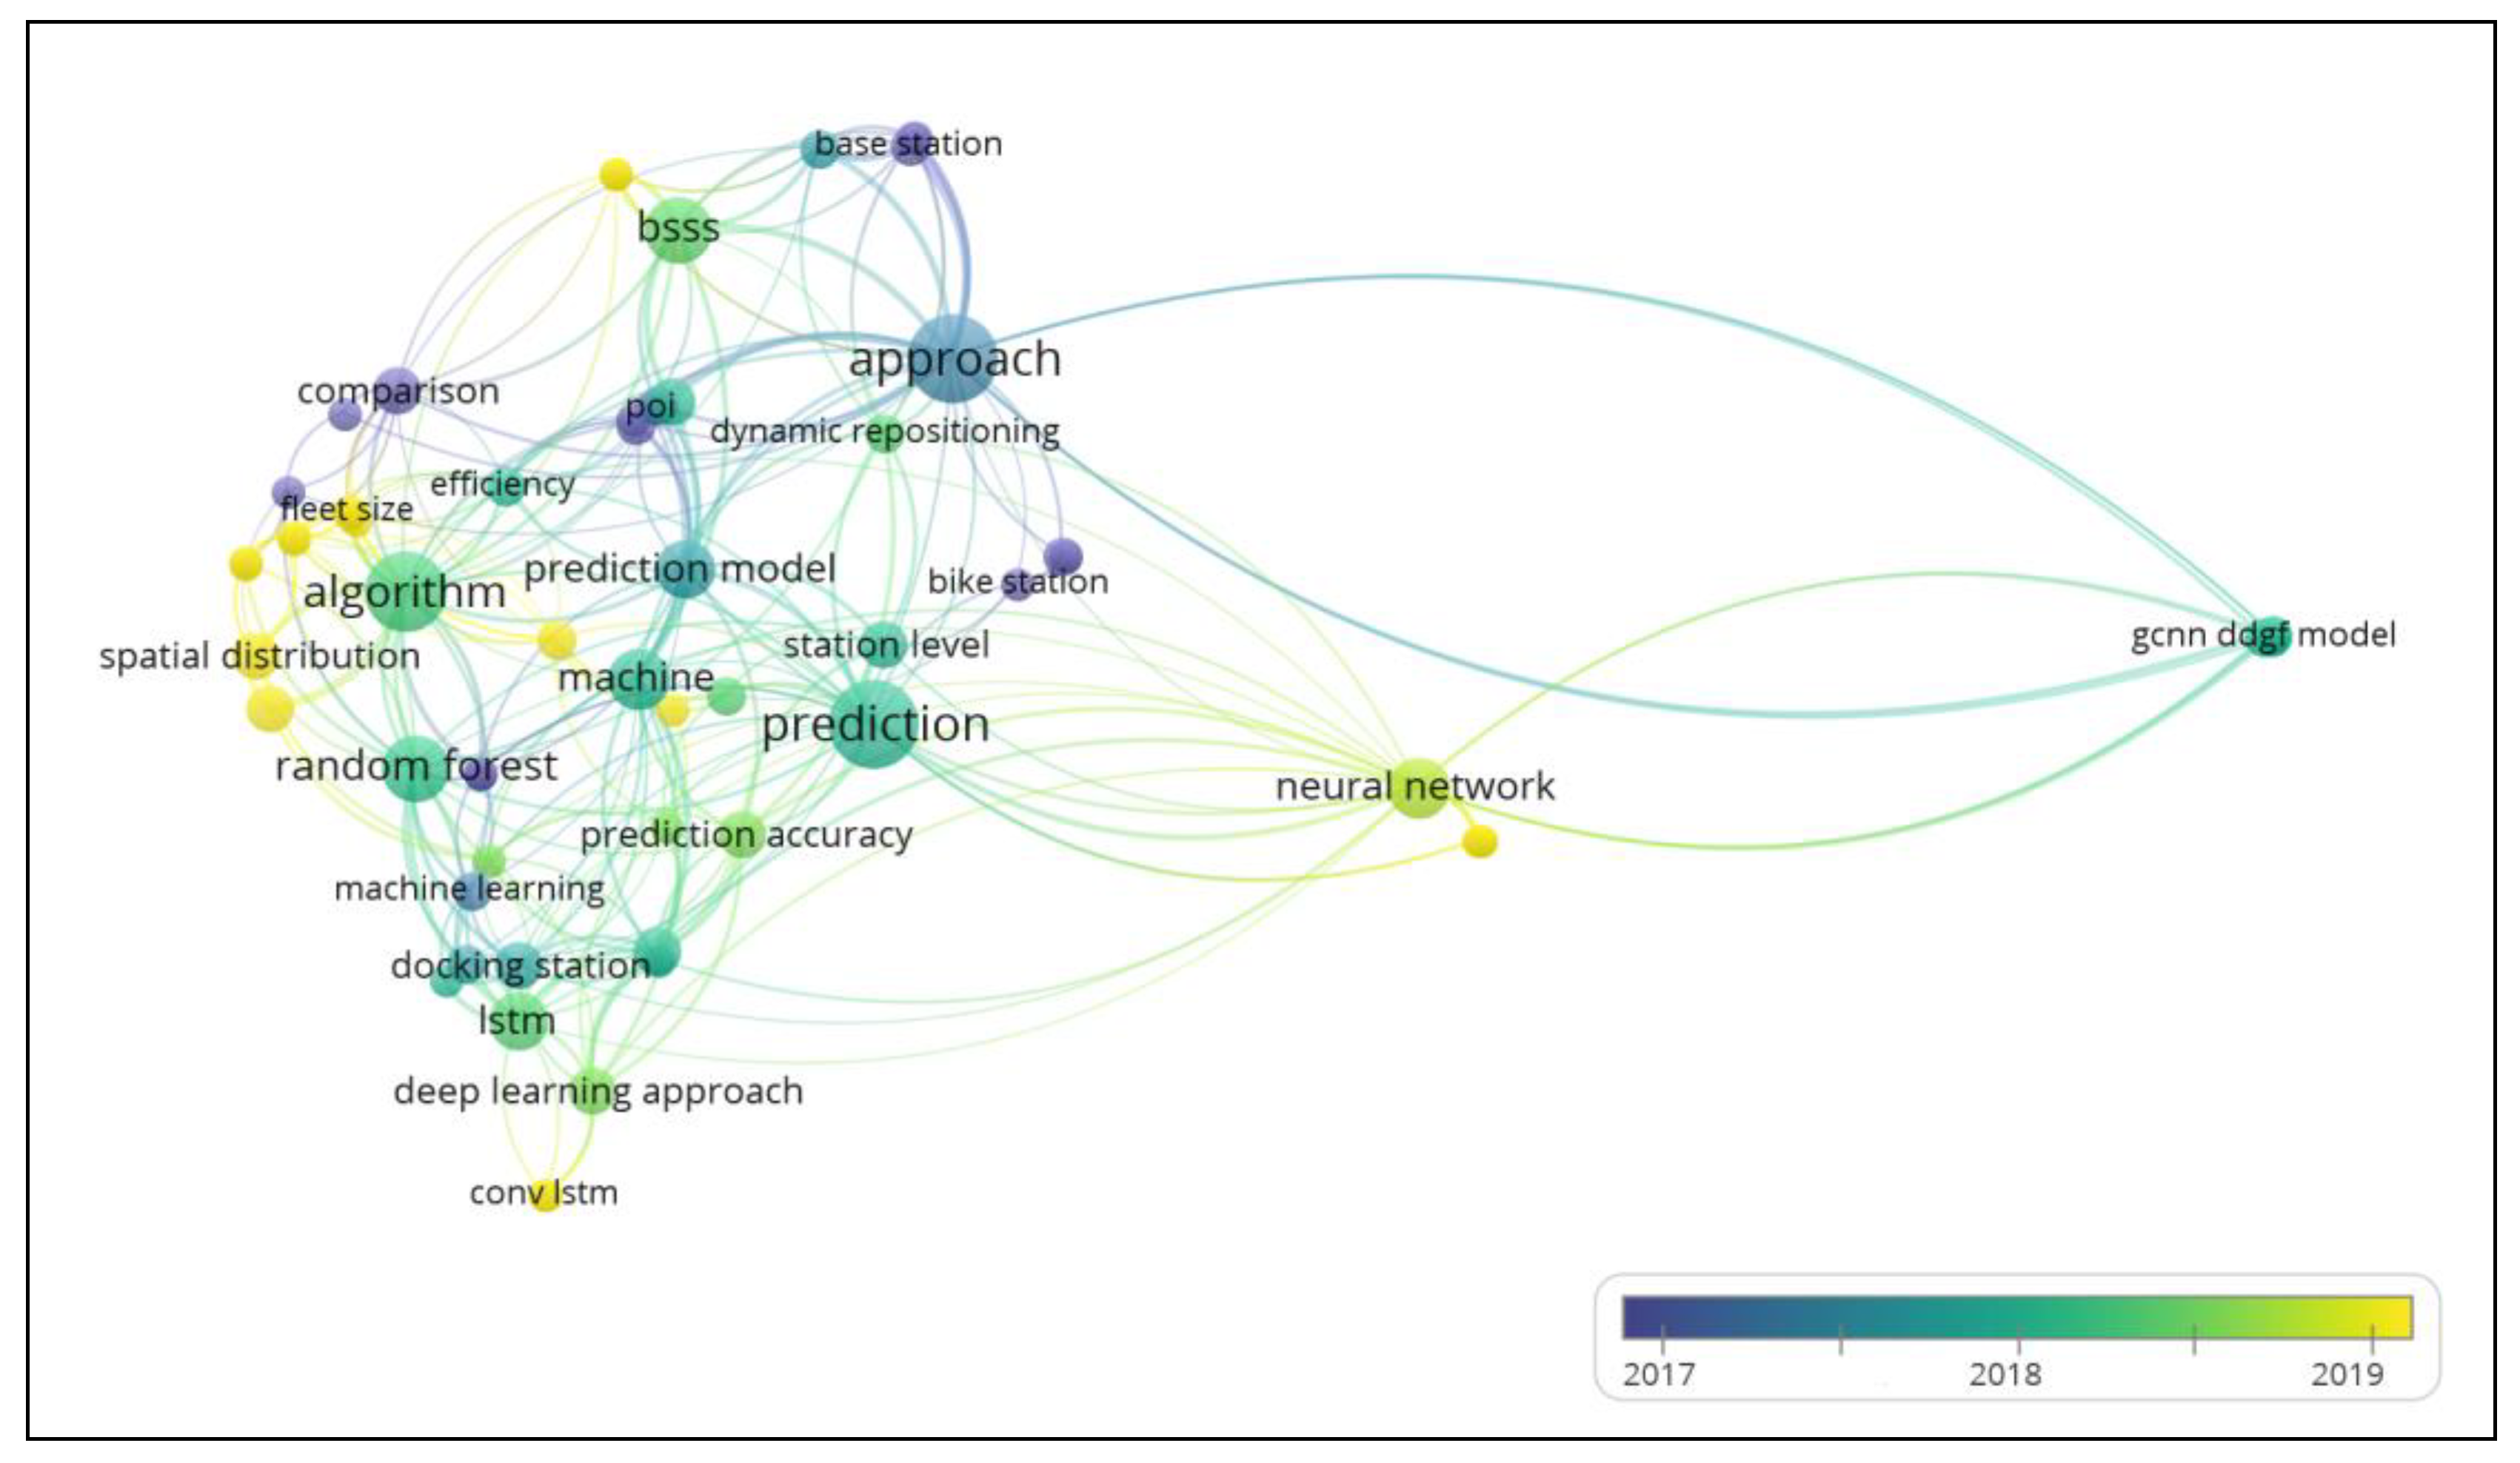
3.5. Title and Abstract Text Occurrence Analysis
This analysis (with VOSviewer) was performed on text data using a full counting method and included 749 screened items with a minimum threshold of 2 occurrences, resulting in 160 items. The relevance score was calculated for 40% of the sample as a standard reference for the calculation. The process result is shown in Table 5 for the 13 most relevant terms.
The analysis computed a network with 64 items, 8 clusters, 310 links and a total link strength of 987 (Figure 9). The network highlighted an eight-cluster network, being the biggest nodes of each identified as gcnn ddgf model (orange), neural network (brown), lstm nns (cyan), random forest (yellow), approach(green), algorithm(red), prediction model (purple) and prediction(blue). The identified machine learning techniques were also coherent with the ones identified in the keyword analysis, namely deep learning, clustering algorithm and long short-term memory, also suggesting other techniques, such as graph convolutional neural networks with data-driven graph filter (GCNN-DDGF) and neural networks (RNN and CNN).
3.6. Most Cited Publications
Analysis of the most cited publications helped us identify the relevant research topics in the literature. To this aim, a search for the most cited, selected publications was conducted using Scopus and Web of Science data sets. This search showed publications that have been cited between 60 times and 1 time. The results of this process are shown in Table 6.
From the five highlighted publications, we found that Yang, Z., Hu, J., Shu, Y., (...), Chen, J. and Moscibroda, T. [16], was the most cited with 60 citations, followed by Chen, L., Zhang, D., Wang, L., (...), Nguyen, T.-M.-T. and Jakubowicz, J. [12], with 57 citations; Zhou, X. [26], with 54 citations; Caggiani, L., Camporeale, R., Ottomanelli, M. and Szeto, W.Y. [27], with 53 citations; and, finally, Ghosh, S., Varakantham, P., Adulyasak, Y. and Jaillet, P. [28], with 43 citations.
The articles in Table 6 include these described above and suggest coherence with the results from previous analyses. These articles are major bodies of literature, and some of them represent key concepts in the field.
Interestingly, five of the most cited articles identified in Table 6 were published in Q1-ranked journals. We found that the articles were published in a diverse range of journals, and there is no outstanding leading journal in the field.
Moreover, and coherent to the analysis, the most cited article is also highlighted in the author co-authorship analysis (Section 3.4). In fact, Cluster 5 (purple) in Figure 7 groups the most cited author co-authorship [16], and Cluster 1 (red) groups most of the author co-authorship of the second-most cited article [12]. In both keyword occurrence analysis (Section 3.3) and abstract and title text occurrence analysis (Section 3.5), the term random forest was outstanding and is a technique adopted by the most cited publication [16].
3.7. Application and Method Analysis
To evaluate the applications and computing methods of each paper, a theoretical and conceptual framework was built, as shown below in Table 7.
This framework aims to understand most used machine learning techniques according to application and method. It provides the direction of research goals and outcomes and creates the scope for studies on our research-related criteria evaluation.
Several methods and dimensions were applied to BSS applications on SLR articles. Three out of the ten SLR most cited articles [26,27,29] refer to spatiotemporal variation analysis, addressing station spatial distribution with different temporal use, bike behaviour and mobility patterns.
Clustering algorithms, such as hierarchical clustering, community detection clustering and K-means, were tested in studies [26,27,29] to model granular behaviour patterns on bike station spatiotemporal redistribution. The dimension of the application changes according to studies, some using the techniques separately for each dimension (station, cluster and city levels) and others combining or overlapping on the three levels [26].
Of the 10 most cited SLR articles, studies suggest prediction models to address different applications. A random forest (RF) is applied in the study [30] of the most cited article to build a spatiotemporal dynamic network to evaluate and predict station and city bike demand.
On the other hand, the second-most cited article proposes a weight correlation network (WCN) to model the relationship among bike stations and dynamically group neighbouring stations with similar bike usage patterns into clusters, followed by artificial neural network (ANN) and Monte Carlo (MC) simulation to predict the over-demand probability of each cluster, looking at station- and cluster-level dimensions.
An artificial neural network (ANN) is used in a study [13] on the bike-sharing network optimisation approach of station site allocation, in terms of the bike usage and the required rebalancing efforts, by considering multiple influential factors, such as the environment and complex public transportation networks.
Graph convolutional neural network with data-driven graph filter (GCNN-DDGF) models [31] are used to implement spatiotemporal correlations patterns between stations and to predict the station-level hourly demand in a large-scale bike-sharing network.
A prediction model has been used in the latest studies [14,20,21,24,32,33], the long short-term memory neural network (LSTM NN). Xu [32] applied LSTM NNs in their study to predict the bike-sharing trip gap and mobility patterns of the station-free BBS at a citywide scale and to develop dynamic demand forecasting models of dynamic demand with the aim to predict the travel demand of station-free bike-sharing using the deep learning approach.
4. Discussion
Our SLR aimed to outline and identify the main machine learning techniques’ contributions to BSSs in urban mobility, as well as to create a systematic, organised view of this research topic.
In this section, we discuss how the SLR answers our posed research question, which we recapitulate: What are the most promising machine learning techniques adopted by the community to better understand and improve bike-sharing systems in urban mobility?
4.1. Research Question Discussion
Our SLR analysis shows that the two main problems addressed by the proposed machine learning techniques are clustering (classification) and prediction applied to bike-sharing systems.
Clustering algorithms were analysed in Section 3.7 (Application and Method Analysis) and are mostly applied to imbalanced bike usage patterns regarding demand.
Reviewed papers apply clustering algorithms to a bike-sharing system’s data by combining temporal and spatial attribute variables. More specifically, three clustering algorithms, namely hierarchical clustering [26,29,34], community detection clustering [26,27] and K-means clustering [27,35,36,37], were the most commonly used.
According to Caggiani [27], who analysed the performance of the three clustering algorithms, K-means clustering has been proven to be the best clustering algorithm to rebalance bike-sharing usage patterns.
Prediction methods are evolving, and there is now a wide variety of machine learning techniques and applications.
A random forest (RF) has been commonly used to explore the impact of factors on the bike-sharing usage frequency to understand the time-varying flow patterns and the spatial distribution of bike-sharing systems. Studies [15,21,30,34,38,39,40] have been conducted to improve the understanding of bike-sharing usage patterns and obtain insights into dynamic deployment of the bike-sharing system in urban areas.
A gradient boosting tree (GBT) and random forest (RF) were found [41] to provide the best results for the system-level demand using similar features.
A conventional artificial neural network (ANN) is one of the most used artificial intelligence algorithms for modelling time-series data in transportation. However, an ANN is unable to fully capture the characteristics of time-series data [12,13,23], as an ANN does not take into account the temporal dependencies in the model structure. To overcome the limitation associated with ANNs, feed-forward deep neural networks have been proposed, such as the recurrent neural network (RNN). Recurrently connecting hidden layers at different timestamps, an RNN [24,41] accounts for the temporal dependencies and produces good predictive performance on time-series data. Lately, the RNN has evolved [21] with optimal model structures (sequence length, time interval) for better prediction.
Moreover, traditional RNNs have a difficulty in finding the optimal window size in modelling time-series data, as they rely on predetermined time lags to learn temporal sequence processing [42,43].
Recurrent neural networks, namely long short-term memory units (LSTMs), are a type of artificial neural network designed to recognise patterns in sequences of data, such as numerical time-series data from sensors. RNNs and LSTMs differ from other neural networks as they have a temporal dimension. An LSTM NN is used to develop a dynamic demand forecast model in studies [32] for station-free bike-sharing systems. To overcome the limitations associated with RNNs in modelling time-series data with long-term dependencies, an LSTM NN [14,21,24,32,33] has been used to fit the time-series data of station-free bike-sharing.
Related work shows particularly good performance results with RNNs, using LSTM, and gated recurrent unit (GRU) blocks on station demand. A study [21] shows that there is a prevalence of three short-term prediction methods: LSTM, GRU and RF; and of three performance evaluation methods: mean square error (MSE), mean absolute error (MAE) and mean absolute percentage error (MAPE).
4.2. Research Gap Discussion
Our SLR analysis concluded that the main research gap is related to the selection of machine learning techniques that are best fitted and have better performance to solve BSSs at a multilevel scope, aiming at accelerating an evolving process still on-going. Therefore, we realised that more research is required with more case studies and different features to validate and improve future modelling strategies.
Additionally, our analysis has a second research gap: we realised that only a few studies [44] have analysed the implementation of the bike-sharing system in cities, such as Lisbon (the GIRA bike-sharing system), and none, to the best of our knowledge, has yet applied machine learning techniques in classification and prediction problems in the context of this use case. The Civil Engineering Research for Sustainability (CERIS), a research group in Lisbon University—Técnico (https://ceris.pt/), published studies on quantifying carbon emission reduction, time and money saved and health impact regarding the Lisbon bike-sharing system GIRA (that went into operation in 2017) compared to other transport modes. Findings [44] showed that 29% of car trips, 21% of metro trips and 12% walking shifted to the GIRA system in 2018. However, this study does not present any references, neither to the GIRA network expansion nor to multimodal integration. The novelty of GIRA and its expansion process has raised relevant questions, which requires more in-depth analysis. How bike-sharing improves the accessibility of urban mobility in Lisbon and how the expansion of the bicycle-sharing system impacts urban mobility in this city are among those questions.
The two gaps pointed out offer an opportunity for further research to be addressed in future work.
4.3. Study Limitation Discussion
Our SLR method has limitations of not being able to identify the literature outside the parameters given by the researcher. The selected articles do not cover an exhaustive list of publications in the field of machine learning techniques for BSSs. In fact, the analysed literature is an initial map of the research fields, from 2015 to 2019, with general trends and outlines of the main gaps in research, related to the last technological features of a dock-less BSS.
Research from previous years from 2008 onwards can also be of interest, particularly with regards to the scope of the technological evolution of machine learning techniques applied to fourth-generation BSSs, which are characterised by having docking stations.
Future research in this domain may also benefit from gathering data from more repositories than the two—Scopus and Web of Science—selected for the purpose of this work.
Our keyword selection for the publication search took a broader scope of machine learning techniques applied to BSSs. Future research might benefit by looking at specific machine learning techniques, especially prediction models applied to BSSs.
5. Conclusions
The PRISMA methodology outlined the SLR and created an organised view of machine learning techniques applied to BSSs for future information retrieval.
Recent technological developments in station-free BSSs fuelled new research in the last couple of years, with contributions to service improvement in urban mobility.
Our survey showed that in the latest BSS studies, classification and prediction problems are the two issues mostly addressed by machine learning techniques.
Clustering analysis is mainly used to explore BSS spatiotemporal patterns at different city scales. Hierarchical clustering is showed to be the most efficient algorithm to group sites with similar characteristics [33], unlike K-means clustering, which is best suited to rebalance BSS usage patterns [26]. The RF is a robust algorithm to discard outliers and noise and has an advantage of dealing with complex, nonlinear and high-dimensional data. Additionally, it estimates the importance of the input variables of different factors. The literature [37] showed that it has a more sophisticated accuracy rate compared to the multinomial logistic regression method. In a latest study [33], an RF is mainly used to analyse general features of travel distance and time of BSS trips.
Our SLR results suggest that LSTM NNs, a deep learning technique, are the recommended model to be used to identify mobility patterns of the station-free BSS, as well as for dynamic demand forecasting models, able to predict the travel demand of station-free bike-sharing.
Given the identified knowledge gaps, we can raise some recommendations for future work within the overarching theme of machine learning techniques applied to BSSs. Promising areas for further research lie in modelling the spatiotemporal dimension of BSSs in urban mobility, in analysing synergies with other transport modes in multimodal networks [45] and in addressing gaps on urban mobility bridging, with machine learning techniques applied to public transport multimodality and to network expansion strategies.
Author Contributions
Conceptualization, Vitória Albuquerque, Miguel Sales Dias, Fernando Bacao; methodology, Vitória Albuquerque, Miguel Sales Dias, Fernando Bacao; software, Vitória Albuquerque, formal analysis, Vitória Albuquerque, Miguel Sales Dias, Fernando Bacao; literature review and investigation, Vitória Albuquerque; data curation, Vitória Albuquerque; writing—review and editing, Vitória Albuquerque, Miguel Sales Dias, Fernando Bacao; visualization, Vitória Albuquerque; supervision, Miguel Sales Dias, Fernando Bacao; project administration, Vitória Albuquerque, Miguel Sales Dias, Fernando Bacao; funding acquisition, Miguel Sales Dias. All authors have read and agreed to the published version of the manuscript.
Funding
This work was partially funded by national funds through FCT—Fundação para a Ciência e Tecnologia, I.P., under the project FCT UIDB/04466/2020.
Institutional Review Board Statement
Not applicable.
Informed Consent Statement
Not applicable.
Data Availability Statement
Not applicable.
Acknowledgments
We wish to thank Vitor Duarte Santos and Maria Anastasiadou for their help in the PRISMA methodology. The authors would like also to thank the editorial team and the reviewers who provided constructive and helpful comments to improve the quality of the article.
Conflicts of Interest
The authors declare no conflict of interest. The funders had no role in the design of the study; in the collection, analysis, or interpretation of data; in the writing of the manuscript; or in the decision to publish the results.
References
- Inter-Agency and Expert Group on Sustainable Development Goal Indicators, Report of the Inter-Agency and Expert Group on Sustainable Development Goal Indicators (E/CN.3/2016/2/Rev.1), Annex IV. 2016. Available online: https://sustainabledevelopment.un.org/content/documents/11803Official-List-of-Proposed-SDG-Indicators.pdf (accessed on 7 June 2020).
- United Nations. Habitat III New Urban Agenda: Quito Declaration on Sustainable Cities and Human Settlements for All. Habitat III Conference, no. October 2016; p. 24. Available online: http://www.eukn.eu/news/detail/agreed-final-draft-of-the-new-urban-agenda-is-now-available/ (accessed on 7 June 2020).
- OECD. Greening Household Behaviour; OECD: Paris, France, 2011. [Google Scholar]
- Klopp, J.M.; Petretta, D.L. The urban sustainable development goal: Indicators, complexity and the politics of measuring cities. Cities 2017, 63, 92–97. [Google Scholar] [CrossRef]
- Meddin, R.; DeMaio, P.J. The Meddin Bike-Sharing World Map. Google Maps. 2020. Available online: https://bikesharingworldmap.com/#/all/2.3/-1.57/33.92/ (accessed on 3 October 2020).
- Chen, C.; Ma, J.; Susilo, Y.; Liu, Y.; Wang, M. The promises of big data and small data for travel behavior (aka human mobility) analysis. Transp. Res. Part C Emerg. Technol. 2016, 68, 285–299. [Google Scholar] [CrossRef] [PubMed] [Green Version]
- Moher, D.; Liberati, A.; Tetzlaff, J.; Altman, D.G.; The PRISMA Group. Preferred reporting items for systematic reviews and meta-analyses: The PRISMA statement. PLoS Med. 2009, 6, e1000097. [Google Scholar] [CrossRef] [PubMed] [Green Version]
- Pickering, C.; Byrne, J. The benefits of publishing systematic quantitative literature reviews for PhD candidates and other early-career researchers. High. Educ. Res. Dev. 2014, 33, 534–548. [Google Scholar] [CrossRef] [Green Version]
- Petticrew, M.; Roberts, H. Systematic Reviews in the Social Sciences: A Practical Guide; Blackwell Publishing Ltd.: Oxford, UK, 2008. [Google Scholar]
- Roscoe, P.B.; Mead, M.; Mead, M. Supporting Materials. In The Mountain Arapesh; Routledge: Abingdon, UK, 2019; pp. 93–158. [Google Scholar]
- Van Eck, N.J.; Waltman, L. Software survey: VOSviewer, a computer program for bibliometric mapping. Scientometrics 2010, 84, 523–538. [Google Scholar] [CrossRef] [PubMed] [Green Version]
- Chen, L.; Zhang, D.; Wang, L.; Yang, D.; Ma, X.; Li, S.; Wu, Z.; Pan, G.; Nguyen, T.-M.-T.; Jakubowicz, J. Dynamic Cluster-Based over-Demand Prediction in Bike Sharing Systems. In Proceedings of the 2016 ACM International Joint Conference on Pervasive and Ubiquitous Computing, Heidelberg, Germany, 12–16 September 2016; pp. 841–852. [Google Scholar] [CrossRef]
- Liu, J.; Li, Q.; Qu, M.; Chen, W.; Yang, J.; Xiong, H.; Zhong, H.; Fu, Y. Station Site Optimization in Bike Sharing Systems. In Proceedings of the IEEE International Conference on Data Mining, ICDM, Atlantic City, NJ, USA, 14–17 November 2015; pp. 883–888. [Google Scholar] [CrossRef]
- Ai, Y.; Li, Z.; Gan, M.; Zhang, Y.; Yu, D.; Chen, W.; Ju, Y. A deep learning approach on short-term spatiotemporal distribution forecasting of dockless bike-sharing system. Neural Comput. Appl. 2019, 31, 1665–1677. [Google Scholar] [CrossRef]
- Ashqar, H.I.; Elhenawy, M.; Almannaa, M.H.; Ghanem, A.; Rakha, H.A.; House, L. Modeling Bike Availability in A Bike-Sharing System Using Machine Learning. In Proceedings of the 5th IEEE International Conference on Models and Technologies for Intelligent Transportation Systems, MT-ITS 2017, Naples, Italy, 26–28 June 2017; pp. 374–378. [Google Scholar] [CrossRef]
- Yang, Z.; Hu, J.; Shu, Y.; Cheng, P.; Chen, J.; Moscibroda, T. Mobility Modeling and Prediction in Bike-Sharing Systems. In Proceedings of the 14th Annual International Conference on Mobile Systems, Applications, and Services—MobiSys ’16, Singapore, 26–30 June 2016; pp. 165–178. [Google Scholar] [CrossRef]
- Liu, L.; Sun, L.; Chen, Y.; Ma, X. Optimizing fleet size and scheduling of feeder transit services considering the influence of bike-sharing systems. J. Clean. Prod. 2019, 236, 117550. [Google Scholar] [CrossRef]
- Chen, L.; Ma, X.; Nguyen, T.M.T.; Pan, G.; Jakubowicz, J. Understanding bike trip patterns leveraging bike sharing system open data. Front. Comput. Sci. 2017, 11, 38–48. [Google Scholar] [CrossRef] [Green Version]
- Duan, Y.; Wu, J. Optimizing Rebalance Scheme for Dock-Less Bike Sharing Systems with Adaptive User Incentive. In Proceedings of the IEEE International Conference on Mobile Data Management, Hong Kong, China, 10–13 June 2019; pp. 176–181. [Google Scholar] [CrossRef]
- Jiang, J.; Lin, F.; Fan, J.; Lv, H.; Wu, J. A Destination Prediction Network Based on Spatiotemporal Data for Bike-Sharing. Complexity 2019, 2019. [Google Scholar] [CrossRef]
- Wang, B.; Kim, I. Short-Term Prediction for Bike-Sharing Service Using Machine Learning. Transp. Res. Procedia 2018, 34, 171–178. [Google Scholar] [CrossRef]
- Chen, P.-C.; Hsieh, H.-Y.; Sigalingging, X.K.; Chen, Y.-R.; Leu, J.-S. Prediction of Station Level Demand in a Bike Sharing System Using Recurrent Neural Networks. In Proceedings of the 2017 IEEE 85th Vehicular Technology Conference (VTC Spring), Sydney, Australia, 4–7 June 2017; pp. 1–5. [Google Scholar] [CrossRef]
- Zhou, Y.; Huang, Y. Context Aware Flow Prediction of Bike Sharing Systems. In Proceedings of the 2018 IEEE International Conference on Big Data, Big Data 2018, Seattle, WA, USA, 10–13 December 2018; pp. 2393–2402. [Google Scholar] [CrossRef]
- Pan, Y.; Zheng, R.C.; Zhang, J.; Yao, X. Predicting bike sharing demand using recurrent neural networks. Procedia Comput. Sci. 2019, 147, 562–566. [Google Scholar] [CrossRef]
- Liu, X.; Gherbi, A.; Li, W.; Cheriet, M. Multi features and multi-time steps LSTM based methodology for bike sharing availability prediction. Procedia Comput. Sci. 2019, 155, 394–401. [Google Scholar] [CrossRef]
- Zhou, X. Understanding Spatiotemporal Patterns of Biking Behavior by Analyzing Massive Bike Sharing Data in Chicago. PLoS ONE 2015, 10, e0137922. [Google Scholar] [CrossRef] [PubMed]
- Caggiani, L.; Camporeale, R.; Ottomanelli, M.; Szeto, W.Y. A modeling framework for the dynamic management of free-floating bike-sharing systems. Transp. Res. Part C Emerg. Technol. 2018, 87, 159–182. [Google Scholar] [CrossRef]
- Ghosh, S.; Varakantham, P.; Adulyasak, Y.; Jaillet, P. Dynamic repositioning to reduce lost demand in bike sharing systems. J. Artif. Intell. Res. 2017, 58, 387–430. [Google Scholar] [CrossRef]
- Sarkar, A.; Lathia, N.; Mascolo, C. Comparing cities’ cycling patterns using online shared bicycle maps. Transportation 2015, 42, 541–559. [Google Scholar] [CrossRef]
- Yang, Z.; Chen, J.; Hu, J.; Shu, Y.; Cheng, P. Mobility Modeling and Data-Driven Closed-Loop Prediction in Bike-Sharing Systems. IEEE Trans. Intell. Transp. Syst. 2019, 20, 4488–4499. [Google Scholar] [CrossRef]
- Lin, L.; He, Z.; Peeta, S. Predicting station-level hourly demand in a large-scale bike-sharing network: A graph convolutional neural network approach. Transp. Res. Part C Emerg. Technol. 2018, 97, 258–276. [Google Scholar] [CrossRef] [Green Version]
- Xu, C.; Ji, J.; Liu, P. The station-free sharing bike demand forecasting with a deep learning approach and large-scale datasets. Transp. Res. Part C Emerg. Technol. 2018, 95, 47–60. [Google Scholar] [CrossRef]
- Zhang, C.; Zhang, L.; Liu, Y.; Yang, X. Short-term Prediction of Bike-sharing Usage Considering Public Transport: A LSTM Approach. In Proceedings of the IEEE Conference on Intelligent Transportation Systems, Maui, HI, USA, 4–7 November 2018; pp. 1564–1571. [Google Scholar] [CrossRef]
- Du, Y.; Deng, F.; Liao, F. A model framework for discovering the spatio-temporal usage patterns of public free-floating bike-sharing system. Transp. Res. Part C Emerg. Technol. 2019, 103, 39–55. [Google Scholar] [CrossRef]
- Zhao, Y.; Dai, L.; Peng, L.; Song, Y.; Zhou, Z. Analysis of Spatial Distribution of China’s Station-Free Bike-Sharing by Clustering Algorithms. In Proceedings of the ACM International Conference Proceeding Series, Nice, France, 21–25 October 2019; pp. 15–19. [Google Scholar] [CrossRef]
- Li, D.; Zhao, Y.; Li, Y. Time-Series Representation and Clustering Approaches for Sharing Bike Usage Mining. IEEE Access 2019, 7, 177856–177863. [Google Scholar] [CrossRef]
- Guo, Y.; Shen, X.; Ge, Q.; Wang, L. Station Function Discovery: Exploring Trip Records in Urban Public Bike-Sharing System. IEEE Access 2018, 6, 71060–71068. [Google Scholar] [CrossRef]
- Feng, Y.; Wang, S. A Forecast for Bicycle Rental Demand Based on Random Forests and Multiple Linear Regression. In Proceedings of the16th IEEE/ACIS International Conference on Computer and Information Science, ICIS 2017, Wuhan, China, 24–26 May 2017; pp. 101–105. [Google Scholar] [CrossRef]
- Bacciu, D.; Carta, A.; Gnesi, S.; Semini, L. An experience in using machine learning for short-term predictions in smart transportation systems. J. Log. Algebr. Methods Program. 2017, 87, 52–66. [Google Scholar] [CrossRef]
- Ashqar, H.I.; Elhenawy, M.; Rakha, H.A. Modeling bike counts in a bike-sharing system considering the effect of weather conditions. Case Stud. Transp. Policy 2019, 7, 261–268. [Google Scholar] [CrossRef]
- Wu, X.; Lyu, C.; Wang, Z.; Liu, Z. Station-Level Hourly Bike Demand Prediction for Dynamic Repositioning in Bike Sharing Systems. Smart Innov. Syst. Technol. 2019, 149, 19–27. [Google Scholar] [CrossRef]
- Ma, X.; Yu, H.; Wang, Y.; Wang, Y. Large-Scale Transportation Network Congestion Evolution Prediction Using Deep Learning Theory. PLoS ONE 2015, 10, e0119044. [Google Scholar] [CrossRef]
- Zhao, Z.; Chen, W.; Wu, X.; Chen, P.C.V.; Liu, J. LSTM network: A deep learning approach for short-term traffic forecast. IET Image Process. 2017, 11, 68–75. [Google Scholar] [CrossRef] [Green Version]
- Félix, R.; Cambra, P.; Moura, F. Build it and give ‘em bikes, and they will come: The effects of cycling infrastructure and bike-sharing system in Lisbon. Case Stud. Transp. Policy 2020, 8, 672–682. [Google Scholar] [CrossRef]
- Liao, F. Modeling duration choice in space-time multi-state supernetworks for individual activity-travel scheduling. Transp. Res. Part C Emerg. Technol. 2016, 69, 16–35. [Google Scholar] [CrossRef]
Figure 1.
Process workflow.

Figure 2.
Search Query.

Figure 3.
PRISMA flow diagram (n = retained; e = excluded).

Figure 4.
Keyword occurrence network visualisation.

Figure 5.
Keyword occurrence by year overlay visualisation.

Figure 6.
Keyword occurrence network visualisation (4 interconnected clusters).

Figure 7.
Author co-authorship analysis network visualisation.

Figure 8.
Author co-authorship analysis by year overlay visualisation.

Figure 9.
Title and abstract text occurrence network visualisation.

Figure 10.
Title and abstract text occurrence by year overlay visualisation.


Table 1.
Main journals.
| Journals | No. | Quartile Rank | Publisher Country | Field | Publisher |
|---|---|---|---|---|---|
| Transportation Research Part C: Emerging Technologies | 5 | Q1 | United Kingdom | Transportation Computer science Engineering | Elsevier Ltd. |
| IEEE Access | 2 | Q1 | United States of America | Computer science Engineering | Institute of Electrical and Electronic Engineers Inc |
| Journal of Transport Geography | 1 | Q1 | United Kingdom | Transportation Environmental science | Elsevier Ltd. |
| Transportation | 1 | Q1 | The Netherlands | Transportation Engineering | Kluwer Academic Publishers |
| Journal of Artificial Intelligence Research | 1 | Q1 | United States America | Computer science | Morgan Kaufmann Publishers, Inc. |
| Neural Computing and Applications | 1 | Q2 | Germany | Computer science | Springer Verlag |
| Computing | 1 | Q2 | Germany | Computer science Mathematics | Springer Verlag |
| Journal of Logical and Algebraic Methods in Programming | 1 | Q1 | The Netherlands | Computer science Mathematics | Elsevier BV |
| Journal of Urbanism | 1 | Q1 | United Kingdom | Environmental science | Taylor and Francis Inc. |
| PLoS ONE | 1 | Q1 | United States America | Computer science | Public Library of Science |
| Frontiers of Computer Science | 1 | Q2 | Germany | Computer science Mathematics | Springer Verlag |
| Case Studies on Transport Policy | 1 | Q2 | The Netherlands | Transportation | Elsevier BV |
| Complexity | 1 | Q1 | Egypt | Multidisciplinary | Hindawi Limited |
| Smart Innovation, Systems and Technologies | 1 | Q2 | Germany | Computer science Multidisciplinary | Springer Verlag |
| Journal of Cleaner Production | 1 | Q1 | The Netherlands | Engineering | Elsevier BV |
| Applied Intelligence | 1 | Q2 | The Netherlands | Computer science | Kluwer Academic Publishers |
Table 2.
Main conference proceedings.
| Conference Proceedings | No. | Publisher Country | Field |
|---|---|---|---|
| Procedia Computer Science | 2 | The Netherlands | Computer science |
| Transportation Research Procedia | 1 | The Netherlands | Transportation |
| ACM International Conference Proceeding Series (ICPS) | 1 | United States of America | Computer science |
| ACM International Joint Conference on Pervasive and Ubiquitous Computing (Proceedings of the 2016) | 1 | United States of America | Engineering |
| 5th IEEE International Conference on Models and Technologies for Intelligent Transportation Systems (MT-ITS) | 1 | United States of America | Engineering |
| IEEE Vehicular Technology Conference (2017) | 1 | United States of America | Computer science Engineering |
| IEEE Conference on Intelligent Transportation Systems, Proceedings (ITSC 2018) | 1 | United States of America | Computer science Engineering |
| IEEE International Conference on Big Data, Big Data (2018 Proceedings) | 1 | United States of America | Computer science Mathematics |
| IEEE International Conference on Mobile Data Management (2019 Proceedings) | 1 | United States of America | Computer science |
| 2017 IEEE/ACIS 16th International Conference on Computer and Information Science (ICIS) | 1 | United States of America | Computer science Engineering |
| IEEE International Conference on Data Mining | 1 | United States of America | Engineering |
| Annual International Conference on Mobile Systems, Applications, and Services (14th Proceedings) | 1 | United States of America | Computer science Engineering |
| SIAM International Conference on Data Mining (SDM 2018) | 1 | United States of America | Computer science |
Table 3.
Keyword occurrences ranked by link strength.
| Keyword | Occurrences | Link Strength |
|---|---|---|
| big data | 2 | 10 |
| bike-sharing | 2 | 10 |
| deep learning | 2 | 9 |
| long short-term memory networks | 1 | 6 |
| sharing mobility | 1 | 6 |
| station-free bike-sharing | 1 | 6 |
| travel demand forecasting | 1 | 6 |
| bike-sharing systems | 2 | 5 |
| cycling | 1 | 5 |
| data mining | 1 | 5 |
| demand analysis | 1 | 5 |
| smart-card data | 1 | 5 |
| trip chaining | 1 | 5 |
| bike counts prediction | 1 | 4 |
| bike-sharing systems | 1 | 4 |
| bike-sharing | 1 | 4 |
| flow prediction | 1 | 4 |
| machine learning | 1 | 4 |
| mobility modelling | 1 | 4 |
| random forest | 1 | 4 |
| rebalancing | 1 | 4 |
| sharing economy | 1 | 4 |
| taxi | 1 | 4 |
| travel mode choice | 1 | 4 |
| urban computing | 1 | 4 |
| clustering algorithm | 1 | 3 |
| convolutional long short-term memory network | 1 | 3 |
| dock less bike-sharing system | 1 | 3 |
| long short-term memory | 1 | 3 |
| recurrent neural networks | 1 | 3 |
| shared bike demand prediction | 1 | 3 |
| short-term spatiotemporal distribution forecasting | 1 | 3 |
| spatial distribution | 1 | 3 |
| station-free bike-sharing system | 1 | 3 |
| time-series forecasting | 1 | 3 |
Table 4.
Author co-authorship ranked by link strength.
| Author | Documents | Link Strength |
|---|---|---|
| Chen, Longbiao | 1 | 9 |
| Jakubowicz, Jérémie | 1 | 9 |
| Li, Shijian | 1 | 9 |
| Ma, Xiaojuan | 1 | 9 |
| Nguyen, Thi Mai Trang | 1 | 9 |
| Pang, Gang | 1 | 9 |
| Wang, Leye | 1 | 9 |
| Wu, Zhaohui | 1 | 9 |
| Yang, Dingqi | 1 | 9 |
| Zhang, Daqing | 1 | 9 |
| Chen, Weiwei | 1 | 7 |
| Fu, Yanjie | 1 | 7 |
| Li, Qiao | 1 | 7 |
| Liu, Junming | 1 | 7 |
| Qu, Meng | 1 | 7 |
| Xiong, Hui | 1 | 7 |
| Yang, Jingyuan | 1 | 7 |
| Zhong, Hao | 1 | 7 |
| Ai, Yi | 1 | 6 |
| Chen, Wei | 1 | 6 |
| Gan, Mi | 1 | 6 |
| Ju, Yanni | 1 | 6 |
| Li, Zongping | 1 | 6 |
| Yu, Daben | 1 | 6 |
| Zhang, Yunpeng | 1 | 6 |
| Elhenawy, M. | 1 | 3 |
| Ghanem, A. | 1 | 3 |
| House, L. | 1 | 3 |
| Hu, Ji | 1 | 3 |
| Moscibroda, Thomas | 1 | 3 |
| Rakha, H. A. | 1 | 3 |
| Shu, Yuanchao | 1 | 3 |
| Yang, Zidong | 1 | 3 |
| Ma, X. | 2 | 0 |
| Wu, J. | 2 | 0 |
Table 5.
Title and abstract text occurrences ranked by relevance.
| Term | Occurrences | Relevance |
|---|---|---|
| gcnn model | 2 | 2.08 |
| gcnnrec ddgf | 2 | 2.08 |
| gcnnreg ddgf | 2 | 2.08 |
| gcnnreg ddgf model | 2 | 2.08 |
| lstm nns | 4 | 1.77 |
| sharing bike | 4 | 1.71 |
| deep learning approach | 4 | 1.17 |
| recurrent neural network | 3 | 1.11 |
| gru | 2 | 1.07 |
| clustering algorithm | 4 | 0.86 |
| conv lstm | 2 | 0.83 |
| prediction model | 6 | 0.60 |
| random forest | 8 | 0.49 |
Table 6.
Publications ranked by number of citations.
| No. | Author(s) | Year | Article Title | Publication (Journal/Conference Proceeding) | No. of Citations |
|---|---|---|---|---|---|
| 1 | Yang, Z., Hu, J., Shu, Y., (...), Chen, J., Moscibroda, T. | 2016 | Mobility Modeling and Prediction in Bike-Sharing Systems | Annual International Conference on Mobile Systems, Applications, and Services (14th Proceedings) | 60 |
| 2 | Chen, L., Zhang, D., Wang, L., (...), Nguyen, T.-M.-T., Jakubowicz, J. | 2016 | Dynamic Cluster-Based Over-Demand Prediction in Bike Sharing Systems | ACM International Joint Conference on Pervasive and Ubiquitous Computing (2016 Proceedings) | 57 |
| 3 | Zhou, X. | 2015 | Understanding Spatiotemporal Patterns of Biking Behavior by Analyzing Massive Bike Sharing Data in Chicago | PloS ONE | 54 |
| 4 | Caggiani, L., Camporeale, R., Ottomanelli, M., Szeto, W.Y. | 2018 | A Modeling Framework for the Dynamic Management of Free-Floating Bike-Sharing Systems | Transportation Research Part C: Emerging Technologies | 53 |
| 5 | Ghosh, S., Varakantham, P., Adulyasak, Y., Jaillet, P. | 2017 | Dynamic Repositioning to Reduce Lost Demand in Bike Sharing Systems | Journal of Artificial Intelligence Research | 43 |
| 6 | Lin, L., He, Z., Peeta, S. | 2018 | Predicting Station-Level Hourly Demand in a large-scale Bike-Sharing Network: A Graph Convolutional Neural Network Approach | Transportation Research Part C: Emerging Technologies | 36 |
| 7 | Liu, J., Li, Q., Qu, M., (...), Zhong, H., Fu, Y. | 2016 | Station Site Optimization in Bike Sharing Systems | IEEE International Conference on Data Mining (2015 Proceedings) | 35 |
| 8 | Xu, C., Ji, J., Liu, P. | 2018 | The Station-Free Sharing Bike Demand Forecasting with a Deep Learning Approach and Large-Scale Datasets | Transportation Research Part C: Emerging Technologies | 23 |
| 9 | Bordagaray M., dell’Olio L., Fonzone A., Ibeas Á. | 2016 | Capturing the Conditions That Introduce Systematic Variation in Bike-Sharing Travel Behavior Using Data Mining Techniques | Transportation Research Part C: Emerging Technologies | 23 |
| 10 | Sarkar, A., Lathia, N., Mascolo, C. | 2015 | Comparing Cities’ Cycling Patterns Using Online Shared Bicycle Maps | Transportation | 22 |
| 11 | Ai, Y., Li, Z., Gan, M., (...), Chen, W., Ju, Y. | 2019 | A Deep Learning Approach on Short-Term Spatiotemporal Distribution Forecasting of Dockless Bike-Sharing System | Neural Computing and Applications | 15 |
| 12 | Cagliero, L., Cerquitelli, T., Chiusano, S., Garza, P., Xiao, X. | 2017 | Predicting Critical Conditions in Bicycle Sharing Systems | Computing | 13 |
| 13 | Du, Y., Deng, F., Liao, F. | 2019 | A Model Framework for Discovering the Spatio-Temporal Usage Patterns of Public Free-Floating Bike-Sharing System | Transportation Research Part C: Emerging Technologies | 12 |
| 14 | Ashqar, H.I., Elhenawy, M., Almannaa, M.H., (...), Rakha, H.A., House, L. | 2017 | Modeling Bike Availability in a Bike-Sharing System Using Machine Learning | IEEE International Conference on Models and Technologies for Intelligent Transportation Systems (5th Proceedings) | 12 |
| 15 | Feng, Y., Wang, S. | 2017 | A Forecast for Bicycle Rental Demand Based on Random Forests and Multiple Linear Regression | IEEE/ACIS International Conference on Computer and Information Science (16th Proceedings) | 10 |
| 16 | Bacciu, D., Carta, A., Gnesi, S., Semini, L. | 2017 | An Experience in Using Machine Learning for Short-Term Predictions in Smart Transportation Systems | Journal of Logical and Algebraic Methods in Programming | 6 |
| 17 | Wang, B., Kim, I. | 2018 | Short- Term Prediction for Bike-Sharing Service Using Machine Learning | Transportation Research Procedia | 5 |
| 18 | Chen, P.-C., Hsieh, H.-Y., Sigalingging, X.K., Chen, Y.-R., Leu, J.-S. | 2017 | Prediction of Station Level Demand in a Bike Sharing System Using Recurrent Neural Networks | IEEE Vehicular Technology Conference, 2016 | 5 |
| 19 | Chen, L., Ma, X., Nguyen, T.-M.-T., Pan, G., Jakubowicz, J. | 2017 | Understanding Bike Trip Patterns Leveraging Bike Sharing System Open Data | Frontiers of Computer Science | 5 |
| 20 | Ashqar, H.I., Elhenawy, M., Rakha, H.A. | 2019 | Modeling Bike Counts in a Bike-Sharing System Considering the Effect of Weather Conditions | Case Studies on Transport Policy | 4 |
| 21 | Zhou, Y., Huang, Y. | 2019 | Context Aware Flow Prediction of Bike Sharing Systems | IEEE International Conference on Big Data, Big Data (2018 Proceedings) | 3 |
| 22 | Jiang, J., Lin, F., Fan, J., Lv, H., Wu, J. | 2019 | A Destination Prediction Network Based on Spatiotemporal Data for Bike-Sharing | Complexity | 3 |
| 23 | Pan, Y., Zheng, R.C., Zhang, J., Yao, X. | 2019 | Predicting Bike Sharing Demand Using Recurrent Neural Networks | Procedia Computer Science | 3 |
| 24 | Wu, X., Lyu, C., Wang, Z., Liu, Z. | 2019 | Station-Level Hourly Bike Demand Prediction for Dynamic Repositioning in Bike Sharing Systems | Smart Innovation, Systems and Technologies | 2 |
| 25 | Duan, Y., Wu, J. | 2019 | Optimizing Rebalance Scheme for Dock-less Bike Sharing Systems with Adaptive User Incentive | IEEE International Conference on Mobile Data Management (2019 Proceedings) | 2 |
| 26 | Zhang, C., Zhang, L., Liu, Y., Yang, X. | 2018 | Short-Term Prediction of Bike-Sharing Usage Considering Public Transport: A LSTM Approach | IEEE Conference on Intelligent Transportation Systems, Proceedings (ITSC 2018) | 2 |
| 27 | Liu, L., Sun, L., Chen, Y., Ma, X. | 2019 | Optimizing Fleet Size and Scheduling of Feeder Transit Services Considering the Influence of Bike-Sharing Systems | Journal of Cleaner Production | 1 |
| 28 | Zhou, X., Wang, M., Li, D. | 2019 | Bike-Sharing or Taxi? Modeling the Choices of Travel Mode in Chicago Using Machine Learning | Journal of Transport Geography | 1 |
| 29 | Xu, H., Duan, F., Pu, P. | 2019 | Dynamic Bicycle Scheduling Problem Based on Short-Term Demand Prediction | Applied Intelligence | 1 |
| 30 | Zhao, Y., Dai, L., Peng, L., Song, Y., Zhou, Z. | 2019 | Analysis of Spatial Distribution of China’s Station-Free Bike-Sharing by Clustering Algorithms | ACM International Conference Proceeding Series | 1 |
| 31 | Li, D., Zhao, Y., Li, Y. | 2019 | Time-Series Representation and Clustering Approaches for Sharing Bike Usage Mining | IEEE Access | 1 |
| 32 | Liu, X., Gherbi, A., Li, W., Cheriet, M. | 2019 | Multi Features and Multi-Time Steps LSTM Based Methodology for Bike Sharing Availability Prediction | Procedia Computer Science | 1 |
| 33 | Guo, Y., Shen, X., Ge, Q., Wang, L. | 2018 | Station Function Discovery: Exploring Trip Records in Urban Public Bike-Sharing System | IEEE Access | 1 |
| 34 | Liu, K., Wang, P., Zhang, J., Fu, Y., Das, S.K. | 2018 | Modelling the Interaction Coupling of Multi-View Spatiotemporal Contexts for Destination Prediction | SIAM International Conference on Data Mining (SDM 2018) | 1 |
| 35 | Zhou, M., Ding, J., Fang, H. | 2018 | Performance Modelling and Analysis of a Station-Free Bike Sharing System | International Conference on Intelligent Autonomous Systems (ICoIAS 2018) | 1 |
Table 7.
Application and method analysis.
| No. | Author(s) | Application | Methods |
|---|---|---|---|
| 1 | Yang, Z., Hu, J., Shu, Y., (...), Chen, J., Moscibroda, T. | Build a spatiotemporal dynamic network to evaluate and predict station and city bike demand. | Random forest |
| 2 | Chen, L., Zhang, D., Wang, L., (...), Nguyen, T.-M.-T., Jakubowicz, J. | Weight a correlation network to model the relationship among bike stations and dynamically group neighbouring stations with similar bike usage patterns into clusters. Use Monte Carlo simulation to predict the over-demand probability of each cluster. | Weighted correlation network and Monte Carlo simulation (WCN-MC), auto-regressive integrated moving average (ARIMA), Bayesian Monte Carlo (B-MC), artificial neural network (ANN), Static clustering Monte Carlo (SC-MC), common contextual factor-based clustering Monte Carlo (CCF-MC) |
| 3 | Zhou, X. | Detect and visualise spatiotemporal bike flow clusters. Analyse station over-demand patterns across the city using hierarchical clustering to understand spatial distribution of stations with different temporal use signatures, biking behaviour and mobility patterns. | Community detection clustering, hierarchical clustering |
| 4 | Caggiani, L., Camporeale, R., Ottomanelli, M., Szeto, W.Y. | Spatiotemporal clustering, first grouping the data simultaneously by creating a cluster tree and second minimising the average squared distance between points in the same cluster. Forecast the trend of available bikes in each spatiotemporal cluster to understand how many bikes have to be repositioned to improve user satisfaction and system attraction. | Hierarchical clustering, K-means, nonlinear autoregressive neural network prediction |
| 5 | Ghosh, S., Varakantham, P., Adulyasak, Y., Jaillet, P. | Dynamic repositioning of bikes in conjunction with the routing solution and a scalable solution for the real-world large-scale bike-sharing systems. | Lagrange dual decomposition (LDD) |
| 6 | Lin, L., He, Z., Peeta, S. | Six types of GCNN models and seven benchmark models built and compared on a Citi Bike dataset from New York City to make spatiotemporal correlations patterns between stations and to predict station-level hourly demand in a large-scale bike-sharing network. | Graph convolutional neural network with data-driven graph filter (GCNN-DDGF) |
| 7 | Liu, J., Li, Q., Qu, M., (...), Zhong, H., Fu, Y. | Bike-sharing network optimisation approach of station site allocation in terms of the bike usage as well as the required rebalancing efforts by considering multiple influential factors: environment and complex public transportation networks. | Artificial neural network (ANN) |
| 8 | Xu, C., Ji, J., Liu, P. | Predict the bike-sharing trip gap, production and attraction: mobility pattern of the station-free bike-sharing at a citywide scale and development of dynamic demand forecasting models to predict the travel demand of station-free bike-sharing using the deep learning approach. | Long short-term memory neural networks (LSTM NNs) |
| 9 | Bordagaray M., dell’Olio L., Fonzone A., Ibeas Á. | Algorithm to classify trips of bike-sharing system (BSS) users in well-defined usage types by mining smart-card transactions, and spatiotemporal distribution and travel behaviour within public systems. | Rule-based classification, logistic regression (binary regression) |
| 10 | Sarkar, A., Lathia, N., Mascolo, C. | Model granular behavioural patterns on spatiotemporal variations and bike station redistribution. | Hierarchical clustering |
| 11 | Ai, Y., Li, Z., Gan, M., (...), Chen, W., Ju, Y. | A deep learning approach to address the spatiotemporal dependences, including the number of bicycles in the area, distribution uniformity, usage distribution and time of day. | Convolutional long short-term memory network (conv-LSTM) |
| 12 | Cagliero, L., Cerquitelli, T., Chiusano, S., Garza, P., Xiao, X. | Station performance occupancy-level prediction. | Bayesian classifier, L3 classifiers |
| 13 | Du, Y., Deng, F., Liao, F. | Model framework to explore the spatiotemporal usage patterns of free-floating shared bikes using the usage data to explore the impact of factors on the frequency in different districts. | Random forest, hierarchical clustering |
| 14 | Ashqar, H.I., Elhenawy, M., Almannaa, M.H., (...), Rakha, H.A., House, L. | Univariate and multivariate models for availability prediction of shared bikes at the station. | Random forest, least-squares boosting and partial least-squares regression (PLSR) |
| 15 | Feng, Y., Wang, S. | Multiple regression analysis has a great improvement when a random forest model is used to predict the demand for bicycle rental. | Multiple linear regression, random forest |
| 16 | Bacciu, D., Carta, A., Gnesi, S., Semini, L. | Compare machine learning techniques to predict and infer whether there is in use a bike that could be, with high probability, returned at the station where the user is waiting. | Gausian support vector machine (SVM) classifier, time series, random forest |
| 17 | Wang, B., Kim, I. | Short-term forecast for docking station usage with two RNN techniques and random forest (RF) to compare performance. | Recurrent neural networks (RNNs) (long short-term memory network (LSTM) and gated recurrent unit (GRU)), random forest |
| 18 | Chen, P.-C., Hsieh, H.-Y., Sigalingging, X.K., Chen, Y.-R., Leu, J.-S. | Predict both rental and return demand for every station at once, which is efficient for online balancing strategies. | Recurrent neural network (RNN) |
| 19 | Chen, L., Ma, X., Nguyen, T.-M.-T., Pan, G., Jakubowicz, J. | Approach to infer the spatiotemporal bike trip patterns from the public station feeds. | Sparse regularisation, weighted regularisation |
| 20 | Ashqar, H.I., Elhenawy, M., Rakha, H.A. | Quantify the effect of several variables (month of the year, day of the week, time of the day and various weather conditions) on the mean of bike counts for the Bay Area BSS network. Prediction model for the bike counts at each station over time as it is one of the key tasks in making the rebalancing operation more efficient. | Poisson regression model (PRM), negative binomial regression model (NBRM), random forest, Bayesian information criterion (BIC) |
| 21 | Zhou, Y., Huang, Y. | Context-aware framework to predict bike flows for both existing stations and new stations that incorporates spatiotemporal, network and environmental contexts in a synergistic manner. | Fuzzy logic (FL)-based adaptive neuro-fuzzy inference system for enhancing traveling comfort (FLC), auto-regression moving average (ARMA), artificial neural network (ANN), bipartite clustering |
| 22 | Jiang, J., Lin, F., Fan, J., Lv, H., Wu, J. | Prediction network based on spatiotemporal data. | Long short-term memory network (LSTM), convolutional neural network (CNN), candidate generation model (CGM), naïve Bayesian |
| 23 | Pan, Y., Zheng, R.C., Zhang, J., Yao, X. | Prediction of bike-renting in different areas of a city during a future period based on historical, weather and time data. | Community detection clustering, recurrent neural network (RNN), long short-term memory network (LSTM) |
| 24 | Wu, X., Lyu, C., Wang, Z., Liu, Z. | Prediction accuracy of the hourly bike number change at the station level. | Random forest (RF), gradient boosting regression tree (GBRT) and neural network (NN) |
| 25 | Duan, Y., Wu, J. | Rebalancing the dock-less bike-sharing systems. | Markov decision process (MDP), deep reinforcement learning (DRL) |
| 26 | Zhang, C., Zhang, L., Liu, Y., Yang, X. | Prediction approach to historical usage and real-time passengers of public transport and neural networks to establish the connection among them. | Long short-term memory (LSTM) |
| 27 | Liu, L., Sun, L., Chen, Y., Ma, X. | Optimisation of fleet size and schedules of feeder buses that connect metro and residential areas in the context of bike-sharing systems. | Non- dominated sorting genetic algorithm -II (NSGA-II), customised multi-objective optimisation algorithm based on particle swarm optimisation (MPSO) |
| 28 | Zhou, X., Wang, M., Li, D. | Spatiotemporal model for travel choices between two transport alternatives. | Logistic regression, regularised linear models with stochastic gradient descent (SGD) learning, nonlinear algorithms, K-nearest neighbours (K-NN), support vector machine (SVM), Gaussian naïve Bayes, decision tree (DT), neural network, random forest (RF) |
| 29 | Xu, H., Duan, F., Pu, P. | Dynamic bicycle scheduling (DBS) model based on short-term demand prediction. | K-means, random forest (RF), enhanced genetic algorithm (E-GA) |
| 30 | Zhao, Y., Dai, L., Peng, L., Song, Y., Zhou, Z. | Model characteristics of the spatial distribution of shared traffic resources through the relationship between the density of bicycle distribution and the geographical location. | K-means (KM), ant colony (ACO), fuzzy C-means (FCM), mean shift (MS) |
| 31 | Li, D., Zhao, Y., Li, Y. | Dimension reduction in count series data to enhance performance with clustering, classification and prediction. | Time series, hierarchical clustering, K-Means (KM), K-medoids, K-shape |
| 32 | Liu, X., Gherbi, A., Li, W., Cheriet, M. | Rebalance bikes efficiently among different bike-sharing dockers. | Long short-term memory (LSTM), recurrent neural network (RNN), deep neural network (DNN) |
| 33 | Guo, Y., Shen, X., Ge, Q., Wang, L. | Station function method validated by the analysis of spatiotemporal characteristics on traffic patterns for station clusters and evaluated by the comparison of clustering results with the data of point of interests and station names. | K-means (KM), latent dirichlet allocation (LDA) |
| 34 | Liu, K., Wang, P., Zhang, J., Fu, Y., Das, S.K. | Multi-view model that can learn the relationship of the spatial and temporal views and substantially enhance the predictive performances. | Multiple additive regression trees (MART), RankBoost (RB), LambdaMART (LM), ListNet (LN), RankNet (RN) |
| 35 | Zhou, M., Ding, J., Fang, H. | Performance analysis for station-free bike-sharing systems to evaluate the travel time, capacity planning and utilisation. | Monte Carlo (MC), continuous time Markov chain (CTMC), performance evaluation process algebra (PEPA) |
Publisher’s Note: MDPI stays neutral with regard to jurisdictional claims in published maps and institutional affiliations. |
© 2021 by the authors. Licensee MDPI, Basel, Switzerland. This article is an open access article distributed under the terms and conditions of the Creative Commons Attribution (CC BY) license (http://creativecommons.org/licenses/by/4.0/).
Share and Cite
MDPI and ACS Style
Albuquerque, V.; Sales Dias, M.; Bacao, F. Machine Learning Approaches to Bike-Sharing Systems: A Systematic Literature Review. ISPRS Int. J. Geo-Inf. 2021, 10, 62. https://0-doi-org.brum.beds.ac.uk/10.3390/ijgi10020062
AMA Style
Albuquerque V, Sales Dias M, Bacao F. Machine Learning Approaches to Bike-Sharing Systems: A Systematic Literature Review. ISPRS International Journal of Geo-Information. 2021; 10(2):62. https://0-doi-org.brum.beds.ac.uk/10.3390/ijgi10020062
Chicago/Turabian StyleAlbuquerque, Vitória, Miguel Sales Dias, and Fernando Bacao. 2021. "Machine Learning Approaches to Bike-Sharing Systems: A Systematic Literature Review" ISPRS International Journal of Geo-Information 10, no. 2: 62. https://0-doi-org.brum.beds.ac.uk/10.3390/ijgi10020062
Note that from the first issue of 2016, this journal uses article numbers instead of page numbers. See further details here.