
Mixed Reality Flood Visualizations: Reflections on Development and Usability of Current Systems


Department of Geography, Simon Fraser University, Burnaby, BC V5A 1S6, Canada
*
Author to whom correspondence should be addressed.
ISPRS Int. J. Geo-Inf. 2021, 10(2), 82; https://0-doi-org.brum.beds.ac.uk/10.3390/ijgi10020082
Submission received: 16 January 2021
/
Revised: 15 February 2021
/
Accepted: 16 February 2021
/
Published: 18 February 2021
Abstract
:Interest in and use of 3D visualizations for analysis and communication of flooding risks has been increasing. At the same time, an ecosystem of 3D user interfaces has also been emerging. Together, they offer exciting potential opportunities for flood visualization. In order to understand how we turn potential into real value, we need to develop better understandings of technical workflows, capabilities of the resulting systems, their usability, and implications for practice. Starting with existing geospatial datasets, we develop single user and collaborative visualization prototypes that leverage capabilities of the state-of-the art HoloLens 2 mixed reality system. By using the 3D displays, positional tracking, spatial mapping, and hand- and eye-tracking, we seek to unpack the capabilities of these tools for meaningful spatial data practice. We reflect on the user experience, hardware performance, and usability of these tools and discuss the implications of these technologies for flood risk management, and broader spatial planning practice.
1. Introduction
With changing climate and growing sea levels, coastal and riverine flooding is a growing concern across the world. With projected increases in the magnitude and frequency of flooding, understanding the risks and developing policies to address them is an integral part of urban planning. Visualizations play a crucial role in understanding and disseminating information from flood simulations and scenario modeling for planners, as well as negotiating adaptation pathways among exposed stakeholders [1,2,3]. Given the institutional nature of flood risk management (FRM), most developed visualizations attempt to fit into the existing planning/risk management infrastructure. This integration makes the flood visualization domain particularly interesting, as the developed tools can be analyzed within the applied context of spatial analysis of risk and its communication to stakeholders.
Over the last decade, 3D visualizations of flood impacts have been increasingly prominent in scholarly literature [1,4,5]. These are mostly produced for risk communication purposes, often with an assumption that perspective 3D views of the landscape are easier to interpret for non-experts [6]. Although many developed tools are compelling, we still lack empirical studies to turn novelty and claims of improved understanding of data into demonstrable value for users. This trend has certainly been influenced by increased generation and use of 3D data (e.g., LiDAR, structure-from-motion (SfM), building information management (BIM)) where the vertical characterization of space is more complex [7,8]. This has, in turn, increased both the need and demand for software that can adequately represent topology in three dimensions and provide interactive and querying capabilities. However, now most of the viewing of and interaction with 3D content is mediated through 2D displays and windows, icon, mouse, pointer (WIMP) interfaces. This is significant, because it eliminates binocular depth cues, the potentially invaluable opportunity to view/manipulate and experience inherently 3D data in three dimensions and restricts interaction to keyboard and mouse inputs.
Concurrently, researchers are investigating ways to leverage emerging 3D interfaces to improve interaction with, and perceptual experiences of, 3D data. Within the FRM domain in particular, mobile augmented reality tools have been developed to visualize flood impacts in situ (e.g., [9,10,11,12]), ex situ (e.g., [13]), and immersive virtual environments have been created to visualize potential futures for coastal adaptation [11,14,15]. This growth in research interest has mirrored the development of a new generation of mixed reality (MR) interfaces that have potential to alter, and potentially improve, our interaction and understanding of complex 3D data. When discussing mixed reality tools, we largely follow the definition of an augmented reality (AR) system offered by Azuma [16], where the system combines virtual and real content, is registered in three-dimensional space, and is interactive in real time. The visualization solution described in this paper is distinct from other types of tangible interfaces, such as AR sandboxes, where physical objects are augmented with digital overlays of data (e.g., [17,18]). We use the term MR instead of AR for two reasons: AR systems often focus on augmenting the real landscapes with virtual content, while our application is more environmentally agnostic (thus, further along the virtuality continuum of Milgram and Kishino [19]. Secondly, the term MR has been used widely by researchers and developers to describe head-mounted display-based systems for AR/MR (e.g., [20,21]).
MR geographic visualization has been developing as a distinct domain over the last three decades, but we are now at the pivotal point, where such tools are becoming usable enough to be introduced into routine work [22,23,24,25]. In this medium, real world views can be augmented with spatially registered three-dimensional content [16]. With advances in display technology, processing power, cloud computing, computer vision, hand and eye tracking, registration and occlusion management, these tools provide numerous opportunities for development of alternative data interfaces. This moment presents a unique opportunity for researchers and practitioners to evaluate their application in spatial data practice.
While this trend is sparked by the availability of new devices, the interest in emerging interfaces is not about the specific hardware or software. The mixtures of content and narrative are mediated through user interfaces, displays, input/output channels to deliver unique perceptual experiences of spatial data for the user. Each of the components making up an interface between the underlying data and user have the ability to influence understanding of the phenomena, whether in terms of topology of risk (e.g., flood extents and depths), or the associated narrative (e.g., risk perception, willingness to act) [26]. The preceding introduction and commentary reveal that interfaces are far from being just novel display devices or interaction systems. They are multifaceted perceptual and experiential relationships between humans and phenomena, mediated by the data that represent them, the visualizations that attempt to convey them, and the interfaces that mediate this exploration. Mixed reality interfaces, in particular, are a promising tool to improve user interaction with three-dimensional spatial data due to the combination of visual, sensory-motor, and proprioceptive feedback in the interaction with virtual objects in real spaces [27,28]. Proprioception refers to the person’s awareness of their own body in space/environment, which is preserved when using MR tools [28]. This multi-sensory nature of the interface may improve the comprehension and interaction with complex 3D data. With hand tracking, we can develop interfaces that leverage a user’s knowledge about interaction with real objects to manipulate virtual content, potentially simplifying interaction with complex 3D content (compared to a WIMP interface).
Furthermore, mixed reality interfaces offer distinct and significant features for applied spatial data practice, especially when it comes to collaborative tasks in a shared environment. In particular, the legacy spaces in which most routine work happens will require dedicated open spaces to leverage completely virtual environments (VR), while we might get most of the benefits of virtual environments in MR systems (e.g., immersion, binocular 3D, natural user interfaces), with a more flexible integration into work spaces. MR tools preserve the ability to see and interact with other people and the surrounding environment, and to interact with non-MR tools (e.g., paper maps, sketches), without the need to exit the interface. Numerous researchers have recognized this potential over the years [22,28,29,30,31]. Much of the research in the past has focused on overcoming technical hurdles in implementing MR systems. While current MR devices are not yet ubiquitous, much of the development infrastructure needed to create usable visualizations exists. This presents exciting opportunities for researchers to develop and evaluate emerging platforms for their ability to deliver meaningful and useful interaction with rigorous spatial data. Furthermore, much conceptual work is needed to understand the role of various components of the MR interface (data, display, interaction, visualization approaches) in mediating understanding of data and associated phenomena by user.
This paper sits at the intersection of evolving modes of flood risk analysis and communication, and emerging interface technology. Its objective is to report on an applied mixed reality FRM visualization system and then unpack the interplay between interface capabilities, informational experiences grounded in FRM practice, and contemporary workspaces. The sections that follow describe the workflows through which we explored the feasibility of developing MR flood risk visualization tools; the resulting visualization interfaces; critical reflection and review of these systems from the perspectives of their performance, usability, and potential as operational tools; and their potential to integrate with current and future spaces of FRM practice. In the first of these, we report the design and development of a set of prototypes developed to demonstrate the possibilities of single-user and collaborative MR flood visualizations. Using the case study of flood risk management along the shore of the Fraser River in Vancouver, we develop 3D visualizations of the area, associated impacts, and potential mitigation infrastructure. By integrating this visualization into the state-of-the-art mixed reality system HoloLens 2, we aim to understand the usability of such tools and highlight how the distinct aspects of the interface alter the perceptual outcomes of 3D visualization. Informed by this experience, we present a discussion of the potential concerns for integration of MR visualizations into practice. Ultimately, this effort seeks to assess MR tools for potential to improve interaction, understanding and communication of flood risks through visualization by planners, decision-makers, and stakeholders.
2. Methodology
This section describes the development methodology for the mixed reality flood visualization tools. The workflow consists of data preparation in a geographic information system (GIS) environment, conversion of data into 3D objects in CityEngine, integration of mixed reality capabilities, and development of the user interface in Unity, based on the mixed reality toolkit [32]. This development workflow mirrors other attempts at 3D geovisualization using HoloLens, with some changes in the software used [21,33]. A high level summary of the process is presented in Figure 1 below, with details expanded in the following sections. The development process was guided by our experience interacting with local planners and observing their policy meetings. We aimed to create visualizations that would reflect (i.e., be useful) current data and flood risk management practices and policies developed by the City of Vancouver. The visualizations are evaluated based on their hardware performance, usability (using Vi et al. [34] usability heuristics) in the Results section.
2.1. Study Area
The choice of the study area for this project was guided by existing adaptation efforts at the City of Vancouver for the shore of the Fraser River (Figure 2). This area is currently being assessed for development of appropriate adaptation measures, and numerous resources exist to develop contextually rich visualizations of flood impacts in the area [35,36]. Located on the south of the City, the Fraser River shore consists mostly of industrial land use, with some critical urban infrastructure located in the area. Given the fact that most of the shore area is vulnerable at current water levels, timely adaptation becomes an increasingly pressing concern. The extensive mapping and proposed adaptation policies available for this area made them relevant for developing contextually rich visualizations.
2.2. GIS Data to 3D Models
To develop the visualizations, various layers were used, including the digital elevation model (DEM) at 0.5 m resolution (later converted to 1 m resolution for improved performance of the visualization system), orthophoto, flood depths, building footprints, and river setbacks. DEM, orthophoto, and building footprints are available on the City of Vancouver Open Data Portal, while flood depths, and river setbacks were provided to us by municipal planners. Other layers (e.g., protection infrastructure) were digitized based on existing adaptation proposals developed by the City [36]. All layers were projected to UTM10N in QGIS and clipped to the appropriate extent. To develop 3D representation of flood depths, the flood depth layer was overlaid with DEM to derive DEM-adjusted flood depth, where the height of water was calculated as flood depth + current elevation (i.e., flood elevation is now relative to absolute elevation, not referencing the DEM elevation). Once the layers were prepared and clipped to an appropriate extent (discussed below), raster layers were exported in GeoTIFF format, and vector layers as shapefiles. These layers were then imported into CityEngine software, with DEM and DEM-adjusted flood depths as terrain layers, and buildings, dikes, and setbacks as vector layers. DEM was textured with orthophoto at 0.2 m resolution, and flood depth was textured identically to existing flood maps published by the City. To derive 3D geometry from vector layers, base heights were adjusted to the DEM and building layers’ attribute height information was used to extrude buildings. The proposed dikes do not contain specific information on their dimensions, so they were represented as 4-m wide and 6-m high splines, colored in red. The setback lines were visualized as 2 m wide 10 m high splines, colored in white. The 3D geometry generated in CityEngine was exported in Filmbox (.fbx) format, which can be imported across 3D modeling/game engine software, including Unity, which was used to integrate mixed reality capabilities [37].
2.3. Integration with Mixed Reality Toolkit
To develop mixed reality visualization based on the created 3D models, we used the mixed reality toolkit (MRTK), which is a platform built to integrate mixed reality capabilities in existing applications [38]. It is developed by Microsoft and is an underlying infrastructure used to develop most applications for the HoloLens platform. The HoloLens 2 device is a head-mounted computer system that has stereoscopic displays, 6 degrees-of-freedom positional tracking of the user, spatial mapping, and occlusion management of environment, eye-tracking, and articulated hand tracking [39]. Using the MRTK infrastructure, we can also use synchronized coordinate systems across multiple devices (through Azure Anchors), and develop multi-user applications (through Photon Unity Networking) [40,41]. Documentation describing the development process exhaustively is openly available on the Microsoft website.
We used MRTK version 2.3, using Unity 2019.2 and 2019.3 for collaborative, and single user applications respectively. The different versions of Unity were used since some features are only available in the newer version (e.g., eye-tracking), and collaborative capabilities are only available in the older version. We do not present all the minute changes done in Unity to integrate MRTK, since the ongoing changes to the toolkit and changing software versions will make our development guide outdated by the time of publication. Rather, we discuss higher-level content and user interface (UI) design decisions made throughout the development process. For instance, the entire Fraser shore is approximately 10 km, and given the resolution of DEM at 0.5 m and flood depths at 1 m, visualizing the entire shore would be unfeasible given the processing limitations of the device used. Throughout testing and development, it was determined that a clipped area of the shore about 300 × 300 m resulted in smooth performance (stable at 55–60 fps). A final extent ended up being 347 by 391 m, at 1 m resolution for floodplain and digital elevation model. Larger areas would hinder rendering performance on our devices. This can be addressed through the use of remote rendering, whether in the cloud or on a local machine, but was not used in this case since it limits the capabilities of the device in the current version of MRTK. In particular, articulated hand tracking and eye tracking did not work in our tests, and understanding the capabilities, use, and shortcomings of these aspects of the interface was deemed more important than visualizing larger areas with off-device rendering. The final visualization landscape model (Figure 3a) is approximately 1.5 m wide when a user launches the application.
2.4. Development of the User Interface
Although mixed reality research has been going on for several decades, it is only relatively recently that robust, high-performance, consumer-grade MR systems have become available (e.g., HoloLens, Magic Leap). Hence, there are few guidelines for the development of appropriate user interfaces for MR applications. Some suggestions for the design of user interface for MR systems have been made in literature, and others are suggested by Microsoft in its design guidelines [34,42,43,44,45]. The guidelines presented by Vi et al. [34] seemed particularly relevant, as they were written with last generation head-mounted augmented reality devices (e.g., HoloLens), while many of previous studies concerned themselves with handheld augmented reality visualizations (e.g., [46]). We emphasize that UI design decisions were based on the above literature and our development experience. Development of usable and useful MR user interfaces for spatial data requires much research to understand what aspects of the design contribute to ease of use and provide a compelling user experience. Our goal was to develop an invisible/natural interface, to allow users to remain focused on the task and content at hand, rather than be distracted by novel technology. To this end, we utilized HoloLens’s hand- and eye-tracking capabilities, as well as use the spatial map of the environment for occlusion management and content placement.
The goals for the user interface were fourfold: (1) provide interactive capabilities to visualize alternative shore adaptation scenarios developed by City of Vancouver on-the-fly, (2) provide inter-connected contextual information to the user based on the state of the 3D model, (3) integrate virtual content into the physical space of the user, and (4) use the available features of the device (hand and eye-tracking) where it seemed to add value to the user experience.
2.4.1. Content Layout
The layout of the UI was guided by the desire to utilize virtual space to effectively display contextual information related to FRM. We integrated an existing conceptual drawing created by urban planners to illustrate potential layout of the physical space under a specific adaptation scenario. The associated description of potential adaptation scenarios is displayed on the text panel above the 3D content, with a legend for flood depth information (Figure 3). To contextualize the visualized shore, we added a scale bar and a directional arrow to the visualized section of the Fraser shore. The 2D content elements (drawings, text, legend) are placed on 3D slates, which are a thin 3D cube. Once the user launches the application, 3D content appears at a distance of about 1.25 m in front of the user, with the text panel and conceptual drawings panel appearing at user’s eye level. This was a compromise between a desire to enable near interaction and reducing vergence-accommodation conflict, caused by proximity of virtual content to user’s eyes. The 3D visualization of the Fraser shore flood risks is slightly below the eye-level of the user. The default location of content is informed by ergonomics of head-mounted displays, where putting content more than 15 degrees below the eye level introduces neck strain [42]. Furthermore, to reduce unnecessary motion, all of the content fits into the field of view of HoloLens 2.
2.4.2. Interaction
Hand tracking is used across the application for manipulation of 3D content (movement, rotation, scaling), as well as changing the state of content through a virtual menu. The capabilities of MR systems to track the hands and recognize gestures can be used to integrate interaction metaphors for virtual content (e.g., grabbing an object) that leverage the user’s knowledge of interacting with real objects. Articulated hand tracking allows the user to manipulate virtual objects at a close distance using their hand (pinch to grab) and at a distance with a virtual ray coming out of the user’s index finger. This allows a user to interact with a single hand to move content, and two hands for scaling and rotation. These interactive capabilities were added to all virtual objects in the scene. Given the nature of the content (text, drawings, geographic landscape), we restricted rotation for all information objects to keep them aligned vertically to the orientation of the user and environment.
For the 3D visualization, we added a wireframe bounding box, which provides information on total extents of visualization, and provides a metaphor for interaction with the visualization (virtual box). For the 3D slates holding the 2D content, we added a capability to align rotation of the slates to the physical walls, leveraging the spatial mapping and solvers (surface magnetism) capabilities of the MRTK [47]. This capability is enabled once a user grabs the object (slate), with ray cast from the user’s index finger detecting a wall and aligning the slate to it. The slate’s rotation is updated every 0.6 s during the interaction, with the spatial map of the environment being updated every second. By default, this value is set to 0.1 s, but the interaction was jittery at this update rate. The spatial mapping capabilities and solvers allow a flexible integration of virtual content across real world environments in which the MR tools can be used. To further the ability of application to quickly adapt to new environments, we designed the hierarchy of objects with slates being children of the main 3D visualization of the shore. This allows a user to just move the model of the shore, and the rest of the user interface follows. However, this can introduce problems from the usability standpoint too, for instance, if the slates are already aligned to the wall, and the user rotates the 3D model, slates will rotate as well, requiring re-alignment.
The hand tracking also allows users to press virtual menu buttons using their index finger, which has a virtual collider. Control of the state of the displayed scenarios is realized through a virtual menu, where users can interact with buttons using their index finger at a close distance, and through a “pinch” gesture at a distance. While it did not seem detrimental to usability to enable user to scale, rotate, and move content freely, for the 3D model of the landscape, rotation is locked to a single axis (i.e., visualization orientation is always aligned to the floor). Audio feedback is provided throughout the application every time the user clicks a button or interacts with visualization contents.
We did not explore interactive capabilities of eye-tracking, apart from a subtle use of gaze detection to show appropriate interaction hints, when a user looks on an interactable object. Another use of eye-tracking, which is integrated by default in MRTK, is a highlighting pointer added to a surface that is hit by the articulated eye-gaze (i.e., not just a ray pointing out of the center of the user’s head), highlighting content. For instance, when a user looks at a button it becomes highlighted with a slight glow; when a user looks at either of the clipping planes (described in the next paragraph) a text hint appears prompting the user to move it.
2.4.3. Querying Data
To investigate the possibilities of querying the topology with mixed reality tools, we utilized MRTK capabilities to clip through 3D content using a 2D plane. We used a transparent 2D cut plane with outline (handles), and applied a simple grid with 50 m cells to the surface to provide scale reference when looking at the cross-section of 3D geometry. By default, the 2D clipping plane is orthogonal to the displayed direction of 3D content, allowing users to have define east and west boundaries of the 3D visualization.
2.4.4. Guidance
Within the single user application, we also integrated some guidance in case the application is used by a novice user. By default, once the application is launched, the text panel describes the visualized section of the Fraser shore, as well as describing the 2D panels, and basics of interaction. Virtual animations (part of MRTK) that show an outline of hand were integrated with text prompts to explain how to move the clipping planes, open the menu, and disable guidance. The 3 animations are shown sequentially, delayed by 5, 10, 15 seconds since the last detection of the user’s hand. If user’s hand is not present, animations are shown by default.
2.5. Development of Collaborative Visualization
To develop the collaborative tools for mixed reality applications we needed to resolve three aspects: synchronization of content, position of content in the local coordinate system, and positioning of the coordinate systems across devices. To synchronize the local position of content in the scene, we used basic Photon Unity Networking setup (described in MRTK documentation) [41]. To enable synchronization of content state/interaction, we used remote procedure calls, which enabled us to synchronize state of scripts/objects across two users. To co-locate virtual objects in a shared environment, we used the Azure Anchor infrastructure [40]. All of the content of the visualization is attached to a virtual cube, which is used as an anchor. When a user moves the cube and creates an anchor using a button, and then shares it to the network, another user can retrieve this anchor and co-locate it in space based on the similarities of spatial maps of the environment scanned by two HoloLens devices. Both Photon Unity Networking and Azure Anchors rely on local wi-fi network to update state of the content across two devices. This infrastructure is visualized in Figure 4 below.
3. Results
Based on the workflow presented above, we developed two visualization prototypes for single user and collaborative MR visualization of flooding and associated adaptation scenarios. In the sections that follow, the user experience, reflections on hardware performance and usability are presented. Through unpacking the developed prototypes through multiple lenses, we highlight the state-of-the art capabilities of MR as realized within our prototypes.
3.1. Developed Applications
As mentioned above, we developed a single user version to demonstrate the capabilities of current MR devices, while also developing a collaborative prototype, with minor changes. Two versions were created as some functionality of the single user application could not be realized (given our development resources) in a shared version. Specifically, content scaling was disabled, as well as the hand-bound content menu, which was moved into the environment. This can also be considered advantageous to the user experience, as the state of menu is displayed next to the 3D model for both users. Below, we discuss the user experience and capabilities of developed visualizations.
When a user launches the application, the digital content (3D visualization, text panel, conceptual drawings) is presented in front of the user. The text panel describing the visualization presents a brief description of the visualization, interaction, and the legend for the floodplain depth layer. Within the single user application, gesture guidance is provided to the user upon the start of the application, describing how to move content (pinch and hold), bring up the menu (bring palm up) and toggle the guidance off with a switch on the text panel (pinch/air tap). The 3D visualization itself can be moved and scaled freely in space and persist in a specific real-world location. The text and conceptual drawing panels provide contextual information related to the presented flood visualization, as well as serve relevant information when a user chooses a specific adaptation scenario. By selecting one of the four adaptation scenarios, relevant changes to 3D content appear (e.g., display a shore dike), the textual information is switched to describe pros and cons of a specific adaptation approach, and the conceptual drawings illustrate artistic sketches of the future shore layout. This ability to dynamically explore the spatial and policy implications of a particular adaptation approach mirror the role of maps and other 3D visualization tools designed to understand and communicate risks and relevant mitigation policies [1,3,26]. Another aspect of FRM in the City of Vancouver is the development of setback policies to preserve shore areas for potential adaptation infrastructure. The 3D splines representing setbacks from the shore are available to a user in the menu, and the conflicts between the proposed policy and existing buildings can be seen.
Since the environment is mapped by the devices using the array of sensor, occlusion management is done on the fly in a given environment. This map of the environment is also used to align the virtual slates with text and drawings to the real-world walls. In case the alignment to walls does not make sense in a given environment (or the space is poorly mapped), two-handed manipulation rotating the slate can override it. This flexibility of content scaling, movement, and alignment enables integration of visualization across a range of environments, from a single user desk to a room-scale visualization.
Two movable clipping planes placed orthogonally to the content present the user with a simple tool to define extents and query 3D geometry of visualization along the clipping plane axis (i.e., transect). The resulting “slice” of the landscape is similar to the cross-section of shore displayed in the conceptual drawings panel. We designed this capability to provide a simple solution to query the 3D geometry of shore, while also providing visual correspondence to “slices” of the shore in conceptual drawings.
The shared application provides the capabilities of mixed reality visualization in a co-located, synchronous interactive collaborative setting. In terms of actual user experience, the only difference from a single user application is the need to move the anchor (virtual cube to which the content is attached) to a position with sufficiently complex real-world geometry (i.e., not just mid-air, e.g., on a table corner). By moving the cube, the user can use virtual buttons to start the Azure session, create anchor, and share it to the network. At this point, the anchor cube is locked in space and cannot be moved. The second user then starts an Azure session on their device and gets the shared network anchor. At this point, the position of the anchor cube is identical for both users, and the virtual coordinate systems of co-located users are synchronized, meaning the virtual content appears at the same real-world location. Once both users establish a common coordinate system, the 3D content position, rotation, scale (fixed), and scenario state are all synchronized in real time across users, allowing users to see and share visual information from their own perspective and position in a shared mixed reality environment. This ability to experience and interact with data in a collaborative environment can help to build shared mental models of environmental risks, risk reduction options and spatial policy based on a collaborative experience of 3D visualizations. Furthermore, this MR application setup preserves most of the rich context available to co-located collaborators: an ability to see and interact with the surrounding workspace, to talk and to see a peer’s body language and gestures [22]. This setup was tested with two users, but it is scalable for more users.
3.2. Hardware Performance
In this section, we reflect on the device performance in processing, robustness of spatial mapping, and hand- and eye-tracking.
Processing across single and shared user versions were practically identical, given much of processing power is spent on loading 3D visualization. Notably, in Figure 5 illustrates that the application utilizes almost 100% of single core GPU capacity of the device, with framerates beingly fairly stable in the range of 50–60 frames per second. Since we attempted to optimize content to utilize as much of local processing as possible, this demonstrates the limits of current state-of-the art devices. We are slightly above the recommended limit of 100 thousand polygons for the device, with the final model being at ~106 k polygons. It is important to note that local device limitations should not restrict applications to simple 3D content, low resolution or small aerial footprint. With remote rendering on a machine within a local network (Remote Rendering) or with cloud rendering (Azure Remote Rendering), HoloLens-based tools can fit tens of millions of polygons, which is especially relevant for large/complex spatial datasets.
Mixed reality displays on HoloLens 2 have a fairly limited field of view, which is a limitation inherent to all current head-mounted mixed/augmented reality devices, meaning that much of the peripheral view is not augmented, which does affect immersion and limits the “virtual real estate” that can be used without a need for user to move their head. Another notable limitation of this device is brightness limitations of current displays: the device becomes practically unusable in bright (e.g., lit by direct sunlight) environments.
Spatial mapping was satisfactory for our goals of occlusion management, digital content persistence, and alignment of virtual slates to walls. The default update rate of spatial mesh of the environment is 3.5 s in MRTK. We increased the update rate to once per second, which resulted in better performance of the above-mentioned features, without apparent performance penalty. There is still room for improvement, especially in environments with complex geometry/shadows. Nevertheless, the spatial mapping of environment and stability of digital content in real space is robust in a well-lit environment and is especially impressive given the lack of any external sensors or use of fiducial markers.
Hand tracking performance on HoloLens 2 is difficult to capture without a reference to other tracking setups. In our experience, the tracking is not on an “appliance level” of usability. After initial adaptation to the idiosyncrasies of hand tracking (e.g., hand needs to be a certain distance away) and interaction (i.e., gestures and buttons need to be pressed much further than you would expect based on visual feedback), the accuracy of tracking is satisfactory/usable, but still has substantial room for improvement.
Despite the limited use of eye-tracking, we need to acknowledge almost uncanny accuracy of this capability of HoloLens. The tracking is practically flawless, and this is especially exciting for potential approaches to evaluate user interfaces in mixed reality based on rich articulated eye-tracking data, beyond a simple gaze from a center of the camera/head of the user.
The performance of shared application in synchronizing coordinate systems and content state across two devices was satisfactory, with little (<100 ms) lag. The establishment of the anchor to share the coordinate system requires a sufficiently complex scanned real environment. If the anchor is placed on a fairly uniform surface (empty table) or in mid-air, the resulting coordinate synchronization is inaccurate and can be off by 50+ cm. Since both content and coordinate synchronization rely on networked services, local wi-fi overload, poor signal, and low speed might impact the delay across two users.
3.3. Usability
To understand and unpack the usability of developed MR visualization tools, we used Vi et al.’s [34] framework of 11 MR user interface heuristics framework. This set of design guidelines has been developed with capabilities of head-mounted systems in mind and provide a useful framework to discuss the user interface design decisions made.
- 1.
- Organize the spatial environment to maximize efficiency
The ability of MR interfaces to map the physical environment of a user enables integration of virtual content and physical space. By placing virtual objects on real surfaces (the truest form of AR, according to Azuma [16], we leverage human capacity for spatial reasoning and a sense of their own body in space, through strong proprioceptive cues, to interpret virtual content. This is accomplished by occluding virtual content by real surfaces, as well as aligning information panels to physical walls. This set of capabilities makes the application adaptable to complex office environments. We actively tried the MR applications in several spaces to see how they performed visually, spatially, and cogently in (and with) different spaces. We tested both shared and single user versions in office, formal conference, and informal co-working spaces (Figure 6). The on-the-fly spatial sensing/mapping of the device supported impressive agility and flexibility in adapting to different environments. Furthermore, the robustness of spatial awareness capabilities allowed movement of content from one space (meeting room) to another (open office area) without a loss of tracking or synchronicity of content placement in a shared version.
For instance, we can place a Fraser shore visualization on a table, and information panels on a wall (e.g., Figure 6, bottom-left). By leveraging the real environment of the user, we provide a set of visual and proprioceptive cues that help understand the scale of virtual object and their relative positions [28]. From the user experience perspective, it might be easier to automatically “snap” content to detected surfaces, which is possible through the use of semantic understanding of environment by device (“scene understanding”) but was not realized here due to technical complexity.
- 2.
- Create flexible interactions and environments
We sought to leverage hand tracking capabilities of HoloLens to provide intuitive/natural interaction with virtual objects, mimicking real objects. Beyond the ability to manipulate content directly with hands, users can use a virtual ray to grab distant objects. The ability to move, scale, and rotate content as desired by a user makes the visualization adaptable to a given environment.
- 3.
- Prioritize user’s comfort and 5. Design around hardware capabilities and limitations
Content placement was guided by the desire to make interaction and viewing comfortable for the user, without intruding into personal space or requiring excess movements, which is realized through the ability to interact with content at a distance. Furthermore, content placement at approximately 1.25 m in front of the user by default requires the user to move their hands within the view of device cameras for hand tracking. To accommodate the limited field of view of MR displays on HoloLens, content was placed compactly so as to minimize user’s need for neck movement during the use. Processing limitations of the device were addressed by optimizing spatial extents of Fraser shore visualization.
- 4.
- Keep it simple: do not overwhelm the user
To keep the user focused on the flood impacts, adaptation and associated policy implications, the UI design is minimal and includes only features directly relevant to the displayed content. There is also a clear correspondence in the results of interaction, where a user’s choice of scenario reflects a simultaneous change in relevant conceptual drawing, text, and 3D content.
- 5.
- Use cues to help users throughout their experience and 8. Build upon real world knowledge
Once the user launches the application, the first thing appearing in the field of view is the text panel describing visualization contents and interaction. Within the single user version, users are also presented with gesture guide animations for opening the content menu, moving content and distant clicking (air tap) to disable guidance. The subtle use of eye-tracking to show text prompts and highlights at the user’s gaze position also seeks to guide the user through interaction.
- 6.
- Create a compelling XR experience
This set of MR visualization prototypes seeks to leverage the existing information related to flood visualization to provide a complete understanding of flooding phenomena. We used most of the information related to shore adaptation of the area available within the visualization, and leveraged the capacities of MR interface (as discussed throughout) to provide an engaging, simple to use tool to interact with spatial data. While prototypes we developed are certainly compelling to experience and use, we anticipate that spatial data users will expect to be able to use much larger geographic datasets, based on their GIS experience. This can be accomplished with off-device rendering. There are other aspects of MR interface that can especially highlight the potential of interactive MR environments for data exploration, particularly, data with more complex characterization of 3D space, and dynamic content (e.g., animated output of a flood simulation).
- 7.
- Provide feedback and consistency
When users interact with content, they get the visual, audio, and proprioceptive feedback based on their interactions. For instance, when a user chooses a particular scenario in the menu, the associated radial button changes color, a clicking sound is played, and the content is changed. We sought to provide users with a feedback on how the device sees their hand/hand gestures, thus we kept the visualization of hand mesh observed by device on, so that a user sees what the device sees (Figure 7). The interaction across different content is consistent, with single handed interaction moving the content, and two-handed manipulation used for scaling and rotating (and moving) virtual objects.
- 8.
- Allow users to feel in control of the experience
The displayed content is inert when a user launches the app (apart from hand guidance, which is animated, but fixed in space). This means that content changes state or moves only due to explicit interaction by the user. While good in theory, in practice, some general hand movements were recognized as gestures by the device, leading to unexpected movement of content. This is not a persistent feature of hand tracking, but rather a noticeable “accidental” limitation when using application for prolonged time.
- 9.
- Allow for trial and error
The only critical error that critically affected the experience and required a restart of the application was accidental movement of content behind a physical object/surface/wall. Due to the nature of MR interfaces and management of occlusion, content can sometimes be practically “lost” in physical space, such as behind a wall (i.e., users cannot see or interact with it). This movement of content behind walls is likely fixable through the addition of colliders to walls and virtual objects, but resulted in unexpected behavior (virtual content bouncing off and flying around the room). We wanted to implement the ability to restart the visualization to default position, but restarting a scene with MRTK components in Unity is not straight-forward (see [48]) and was not implemented due to practical time constraints.
4. Discussion
This section offers critical reflection and review of these systems from the perspectives of their performance and potential as operational tools, and their potential to integrate with current and future FRM and planning practice; and finally, theorization of their significance as data interfaces.
Devices that can deliver usable 3D visualizations with natural user interfaces that are robust enough to support everyday information science work have appeared only recently and, while there is much room for improvement, they provide distinct and compelling experiences of interacting with 3D data [25]. Growth of dedicated development frameworks and communities significantly reduces the complexity of development of MR experiences. While contemporary systems have their limitations, we are at a critical juncture where the MR systems are becoming usable enough to focus on the applied problems. With decreasing barriers and streamlined integration of geospatial data into MR interfaces, these tools can become a meaningful addition to the planner’s toolkit to investigate topologies of impacts, explore datasets across scales, and understand the interplay between inundation scenario and proposed adaptation policies.
With the capabilities of HoloLens 2, we can develop flexible collaborative flood visualizations that can be used within real offices without a need for dedicated spaces (as needed for VR), or specialized knowledge for interaction. This work demonstrates the practical workflow and seeks to highlight the significant infrastructure available to build powerful MR tools without significant development experience. The developed prototypes only demonstrate a particular case of ex situ, and in case of the shared version, co-located synchronous MR. Many researchers are also investigating in situ visualizations of flood impacts using MR/AR [11,15]. This range of applications highlights the significant potential these tools can have for analyzing and responding to flooding risks, as well as provide compelling environments to provide on-site information to broader set of stakeholders (e.g., decision-makers, businesses, residents, etc.). At the same time, we see massive potential in how MR visualization can transform the flood scenario visualizations done ex situ to understand the impacts and adaptation based on the available data. Although this work focuses on collaboration in shared physical environment, possibilities for remote collaboration using emerging interfaces could have a qualitative change to how the risks are understood and managed, given the potential of remote collaborators to develop robust, shared mental models of risks, and possible adaptation based on interactive 3D visualizations.
The visualization development process outlined here was guided by datasets available for flood risk management in the local context. Within developed tools (and underlying datasets), the third dimension is only used to display elevation information at a location (ground elevation, flood depth, building height), without much vertical complexity in data. However, to realize the potential of 3D displays and natural user interfaces, we need an integration of data with more complex 3D characterizations of space. With increasing use of truly 3D data, such as LiDAR, 3D models derived from structure-from-motion, and BIM to characterize urban landscape and structures, the added value of MR visualizations and interaction over a WIMP interface will likely be more significant. This can result in a richer analytical experience, as well as improve practical accuracy of understanding of potential impacts of flooding (e.g., [7,8]). Although this work focuses on collaboration in the shared physical environment, possibilities for remote collaboration using emerging interfaces could have a significant influence on how the risks are understood and managed, and potentially enable remote collaborators to develop robust, shared mental models of risks and possible adaptation based on interactive 3D visualizations.
To integrate the tools meaningfully into planning generally, and flood risk management in particular, we need much more empirical work to understand what aspects of mixed reality interfaces provide value for the user. The current moment presents numerous research opportunities to investigate these tools for spatial data practice as they become widely available and used across numerous industries. However, it is not clear how to investigate tools developed for complex tasks and goals, such as exploring and supporting policy discussion. Simple usability metrics and task completion times typically used to compare interfaces do not capture the perceptual outcomes, and the potential of MR tools to engage broader set of users in exploring geospatial data (i.e., without the complexities of a desktop GIS).
5. Conclusions
This research aimed to integrate existing datasets related to shore adaptation to flooding risks in the state-of-the-art mixed reality interface system. We presented the workflow used to integrate rigorous geospatial data into single user and collaborative MR interfaces. The developed prototypes demonstrate the capabilities of the contemporary MR interfaces to deliver 3D visualization, hand-based interaction, and integration with surrounding environment while being stable and usable in real-world settings. These platforms provide compelling tools to explore spatial data and have a distinct potential to be integrated into actual practice due to their flexibility and potential benefits arising from the distinct perceptual experiences of data in MR. Our work was guided by a desire to develop visualizations that reflect actual flood risk management practice, while focusing on designing a simple and effective user interface, while being mindful of device limitations. Recent developments in enabling interface technologies present exciting critical opportunities for researchers and practitioners to experiment and explore their data in MR environments. Through this work, we sought to demonstrate the potential of the state-of-the-art interfaces to mediate interaction with spatial data in an applied context of flood risk management. It is our hope that the technical workflows reported, and conceptual perspectives offered, will be useful to support the work of other colleagues in this emerging field. Ultimately, emerging interfaces need to be evaluated for their utility and relevance by practitioners on the ground, and this will help and to understand the perceptual and cognitive implications of working interactively with data in 3D MR environments.
Author Contributions
Conceptualization, Ruslan Rydvanskiy and Nick Hedley; Data curation, Ruslan Rydvanskiy; Funding acquisition, Nick Hedley; Investigation, Ruslan Rydvanskiy; Methodology, Ruslan Rydvanskiy and Nick Hedley; Project administration, Nick Hedley; Resources, Nick Hedley; Software, Ruslan Rydvanskiy; Supervision, Nick Hedley; Visualization, Ruslan Rydvanskiy; Writing—original draft, Ruslan Rydvanskiy and Nick Hedley. All authors have read and agreed to the published version of the manuscript.
Funding
This research was funded by the Marine Environmental Observation, Prediction and Response Network (MEOPAR) Canadian Network of Centres of Excellence, Project 1-02-02-032.4—“Coastal Flood Risk Governance in a Changing Climate”.
Data Availability Statement
Some input data (digital elevation model, building footprints, orthophoto) is in a publicly accessible repository that does not issue DOI: the City of Vancouver open data portal (https://opendata.vancouver.ca/pages/home/ (accessed on 25 February 2021)). Other datasets (3rd party data) (flood depths, setbacks) were provided to us by City planners and are not publicly available due to privacy concerns.
Conflicts of Interest
The authors declare no conflict of interest.
References
- Jacquinod, F.; Bonaccorsi, J. Studying Social Uses of 3D Geovisualizations: Lessons Learned from Action-Research Projects in the Field of Flood Mitigation Planning. ISPRS Int. J. Geo-Inf. 2019, 8, 84. [Google Scholar] [CrossRef] [Green Version]
- Voinov, A.; Kolagani, N.; McCall, M.K.; Glynn, P.D.; Kragt, M.E.; Ostermann, F.O.; Pierce, S.A.; Ramu, P. Modelling with stakeholders–next generation. Environ. Model. Softw. 2016, 77, 196–220. [Google Scholar] [CrossRef]
- Henstra, D.; Minano, A.; Thistlethwaite, J. Communicating disaster risk? An evaluation of the availability and quality of flood maps. Nat. Hazards Earth Syst. Sci. 2019, 19, 313–323. [Google Scholar] [CrossRef] [Green Version]
- Macchione, F.; Costabile, P.; Costanzo, C.; De Santis, R. Moving to 3-D flood hazard maps for enhancing risk communication. Environ. Model. Softw. 2019, 111, 510–522. [Google Scholar] [CrossRef]
- Fenech, A.; Chen, A.; Clark, A.; Hedley, N. Building an adaptation tool for visualizing the coastal impacts of climate change on Prince Edward Island, Canada. In Climate Change Adaptation in North America; Springer: Berlin/Heidelberg, Germany, 2017; pp. 225–238. [Google Scholar]
- Lai, J.-S.; Chang, W.-Y.; Chan, Y.-C.; Kang, S.-C.; Tan, Y.-C. Development of a 3D virtual environment for improving public participation: Case study—The Yuansantze Flood Diversion Works Project. Adv. Eng. Inform. 2011, 25, 208–223. [Google Scholar] [CrossRef]
- De Santis, R.; Macchione, F.; Costabile, P.; Costanzo, C. Visual Risk Communication of Urban Flooding in 3D Environments Based on Terrestrial Laser Scanning. In Proceedings of the New Trends in Urban Drainage Modelling. UDM 2018. Green Energy and Technology; Mannina, G., Ed.; Springer International Publishing: Cham, Switzerland, 2019; pp. 783–787. [Google Scholar]
- Amirebrahimi, S.; Rajabifard, A.; Mendis, P.; Ngo, T. A BIM-GIS integration method in support of the assessment and 3D visualisation of flood damage to a building. J. Spat. Sci. 2016, 61, 317–350. [Google Scholar] [CrossRef]
- Mirauda, D.; Erra, U.G.O.; Agatiello, R.; Cerverizzo, M. Mobile augmented reality for flood events management. Water Stud. 2018, 13, 418–424. [Google Scholar] [CrossRef]
- Wursthorn, S.; Coelho, A.H.; Staub, G. Applications for mixed reality. In Proceedings of the XXth ISPRS Congress, Istanbul, Turkey, 12–23 July 2004; pp. 12–23. [Google Scholar]
- Haynes, P.; Hehl-Lange, S.; Lange, E. Mobile Augmented Reality for Flood Visualisation. Environ. Model. Softw. 2018, 109, 380–389. [Google Scholar] [CrossRef]
- Lonergan, C.; Hedley, N. Flexible mixed reality and situated simulation as emerging forms of geovisualization. Cartogr. Int. J. Geogr. Inf. Geovisualization 2014, 49, 175–187. [Google Scholar] [CrossRef]
- Zhang, G.; Gong, J.; Li, Y.; Sun, J.; Xu, B.; Zhang, D.; Zhou, J.; Guo, L.; Shen, S.; Yin, B. An efficient flood dynamic visualization approach based on 3D printing and augmented reality. Int. J. Digit. Earth 2020, 13, 1302–1320. [Google Scholar] [CrossRef]
- Newell, R.; Canessa, R.; Sharma, T. Visualizing our options for coastal places: Exploring realistic immersive geovisualizations as tools for inclusive approaches to coastal planning and management. Front. Mar. Sci. 2017, 4, 290. [Google Scholar] [CrossRef]
- Lonergan, C.; Hedley, N. Navigating the future of tsunami risk communication: Using dimensionality, interactivity and situatedness to interface with society. Nat. Hazards 2015, 78, 179–201. [Google Scholar] [CrossRef]
- Azuma, R.T. A survey of augmented reality. Presence Teleoperators Virtual Environ. 1997, 6, 355–385. [Google Scholar] [CrossRef]
- Woods, T.L.; Reed, S.; Hsi, S.; Woods, J.A.; Woods, M.R. Pilot study using the augmented reality sandbox to teach topographic maps and surficial processes in introductory geology labs. J. Geosci. Educ. 2016, 64, 199–214. [Google Scholar] [CrossRef]
- Reed, S.E.; Kreylos, O.; Hsi, S.; Kellogg, L.H.; Schladow, G.; Yikilmaz, M.B.; Segale, H.; Silverman, J.; Yalowitz, S.; Sato, E. Shaping watersheds exhibit: An interactive, augmented reality sandbox for advancing earth science education. In Proceedings of the AGU Fall Meeting Abstracts, San Francisco, CA, USA, 15–19 December 2014; Volume 2014, p. ED34A-01. [Google Scholar]
- Milgram, P.; Kishino, F. A taxonomy of mixed reality visual displays. IEICE Trans. Inf. Syst. 1994, 77, 1321–1329. [Google Scholar]
- Kim, S.; Lee, G.; Huang, W.; Kim, H.; Woo, W.; Billinghurst, M. Evaluating the Combination of Visual Communication Cues for HMD-based Mixed Reality Remote Collaboration. Conf. Hum. Factors Comput. Syst. Proc. 2019, 1–13. [Google Scholar] [CrossRef]
- Wang, W.; Wu, X.; Chen, G.; Chen, Z. Holo3DGIS: Leveraging Microsoft HoloLens in 3D geographic information. ISPRS Int. J. Geo-Inf. 2018, 7, 60. [Google Scholar] [CrossRef] [Green Version]
- Ens, B.; Lanir, J.; Tang, A.; Bateman, S.; Lee, G.; Piumsomboon, T.; Billinghurst, M. Revisiting collaboration through mixed reality: The evolution of groupware. Int. J. Hum. Comput. Stud. 2019, 131, 81–98. [Google Scholar] [CrossRef]
- Hedley, N.; Postner, L.; Billinghurst, M.; May, R. Collaborative AR for geographic visualization. In Proceedings of the Second International Symposium on Mixed Reality, Yokohama, Japan, 14–15 March 2001; pp. 11–18. [Google Scholar]
- Hedley, N.; Billinghurst, M.; Postner, L.; May, R.; Kato, H. Explorations in the use of augmented reality for geographic visualization. Presence Teleoperators Virtual Environ. 2002, 11, 119–133. [Google Scholar] [CrossRef]
- Billinghurst, M.; Clark, A.; Lee, G. A survey of augmented reality. Found. Trends Hum.-Comput. Interact. 2015, 8, 73–272. [Google Scholar] [CrossRef]
- Lieske, D.J.; Wade, T.; Roness, L.A. Climate change awareness and strategies for communicating the risk of coastal flooding: A Canadian Maritime case example. Estuar. Coast. Shelf Sci. 2014, 140, 83–94. [Google Scholar] [CrossRef]
- Shelton, B.E.; Hedley, N. Using augmented reality for teaching earth-sun relationships to undergraduate geography students. In Proceedings of the First IEEE International Workshop Augmented Reality Toolkit; IEEE: Darmstadt, Germany, 2002; p. 8. [Google Scholar]
- Shelton, B.E.; Hedley, N. Exploring a cognitive basis for learning spatial relationships with augmented reality. Technol. Instr. Cogn. Learn. 2004, 1, 323. [Google Scholar]
- Nilsson, S.; Johansson, B.J.E.; Jönsson, A. A co-located collaborative augmented reality application. In Proceedings of the 8th International Conference on Virtual Reality Continuum and Its Applications in Industry; ACM: Yokohama, Japan, 2009; pp. 179–184. [Google Scholar]
- Billinghurst, M.; Weghorst, S.; Furness, T. Wearable computers for three dimensional CSCW. In Proceedings of the Digest of Papers. First International Symposium on Wearable Computers; IEEE: Cambridge, MA, USA, 1997; pp. 39–46. [Google Scholar]
- Grasset, R.; Lamb, P.; Billinghurst, M. Evaluation of mixed-space collaboration. In Proceedings of the Fourth IEEE and ACM International Symposium on Mixed and Augmented Reality (ISMAR’05); IEEE: Vienna, Austria, 2005; pp. 90–99. [Google Scholar]
- Microsoft What Is the Mixed Reality Toolkit. Available online: https://microsoft.github.io/MixedRealityToolkit-Unity/version/releases/2.3.0/README.html (accessed on 10 June 2020).
- Wang, W.; Wu, X.; He, A.; Chen, Z. Modelling and Visualizing Holographic 3D Geographical Scenes with Timely Data Based on the HoloLens. ISPRS Int. J. Geo-Inf. 2019, 8, 539. [Google Scholar] [CrossRef] [Green Version]
- Vi, S.; da Silva, T.S.; Maurer, F. User Experience Guidelines for Designing HMD Extended Reality Applications. In Proceedings of the IFIP Conference on Human-Computer Interaction; Springer: Paphos, Cyprus, 2019; pp. 319–341. [Google Scholar]
- City of Vancouver. Fraser River Maps; City of Vancouver: Vancouver, BC, Canada, 2014. [Google Scholar]
- City of Vancouver. Coastal Adaptation Plan-Fraser River East Current Conditions; City of Vancouver: Vancouver, BC, Canada, 2018. [Google Scholar]
- Esri How to: Export Textured Models from CityEngine into Unity. Available online: https://support.esri.com/en/technical-article/000012449 (accessed on 10 June 2020).
- Microsoft Getting Started with MRTK v2. Available online: https://docs.microsoft.com/en-us/windows/mixed-reality/mrtk-getting-started (accessed on 2 October 2020).
- Microsoft HoloLens 2. Available online: https://www.microsoft.com/en-us/hololens/hardware (accessed on 10 June 2020).
- Microsoft 1. Getting Started with Azure Spatial Anchors. Available online: https://docs.microsoft.com/en-us/windows/mixed-reality/mrlearning-asa-ch1 (accessed on 10 June 2020).
- Microsoft 1. Setting Up Photon Unity Networking. Available online: https://docs.microsoft.com/en-us/windows/mixed-reality/mrlearning-sharing(photon)-ch1 (accessed on 10 June 2020).
- Microsoft Comfort. Available online: https://docs.microsoft.com/en-us/windows/mixed-reality/comfort (accessed on 10 June 2020).
- Dünser, A.; Billinghurst, M. Evaluating augmented reality systems. In Handbook of Augmented Reality; Springer: Berlin/Heidelberg, Germany, 2011; pp. 289–307. [Google Scholar]
- Stevens, M.R.; Hanschka, S. Municipal flood hazard mapping: The case of British Columbia, Canada. Nat. Hazards 2014, 73, 907–932. [Google Scholar] [CrossRef]
- Dey, A.; Billinghurst, M.; Lindeman, R.W.; Swan, J. A systematic review of 10 Years of Augmented Reality usability studies: 2005 to 2014. Front. Robot. 2018, 5, 37. [Google Scholar] [CrossRef] [Green Version]
- Santos, M.E.C.; Polvi, J.; Taketomi, T.; Yamamoto, G.; Sandor, C.; Kato, H. Toward standard usability questionnaires for handheld augmented reality. IEEE Comput. Graph. Appl. 2015, 35, 66–75. [Google Scholar] [CrossRef]
- Microsoft Surface Magnetism. Available online: https://docs.microsoft.com/en-us/windows/mixed-reality/surface-magnetism (accessed on 10 June 2020).
- Provencher, E. The MRTK Does Not Support Being Unloaded and Destroyed #4530. Available online: https://github.com/microsoft/MixedRealityToolkit-Unity/issues/4530 (accessed on 10 June 2020).
Figure 1.
This flowchart presents an overview of the development workflow from conventional GIS data (orange boxes representing raster data, green boxes representing vector data) that is exported in appropriate format and converted to 3D geometry (blue boxes) in CityEngine, created 3D model can then be imported into Unity and integrated with various mixed reality toolkit components (yellow boxes) to create single and shared user applications deployed on HoloLens 2.

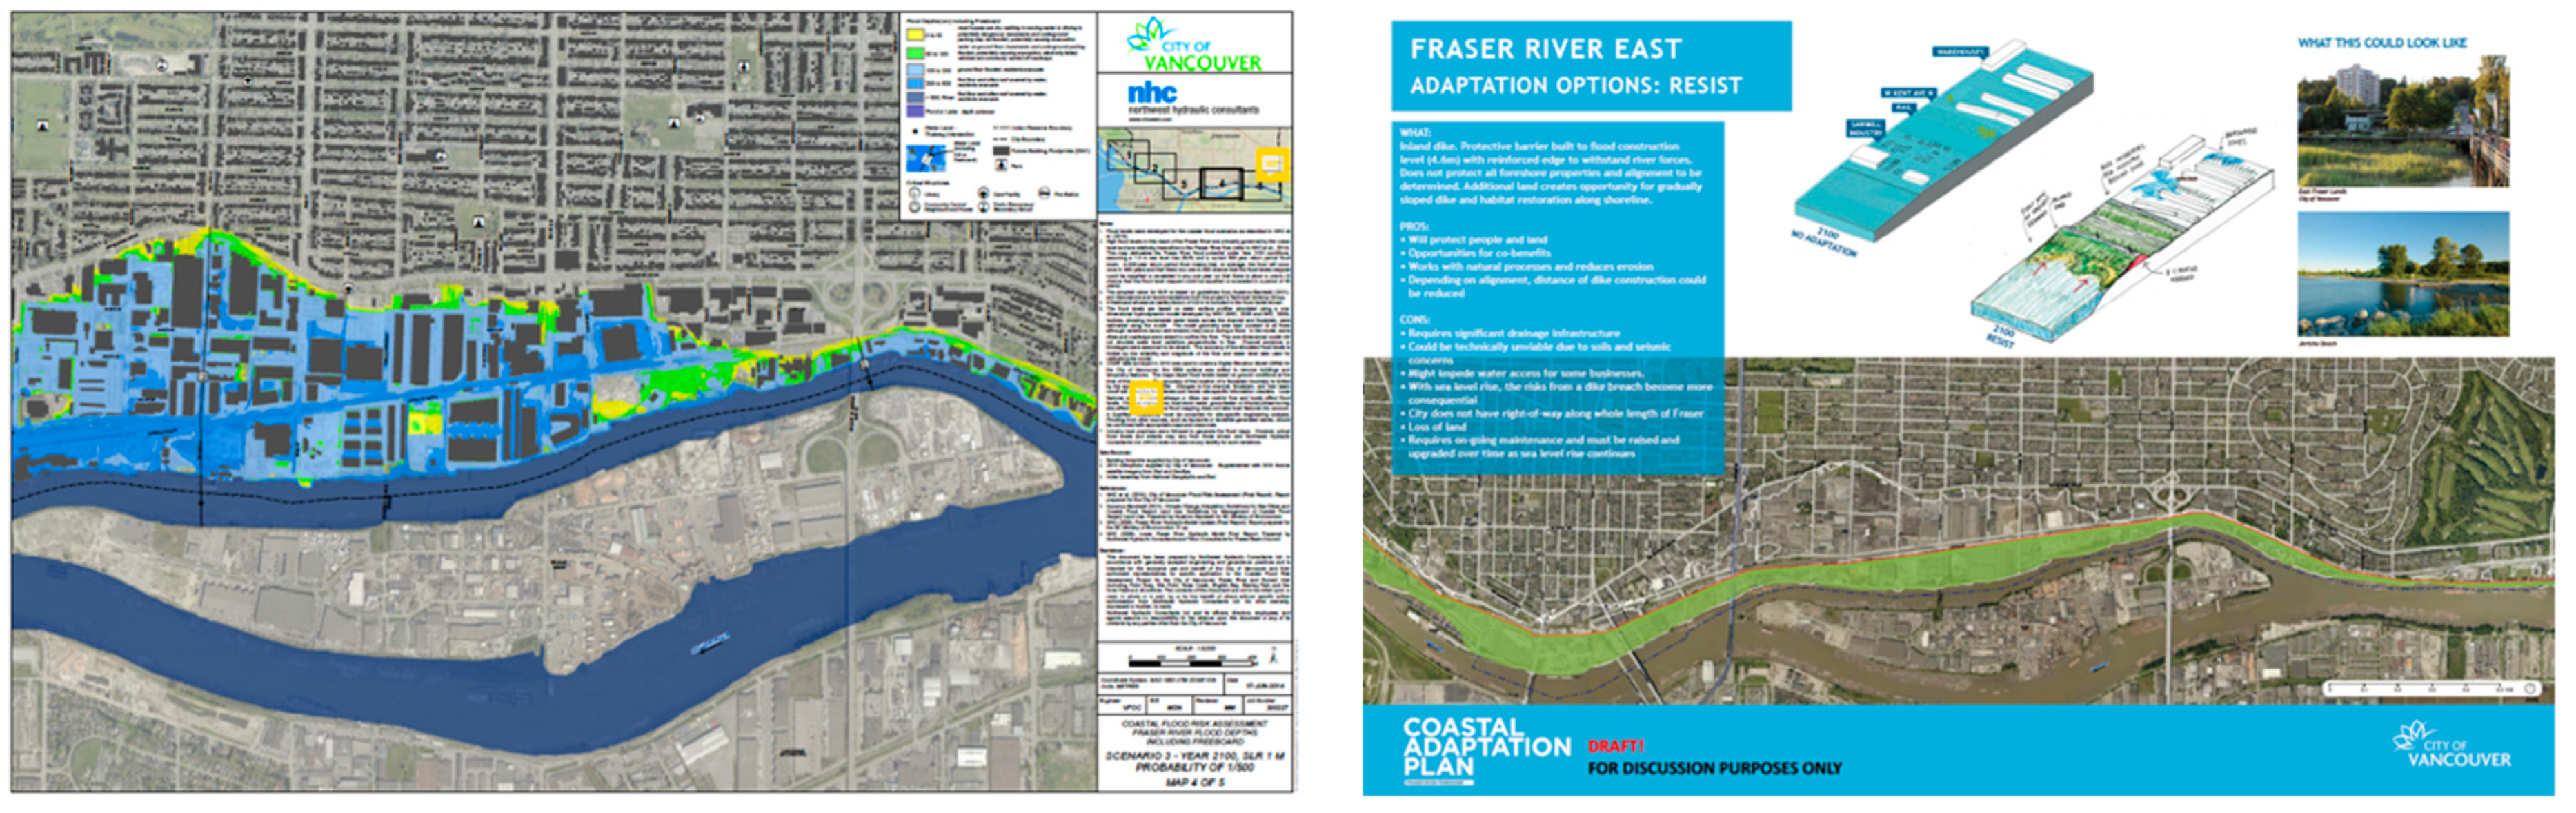
Figure 2.
The documents published by the City of Vancouver provided guidance to the design of visualization, as well as the text and conceptual drawings used in the user interface. On the left, is a flood impact map, and the right document is an excerpt from the Coastal Adaptation plan describing various adaptation scenarios for the Fraser shore area.

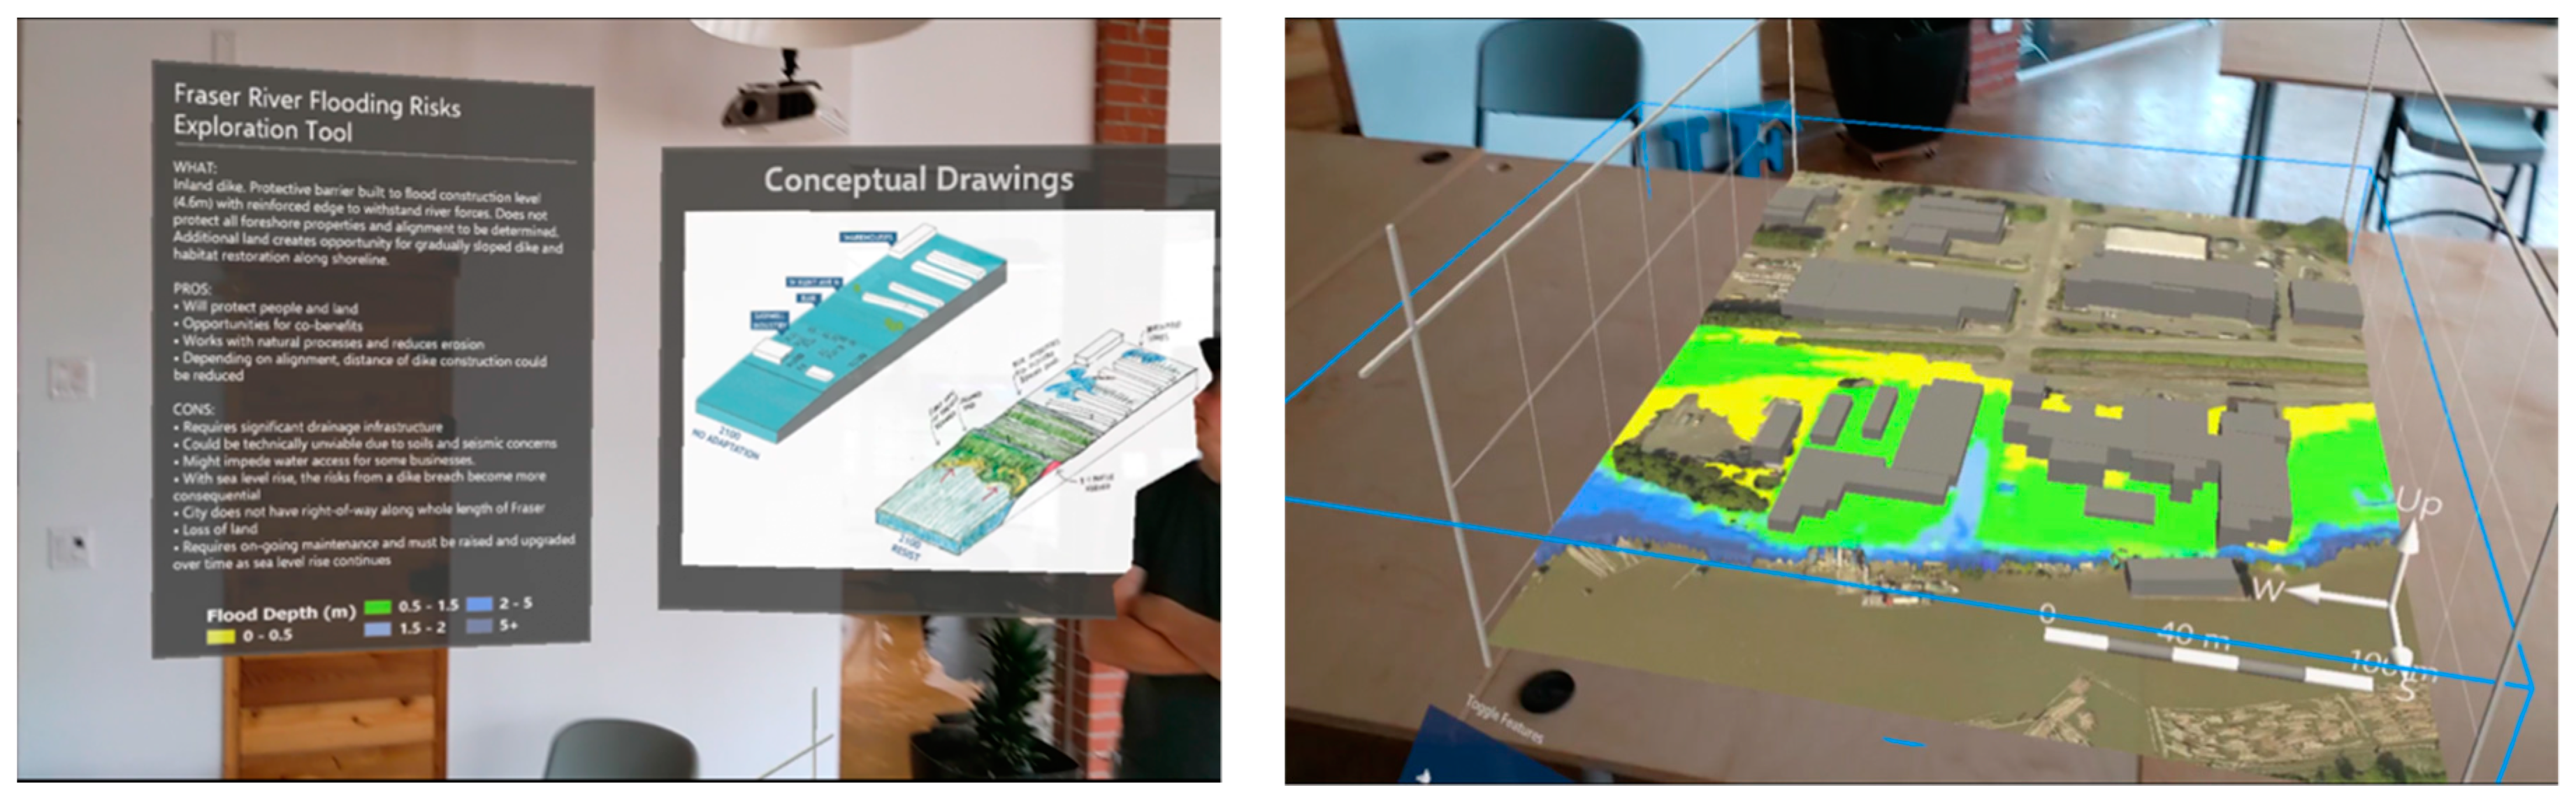
Figure 3.
This screenshot captures the developed UI (user interface) of the visualization in a shared application, with an inland dike adaptation scenario selected: (a) 3D content, with 2 clipping planes, scale bar and directional arrows; (b) text panel providing vis. and scenario description; (c) conceptual drawings related to a scenario; (d) Anchor object used to synchronize position; (e) content menu.

Figure 4.
This chart illustrates how the various components of the shared experience are synchronized across two users, with Photon Unity Networking and Remote Procedural calls connecting the content state across two users, and Azure Anchors providing the common coordinate system for to users.
Figure 4.
This chart illustrates how the various components of the shared experience are synchronized across two users, with Photon Unity Networking and Remote Procedural calls connecting the content state across two users, and Azure Anchors providing the common coordinate system for to users.

Figure 5.
Screenshot of a live hardware usage of shared MR (mixed reality) visualization. As you can see, the usage of CPU (central processing unit) is at 50–60%, and GPU load fluctuates at almost 100%, with framerates fluctuating between 50–60 fps, which is sufficient for smooth application performance.

Figure 6.
(Top) Shared version of MR prototype in a conference room environment. Displayed is a default layout of content on launch, that can be further adapted to the environment. (Bottom) Single user MR visualization adapted to the shared workspace environment. The 3D visualization (Right) is placed on a table and information panels (left) are aligned to a nearby wall. You can also notice dynamic occlusion of a person standing in front of the conceptual drawings panel.


Figure 7.
Screenshot of a single user application in use, with the content menu activated by bringing up the palm. You can see the hand mesh visualization, providing visual feedback to the user. Note: the significant displacement/difference between virtual and real hand only appears on captured videos/screenshots.

Publisher’s Note: MDPI stays neutral with regard to jurisdictional claims in published maps and institutional affiliations. |
© 2021 by the authors. Licensee MDPI, Basel, Switzerland. This article is an open access article distributed under the terms and conditions of the Creative Commons Attribution (CC BY) license (http://creativecommons.org/licenses/by/4.0/).
Share and Cite
MDPI and ACS Style
Rydvanskiy, R.; Hedley, N. Mixed Reality Flood Visualizations: Reflections on Development and Usability of Current Systems. ISPRS Int. J. Geo-Inf. 2021, 10, 82. https://0-doi-org.brum.beds.ac.uk/10.3390/ijgi10020082
AMA Style
Rydvanskiy R, Hedley N. Mixed Reality Flood Visualizations: Reflections on Development and Usability of Current Systems. ISPRS International Journal of Geo-Information. 2021; 10(2):82. https://0-doi-org.brum.beds.ac.uk/10.3390/ijgi10020082
Chicago/Turabian StyleRydvanskiy, Ruslan, and Nick Hedley. 2021. "Mixed Reality Flood Visualizations: Reflections on Development and Usability of Current Systems" ISPRS International Journal of Geo-Information 10, no. 2: 82. https://0-doi-org.brum.beds.ac.uk/10.3390/ijgi10020082
Note that from the first issue of 2016, this journal uses article numbers instead of page numbers. See further details here.