
Spatial Variability of Rainfall Trends in Sri Lanka from 1989 to 2019 as an Indication of Climate Change


Abstract
:1. Introduction
2. Materials and Methods
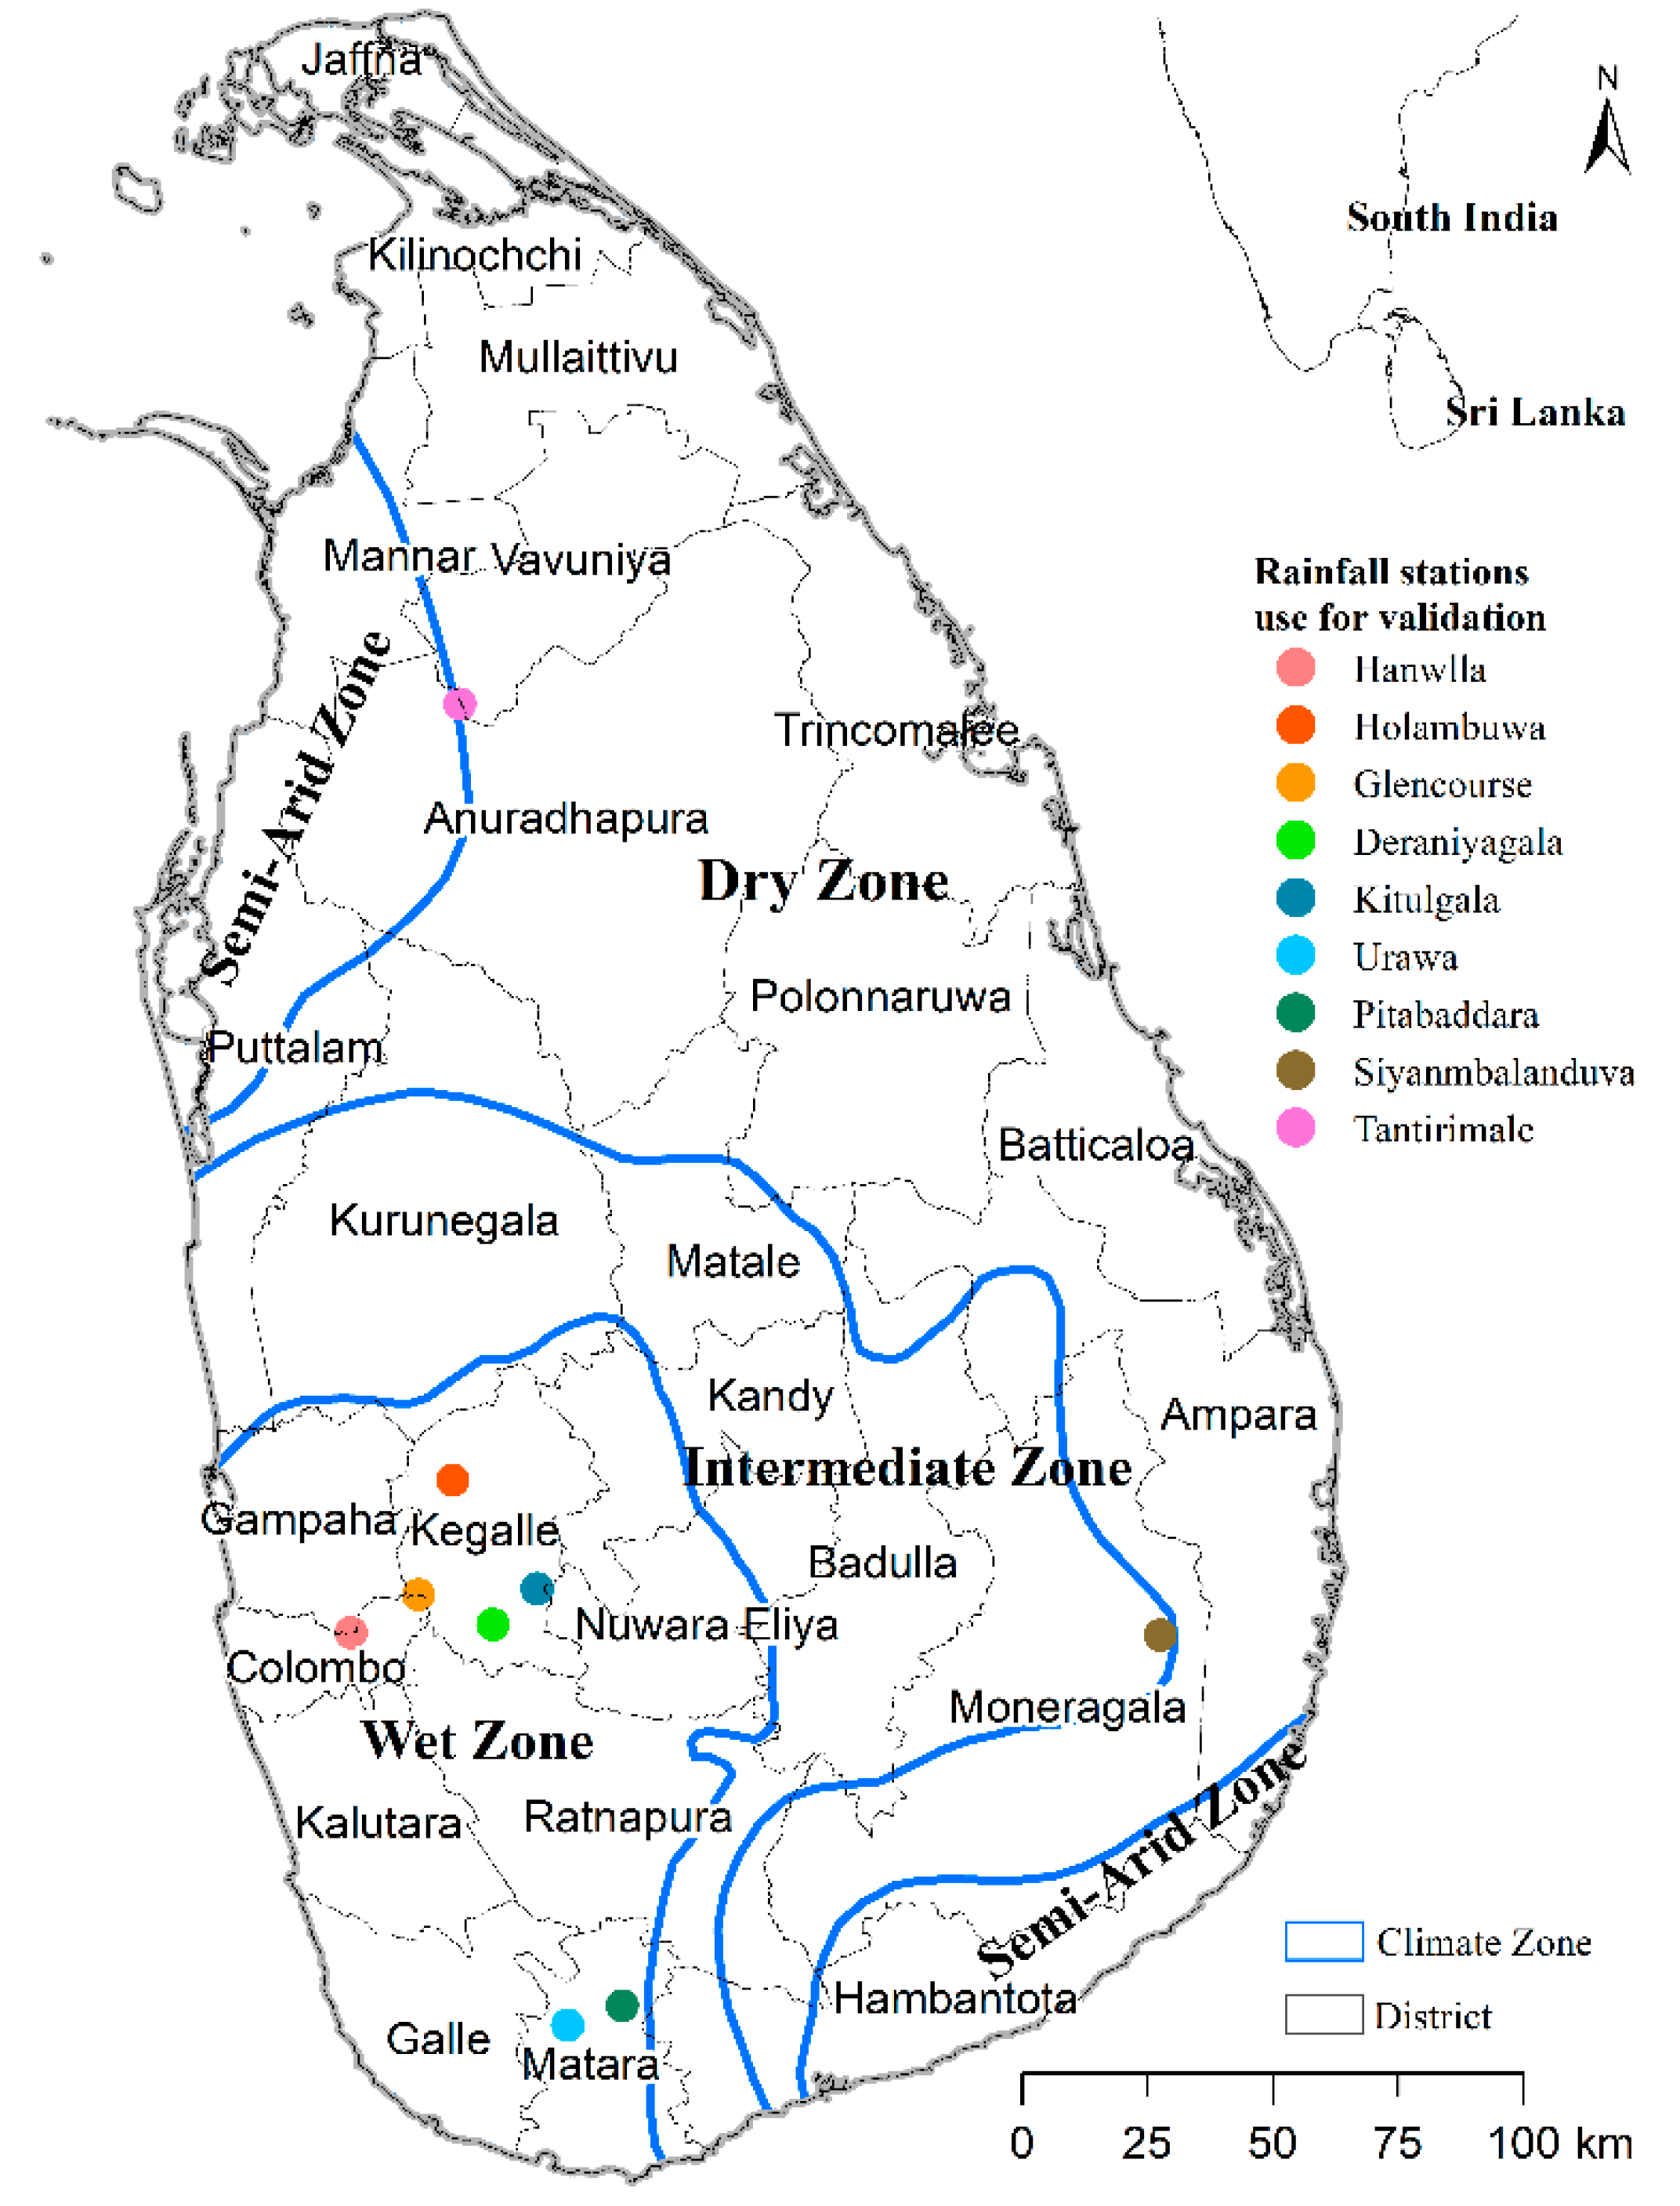
2.1. Study Area
2.2. Data
2.3. Methodology
2.3.1. Mann–Kendall Test
2.3.2. Sen’s Slope Estimation
3. Results
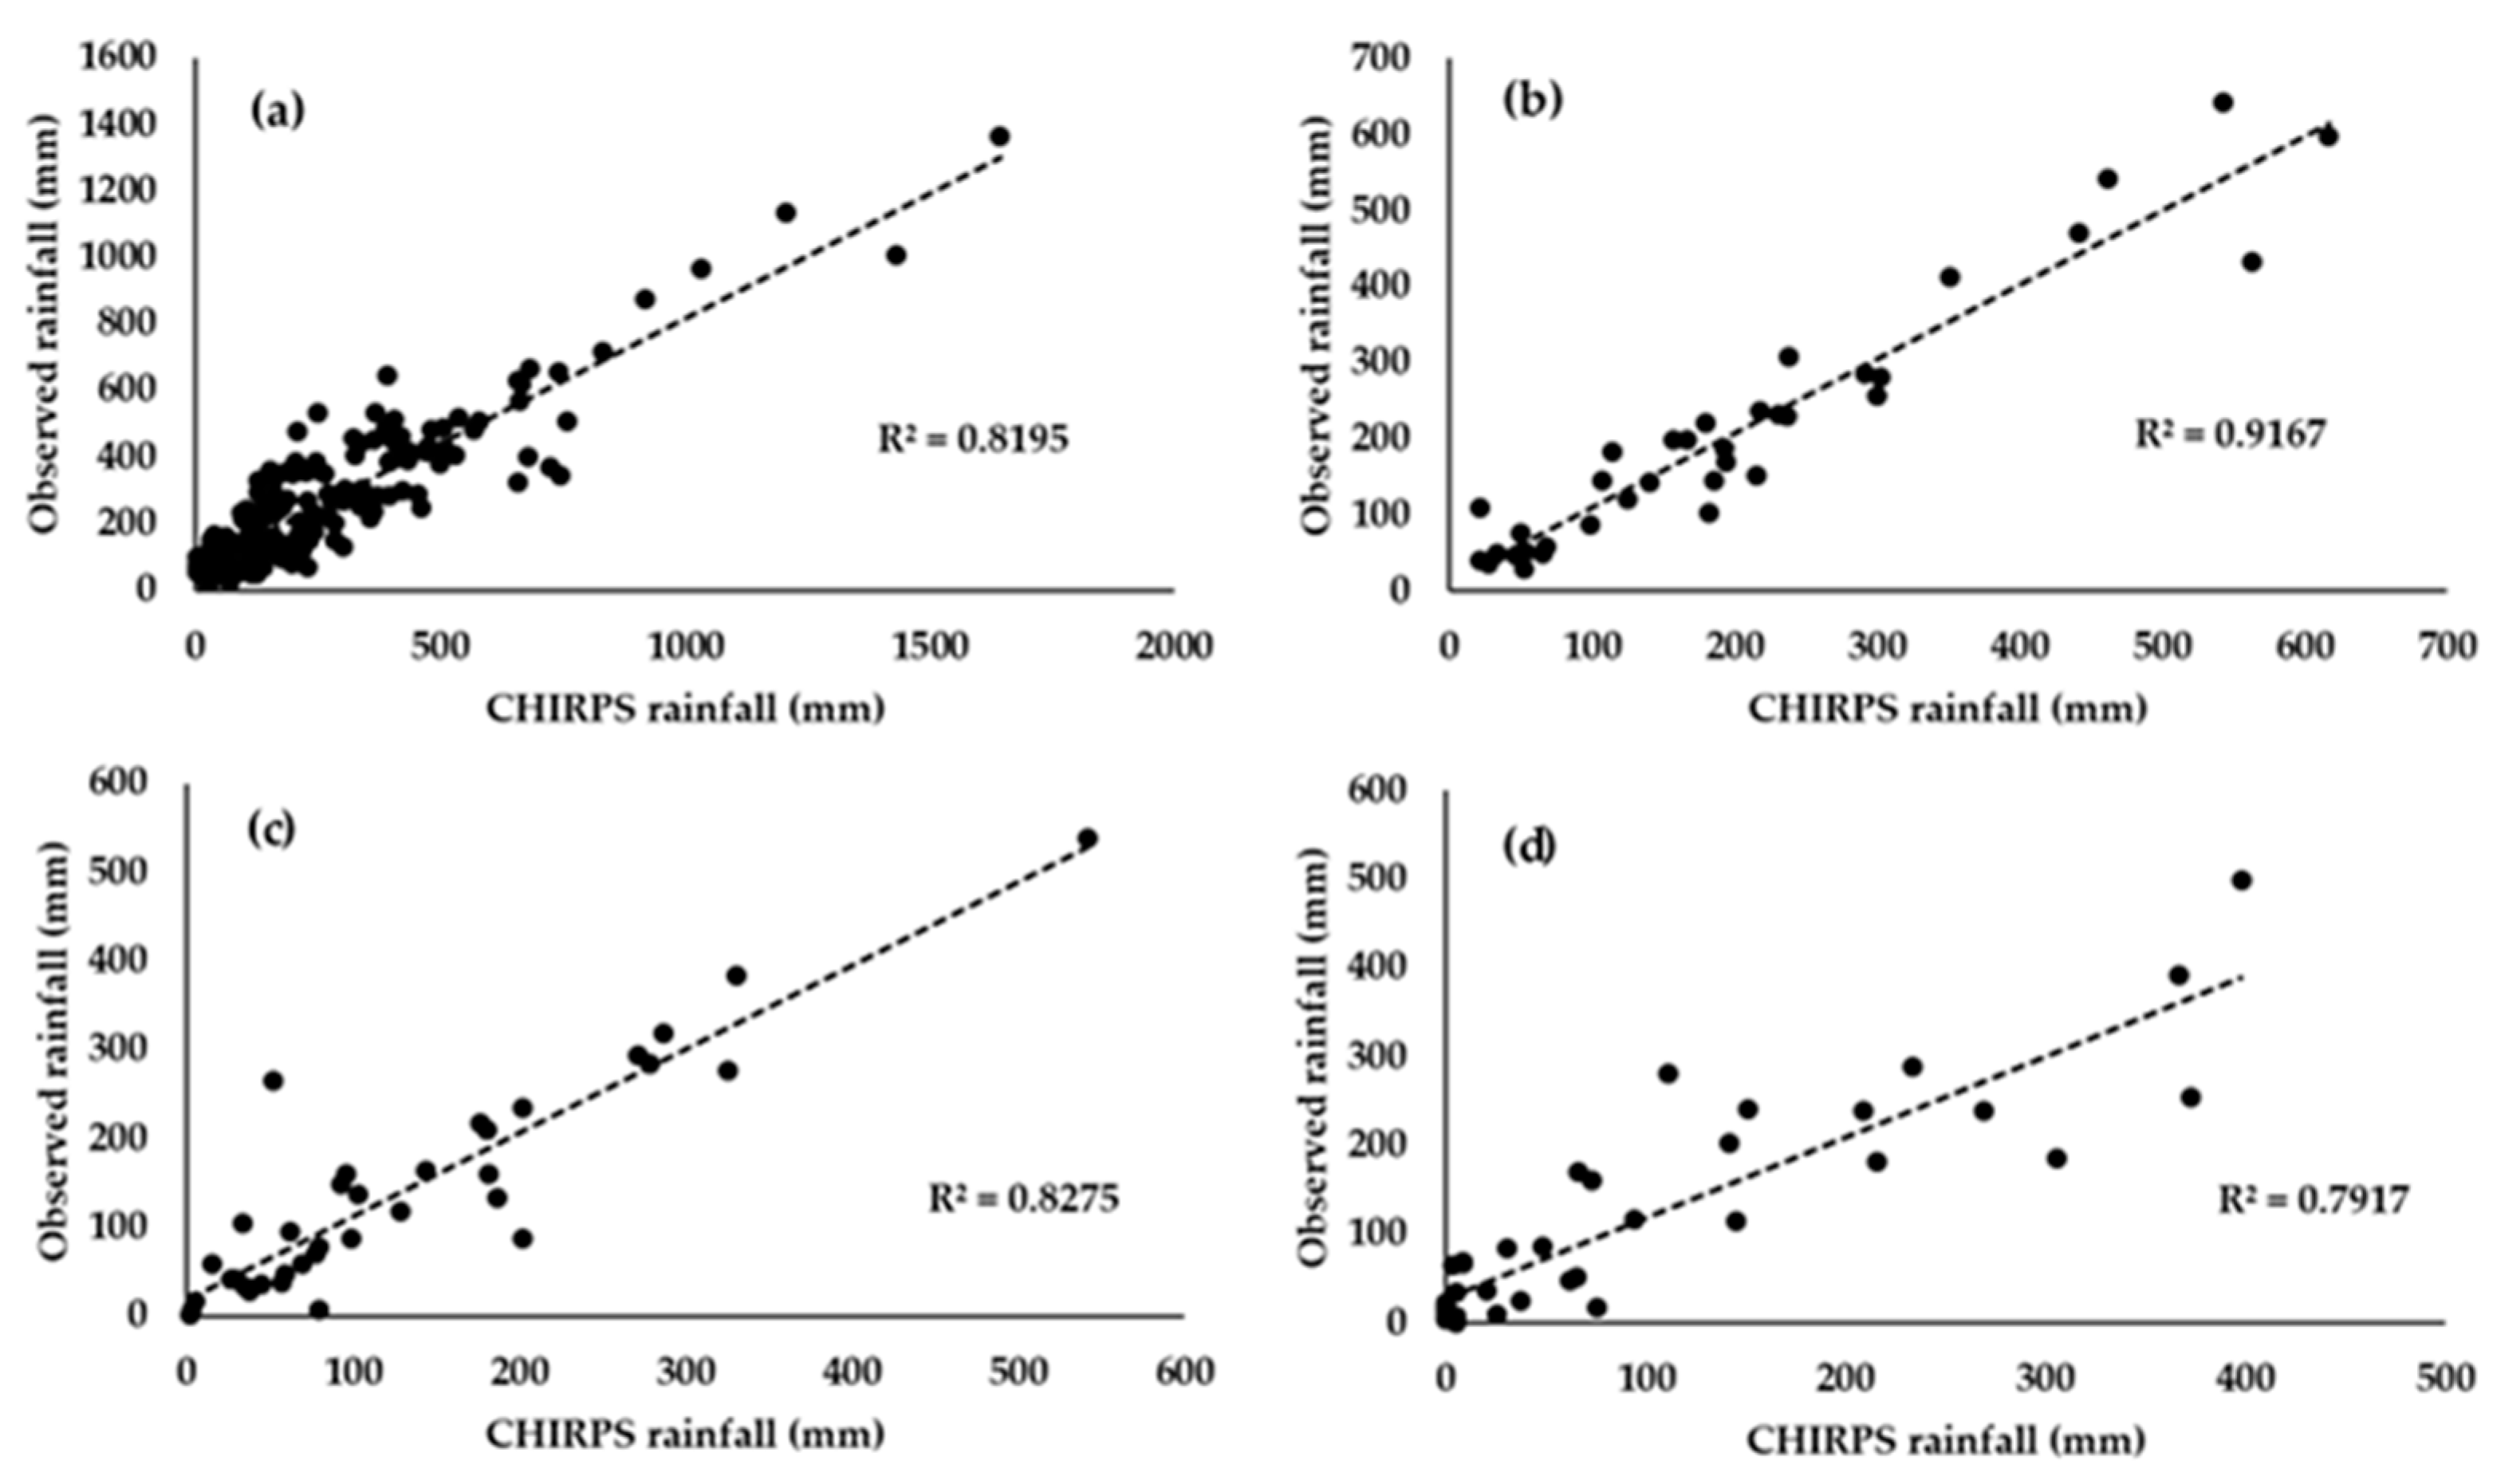
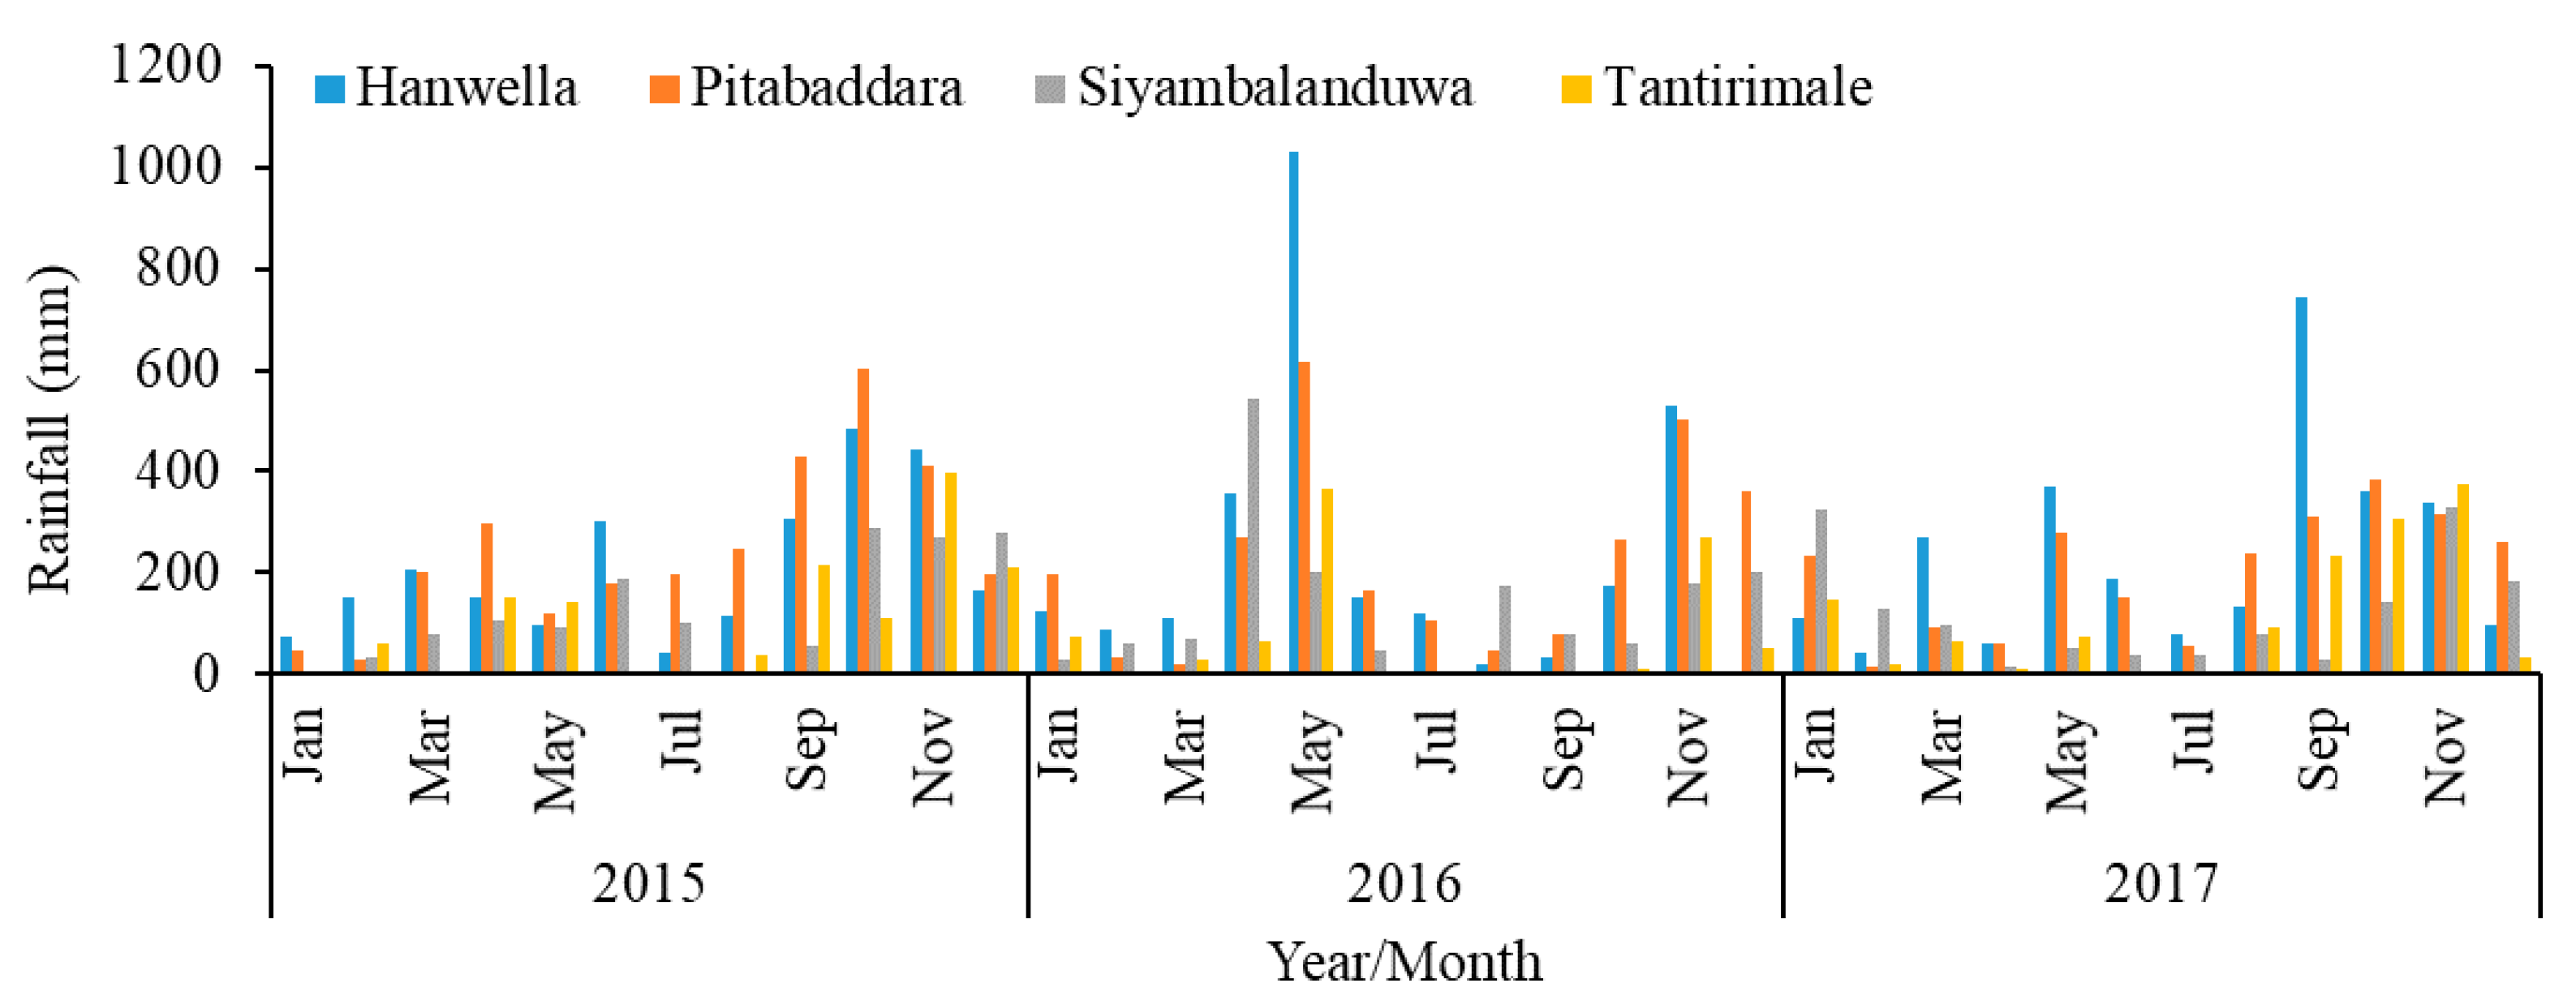
3.1. Cross Validation of CHIRPS Data
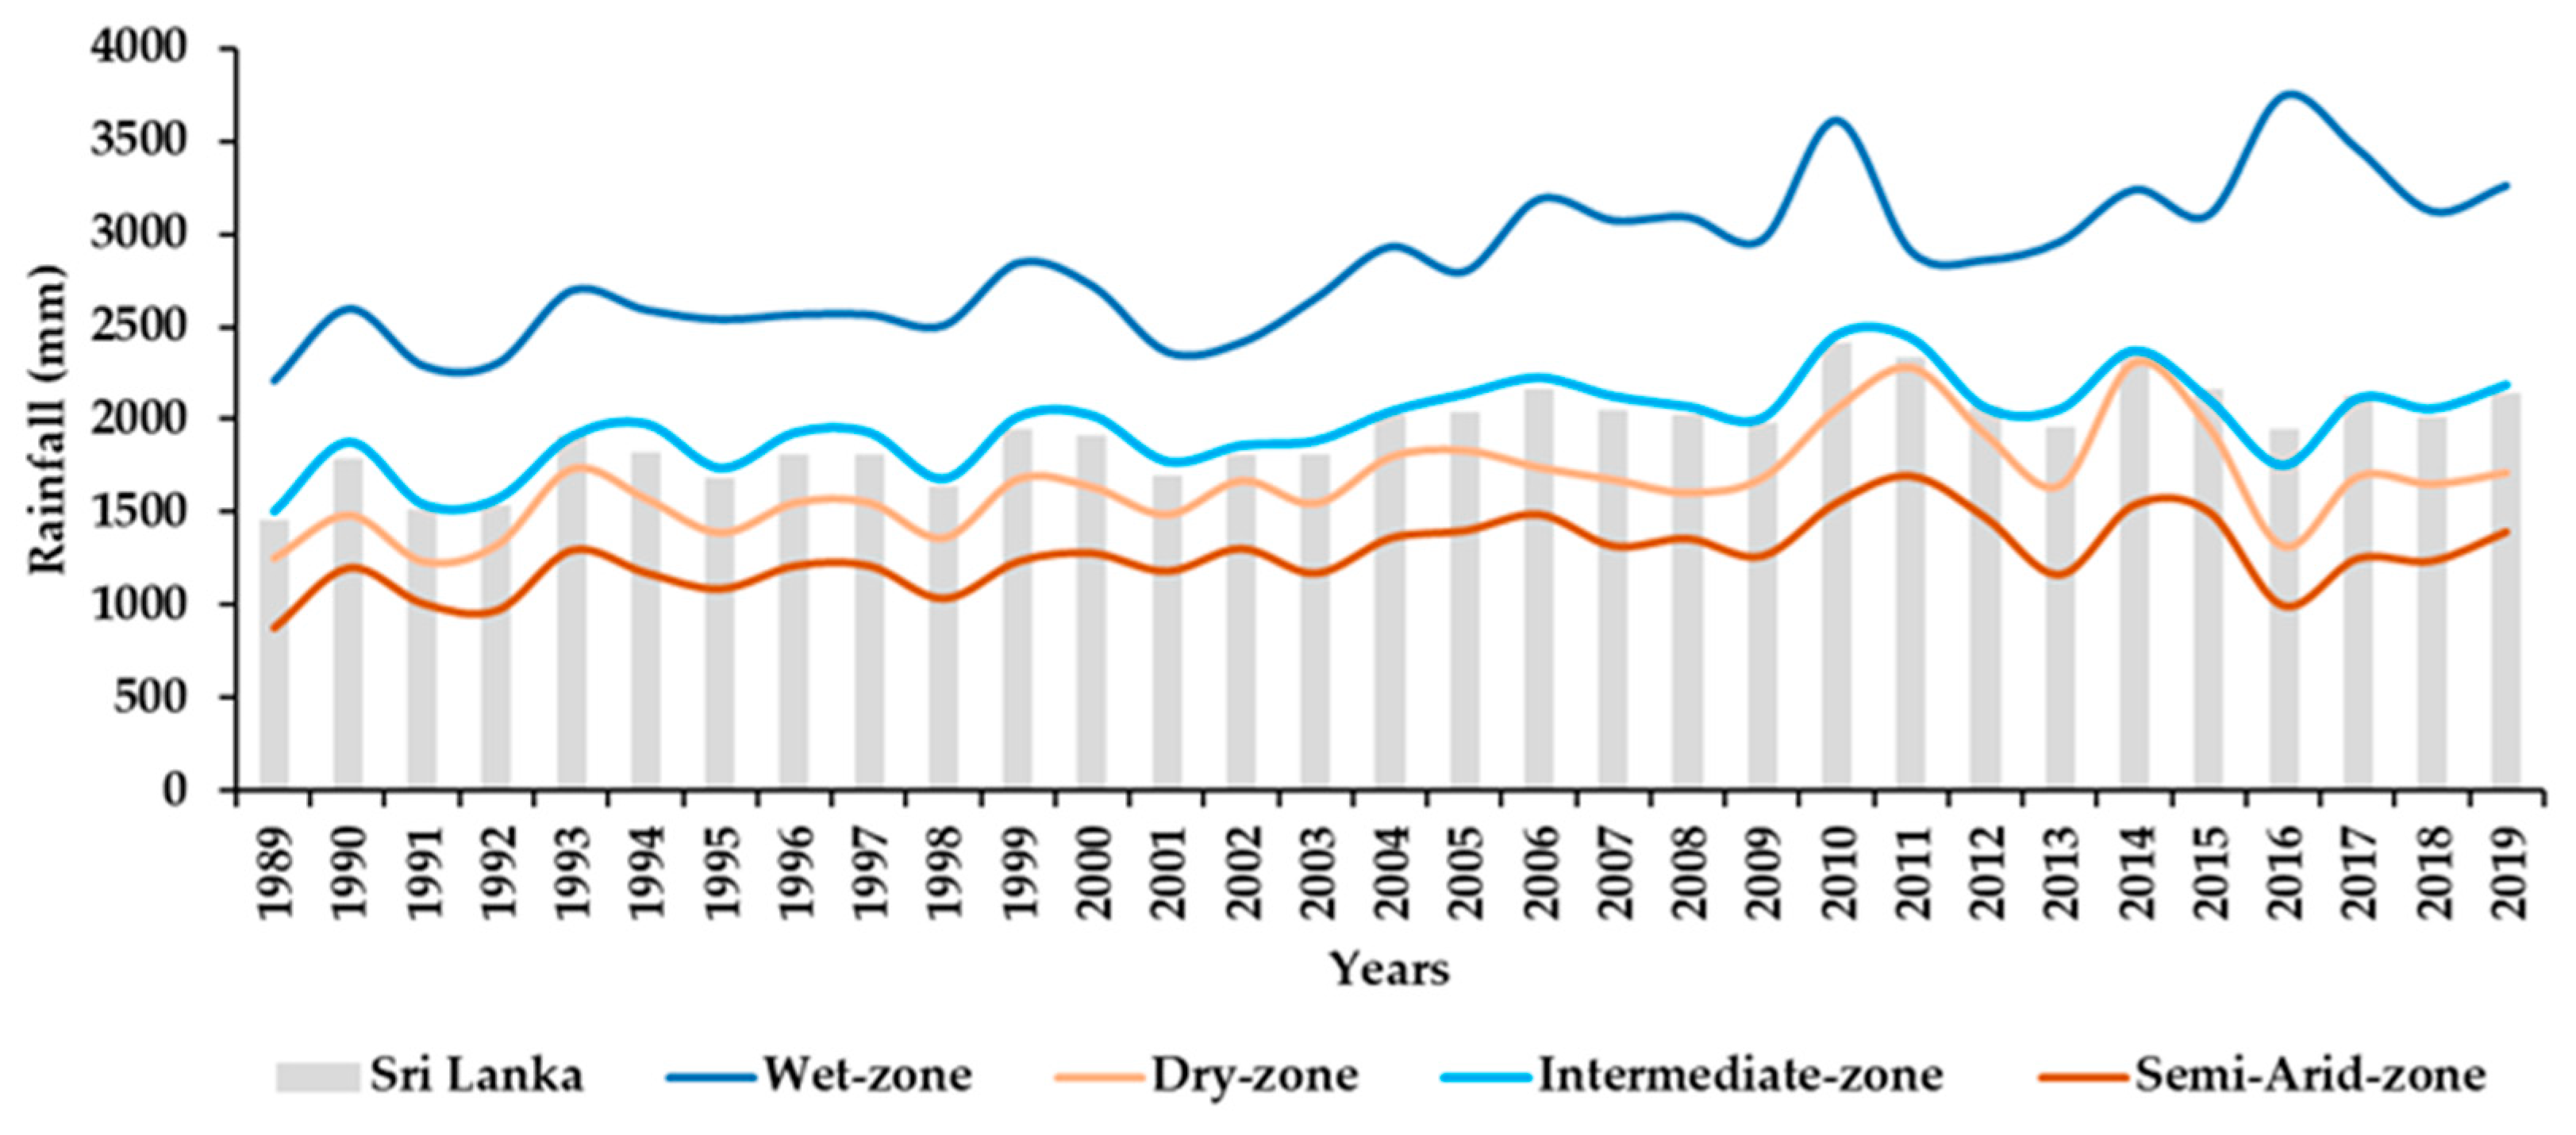
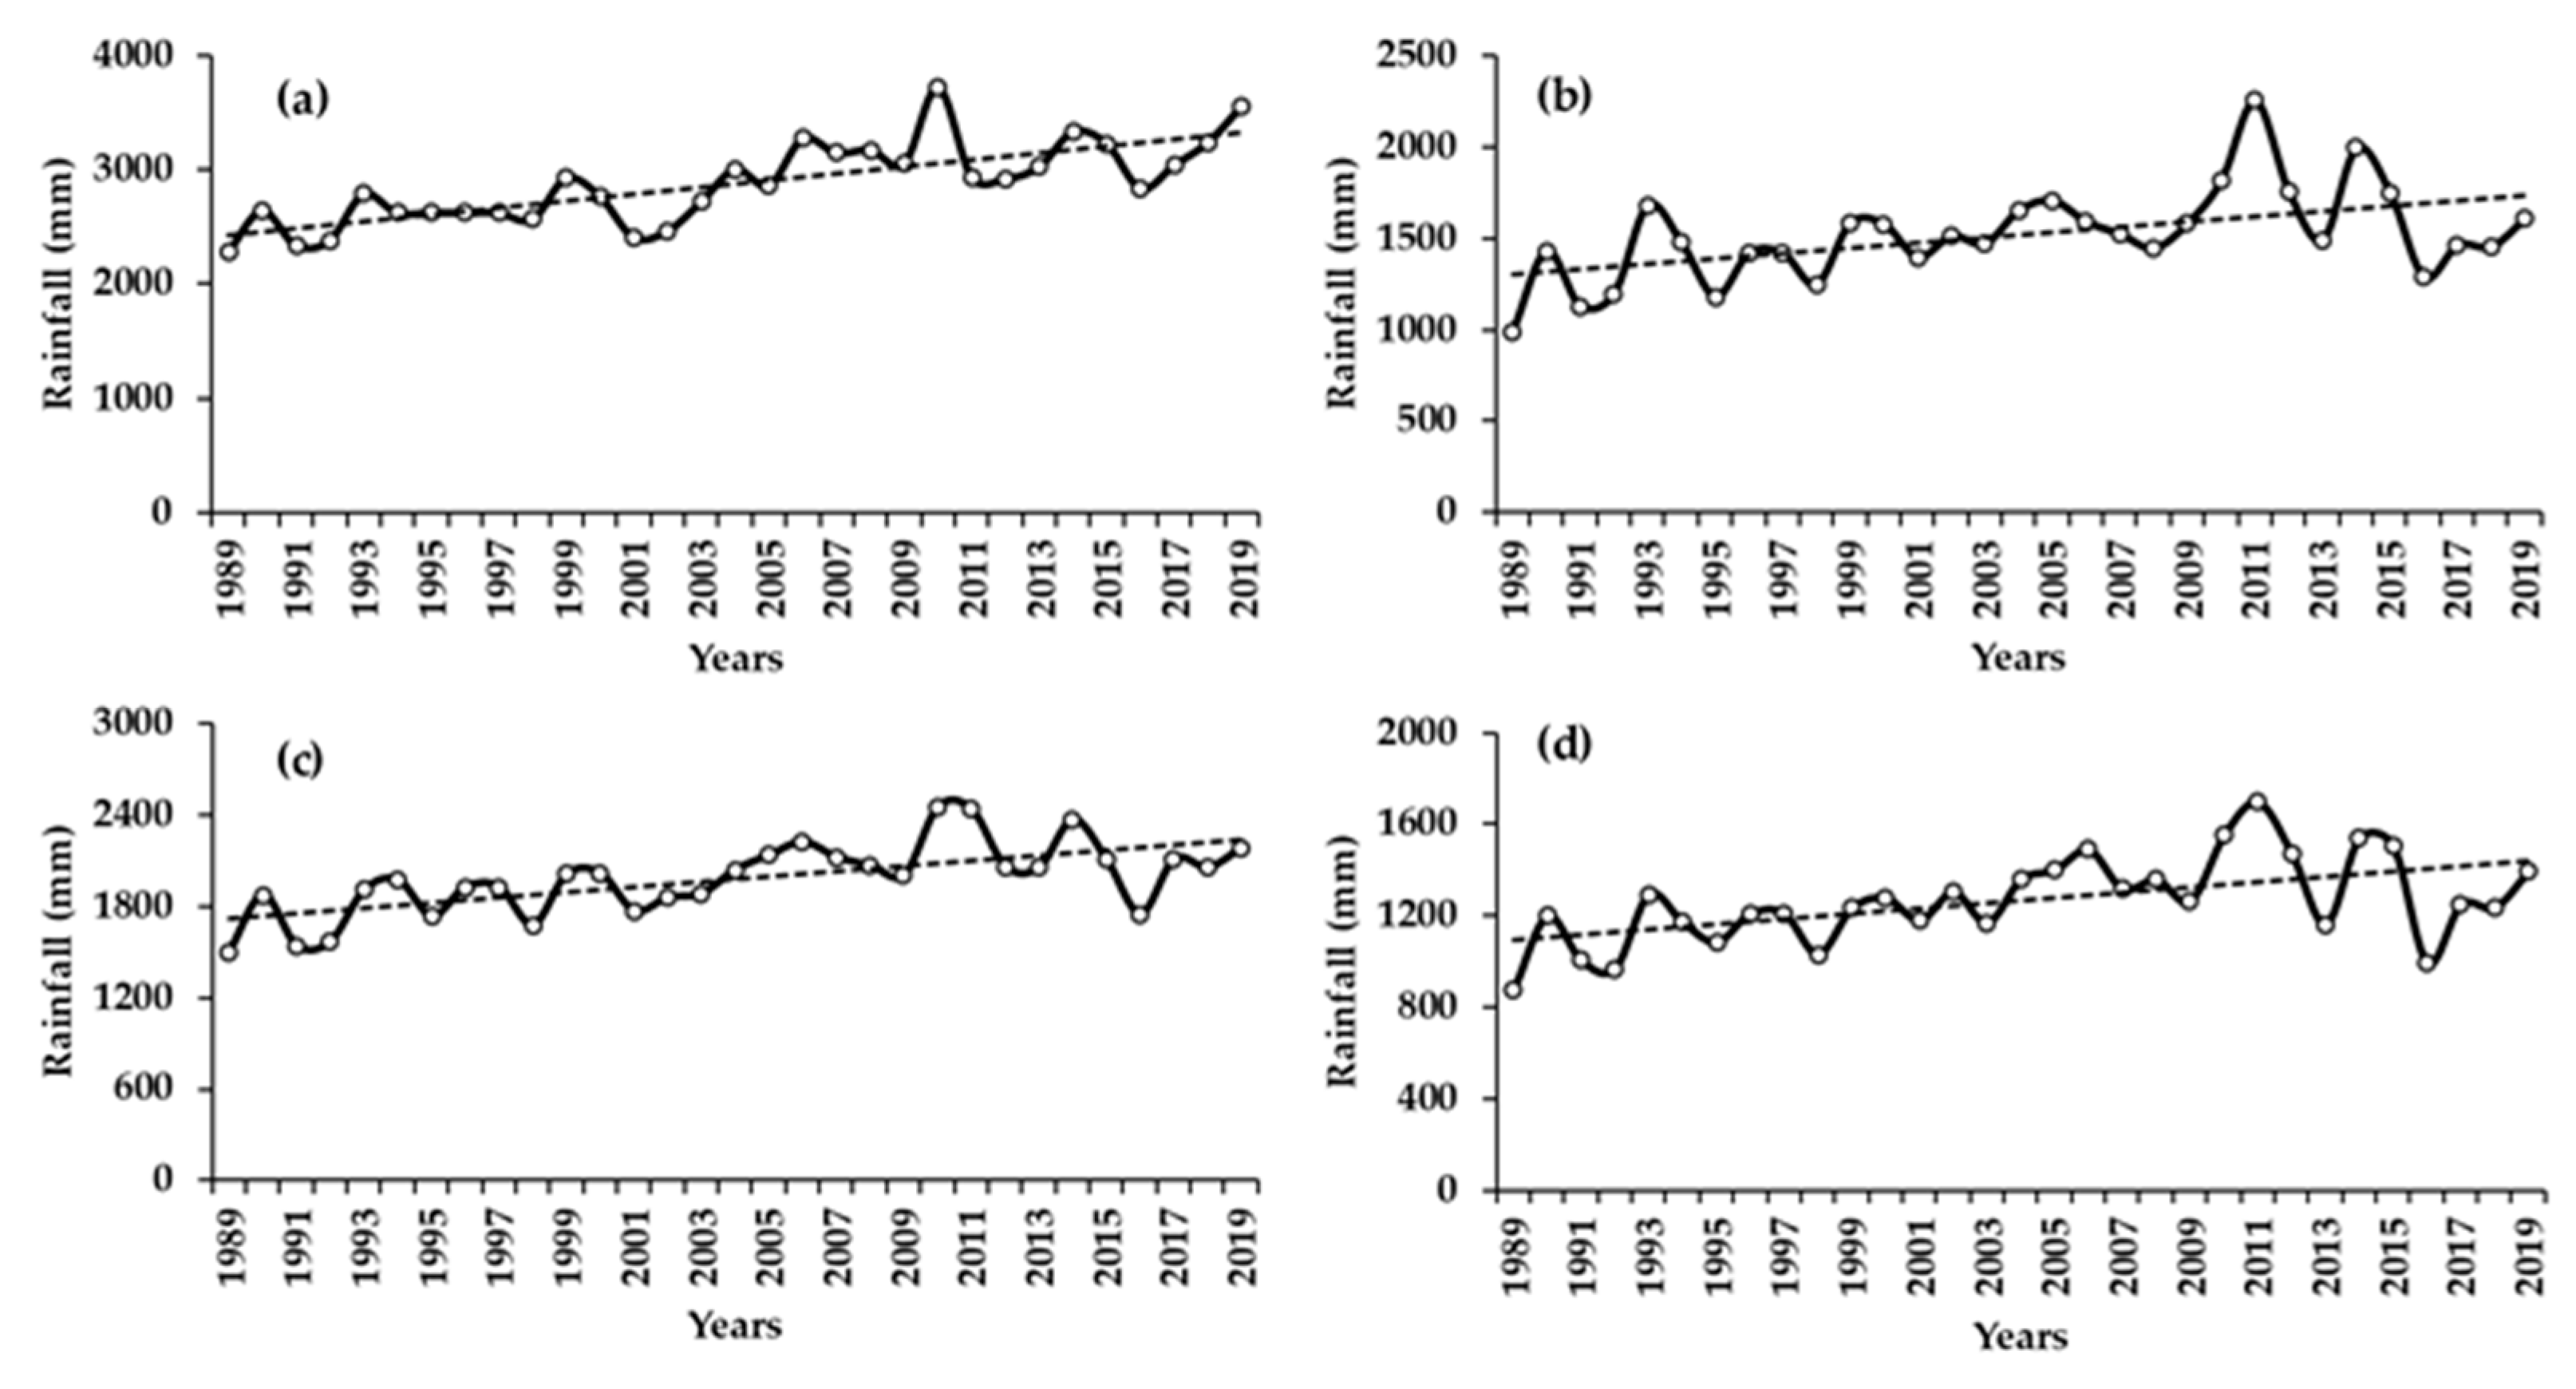
3.2. Descriptive Statistics Generated Using CHIRPS Data
4. Discussion
5. Conclusions
Author Contributions
Funding
Institutional Review Board Statement
Informed Consent Statement
Data Availability Statement
Acknowledgments
Conflicts of Interest
Appendix A

| District | K-Tau | Sen’s Slope | p-Value |
|---|---|---|---|
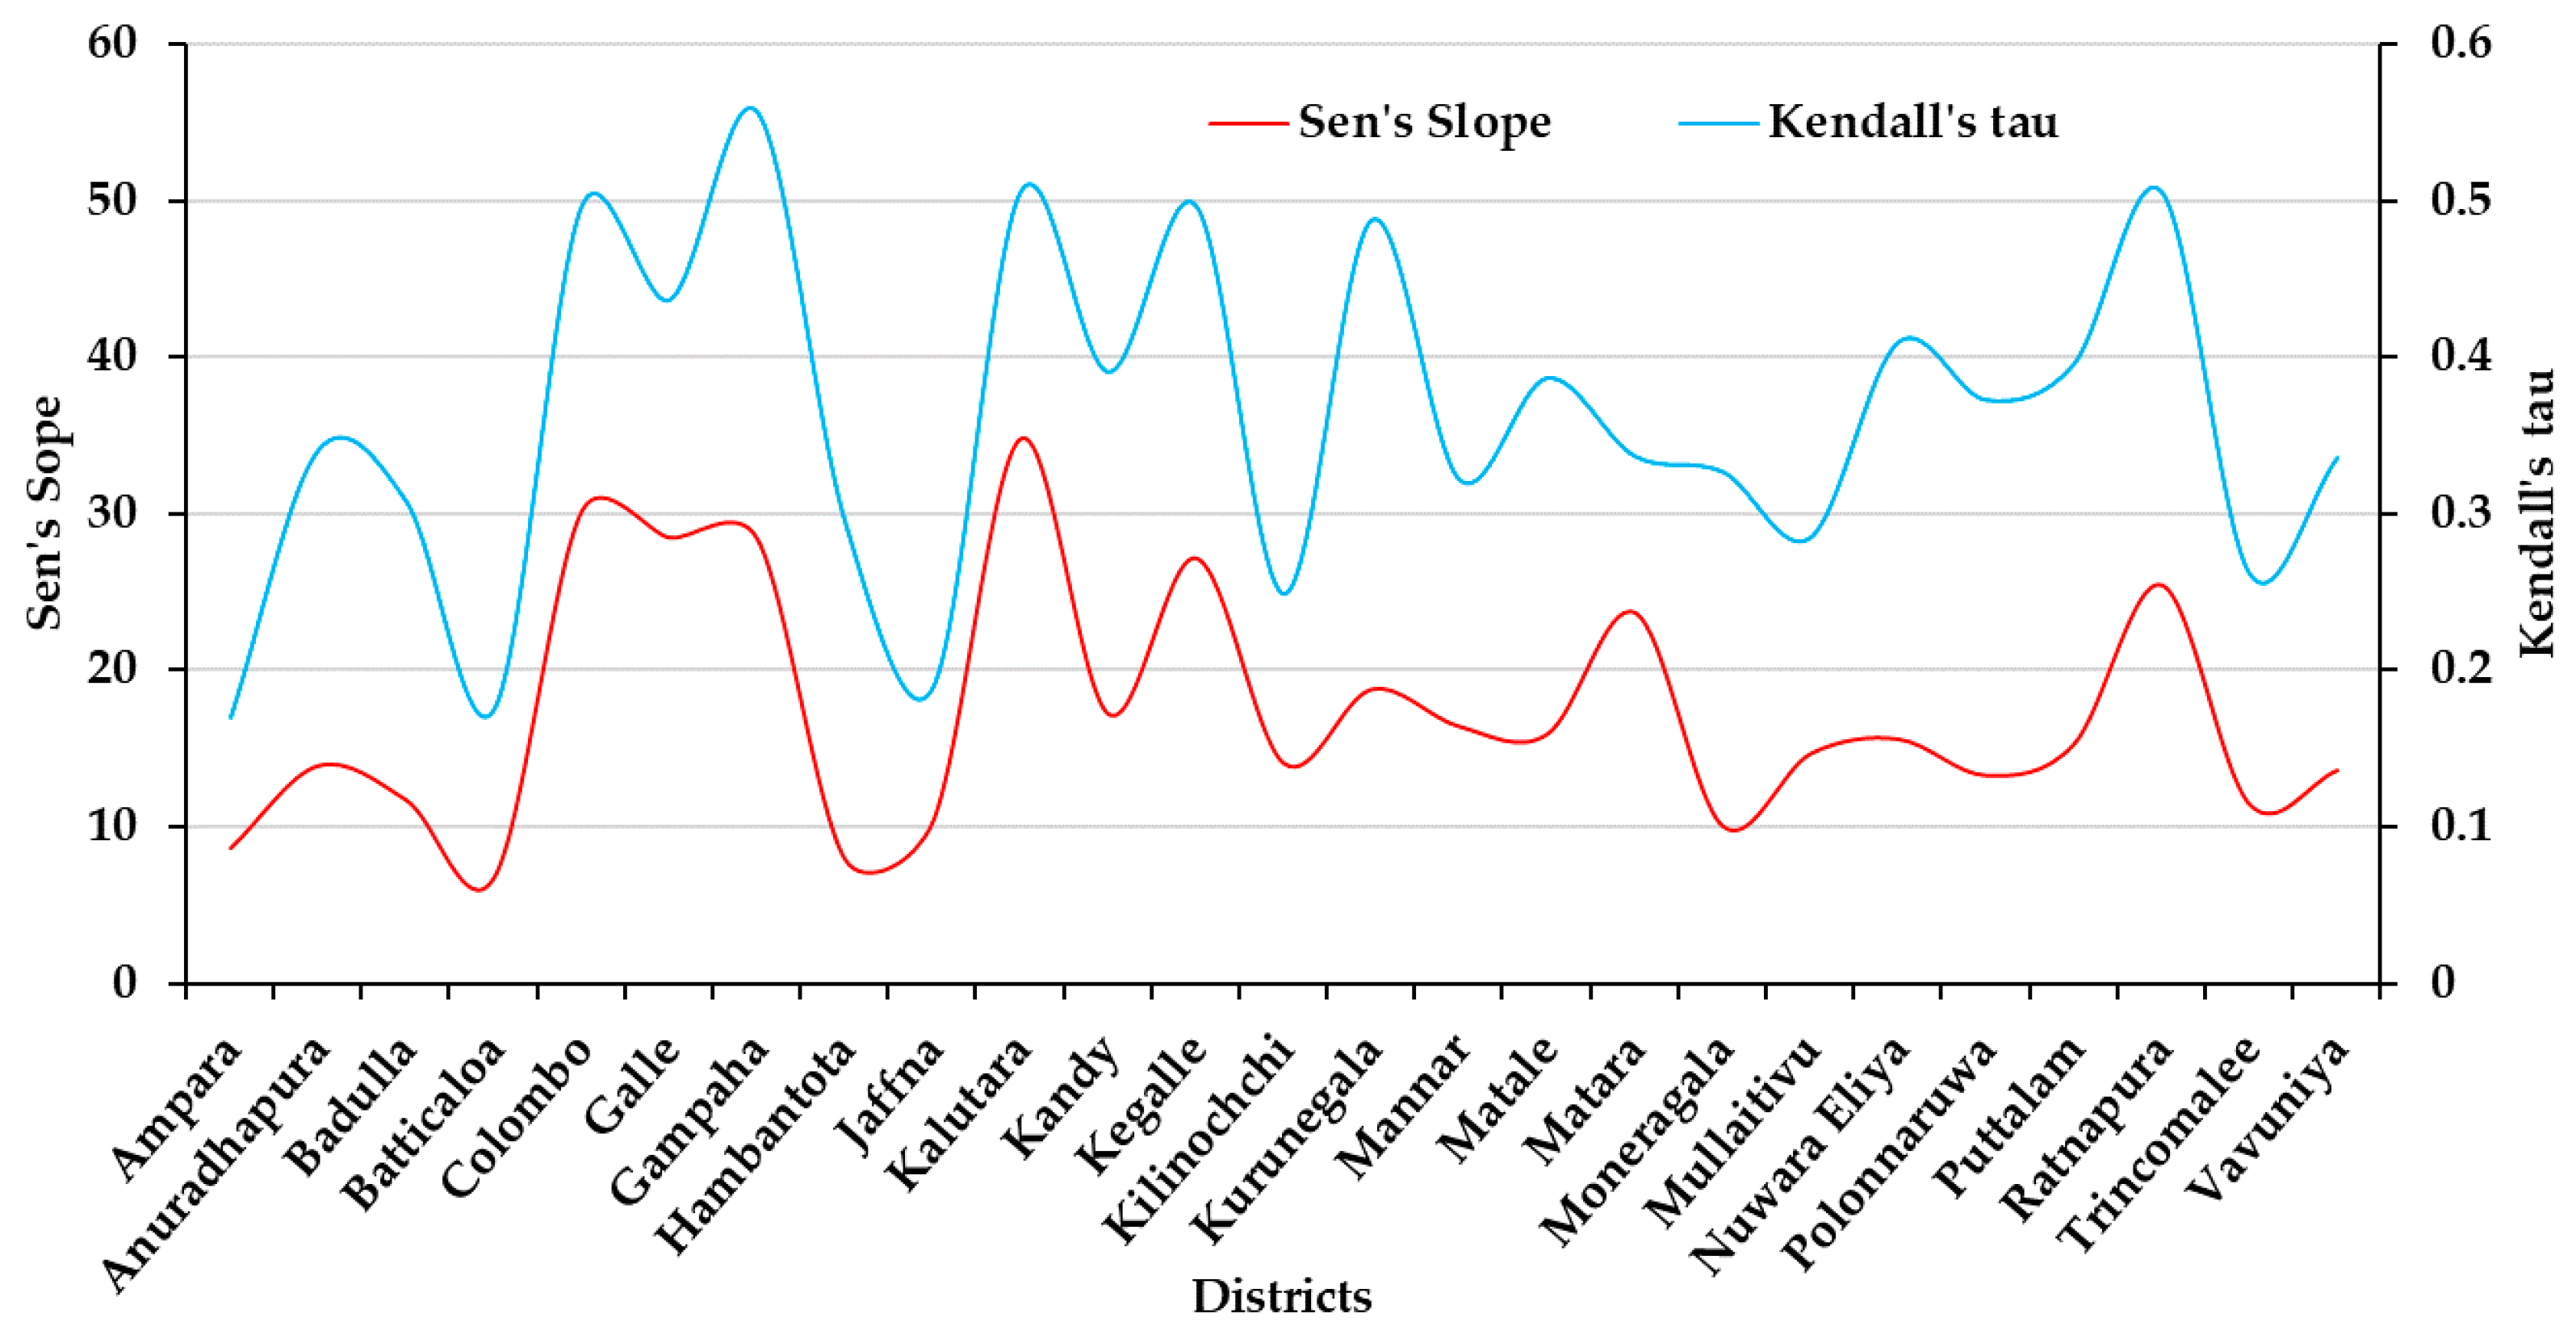
| Ampara | 0.17 | 8.64 | 0.143 |
| Anuradhapura | 0.34 | 13.91 | 0.009 |
| Badulla | 0.31 | 11.71 | 0.018 |
| Batticaloa | 0.18 | 6.75 | 0.181 |
| Colombo | 0.50 | 30.22 | 0.0001 |
| Galle | 0.44 | 28.51 | 0.001 |
| Gampaha | 0.56 | 28.44 | 0.0001 |
| Hambantota | 0.30 | 7.91 | 0.023 |
| Jaffna | 0.19 | 10.34 | 0.148 |
| Kalutara | 0.51 | 34.85 | 0.000 |
| Kandy | 0.39 | 17.22 | 0.003 |
| Kegalle | 0.50 | 27.20 | 0.000 |
| Kilinochchi | 0.25 | 14.06 | 0.056 |
| Kurunegala | 0.49 | 18.80 | 0.001 |
| Mannar | 0.32 | 16.42 | 0.013 |
| Matale | 0.39 | 15.94 | 0.003 |
| Matara | 0.34 | 23.71 | 0.004 |
| Moneragala | 0.33 | 10.04 | 0.012 |
| Mullaitivu | 0.29 | 14.69 | 0.028 |
| Nuwara Eliya | 0.41 | 15.62 | 0.002 |
| Polonnaruwa | 0.37 | 13.29 | 0.004 |
| Puttalam | 0.40 | 15.29 | 0.002 |
| Ratnapura | 0.51 | 25.48 | 0.000 |
| Trincomalee | 0.26 | 11.45 | 0.044 |
| Vavuniya | 0.34 | 13.62 | 0.010 |
| Climate Zone | K-Tau | Sen’s Slope | p-Value |
|---|---|---|---|
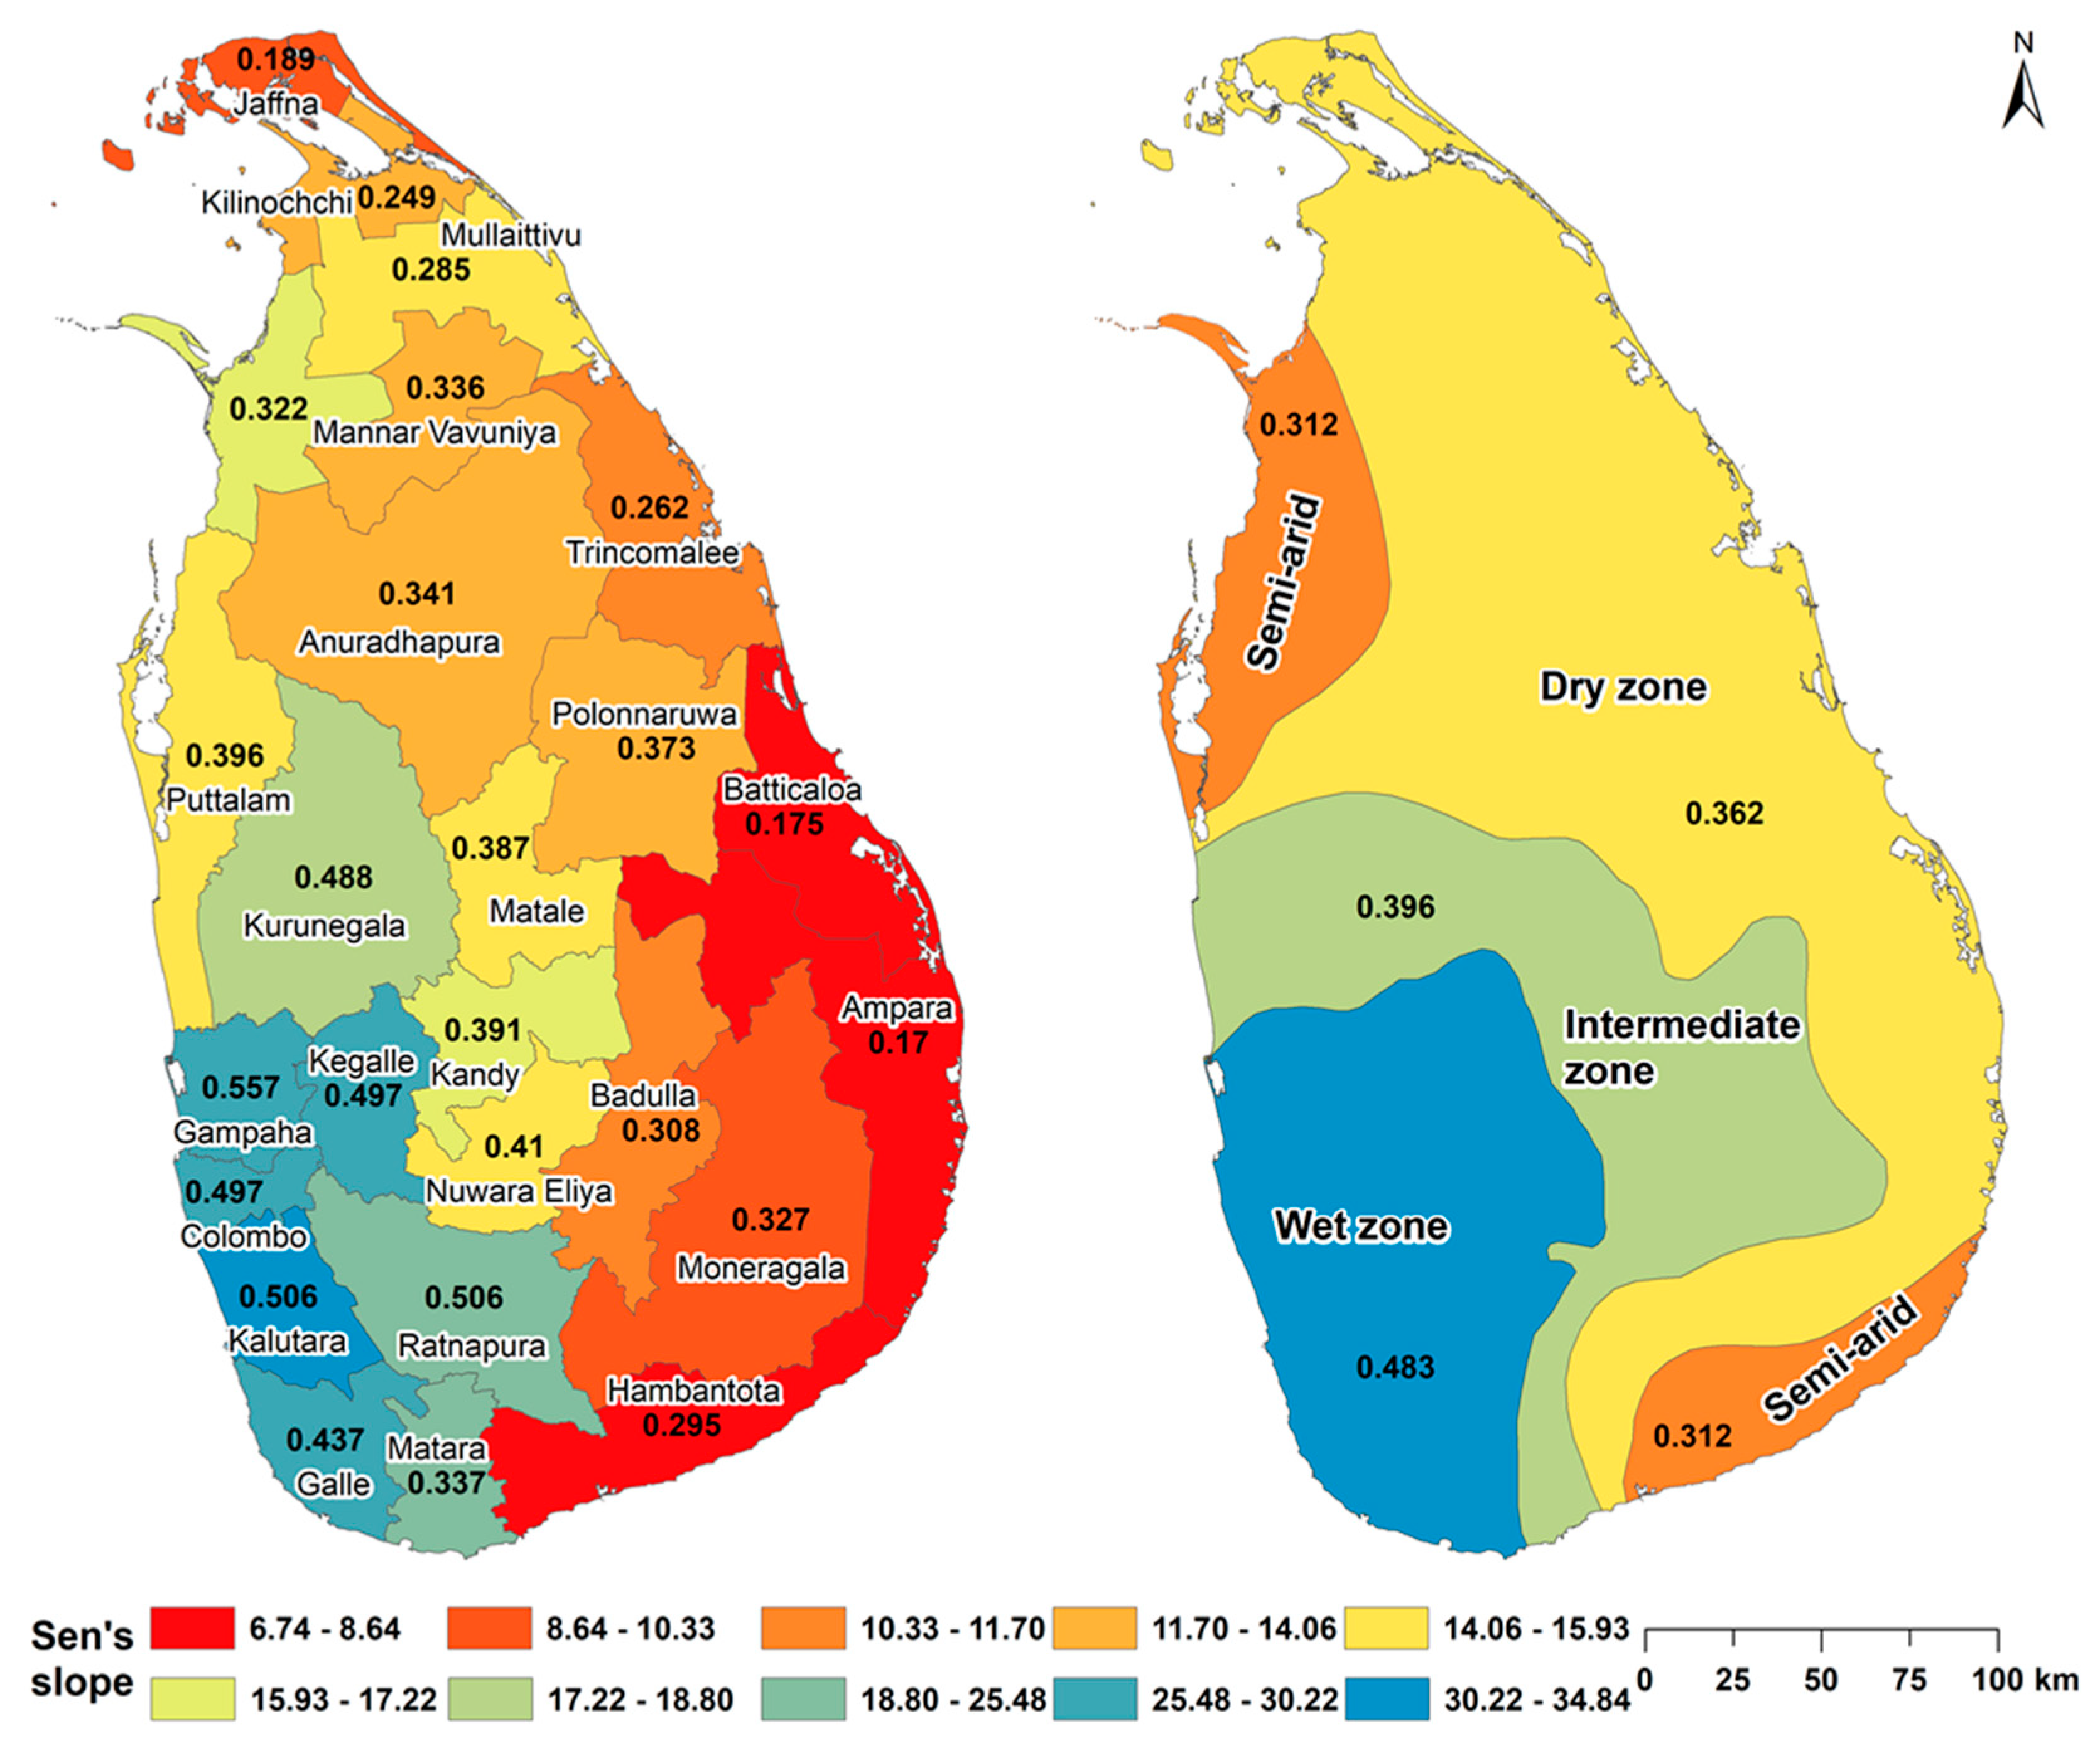
| Dry | 14.521 | 0.362 | 0.016 |
| Wet | 31.301 | 0.483 | 0.001 |
| Intermediate | 17.270 | 0.396 | 0.009 |
| Semi-Arid | 11.549 | 0.312 | 0.022 |
| District | SWM | NEM | FIM | SIM | ||||||||
|---|---|---|---|---|---|---|---|---|---|---|---|---|
| K-Tau | p-Value | Sen’s | K-Tau | p-Value | Sen’s | K-Tau | p-Value | Sen’s | K-Tau | p-Value | Sen’s | |
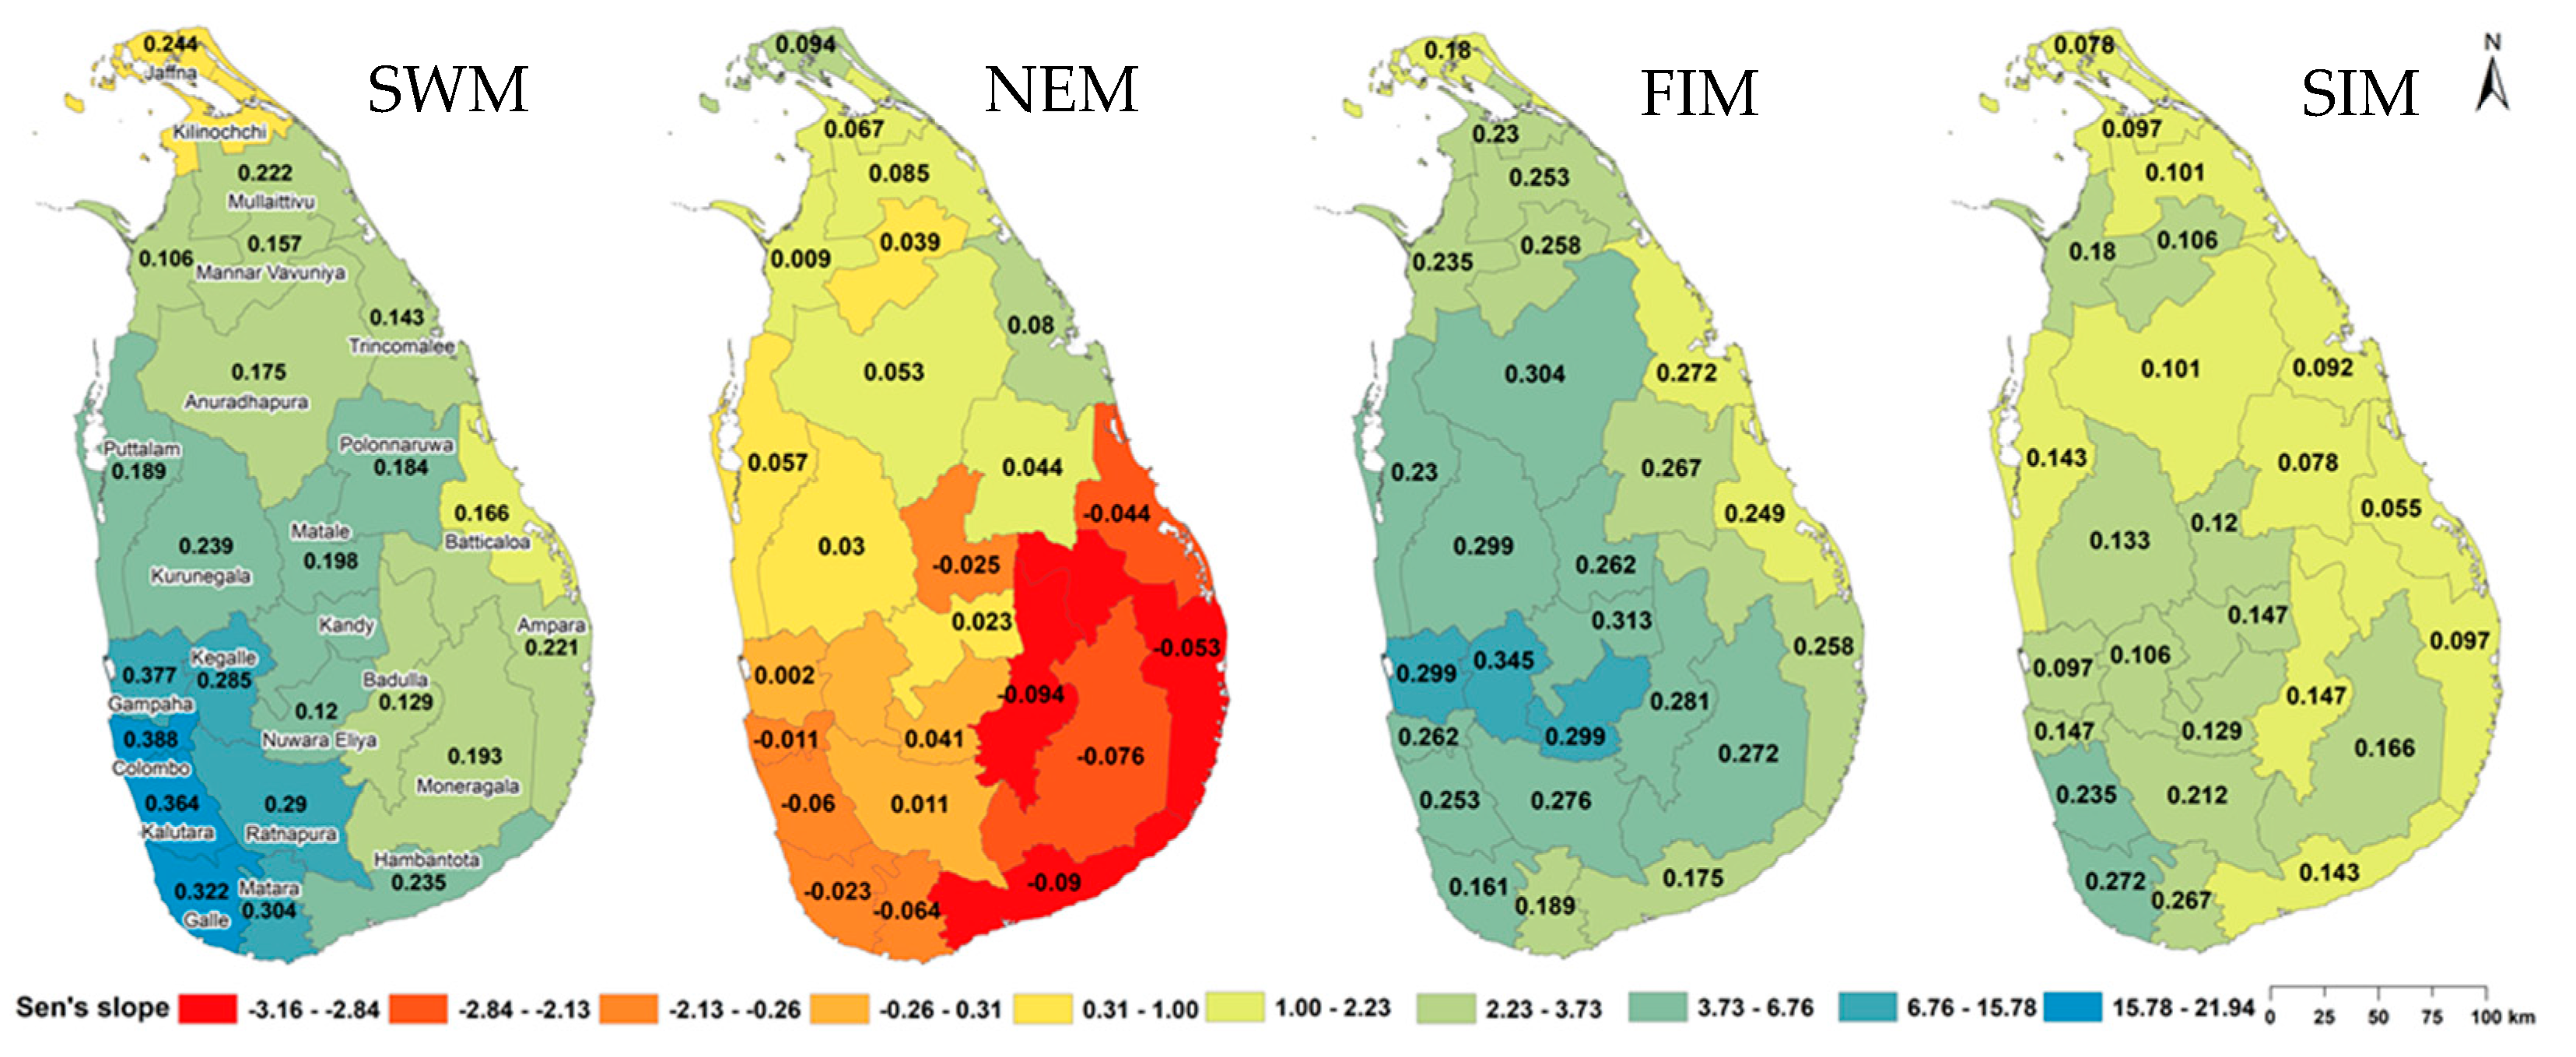
| Ampara | 0.221 | 0.090 | 3.159 | −0.053 | 0.695 | −2.981 | 0.258 | 0.048 | 2.982 | 0.097 | 0.464 | 2.845 |
| Anuradhapura | 0.175 | 0.181 | 3.735 | 0.053 | 0.695 | 1.430 | 0.304 | 0.019 | 4.099 | 0.101 | 0.443 | 2.578 |
| Badulla | 0.129 | 0.326 | 2.667 | −0.094 | 0.475 | −2.848 | 0.281 | 0.031 | 5.312 | 0.147 | 0.261 | 3.144 |
| Batticaloa | 0.166 | 0.205 | 1.698 | −0.044 | 0.748 | −2.583 | 0.249 | 0.056 | 2.106 | 0.055 | 0.682 | 1.403 |
| Colombo | 0.377 | 0.004 | 18.650 | −0.011 | 0.943 | −0.357 | 0.262 | 0.044 | 6.369 | 0.147 | 0.261 | 6.287 |
| Galle | 0.322 | 0.013 | 17.665 | −0.023 | 0.872 | −0.488 | 0.161 | 0.218 | 4.065 | 0.272 | 0.037 | 8.020 |
| Gampaha | 0.377 | 0.004 | 15.782 | 0.002 | 1.000 | 0.000 | 0.299 | 0.021 | 7.244 | 0.097 | 0.464 | 4.628 |
| Hambantota | 0.235 | 0.072 | 4.092 | −0.090 | 0.498 | −3.166 | 0.175 | 0.181 | 2.298 | 0.143 | 0.276 | 2.832 |
| Jaffna | 0.244 | 0.061 | 1.001 | 0.094 | 0.475 | 3.661 | 0.180 | 0.169 | 1.272 | 0.078 | 0.556 | 2.378 |
| Kalutara | 0.364 | 0.005 | 21.943 | −0.060 | 0.665 | −1.137 | 0.253 | 0.042 | 5.967 | 0.235 | 0.067 | 9.779 |
| Kandy | 0.157 | 0.232 | 5.224 | 0.023 | 0.872 | 0.892 | 0.313 | 0.016 | 6.699 | 0.147 | 0.261 | 3.865 |
| Kegalle | 0.285 | 0.028 | 11.381 | 0.009 | 0.957 | 0.052 | 0.345 | 0.008 | 9.395 | 0.106 | 0.422 | 5.155 |
| Kilinochchi | 0.184 | 0.159 | 0.978 | 0.067 | 0.617 | 2.823 | 0.230 | 0.077 | 2.646 | 0.097 | 0.464 | 2.761 |
| Kurunegala | 0.239 | 0.066 | 6.769 | 0.030 | 0.830 | 0.477 | 0.299 | 0.021 | 5.967 | 0.133 | 0.309 | 3.893 |
| Mannar | 0.106 | 0.422 | 2.362 | 0.009 | 0.454 | 2.231 | 0.235 | 0.072 | 3.524 | 0.180 | 0.169 | 5.005 |
| Matale | 0.198 | 0.129 | 5.816 | −0.025 | 0.853 | −0.265 | 0.262 | 0.044 | 5.132 | 0.120 | 0.363 | 3.843 |
| Matara | 0.304 | 0.019 | 14.600 | −0.064 | 0.630 | −0.829 | 0.189 | 0.148 | 3.520 | 0.267 | 0.040 | 6.040 |
| Moneragala | 0.193 | 0.139 | 3.051 | −0.076 | 0.568 | −2.137 | 0.272 | 0.037 | 4.446 | 0.166 | 0.205 | 4.146 |
| Mullaitivu | 0.221 | 0.090 | 2.381 | 0.085 | 0.521 | 2.873 | 0.253 | 0.052 | 3.486 | 0.101 | 0.443 | 2.556 |
| Nuwara Eliya | 0.120 | 0.363 | 4.352 | 0.041 | 0.762 | 0.312 | 0.299 | 0.021 | 6.786 | 0.129 | 0.326 | 4.274 |
| Polonnaruwa | 0.184 | 0.159 | 4.765 | 0.044 | 0.748 | 1.092 | 0.267 | 0.040 | 3.370 | 0.078 | 0.556 | 2.964 |
| Puttalam | 0.189 | 0.148 | 4.016 | 0.057 | 0.669 | 0.958 | 0.230 | 0.077 | 4.249 | 0.143 | 0.276 | 3.163 |
| Ratnapura | 0.290 | 0.026 | 10.826 | 0.011 | 0.943 | 0.299 | 0.276 | 0.034 | 6.407 | 0.212 | 0.104 | 6.487 |
| Trincomalee | 0.143 | 0.276 | 2.830 | 0.080 | 0.544 | 3.737 | 0.272 | 0.037 | 2.027 | 0.092 | 0.486 | 1.723 |
| Vavuniya | 0.157 | 0.232 | 3.577 | 0.039 | 0.775 | 0.664 | 0.258 | 0.048 | 3.554 | 0.106 | 0.422 | 3.989 |
References
- Intergovernmental Panel on Climate Change (IPCC). Climate Change 2007—The Physical Science Basis: Working Group; Cambridge University Press: Cambridge, UK, 2007.
- Intergovernmental Panel on Climate Change (IPCC). Climate Change 2007—Impacts, Adaptation and Vulnerability; Cambridge University Press: Cambridge, UK, 2007.
- Intergovernmental Panel on Climate Change (IPCC). Climate Change 2013—The Physical Science Basis; Cambridge University Press: Cambridge, UK; New York, NY, USA, 2013.
- Bureau of Meteorogy; CSIRO. The State of the Climate Report; Australian Government: Canberra, ACT, Australia, 2014.
- Banholzer, S.; Kossin, J.; Donner, S. The Impact of Climate Change on Natural Disasters. In Reducing Disaster: Early Warning Systems for Climate Change; Singh, A., Zommers, Z., Eds.; Springer: Dordrecht, The Netherlands, 2014. [Google Scholar] [CrossRef]
- New, M.; Todd, M.; Hulme, M.; Jones, P. Precipitation measurements and trends in the twentieth century. Int. J. Climatol. 2001, 21, 1899–1922. [Google Scholar] [CrossRef]
- Lawrimore, J.H.; Halpert, M.S.; Bell, G.D.; Menne, M.J.; Lyon, B.; Schnell, R.C.; Gleason, K.L.; Easterling, D.R.; Thiaw, W.; Wright, W.J.; et al. Climate assessment for 2000. Bull. Am. Meteorol. Soc. 2001, 82, 1–39. [Google Scholar] [CrossRef] [Green Version]
- Brunetti, M.; Maugeri, M.; Monti, F.; Nanni, T. Temperature and precipitation variability in Italy in the last two centuries from homogenised instrumental time series. Int. J. Climatol. 2006, 26, 345–381. [Google Scholar] [CrossRef]
- Norrant, C.; Douguedroit, A. Monthly and daily precipitation trends in the Mediterranean (1950–2000). Theor. Appl. Climatol. 2006, 83, 89–106. [Google Scholar] [CrossRef]
- Gonzalez-Hidalgo, J.C.; Brunetti, M.; De Luıs, M. A new tool for monthly precipitation analysis in Spain: MOPREDAS database (monthly precipitation trends December 1945–November 2005). Int. J. Climatol. 2011, 31, 715–731. [Google Scholar] [CrossRef]
- Caloiero, T.; Coscarelli, R.; Ferrari, E.; Mancini, M. Precipitation change in Southern Italy linked to global scale oscillation indexes. Nat. Hazards Earth Syst. Sci. 2011, 11, 1683–1694. [Google Scholar] [CrossRef]
- Sharma, K.P.; Moore, B.; Vorosmarty, C.J. Anthropogenic, climatic, and hydrologic trends in the Kosi basin, Himalaya. Clim. Chang. 2000, 47, 141–165. [Google Scholar] [CrossRef]
- Hamilton, J.P.; Whitelaw, G.S.; Fenech, A. Mean annual temperature and total annual precipitation trends at Canadian biosphere reserves. Environ. Monit. Assess. 2001, 67, 239–275. [Google Scholar] [CrossRef] [PubMed]
- Boyles, R.P.; Raman, S. Analysis of climate trends in North Carolina (1949–1998). Environ. Int. 2003, 29, 263–275. [Google Scholar] [CrossRef] [Green Version]
- Rao, V.B.; Franchito, S.H.; Santo, C.M.E.; Gan, M. An update on the rainfall characteristics of Brazil: Seasonal variations and trends in 1979–2011. Int. J. Climatol. 2016, 36, 291–302. [Google Scholar] [CrossRef]
- Parthasarathy, B.; Kumar, K.R.; Munot, A.A. Homogeneous Indian monsoon rainfall—Variability and prediction. Proc. Indian Acad. Sci. Earth Planet. Sci. 1993, 102, 121–155. [Google Scholar]
- Srivatsava, H.N. Decadal trends in climate over India. Mausam 1992, 43, 7–20. [Google Scholar]
- Goswami, B.N.; Venugopal, V.; Sengupta, D.; Madhusoodanan, M.S.; Xavier, P.K. Increasing trend of extreme rain events over India in a warming environment. Science 2006, 314, 1442–1445. [Google Scholar] [CrossRef] [PubMed] [Green Version]
- Guhathakurta, P.; Rajeevan, M. Trends in the Rainfall Pattern over India; NCC Research Report No 2/2006; National Climate Centre, India Meteorological Department: Delhi, India, 2006; p. 23. [Google Scholar]
- Ranagalage, M.; Ratnayake, S.S.; Dissanayake, D.; Kumar, L.; Wickremasinghe, H.; Vidanagama, J.; Cho, H.; Udagedara, S.; Jha, K.K.; Simwanda, M.; et al. Spatiotemporal Variation of Urban Heat Islands for Implementing Nature-Based Solutions: A Case Study of Kurunegala, Sri Lanka. ISPRS Int. J. Geo-Inf. 2020, 9, 461. [Google Scholar] [CrossRef]
- Nisansala, W.D.S.; Abeysingha, N.S.; Islam, A.; Bandara, A.M.K.R. Recent rainfall trend over Sri Lanka (1987–2017). Int. J. Climatol. 2020, 40, 3417–3435. [Google Scholar] [CrossRef]
- Caloiero, T. Analysis of rainfall trend in New Zealand. Environ. Earth Sci. 2015, 73, 6297–6310. [Google Scholar] [CrossRef]
- Shishutosh, B.; Nitin, M.; Ng, A.W.M.; Perera, B.J.C. Rainfall trend and its implications for water resource management within the Yarra River catchment, Australia. Hydrol. Process. 2013, 27, 1727–1738. [Google Scholar]
- Naveendrakumar, G.; Vithanage, M.; Kwon, H.H.; Iqbal, M.C.M.; Pathmarajah, S.; Obeysekera, J. Five Decadal Trends in Averages and Extremes of Rainfall and Temperature in Sri Lanka. Adv. Metrol. 2018, 2018. [Google Scholar] [CrossRef]
- Clift, P.D.; Plumb, R.A. The Asian Monsoon: Causes, History and Effects; Cambridge University Press: Cambridge, UK, 2008. [Google Scholar]
- Rasmussen, E.M.; Carpenter, T.H. The relationship between eastern equatorial Pacific sea surface temperature and rainfall over India and Sri Lanka. Mon. Weather Rev. 1982, 110, 354–384. [Google Scholar] [CrossRef] [Green Version]
- Ropelewski, C.F.; Halpert, M.S. Global and regional scale precipitation patterns associated with the El Niño/Southern Oscillation (ENSO). Mon. Weather Rev. 1987, 115, 1606–1626. [Google Scholar] [CrossRef] [Green Version]
- Suppiah, R. Spatial and temporal variations in the relationships between the Southern Oscillation phenomenon and the rainfall of Sri Lanka. Int. J. Climatol. 1996, 16, 1391–1407. [Google Scholar] [CrossRef]
- Zubair, L.; Siriwardhana, M.; Chandimala, J.; Yahiya, Z. Predictability of Sri Lankan rainfall based on ENSO. Int. J. Climatol. 2008, 28, 91–101. [Google Scholar] [CrossRef] [Green Version]
- Geethalakshmi, V.; Yatagai, A.; Palanisamy, K.; Umetsu, C. Impact of ENSO and the Indian Ocean Dipole on the north-east monsoon rainfall of Tamil Nadu State in India. Hydrol. Process. Int. J. 2009, 23, 633–647. [Google Scholar] [CrossRef]
- Chandimala, J.; Zubair, L. Predictability of stream flow and rainfall based on ENSO for water resources management in Sri Lanka. J. Hydrol. 2007, 335, 303–312. [Google Scholar] [CrossRef] [Green Version]
- Kumar, P.P.; Rajagopalan, B.; Cane, M.A. On the weakening relationship between the Indian Monsoon and ENSO. Science 1999, 284, 2156–2159. [Google Scholar] [CrossRef] [Green Version]
- Suppiah, R. Four types of relationships between rainfall and paddy production in Sri Lanka. GeoJournal 1985, 10, 109–118. [Google Scholar] [CrossRef]
- Zubair, L. El Niño-Southern Oscillation influences on rice production in Sri Lanka. Int. J. Climatol. 2002, 22, 249–260. [Google Scholar] [CrossRef] [Green Version]
- Farmer, B.H. Green Revolution? Technology and Change in Rice-Growing Areas of Tamil Nadu and Sri Lanka; Farmer, B.H., Ed.; MacMillan: London, UK, 1977. [Google Scholar]
- Disaster Management Centre. Drought Situation Report—Sri Lanka, 30th May 2017; Ministry of Public Administration and Disaster Management: Colombo, Sri Lanka, 2017.
- Prasanna, R.P.I.R. Economic costs of drought and farmers’ adaptation strategies: Evidence from Sri Lanka. Sri Lanka J. Econ. Res. 2018, 5, 61–79. [Google Scholar]
- Somaratne, S.; Dhanapala, A.H. Potential impact of global climate change on forest distribution in Sri Lanka. Water Air Soil Pollut. 1996, 92, 129–135. [Google Scholar]
- Bandara, C.M.; Wickramagamage, P. Climate Change and Its Impact on Upper 867 Watershed of the Hill Country of Sri Lanka. In Proceedings of the International Conference on Sustainable Water Resources Management in Changing Environment of the Monsoon Region, Sri Lanka, Colombo, 17–19 November 2004. [Google Scholar]
- Kayane, I.; Nakagawa, K.; Edagawa, H.; Bandara, C.M. Hydrological Consequences of Global Warming Revealed by the Century-Long Climatological Data in Sri Lanka and Southwest India. In Report of Special Research Project on Global Environmental Change 3; University of Tsukuba: Ibaraki, Japan, 1998. [Google Scholar]
- Jayawardene, H.K.W.I.; Jayawardena, D.R.; Sonnadara, D.U.J. Interannual variability of 801 precipitation in Sri Lanka. J. Natl. Sci. Found. Sri Lanka 2015, 43, 75–82. [Google Scholar] [CrossRef] [Green Version]
- Karunathilaka, K.L.A.A.; Dabare, H.K.V.; Nandalal, K.D.W. Changes in Rainfall in Sri 821 Lanka during 1966–2015. J. Inst. Eng. Sri Lanka 2017, 50, 39–48. [Google Scholar]
- De Costa, W.A.J.M. Climate change in Sri Lanka: Myth or reality? Evidence from long-term meteorological data. J. Natl. Sci. Found. Sri Lanka 2008, 36, 63–88. [Google Scholar] [CrossRef] [Green Version]
- Katsanos, D.; Retalis, A.; Tymvios, F.; Michaelides, S. Analysis of precipitation extremes based on satellite (CHIRPS) and in situ dataset over Cyprus. Nat. Hazadrs 2016. [Google Scholar] [CrossRef]
- Banerjee, A.; Chen, R.; Meadows, M.E.; Singh, R.B.; Mal, S.; Sengupta, D. An Analysis of Long-Term Rainfall Trends and Variability in the Uttarakhand Himalaya Using Google Earth Engine. Remote Sens. 2020, 12, 709. [Google Scholar] [CrossRef] [Green Version]
- Gebrechorkos, S.H.; Hülsmann, S.; Bernhofer, C. Long-term trends in rainfall and temperature using high-resolution climate datasets in East Africa. Sci. Rep. 2019, 9, 1–9. [Google Scholar] [CrossRef] [PubMed] [Green Version]
- Muthoni, F.K.; Odongo, V.M.; Ochieng, J.; Mugalavai, E.M.; Mourice, S.K.; Hoesche-Zeledon, I.; Mwila, M.; Bekunda, M. Long-term spatial-temporal trends and variability of rainfall over Eastern and Southern Africa. Theor. Appl. Climatol. 2019, 137, 1869–1882. [Google Scholar] [CrossRef] [Green Version]
- Wu, W.; Li, Y.; Luo, X.; Zhang, Y.; Ji, X.; Li, X. Performance evaluation of the CHIRPS precipitation dataset and its utility in drought monitoring over Yunnan Province, China. Geomat. Nat. Hazards Risk 2019, 10, 2145–2162. [Google Scholar] [CrossRef] [Green Version]
- Funk, C.; Peterson, P.; Landsfeld, M.; Pedreros, D.; Verdin, J.; Shukla, S.; Husak, G.; Rowland, J.; Harrison, L.; Hoell, A.; et al. The climate hazards infrared precipitation with stations—A new environmental record for monitoring extremes. Sci. Data 2015, 2, 1–21. [Google Scholar] [CrossRef] [Green Version]
- Dandridge, C.; Lakshmi, V.; Bolten, J.; Srinivasan, R. Evaluation of Satellite-Based Rainfall Estimates in the Lower Mekong River Basin (Southeast Asia). Remote Sens. 2019, 11, 2709. [Google Scholar] [CrossRef] [Green Version]
- Pandey, V.; Srivastava, P.K.; Singh, S.K.; Petropoulos, G.P.; Mall, K.R. Drought Identification and Trend Analysis Using Long-Term CHIRPS Satellite Precipitation Product in Bundelkhand, India. Sustainability 2021, 13, 1042. [Google Scholar] [CrossRef]
- Burt, T.P.; Weerasinghe, K.D.N. Rainfall distributions in Sri Lanka in time and space: An analysis based on daily rainfall data. Climate 2014, 2, 242–263. [Google Scholar] [CrossRef] [Green Version]
- Zubair, L. El Niño-southern oscillation influences on the Mahaweli streamflow in Sri Lanka. Int. J. Climatol. 2003, 23, 91–102. [Google Scholar] [CrossRef] [Green Version]
- Thambyahpillay, G. The rainfall rhythm in Ceylon. Univ. Ceylon Rev. 1954, 12, 223–274. [Google Scholar]
- Wickramagamage, P. Seasonality and spatial pattern of rainfall of Sri Lanka: Explanatory factor analysis. Int. J. Climatol. 2010, 30, 1235–1245. [Google Scholar] [CrossRef]
- Disaster Management Center. Drought Situation Report—Sri Lanka, 17th May 2018; Ministry of Public Administration and Disaster Management: Colombo, Sri Lanka, 2018.
- Disaster Management Center. Drought Situation report—Sri Lanka, 26th May 2016; Ministry of Public Administration and Disaster Management: Colombo, Sri Lanka, 2016.
- Alahacoon, N.; Matheswaran, K.; Pani, P.; Amarnath, G. A Decadal Historical Satellite Data and Rainfall Trend Analysis (2001–2016) for Flood Hazard Mapping in Sri Lanka. Remote Sens. 2018, 10, 448. [Google Scholar] [CrossRef] [Green Version]
- Gadgil, A.; Dhorde, A. Temperature trends in twentieth century at Pune, India. Atmos. Environ. 2005, 39, 6550–6556. [Google Scholar] [CrossRef]
- Helsel, D.R.; Hirsch, R.M. Statistical Methods in Water Resources; Elsevier Science: Amsterdam, The Netherlands, 1992. [Google Scholar]
- Sen, P.K. Estimates of the regression coefficient based on Kendall’s tau. J. Am. Stat. Assoc. 1968, 63, 1379–1389. [Google Scholar] [CrossRef]
- Maduranga, U.G.D.; Edirisinghe, M.; Gamage, L.V. Annual variation trend of lightning flash activities over Sri Lanka. Int. J. World Sci. News 2018, 114, 256–264. [Google Scholar]


| District | Average | Max | Min | STD | CV | Median | 1st Quartile | 3rd Quartile |
|---|---|---|---|---|---|---|---|---|
| Colombo | 2993.5 | 3982.5 | 2329.6 | 404.5 | 13.5 | 2968.3 | 2632.1 | 3184.5 |
| Galle | 2997.6 | 4319.0 | 2257.1 | 468.2 | 15.6 | 2940.0 | 2623.2 | 3285.5 |
| Gampaha | 2554.2 | 3483.0 | 2094.6 | 351.9 | 13.8 | 2581.6 | 2211.3 | 2791.8 |
| Kalutara | 3340.2 | 4489.4 | 2628.5 | 480.7 | 14.4 | 3275.5 | 2995.0 | 3672.8 |
| Kandy | 2389.6 | 2984.4 | 1680.0 | 297.9 | 12.5 | 2420.5 | 2229.7 | 2603.3 |
| Kegalle | 2942.1 | 3919.7 | 2332.8 | 373.1 | 12.7 | 2909.1 | 2662.9 | 3199.6 |
| Matara | 2589.8 | 3667.0 | 1756.4 | 398.0 | 15.4 | 2513.3 | 2302.8 | 2824.3 |
| Nuwara Eliya | 2509.3 | 3135.8 | 1713.1 | 304.4 | 12.1 | 2548.6 | 2373.3 | 2691.0 |
| Ratnapura | 2759.7 | 3531.3 | 2076.8 | 343.5 | 12.4 | 2743.0 | 2556.7 | 2970.9 |
| Badulla | 2082.1 | 2716.2 | 1364.0 | 280.9 | 13.5 | 2119.0 | 1974.2 | 2224.1 |
| Kurunegala | 1762.0 | 2345.1 | 1354.6 | 251.8 | 14.3 | 1734.6 | 1626.4 | 1945.8 |
| Matale | 2063.7 | 2768.3 | 1494.9 | 308.3 | 14.9 | 2074.2 | 1933.3 | 2188.8 |
| Ampara | 1697.9 | 2597.3 | 1000.2 | 307.1 | 18.1 | 1709.6 | 1620.4 | 1838.9 |
| Anuradhapura | 1469.7 | 2161.0 | 1066.5 | 267.5 | 18.2 | 1421.8 | 1323.6 | 1602.7 |
| Batticaloa | 1540.3 | 2485.4 | 911.8 | 311.9 | 20.2 | 1547.3 | 1371.7 | 1708.8 |
| Jaffna | 1118.4 | 1690.0 | 614.6 | 282.4 | 25.3 | 1087.0 | 984.1 | 1310.4 |
| Kilinochchi | 1109.7 | 1695.3 | 565.7 | 287.7 | 25.9 | 1114.5 | 911.2 | 1287.0 |
| Moneragala | 1698.4 | 2267.8 | 1043.4 | 244.1 | 14.4 | 1755.4 | 1619.2 | 1819.0 |
| Mullaitivu | 1357.4 | 2081.3 | 809.3 | 317.9 | 23.4 | 1351.0 | 1156.5 | 1537.6 |
| Polonnaruwa | 1795.2 | 2689.1 | 1223.8 | 312.0 | 17.4 | 1750.7 | 1626.6 | 1863.1 |
| Trincomalee | 1511.8 | 2468.3 | 893.0 | 312.0 | 20.6 | 1433.7 | 1295.2 | 1707.9 |
| Vavuniya | 1475.4 | 2210.2 | 994.5 | 289.2 | 19.6 | 1448.3 | 1295.3 | 1637.0 |
| Hambantota | 1393.4 | 1774.7 | 841.6 | 201.2 | 14.4 | 1398.2 | 1280.6 | 1510.4 |
| Puttalam | 1358.6 | 1847.0 | 1049.0 | 220.8 | 16.3 | 1329.6 | 1199.1 | 1516.1 |
| Mannar | 1258.0 | 1821.4 | 776.6 | 262.1 | 20.8 | 1257.6 | 1076.2 | 1434.2 |
| Climate Zone | Average | Max | Min | STD | CV | Median | 1st Quartile | 3rd Quartile |
|---|---|---|---|---|---|---|---|---|
| Dry | 1520.6 | 2255.8 | 990.8 | 252.7 | 601.8 | 1492.5 | 1421.8 | 1632.5 |
| Wet | 2876.7 | 3719.1 | 2280.4 | 354.8 | 810.7 | 2863.0 | 2625.4 | 3100.7 |
| Intermediate | 1979.3 | 2454.1 | 1502.3 | 236.6 | 836.5 | 2012.7 | 1866.3 | 2108.7 |
| Semi-Arid | 1264.6 | 1697.4 | 873.2 | 189.0 | 669.2 | 1249.2 | 1170.2 | 1377.2 |
Publisher’s Note: MDPI stays neutral with regard to jurisdictional claims in published maps and institutional affiliations. |
© 2021 by the authors. Licensee MDPI, Basel, Switzerland. This article is an open access article distributed under the terms and conditions of the Creative Commons Attribution (CC BY) license (http://creativecommons.org/licenses/by/4.0/).
Share and Cite
Alahacoon, N.; Edirisinghe, M. Spatial Variability of Rainfall Trends in Sri Lanka from 1989 to 2019 as an Indication of Climate Change. ISPRS Int. J. Geo-Inf. 2021, 10, 84. https://0-doi-org.brum.beds.ac.uk/10.3390/ijgi10020084
Alahacoon N, Edirisinghe M. Spatial Variability of Rainfall Trends in Sri Lanka from 1989 to 2019 as an Indication of Climate Change. ISPRS International Journal of Geo-Information. 2021; 10(2):84. https://0-doi-org.brum.beds.ac.uk/10.3390/ijgi10020084
Chicago/Turabian StyleAlahacoon, Niranga, and Mahesh Edirisinghe. 2021. "Spatial Variability of Rainfall Trends in Sri Lanka from 1989 to 2019 as an Indication of Climate Change" ISPRS International Journal of Geo-Information 10, no. 2: 84. https://0-doi-org.brum.beds.ac.uk/10.3390/ijgi10020084