Technical Note

A Fine-Scale Mangrove Map of China Derived from 2-Meter Resolution Satellite Observations and Field Data

1
Land Satellite Remote Sensing Application Center (LASAC), Beijing 100048, China
2
Beijing Laboratory of Water Resources Security, College of Resource Environment and Tourism, Capital Normal University, Beijing 100048, China
3
LREIS, Institute of Geographic Sciences and Natural Resources Research, Chinese Academy of Sciences, Beijing 100101, China
*
Author to whom correspondence should be addressed.
ISPRS Int. J. Geo-Inf. 2021, 10(2), 92; https://0-doi-org.brum.beds.ac.uk/10.3390/ijgi10020092
Submission received: 9 December 2020 / Revised: 9 February 2021 / Accepted: 16 February 2021 / Published: 20 February 2021

Abstract

:
Mangrove forests are important ecosystems in the coastal intertidal zone, but China’s mangroves have experienced a large reduction in area from the 1950s, and the remaining mangrove forests are exhibiting increased fragmentation. A detailed mangrove dataset of China is crucial for mangrove ecosystem management and protection, but the fragmented mangrove patches are hardly mapped by medium resolution satellite imagery. To overcome these difficulties, we presented a fine-scale mangrove map for 2018 using the 2-meter resolution Gaofen-1 and Ziyuan-3 satellite imagery together with field data. We employed a hybrid method of object-based image analysis (OBIA), interpreter editing, and field surveying for mangrove mapping. The field survey route reached 9500 km, and 2650 patches were verified during the field work. Accuracy assessment by confusion matrix showed that the kappa coefficient reached 0.98, indicating a highly thematic accuracy of the mangrove dataset. Results showed the total area of mangrove forest in China for 2018 was 25,683.88 hectares, and approximately 91% of mangroves were found in the three provinces of Guangdong, Guangxi, and Hainan. About 64% of mangroves were distributed in or near the nature reserves established by national or local governments, which indicated that China’s mangroves were well protected in recent years. The new fine-scale mangrove dataset was freely shared together with this paper, and it can be used by local authorities and research groups for mangrove management and ecological planning.

1. Introduction

Mangrove forests are distributed in the tropical and subtropical areas of the world between approximately 30° N and 30° S latitude [1,2]. These forests consist of trees, shrubs, and palms that grow in harsh environmental settings including high salinity, high temperatures, extreme tides, high sedimentation, and muddy anaerobic soils [1]. Mangrove forests provide a wide range of ecosystem services such as shoreline stabilization, water purification, the provision of biological diversity and nursery habitats for marine fisheries, and they are important to the recreation and tourism industry [3,4,5,6].
The mangrove ecosystem is one of the most vulnerable ecosystems on Earth because of human disturbance and climate change. According to reports, 20–35% of global mangrove forest land has been lost due to deforestation since the 1980s [7,8]. The rapid loss of mangroves has forced forest managers and associated scientists to inventory and monitor their spatial extent. A number of efforts have been made for the extensive monitoring of mangrove forests from local to global scales [1,9,10,11,12,13,14,15,16,17,18,19,20] using imagery including optical, hyperspectral, radar, etc. The most influential datasets at a global scale were produced for the year 2000: the World Atlas of Mangroves (WAM10) by Spalding [10] and Mangrove Forests of the World (MFW) by Giri et al. [1]. Recently, Bunting et al. [21,22] released the mangrove dataset from the Global Mangrove Watch project (GMW), including the 2010 Global Baseline of Mangrove Extent (GMW2010) and the latest 2016 Global Mangrove Extent (GMW2016), which aims to provide geospatial information about mangrove extent and changes to the Ramsar Convention, national wetland practitioners, decision makers, and NGOs. These works have contributed to the research of mangrove carbon stocks and biodiversity as well as to the efforts of mangrove ecosystem conservation.
However, the above-mentioned mangrove forest maps in China are incomplete or outdated and cannot reflect the latest spatial distribution of mangroves. For example, only 3139 hectares (about 14%) of mangroves in China were mapped in the MFW dataset. This incomplete map of mangroves in China was propagated to the annual CGMFC-21 map [11] because they were generated using the 2000 MFW base map and other forest change data. In addition, there were a few gains in mangrove coverage in China over the last twenty years. The WAM10 and MFW map cannot reflect the recent mangrove distribution because they were generated using Landsat’s thematic mapper (TM) and enhanced thematic mapping (ETM+) data obtained between 1997 and 2003.
The coasts of China contain tropical, subtropical, and temperate zones, and it is an ideal area for studying the response of mangroves to global warming and the effects of human activities such as conservation, restoration, population growth, and rapid economic development [23]. Some studies have estimated the mangrove areas in China from the local [24,25,26,27,28,29,30,31] to the national scale [10,19,32,33,34,35]. However, these estimates vary widely at the national scale from 19,788 hectares to 24,602 hectares. The remotely sensed imagery used in these mangrove extent estimates were mainly Landsat data at a resolution of 30 m. In fact, the mangroves along the coast of China were fragmented due to human disturbances. Therefore, it is a challenging task to accurately map mangrove forests in China using medium resolution remotely sensed imagery, and mapping mangrove extent using high spatial resolution remote sensing images at a finer scale will be necessary.
From the beginning of the 21st century, high spatial resolution (HSR) satellite remote sensing technology has developed rapidly. A large amount of research using high spatial resolution imagery has focused on mangrove extent mapping [36], mangrove species identification [37], biomass estimation [38,39], and hurricane disaster loss assessment [40]. However, these applications generally focused on areas with a small spatial range, and mangrove mapping applications on regions with wide spatial range using HSR imagery were rarely reported. A fine-scale, high-precision mangrove distribution dataset is important for mangrove conservation policy development, restoration planning, and ecosystem status monitoring, yet the commercial HSR image data is costly for wide-range mangrove mapping and monitoring. With the construction of China’s civil space infrastructure, China has gradually launched several satellites with optical sensors at relatively fine spatial resolutions [41,42], including Ziyuan-3, Gaofen-1, Gaofen-2, and Gaofen-6. At present, it could guarantee the annual national coverage of 2-meter-scale cloud-free images, which would provide a strong image basis for mangrove monitoring.
The object-based image analysis (OBIA) techniques employ image segmentation and machine learning methods for information extraction and patch delineation from high resolution imagery. Recently, several studies have used the OBIA method to analyze high-resolution images to extract mangrove information, including mangrove extent [13,17], mangrove tree species [43,44], biophysical parameters [45], etc. Most of the research was limited to method testing in a small test region, and there was a lack of mangrove mapping applications in large areas using high spatial resolution imagery and OBIA approaches.
In this study, we have developed a hybrid method that combines object-based image analysis, interpreter editing, and field surveying. This method was applied to fine-scale mangrove mapping over a large area (10,000 km of coastline). The objectives of this study were (1) to generate a fine-scale benchmark inventory of mangroves in China (MC2018) [46] using Ziyuan-3 and Gaofen-1 satellite imagery; (2) to present a new hybrid method of object-based image analysis and field verification for mangrove mapping; (3) to compare the MC2018 dataset with existing mangrove datasets both quantitatively and visually; and (4) to discuss the advantages of 2 m images for mangrove mapping, the confusions between mangroves and other vegetation, and the limitations and caveats of the MC2018 dataset.

2. Materials and Methods
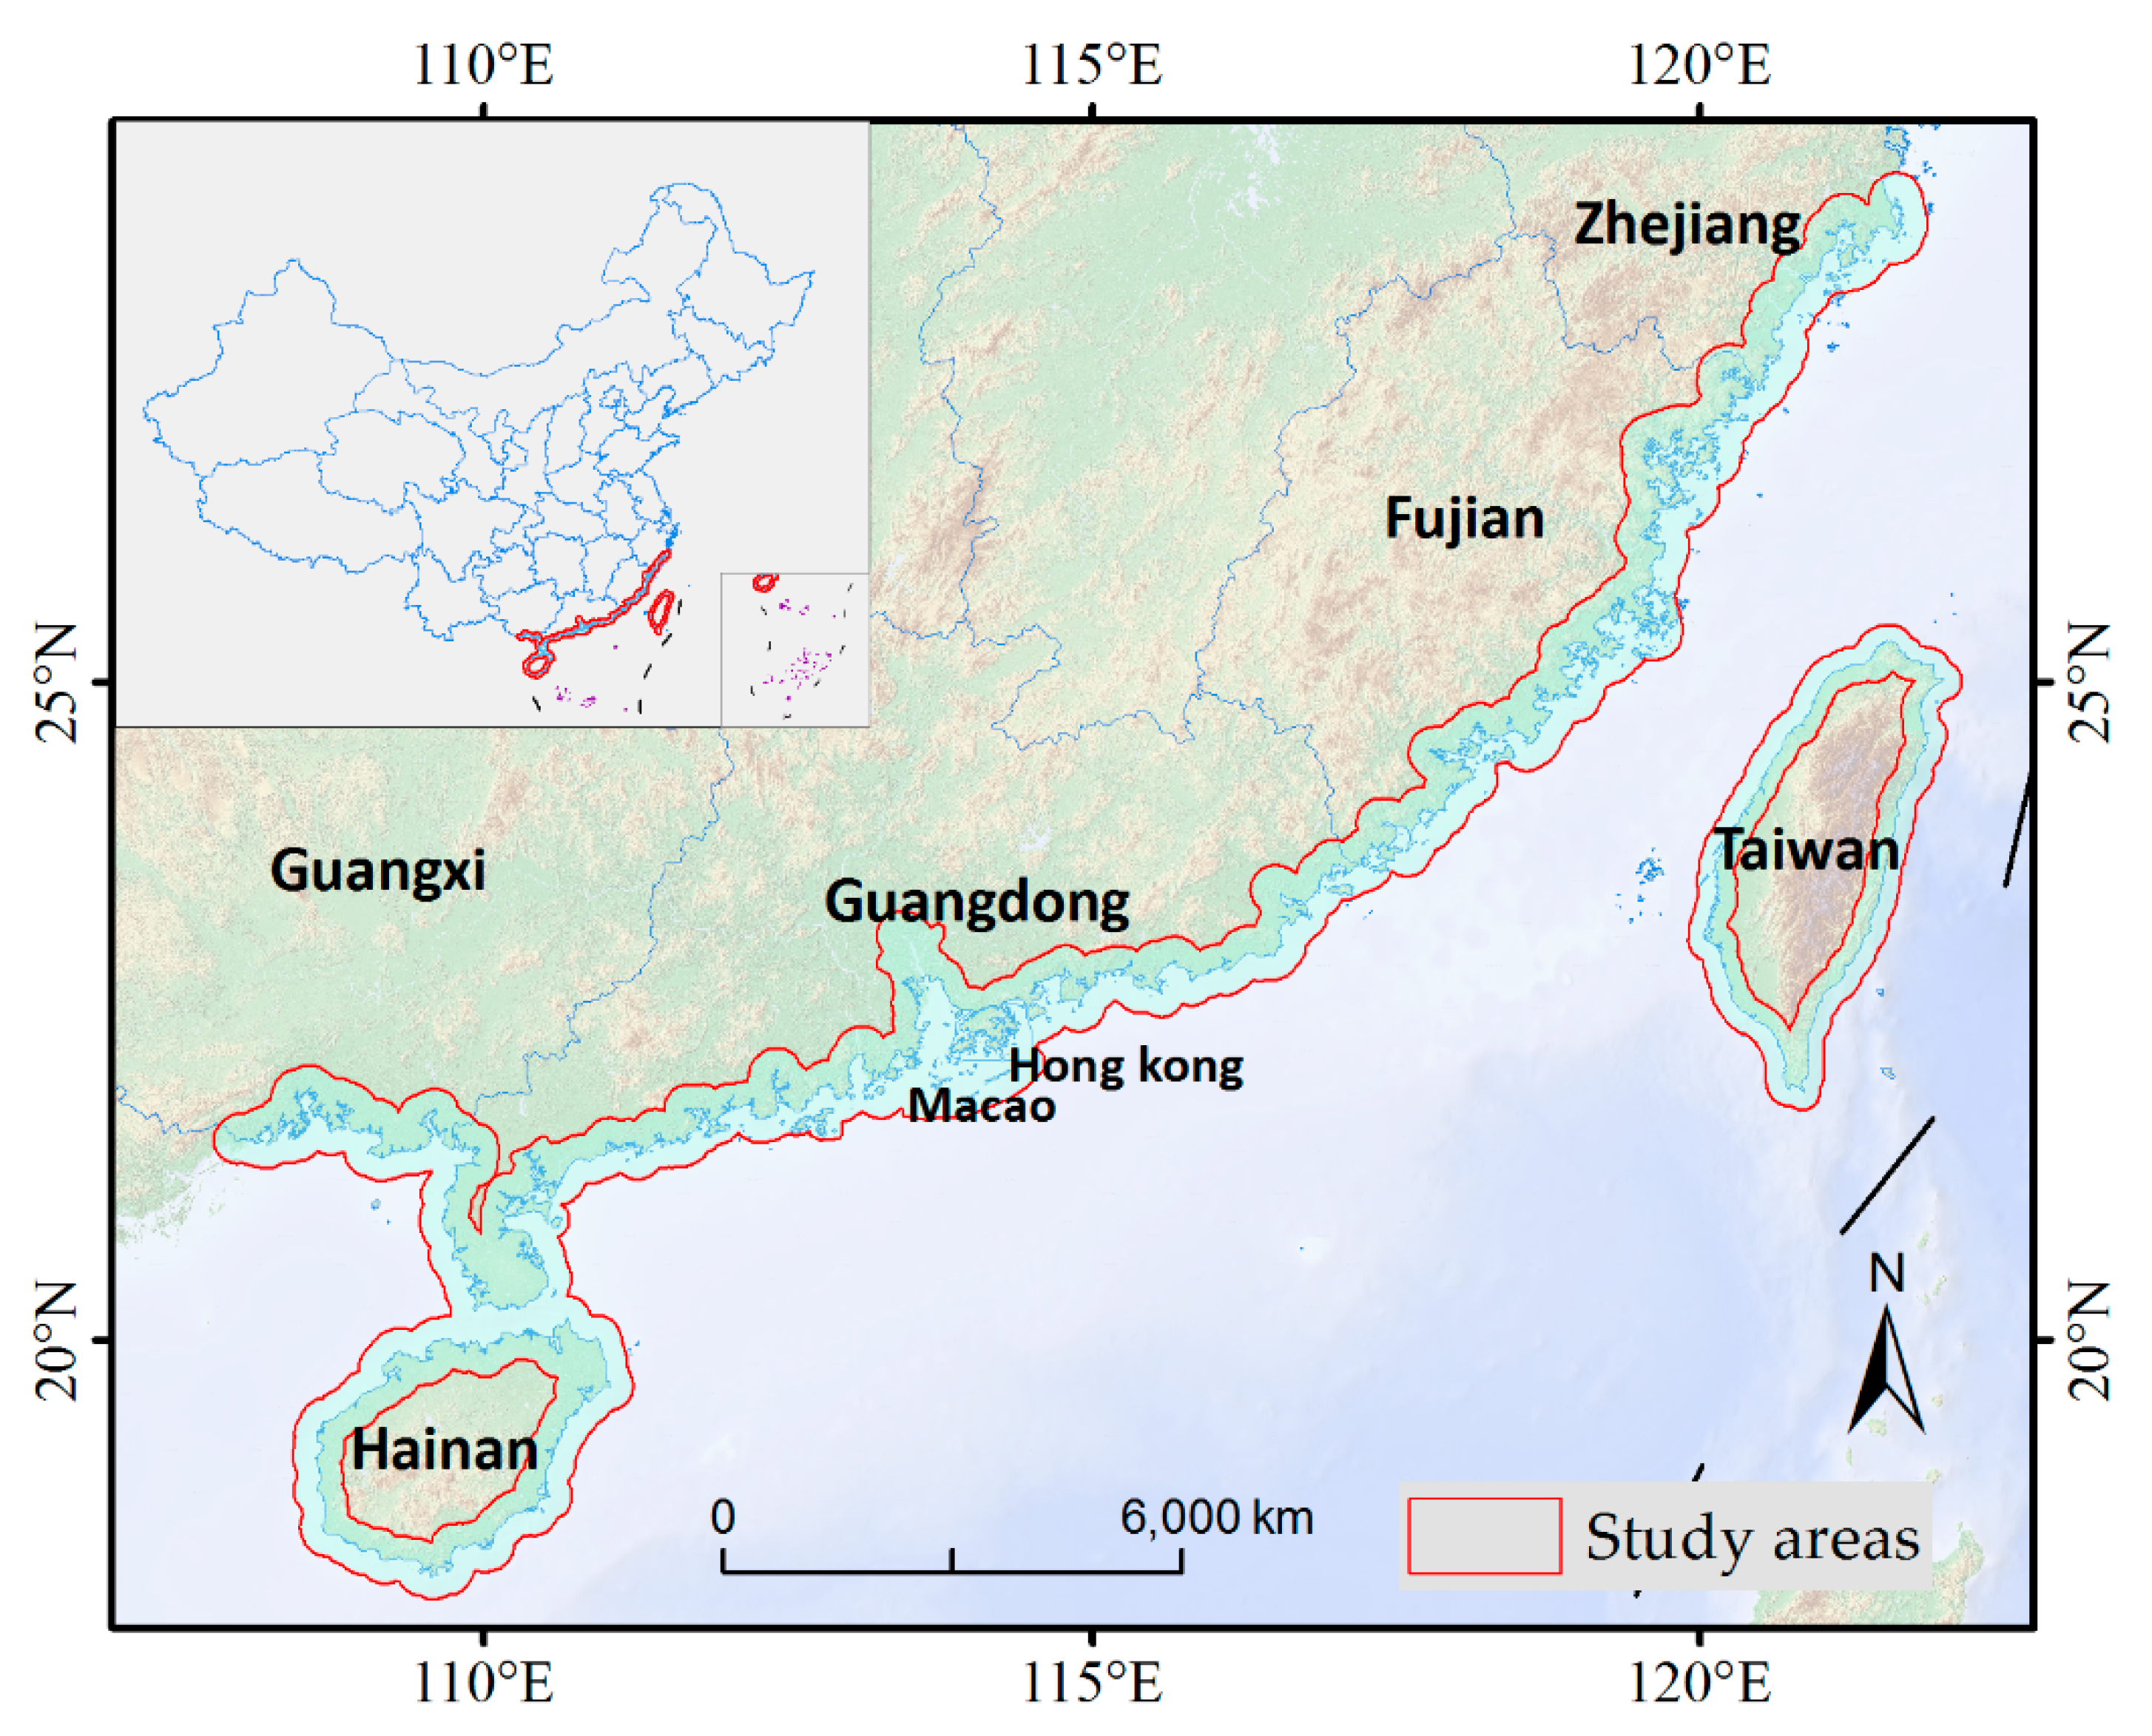
2.1. Study Area

The study area included the coastal mangrove ecosystems in southern China (Figure 1), comprising the coasts of the Guangxi Zhuang Autonomous Region (referred to as Guangxi), Hong Kong, Macao, Taiwan, and the provinces of Guangdong, Hainan, Fujian, and Zhejiang. The study area was mainly located within the 30 km buffer zone of the coastline. Natural mangrove forests in China are mainly distributed within latitudes between 18° N and 27° N, while planted mangrove forests have extended to Leqing Bay in Zhejiang Province with a latitude of 28°25′ N [47]. Historically, the total area of mangrove forests in China once reached 250,000 ha and, in the 1950s, was about 42,000 ha, which continued to decrease because of extensive aquaculture farming and urbanization [48]. Dominant mangroves species in China include Bruguiera gymnorrhiza, Kandelia obovta, Avicennia marina, Aegiceras corniculatum, Rhizophora stylosa, Acrostichum aureum, and Acanthus ilicifolius [48].

2.2. Data and Processing

2.2.1. Satellite Remote Sensing Images and Processing

The remote-sensed imagery used in this research was obtained from six satellites, including Ziyuan-3-01, Ziyuan-3-02, Gaofen-1A, Gaofen-1B, Gaofen-1C, and Gaofen-1D. The Ziyuan-3-01 (ZY3-01) satellite was launched on 9 January 2012 and the Ziyuan3-02 (ZY3-02) satellite was launched on 30 May 2016 in China [41]. These two Ziyuan-3 series satellites form a constellation at an altitude of about 505 km, providing pan and multispectral imagery (PMS) with resolutions of 2.1 m and 5.8 m, respectively. The Gaofen-1A satellite was launched on 26 April 26 2013 and the Gaofen-1B, -1C, and -1D were launched on 31 March 2018 [42]. The four Gaofen-1 (GF-1) series satellites form a constellation at an altitude of about 645 km, providing pan and multispectral imagery with resolutions of 2 m and 8 m, respectively. The main parameters for ZY-3 and GF-1 imagery are shown in Table 1. The swath width for the Gaofen-1 satellites was 60 km, and the revisit period was 41 days. The four-star constellation of the Gaofen-1 satellites has shortened the revisit period to 10 days. The Ziyuan-3 satellite had a swath width of 52 km and a revisit period of 59 days, and the double stars constellation shortened the revisit period to 30 days. The radiation resolution of the PMS sensors of the Gaofen-1 and the Ziyuan-3 satellites were both 10 bit.
In this study, 2018 imagery obtained from the ZY-3 and GF-1 sensors were screened for the use of mangrove mapping. The rules for image screening were: (1) cloud cover should be less than 5% and (2) imagery obtained at low tide should be preferred. A total of 509 images were screened in the first step. Next, all images were orthorectified to the World Geodetic System 1984 (WGS84) reference system, and the root mean square geometric errors were less than 1 pixel. Each image was normalized for variation in solar angle and earth–sun distance by converting the digital number values to top-of-atmosphere reflectance. Then, the ortho-corrected panchromatic and multi-spectral imagery were fused using the pan-sharpen [49] algorithm and resampled to 2-meter imagery. The images covering the study area were mosaiced into a 2-meter image base, which would be used for mangrove mapping in the following step.

2.2.2. Mangrove Habitat Preparation

Prior to mangrove delineation, mangroves exist within a specific ecological niche, which can be used to eliminate much of the area where they will not be found. Since mangroves need to be tidal inundated periodically, the mangrove growing area should not be too far from the shoreline and the terrain elevation should not be too high. In this study, the mangrove habitat region was obtained by following two steps. First, a 30 km buffer zone was generated based on the coastline of China. Second, a mangrove habitat region was obtained by extracting the areas with a terrain elevation less than 20 m in the buffer zone, as the height of mangrove trees along the coast of China seldom exceeded 20 m [50]. The 30-m Shuttle Radar Topography Mission (SRTM) digital elevation model (DEM) data was used for terrain elevation estimation. Through the mangrove habitat preparation step, it was possible to screen out areas where mangroves were unlikely to occur, thereby improving interpretation efficiency.

2.3. Methods for Mangrove Delineation

The overview of the method workflow is shown in Figure 2. First, the satellite imagery was processed and mosaiced into a 2-meter resolution image base, and the mangrove habitat zone was prepared. Second, an object-based image analysis procedure was performed for mangrove plot basis extraction, including sample collection, image segmentation, image object classification, and post-processing. Third, the detected mangrove plots were checked by interpreters and verified by field work. Finally, the mangrove China dataset (MC2018) was generated and its accuracy was assessed.
Mangrove plots with canopy closure greater than 20% were mapped, but sparsely scattered mangroves and young forests were not included in this inventory. The minimum mapping unit in MC2018 was 100 square meters.

2.3.1. OBIA Procedure for Mangrove Delineation

After the 2-meter resolution imagery and the mangrove habitat zone was prepared, we used an object-oriented image analysis method to extract mangrove distribution features. First, we conducted a sample collection. The preliminary samples were obtained from the Jia2015 dataset [33] by random sampling, and then these samples were manually checked with reference of Google EarthTM submeter images. A total of about 10,000 mangrove sample points and 30,000 non-mangrove sample points were obtained. Non-mangrove samples were image patches including open water, urban area, land vegetation, bare tidal flats, and Spartina alterniflora beach.
Because of the large area of the study region, the east–west span was 1600 km and the north–south span was 1200 km; it was unrealistic to process the whole area image at the same time. We adopted the strategy of tile processing in the second step, cutting the base image with a size of 40 km × 40 km. We obtained 150 tiles in total. The segmentation and classification were processed separately for each image tile, and the final result was a stitch of the tiled export.
The segmentation was performed with a multiresolution segmentation algorithm [51], which was widely used for image analysis. An image is partitioned into object primitives, which have small internal spectral heterogeneity with respect to their neighboring objects. This algorithm requires three user-defined parameters to control the size and shape of the generated image objects: (1) scale, (2) shape weight, and (3) compactness weight. We prepared different parameter combinations to segment the test images, and we used visual inspection to select images with better segmentation results. From this we determined the segmentation parameters for the mangrove image analysis, which were scale = 15, shape weight = 0.3, and compactness weight = 0.2.
The support vector machine (SVM) algorithm [52] was selected for object-oriented classification, and we used the Gaussian radial basis function (RBF) as the kernel. The SVM model has two important parameters: C and gamma. C is the penalty coefficient. If C is too large or too small, the generalization ability will deteriorate. Gamma is a parameter followed with the selection of the RBF function, and it also affects the generalization ability of SVM models. First, we conducted a parameter tuning process on a test region. We used the grid search optimization strategy to determine parameter settings in order to achieve better classification models. Results showed that setting C = 200 and gamma = 0.1 would produce a relatively strong SVM classification. Then, for each tile, an SVM model was trained, and all image object primitives were classified with the corresponding classifier. Finally, a stitch process was conducted to merge classification results of all tiles, and merged image objects were re-shaped with post-processing procedures, which included merging segments of the same class, removing objects with very small areas, and smoothing object borders. Through object-oriented image analysis and processing, we obtained the mangrove dataset V1 (MC2018V1).

2.3.2. Interpreter Checking

In order to improve the thematic accuracy of mangrove data, we conducted interpreter checking to correct errors in the extraction results and to add some missing patches by reference of the 2-meter base imagery. In the cross-checking step, the MC2018V1 were cross-checked by three operators. Each patch was marked with an attribute of “suspect” or “certain” according to the judgement of the three operators. These inspectors also reinterpreted the imagery, added some possible missing patches, and modified the unreasonable boundaries. Suspect patches would be focused on inspection during the field work. After interpreter cross-checking, we obtained the mangrove dataset V2 (MC2018V2).

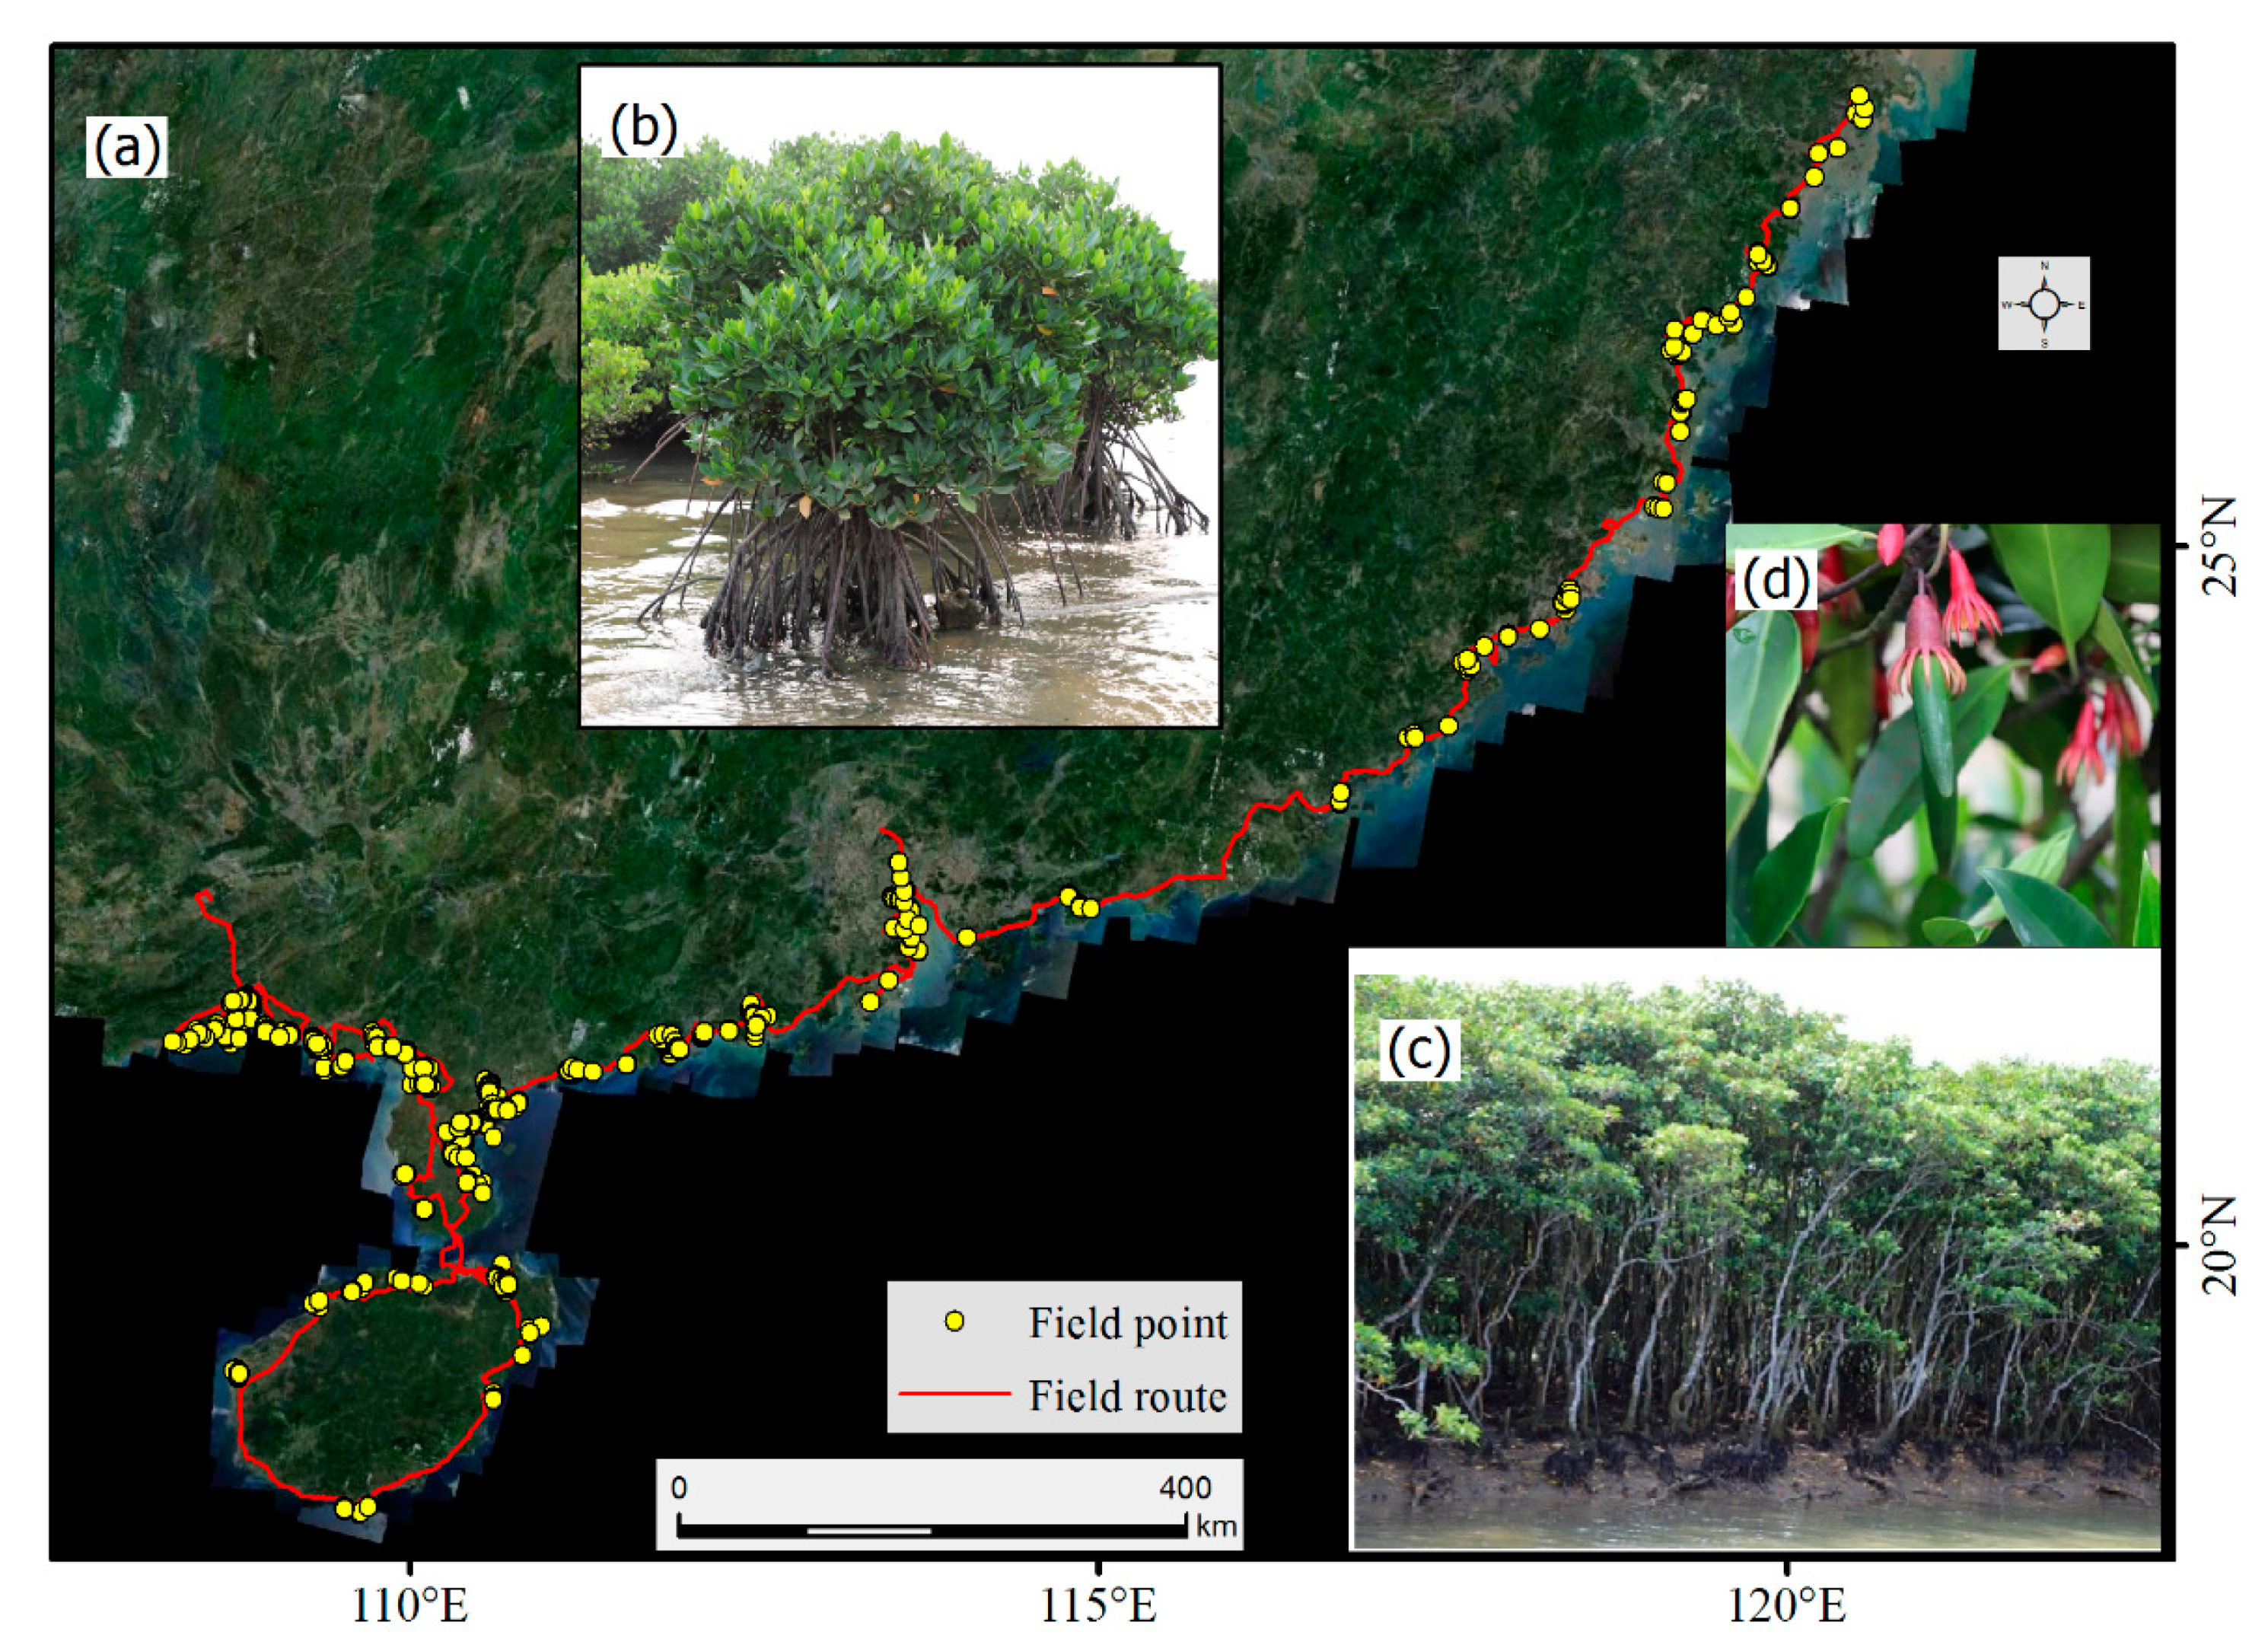
2.3.3. Field Verification

The research team carried out the field survey of China’s coastal mangrove forests in April and May 2019. The field work focused on verifying mangrove patches with low degrees of certainty. Mangrove patches marked as suspect in the MC2018V2 dataset were all selected for verification. For patches marked as certain, we selected 50% for verification in the field process. During the field work, some missing patches (omission errors) were recorded and manually added to the updated map.
The field survey was conducted along the Chinese mainland coastline, from the border in Guangxi to Taizhou in Zhejiang (Figure 3). The length of the field survey route was approximately 9500 km. A total number of 2650 mangrove patches were verified during the field work. After field verification, the MC2018V2 dataset was modified and improved, and the final version MC2018 dataset was obtained.

2.4. Accuracy Assessment

There were two sources of ground truth points for accuracy assessment in this study. First, in June 2019, 223 points were obtained in Guangdong, Guangxi, Hainan, and Fujian by field survey. Second, 2077 mangrove verification points were collected by field investigators from submeter imagery of Google EarthTM and Bing MapsTM. We conducted no field survey in Taiwan, and the verification points in Taiwan were all collected from Google EarthTM and Bing MapsTM. The ground truth points fall into two categories: mangroves and non-mangroves. Non-mangrove classes included open water, urban area, land vegetation, bare tidal flats, and Spartina alterniflora beach. The confusion matrix method was used for accuracy assessment, and the producer’s accuracy (PA), the user’s accuracy (UA), the overall accuracy (OA), and the kappa coefficient were calculated.

2.5. Inter-Comparison with Other Available Mangrove Forest Maps or Datasets

The MC2018 dataset [46] was compared with other available mangrove data, including: (1) the 2000 State Forestry Administration mangrove dataset (SFA2000 [23]); (2) the Northeast Institute of Geography and Agroecology, Chinese Academy of Sciences dataset by Jia et al. (Jia2015 [34]); (3) the mangrove forest 2015 dataset by Chen et al. (Chen2015 [35]); (4) the World Atlas of Mangroves by Spalding et al. (WAM2000 [10]); (5) the mangrove forest of the world dataset by Giri et al. (MFW2000 [1]); (6) Global Mangrove Watch (GMW2016 [21,22]); and (7) the mangrove forest change of China dataset by Zheng et al. (MFC2018 [19]). Information about image sources, image resolutions, mapping methods, and obtained mangrove areas were collected and compared for these datasets. In addition, MC2018, Jia2015, Chen2015, MFW2000, and GMW2016 were selected for visual comparison on the two test sites of Qinzhou Bay in Guangxi and Dongzhai Port in Hainan.

3. Results

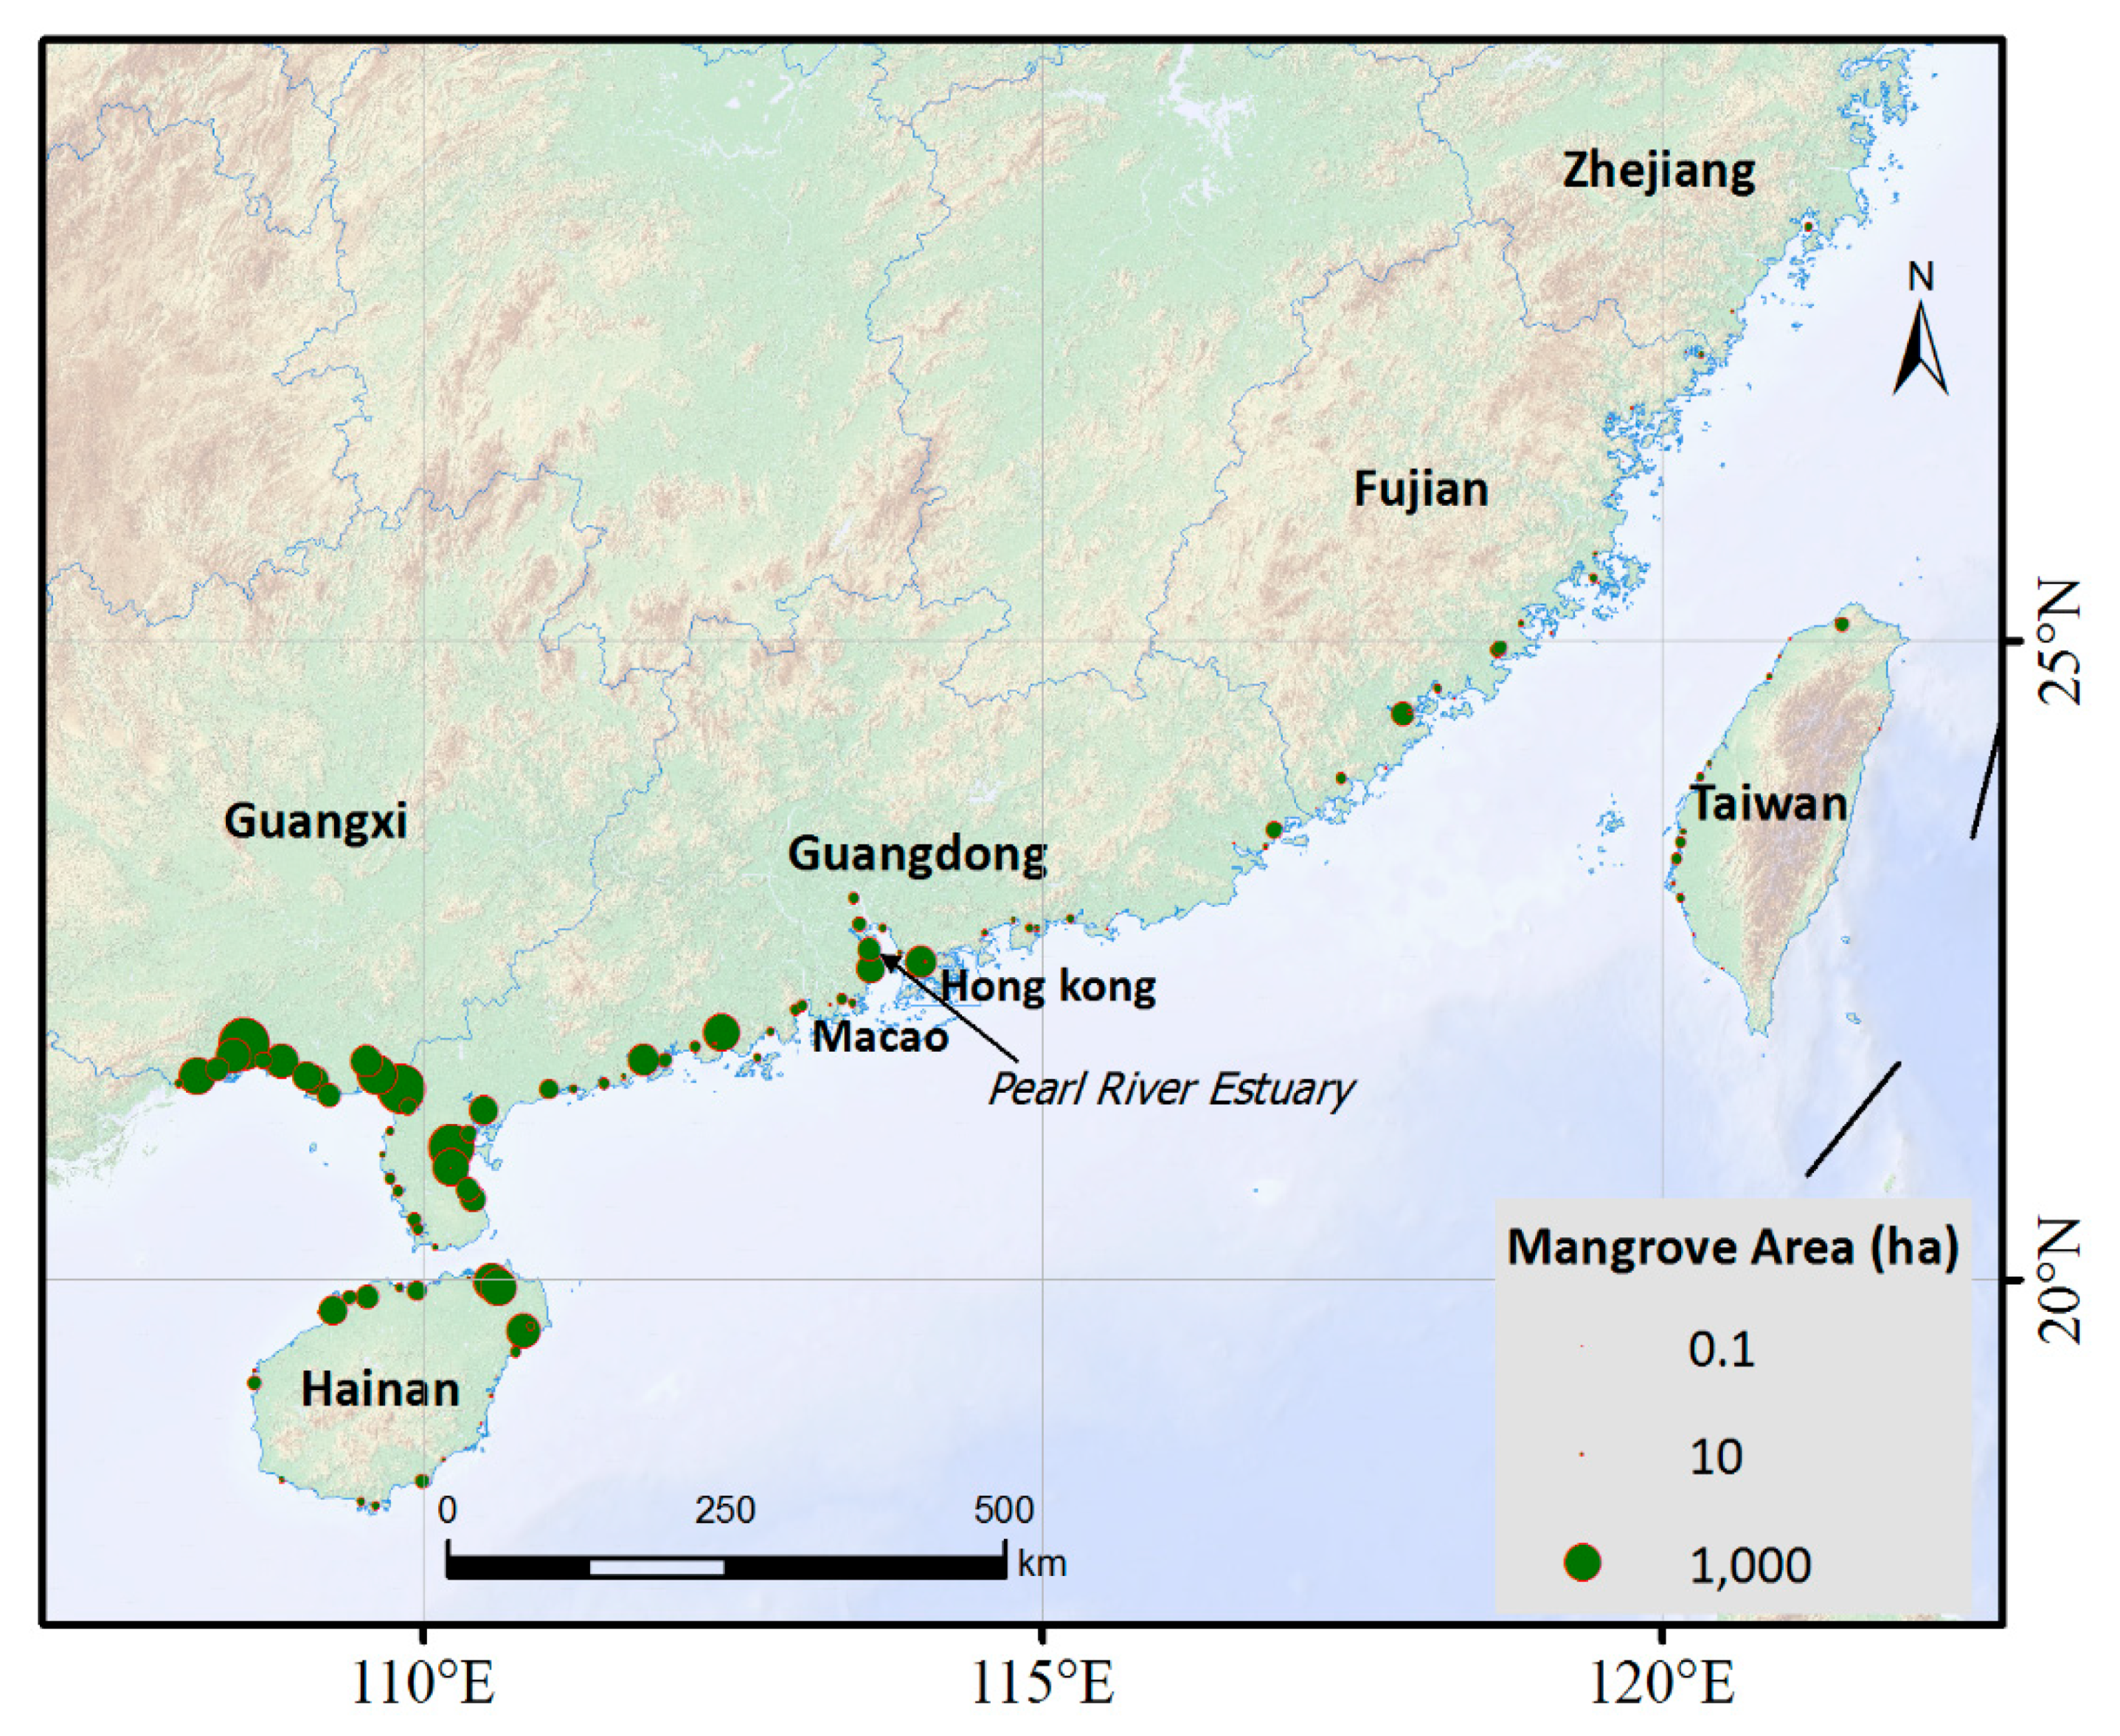
3.1. Spatial and Area Distribution of Mangroves in China in 2018

3.1.1. Distribution of Mangroves in Different Provinces

In 2018, the total area of mangrove forests in China was 25,683.88 hectares (Table 2). The distribution of mangrove forests varied greatly among different provinces. Guangdong Province held the largest distribution area of mangroves, which was 10,330.74 hectares, accounting for 40.22% of the total national mangrove area. Guangxi and Hainan followed with distribution areas of 8449.0 hectares and 4676.71 hectares, respectively. The total mangrove area in the top three provinces accounted for 91.33% of the national mangrove area.
Figure 4 shows the spatial distribution of mangrove forest areas along the coasts. Mangrove areas were mainly distributed in Guangxi, eastern Guangdong, and northern Hainan Province, and they were less distributed in Fujian, Zhejiang, and Taiwan.

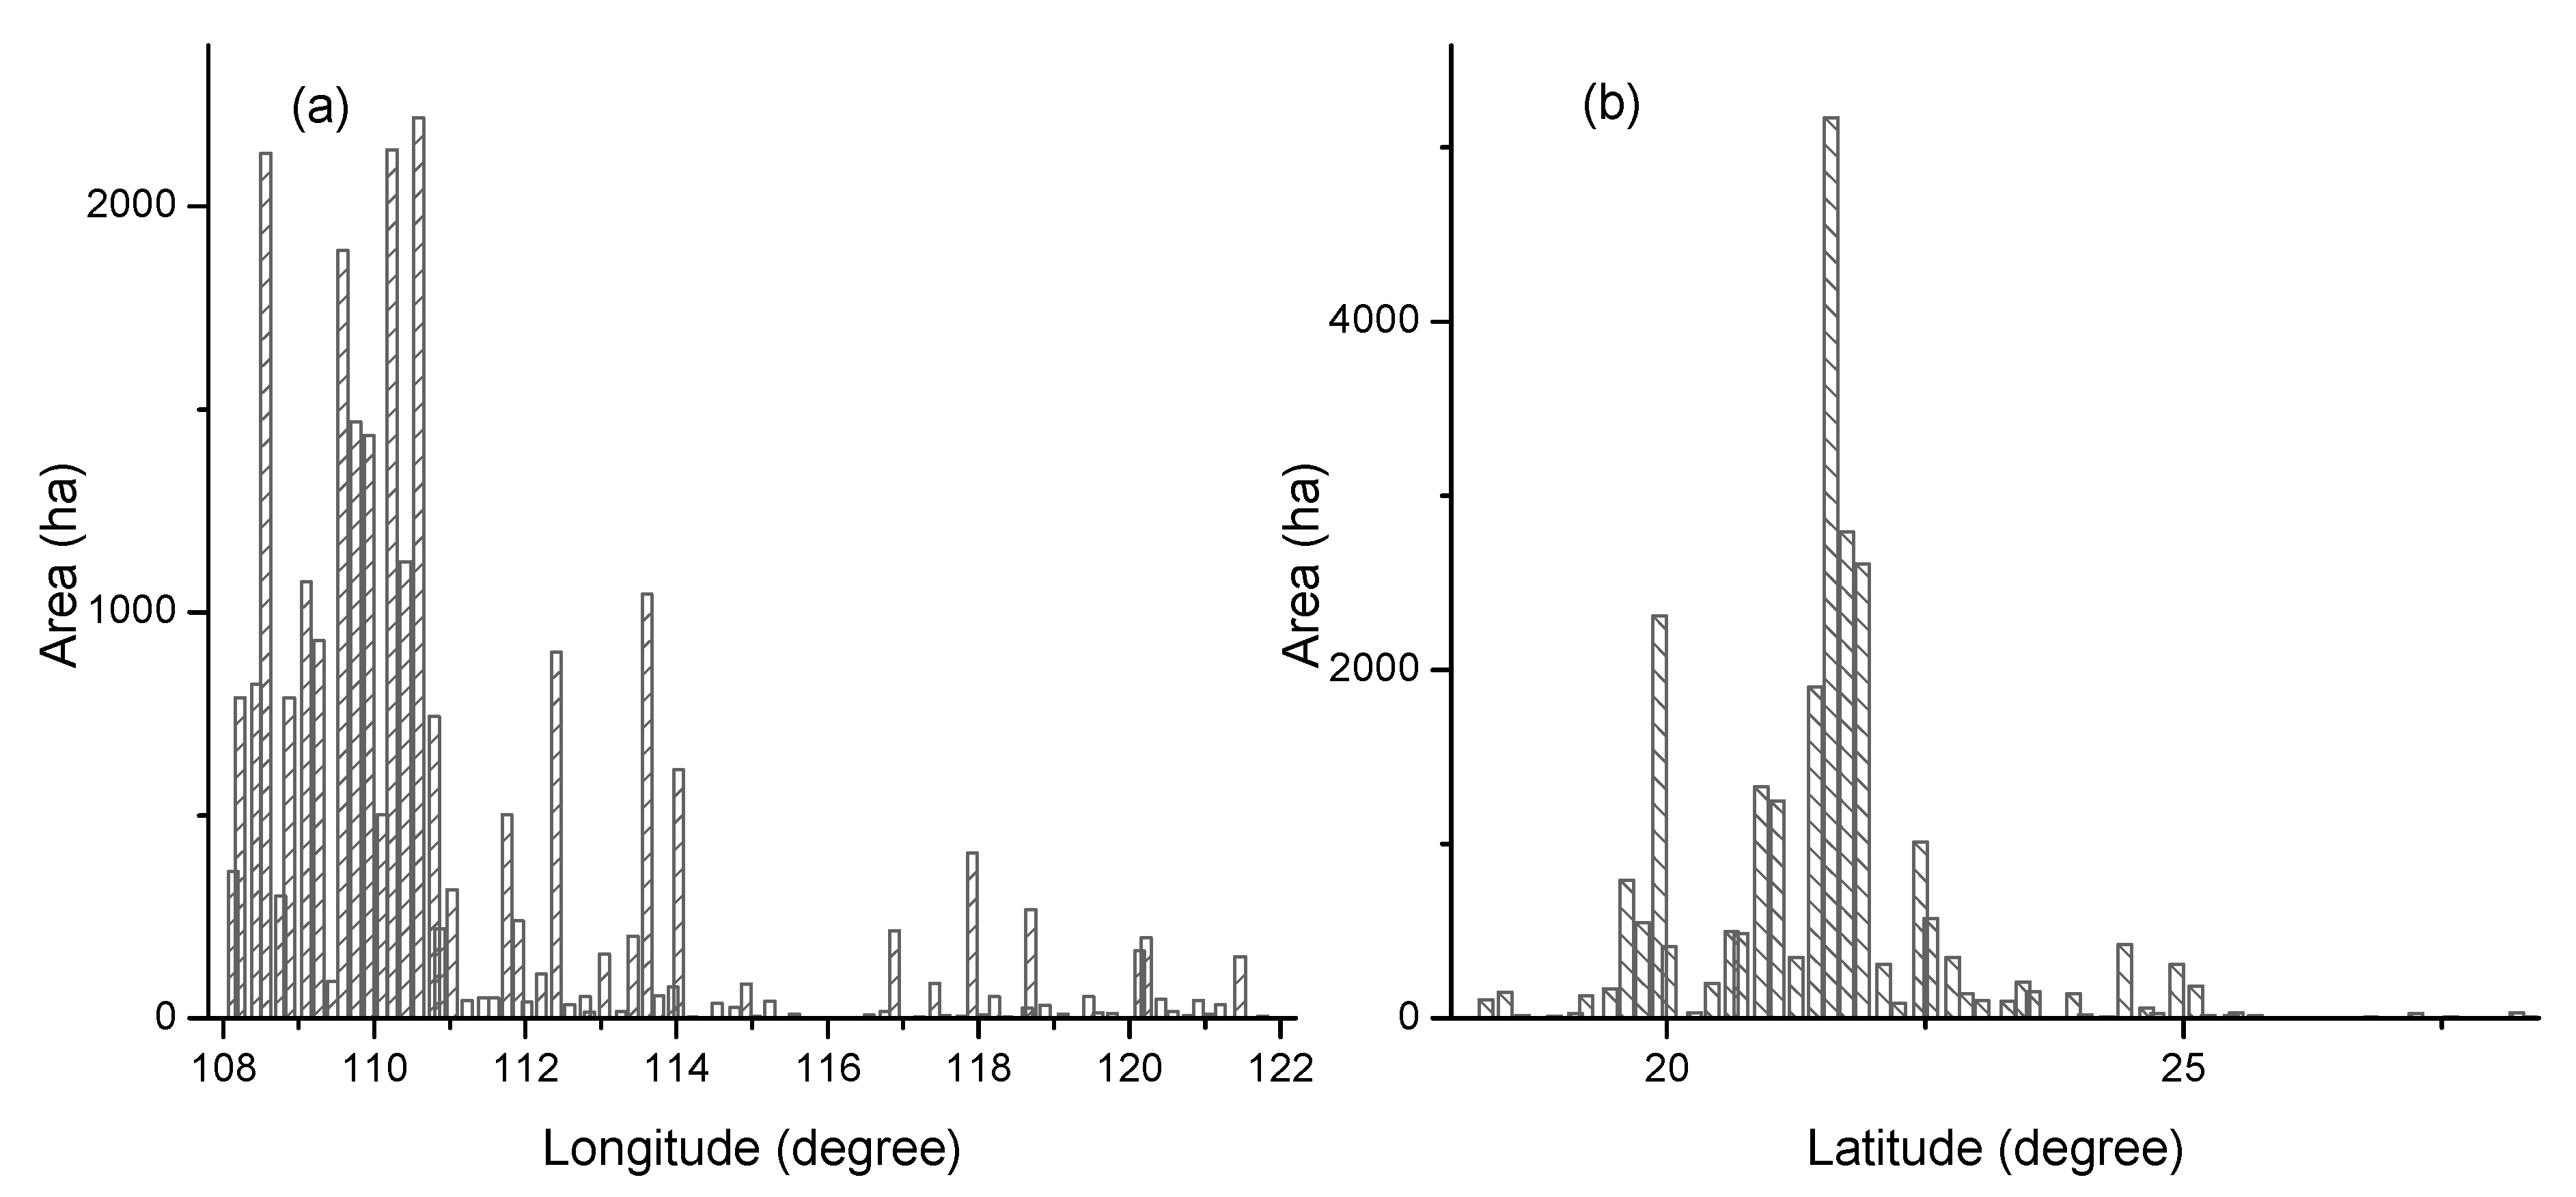
3.1.2. Distribution of Mangroves in the Latitudinal and Longitudinal Directions

We cut the mangrove patches with a 0.01° fishnet in the latitudinal and longitudinal directions and summarized the area distribution of mangroves in the longitudinal and latitudinal directions. The results are shown in Figure 5. From the longitudinal direction, mangroves were distributed between 108.0° E and 122° E. Mangrove forests in China can be divided into two parts by the longitude line of 114.0° E (near the Pearl River estuary). Most mangroves were distributed to the west of the Pearl River estuary (108.0° E to 114.0° E), and the area of mangroves in this region reached 22,953.40 hectares, accounting for 89.4% of the total mangrove area. The area of mangroves east of the Pearl River estuary (114.0° E to 122.0° E) was 2730.48 hectares, accounting for only 10.6% of the total mangrove area.
From the latitudinal direction, Chinese mangroves were distributed between 18° N and 28.9° N, showing characteristics of high area in the middle and low area toward the ends. Most mangroves were distributed between 19° N latitude and 23° N latitude, with a total area of 21,329.72 hectares, accounting for 83% of the total mangrove area. In regions north of 25° N, only a small area of mangroves was scatter distributed.

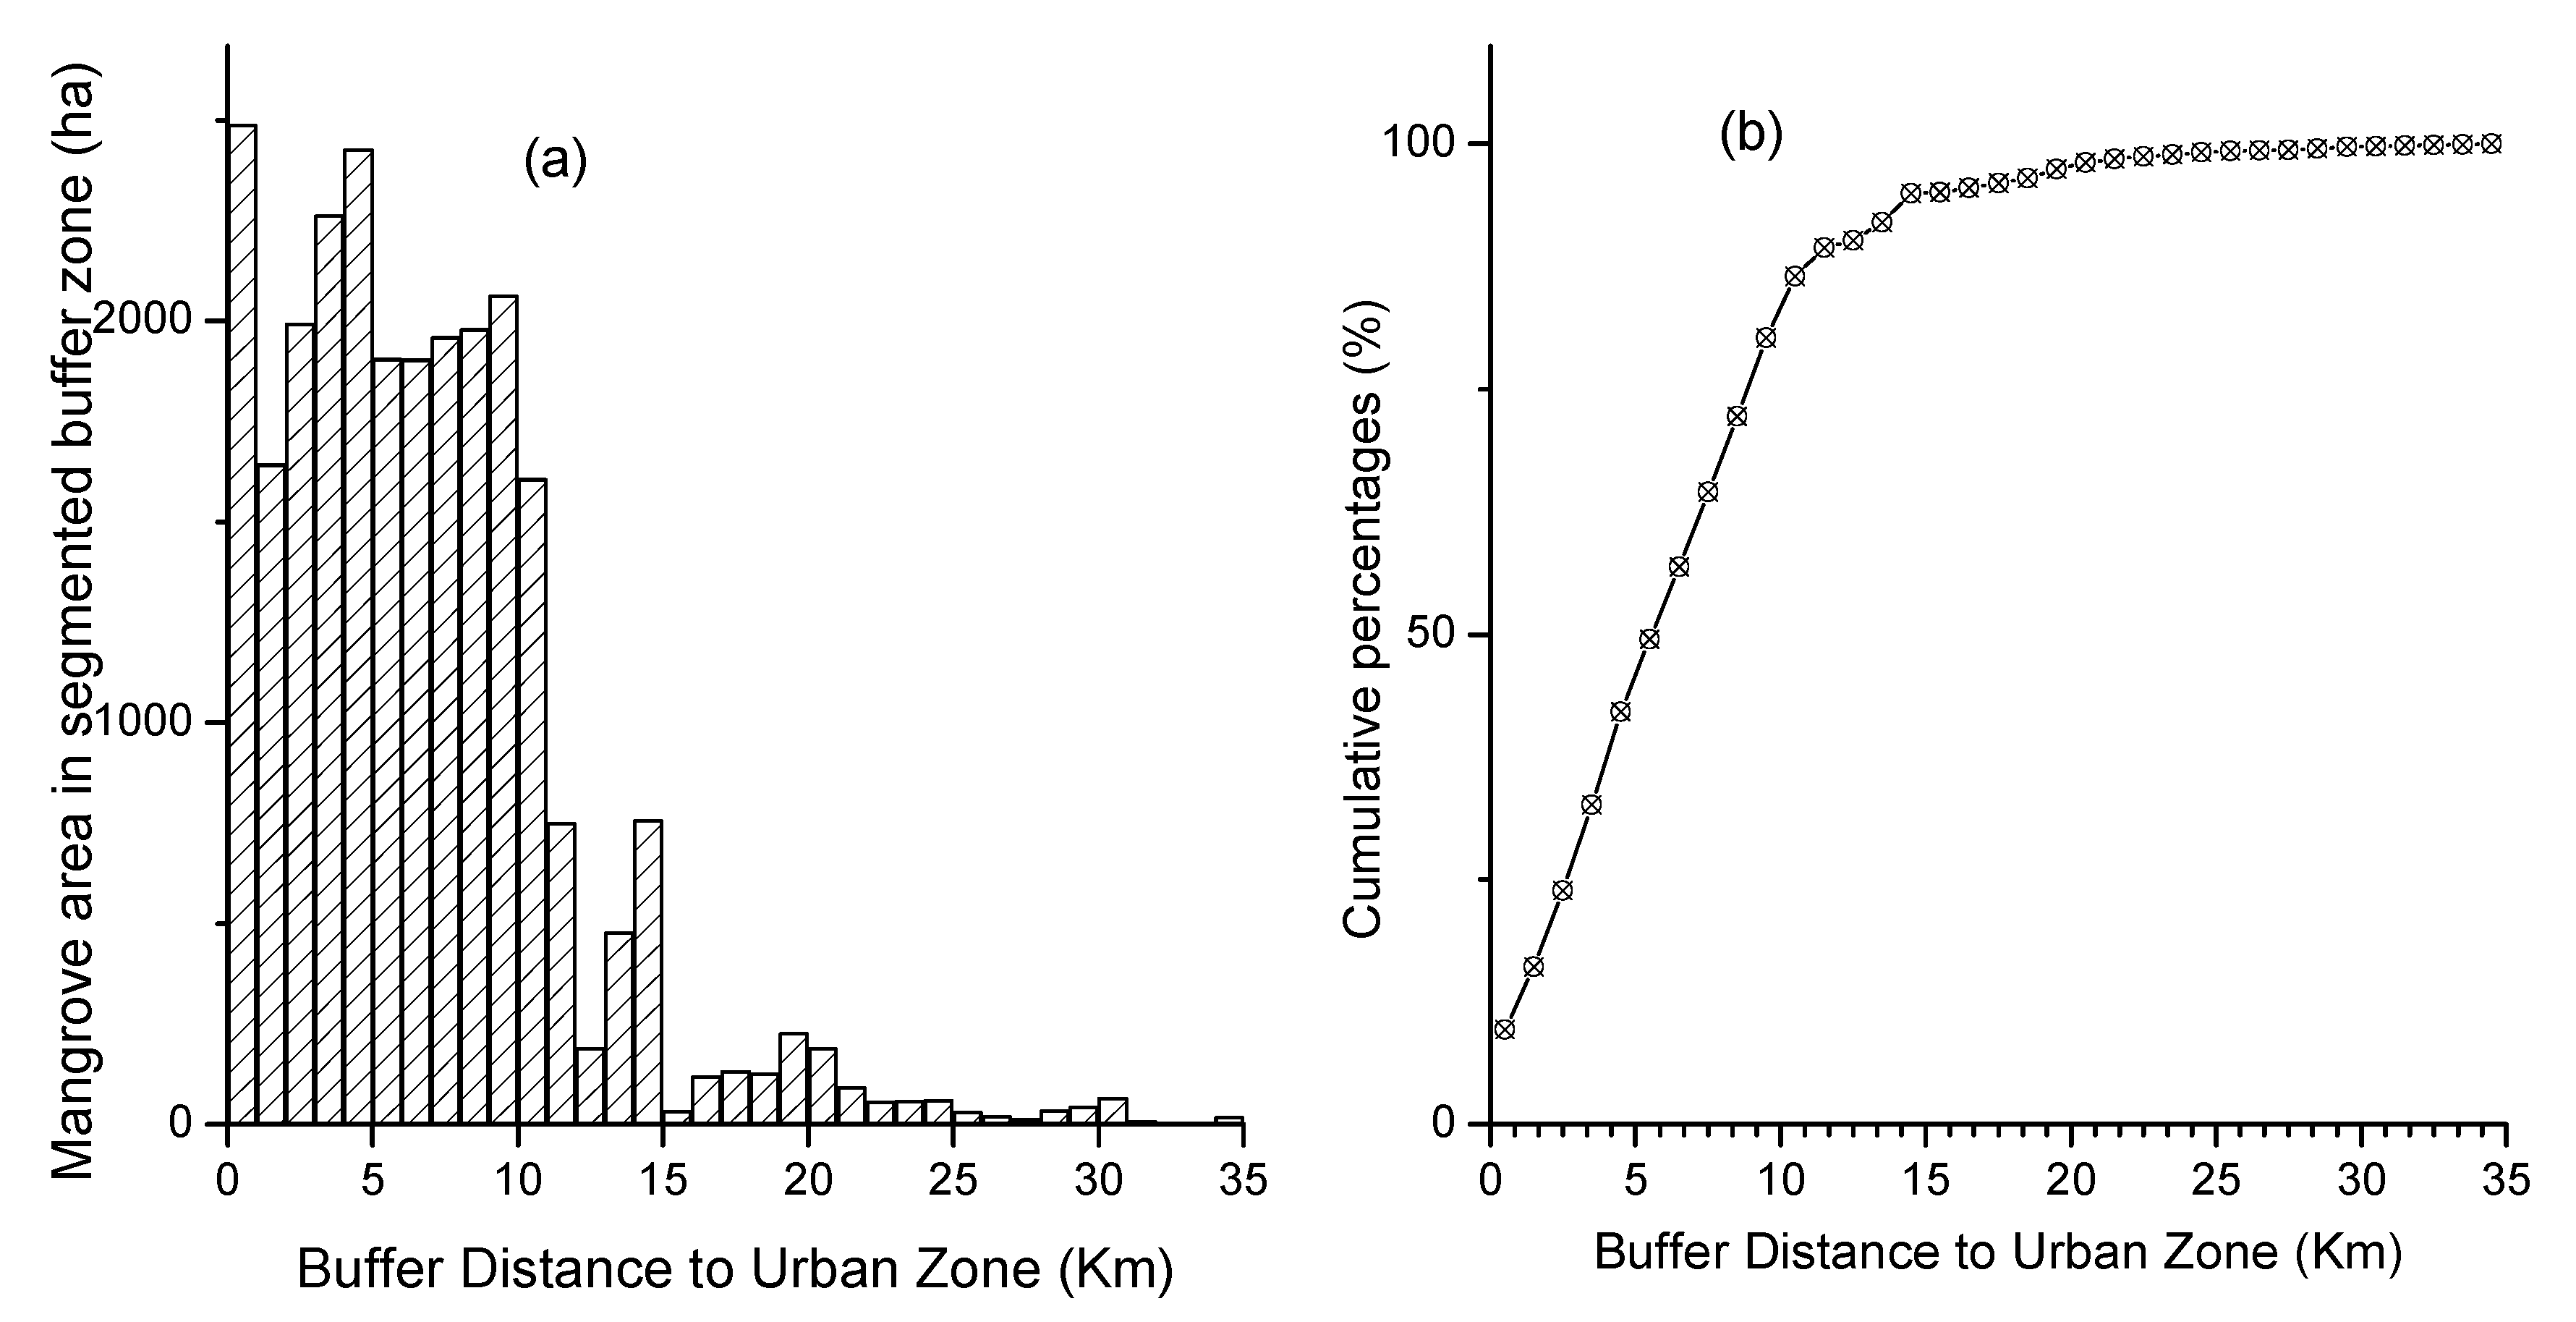
3.1.3. Distribution of Mangroves within the Proximity of Urban Areas

In order to obtain the relationship between the distribution of mangroves and the development of coastal cities, we used the buffer and overlay analysis method to calculate the area of mangroves within the proximity of different buffer distances of urban boundaries. We used the global urban boundaries (GUB_Global_2018) dataset produced by Li et al. [53]. We gradually increased the buffer distance in 1 km steps and calculated the area of mangroves in buffer zone segments with buffer distances from 1 km to 35 km.
The results are shown in Figure 6. About 10% of the mangrove area was distributed within 1 km of the urban boundary, and the farthest distance from the mangrove forest to the urban area was 35 km. Figure 6b shows that mangrove area grows rapidly as the distance from the urban boundary increases. About 80% of the mangroves were distributed within a 10 km proximity of the city area, and mangrove area within 15 km from the city boundary accounted for 95%.

3.2. Accuracy of MC2018

The accuracy evaluation results are shown in Table 3. The overall accuracy of the MC2018 dataset, the kappa coefficient, the mapping accuracy, and the user accuracy, were 99.3%, 0.985, 99.3%, and 99.0%, respectively.

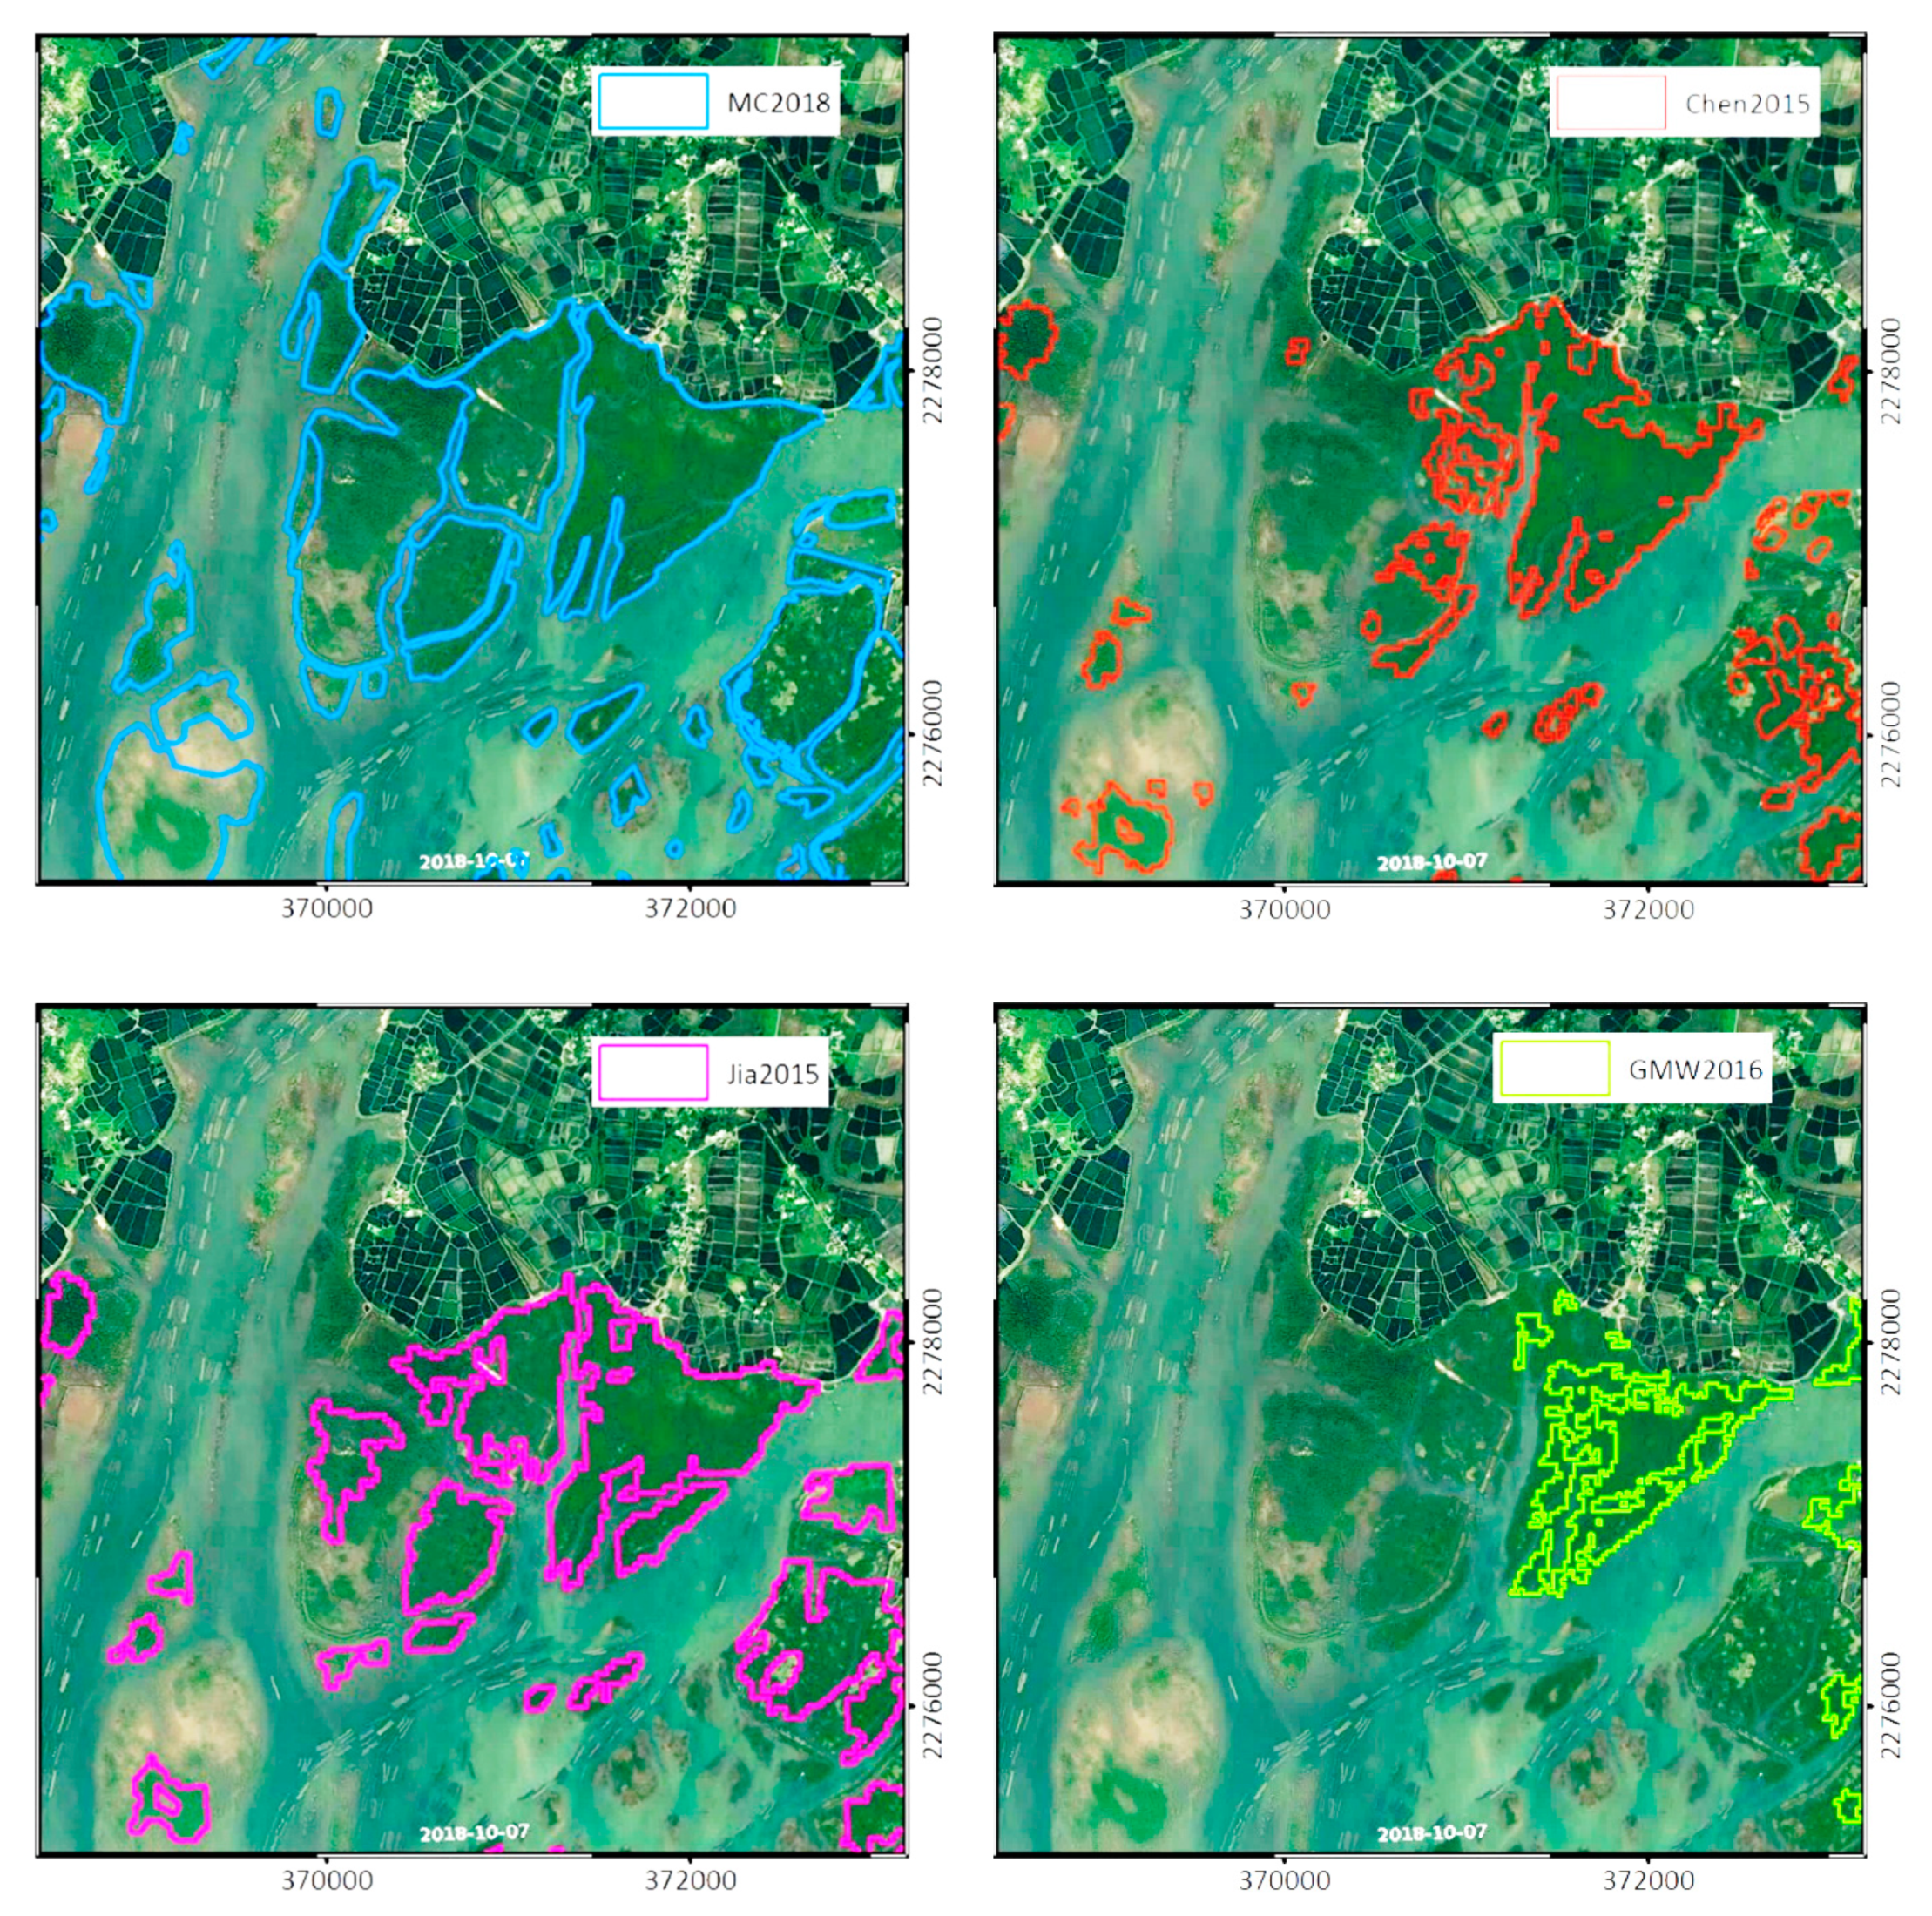
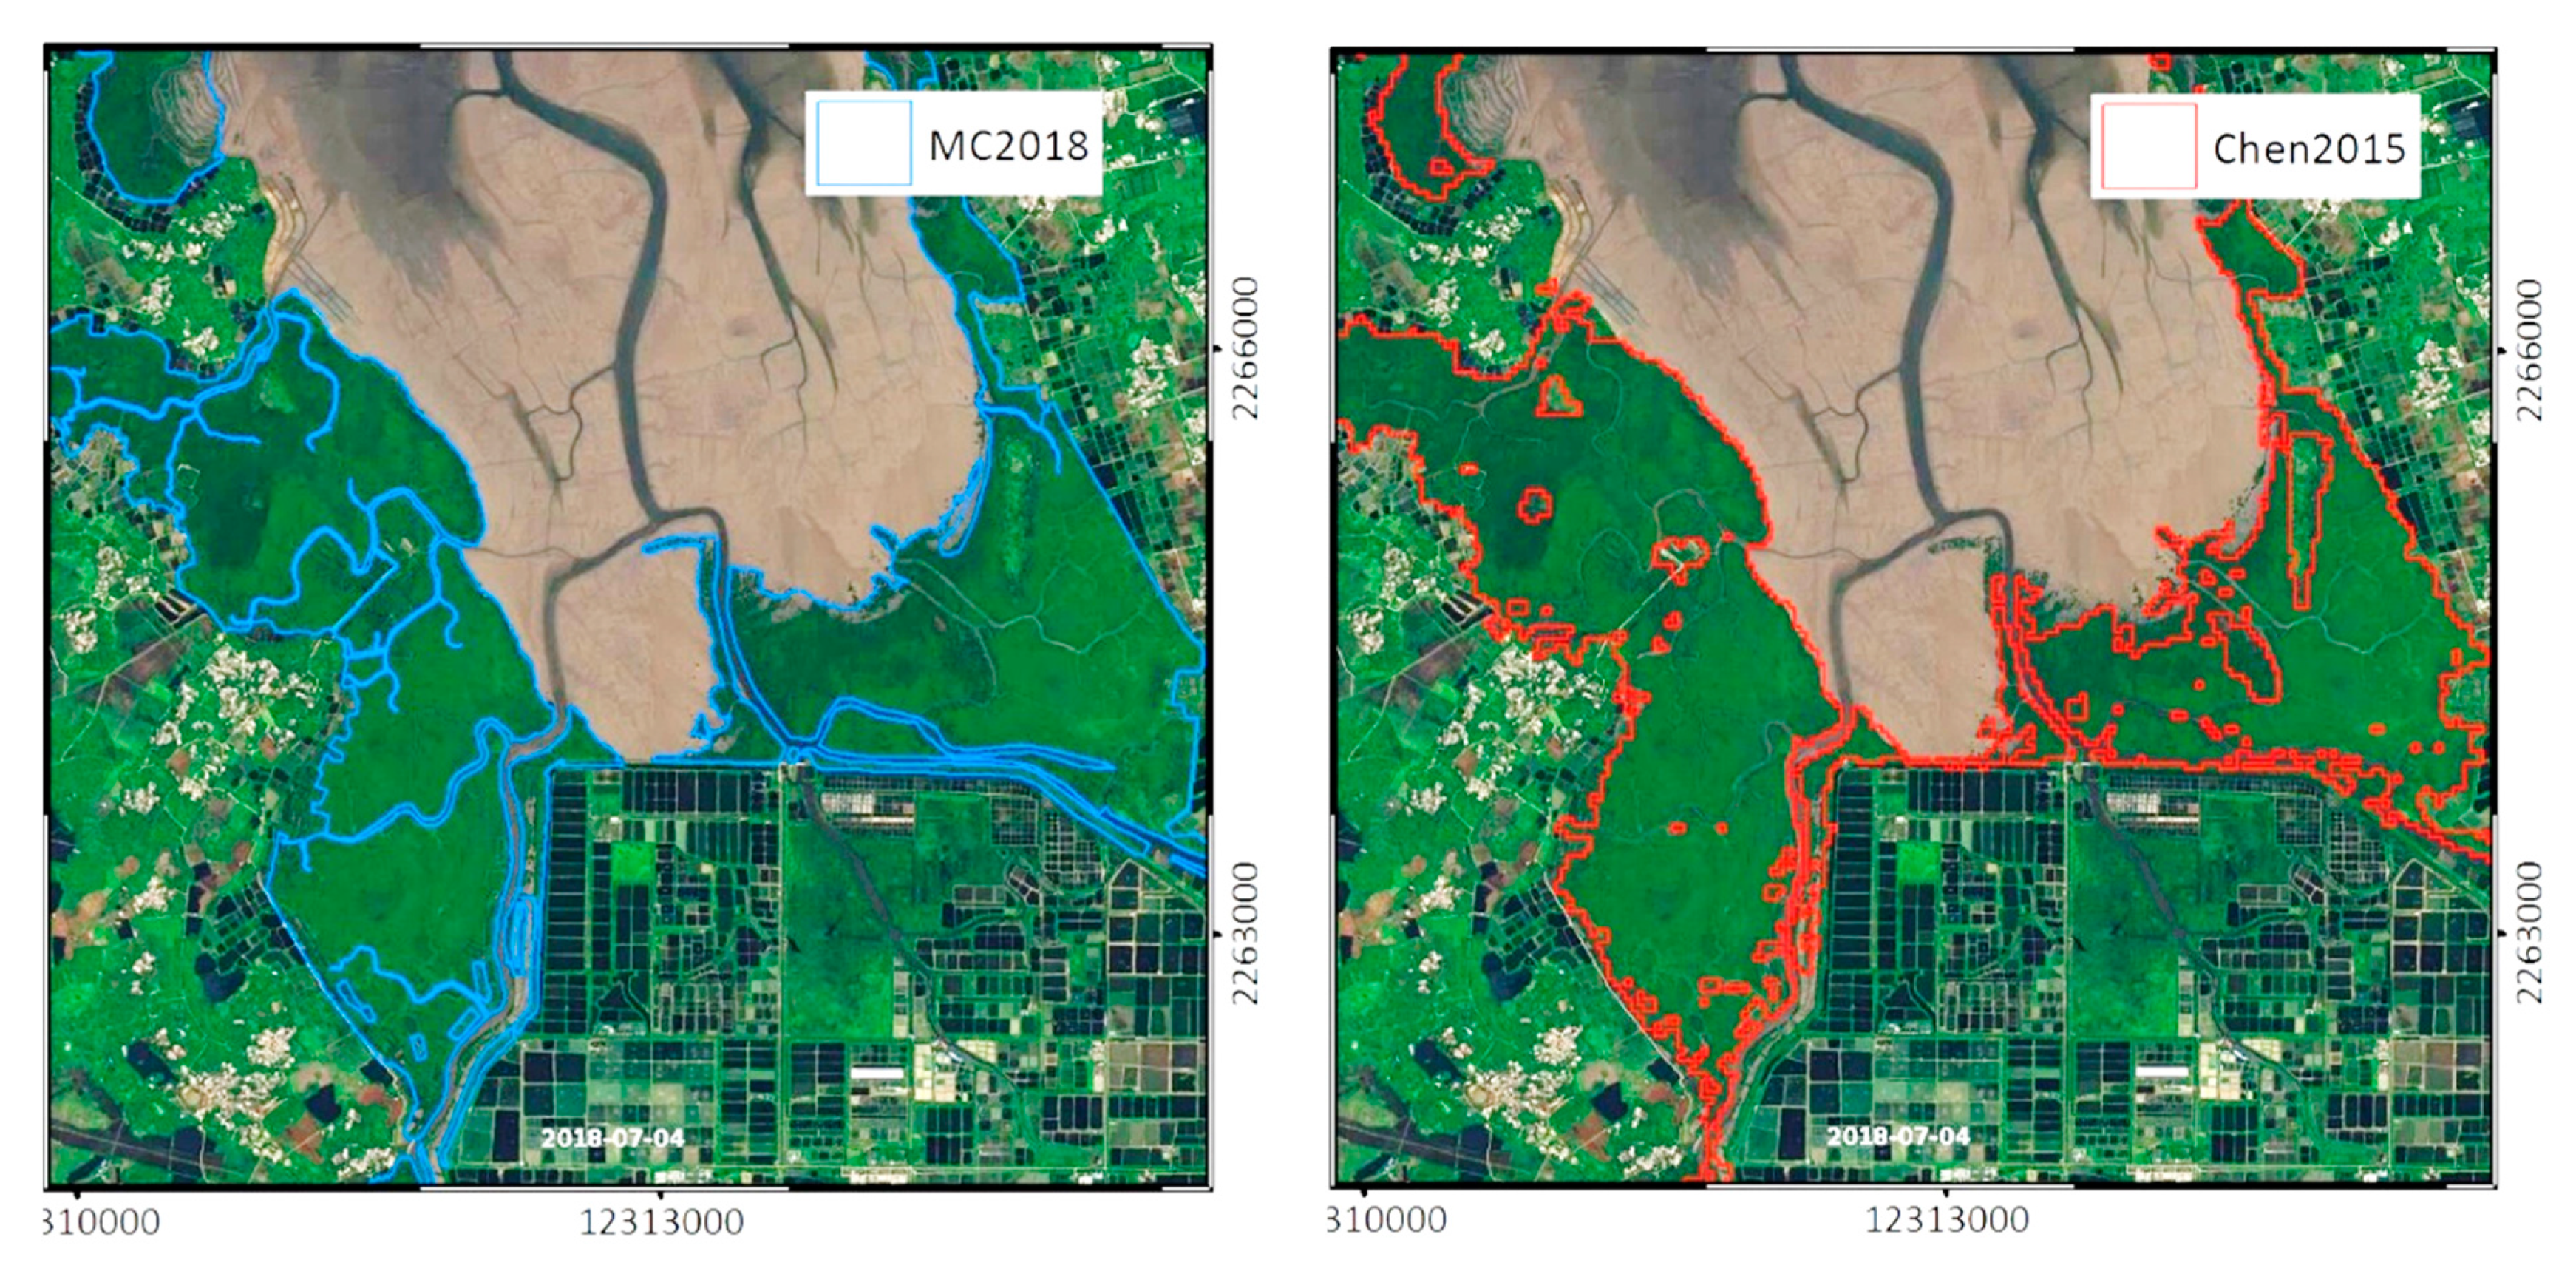
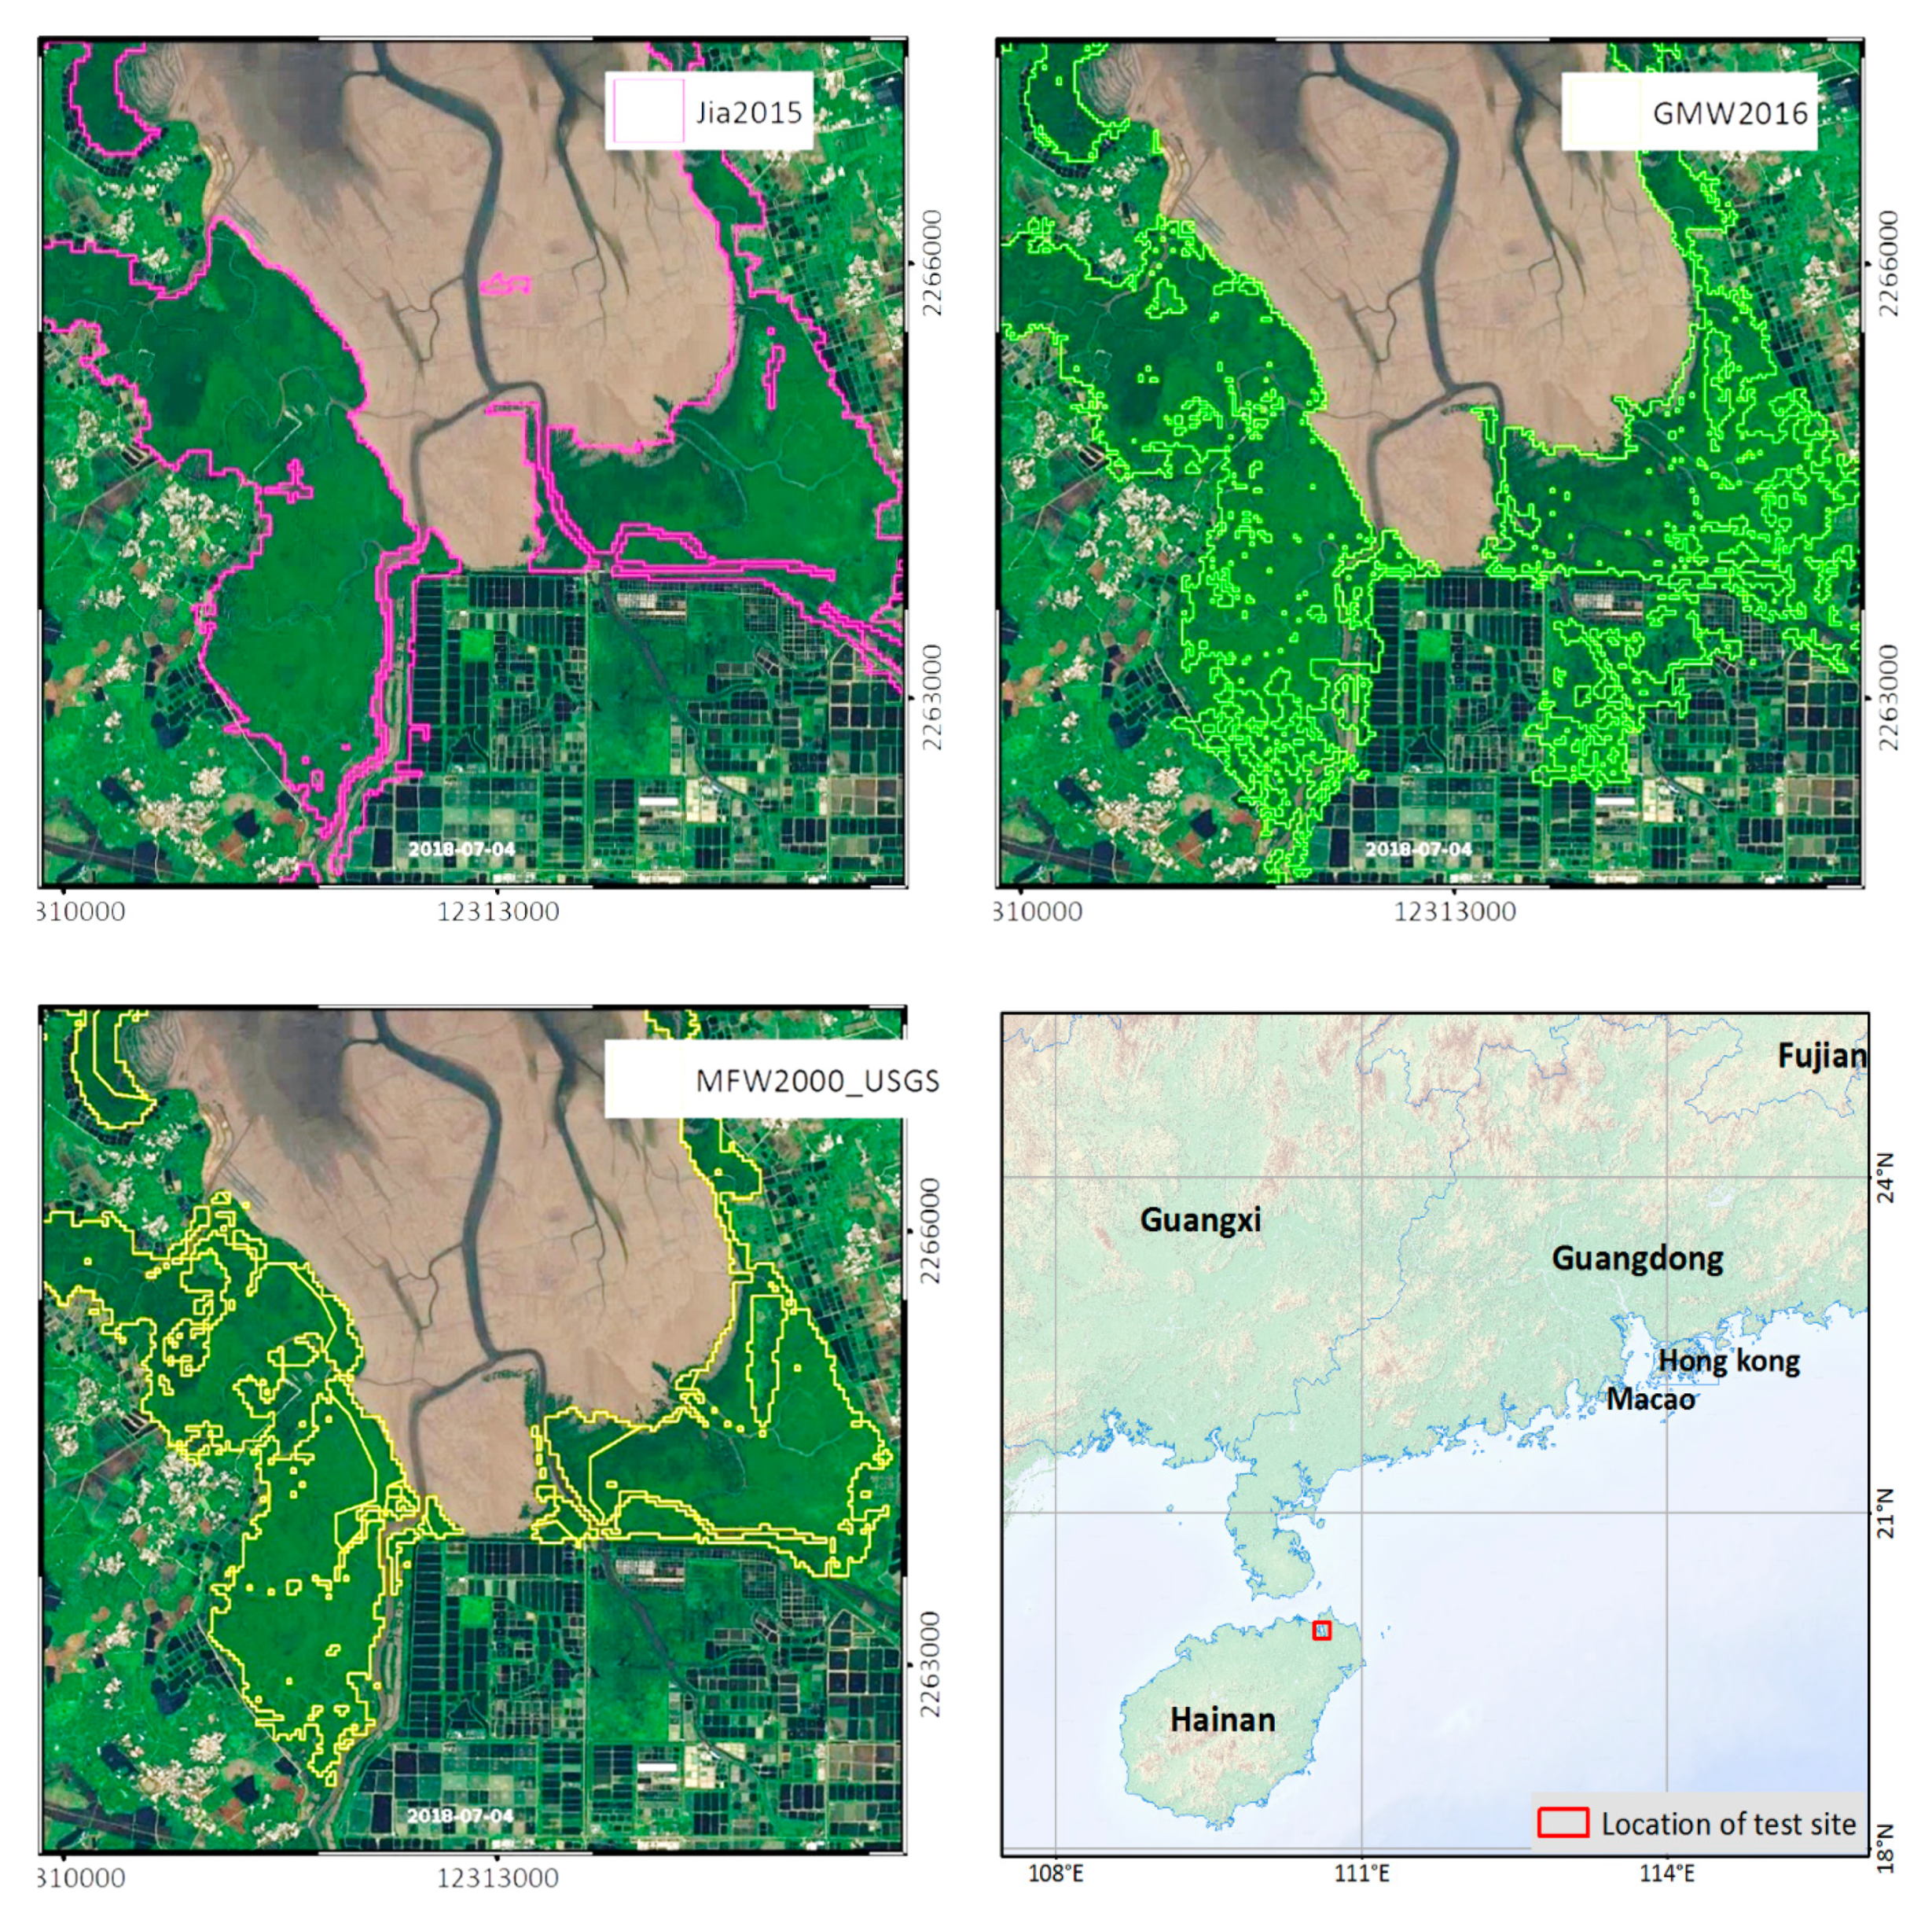
3.3. Inter-Comparison of Mangrove Maps among Multi-Source Datasets

The MC2018 dataset [46] was compared with the other seven available mangrove maps, including SFA2000 [23], Jia2015 [34], Chen2015 [35], WAM2000 [10], MFW2000 [1], GMW2016 [21], and MFC2018 [19]. Detailed information is listed in Appendix A Table A1. In these datasets, the mangrove area in China varied greatly. The largest area was 25,683.88 hectares, obtained in this study, and the smallest area was 15,869 hectares, obtained from the GMW2016 dataset. Both the MC2018 dataset and the MFC2018 dataset were mangrove maps of China in 2018, and the mangrove area in the MC2018 dataset was 1081.43 hectares more than the MFC dataset. The difference may exist because there were many small mangrove patches in China and because the higher resolution images and richer field data used by MC2018 had a better potential to capture these small areas of fragmented mangroves. In addition, some of the area differences should be due to the differences in time (year) of image acquisition and the different methodologies employed for mangrove mapping. Furthermore, from the time sequence of the different mangrove datasets in Table A1, the mangrove area in China had been increasing since 2000, which was consistent with the result from Jia [33].
We selected two test regions of Qinzhou Bay in Guangxi and Dongzhai Port in Hainan, and visually compared the MC2018 and the other four datasets (Jia2015, Chen2015, GMW2016 and MFW2000) in these two regions. Figure 7 shows the results of the Guangxi Qinzhou test area. In this area, the MC2018 dataset performed best and mangrove patches fit the reference image well. The Chen2015 and Jia2015 datasets performed second; they correctly extracted about 50% of the mangrove range, with some missing error. The GMW2016 and MFW_USGS did not perform well enough in the region; they missed a significant amount of the mangrove area. Some of the missing errors were due to the year differences between the mangrove maps and the reference images.
In the Hainan Dongzhai Port test area (Figure 8), mangroves were concentrated in large areas, and they have changed little in recent decades. In general, the five datasets have correctly extracted large mangrove areas in this region. The overall accuracies of MC2018, Jia2015, Chen2015 were relatively high, but there were relatively more errors and omissions in the MFW2000 and GMW2016 datasets. The MC2018 dataset was mapped from 2-meter high-resolution imagery, the edge of the patch is smooth, and the structure of the small patch is complete. The mangrove patches in the remaining four datasets all exhibit severe jagged edge effects and the small-area mangrove patches were not sufficiently accurate.

4. Discussion

4.1. The Status of Mangrove Protection Areas in China

According to the list of China’s nature reserves from 1980 to the present, China has established 35 nature reserves related to mangrove protection, including 7 national-level nature reserves, 7 provincial-level nature reserves, and 21 county-level and municipal-level nature reserves. In addition, since 2001, China has launched a mangrove protection project, continued to carry out afforestation activities, and achieved good results. The results of remote sensing monitoring have shown that the area of mangrove forests in China has gradually resumed growth since 2000 [33].
We overlaid the mangrove forest distribution data with the nature reserve range and found that 64% (16,388.9 hectares) of mangroves were already in the mangrove protection area. This shows that, in recent years, the awareness of ecological protection has been continuously strengthened, and the protection of mangrove wetland ecosystems has continued to improve in China.

4.2. Advantages of 2-Meter Resolution Imagery

Most of the mangrove distribution datasets currently released used Landsat data at 30-meter resolution or PALSAR (Phased Array type L-band Synthetic Aperture Radar) data at a 25-meter resolution. On these moderate spatial resolution images, the vegetation texture and spatial details were missing, and the accuracy of mangrove identification was defective. In addition, small and irregularly shaped mangrove areas were difficult to identify and extract accurately.
In this study, satellite remote sensing images with a resolution of 2 m were used for mangrove mapping. The finer spatial resolution makes it possible to delineate scattered, distributed mangrove plots with small areas and to map narrow strips of mangrove plots distributed along the shoreline. This is particularly important for the mapping of mangroves in China because most mangroves patches (more than 10,000 hectares in total) were less than 10 hectares, accounting for about 40% of the total mangrove area in China. Using high spatial resolution remote sensing images, mangrove forest distributions at a finer scale can be extracted and fine changes in information can be quickly detected. The detailed information of the distribution and changes in these mangroves is highly significant for local management agencies to carry out mangrove ecological protection and restoration and to coordinate coastal economic development and ecological protection.

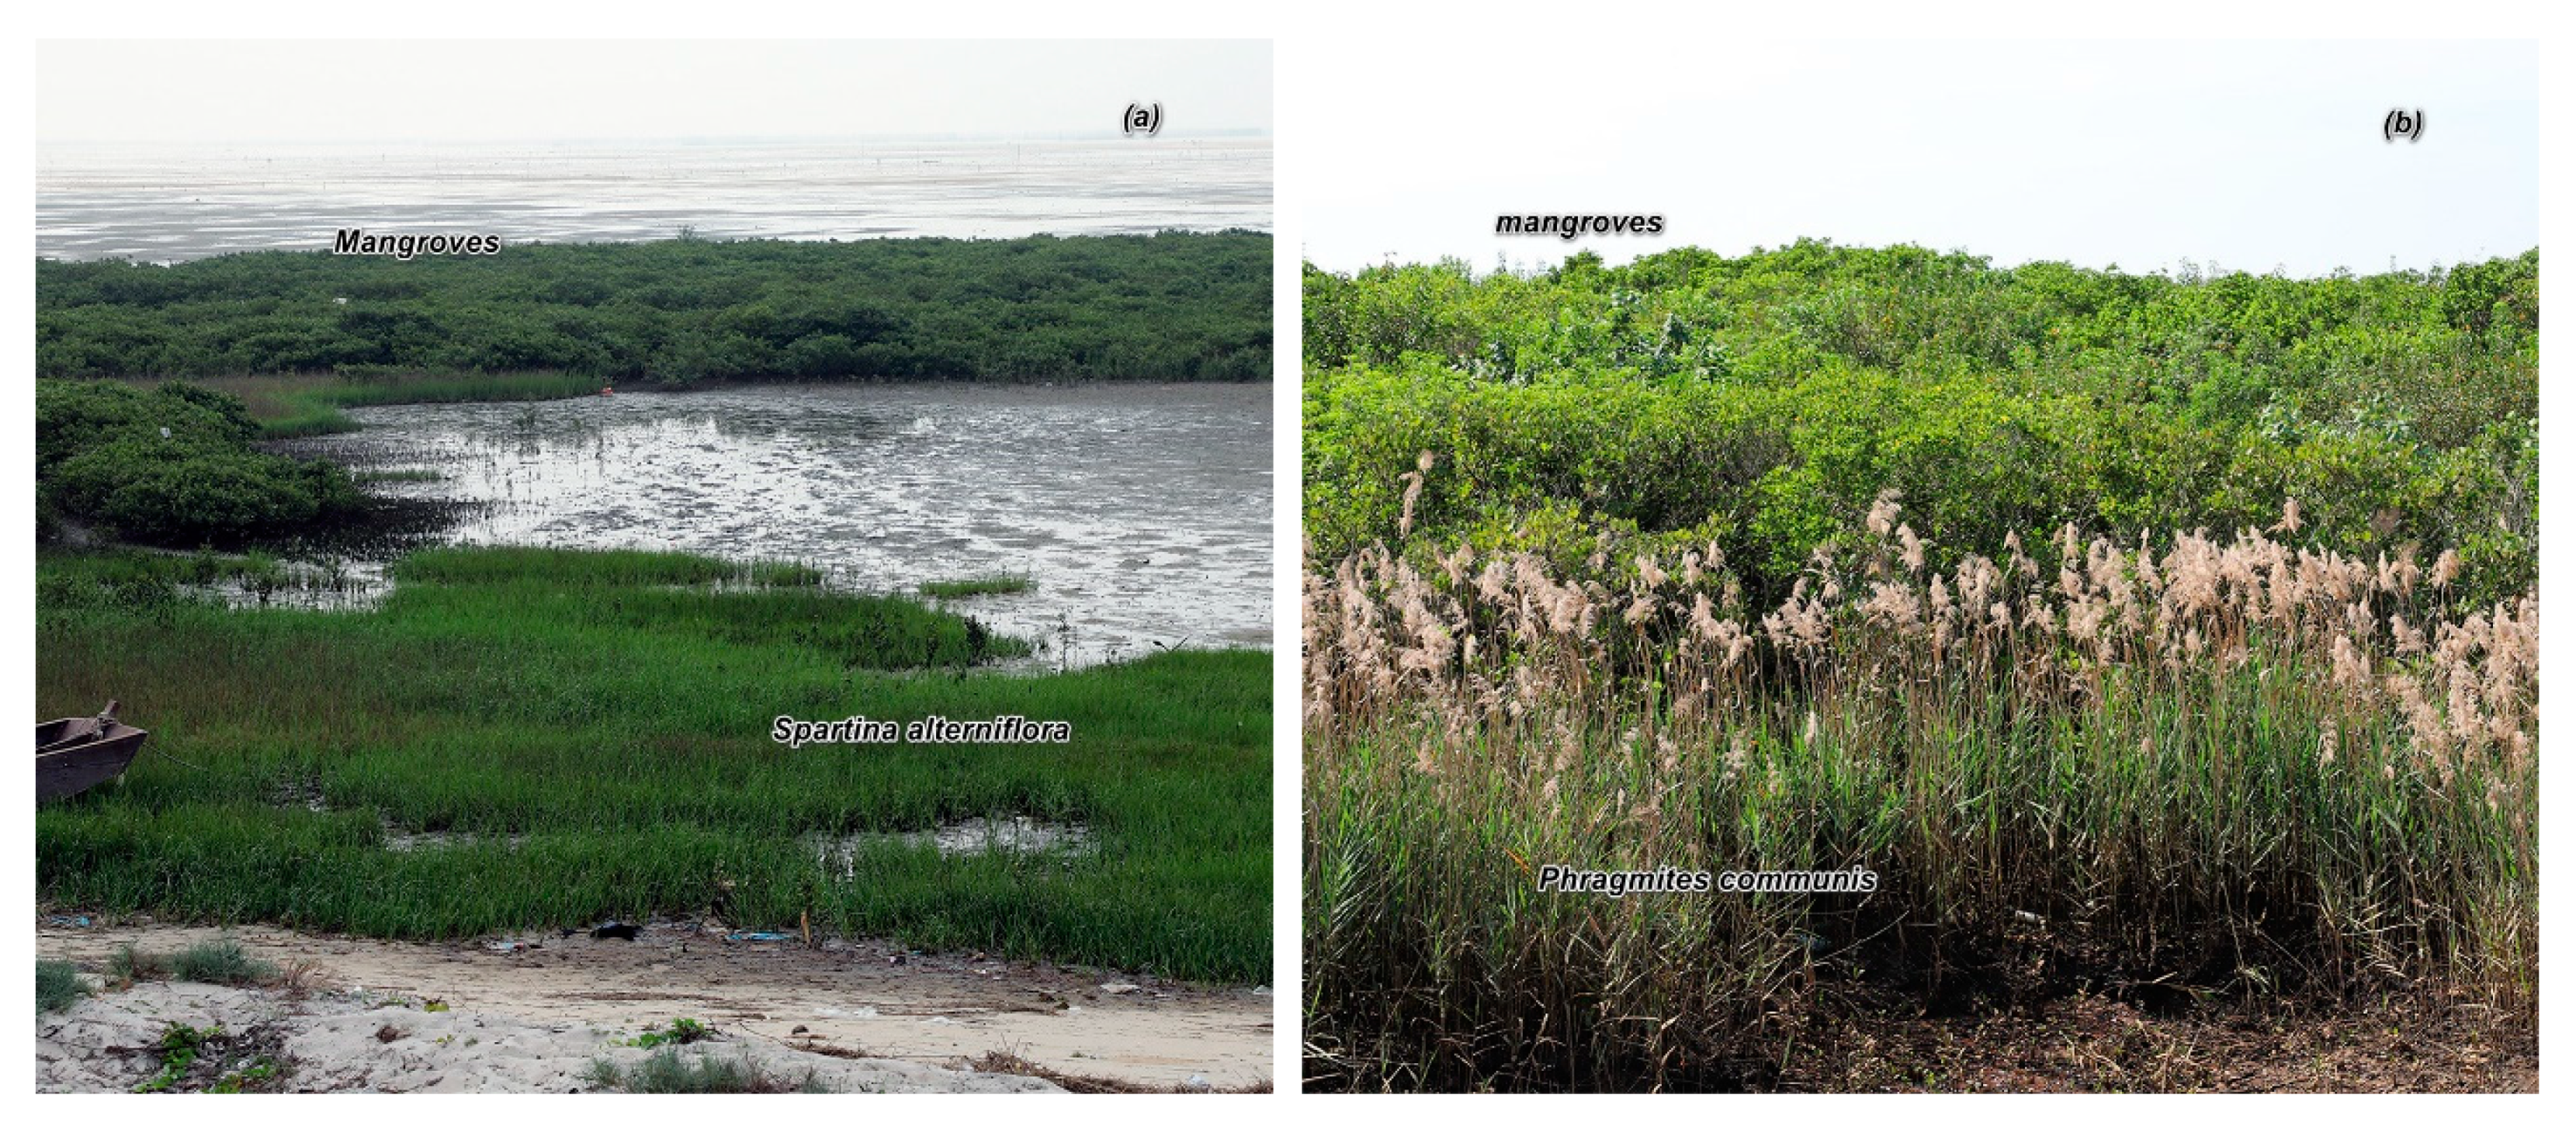
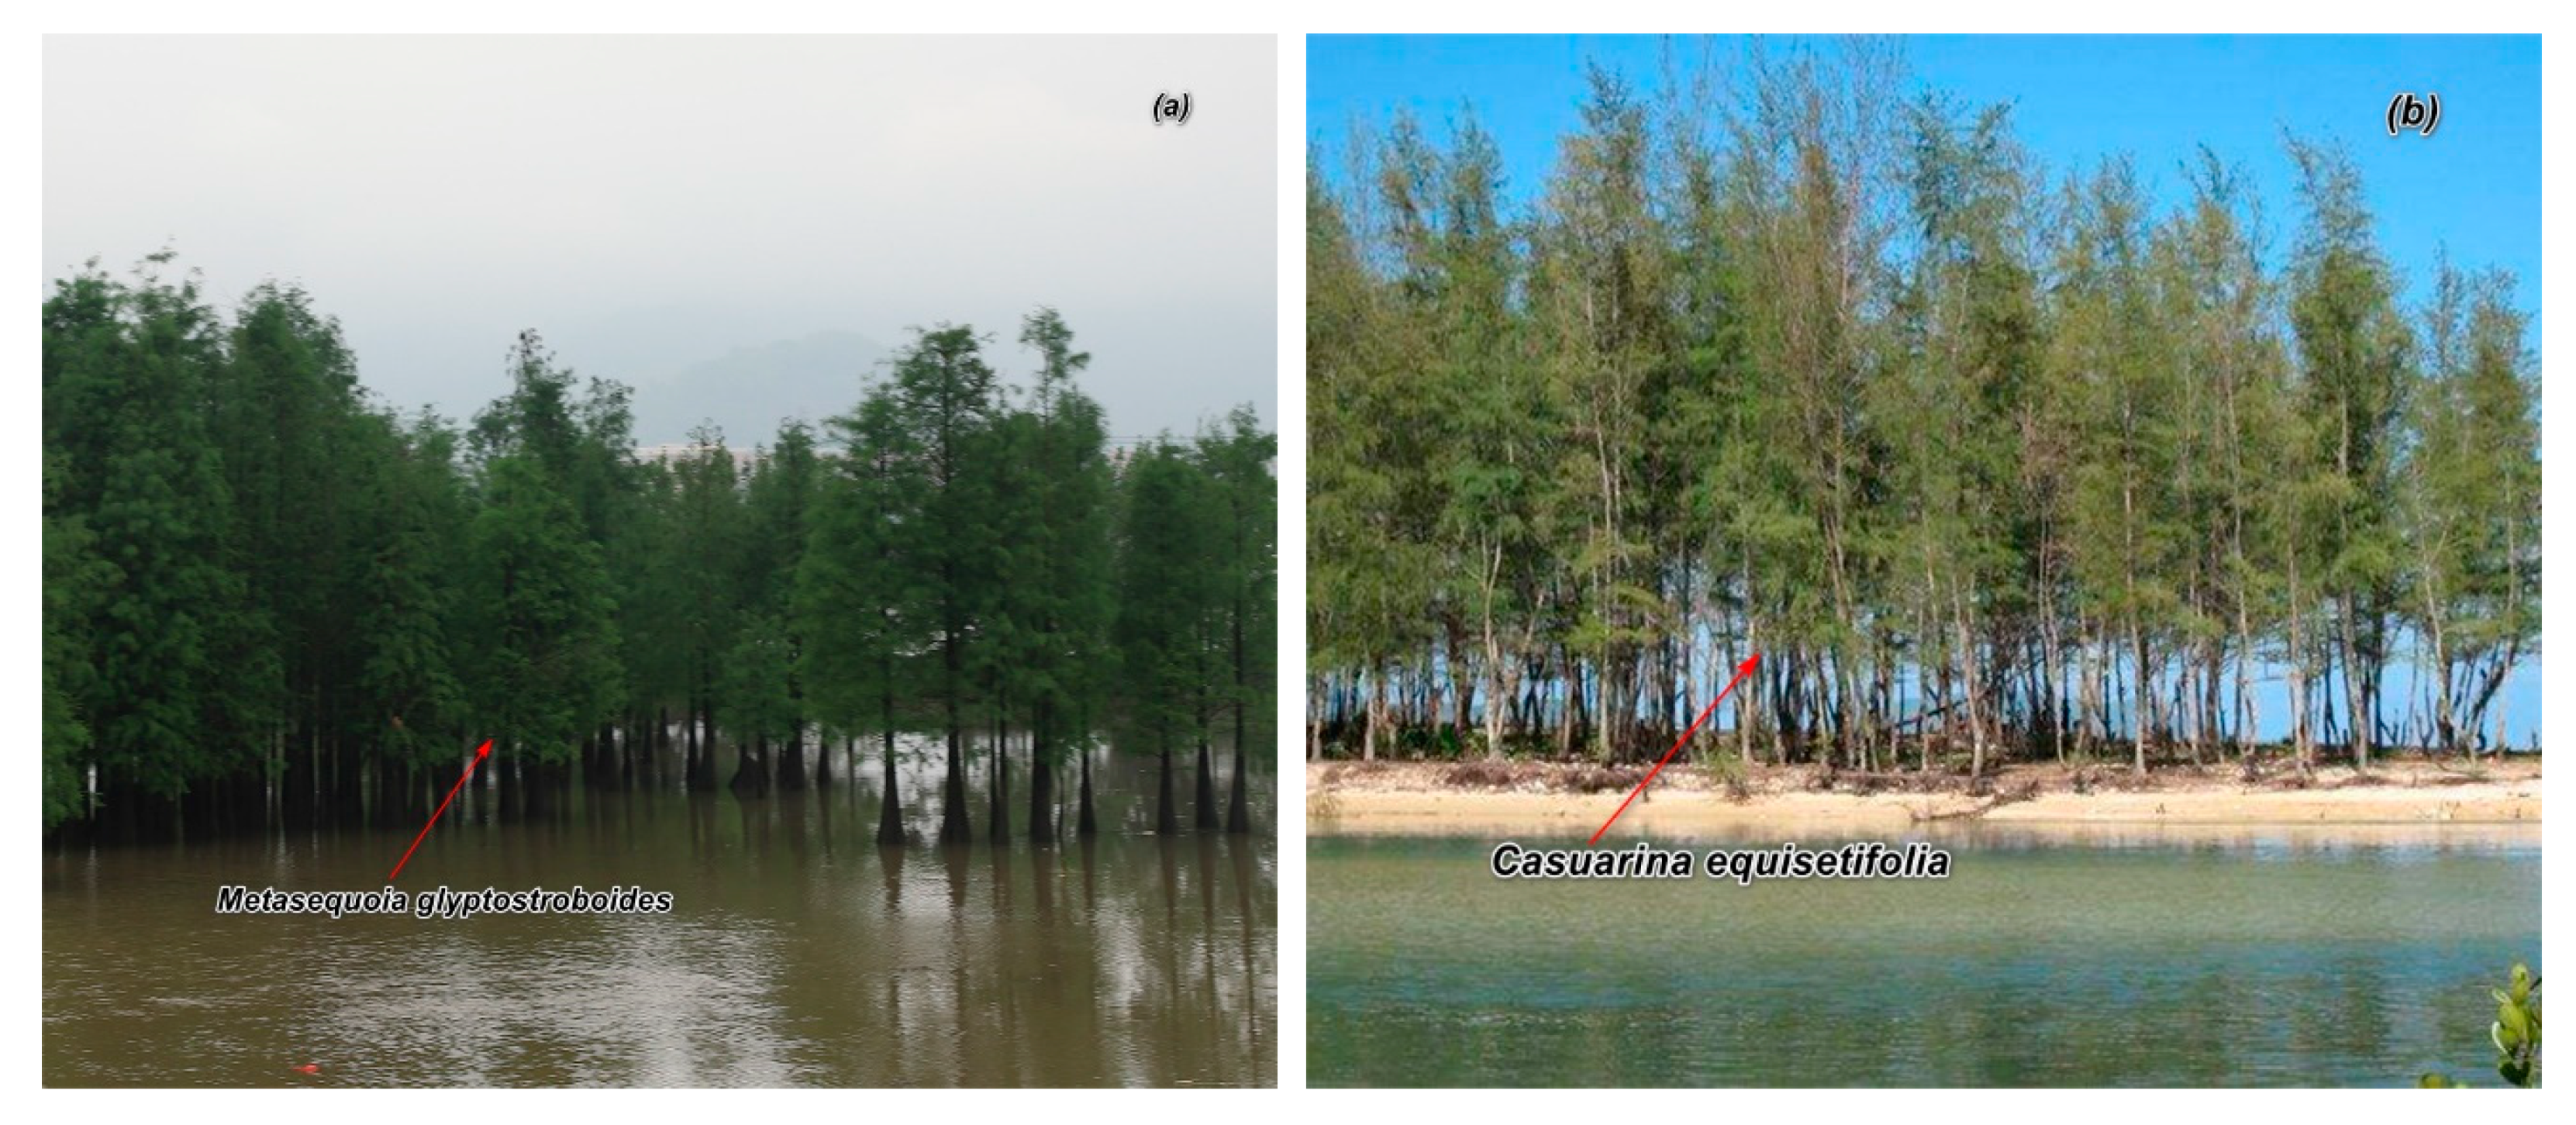
4.3. Confusions between Mangroves and Other Vegetation

Along the southeast coast of China, there exist other types of vegetation growing on the tidal flats where mangrove vegetation grows, and these vegetation types are confused with mangroves in image interpretation. Some vegetation grow in the same habitat as mangroves and form a competitive relationship with mangroves. Such vegetation is typically Spartina alterniflora and Phragmites communis (reed) (Figure A1). Spartina angustifolia was first introduced from the United States in 1979 and was mainly used for wave and beach protection early on. However, because of the lack of local natural enemies, Spartina alterniflora multiplied quickly and invaded the living environment of local species, especially mangroves. Spartina alterniflora or reeds could often be found around mangrove plots. The spectral characteristics of these vegetations are relatively similar, which increases the complexity of mangrove mapping from imagery in these areas.
In addition, the two types of woody vegetation that are easily confused with mangroves in China are Metasequoia glyptostroboides and Casuarina equisetifolia. Figure A2 shows the field photos of Metasequoia and Casuarina. In the southeast coast of China, most of the Metasequoia glyptostroboides trees were planted artificially, and it was an important tree species for coastal protection. Casuarina equisetifolia trees in the coastal areas were either naturally grown or artificially cultivated, and it was also the main tree species for coastal protection. Similar to mangrove vegetation, Metasequoia and Casuarinas grow on the tidal flats or around the nearby areas; sometimes they even grow spatially connected with mangroves. When interpreting mangroves, these types of vegetation need to be distinguished, and comprehensive judgments need to be made in combination with information from field surveys.

4.4. The Importance of Field Work in Mangrove Mapping

Mapping mangroves from remote sensing imagery faces two important difficulties: (1) it is difficult to distinguish mangrove vegetation from adjacent non-mangrove vegetation and (2) it is difficult to distinguish between mangrove and tidal flat herbaceous vegetation (Spartina alterniflora). Using image analysis methods (such as OBIA) alone can hardly generate mangrove maps with high accuracy in large regions. In the OBIA extraction steps in this study, the accuracy of mangrove mapping only reached about 80%. We believe that, in order to produce fine-scale and high-precision mangrove maps, manual editing and strict field verification work are necessary.

4.5. Limitations and Caveats

The mangrove inventory only included mangrove plots with a canopy density of 20% or more. Young plants that were newly planted but not forested were not included in this dataset. In addition, in high-tide images, some low-lying mangroves will be submerged by water bodies, making mangroves difficult to identify and extract. Although most of the images we used were in low tide periods, there may be a small amount of missing mangrove area in some low tide beaches. Furthermore, in the process of the field work, we also found sparsely distributed mangroves with canopy densities less than 20%, and these sparse forests were not included in the MC2018 dataset either. Despite the high spatial resolution of Gaofen-1 and Ziyuan-3 sensors, the spectral resolutions of these sensors are limited and consisted in only the RGB and NIR spectrums. Thus, the use of multispectral and hyperspectral wavelengths and multi-modality, multi-sensor data fusion would show strong potential for mangrove mapping in the future.

5. Conclusions

Remote sensing techniques have become an important method to quickly obtain data about the distribution and change of mangroves. However, the traditional medium-resolution images like Landsat can only obtain relatively coarse mangrove distribution data globally or regionally. With the rapid development of high spatial resolution remote sensing technology, it is necessary to produce fine-scale mangrove data over a large area using higher spatial resolution remote sensing images.
In this research, we used 2-meter spatial resolution remote sensing imagery obtained from GF-1 and ZY-3 satellites, and we employed a hybrid method of object-based image analysis (OBIA), interpreter editing, and field verification. We produced the fine-scale mangrove extent dataset of China in 2018 (MC2018), with an overall accuracy greater than 98%. This dataset can provide detailed information about the mangrove ecosystem status and can support local authorities for mangrove forest planning and management. This study demonstrated the strong potential of the 2-meter resolution satellite imagery of Ziyuan-3 and Gaofen-1 in the annual monitoring of resources and environmental parameters over a large region. The hybrid method used in this study can also provide a reference for fine-scale mangrove monitoring and mapping in other regions of the world.

Author Contributions

Conceptualization, Tao Zhang, Xiaomei Yang, and Shanshan Hu; funding acquisition, Shucheng You; methodology, Tao Zhang, Yun He, Shucheng You, Xiaomei Yang, and Shanshan Hu; project administration, Shucheng You, Xiaomei Yang, and Shanshan Hu; resources, Shucheng You; validation, Yuhang Gan and Aixia Liu; visualization, Yun He, Yuhang Gan, and Aixia Liu; writing–original draft, Tao Zhang and Shanshan Hu; writing–review and editing, Tao Zhang, Yun He, and Xiaomei Yang. All authors have read and agreed to the published version of the manuscript.

Funding

This research was funded by the National Key Research and Development Program of China (NO.2016YFB0501403) and the Ministry of Natural Resources of China (NO.121133000000190020).

Data Availability Statement

The data presented in this study are openly available in [Science Data Bank (ScienceDB)] at [doi:10.11922/sciencedb.00449], reference number [46].

Acknowledgments

The authors would like to thank Wu Houjian, Hu Jianquan of the National Forestry and Grassland Administration, Mu Xinglin, Luo Zhengyu, Wang Zhongwu, Liu Ke, Li Quan, Liu Baocheng, Qu Xiaodong, and Ma Xingwang from LASAC for their assistances in the field work. The authors appreciate the comments and suggestions of anonymous reviewers.

Conflicts of Interest

The authors declare no conflict of interest.

Appendix A

Table A1. Comparison of datasets from different sources mapping mangroves in China.
DatasetsAuthorsYearImage SourceImage ResolutionMangrove Areas in China (ha)Mapping Methods
MC2018Zhang et al. LASAC2018ZY-3, GF-12 m25,683.88Image interpretation and field survey
MFC2018Zheng et al.2018Landsat8, Alos_PalSAR30 m24,602.45Supervised classification
GMW2016Bunting et al.2016Landsat, Alos_PalSAR25 m15,869Supervised classification
Chen2015Chen et al.2015Landsat, Sentinel30 m20,303Supervised classification and manual inspection
Jia2015Jia et al.2015Landsat30 m22,419Supervised classification
SFA2000SFA2000Not clearNot clear22,025 #Mainly field survey
WAM2000Spalding et al.2000Landsat30 m19,788Image interpretation
MFW2000Giri et al., USGS.2000Landsat30 m17,796Supervised classification
# Does not include mangrove areas in Taiwan, Hong Kong, and Macao.
Figure A1. Field photos of (a) Spartina alterniflora and mangroves and (b) Phragmites communis and mangroves.
Ijgi 10 00092 g0a1
Figure A2. Field photos of (a) Metasequoia glyptostroboides and (b) Casuarina equisetifolia.
Ijgi 10 00092 g0a2

References

  1. Giri, C.; Ochieng, E.; Tieszen, L.L.; Zhu, Z.; Singh, A.; Loveland, T.; Masek, J.; Duke, N. Status and distribution of mangrove forests of the world using earth observation satellite data. Glob. Ecol. Biogeogr. 2011, 20, 154–159. [Google Scholar] [CrossRef]
  2. Wang, L.; Jia, M.; Yin, D.; Tian, J. A review of remote sensing for mangrove forests: 1956–2018. Remote Sens. Environ. 2019, 231, 111223. [Google Scholar] [CrossRef]
  3. Rahman, M.R.; Saha, S.K. Multi-resolution segmentation for object-based classification and accuracy assessment of land use/land cover classification using remotely sensed data. Photonirvachak J. Ind. 2008, 36, 189–201. [Google Scholar]
  4. Giri, C.; Long, J.; Abbas, S.; Murali, R.M.; Qamer, F.M.; Pengra, B.; Thau, D. Distribution and dynamics of mangrove forests of South Asia. J. Environ. Manag. 2015, 148, 101–111. [Google Scholar] [CrossRef] [PubMed]
  5. Pham, T.D.; Xia, J.S.; Ha, N.T.; Bui, D.T.; Le, N.N.; Takeuchi, W. A review of remote sensing approaches for monitoring blue carbon ecosystems: Mangroves, seagrasses and salt marshes during 2010–2018. Sensors 2019, 19, 1933. [Google Scholar] [CrossRef] [Green Version]
  6. Barbier, E.B.; Hacker, S.D.; Kennedy, C.; Koch, E.W.; Stier, A.C.; Silliman, B.R. The value of estuarine and coastal ecosystem services. Ecol. Monogr. 2011, 81, 169–193. [Google Scholar] [CrossRef]
  7. FAO. The World’s Mangroves 1980–2005; FAO Forestry Paper: Rome, Italy, 2007; Volume 153, p. 77. [Google Scholar]
  8. Rahman, M.M.; Ullah, M.R.; Lan, M.; Sumantyo, J.T.; Kuze, H.; Tateishi, R. Comparison of Landsat image classification methods for detecting mangrove forests in Sundarbans. Int. J. Remote Sens. 2013, 34, 1041–1056. [Google Scholar] [CrossRef]
  9. Giri, C. Observation and monitoring of mangrove forests using remote sensing: Opportunities and challenges. Remote Sens. 2016, 8, 783. [Google Scholar] [CrossRef] [Green Version]
  10. Spalding, M. World Atlas of Mangroves; Routledge: London, UK, 2010. [Google Scholar]
  11. Hamilton, S.E.; Casey, D. Creation of a high spatio-temporal resolution global database of continuous mangrove forest cover for the 21st century (CGMFC-21). Glob. Ecol. Biogeogr. 2016, 25, 729–738. [Google Scholar] [CrossRef]
  12. Buitre, M.J.C.; Zhang, H.S.; Lin, H. The mangrove forests change and impacts from tropical cyclones in the Philippines using time series satellite imagery. Remote Sens. 2019, 11, 688. [Google Scholar] [CrossRef] [Green Version]
  13. Wang, D.Z.; Wan, B.; Qiu, P.H.; Su, Y.J.; Guo, Q.H.; Wu, X.C. Artificial mangrove species mapping using pleiades-1: An evaluation of pixel-based and object-based classifications with selected machine learning algorithms. Remote Sens. 2018, 10, 294. [Google Scholar] [CrossRef] [Green Version]
  14. Lymburner, L.; Bunting, P.; Lucas, R.; Scarth, P.; Alam, I.; Phillips, C.; Ticehurst, C.; Held, A. Mapping the multi-decadal mangrove dynamics of the Australian coastline. Remote Sens. Environ. 2019, 238, 111185. [Google Scholar] [CrossRef]
  15. Aziz, A.A.; Phinn, S.; Dargusch, P. Investigating the decline of ecosystem services in a production mangrove forest using Landsat and object-based image analysis. Estuar. Coast. Shelf Sci. 2015, 164, 353–366. [Google Scholar] [CrossRef] [Green Version]
  16. Zhao, C.; Qin, C.-Z. 10-m-resolution mangrove maps of China derived from multi-source and multi-temporal satellite observations. ISPRS J. Photogramm. 2020, 169, 389–405. [Google Scholar] [CrossRef]
  17. Whitt, A.A.; Coleman, R.; Lovelock, C.E.; Gillies, C.; Ierodiaconou, D.; Liyanapathirana, M.; Macreadie, P.I. March of the mangroves: Drivers of encroachment into southern temperate saltmarsh. Estuar. Coast. Shelf Sci. 2020, 240, 106776. [Google Scholar] [CrossRef]
  18. Xia, J.S.; Yokoya, N.; Pham, T.D. Probabilistic mangrove species mapping with multiple-source remote-sensing datasets using label distribution learning in Xuan Thuy National Park, Vietnam. Remote Sens. 2020, 12, 3834. [Google Scholar] [CrossRef]
  19. Zheng, Y.H.; Takeuchi, W. Quantitative assessment and driving force analysis of mangrove forest changes in China from 1985 to 2018 by integrating optical and radar imagery. ISPRS Int. J. Geo-Inf. 2020, 9, 513. [Google Scholar] [CrossRef]
  20. Pham, T.D.; Bui, D.T.; Yoshino, K.; Le, N.N. Optimized rule-based logistic model tree algorithm for mapping mangrove species using ALOS PALSAR imagery and GIS in the tropical region. Environ. Earth Sci. 2018, 77, 159. [Google Scholar] [CrossRef]
  21. Bunting, P.; Rosenqvist, A.; Lucas, R.M.; Rebelo, L.M.; Hilarides, L.; Thomas, N.; Hardy, A.; Itoh, T.; Shimada, M.; Finlayson, C.M. The global mangrove watch—A new 2010 global baseline of mangrove extent. Remote Sens. 2018, 10, 1669. [Google Scholar] [CrossRef] [Green Version]
  22. Thomas, N.; Bunting, P.; Lucas, R.; Hardy, A.; Rosenqvist, A.; Fatoyinbo, T. Mapping mangrove extent and change: A globally applicable approach. Remote Sens. 2018, 10, 1466. [Google Scholar] [CrossRef] [Green Version]
  23. Chen, L.Z.; Wang, Y.H.; Lin, G.H. Recent progresses in mangrove conservation, restoration and research in China. J. Plant Ecol. 2009, 2, 45–54. [Google Scholar] [CrossRef]
  24. Lee, T.M.; Yeh, H.C. Applying remote sensing techniques to monitor shifting wetland vegetation: A case study of Danshui River estuary mangrove communities, Taiwan. Ecol. Eng. 2009, 35, 487–496. [Google Scholar] [CrossRef]
  25. Ren, H.; Wu, X.M.; Ning, T.Z.; Huang, G.; Wang, J.; Jian, S.G.; Lu, H.F. Wetland changes and mangrove restoration planning in Shenzhen Bay, Southern China. Landsc. Ecol. Eng. 2011, 7, 241–250. [Google Scholar] [CrossRef]
  26. Zhang, C.H.; Kovacs, J.M.; Wachowiak, M.P.; Flores-Verdugo, F. Relationship between hyperspectral measurements and mangrove leaf nitrogen concentrations. Remote Sens. 2013, 5, 891–908. [Google Scholar] [CrossRef] [Green Version]
  27. Zhang, C.H.; Kovacs, J.M.; Liu, Y.L.; Flores-Verdugo, F.; Flores-de-Santiago, F. Separating mangrove species and conditions using laboratory hyperspectral data: A case study of a degraded mangrove forest of the Mexican Pacific. Remote Sens. 2014, 6, 11673–11688. [Google Scholar] [CrossRef] [Green Version]
  28. Wang, T.; Zhang, H.S.; Lin, H.; Fang, C.Y. Textural-spectral feature-based species classification of mangroves in Mai Po Nature Reserve from Worldview-3 Imagery. Remote Sens. 2016, 8, 24. [Google Scholar] [CrossRef] [Green Version]
  29. Wang, M.; Cao, W.Z.; Guan, Q.S.; Wu, G.J.; Wang, F.F. Assessing changes of mangrove forest in a coastal region of southeast China using multi-temporal satellite images. Estuar. Coast. Shelf Sci. 2018, 207, 283–292. [Google Scholar] [CrossRef]
  30. Lu, C.Y.; Liu, J.F.; Jia, M.M.; Liu, M.Y.; Man, W.D.; Fu, W.W.; Zhong, L.X.; Lin, X.Q.; Su, Y.; Gao, Y.B. Dynamic analysis of mangrove forests based on an optimal segmentation scale model and multi-seasonal images in Quanzhou Bay, China. Remote Sens. 2018, 10, 2020. [Google Scholar] [CrossRef] [Green Version]
  31. Li, M.S.; Mao, L.; Shen, W.; Liu, S.; Wei, A. Change and fragmentation trends of Zhanjiang mangrove forests in southern China using multi-temporal Landsat imagery (1977–2010). Estuar. Coast. Shelf Sci. 2013, 130, 111–120. [Google Scholar] [CrossRef]
  32. Hu, L.; Li, W.; Xu, B. Monitoring mangrove forest change in China from 1990 to 2015 using Landsat-derived spectral-temporal variability metrics. Int. J. Appl. Earth Obs. 2018, 73, 88–98. [Google Scholar] [CrossRef]
  33. Jia, M.M.; Wang, Z.M.; Zhang, Y.Z.; Mao, D.H.; Wang, C. Monitoring loss and recovery of mangrove forests during 42 years: The achievements of mangrove conservation in China. Int. J. Appl. Earth Obs. 2018, 73, 535–545. [Google Scholar] [CrossRef]
  34. Jia, M.M.; Wang, Z.M.; Li, L.; Song, K.S.; Ren, C.Y.; Liu, B.; Mao, D.H. Mapping China’s mangroves based on an object-oriented classification of Landsat imagery. Wetlands 2014, 34, 277–283. [Google Scholar] [CrossRef]
  35. Chen, B.Q.; Xiao, X.M.; Li, X.P.; Pan, L.H.; Doughty, R.; Ma, J.; Dong, J.W.; Qin, Y.W.; Zhao, B.; Wu, Z.X.; et al. A mangrove forest map of China in 2015: Analysis of time series Landsat 7/8 and Sentinel-1A imagery in Google Earth Engine cloud computing platform. ISPRS J. Photogramm. 2017, 131, 104–120. [Google Scholar] [CrossRef]
  36. Abdel-Hamid, A.; Dubovyk, O.; Abou El-Magd, I.; Menz, G. Mapping mangroves extents on the red sea coastline in Egypt using polarimetric SAR and high resolution optical remote sensing data. Sustainability 2018, 10, 646. [Google Scholar] [CrossRef] [Green Version]
  37. Kamal, M.; Ningam, M.U.L.; Alqorina, F.; Wicaksono, P.; Murti, S.H. Combining field and image spectral reflectance for mangrove species identification and mapping using WorldView-2 image. Earth Resour. Environ. Remote Sens. GIS Appl. IX 2018, 10790, 1–9. [Google Scholar] [CrossRef]
  38. Pham, T.D.; Yokoya, N.; Bui, D.T.; Yoshino, K.; Friess, D.A. Remote sensing approaches for monitoring mangrove species, structure, and biomass: Opportunities and challenges. Remote Sens. 2019, 11, 230. [Google Scholar] [CrossRef] [Green Version]
  39. Pereira, F.R.D.; Kampel, M.; Soares, M.L.G.; Estrada, G.C.D.; Bentz, C.; Vincent, G. Reducing uncertainty in mapping of mangrove aboveground biomass using airborne discrete return lidar data. Remote Sens. 2018, 10, 637. [Google Scholar] [CrossRef] [Green Version]
  40. Han, X.X.; Feng, L.; Hu, C.M.; Kramer, P. Hurricane-induced changes in the Everglades National Park Mangrove Forest: Landsat observations between 1985 and 2017. J. Geophys. Res. Biogeosci. 2018, 123, 3470–3488. [Google Scholar] [CrossRef]
  41. Tang, X.; Zhou, P.; Zhang, G.; Wang, X.; Pan, H. Geometric accuracy analysis model of the ZiYuan-3 satellite without GCPs. Photogramm. Eng. Remote Sens. 2015, 81, 927–934. [Google Scholar] [CrossRef]
  42. Xu, W.; Gong, J.; Wang, M. Development, application, and prospects for Chinese land observation satellites. Geo Spat. Inf. Sci. 2014, 17, 102–109. [Google Scholar] [CrossRef]
  43. Cao, J.J.; Leng, W.C.; Liu, K.; Liu, L.; He, Z.; Zhu, Y.H. Object-based mangrove species classification using unmanned aerial vehicle hyperspectral images and digital surface models. Remote Sens. 2018, 10, 89. [Google Scholar] [CrossRef] [Green Version]
  44. Heenkenda, M.K.; Joyce, K.E.; Maier, S.W.; Bartolo, R. Mangrove species identification: Comparing WorldView-2 with aerial photographs. Remote Sens. 2014, 6, 6064–6088. [Google Scholar] [CrossRef] [Green Version]
  45. Liu, K.; Liu, L.; Liu, H.X.; Li, X.; Wang, S.G. Exploring the effects of biophysical parameters on the spatial pattern of rare cold damage to mangrove forests. Remote Sens. Environ. 2014, 150, 20–33. [Google Scholar] [CrossRef]
  46. Zhang, T.; You, S.; Yang, X.; Hu, S. Mangroves Map of China 2018 (MC2018) Derived from 2-Meter Resolution Satellite Observations and Field Data; Science Data Bank: Beijing, China, 2020; Volume 1. [Google Scholar] [CrossRef]
  47. Wu, P.; Zhang, J.; Ma, Y.; Li, X. Remote sensing monitoring and analysis of the changes of mangrove resource in China in the past 20 years. Adv. Mar. Sci. 2013, 31, 406–414. [Google Scholar]
  48. Liao, B.; Zhang, Q. Area, distribution and species composition of mangroves in China. Wetl. Sci. 2014, 12, 435–440. [Google Scholar]
  49. Zhang, Y.; Mishra, R.K. A review and comparison of commercially available pan-sharpening techniques for high resolution satellite image fusion. In Proceedings of the 2012 IEEE International Geoscience and Remote Sensing Symposium, Munich, Germany, 22–27 July 2012; pp. 182–185. [Google Scholar]
  50. Wang, W.Q.; Wang, M. Mangroves in China; Science Press: Beijing, China, 2007. [Google Scholar]
  51. Benz, U.C.; Hofmann, P.; Willhauck, G.; Lingenfelder, I.; Heynen, M. Multi-resolution, object-oriented fuzzy analysis of remote sensing data for GIS-ready information. ISPRS J. Photogramm. 2004, 58, 239–258. [Google Scholar] [CrossRef]
  52. Chang, C.C.; Lin, C.J. LIBSVM: A library for support vector machines. ACM Trans. Intell. Syst. Technol. 2011, 2, 1–27. [Google Scholar] [CrossRef]
  53. Li, X.; Gong, P.; Zhou, Y.; Wang, J.; Bai, Y.; Chen, B.; Hu, T.; Xiao, Y.; Xu, B.; Yang, J.; et al. Mapping global urban boundaries from the global artificial impervious area (GAIA) data. Environ. Res. Lett. 2020, 15, 94044. [Google Scholar] [CrossRef]
Figure 1. Illustration of the study area for mapping mangroves in China; most of the mangroves are distributed within 20 km of the coastline.
Ijgi 10 00092 g001
Figure 2. Overview of workflow for producing the mangrove China 2018 dataset.
Ijgi 10 00092 g002
Figure 3. Illustration of field verification information of (a) field points and field routes overlapped on the 2-meter imagery; field photo of (b) typical mangrove species Rhizophora stylosa; (c) typical mangrove species Bruguiera gymnorrhiza; and (d) hypocotyl of Bruguiera gymnorrhiza.
Ijgi 10 00092 g003
Figure 4. Spatial distribution of China’s mangrove forests in 2018.
Ijgi 10 00092 g004
Figure 5. Area distribution of mangrove forests in China in 2018 along the (a) longitudinal direction and the (b) latitudinal direction.
Ijgi 10 00092 g005
Figure 6. Distribution of mangrove forests in China within the proximity of urban areas. (a) Mangrove areas within each segmented buffer zone with an increment buffer distance of 1 km; (b) the cumulative percentages of mangrove areas within the proximity of urban regions.
Ijgi 10 00092 g006
Figure 7. Comparison of mangrove patches from MC2018, Jia2015, Chen2015, GMW2016, and MFW2000 in the Guangxi Qinzhou Bay test region.
Ijgi 10 00092 g007aIjgi 10 00092 g007b
Figure 8. Comparison of mangrove patches from MC2018, Jia2015, Chen2015, GMW2016, and MFW2000 in the Hainan Dongzhai Port test region.
Ijgi 10 00092 g008aIjgi 10 00092 g008b
Table 1. Band wavelengths and pixel sizes for ZY-3 and GF-1 satellite images. PMS refers to the sensors with pan and multispectral bands.
ZY3-01/02 PMSGF-1A/1B/1C/1D PMS
BandsWavelength (μm)Pixel SizeBandsWavelength (μm)Pixel Size
Pan (nadir)0.45–0.902.1 mPan (nadir)0.45–0.902 m
MS10.45–0.525.8 mMS10.45–0.528 m
MS20.52–0.595.8 mMS20.52–0.598 m
MS30.63–0.695.8 mMS30.63–0.698 m
MS40.77–0.895.8 mMS40.77–0.898 m
Table 2. Area distribution of mangrove forests in China in 2018 in different provinces.
Mangrove Area (ha)Percentage
Guangdong10,330.7440.22%
Guangxi8449.0032.90%
Hainan4676.7118.21%
Fujian1019.403.97%
Taiwan600.322.34%
Hong Kong539.032.10%
Zhejiang48.680.19%
Macao20.010.08%
Total25,683.88100.00%
Table 3. Accuracy assessment of mangrove China 2018 (MC2018) using ground truth data.
Ground Truth Points
ClassMangroveNon-Mangrove
Map pointsMangrove102510
Non-mangrove71258
Producer’s accuracy (PA) 99.3%
User’s accuracy (UA) 99.0%
Overall accuracy (OA) 99.3%
Kappa coefficient 0.985
Publisher’s Note: MDPI stays neutral with regard to jurisdictional claims in published maps and institutional affiliations.

