
TouchTerrain—3D Printable Terrain Models

1
Department of Geological and Atmospheric Sciences and Human-Computer Interaction Program, Iowa State University, Ames, IA 50013, USA
2
Kansas Geological Survey, Lawrence, KS 66047, USA
3
Department of Geological and Atmospheric Sciences Iowa State University, Ames, IA 50013, USA
*
Author to whom correspondence should be addressed.
ISPRS Int. J. Geo-Inf. 2021, 10(3), 108; https://0-doi-org.brum.beds.ac.uk/10.3390/ijgi10030108
Submission received: 31 December 2020
/
Revised: 16 February 2021
/
Accepted: 19 February 2021
/
Published: 25 February 2021
(This article belongs to the Special Issue Multimedia Cartography)
Abstract
:TouchTerrain is a simple-to-use web application that makes creating 3D printable terrain models from anywhere on the globe accessible to a wide range of users, from people with no GIS expertise to power users. For coders, a Python-based standalone version is available from the open-source project’s GitHub repository. Analyzing 18 months of web analytics gave us a preliminary look at who is using the TouchTerrain web application and what their models are used for; and to map out what terrains on the globe they chose to 3D print. From July 2019 to January 2021, more than 20,000 terrain models were downloaded. Models were created for many different use cases, including education, research, outdoor activities and crafting mementos. Most models were realized with 3D printers, but a sizable minority used CNC machines. Our own experiences with using 3D printed terrain in a university setting have been very positive so far. Anecdotal evidence points to the strong potential for 3D printed terrain models to provide significant help with specific map-related tasks. For the introductory geology laboratory, 3D printed models were used as a form of “training wheels” to aid beginning students in learning to read contour maps, which are still an important tool for geology.
Keywords:
3D printing; topography; terrain; elevation; geoscience education; web; Python; Earth Engine; open source1. Introduction
One of the fundamental competencies of geoscientists is to describe the spatial nature of the solid Earth so the processes that modify it can be interpreted [1]. Indeed, the physical morphology of Earth has profound impacts on the evolution of species, the distribution of weather and climate, and provides the basis for millions of economic decisions made by governments, landowners, developers, architects and engineers every day.
Terrain, the surface of the Earth, is of fundamental importance for many aspects of the geosciences, be they education, research, engineering or resource management. Terrain is also a pivotal component for related efforts such as hydrology and climate modelling. Even when terrain does not play a large part in our daily lives, it is often part of the mental residue we collect from some places that we had a connection to where we grew up, where we went to school, where we traveled on vacation or where we went mountain biking. As such, “experiencing terrain” can afford a form of emotional connection to times and places that were important to us in some form and it can help to lead us back to them.
Despite this importance, the scale and nature of terrain is often difficult for people to comprehend because it is so much larger than the scale of a human being. Field trips, theoretically the most genuine way to experience terrain to the geology student, are often not feasible, which is why most of the time, terrain is only experienced intermittently through interacting with some form of cartographic artifact (e.g., a map). Terrain maps vary from 2D topographic maps, traditionally printed on paper, to various forms of 3D multimedia cartography viewed on a computer screen or projected in 3D “caves”.
Such terrain maps are visualizations of data in the form of Digital Elevation Models (DEM), also known as a Digital Terrain Model (DTM) or Digital Surface Model (DSM). These digital models represent terrain as elevation offsets from sea level and are typically stored in a rasterized height field. Technology for creating such digital elevation models has proliferated rapidly over recent decades, both in terms of their coverage and their resolution. As of 2021, the globe has been fully covered by multiple datasets of various resolutions, such as the satellite derived ALOS World 3D–30m (AW3D30) DEM with a 30 m resolution at the equator [2]. A 1 km resolution DEM that includes the entire seafloor bathymetry also exists. In the US, the United States Geological Survey (USGS) maintains the nationwide 10 m resolution National Elevation Dataset (NED); its 3D Elevation Program (3DEP) is on track to create nationwide lidar coverage by 2023, affording a roughly 1 m resolution DEM.
Although the details are still debated [3], it seems clear that interacting with 3D terrain data “in 3D” should make it easier to perform map-related tasks as it imposes a lower cognitive burden than having to “translate” 2D information (such as 2D terrain contours) into a 3D mental model. Indeed, the difficulty students have when asked to make qualitative and quantitative measurements using 2D topographic maps has long been documented [4,5,6,7]. Beginner students often find it difficult to make the leap from reading a topographic map and “seeing” the 3D shape that it represents in their mind’s eye. Using 3D computer graphics, even when displayed on a standard (i.e., non-stereo) display, affords the 3D cartographer a great deal of flexibility with regard to visualization (symbolization) of the terrain elevation, possible in conjunction with other terrain-based data. Increasingly sophisticated techniques are being developed to enable the user to interact with the data in ways that mimic the manipulation of everyday physical objects.
Indeed, the promise of “natural interaction” with 3D data is at the heart of value proposition for virtual reality (VR), augmented reality, and related technologies. VR cartography has been explored in recent years, for example by [8,9,10], and has shown promise. However, despite significant advances in recent VR technology, using VR to interact with 3D maps still requires a substantial amount of expertise in operating sophisticated hardware and software, imposing nontrivial hindrances to creating suitably natural user interactions. This makes VR costly and often impractical to deploy, especially to large audiences and in everyday “low-tech” scenarios. For most people, experiencing the majesty of the Grand Canyon from their living room or classroom is much more likely to involve Google Earth than donning a VR Head-Mounted Display (HMD).
3D printed terrain models (or physical, tangible models in general) fall on the opposite side of VR on the 3D technology spectrum. By their very nature, physical models are static. Unlike VR (or 3D computer graphics models in general), they cannot effortlessly change their colors or any other visual aspect. However, physical models bring something to the user that few, if any, VR systems can provide, an aspect that is usually neglected in cartography [11,12,13]—the sense of touch.
With tangibility, the complexity of smooth and efficient interaction with the model is reduced to triviality. From handling everyday objects, we already know how to perform a “rotate”, “pan” or “zoom in” on a physical terrain model, either using our hands or, for very large models, walking around them. No need to look up which mouse buttons are used for zoom, pan and rotate. Given good lighting conditions, just handling the model reveals its surface details (plus, if available, painted colors or drawn annotations), without the need for complex 3D rendered visual effects like specular highlights, shaders or ray tracing. As a “no-tech” solution, a physical terrain model can be handled outdoors during glaring sunlight and during rain; it never stops working and has no batteries that can run out.
More importantly, the tactile aspect, i.e., the ability to feel the model’s surface details (and its general macro shape), in concert with a visual exploration creates a much stronger sensory impression and potentially a much more vibrant and memorable mental model of the terrain. No wonder that we are intuitively tempted to touch an interesting looking physical object and run our fingers over it. Despite often being discouraged in children, actively touching a new object provides an underappreciated yet integral part of first exploring, and later understanding, complex objects.
A variety of approaches can be used to obtain elevation data and convert the DEM into a format suitable for 3D printing. Given sufficient expertise, a multi-stage workflow using 3D modelling software, such as Blender (with the BlenderGIS plugin [14], Meshlab, Meshmixer, Sketchup or threejs; and/or GIS software, such as ArcGIS, Global Mapper or QGIS (with its DEMto3D plugin [15]) can be developed to extrude the elevation values into a triangle surface that is part of a watertight mesh. Terrain2STL [16] and The Terrainator [17] are easy-to-use, free web applications with a approach similar to the TouchTerrain web application. However, they appear not to be in active development and lack many of the DEM sources and usability features that TouchTerrain offers.
Hobbyist-level 3D printers are now cheap enough and their software has matured enough to make filament-based 3D printing affordable to many. In addition to being operated as a hobby, 3D printers are now part of many makerspaces, schools, workshops and offices, where they can be used to print the 3D model files downloaded from TouchTerrain. Typical hobbyist-level 3D printers can print models with horizontal extents ranging from 10 × 10 cm to 40 × 40 cm, with very little material cost. With TouchTerrain, larger 3D terrain models can be assembled from multiple smaller tiles. The large model is split into equal sized tiles of a size small enough to be printed on a typical hobbyist 3D printer. After 3D printing each terrain tile separately, the tiles are assembled (e.g., via glue) into a much larger model. Depending on their use case, 3D terrain models can be painted or annotated with pencils.
3D printed terrain models have been used in several undergraduate geology courses at Iowa State University over the last 3 years, both in classroom exercise and to support geologic mapping in the field. In the classroom, 3D printed terrain models can be used in conjunction with paper contour maps of the same area to help students better understand the fundamental principles of contour maps and to provide a novel tool for supporting all learning styles. In the field, 3D terrain models were used to situate the students geographically in the area and to permit them to put annotations about their field work directly on the models.
TouchTerrain has grown in popularity, especially since version 3 was released in October 2020, which introduced a modern GUI and several features requested by users. Based on telemetry and feedback from TouchTerrain users, we attempted to answer the following research questions: Who are our users? For what purpose are terrain models used for? What areas on the globe are most attractive to 3D terrain print?
The rest of the paper is structured as follows: Section 2 provides a historical context for 3D physical terrain models. Section 3 gives an overview of the 3D printed process in general, followed by sections about how to use the TouchTerrain web application (server version), the standalone version and will describe some of its implementation details. The web application, which has been running for several years, has collected anonymous usage information via Google Analytics. Section 4 reports on this web usage and includes an analysis of feedback from 1500 users about how they intended to use their 3D terrain models. Section 5 provides more details on the use of 3D printed terrain models at Iowa State University geology curriculum followed by conclusions and future work in Section 6. Figure A1, Figure A2, Figure A3 and Figure A4 in Appendix A show images of 3D printed terrain models.
2. Background: Usage of Physical 3D Terrain Models in Geography
3D physical terrain models have long been used in geography and related fields. The following briefly covers some of these uses to provide context to the TouchTerrain project. Historically, physical 3D terrain models have been used primarily to support planning efforts in an engineering or a military context [18]. For an extensive description of such historical uses, cf. Chapter 2.1 of [19].
Priestnall [20] describes the partial reconstruction of a 4.57 m by 4.27 m plaster terrain model of the Lake District in the UK that was created in 1875. The model consisted of 142 tiles, each 1 × 1 foot. Each tile was created and painted by hand, based on Ordnance Survey of England’s topographic maps. The model was created to promote the burgeoning tourism in the region. Viewers walked around the model to gain an appreciation of the landscape and to plan their own holiday excursions. In this way, they became familiar with the region without having to travel across it. Compared to smaller, handheld 3D models, such large 3D terrain models naturally provide a much fuller context but impose a different navigational paradigm. Users must move around the model rather than rotating them directly with their hands. Some interior parts of the model may be inaccessible to closer inspection.
Although recently produced terrain models are typically created in a purely machine-driven manufacturing context, there can still be room for the cartographic artistry of the human touch. Comparing two 3D models of the Eiger (Switzerland), Welter [21] pointed out that hand-made and hand-painted models can be cartographically superior to the technically precise, computer generated models because…? A better, “hybrid” approach would be to use technology to quickly and precisely generate most of the geometry and to then “touch-up” or “post-process” the model by hand with paint to impart the artistic feel and cartographic quality of the traditional, hand-made models.
Kete [22] describes the creation of a 3D map which combines elevation data with infrastructure objects, such as roads, ski runs and ski lifts. Cartographic principles, such as generalization, were applied to the infrastructure data. Four tiles, each measuring 245 × 356 × 203 mm, were printed by a plaster-powder based 3D printer (Z510), which also applied color to the print surface. A final layer of epoxy resin was applied to stabilize the powder. While offering the advantage of direct color manufacturing, power-based prints are comparatively expensive and far more fragile than plastic-based 3D prints, even after being coated with epoxy resin.
2.1. Research in an Educational Context
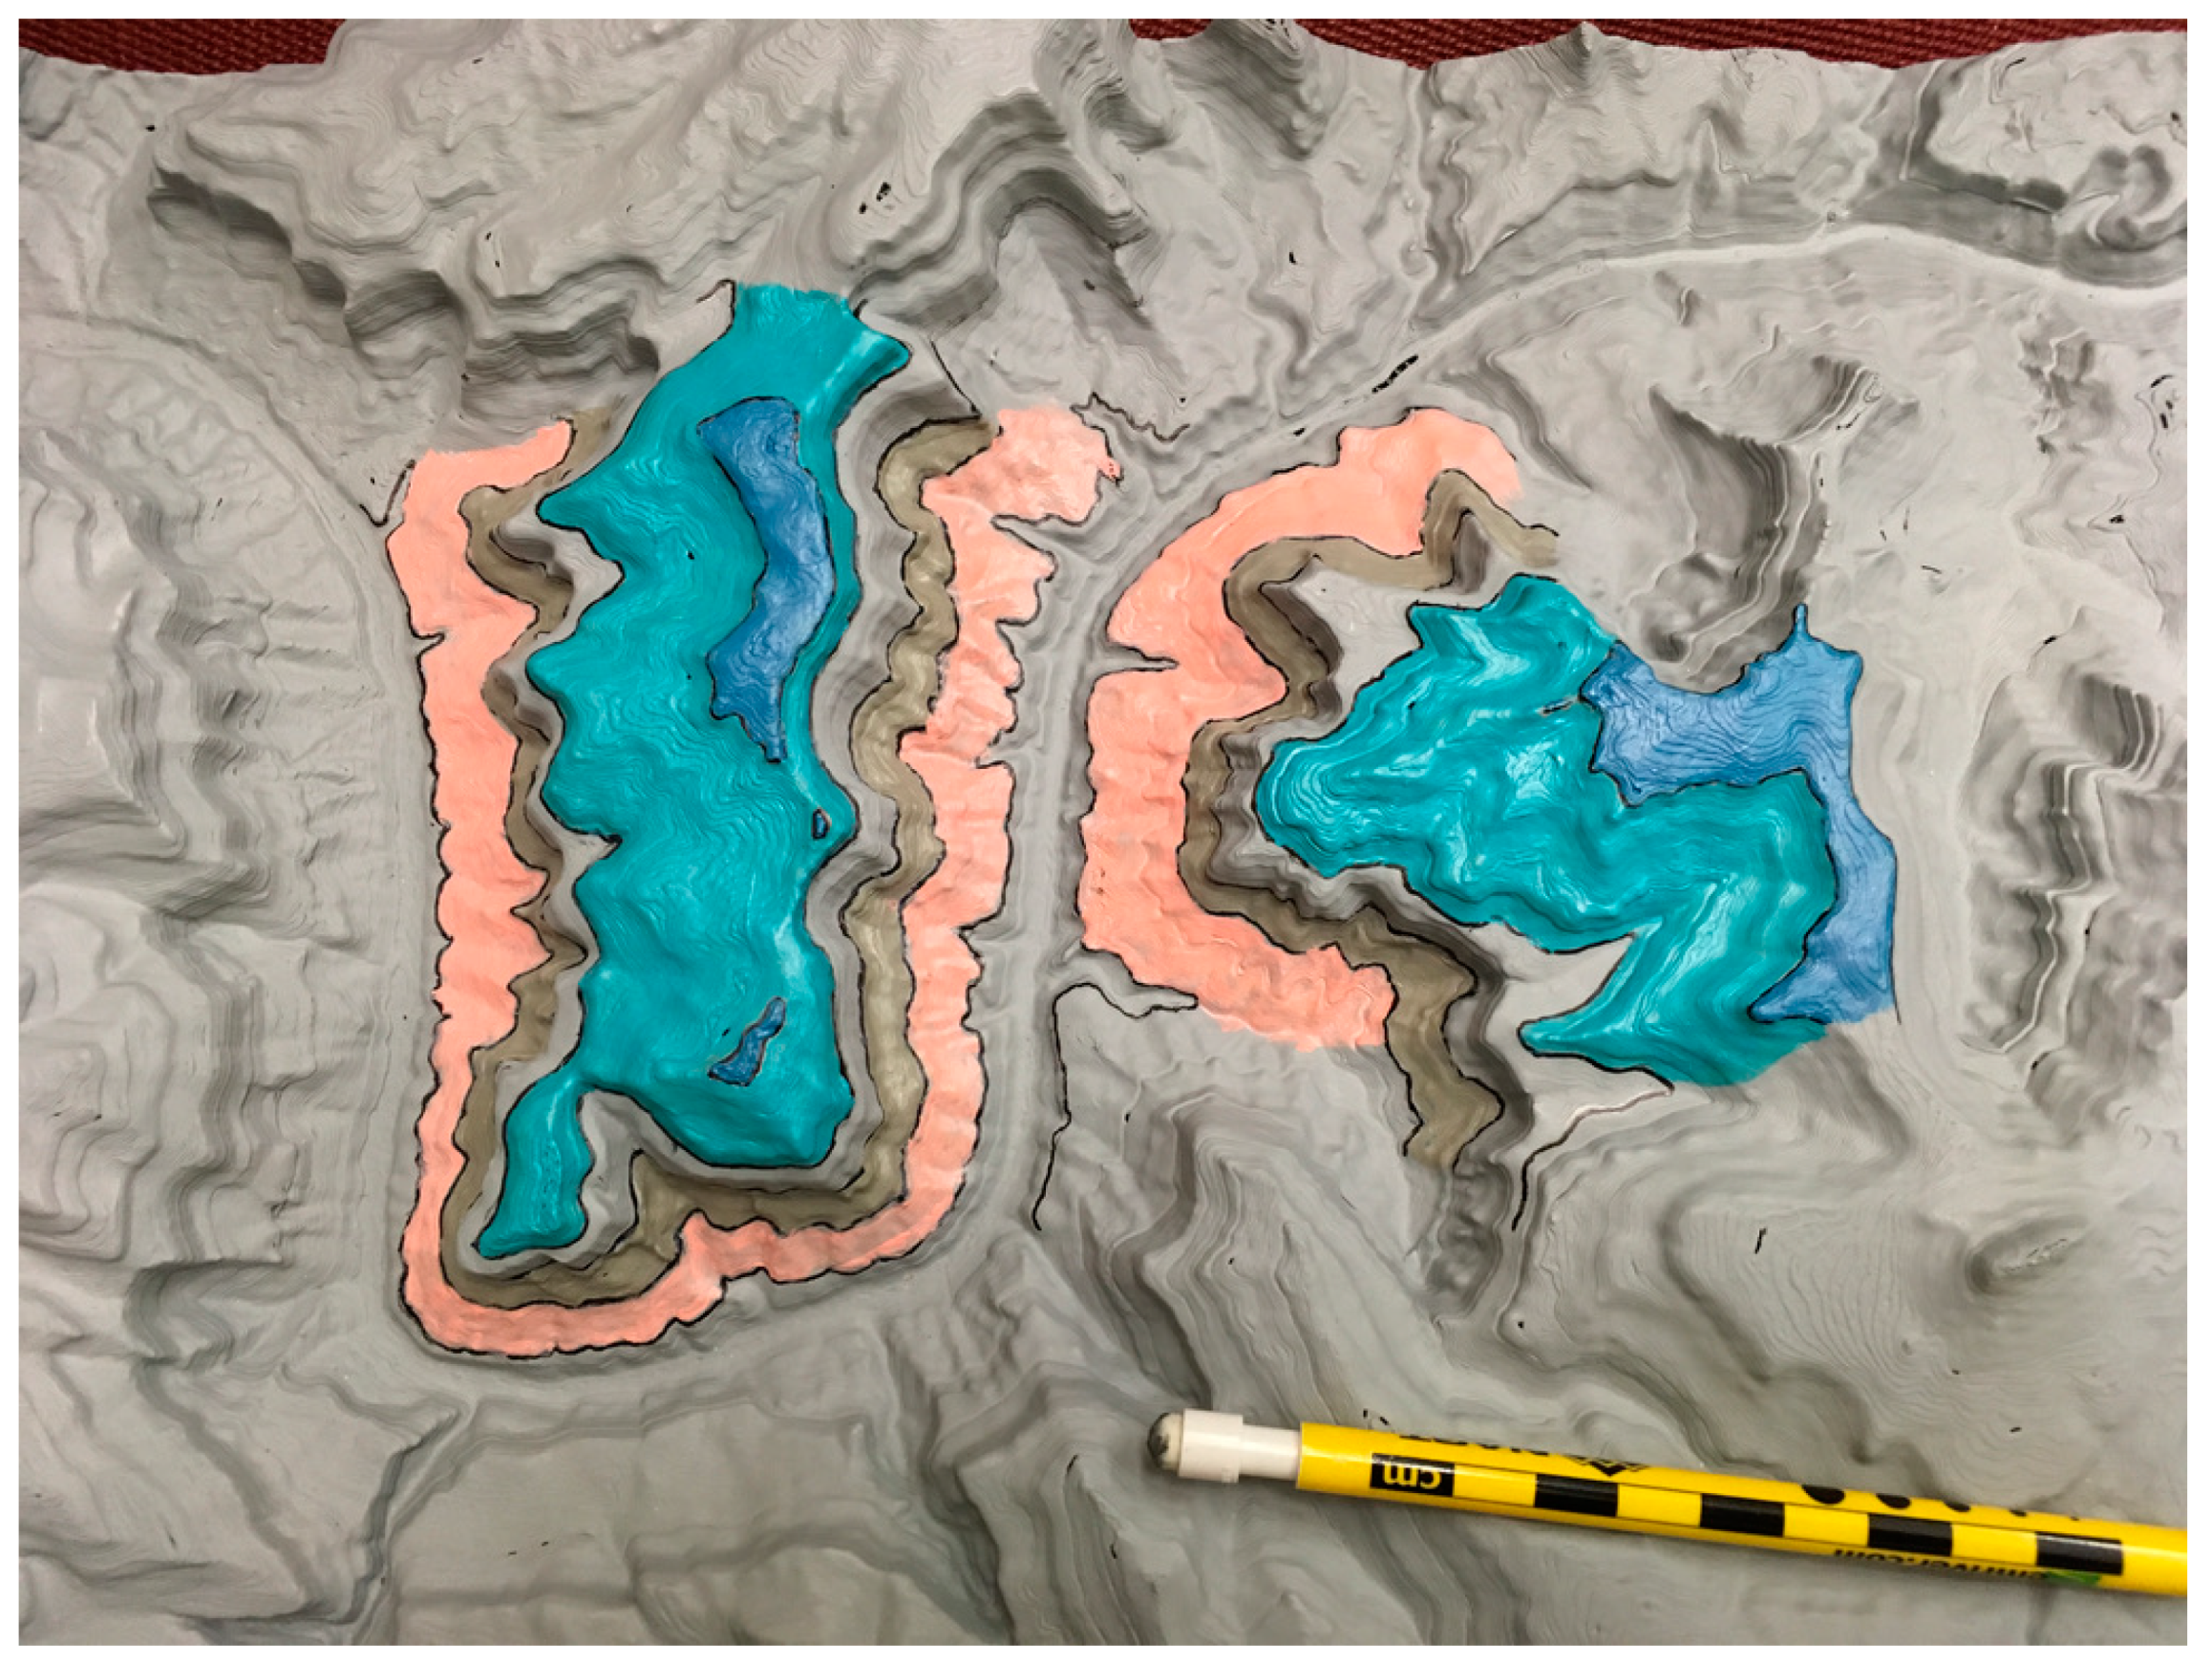
Many aspects of the work involving physical terrain models are centered around their role in education. Oswald et al. [23] explored novel application of 3D printed terrain models in physical and urban geography education and outreach. Using GIS and other software, they created watershed models using a polygon as a boundary. These were then printed on a plastic 3D printer and a powder-based 3D printer. Both models used a z-scale of 10 to increase the details of the various river valleys within the watershed. On the 20 × 40 cm powder-based model, color was used to indicate major streams (blue), major roads (gray) and greens spaces (green). In a novel watershed puzzle (total size: 25 × 15 cm), a watershed was subdivided into 10 sub-watershed “puzzle pieces”. The puzzle was used to demonstrate how landscapes can be partitioned into watersheds, these into sub-watersheds, etc. The puzzle was also used for comparing the area, relief and drainage density of the different sub-watersheds.
Furthermore, a 25 × 25 cm model (z-scale of 5) of the Toronto, Canada, waterfront including lake bathymetry was sprayed with water to demonstrate how water would drain downslope along the terrestrial part of the model into the lake part. These terrain models were used in outreach events and in a high school learning module on urban watersheds, where an increase in the level of student engagement when interacting with a 3D watershed model was noted. Other models, such as a two-tile, 50 × 25 cm model of a moraine (z-scale of 25) and cityscape models, where buildings are placed onto the topography, are also mentioned.
It should be noted that this is exactly the scenario TouchTerrain was designed to improve upon: to alleviate the need for GIS expertise and to thus make it possible for end users such as high school teachers or outreach personnel to create 3D terrain models with complex outlines (such as the polygon outlines defining the watersheds). With TouchTerrain, models can easily be given enough elevation exaggeration to show relevant terrain details even on low relief terrain. Models could also be potentially printed as multi-tile models.
In closing, the authors note that “Feedback from social media, the high school education sessions, expert workshops/conferences, and public events was positive without exception” and that “we believe there is a great potential to continue integrating 3D landscape prints (of watersheds and landforms) into our teaching and research outreach activities”. Other publications, such as [24], offer a similar, but primarily anecdotal assessment of the potential educational benefits of using 3D printed terrain models.
In recent years, several educational studies were performed aimed at going beyond such anecdotal evidence and to quantitatively evaluate the role of 3D models in geoscience university teaching. The Topographic Map Assessment (TMA) instrument [25] is one way to objectively define a set of map reading skills. The TMA consists of 18 exercises each testing a certain type of topographic map-related task, such as drawing the water flow between two points in different geographical settings, comparing the steepness of two slopes or determining the visibility (uninterrupted line of sight) between two points. Points are awarded based on how well the tasks are performed.
Tests like the TMA can thus quantitatively determine how well groups of participants perform spatial tasks using one of two different types of maps, e.g., using a 3D terrain map and a traditional 2D contour map (as baseline). A statistical analysis of the results determines the efficacy (gain) for each type of teaching technique. As intrinsic motivation is an important factor in learning, such quantitative assessment may be complemented by an instrument such as the Intrinsic Motivation Inventory (IMI) [26], in which participants self-assess their experience of performing the spatial mapping tasks.
A study performed by Carbonell-Carrera et al. [27] compared 2D contour maps to 3D printed terrain (tangible 3D) and to a marker-based AR system in which a card of the same extent as the 3D print was held in one hand and viewed through a smartphone or tablet. Using those markers, the AR software deduces the card’s orientation and creates a 3D computer graphic that shows the terrain in this orientation on the screen (digital 3D). The results suggest that using 3D, both tangible and digital, resulted in significantly better performance. Note, however, that no distinction was made between the tangible 3D and the digital 3D and it seems that members of the 3D group used both types together. Therefore, the effect of using the tangible, 3D printed terrain models we are interested in, is not quantifiable from this study.
Carbonell-Carrera et al. [28] performed a similar, larger study that also included use of the Intrinsic Motivation Inventory (IMI), but now compared 2D contour maps with AR-based 3D models only (i.e., it did not use 3D printed models). Again, 3D has some advantages, especially with regard to student motivation, excitement about the new technology and ease of use, but 2D showed greater efficacy in some aspects of spatial learning. Additionally, some students performed better with 3D while others performed the same task better in 2D. In the author’s opinion, both 2D and 3D tools should be used in tandem to offer students different entry points to success, no matter their initial spatial abilities and preferred learning styles.
In a large study performed by Adams [19], the TMA was used in a pretest to establish a baseline of the participants’ spatial skill. Participants would use either a 2D contour map, a roughly 30 × 30 cm 3D printed terrain model (3D group) or the 3D printed terrain model with the contours projected on it from above (3D/AR group). For the TMA pretest, none of the three groups was statistically different. For the actual experiment, participants were given a set of ten custom tailored spatial tasks that were equivalent to those in the TMA but involved different terrain not included in the TMA. All tasks were evaluated via multiple choice questions. For most, but not all, of the ten questions, both 3D groups performed statistically significantly better than the 2D group. In general, the two 3D groups themselves were not significantly different from each other, however, the 3D/AR group performed better than the 3D group in the photo interpretation relief tasks, perhaps hinting at the value of adding contour information on top of the 3D printed terrain model. For questions involving slope, 2D was found to be marginally better than 3D.
2.2. Research on Blind–Visually Impaired Map Users
The final area in which to put 3D printed terrain models into context is their use by blind and visually impaired (BVI) individuals. As touch is the primary or only sense a BVI person has to interact with and learn about terrain data, usage of 3D printed terrain models in areas such as wayfinding, mobility training and geography education would seem to be fertile ground for research and applications. However, we found few studies in this area of research.
Tactile maps, which traditionally use raised symbols embossed into paper, have long been employed in many BVI related mapping contexts [29]. Recently, 3D printing has been used to extend this tactile map concept [30]. Schwarzbach et al. [31] describe the cartographic process of a 25 × 35 cm “3D tactile map” of an outdoor hiking area. Instead of raised symbols, the map is based on a 3D landscape, created with a powder 3D printer. Its extended tactile symbology included raising roads to make them easy to follow and the use of tactile textures to differentiate types of land cover (e.g., forests from lakes). Results were anecdotally reported as successfully giving BVI individuals the ability to plan and prepare for hiking tours. However, no formal user study was performed.
Voženílek et al. [32] designed and 3D printed a tactile map of Europe for use in BVI education. The 3D model was printed with a 25 by 35 cm powder-based printer in color. The printed DEM was severely simplified to have only five elevation levels, at 0.5 mm intervals, which reportedly allowed BVI users to consistently perceive changes in elevation via their hands. To help low-vision users, each interval was painted in bright colors in a high contrast sequence: white (sea level), green, yellow, magenta and black. An observational user study was performed with BVI school children as participants. The reactions were positive with participants stating that this 3D terrain map gave them, for the first time, the ability to perceive and compare terrain features such as different European mountain ranges.
Perry [33] compared two methods of conveying topographic data for BVI individuals. In this study, the recognition of comparatively simple topographic landforms was used, based on a set of eight idealized variations of a simple hill. 3D printed terrain models were created from these eight hill variations which were used in the study’s 3D mode. For its 2D mode, the eight hills were converted into contours which were braille printed as tactile paper maps. Using these two modes, the study performed a cross-modal experiment. Participants were given each of the hill variations either as a tactile map or as a 3D printed model, and were asked to find the matching model of the other modality. This was repeated for all models/maps. Learning time (i.e., the time needed to completely encode the map or model into a mental representation), selection time, (i.e., the amount of time needed to haptically explore all eight maps/models of the other modality to find a match), and the match’s success/fail were recorded and analyzed.
Results indicated statistical significantly shorter learning times for the 2D mode, (i.e., for learning the terrain shape encoded in a 2D tactile map and then selecting the correct match from the eight 3D models), possibly because it is faster to explore each 3D model and to then decide to either declare it to be a match or to discard it and investigate the next model. In all other regards, the two modes did not differ significantly, which indicated that, at least for these very simplistic geomorphologies, tactile contour maps are just as effective in building up a mental representation as handling a 3D printed model.
3. Methods and Technology
3.1. 3D Printing Technology Overview
A 3D printer creates a physical 3D model based on a digital 3D model. 3D printers using Fused Deposition Modelling (FDM, also known as Fused Filament Fabrication, FFF) prints with plastic filament and are by far the most common method for printing medium (10 × 10 cm) to large (40 × 40 cm) terrain models, combining cheap, yet reliable hardware, low material cost (1 kg of filament costs USD 15 to 30) with reasonably good detail.
Subtractive manufacturing, another method for creating 3D models, works by successively cutting material away from a solid block of material. For terrain models, typically a Computer Numerical Control (CNC) machine is used to mill away the model from a block of wood [34]. CNC-produced terrain models can be very large (e.g., 120 × 240 cm) and are commonly used for architectural dioramas or interior decorations.
In FDM printing a 3D digital model, usually contained in a STL file, is first processed by software known as a slicer. The slicer software creates horizontal profiles (slices) through the model at 0.1–0.3 mm intervals (the so-called “layer height”). Slices consist of many 2D lines (toolpaths). Lines designated as walls (perimeters), tops and bottoms are used to define the outside of the model. Lines forming a loose infill pattern (typical density: 10–20%) cover the inside of the model, resulting in a sturdy outer “shell” that envelopes a mostly hollow interior.
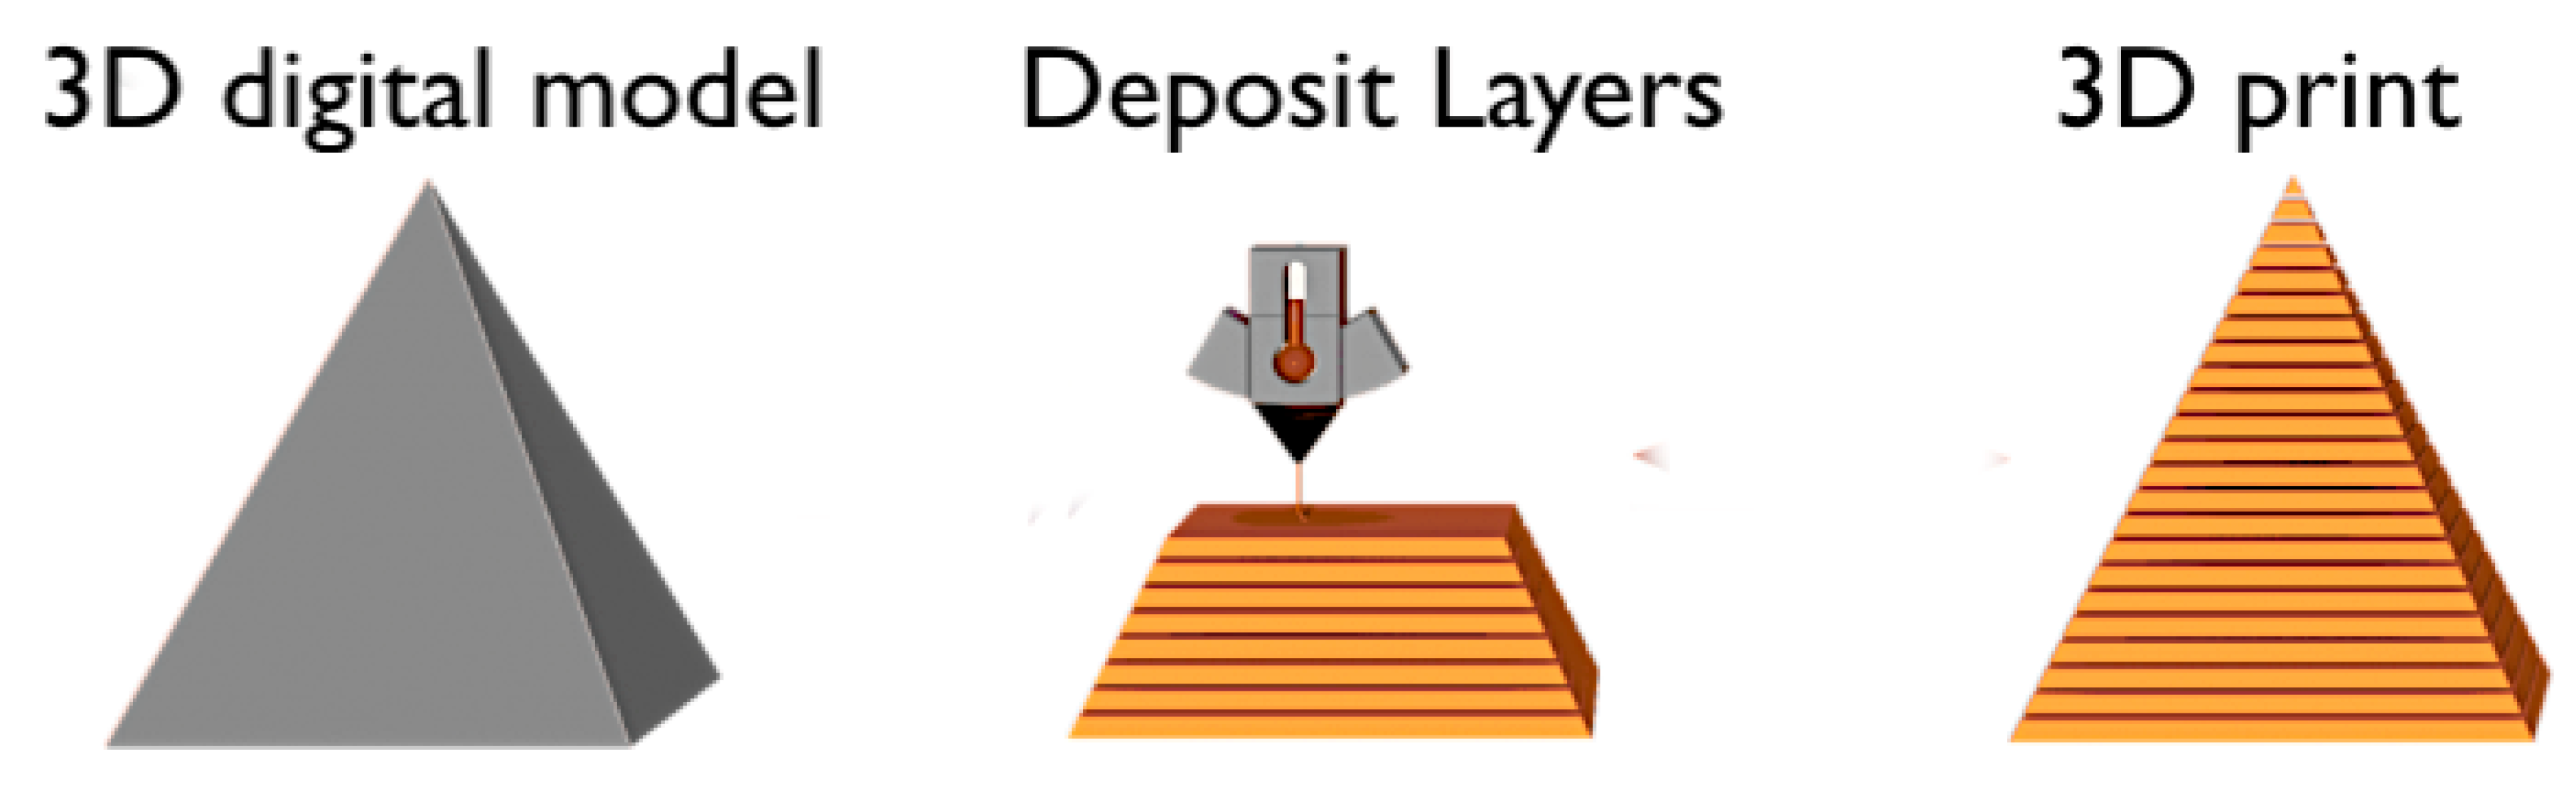
During the printing process the 3D print hardware moves a nozzle of typically 0.4 mm diameter in the horizontal (x/y) plane along the tool path defined for each slice/layer. After each slice is deposited, the nozzle moves up by the layer height (typically 0.1–0.3 mm) and deposits the next slice. The nozzle extrudes ~210 °C hot plastic filament, which quickly cools to a solid form and fuses with the layer below, thus creating a physical object (Figure 1).
3.2. Our Experience with 3D Printing Terrain Models (Guidelines)
It is important to understand some limitations inherent to FDM 3D printing. 3D Printers move the nozzle along the slice (x/y) plane with much higher precision than the smallest possible layer heights produced by TouchTerrain, which can be as small as 0.06 mm but is typically between 0.1 and 0.3 mm. 3D printed terrain therefore will always have a noticeable anisotropy along the horizontal plane, which manifests as horizontal “stripes”. In our experience, noticeable stripes do not detract from the experience as they mimic contours found on topographic maps. However, low layer heights (0.15 mm or lower) result in more visually pleasing models and should be used when possible.
Although it is possible to print different layer heights with the same nozzle by extruding more or less filament, it is generally not possible to print details along the x/y plane that are smaller than nozzle diameter, typically 0.4 mm. In this respect, the degree of detail that is possible along the z-axis with a 0.1 mm layer height is considerably finer than what a 0.4 mm nozzle can create in the x/y plane. Smaller nozzle sizes (e.g., 0.25 mm nozzles) could be used to compensate for this but are generally more difficult to reliably print with.
When looking for suitable areas to print, many users seem to be naturally drawn to high relief terrain, such as the Grand Canyon or famous mountains, which, without z-scaling, prints out as a tall model with many layers (even using a coarse layer heigh of say 0.3 mm) and thus provides good detail and an aesthetic model. However, even areas in low relief regions (such as Kansas or Iowa) can be printed with good detail if the model’s elevation is appropriately exaggerated (z-scaled) prior to printing. The z-scale factor should be large enough, so that the resulting print is at least 20–30 mm tall and thus has enough layers to show enough terrain detail.
Large-sized prints are more impressive and present the terrain in better detail to the viewer. The horizontal size of the print should therefore be chosen to be as large as can reliably be printed in good quality (given the size of the printer’s build plate), but without becoming unwieldy for the intended use case. Going beyond the build plate limitations requires the printing of multiple smaller models (tiles), These can then be assembled into a larger print but will typically still show the internal tile boundaries, which are difficult to conceal well, even with extensive post processing.
Hillshading can help when selecting an area by geomorphological terrain features (e.g., by looking at ridges, valleys or drainage patterns). In TouchTerrain, the transparency, direction and severity of the hill shading can be configured to better bring out such features (even in low relief regions) and can help to inform the precise placement of the print area. It may also be desirable to define the print area with a polygon instead of a simple box, so that its boundary partially corresponds to a terrain feature, e.g., follow a river valley. For this, a polygon can be digitized in either Google Earth or a GIS and given to TouchTerrain as a .kml file. For further guidelines and heuristics for 3D printing terrain models, see Appendix B.
3.3. TouchTerrain Project—Software
TouchTerrain is an open source software project hosted in a Github repository [35]. It is written primarily in Python and is implemented both as a web application and a standalone version. The web application uses an interactive, Google Maps interface. After selecting the print area and setting options related to a user’s 3D printer, online DEM data from Google Earth Engine is converted into digital terrain models and downloaded by the user for 3D printing. The web application is currently hosted by Iowa State at https://touchterrain.geol.iastate.edu/ (accessed on 20 February 2021) (or http://touchterrain.org (accessed on 20 February 2021)) but others are free to deploy the application on their servers.
In the standalone Python version of TouchTerrain, the input parameters (such as the coordinates of the print area) are given via code instead. The standalone version can be run via a jupyter notebook, which affords some interactive functionality. It can process DEM data from Earth Engine and also from local DEM geotiff files. Building on the 2017 version [36], TouchTerrain version 3 added several substantial upgrades and improvements, either in response to user feedback or contributed by others to the open source code (see http://blog.touchterrain.org/ for details (accessed on 20 February 2021)).
3.3.1. TouchTerrain Web Application
Print Area Selection
The first step for the user is to find the desired area on the Google Maps window (Figure 2) and then interactively outline it with the red area selection box. Standard Google Maps navigation is implemented, and a place search field (top) can be used to jump to the general area quickly. Coordinates for the corners of the print area can also be edited manually. Furthermore, a .kml file with a polygon can be uploaded and used as print area. Several online DEM sources, which are provided by Google Earth Engine, are available, providing different resolutions and coverages. For example, the USGS NED dataset, which has the highest resolution (10 m), is only available for printing areas within the contiguous US. A hill shade layer of the current DEM source is overlain over the Google Map. Users can adjust the transparency, and manipulate the hill shade sun direction and sun angle to create an effective relief effect for the area in question.
Printer Settings
Once a print area has been selected, a few additional settings need to be given (3D printer Options). Tile width and height determine the real-world horizontal dimensions of the 3D print in mm. Only the width needs to be given by the user, the height is calculated as per the aspect of the area selection box. This requires the user to know the size of the build plate of their 3D printer. For larger models, TouchTerrain can instead divide the print area into multiple tiles of a size that fit the build plate.
Similarly, the user should know the nozzle diameter of their 3D printer. Although adjustable to values between 0.2 mm and 0.6 mm, the default value of 0.4 mm is an extremely common diameter for hobbyist and prosumer grade printers and should not need to be changed. This nozzle diameter plays a vital role in determining an internal metric called the 3D print resolution, which determines to what resolution the source DEM is down sampled before processing. The rationale for this down sampling is that a 0.4 mm printer nozzle can generally not express terrain details any smaller than 0.4 × 0.4 mm anyway. The DEM raster that is processed into a 3D digital model therefore needs to only be of a resolution that is equivalent to 0.4 × 0.4 mm raster cells instead of the source DEM, for which the resolution is typically considerably higher. This effective DEM resolution is shown to the user, together with the source DEM resolution.
For example, a tile that is as wide as the continental US that shall be printed out as 100 mm wide with a 0.4 mm nozzle, can be down sample from its 10 m resolution (for USGS NED as source DEM) to a resolution of about 20,000 m. This down sampling results in a dramatically smaller digital 3D model file to be downloaded, which can be sliced at a fraction of the time and, in the end, will generate a 3D print that is indistinguishable from a 10 m resolution model. However, there are cases, where the combination of area geometry, 3D print size and nozzle diameter would result in an oversampling of the original source resolution from which nothing can be gained. In these cases, the field showing the effective DEM resolution will turn yellow to inform the user of this fact. While a small degree of oversampling is a non-issue, massive oversampling suggests that the user may want to change the area extent, number of tiles or nozzle size.
A model base thickness value (default: 0.5 mm) determines how thick of a horizontal slab will be added beneath the actual terrain model. This small downward extrusion, which is uniform across all tiles, can help improve the durability of otherwise very thin models and can improve model aesthetics.
The vertical exaggeration factor (or z-scale, default 1x) determines by how much the elevation will be multiplied when processed into a digital model. Given the comparatively coarse layer height used in typical FDM printing (0.1–0.3 mm) it is important that the z-scale is large enough to result in a reasonably large number of layers. Printing at least 50 layers ensures that the model will show a good level of terrain details. The value for a “good” z-scale will depend on the difference between the maximum and minimum of elevation within the requested area, with low-relief areas (with little differences) suggesting z-scale of 2× to 4×, sometimes (e.g., watershed models) as high as 15×. Prior to actually processing the DEM for the selected area, no measure of relief (i.e., elevation difference) can be given to the user, so trial and error must be used for now. However, as it is possible to preview the processed 3D model prior to download, the user may realize that a higher z-scale would be advantageous and re-process the model with it.
The file type for the digital 3D terrain model can be set to either to STL a simple, yet still extremely popular 3D print file format it defaults to, or to OBJ, which is more general and often used in 3D computer graphics and modelling.
The final set of potential 3D printer options are the manual settings, which are meant as a Command Line Interface (CLI) for power users who want to set options that are not directly covered by the Web application’s User Interface (UI) elements. TouchTerrain supports a large number of these expert settings, which are documented on the GitHub page. Once the names of the settings are known, the user can set their values by typing them into the textbox using a JSON style notation. For example, to override the use of UTM as projection and to instead set it to a specific EPSG code, the user would type in “projection”:12345. Multiple manual settings can be given by separating them with a comma.
Model Download
Export Selected Area will fetch a geotiff of the print area from Google Earth Engine and process it into a digital 3D terrain model according to the parameters given by the user. Processing times vary by requested tile number, size and server load, but are generally short: a single tile 3D model that results in a 50 Mb file is usually processed in less than 20 s. The user can now optionally preview the digital model in a WebGL based in-browser 3D renderer and, if needed, change setting and re-process until satisfied with the result.
The final step is to download a zip file, which contains the digital terrain model in the requested file format, the geotiff from which the model was created and a detailed log file indicating all the parameters used in generating the model. The model can now be opened in a slicer for 3D printing. Finally, the user is given a URL to “bookmark” the current print. If this URL is put in a browser, it will bring up the TouchTerrain web application with all the specific print settings for this model already filled in. This is useful for coming back later to repeat a print without having to manually re-enter the print settings. URL bookmarks can be emailed to others to enable them to recreate the same model.
3.3.2. TouchTerrain Processing Details
The processing step at the core of TouchTerrain involves the creation of a triangle mesh by extruding a DEM raster contained in a geotiff. This triangle mesh describes a watertight volume and is stored either in a STL or OBJ file, which can then be sliced and 3D printed. The geotiff, a GIS raster, consists of a regular 2D array of cells (or pixels), each cell containing an elevation value. All cells are of the same size and are typically, but not always, square. In a GIS raster, this 2D array is geo-referenced (i.e., draped onto the surface of the Earth). Each cell, therefore, covers a specific geographic location on the globe with its value.
Google Earth Engine, an online computing platform for raster data, combines over 200 public domain raster datasets (including several elevation datasets) with raster computation via an application programmer interface (API) in JavaScript or Python. TouchTerrain requests DEM rasters from Google Earth Engine, based on the selected DEM source, the lat/long extent of the print area and the down sampling resolution. In response Google Earth Engine generates a geotiff, which TouchTerrain receives and processes. Unless overridden, the coordinate system of the geotiff is set to the UTM zone that covers the print area with WGS84 as datum.
In some rasters, a special value is used for cells to represent the absence of an elevation value. Using such NoData (undefined, NaN) cells permits the definition of arbitrary shapes of terrain outlines (e.g., the terrain of an island surrounded by a sea of NoData values). This scenario still requires a regular 2D array of values; however, some of the cells are set to the NoData value and are, by convention, simply omitted when displaying (or processing) the elevation raster. This results in the appearance of a complex outline instead of a regular 2D array with orthogonal edges and 90° corners. For this, Google Earth Engine can be given a polygon, with which it will mask out any cells that are outside the polygon. The resulting geotiff will, thus, have no data for all cells outside the polygon, which TouchTerrain will ignore when creating the 3D printable model.
Mesh Creation
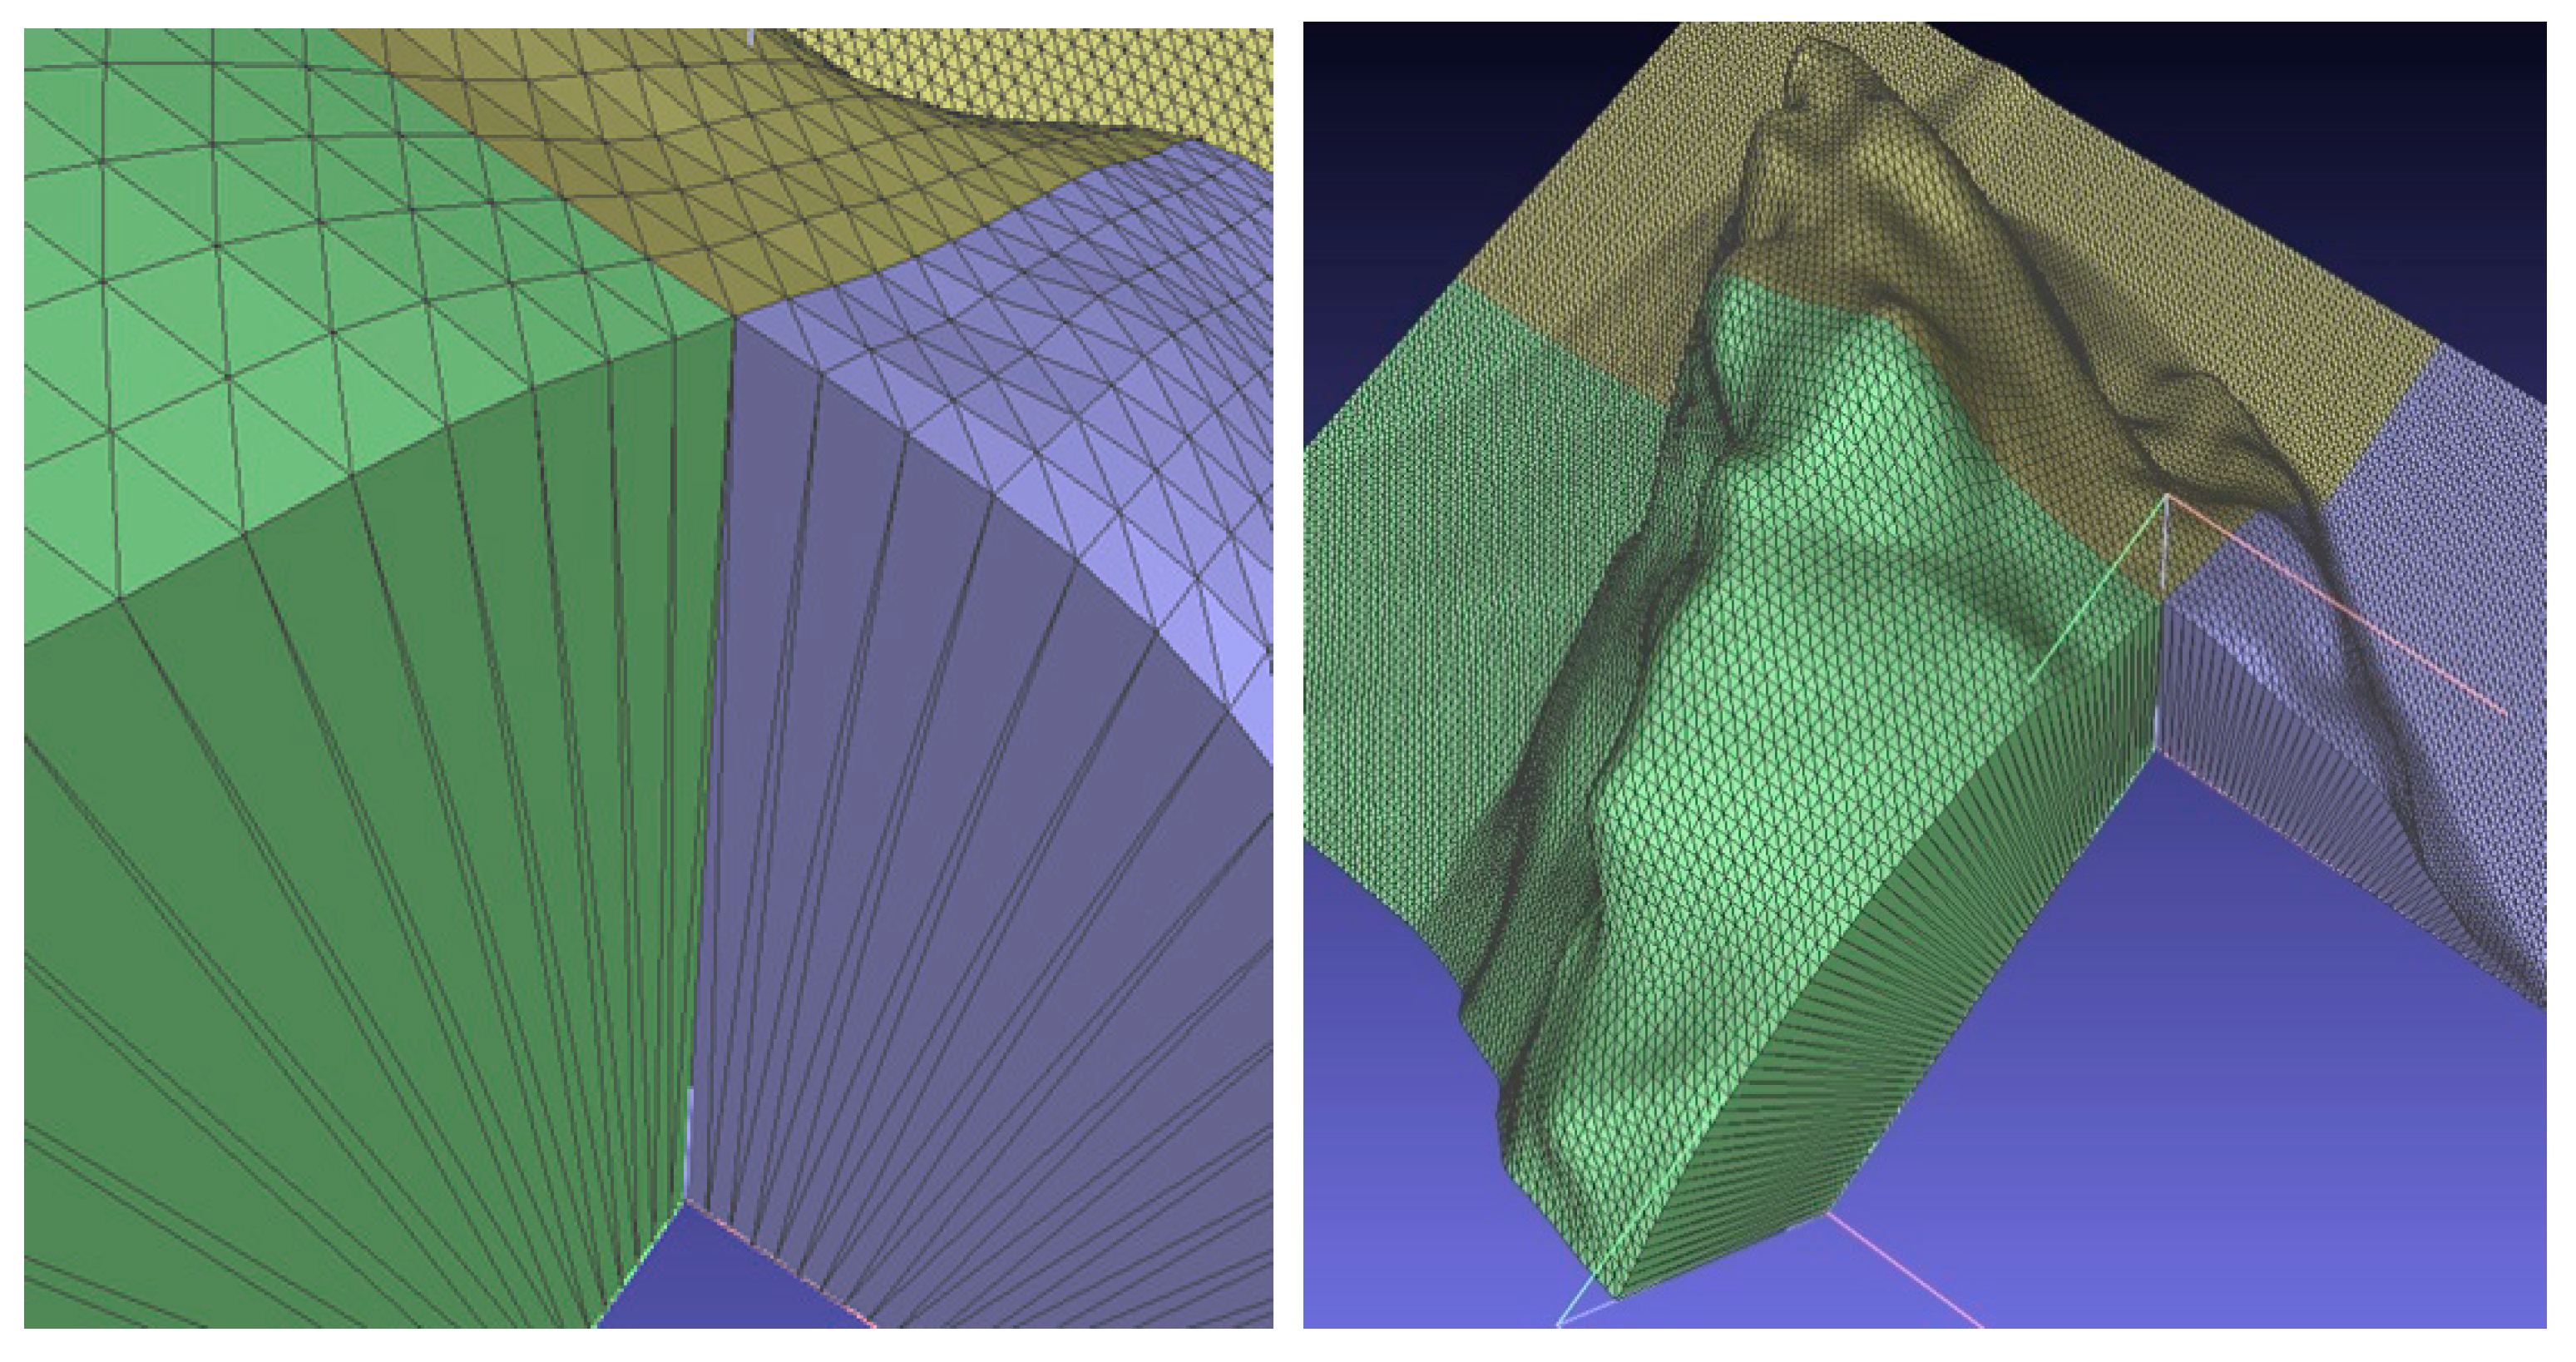
In the TouchTerrain triangle mesh, each square raster cell can be represented by a quad that covers the cell’s x/y extent, which is then divided into two triangles. The z-value of these triangles depends on the elevation value of the raster cell it covers. Extruding all triangles upwards thus forms the top triangle mesh of the 3D model. In order to create a watertight, 3D printable model, a bottom mesh, consisting of a non-extruded version of the raster, and vertical sides (walls) must be added. Figure 3 illustrates the processing steps from the DEM raster to a watertight terrain mesh model.
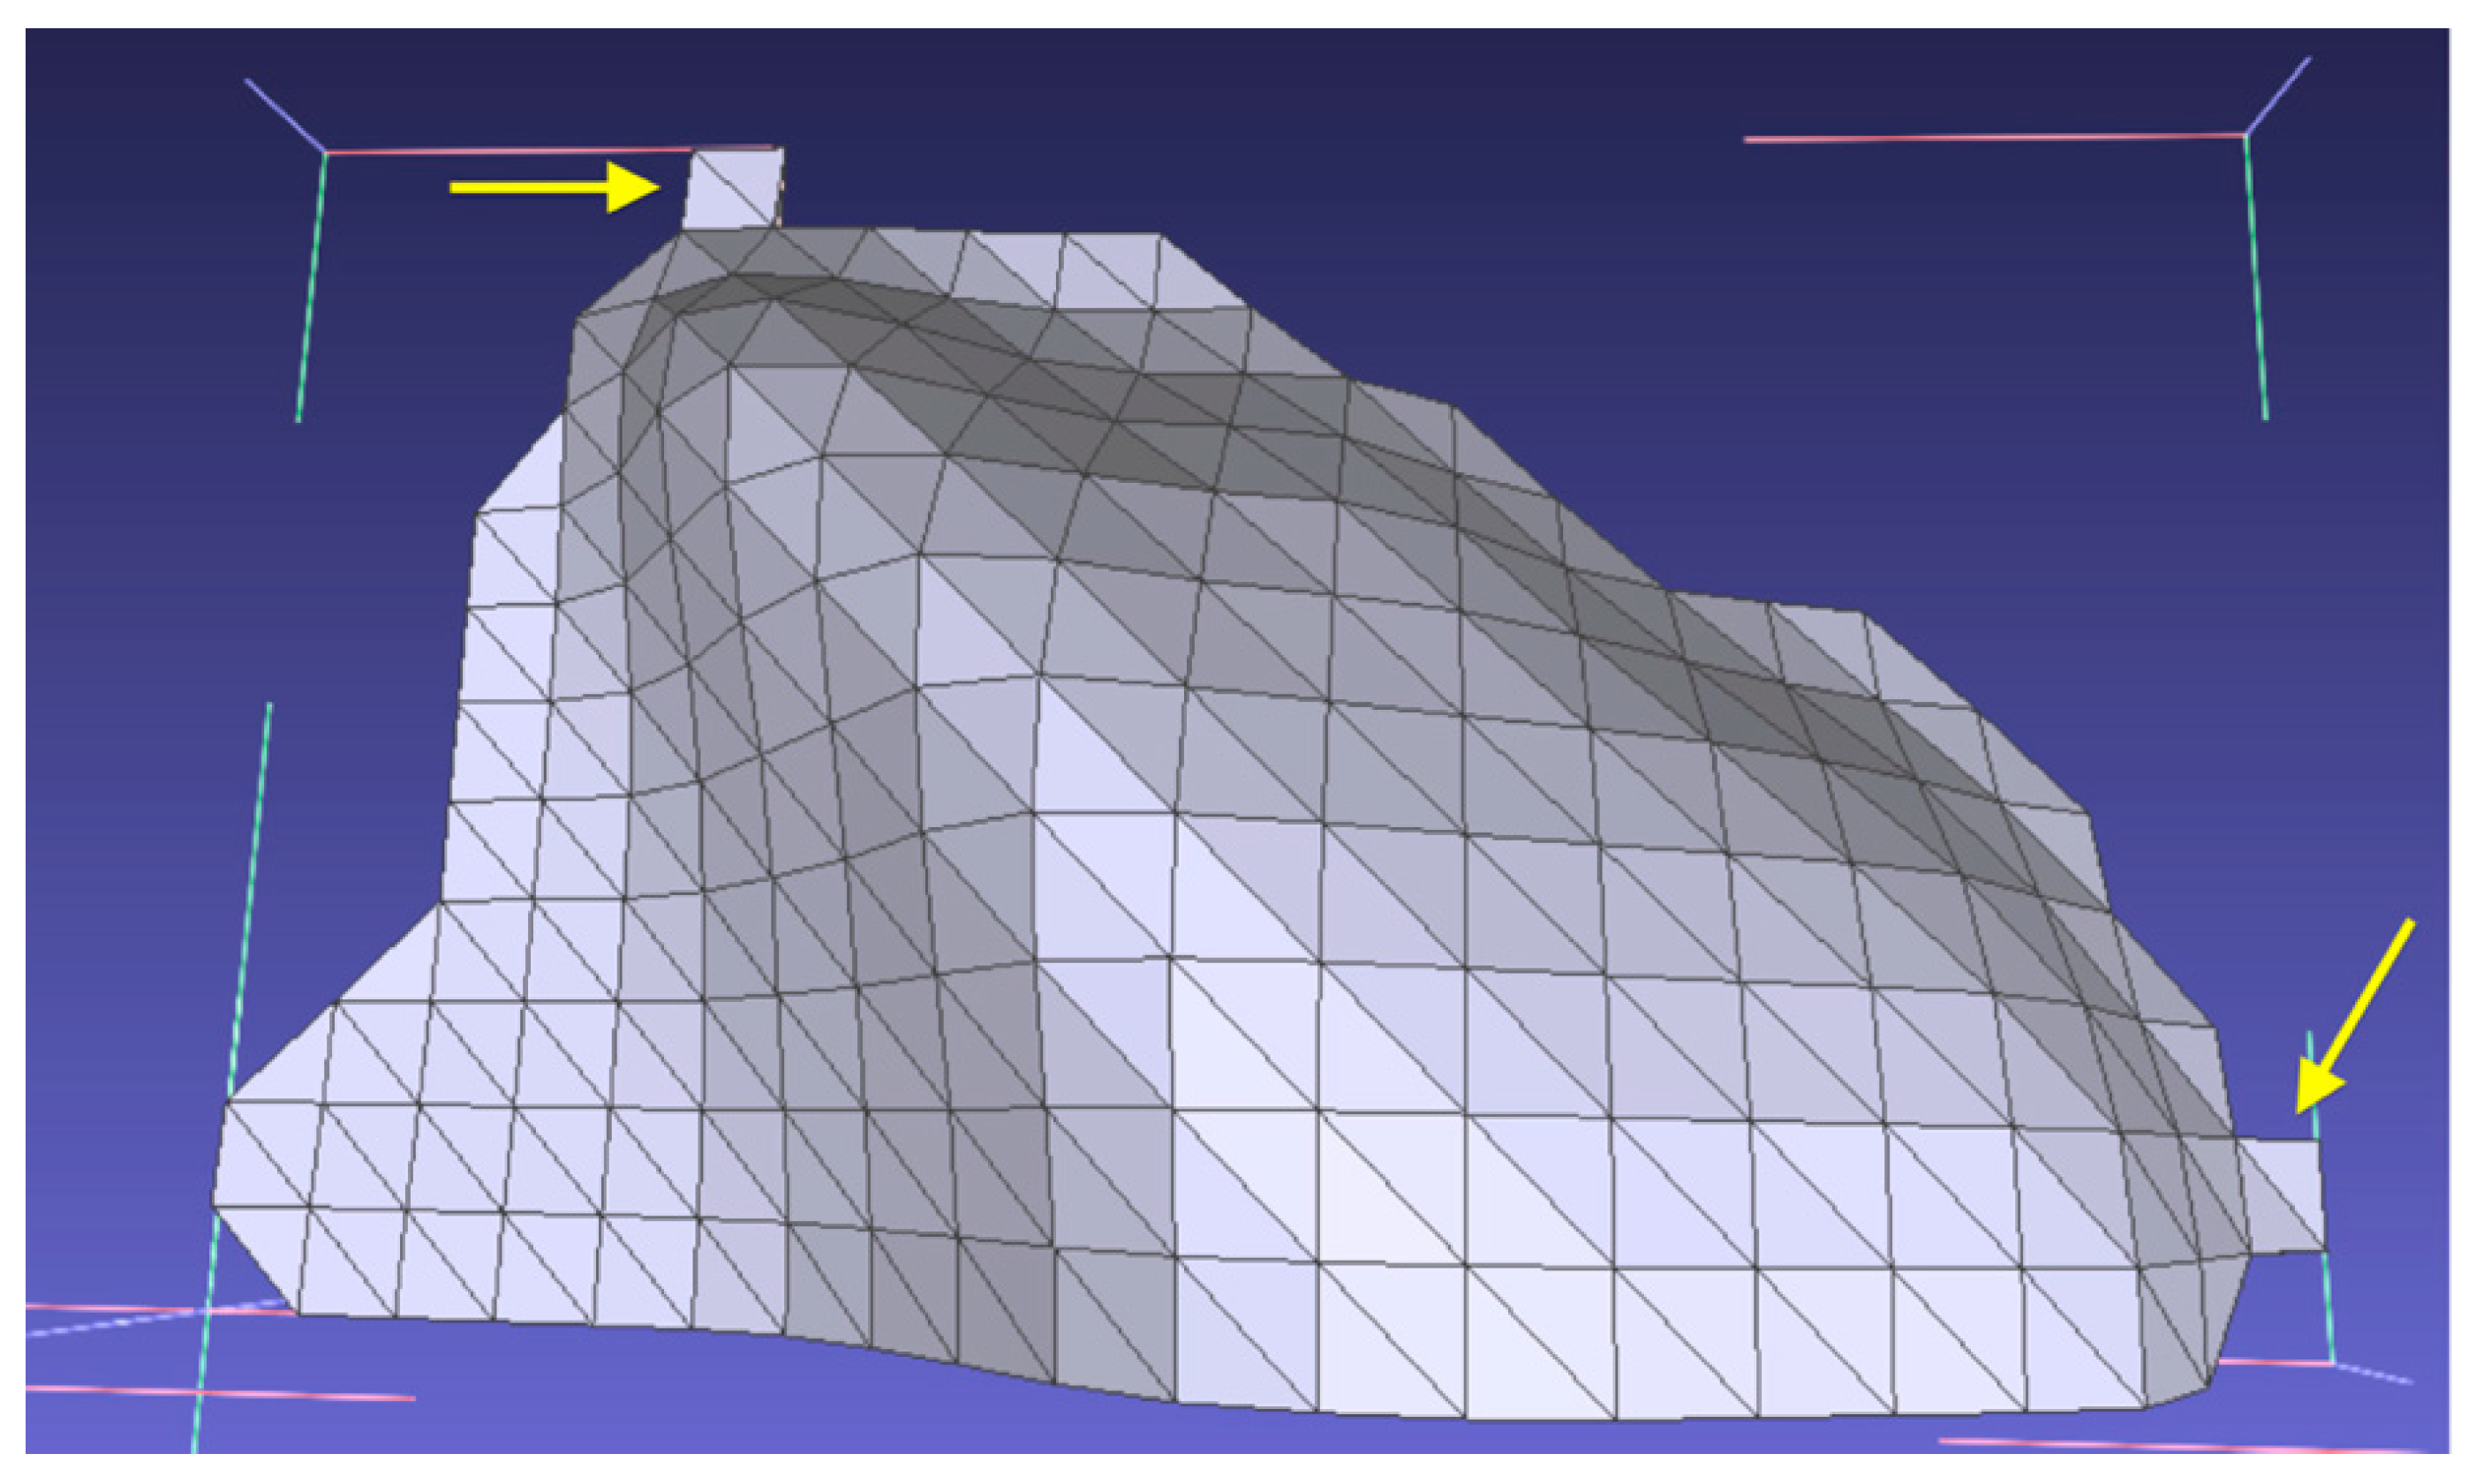
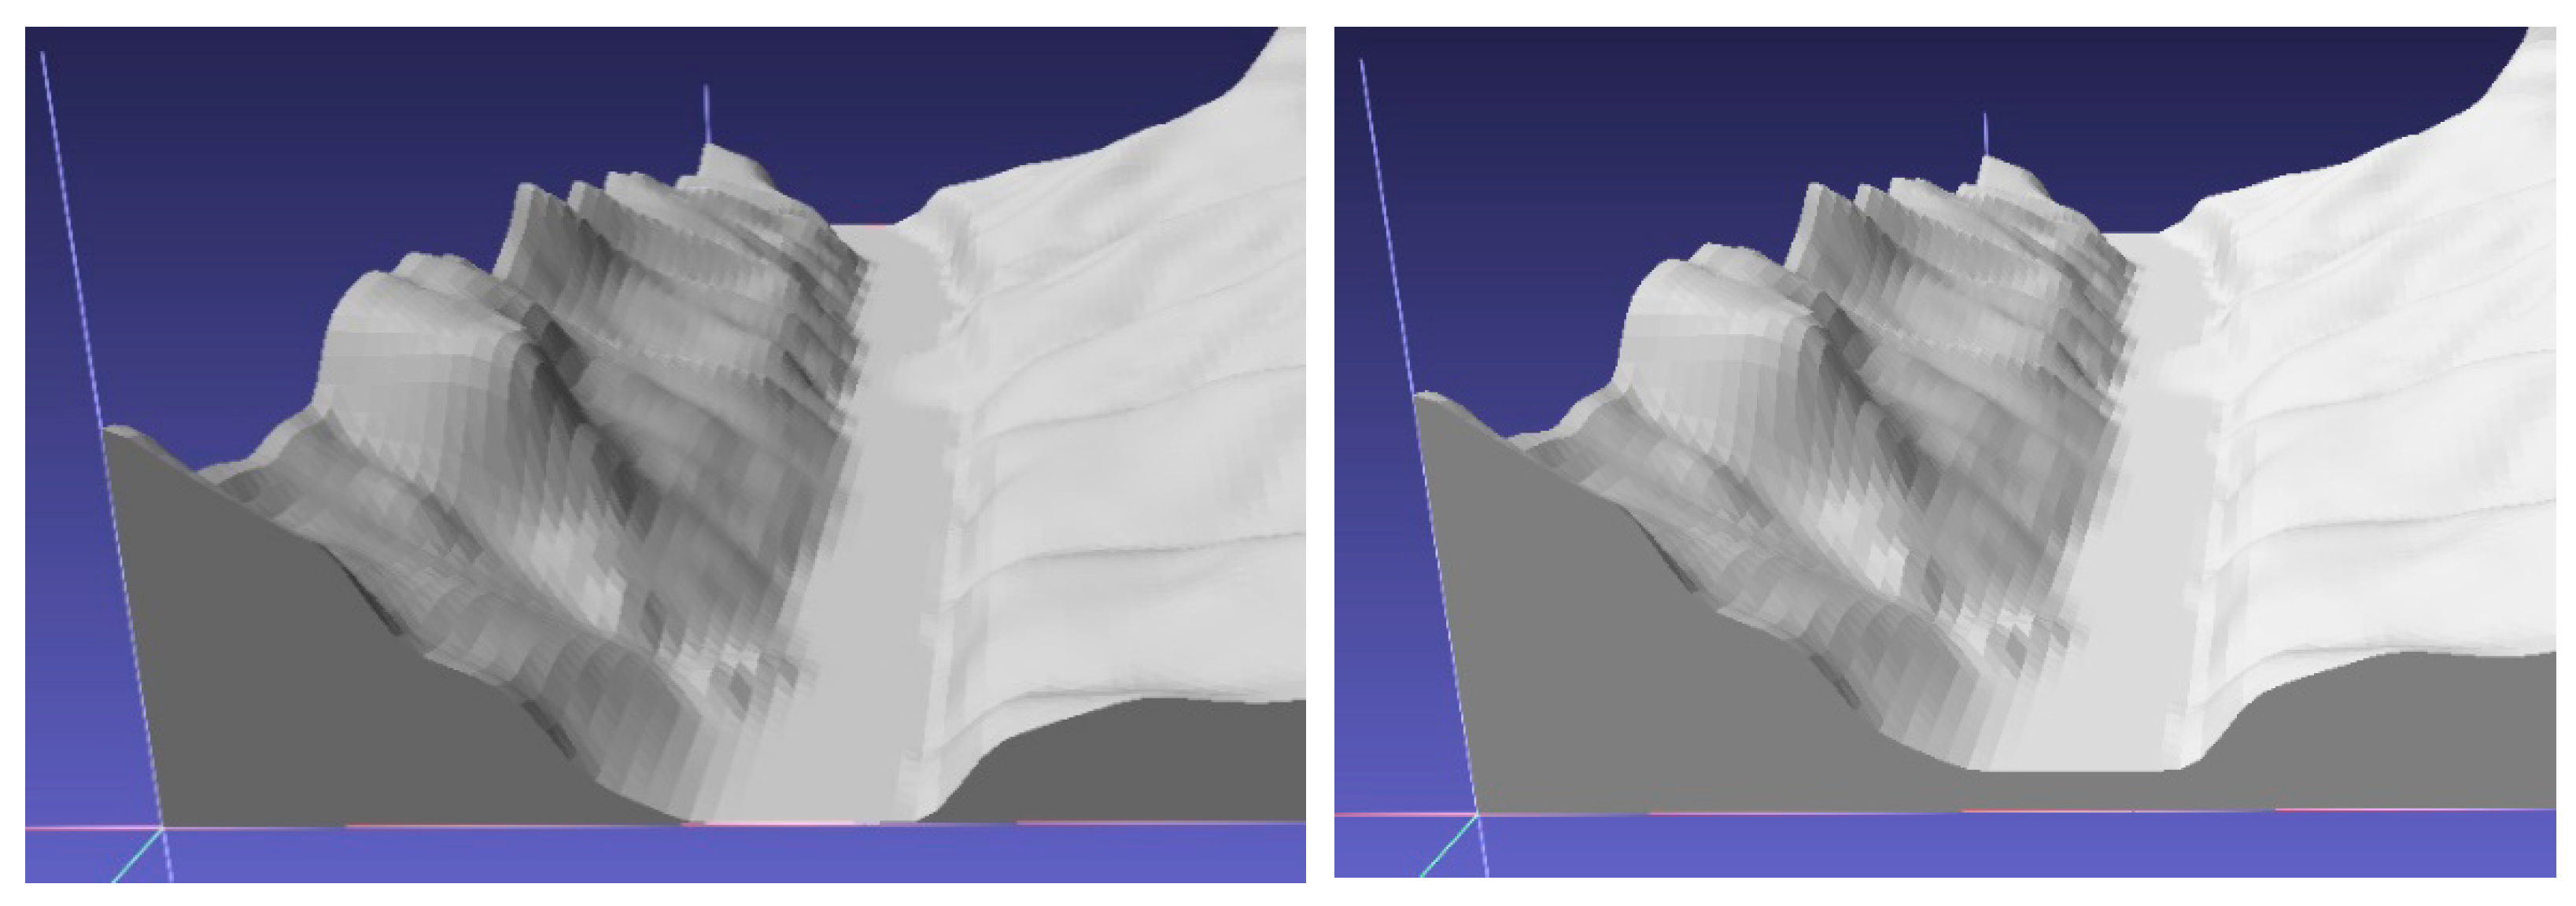
The raster can also be divided into several equally sized sub-rasters (tiles), each of which can be processed into multiple 3D models that, when grouped together, are equivalent to the full 3D model. In Figure 4, using a polygon that sets the values of some cells to NoData resulted in a mesh with omitted cells. Wherever possible, TouchTerrain avoids producing such “stair-step” patterns and attempts to place only one triangle in a configuration that smoothes out the outline. For two cells (arrowed), it was not possible to remove one of the two triangles.
Figure 5 demonstrates the perfect fit of the walls at the tile boundaries when assembling a digital terrain model from four equal sized tiles.
Base Thickness
The base thickness setting determines the (vertical) thickness the print will have at areas where the elevation of the DEM is the lowest. In TouchTerrain, this is set by the base thickness parameter (in mm). 3D printing with the typical 0.2–0.3 mm layer heights requires at least two layers of filament to fuse into a reasonably solid connection. In Figure 6, a river bed occupies the lowest area of the model. Using a setting of 0 mm (Figure 6, left) may not look problematic, but will result in a very brittle result when printed. A setting of at least 0.5 mm (Figure 6, right) is advised.
3.3.3. TouchTerrain Standalone Mode
Although using the web application’s manual options expand TouchTerrain’s functionality beyond the capabilities of the web user interface, there are still some operations that, thus far, can only be performed with the standalone (non-server) version of TouchTerrain. An important aspect of the standalone version is its ability to also process a local geotiff file (in addition to Google Earth Engine DEM sources), which opens the door to, e.g., printing high-resolution LIDAR terrain models (preprocessed into a geotiff raster).
Trails
The standalone version supports the ability to work with GPX (GPS Exchange Format) data files, which describe travel routes and are commonly produced by GPS devices. Thanks to TouchTerrain contributor Chris Kohlhardt, it is possible to “drape” these path lines over the terrain model and extrude them either up or down, thus creating trenches or crests within the model’s top surface. This functionality creates visible imprints of line data on 3D printed terrain models, which is useful for 3D printed terrain models used to support, for example, outdoor activities.
Interactive Digitizing
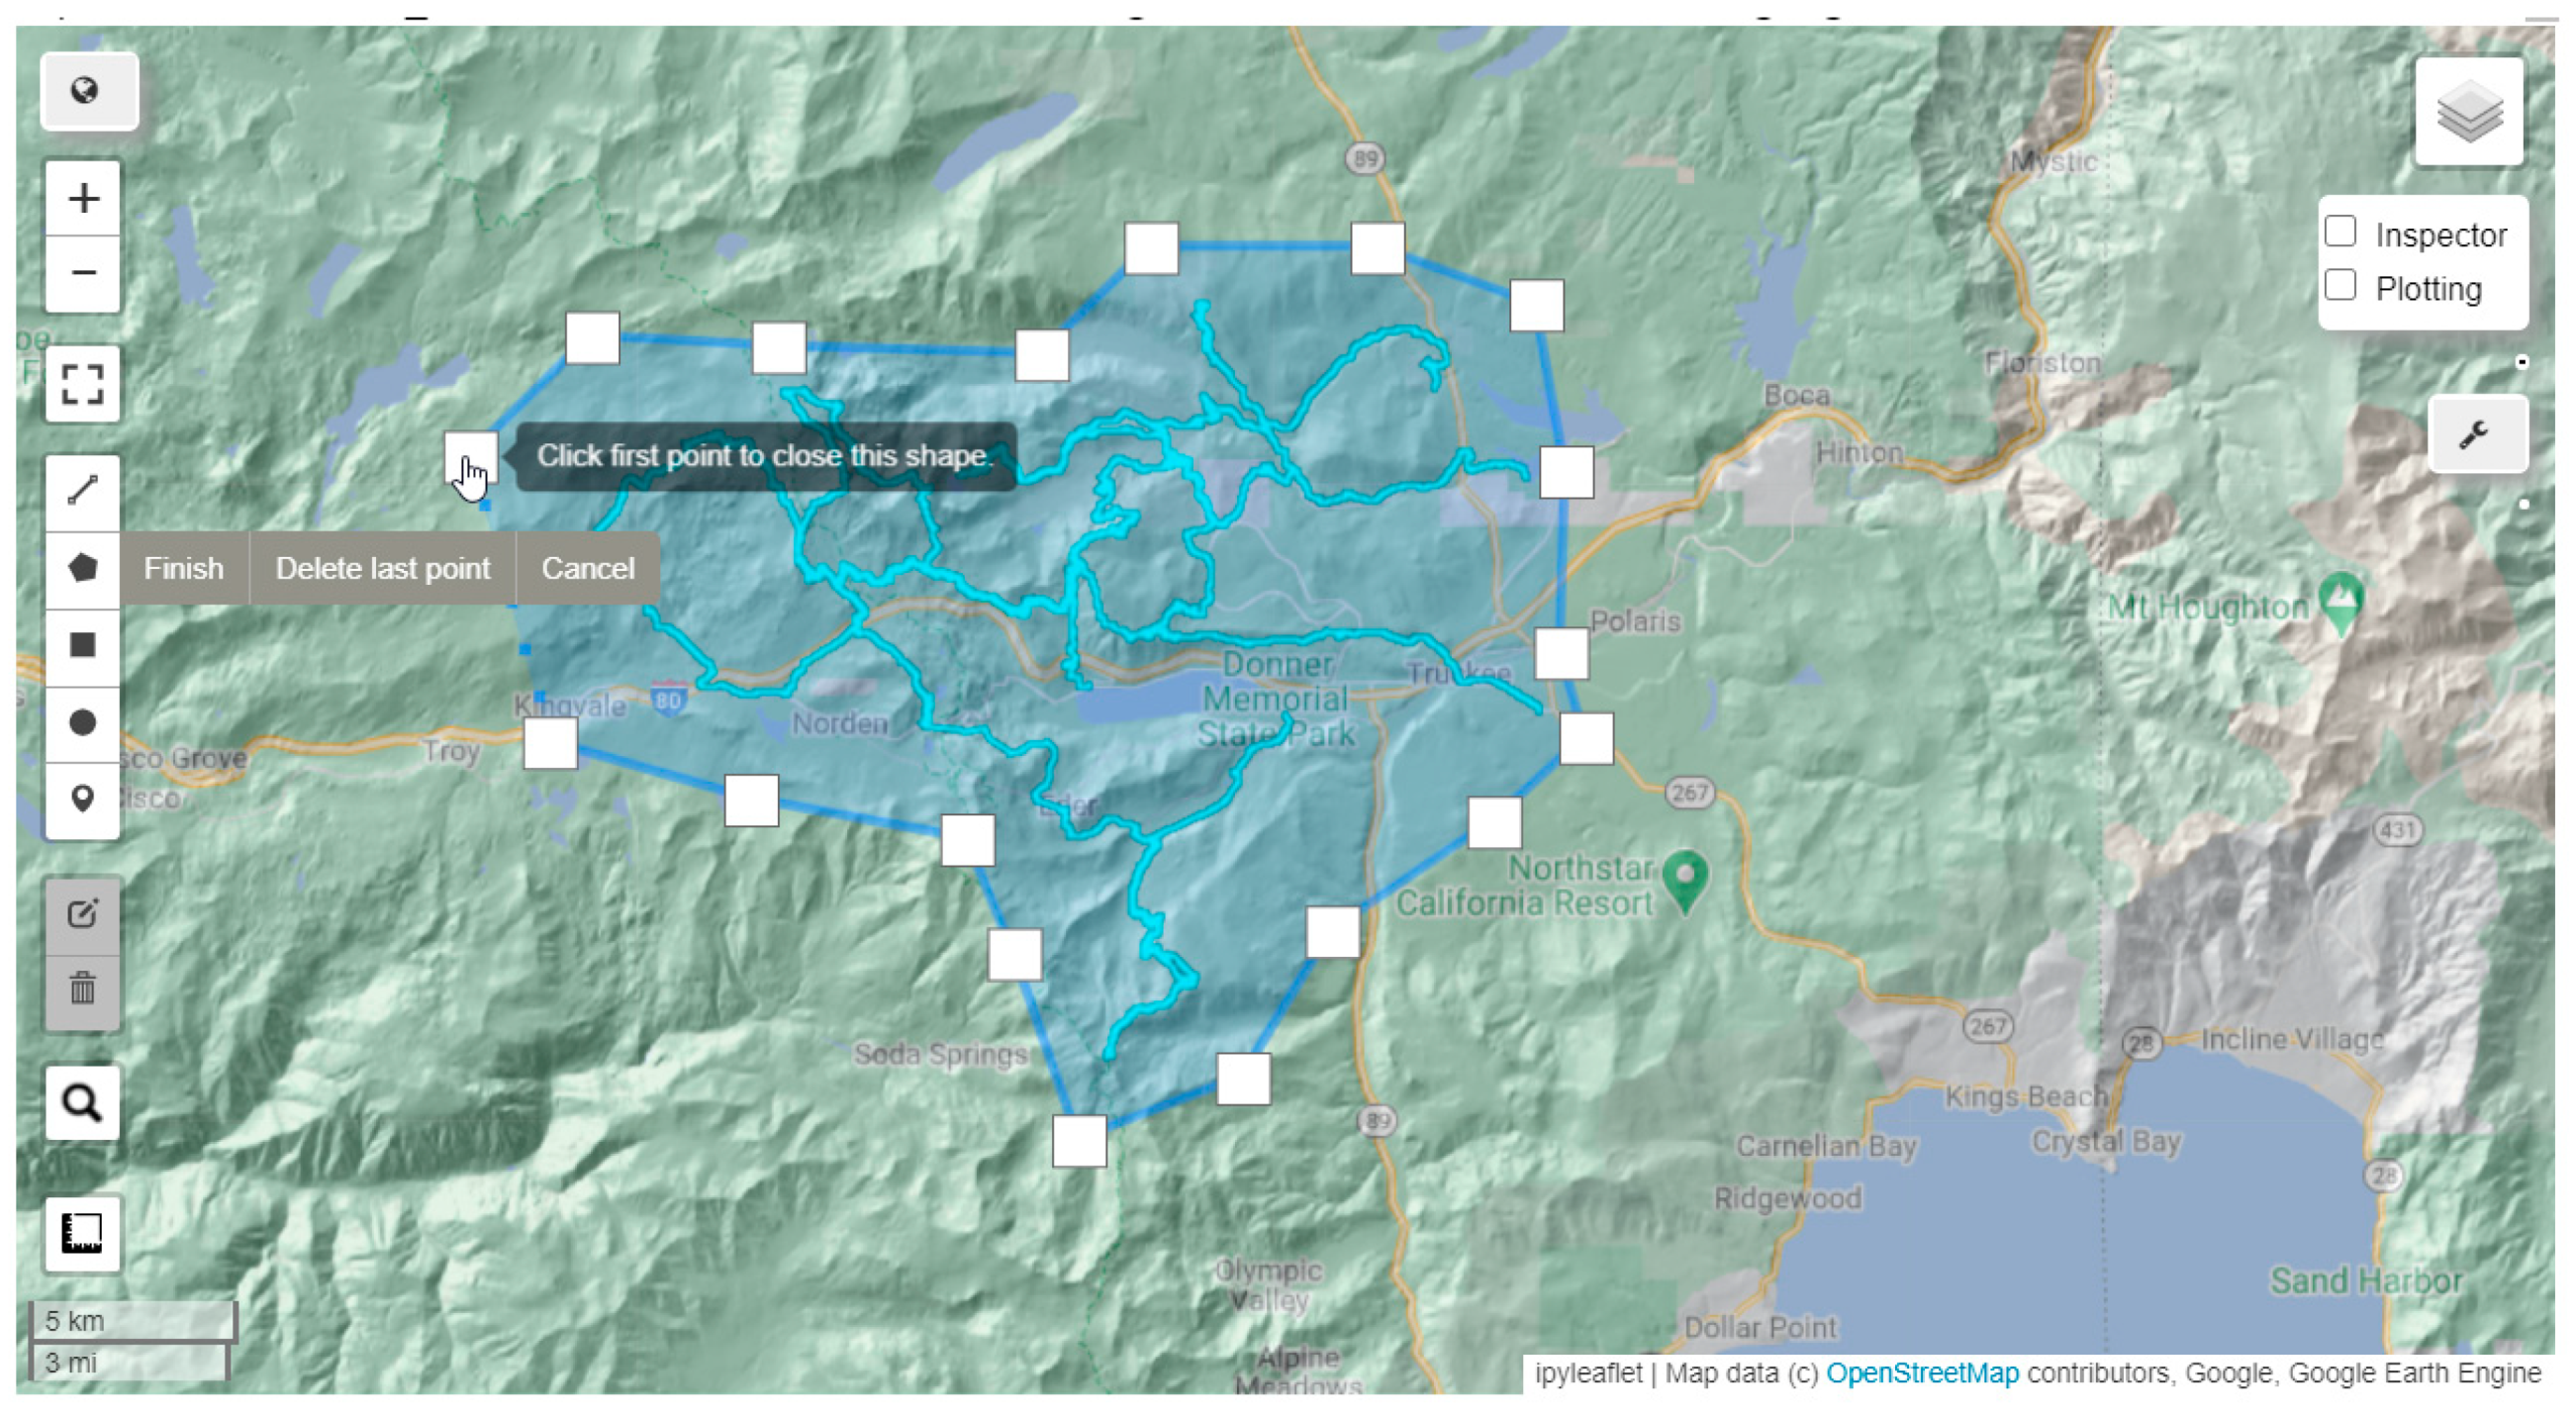
Using the geemap package (geemap.org (accessed on 20 February 2021)), the notebook version gives the user the ability to interactively digitize the print area rather than defining it via python code settings (Figure 7). Geemap offers an in-notebook interactive map interface. The user can digitize a rectangle, a circle or even a polygon to define the print area. If GPX route files are used, these are also displayed on the gee map.
Bottom Mesh Reliefs
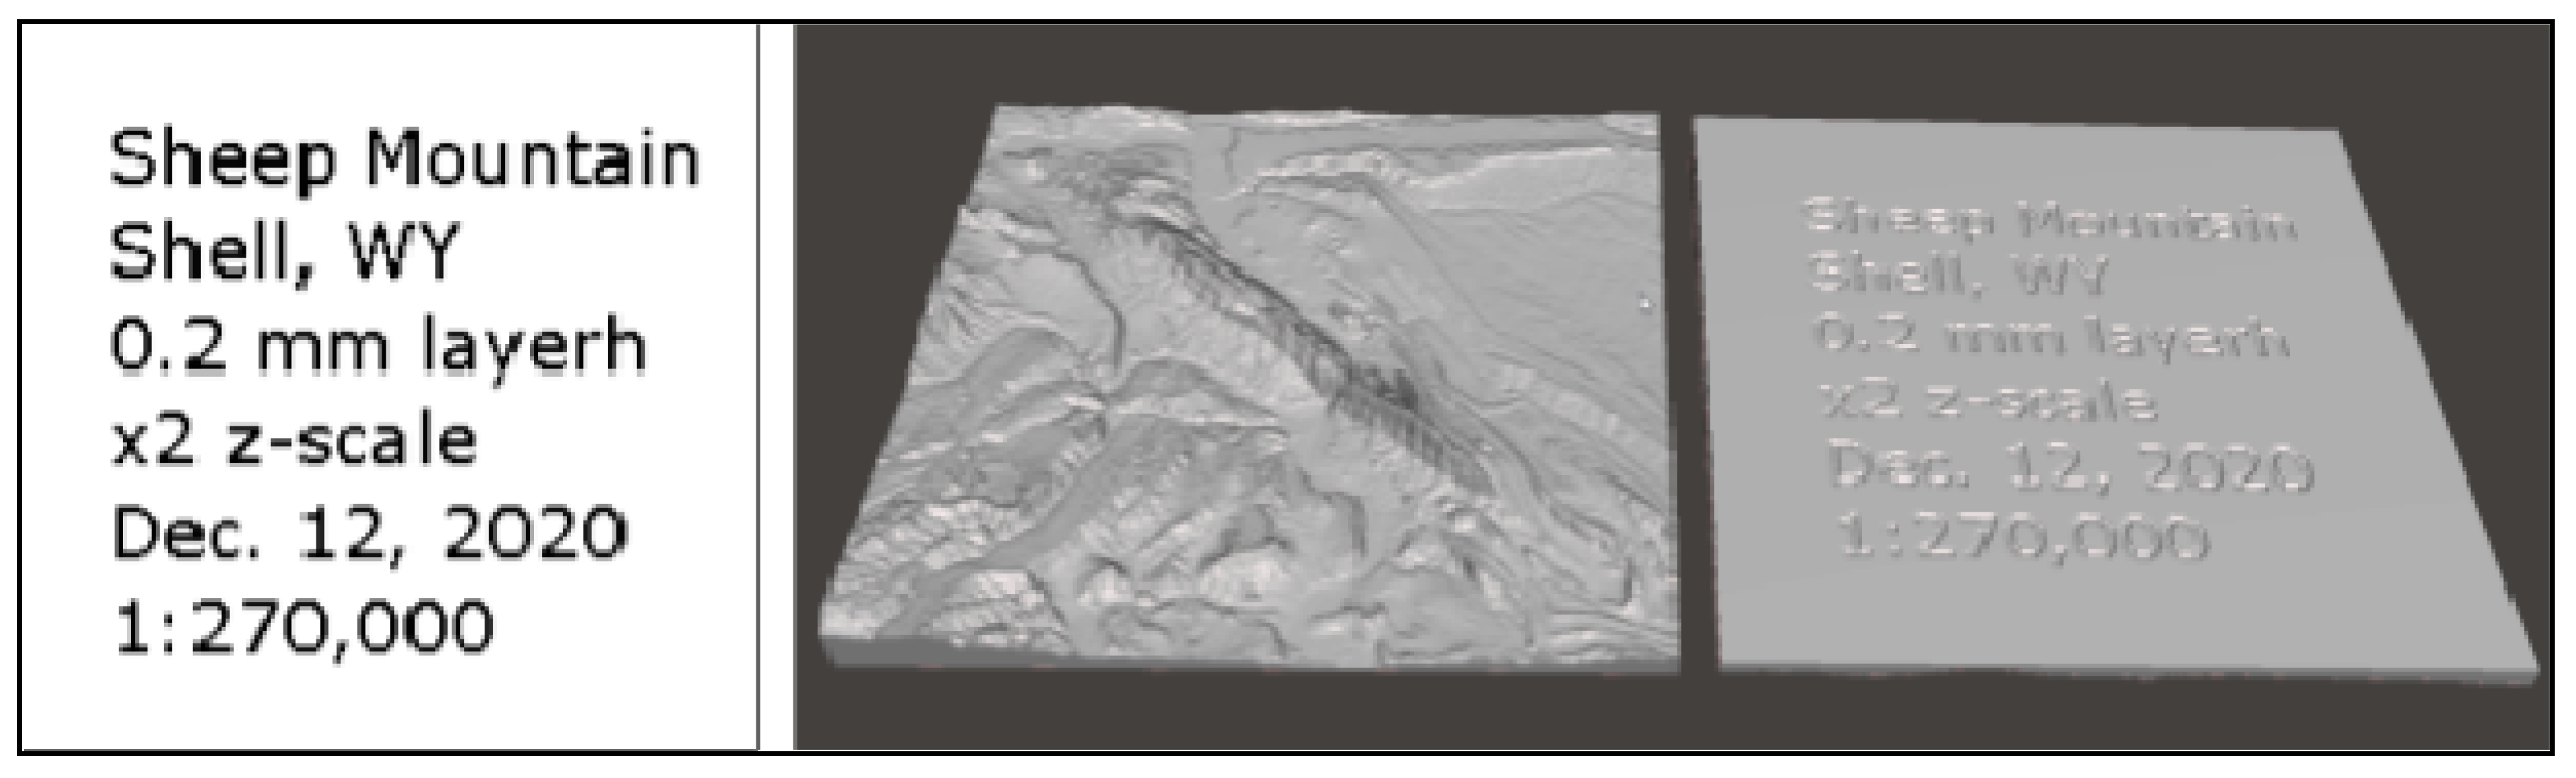
A final aspect of processing only possible with the standalone version is the use of a user-created grayscale (8-bit, 1 band) image for creating a relief on the bottom mesh of the model. The bottom mesh is then extruded upwards according to the value of its corresponding pixel value. White (value 255) pixels are not extruded, black (value 0) pixels are extruded upwards. Results are only legible at relatively large font sizes. Figure 8 shows the use of such a bottom relief to permanently encode metadata about the 3D terrain print. The image may also contain Braille text which could have potential application for terrain models in a BVI context.
4. TouchTerrain Web Application Usage Analysis
TouchTerrain uses Google Analytics, a web analytics service offered by Google that tracks and reports anonymized website traffic, to gain insights into its use. Every time a browser connects to the TouchTerrain server, anonymous information is collected and stored at the Google Analytics server. This includes time of access, type of device used, how the user found the page (e.g., directly via URL or bookmark, via Facebook or via a Google search), and detailed geographic information about the location of the user (city, county, lat/long). It also stores the URL query string and thus all the print options selected.
Collecting this kind and amount of anonymous user information is very typical and completely standard for any web page that uses the Google Analytics service, which almost all commercial websites do nowadays. TouchTerrain does not store any personal information or cookies. Instead of using Google Analytics for its intended marketing purpose, TouchTerrain uses statistics to study usage patterns for academic purposes.
The application will also record certain events such as the user click on buttons: (1) the Export button (i.e., when processing commenced); (2) the Preview button (i.e., when the processed model was previewed inside the browser); and (3) the Download button (i.e., when a processed model was downloaded). Users have the option to give feedback (up to 150 characters) about the terrain model they are about to download (“Optional: tell us what you’re using this model for”); this also generates an event that stores the feedback text. Beginning with TouchTerrain 3.0 (October 2020), the results of place searches are also stored via an event.
4.1. TouchTerrain User Analysis (“Who Are Our Users?”)
The following characterizes the TouchTerrain users by analyzing Google Analytics web statistics. To exclude cases where a user did not actually process a model, we base our analysis on sessions. A valid session requires that the Export button, which processes the model, was clicked at least once. Feedback, Preview and Download can only be clicked after Export has been clicked.
4.1.1. User Characteristics
The following lists some Google Analytics results based on data from sessions between 1 July 2019 and 26 December 2020:
- Nearly 20,000 sessions were recorded, or around 38 sessions per day;
- The average user session duration was 8 min, during which 5.8 pages are typically viewed;
- Most sessions (79%) are from returning users (i.e., which used the site twice or more), only 21% of sessions are from new users. The top three repeat users logged 234, 177, and 170 TouchTerrain sessions, respectively, from December 2019 to December 2020;
- 47% of users are located in the USA, with California (12%), Texas (6%) and Colorado (5%) as the leading states. In addition, 7% of users are located in Germany, 5% in the UK, 4% in Canada, around 2% each in Italy, France, Australia or Spain. The IP-geolocated coordinates of their browsers were used to create an interactive ArcGIS Online dashboard (https://arcg.is/0L8fLz (accessed on 20 February 2021); see next section);
- 62% of users run Windows as their operating system, followed by 16% on MacOS and 2% on Linux. The remaining 20% of users apparently browse TouchTerrain from a mobile device (36% on Apple iPhones, 6% on Apple iPads, with the rest using an Android device);
- 53% of TouchTerrain sessions were initiated directly via a URL. This URL could come from the user’s memory or from a browser bookmark, or perhaps the user’s browser had stored the URL from a previous session. The full model URL that TouchTerrain shows the users at the end and permits them to bookmark specific model settings may also contribute to this unusually large percentage;
- TouchTerrain is also often found via a web search. 33% of sessions were the result of a Google search, with other search engines (Yahoo, Bing, duckduckgo) contributing a total of 2%;
- 2% of sessions were referred from blog.touchterrain.org (accessed on 20 February 2021), the TouchTerrain blog. Looking at social networking sites, around 5% of sessions come from Facebook, 1.5% from YouTube and 0.5% from reddit. Some traffic comes from community sites, such as geo.lmz-bw.de (1%) (accessed on 20 February 2021), which publish content about TouchTerrain.
4.1.2. User Workflow Analysis
Pressing a button generates events. Events can be used to analyze the workflow of a typical session. Table 1 shows the number and type of the different categories (types) of events recorded between 12 October 2020 to 26 December 2020. Unique events are counted only once per session, total events record all events during a session, typically multiple times. This multiplication factor is shown as Total Event Factor
Looking at this multiplication factor suggests that users typically refined their print settings after processing and reprocessing it again (possibly using preview to make this decision) before downloading the model. Using the number of unique exports events as 100% (as export is a prerequisite of the other events), only 82% of all user immediately downloaded their model. This indicates again that some users went back to the map, changed parameters and pressed Export once more. Around half of all sessions used the in-browser 3D visualization tool to preview the model prior to download. About 6% of users left some text as optional feedback about the model’s usage.
The place search field is the only event that can be triggered on the map page, i.e., prior to processing Export. A large number of users seem to find this functionality useful. On average, each session performed 1.14 place searches. The 25 most popular places searched for can be found in Table A1.
4.1.3. User Locations
Google Analytics reports the user’s location for 99.75% of all TouchTerrain sessions using IP-based geolocation. Note that there are many locations from which, over time, many downloads were made. As this leads to a “stack” of many points at the exact same location, a point data visualization cannot adequately represent this fact. However, a kernel density derived heatmap is able to account for such stacks. Figure 9 shows the heatmap, which again suggests the US and Western Europe as primary user locations for TouchTerrain. The full dataset, including the individual point data, can be explored at this ArcGIS Online Dashboard (https://arcg.is/0L8fLz (accessed on 20 February 2021)).
Figure 9 shows a heatmap of user geolocations (July 2019 to December 2020) at the time of hitting the download button. Each of the roughly 19,000 locations was converted into a point (using WGS84 as coordinate system) with the date and time, city, and county as data attributes. Using a geodesic gaussian kernel density operation with a search radius of 50 km, these points were used to create a global density raster (resolution 10 km), which was colored as a heatmap.
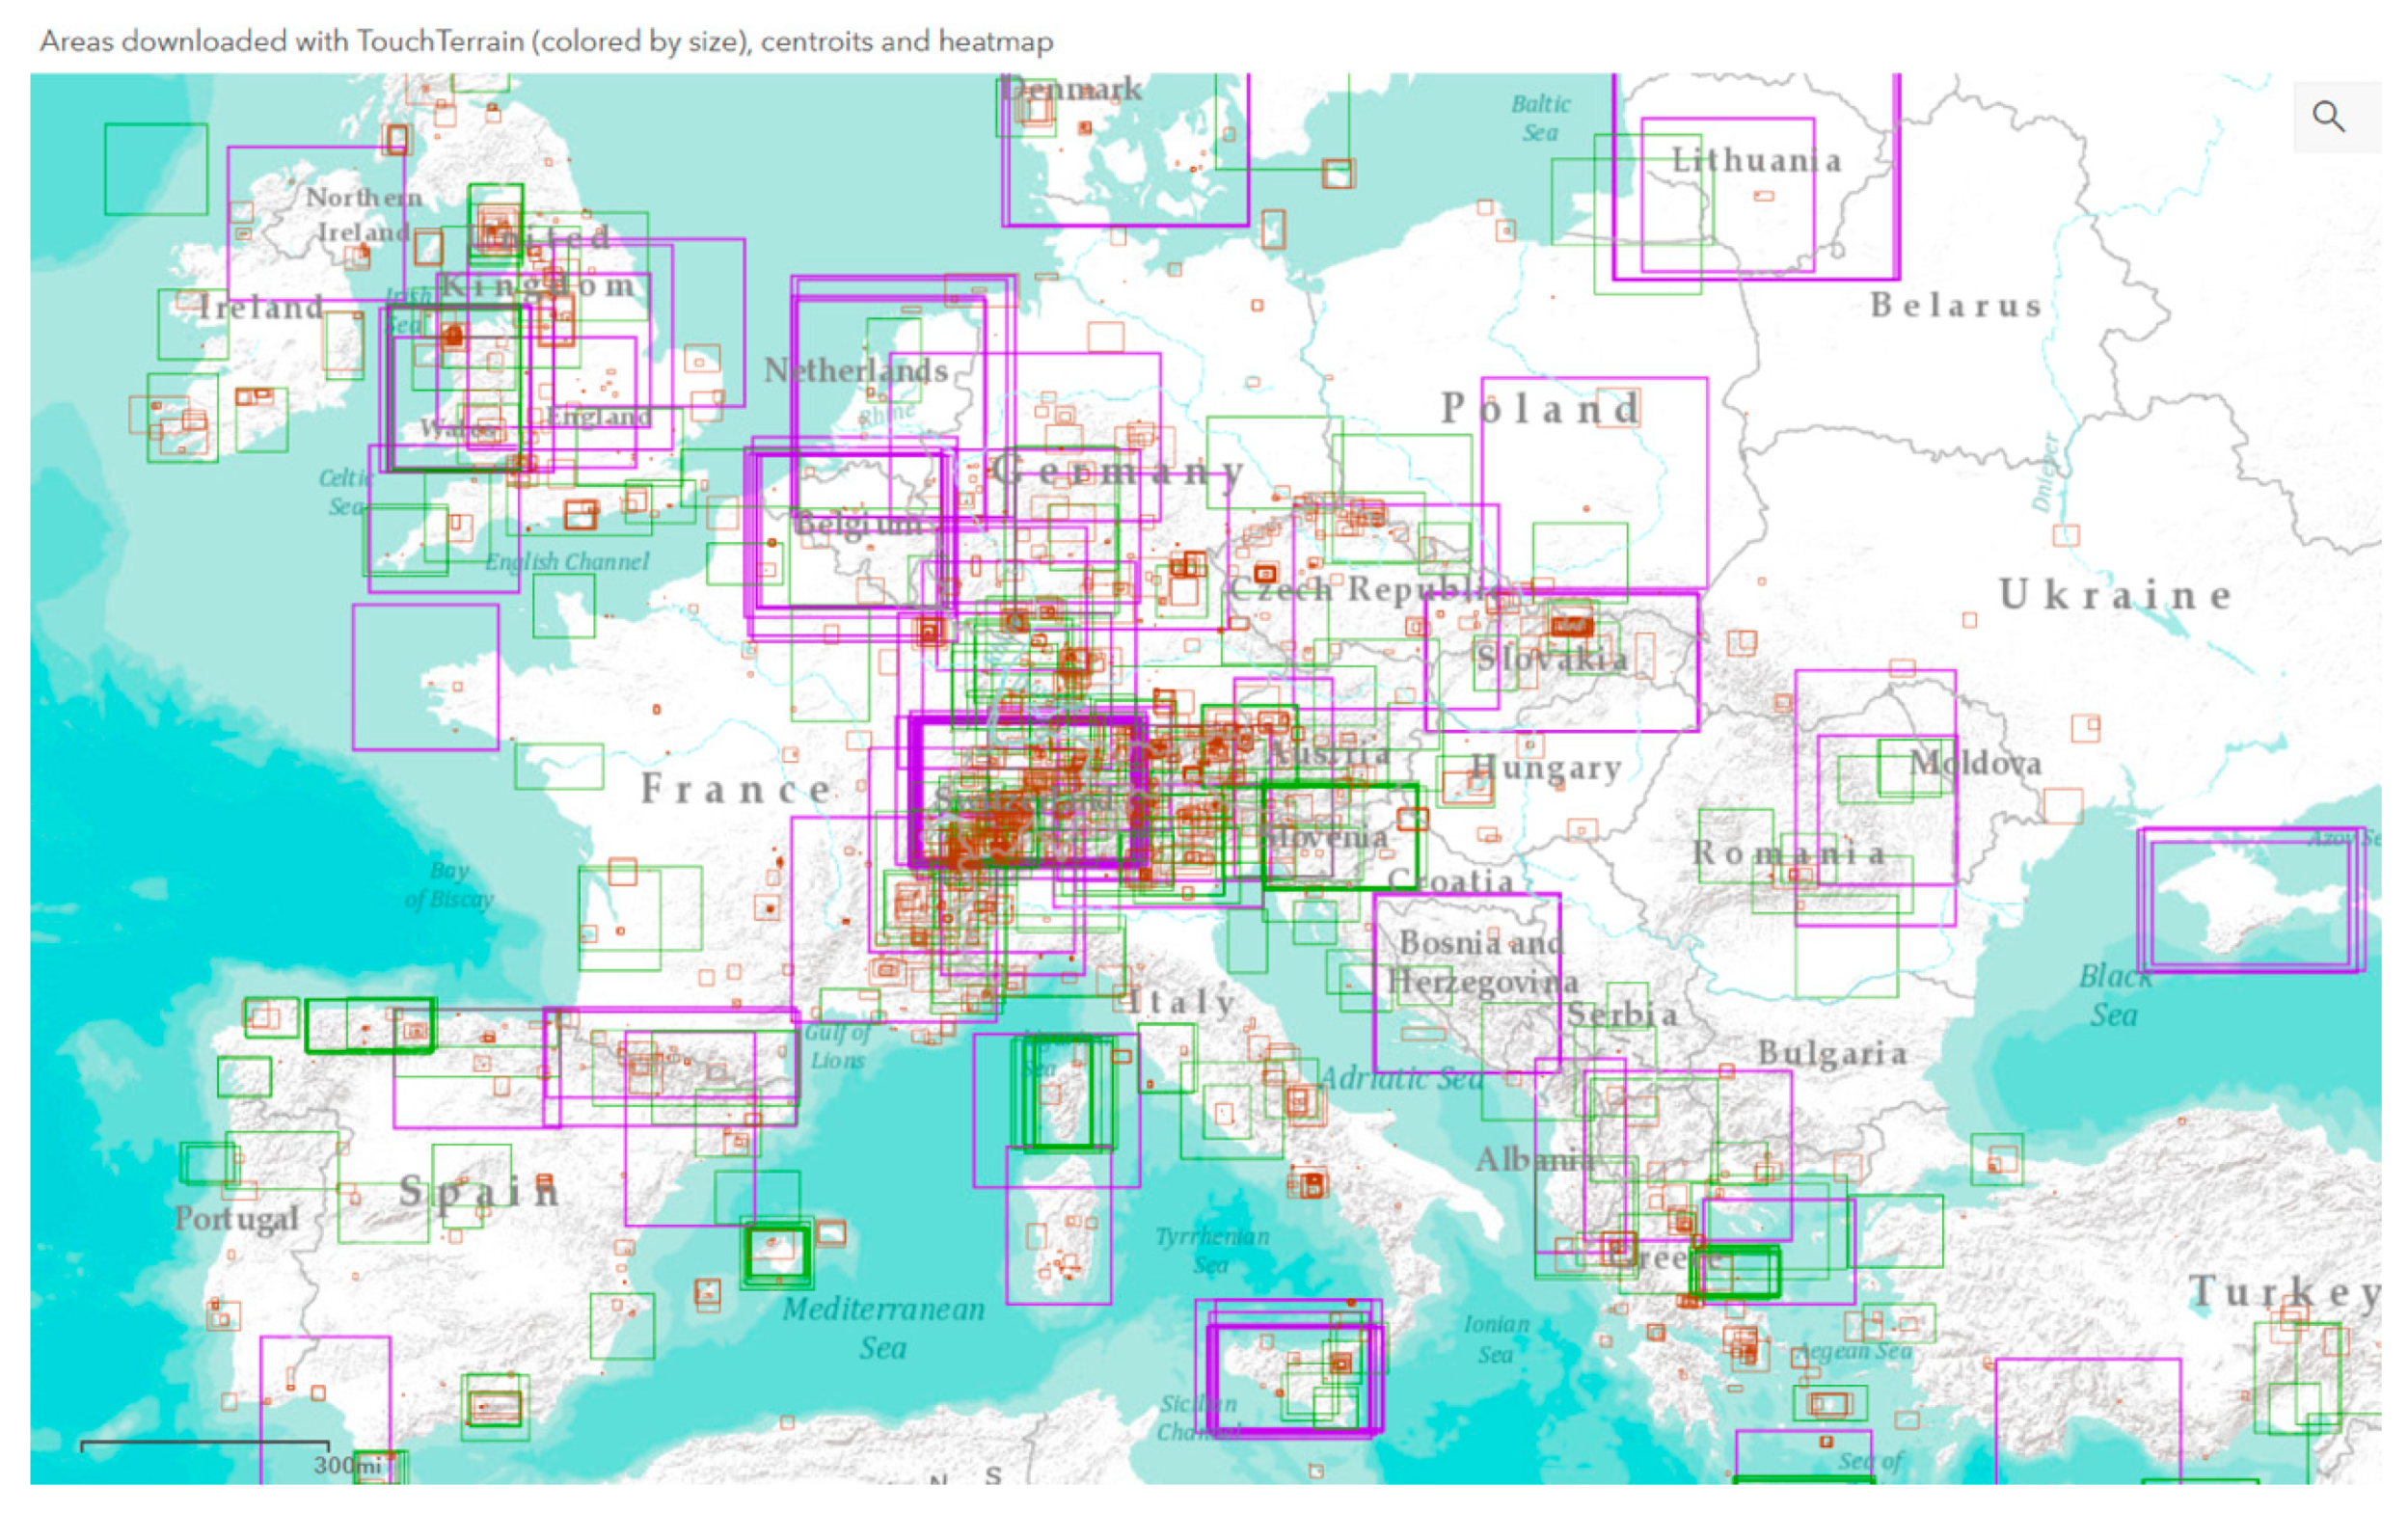
4.2. Area Selection Boxes (“What Areas on the Globe Are Most Attractive for 3D Terrain Printing?”)
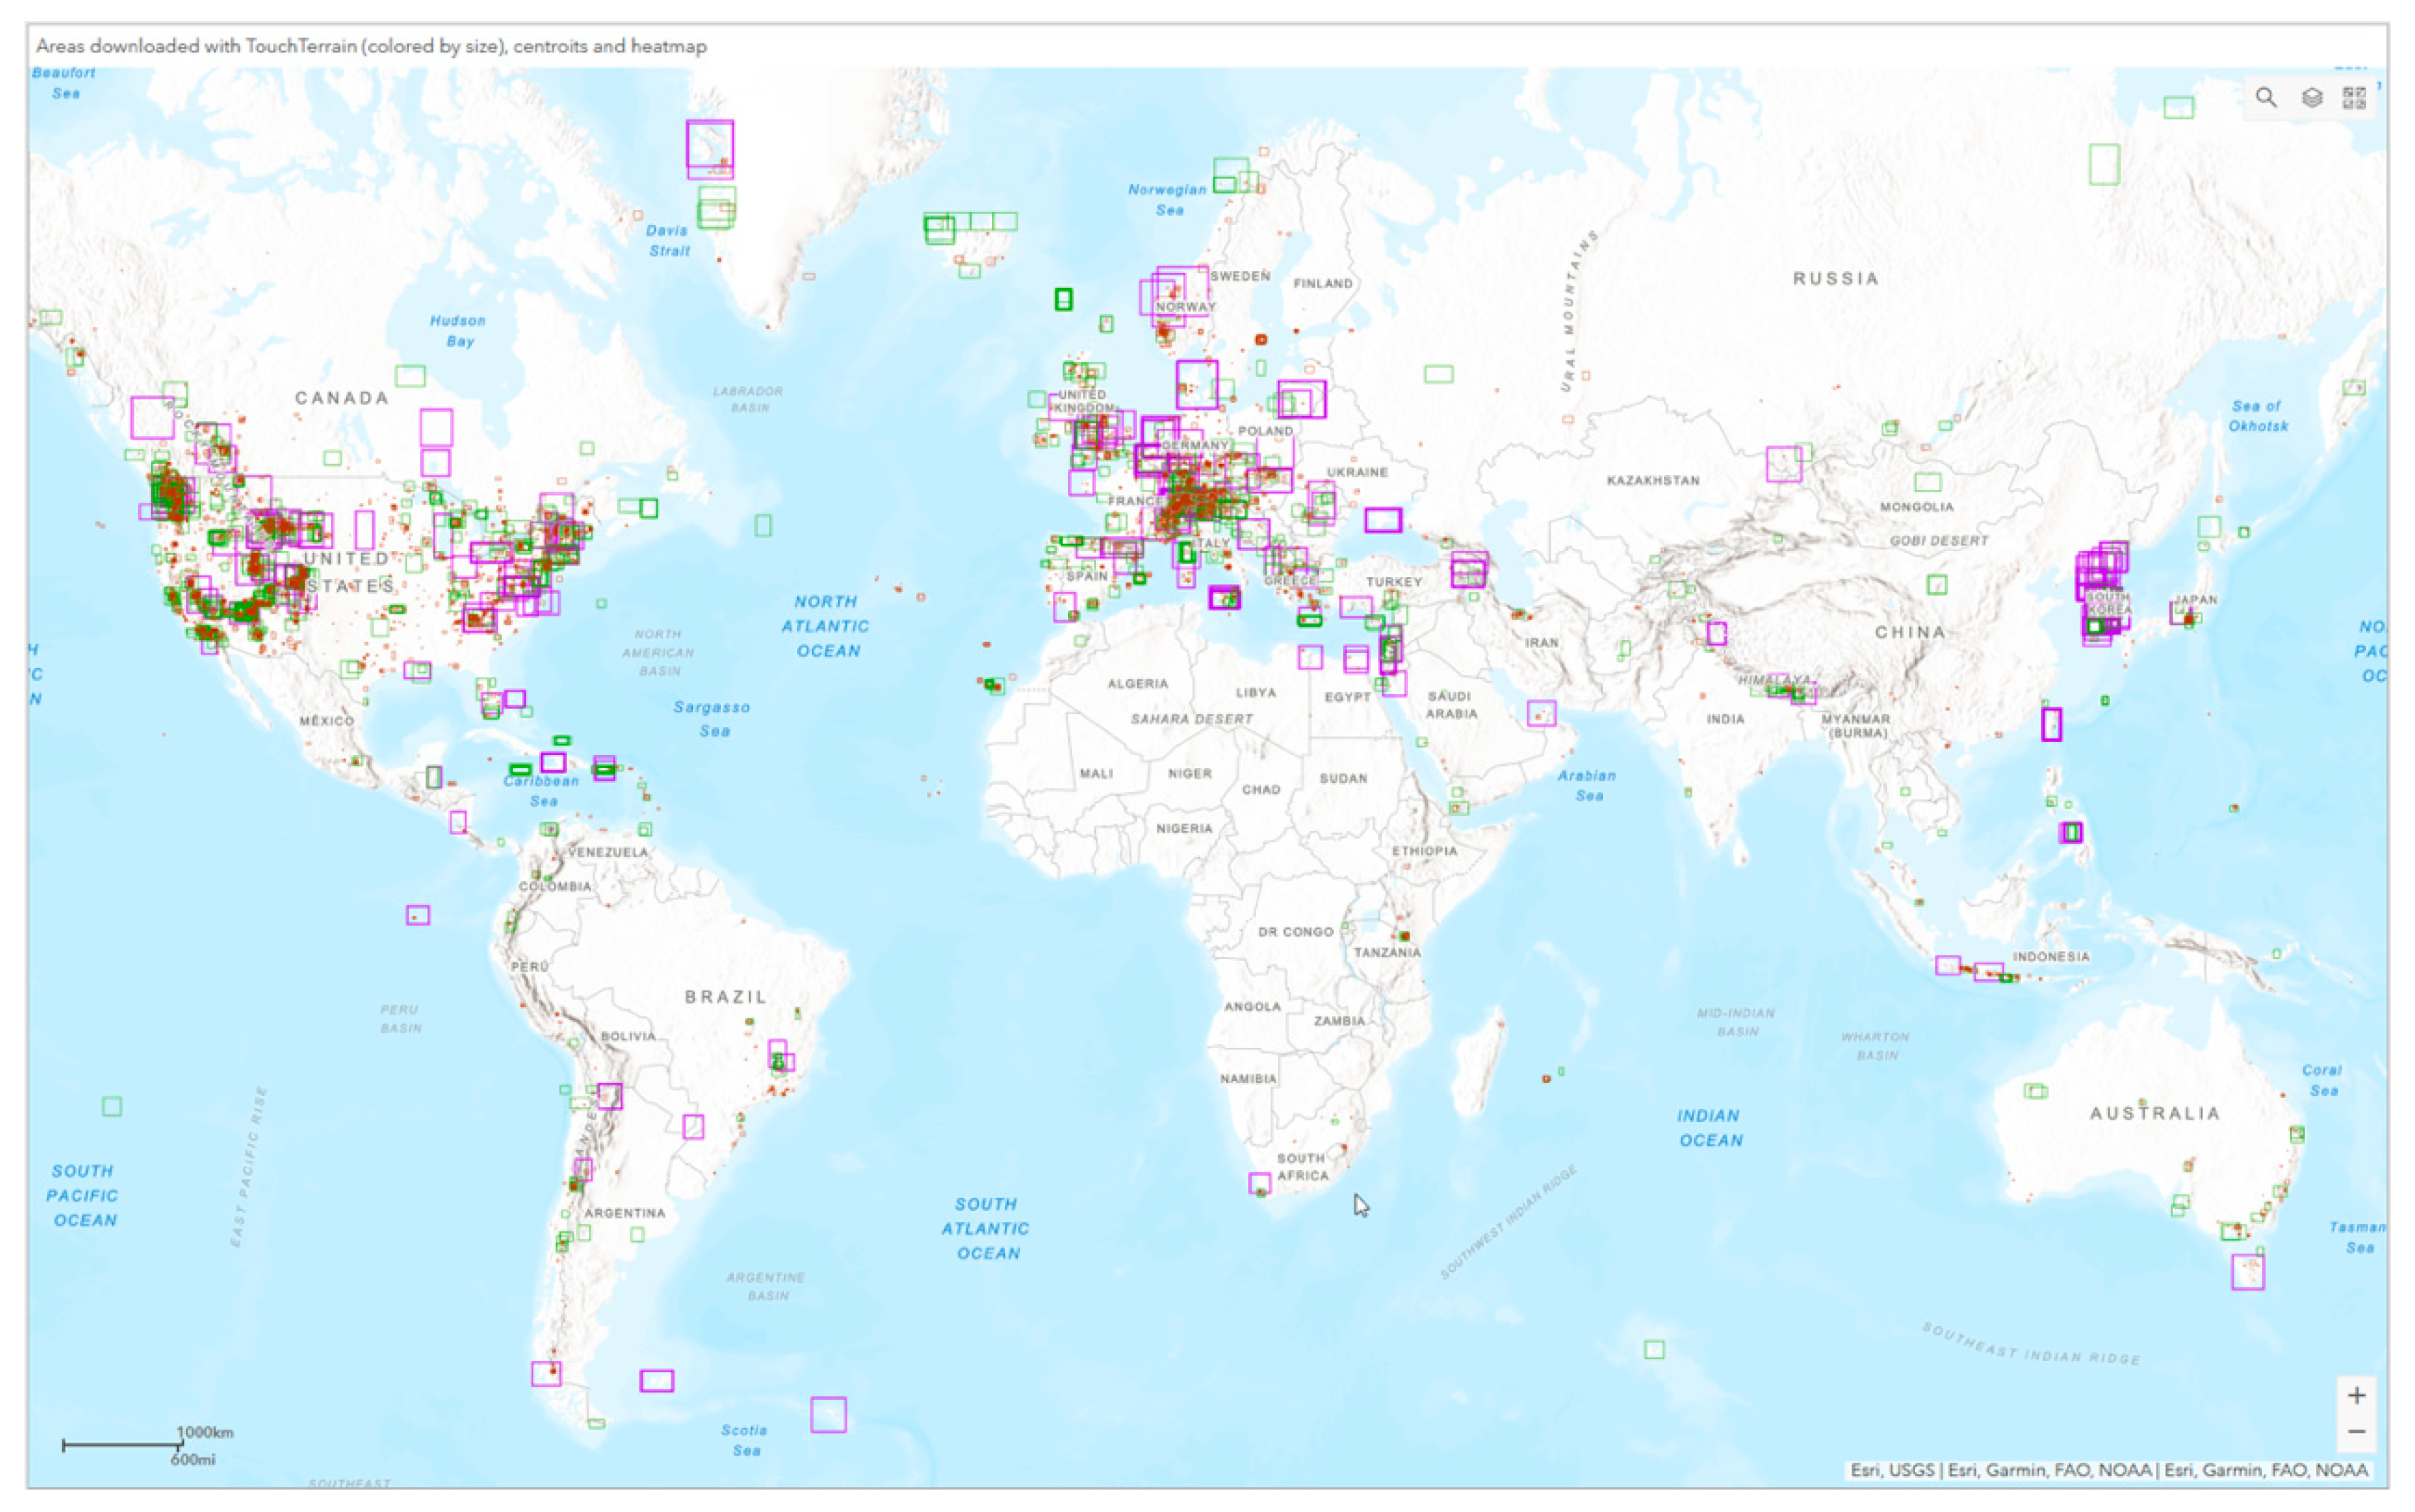
Perhaps more interesting is a look at the areas that users had selected for their 3D terrain prints (Figure 10). Due to changes in the format of the data transmitted to Google Analytics, only user data between November 2019 and December 2020 could be used for this analysis. Again, an ArcGIS Online Dashboard was created to allow the interactive exploration of this large data set here: https://arcg.is/0PO1nK (accessed on 20 February 2021).
From the coordinates of opposing corners of the area selection box, 9925 point pairs were extracted. Exact spatial duplicates were removed. In ArcGIS Pro, the Coordinate Table to two-point line created a diagonal line from each pair. The Feature Envelope-to-Polygon tool was then created a bounding box rectangle from each diagonal. Finally, box centroids used to create a heatmap with a 50 km density kernel. Boxes were divided into three categories by their area and color coded (large = purple, medium = green, small = red), which helps reduce visual clutter. Figure 10 shows a map of the print area boxes, colored by size category, suggesting that mountainous parts of Western Europe and the USA are particularly popular with users.
Figure 11 shows the area selection boxes in Europe. The cluster pattern observed here seems to suggest that users are drawn to mountainous areas, such as the Alps. Closer inspection also reveals “concentric” patterns, which may be the result of a user refining the extent of the print area over several steps. In the US, mountainous regions, such as the Rocky Mountains or the Cascades, monumental structures of the American Southwest, such as the Grand Canyon, and large volcanic structures (such as Mount Rainier in Washington State or Crater Lake in Oregon) appear to be popular. Looking at the most popular place search terms seems to confirm this (see Table A1).
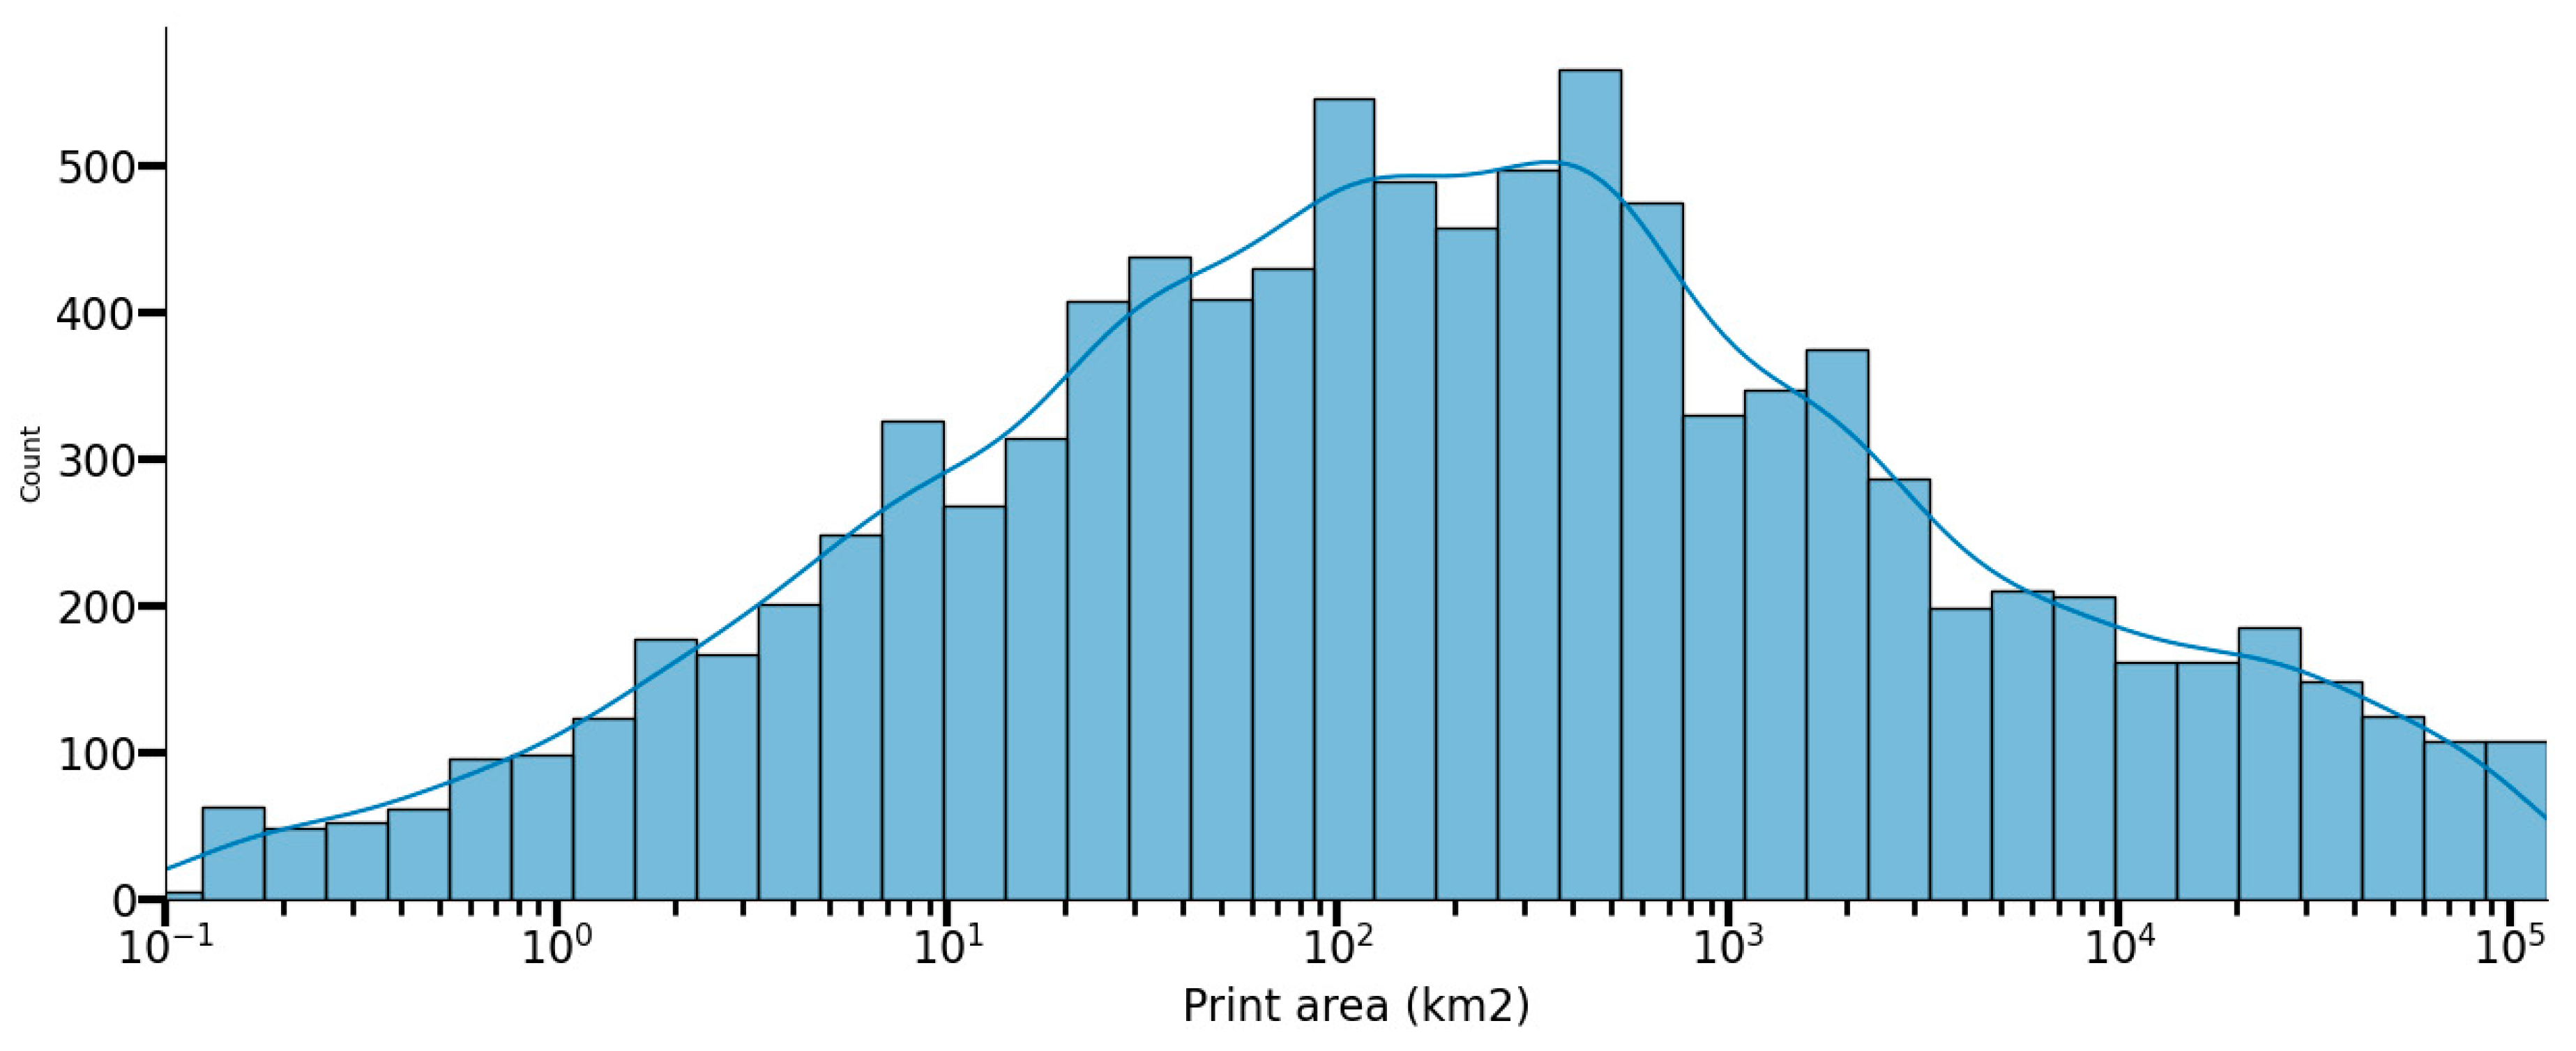
Analysis of the Size of the Area Selection Boxes
Plotting a histogram of the areas of these 9925 selection boxes showed an extreme positively skewed distribution. When plotted without a transformation, the very smallest areas would seem to dominate. However, plotting it using a log10 x-axis (Figure 12) shows an approximately bell-shaped distribution with area for around 300 km2 (corresponding to a square with 17 km long sides) as the most common choice.
4.3. Analysis of the Optional User Feedback
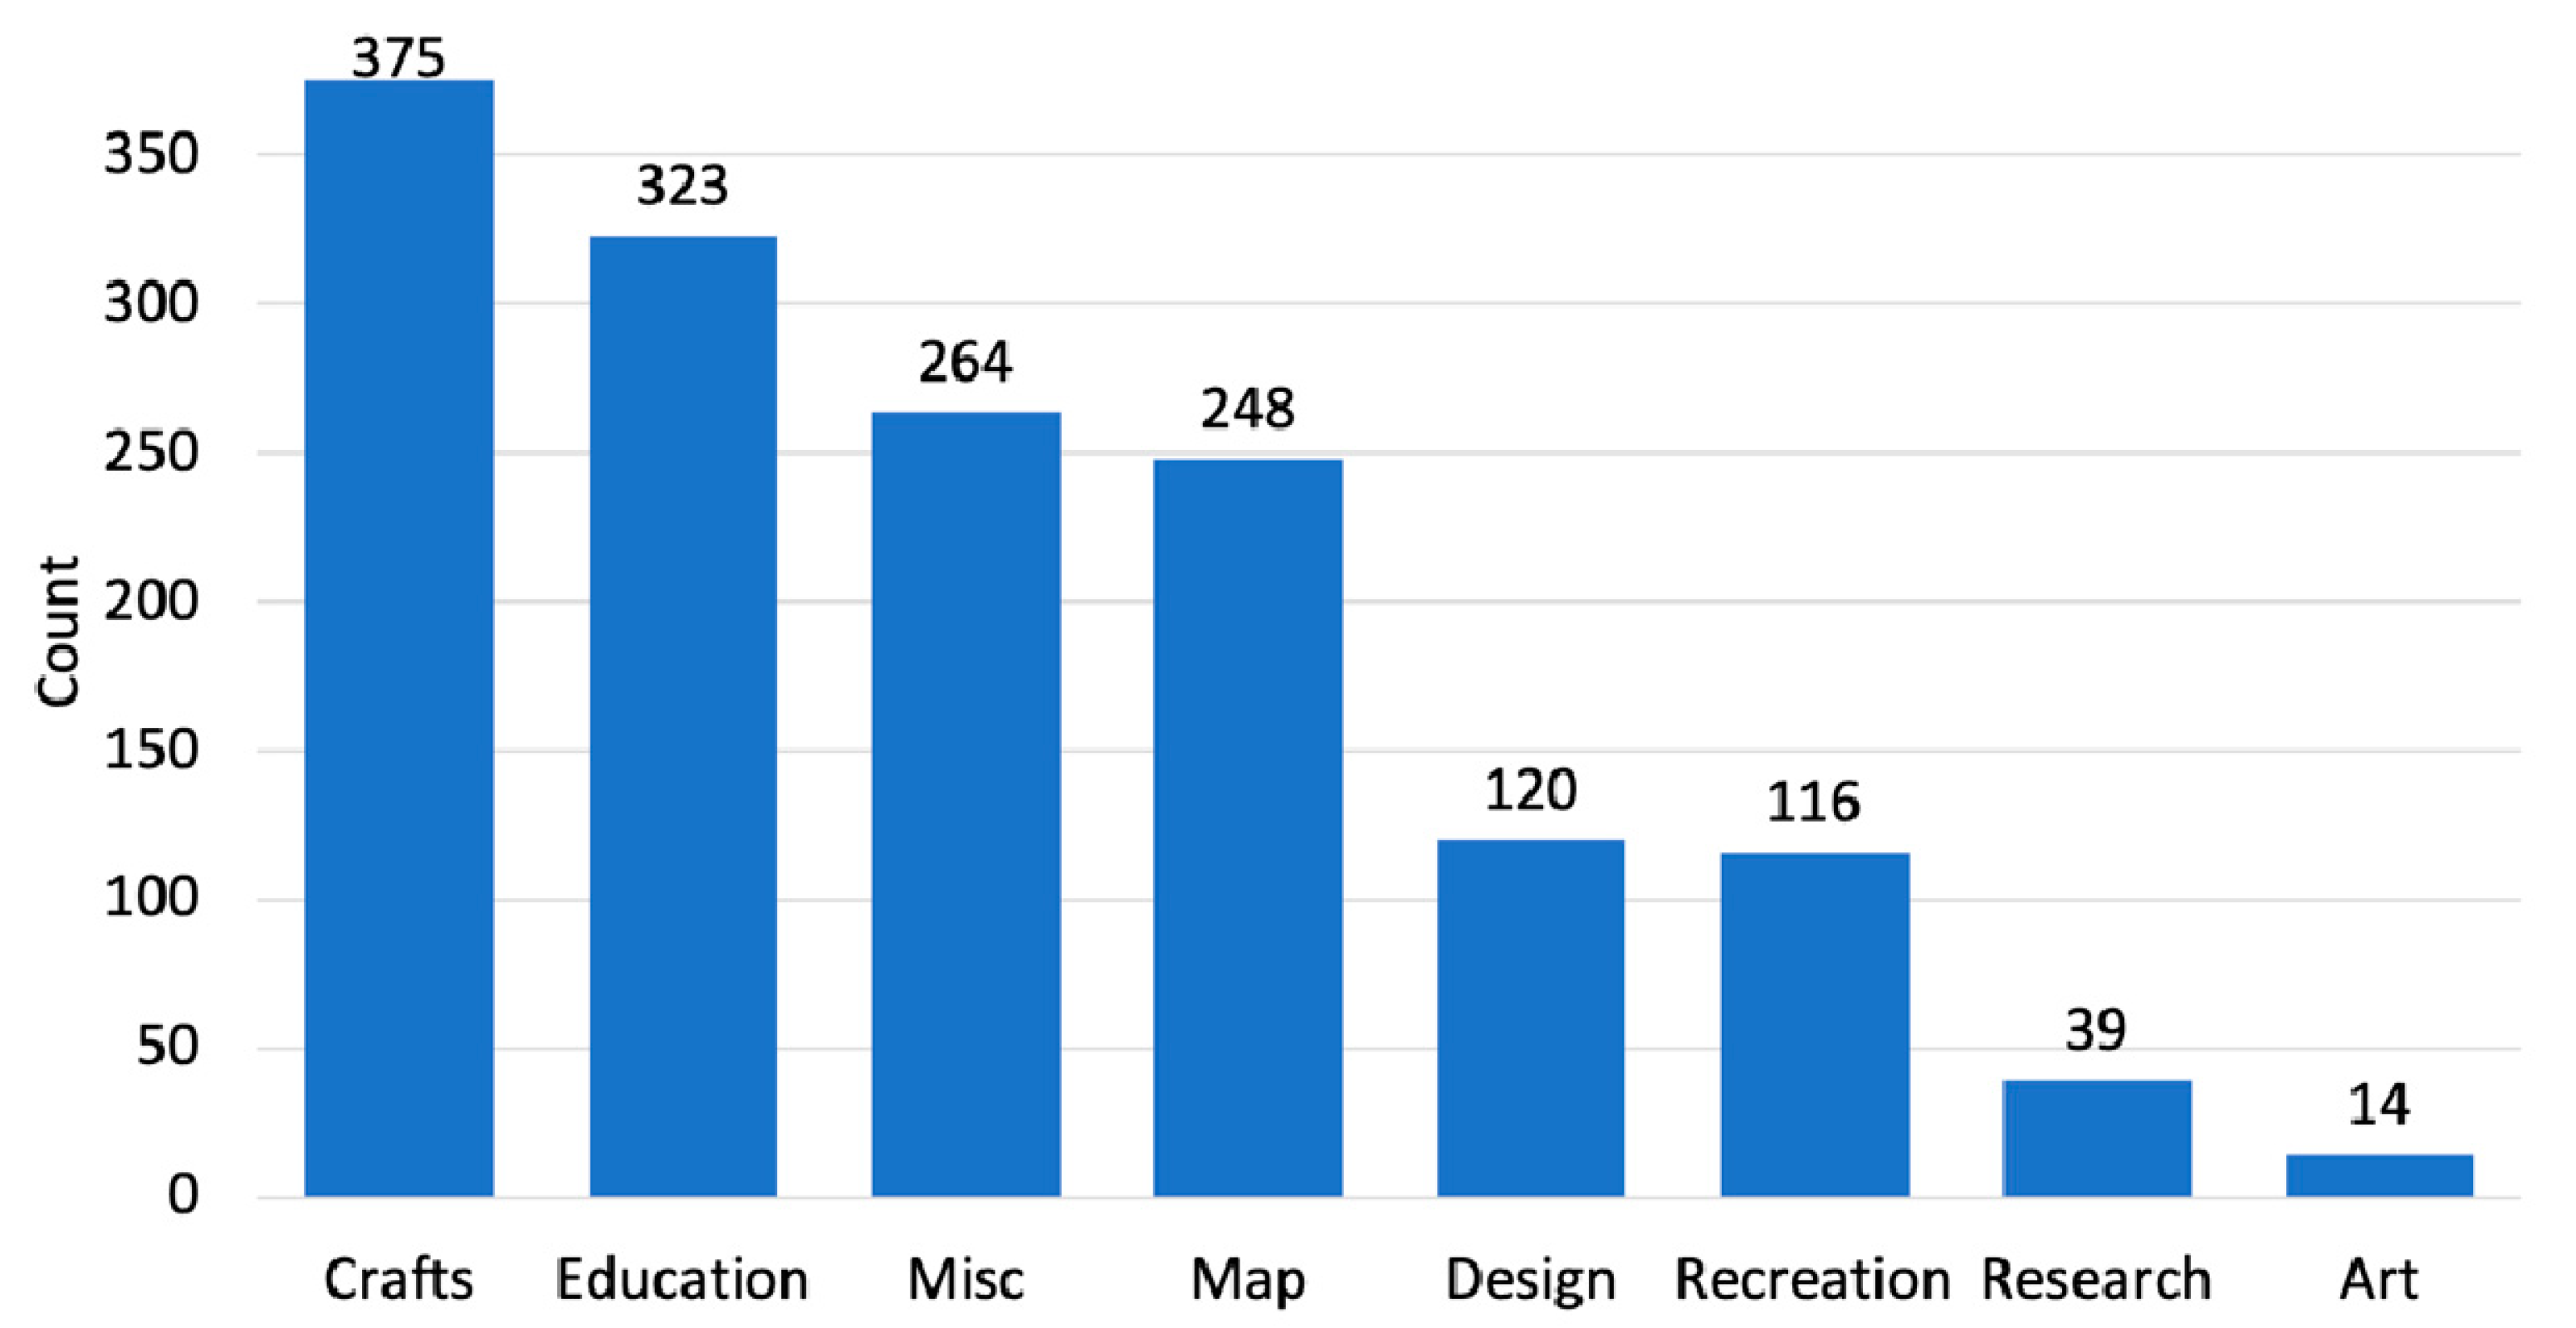
After processing is finished, users are given the option to comment on the purpose of the terrain model (“Optional: tell us what you’re using this model for”). Between July 2019 and December 2020, 1947 users (~6% of all users) provided comments of varying length and quality. A table in csv format, containing these feedback comments, can be found in the Supplementary Material section. After discarding meaningless feedback (such as gibberish, n = 146, or users indicating they were just testing the software, n = 302), the remaining 1499 comments were divided into categories (n = 8) and subcategories (n = 77), which were meant to capture the essence of what the model is used for. If the information given in the comment was too sparse, no subcategory was assigned to it. The system of categories and subcategories used was subjective as was the interpretation of the comments. However, care was taken to be internally consistent. Table 2 shows the system of categories and subcategories used for the analysis. Cases where the category and subcategory are identical (e.g., Art–Art) indicate that a more specific subcategory could not be assigned.
In addition, each comment was tagged with the type of 3D printing technology intended to be used. By default, that type of usage was assumed to be 3D printing (3DP), which seemed reasonable given the overall messaging of the entire web application as intended for 3D printing. However, a 11.7% of comments contained words like CNC or carving; indicating a subtractive, carving process which were flagged as “CNC.” In three cases (0.2%), laser cutting was mentioned, which indicated that the model was to be assembled from laser cut slices of paper, wood or acrylic. The remaining 88.1% of all models was assumed to be intended for 3D printing.
Figure 13 shows the number of comments for each of the major categories. Most models are used for crafting, education or creating a 3D map of an area.
Table 3 and Table 4 list the number of comments by category/subcategory and by type of technology used. n total shows the total number of comments assigned to each category/subcategory combination that was used. n 3DP shows how many of those comments were tagged as being created with 3D printing technology, n CNC those tagged as being created with CNC type technology. Table 3 also includes examples of the feedback text.
Sadly, the most common combination, Misc./Personal, is hardly indicative of its actual usage, indicating the difficulty of interpreting the often terse comments into anything more specific. However, the next most common usage is for education in general, followed by crafting terrain models intended as gifts. This is followed by models intended for CNC carving and by models for creating a 3D map of an area in general.
5. Educational Use Cases of 3D Printed Terrain Models
At Iowa State University (Ames, IA, USA), 3D printed terrain models were first deployed in 2017 and continue to play a role in the undergraduate geology curriculum, primarily as teaching aids for mapping tasks.
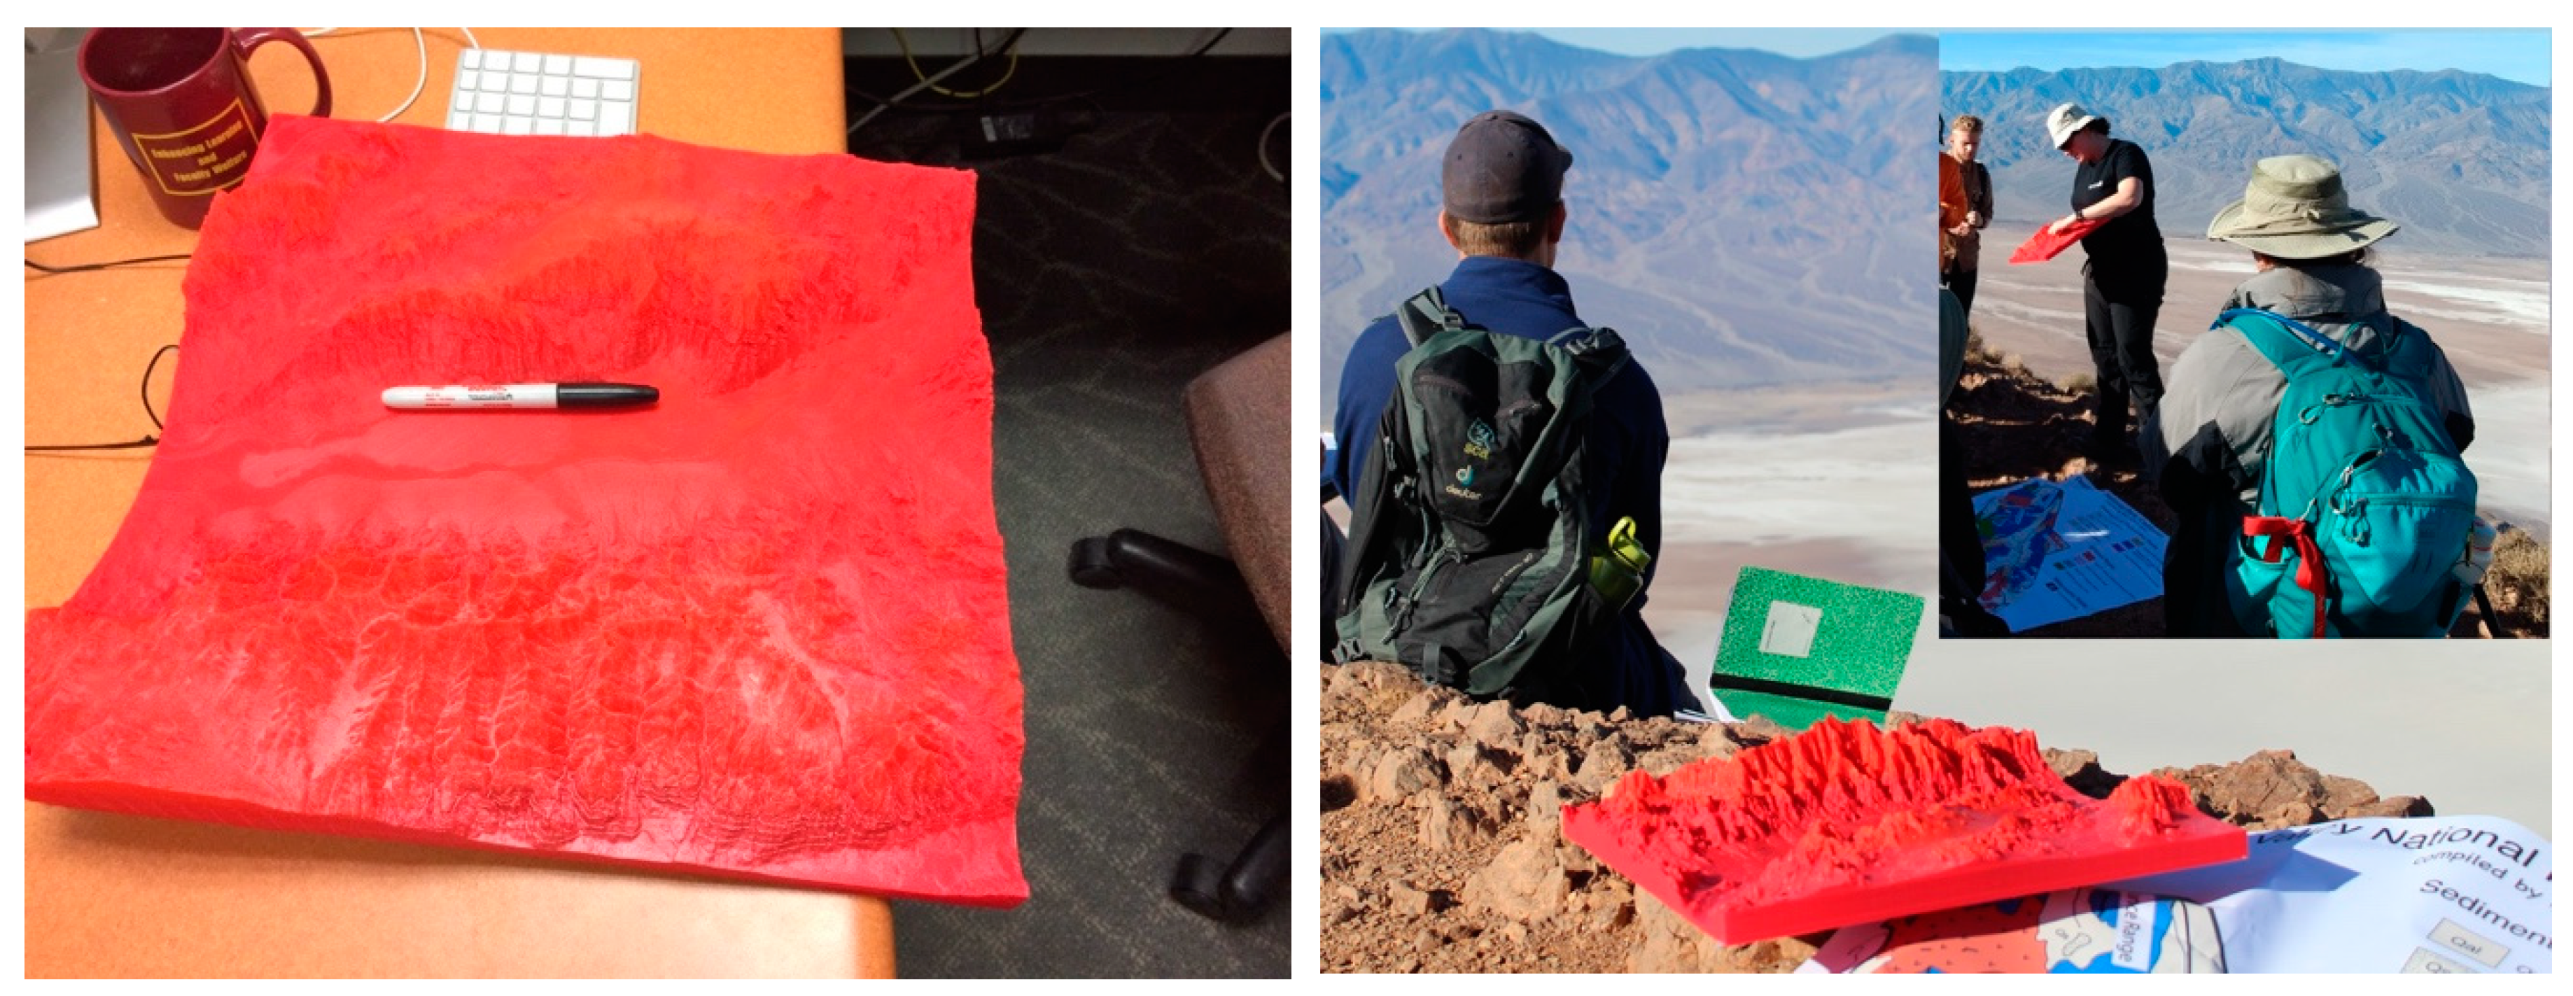
5.1. Field Trip to Death Valley
A very large 3D printed terrain model (400 × 400 mm, z-scale 2×) was used during a 2018 field trip to study the geology of Death Valley (Figure 14). On location, the model (dubbed Mordor by the students) was used to teach them about the geomorphology of the valley (e.g., alluvial fans and other erosional features) and, in conjunction with a geologic map of the area, was used to put the terrain’s various geologic units into spatial context. The model used more than 1 kg of red PLA filament (~USD 30 worth) and took ~50 h to print.
5.2. Geologic Mapping Exercise in Summer Field Camp
GEOL 302 is a 6-week summer field course required of all geology majors. The course focuses on applied geology and provides students with extensive experience in geologic mapping and performing field analyses related to structural deformation, stratigraphy, sedimentology, geomorphology, metamorphic processes and energy resources. The Alkali Anticline Mapping Project comprises a three-day excursion to an anticlinal structure in which student groups (3–4 individuals per group) map formational contacts and collect data on fold and fault geometries of this asymmetric, doubly plunging anticline in the Bighorn Basin, Wyoming, USA. Furthermore, considering the large size of the mapping area (13.5 km2), students must plan their area traversals to efficiently collect enough field data to then be able to fully characterize this complex geological structure on their final 2D geologic map.
Fourteen 3D printed terrain models of Alkali Anticline were used during the last three field seasons to support the mapping project. The 14 cm × 19 cm terrain models represent the topography of a 13.5 km2 area and were printed with a vertical exaggeration of 2×. The model size was chosen for ease of manipulation and transportation during field exercises. Models were printed in ABS material, which is sturdy enough not to suffer damage during the sometimes rough outdoor handling. They were sprayed with a light gray automotive primer paint to ensure good contrast, even under bright outdoor lighting, and to allow students and instructors to temporarily mark waypoints, data, and working hypotheses using soft pencil lead or colored pencils.
Each group of 3–4 students was provided with a 2D topographic base map, a printed satellite image, and a 3D printed terrain model at the start of the project (Figure 15). The instructors spatially oriented students on all representations at the beginning of each day in the field. Students were instructed on how to use the 2D topo map, satellite image, and the 3D model together to plan efficient and safe hiking paths that optimize data collection and make working hypotheses regarding the placement of formational contacts, fault traces, and fold axial traces and plunge. More specifically, the 3D terrain models were used to predict the contact locations by using the geomorphic expression of previously studied geologic formations (i.e., ridge-forming vs. valley-forming lithological units). Disjointed ridge segments and variable valley geometries on the 3D terrain models provide evidence of fault offset whereas slope steepness and orientation of dip slopes on the models delineates folds within the strata.
5.3. Topographic Map Exercise in Introductory Geology Laboratory
The 3D printed terrain models of Alkali Anticline are also integrated into an introductory physical geology laboratory course (GEOL 100L), allowing novice geology students to practice reading and interpreting complex maps of real topography. Topographic map exercises make up a two-week module of lab activities designed to increase student spatial thinking skills in the context of socially relevant issues, such as flood risks. Students are given a 2D topographic map and the 3D printed model and are asked to translate information from the 3D to the 2D representations. Valleys and ridges are marked on the 3D printed terrain models, and students find and label the same features on the 2D maps. After the students have oriented themselves with both the 2D and 3D representations, they are given tasks similar to those of the Topographic Map Assessment, including pathfinding, slope steepness, and visibility between points on the landscape.
5.4. Results
Judging by their feedback, students appeared to be more engaged when using the 3D terrain models than when using 2D topo maps and showed greater enthusiasm to explore the landscape on the 3D models. Introductory geology laboratory students often remarked on how the printed layers of the 3D terrain models helped them identify patterns in contour lines that represent ridges or valleys on the 2D maps. The ability to easily rotate the models and view them at different angles also helped them better understand concepts like the “rule of Vs” and how contour spacing reflects slope steepness.
In course evaluations (see Appendix D), 42 summer field camp students were asked for optional feedback on their use of 3D printed terrain models: “Were the 3D models of Alkali Anticline useful during mapping? If yes, how so? If no, why not?” Of the 42 students, twelve gave responses—all were positive. Eleven students found models beneficial to completing the mapping project, one student commented that they “liked” using them during mapping. Two other students made positive affective comments as well, writing “I also enjoyed the 3D models” and “…a 3D model of an area gets you settled, and you feel more comfortable.” Eight students described the models as being useful in visualizing large-scale geometries, such as structural deformation or stratigraphic relationships, with four other comments regarding the benefit of the models in locating themselves on 2D topographic maps. Three students expressed a desire to expand the use of 3D models in the field course.
Although not a formal study, our results suggest that using 3D terrain models had at the very least a reassuring effect on the confidence of students, which would be in line with work mentioned earlier, such as [28]. Being able to locate the current position on the 3D model (or “getting settled”) is a basic, yet underappreciated mapping task that is foundational to and provides necessary calibration for more complex tasks. The ability to visualize the large-scale tectonic structures, such as folded or faulted rock strata, is at the core of geologic mapping. Here, a key ability is to develop a model in the mind’s eye of 3D geometries that extend both into the subsurface and above ground, visualizing the shape prior to the effects of erosion. Furthermore, the ability to project these geometries onto the real-world terrain surface is critical for forming working hypotheses and predicting the location of additional data. While sophisticated 3D computer graphics would be needed to truly “look inside” the terrain and see these 3D structures, 3D printed terrain models, in combination with the ability to annotate them, may help to bridge the gap between those two worlds.
Further, quantitative studies are certainly needed. However, these student responses, in combination with our other 3D model experiences, may point to the application of 3D terrain models to support geologic field work in general, and specifically for geologic mapping, as promising areas of future research.
6. Conclusions and Future Directions
Analyzing 18 months’ worth of web analytics allowed us to determine who is using the TouchTerrain web application and what size of models they are making; and to map out what areas on the globe they chose to 3D print terrain models of. Since July 2019, more than 20,000 terrain models have been downloaded. Models are being created for many different use cases, including education, research, outdoor activities and crafting mementos. Users took around 8 min to create a model, much faster than with traditional GIS or 3D modeling software. Most models were realized with 3D printers, with a sizable minority using CNC machines.
Our own experiences with using 3D printed terrain in a university setting are so far very positive. Although a formal study has yet to be performed, anecdotal evidence points to the strong potential for 3D printed terrain models to provide significant help with specific map-related tasks. For the introductory geology laboratory, 3D printed models were used as a form of training wheels to aid beginning students in learning the “language” of contour maps, which are still an important tool for field geologists. Field camp students noted the benefit of 3D printed models in locating themselves on their 2D base maps and visualizing the large-scale structures.
In the future, we plan to continue examining the efficacy of 3D terrain models in the undergraduate curriculum at Iowa State University and possible branch out in adjacent disciplines, such as landscape architecture. We are also committed to further develop TouchTerrain’s capabilities. Adding functionality to superimpose other map data (e.g., aerial photos) on generated 3D models would make terrain models more useful when used with 3D modeling software. In order to make it easy to create model that have enough layers to make the 3D printed terrain more interesting, an auto z-scale setting is planned for which the user would select the desired height of the 3D printed model (e.g., 3 cm from the topmost part to the bottom and TouchTerrain would automatically scale the model to this size.
We hope that the further proliferation of affordable 3D terrain models facilitated by TouchTerrain will find more and additional uses for them in science, education and engineering. In the field of supporting student education, we hope that TouchTerrain will stimulate efforts in the training and education of Blind and Visually Impaired (BVI) individuals. This is a difficult and underrepresented area of education research for which TouchTerrain could prove to be a key enabling technology. For example, using 3D printed TouchTerrain models with Braille annotations could prove useful for BVI STEM education or for mobility training.
In future, we expect to expand the use of Google Analytics for more insights. For example, we may be able to combine IP geolocation data of the users with what areas they download, which may reveal insights into concepts like place-based learning, which suggests that people benefit from learning concepts within the context of the landscape that surrounds them and that they are thus familiar with. It might also be interesting to delineate types of users, e.g., power users vs. standard users, in order to better support them.
Supplementary Materials
Supplementary materials are available online at https://0-www-mdpi-com.brum.beds.ac.uk/2220-9964/10/3/108/s1.
Author Contributions
Chris Harding is the principal contributor to the TouchTerrain code, contributed to the usage analysis and wrote the first draft of the manuscript. Franek Hasiuk contributed to the usage analysis and to the writing of the manuscript. Aaron Wood deployed 3D printed terrain models in geoscience education and contributed to the writing of the manuscript. All authors have read and agreed to the published version of the manuscript.
Funding
This research received no external funding.
Institutional Review Board Statement
Not applicable.
Informed Consent Statement
Not applicable.
Data Availability Statement
GIS Data is available in a publicly accessible repository. GIS data for Figure 9 can be found at https://arcg.is/0L8fLz (accessed on 20 February 2021), GIS data for Figure 10 and Figure 11 can be found at https://arcg.is/0PO1nK (accessed on 20 February 2021). The user feedback data analyzed in Section 4.3 are available as supplementary material.
Acknowledgments
We’d like to acknowledge the contribution and assistance provided by Jaqueline Reber, Levi Baber and Nick Booher.
Conflicts of Interest
The authors declare no conflict of interest.
Appendix A. Gallery of 3D Printed Terrain Models
Figure A1, Figure A2, Figure A3 and Figure A4 show images of 3D printed terrain models created with TouchTerrain. Some were contributed by TouchTerrain users and are used with their permission. Otherwise, the print and images were made by the authors.
Figure A1.
Grand Canyon Model with geologic formations painted on by Aaron Wood. Before painting, a coat of gray automotive primer filler was applied.
Figure A1.
Grand Canyon Model with geologic formations painted on by Aaron Wood. Before painting, a coat of gray automotive primer filler was applied.

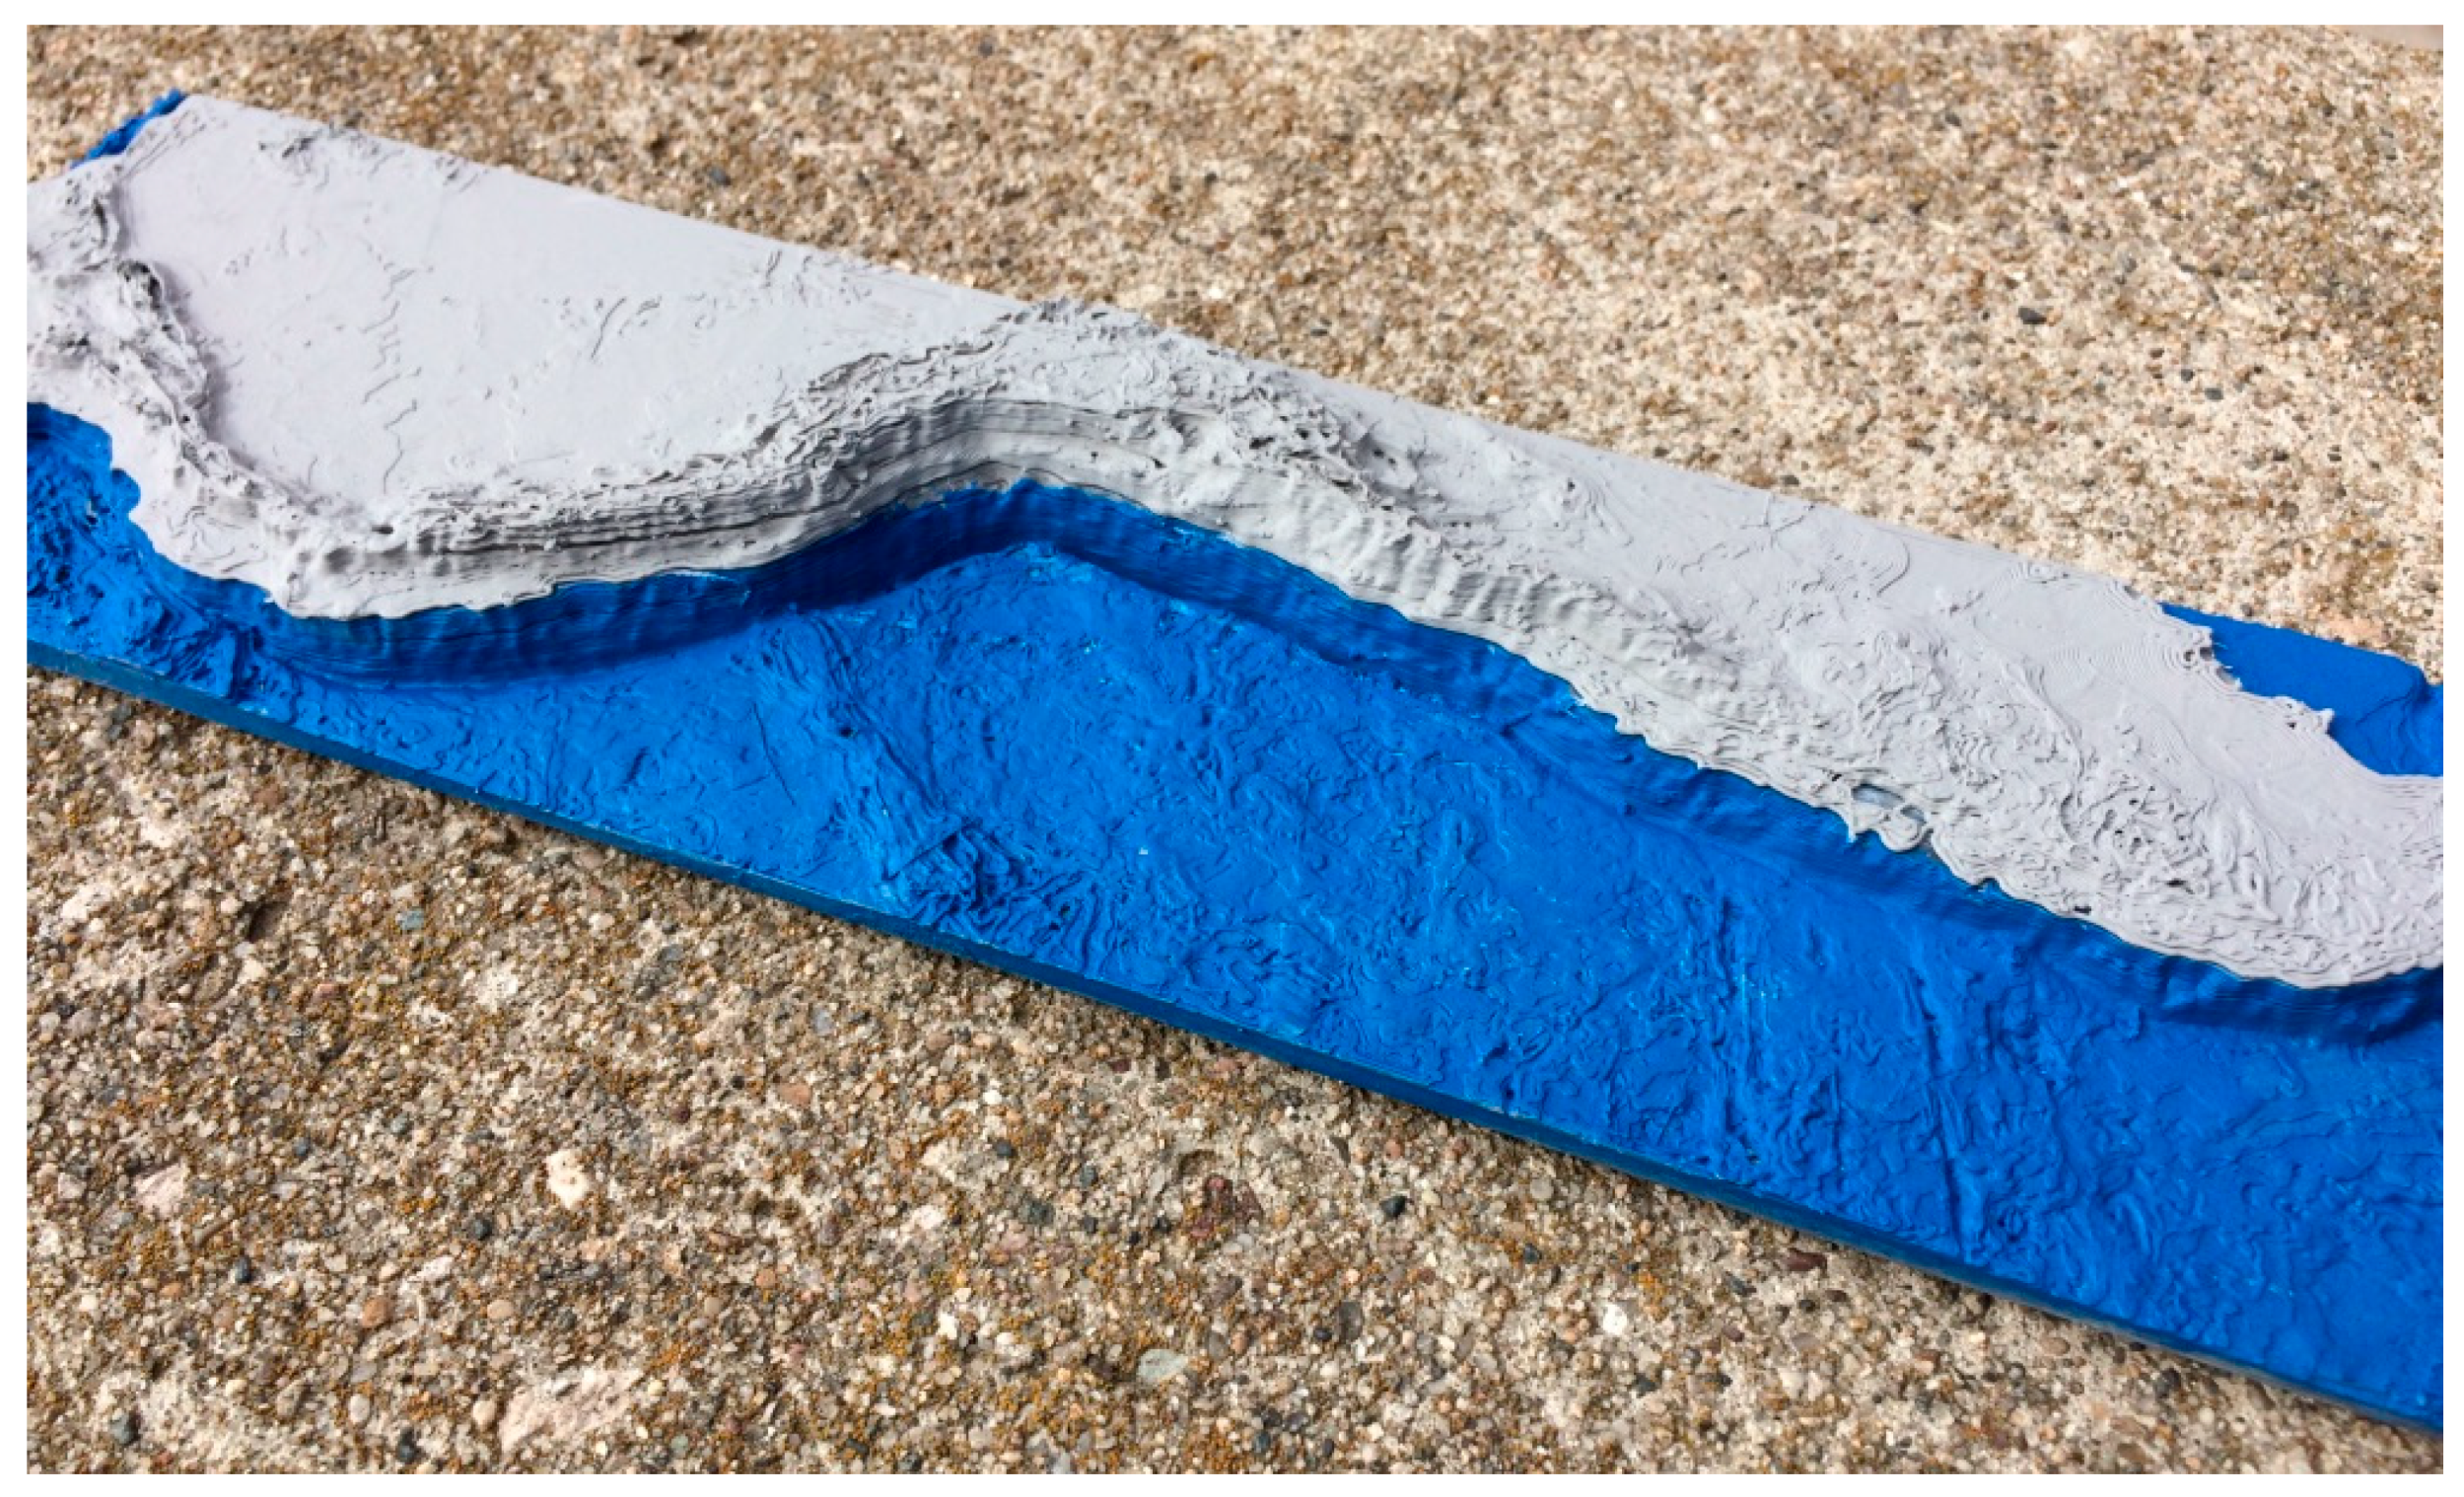
Figure A2.
Print of the West coast of South America, including the bathymetry (z-scale x4) to demonstrate the enormous elevation change from the bottom of the Andes trench to the top of the Andes mountains.
Figure A2.
Print of the West coast of South America, including the bathymetry (z-scale x4) to demonstrate the enormous elevation change from the bottom of the Andes trench to the top of the Andes mountains.

Figure A3.
Two-color terrain print by Rob Lawry. The printer was paused at regular intervals and blue filament was used for one layer, after which gray filament was used again.
Figure A3.
Two-color terrain print by Rob Lawry. The printer was paused at regular intervals and blue filament was used for one layer, after which gray filament was used again.
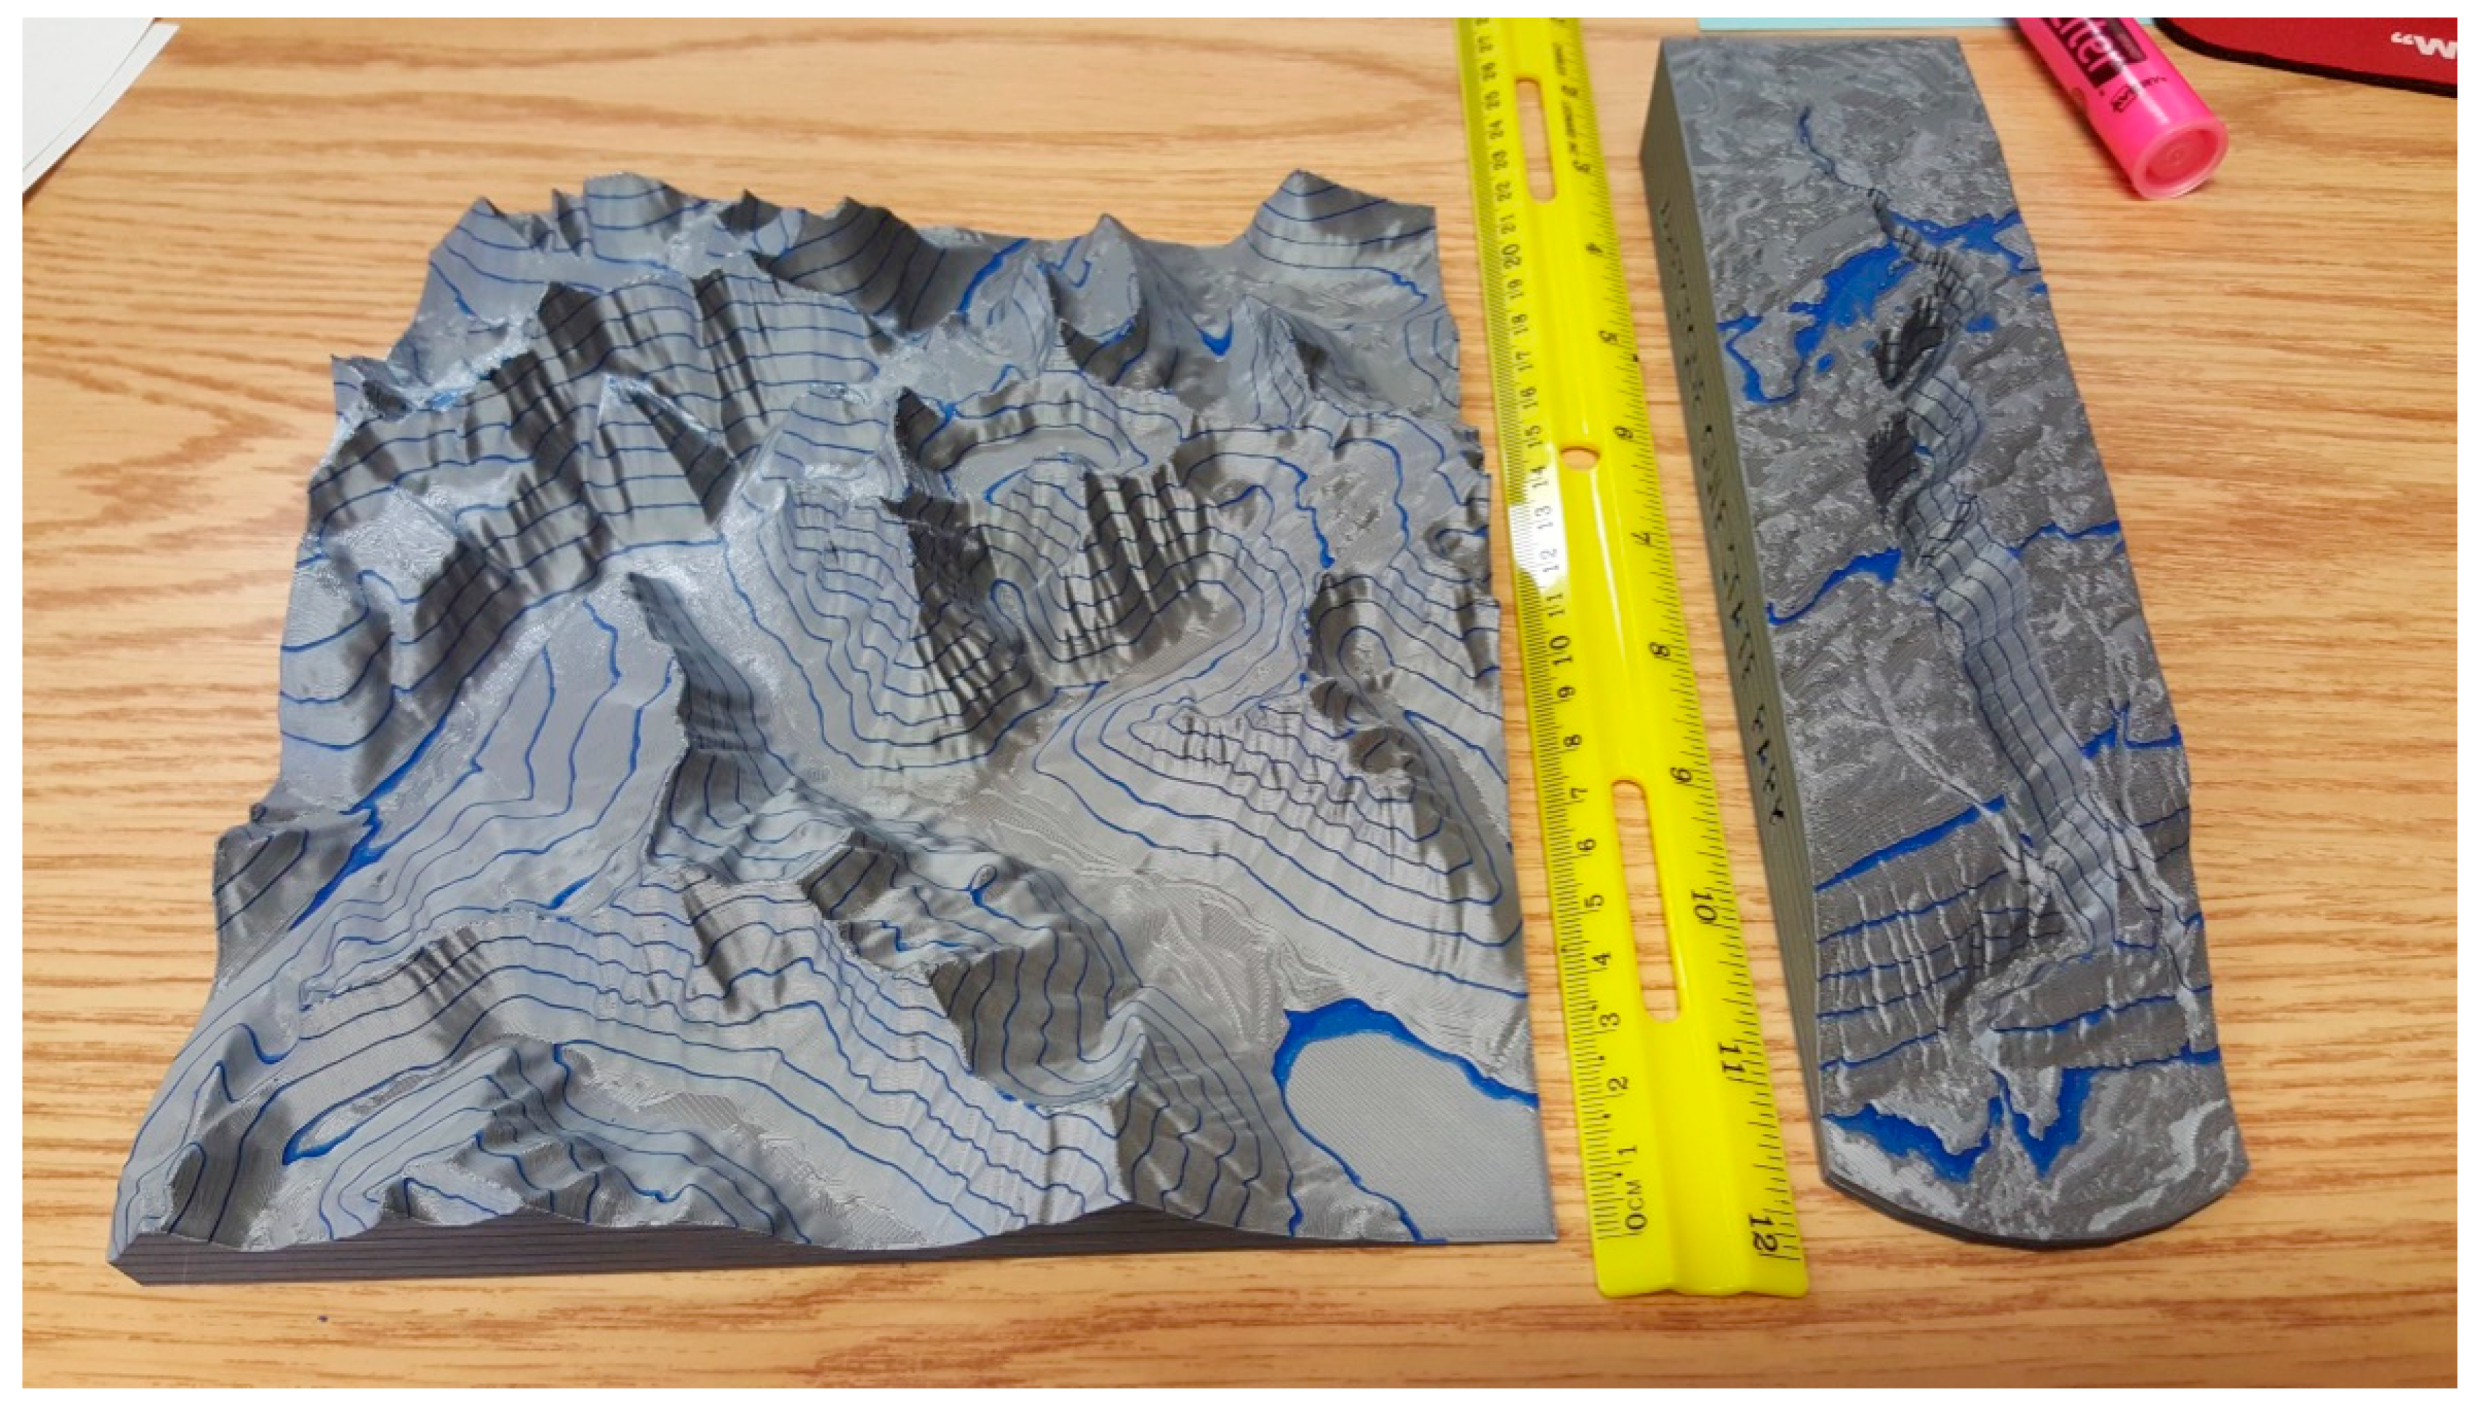
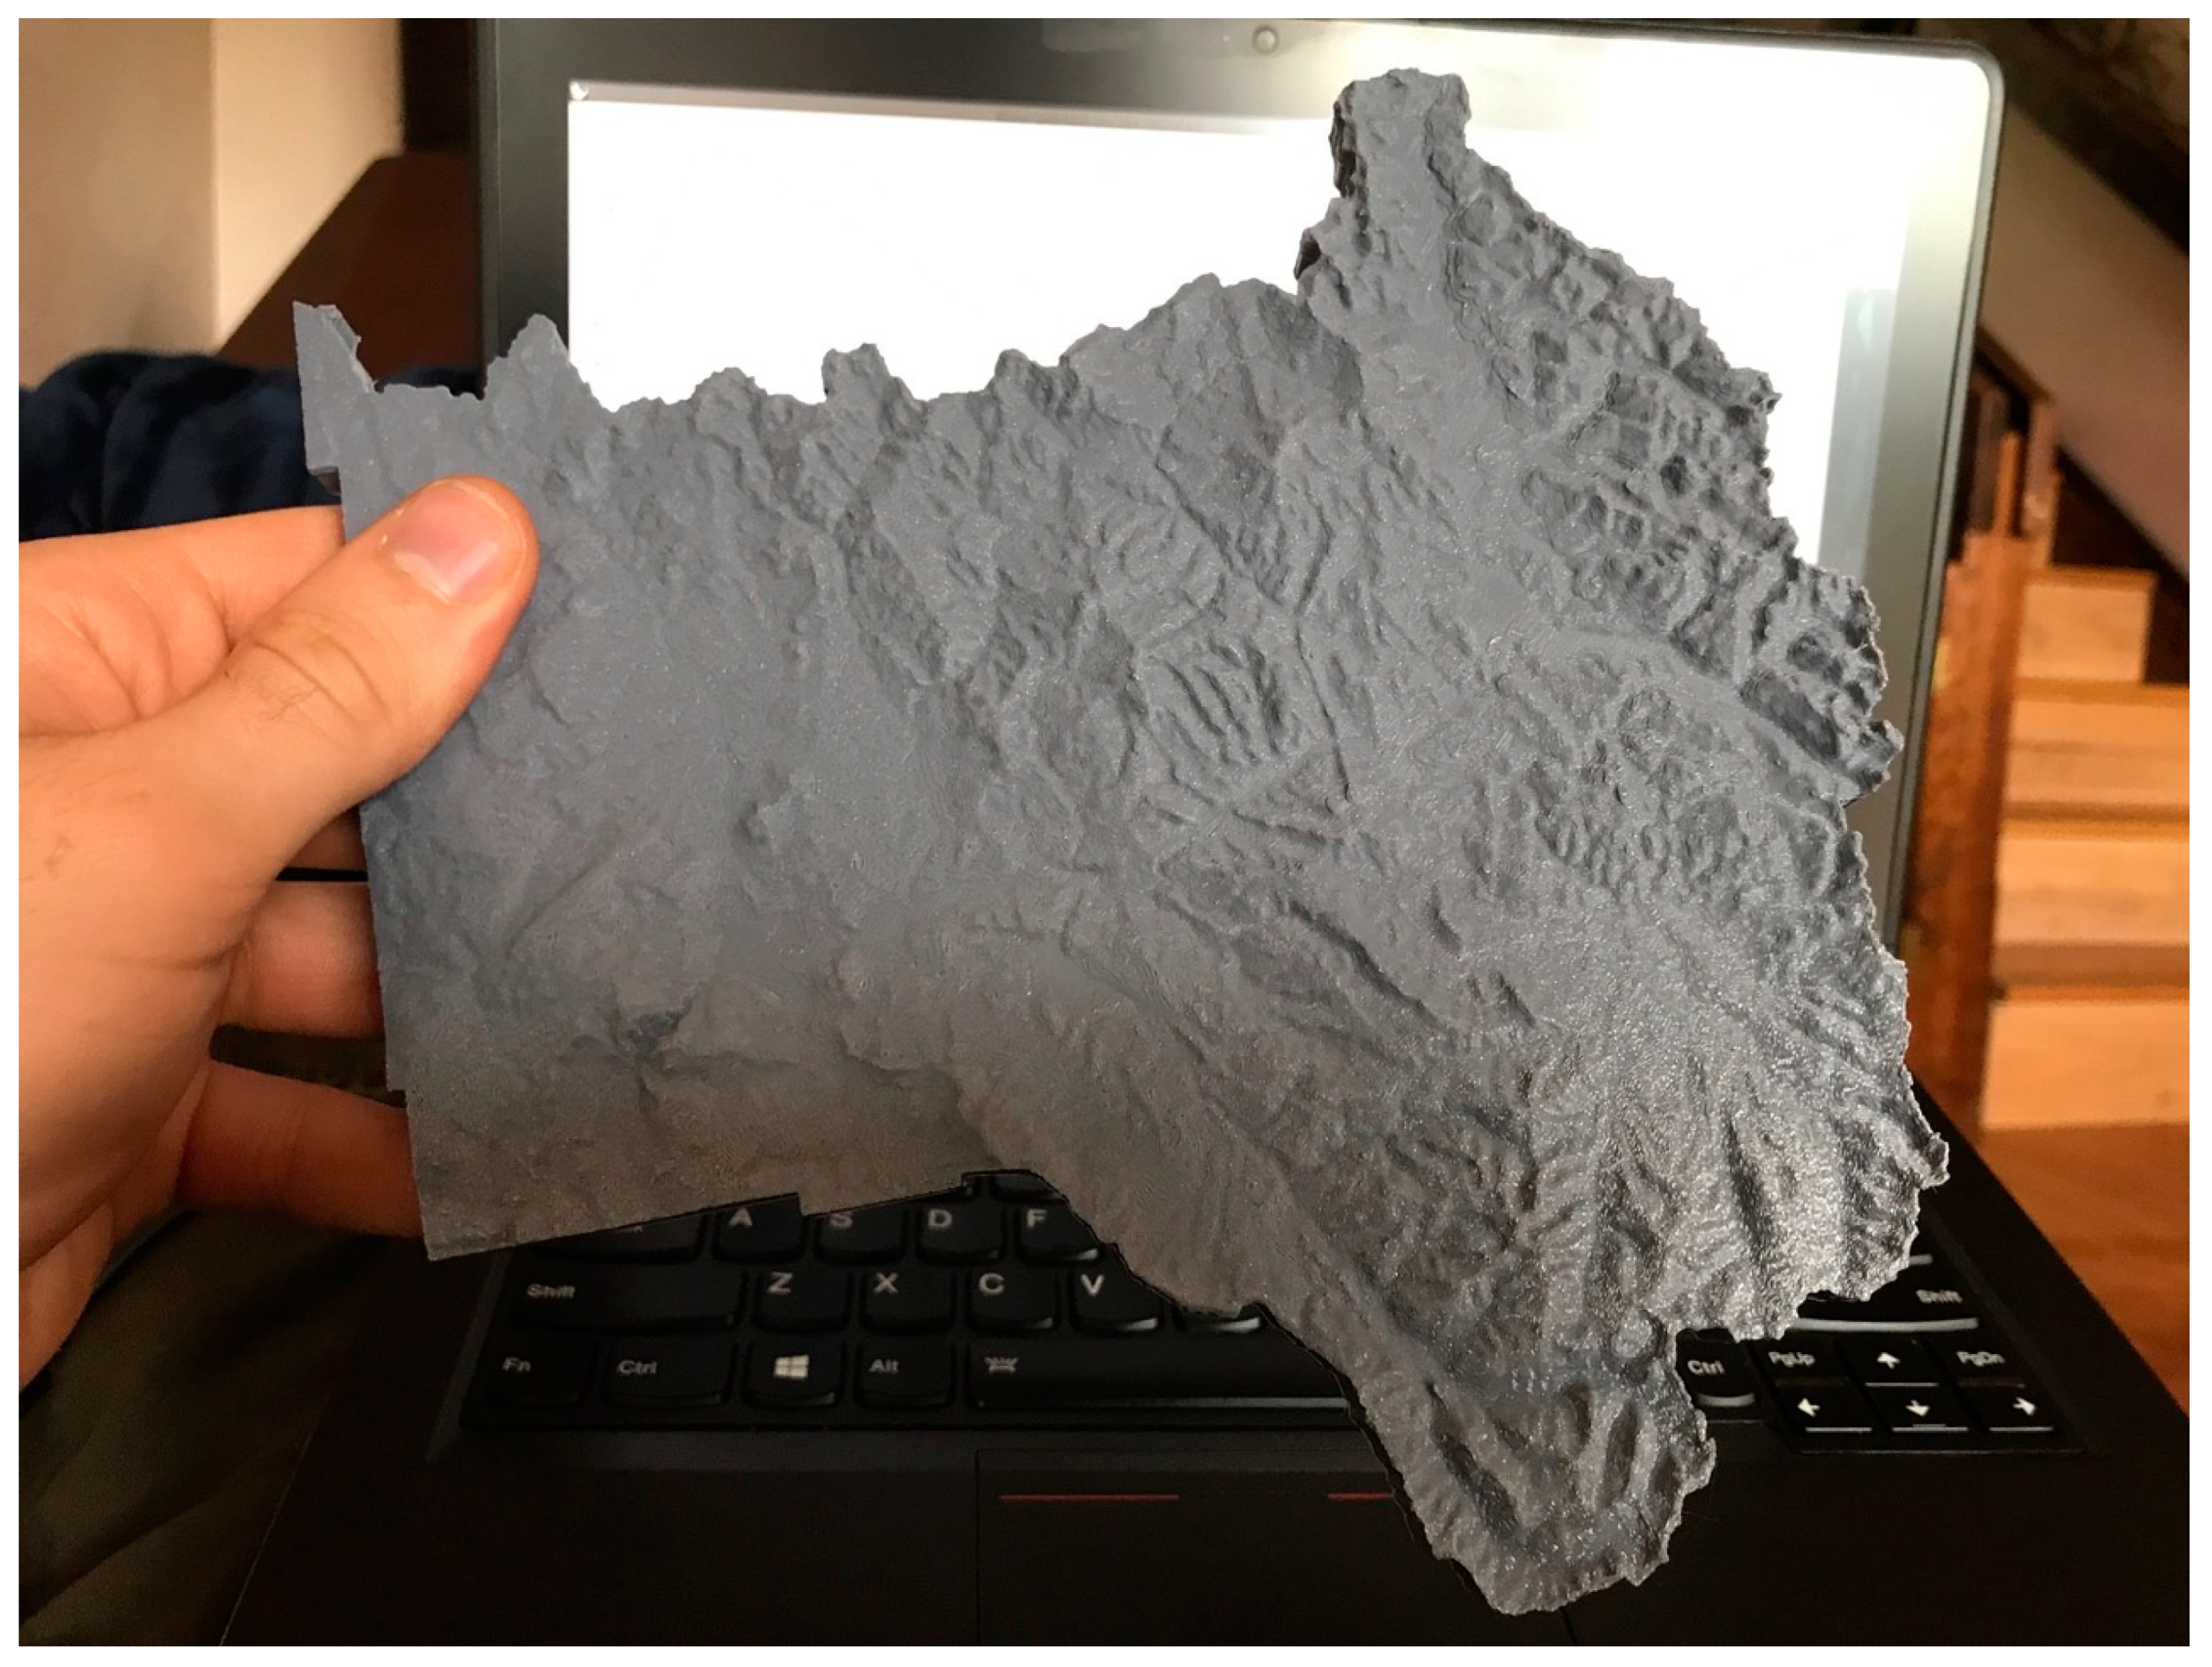
Figure A4.
Print by Bryson Hicks, using a polygonal outline of a US county. Used in disaster management.
Figure A4.
Print by Bryson Hicks, using a polygonal outline of a US county. Used in disaster management.

Appendix B. Additional Best Practices for 3D Printing Terrain Models
This appendix gives more details on best practices for 3D printing terrain models. Familiarity with filament materials and print parameter settings for the popular Cura slicer software is assumed, some of which are under “expert settings”. However, most concepts will apply to other slicers (e.g., Prusa slicer), possibly with a different nomenclature.
Model robustness: To ensure a model is robust enough to withstand rough handline it should be printed with at least two walls (perimeters), at least two bottom layers and at least three top layers, assuming a layer height larger than 0.2 mm. For smaller layer heights, these numbers should be increased. Setting the topmost layer as “skin” in Cura can print it slower and increase print quality. Infill density can be as low as 10–15%. The Cura fill pattern zigzag is particularity economical with no ill effect.
Corner warping: the corners of a box-outlined terrain model may warp upwards as the filament cools and possible contracts. For PLA and PETG, using a heated bed and setting a 5–10 mm wide brim is usually sufficient to suppress corner warping. For ABS, which shrinks more, a larger brim and possible a heat-preserving enclosure may be needed.
Cooling and retractions: In general, terrain printing requires little to no part-cooling which also promotes layer adhesion. The exceptions are layer with are printed very quickly (e.g., small peaks) which require good cooling and/or a long minimum layer time (>15 s). Typical retraction settings should be used unless noticeable stringing occurs. If stringing occurs, brushing the top of the finished model with a wire brush is usually enough to remove it. A hot air gun is more effective but can easily warp the model when used for too long.
Improving the appearance of the top layers: For your top (skin) layer a concentric fill pattern should be used instead for the standard linear pattern. This will avoid artificial looking stripe patterns, which are especially obvious on flat terrain or lakes as the contrast sharply with the organic appearance that surrounds them. Ironing can be used to fill in and smooth the top layers, but is usually not worth the longer print duration.
Post-processing: 3D Prints are typically somewhat glossy. If a matte finish is preferred or is the model is to be drawn on or painted, it can be sprayed with a neutral gray automotive primer filler. To glue together multiple terrain tiles printed with PLA or PETG, superglue gel works well. For ABS, acetone can be used. To mount the print on a wooden plate, a hot glue gun works well; later, this can be removed with alcohol.
Appendix C. Top 25 Place Searches
Table A1 shows search results for place searches performed from 12 October 2020 to 26 December 2020 and ranked by the number of unique usage events. Unique denotes per-user session events, i.e., even if a user performed the same search multiple times during a session it was still counted as a single unique event. Note that these do not necessarily imply that this led to a later download of the searched for area, i.e., this is only an indication of the user’s initial interest before selecting the area to print.

Table A1.
Top 25 search results 12 October 2020 to 6 December 2020.
| Search Results | Total Events | Unique Events |
|---|---|---|
| Grand Canyon National Park, Arizona, USA | 90 | 57 |
| Mt Everest | 75 | 54 |
| Yosemite National Park, California, USA | 36 | 30 |
| Mount Fuji, Kitayama, Fujinomiya, Shizuoka 418-0112, Japan | 36 | 29 |
| Mount Rainier, Washington 98304, USA | 40 | 28 |
| Matterhorn | 31 | 25 |
| Hawaii, USA | 30 | 21 |
| Denali, Alaska, USA | 24 | 21 |
| New York, NY, USA | 23 | 21 |
| Mt St Helens, Washington 98616, USA | 26 | 19 |
| Mount Everest | 24 | 15 |
| Half Dome, California, USA | 20 | 15 |
| Bryce Canyon National Park, Utah, USA | 17 | 15 |
| Santiago, Región Metropolitana, Chile | 22 | 13 |
| Norwich, VT, USA | 18 | 12 |
| Santiago de Chile, Región Metropolitana, Chile | 18 | 12 |
| El Capitan, California 95389, USA | 16 | 12 |
| Zion National Park, Utah, USA | 15 | 12 |
| Denver, CO, USA | 14 | 12 |
| Israel | 14 | 12 |
| Mt. Whitney, California, USA | 17 | 11 |
| Mount Rushmore National Memorial | 11 | 11 |
| Crater Lake, Oregon 97604, USA | 25 | 10 |
| Grand Teton, Wyoming 83414, USA | 15 | 10 |
| Yellowstone National Park, United States | 15 | 10 |
| Mt Hood, Oregon 97041, USA | 14 | 10 |
Appendix D. Student Feedback on Using 3D Models for Geologic Mapping
In 2017, Iowa State geologic field camp students started using 3D printed models during the Alkali Anticline geologic mapping exercise. Working in the field, students were instructed to write annotations about their mapping activities directly on the model (with a soft pencil). The annotated models were used to help them construct the final geologic map. As part of the course evaluations filled out at the end of the field camp, students were asked:
Were the 3D models of Alkali Anticline useful during mapping? If yes, how so? If no, why not?
- The 3D model of Alkali Anticline was extremely useful in finding yourself on the topo maps and to determine if there was any offset on the ridge tops;
- We also got to use 3D models for one of our mapping exercises and if we could use those more that would help a lot. For some students it is really hard to think in 3D and the models fixed that. Contour maps are confusing at first and being able to look at a 3D model of an area really gets you settled and you feel more comfortable. I used the model for all of that project, it was a great learning tool that would be amazing to see implemented more;
- Yes it was very helpful to be able to see the mapping area on a small scale with the topography because it helped with seeing the big picture;
- The 3D models of Alkali Anticline were quite useful in correlating the topographical map and formations;
- I thought the 3D models of Alkali Anticline were useful because they aided us in mapping our position and allowed us to visualize the structure of the anticline by being able to write on them;
- I also enjoyed the 3D models used at alkali anticline and I learned a great deal from them. They were a great help to see displacement and helped us to understand the structure and geology of the location. I do think that an easier way to clean them needs to be found. I scrubbed my model for quite a while but was unable to get all of the graphite off;
- I also liked the 3D models for Alkali Anticline and I would have appreciated more models for other mapping projects;
- I felt that the 3D model was helpful when we remembered we had it, but could have utilized it more had we kept it out of our packs;
- The 3D models used for the Alkali Anticline were very helpful in visualizing what we were standing on and in locating ourselves on the map. I feel like this could be part of the future of geology and especially field camp. The more hands on, the better.
- The 3D model is very useful in mapping exercise in Alkali Anticline as it helps to visualize the structure more accurately;
- Not to me, but my groupmates used the model a lot. Making them available to students was very beneficial to the groups as a whole;
- The use of the 3D topographies of Alkali Anticline were extremely helpful in locating myself and determining what structures I was standing on.
References
- Rapp, D.N.; Culpepper, S.A.; Kirkby, K.; Morin, P. Fostering Student’s Comprehension of Topographic Maps. J. Geosci. Educ. 2007, 55, 5–16. [Google Scholar] [CrossRef]
- Takaku, J.; Tadono, T.; Tsutsui, K.; Ichikawa, M. Validation of “AW3D” global dsm generated from Alos Prism. ISPRS Ann. Photogramm. Remote Sens. Spat. Inf. Sci. 2016, III–4, 25–31. [Google Scholar] [CrossRef] [Green Version]
- Juřík, V.; Herman, L.; Snopková, D.; Galang, A.J.; Stachoň, Z.; Chmelík, J.; Kubíček, P.; Šašinka, Č. The 3D Hype: Evaluating the Potential of Real 3D Visualization in Geo-Related Applications. PLoS ONE 2020, 15, e0233353. [Google Scholar] [CrossRef]
- Ishikawa, T.; Kastens, K.A. Why Some Students Have Trouble with Maps and Other Spatial Representations. J. Geosci. Educ. 2005, 53, 184–197. [Google Scholar] [CrossRef]
- Kastens, K.A.; Ishikawa, T. Spatial thinking in the geosciences and cognitive sciences: A cross-disciplinary look at the intersection of the two fields. In Special Paper 413: Earth and Mind: How Geologists Think and Learn about the Earth; Geological Society of America: Boulder, CO, USA, 2006; Volume 413, pp. 53–76. ISBN 978-0-8137-2413-3. [Google Scholar]
- Manduca, C.A.; Kastens, K.A. Mapping the domain of spatial thinking in the geosciences. In Geological Society of America Special Papers; Geological Society of America: Boulder, CO, USA, 2012; Volume 486, pp. 45–49. ISBN 978-0-8137-2486-7. [Google Scholar]
- Atit, K.; Weisberg, S.M.; Newcombe, N.S.; Shipley, T.F. Learning to Interpret Topographic Maps: Understanding Layered Spatial Information. Cogn. Res. Princ. Implic. 2016, 1. [Google Scholar] [CrossRef] [Green Version]
- Lütjens, M.; Kersten, T.P.; Dorschel, B.; Tschirschwitz, F. Virtual Reality in Cartography: Immersive 3D Visualization of the Arctic Clyde Inlet (Canada) Using Digital Elevation Models and Bathymetric Data. Multimodal Technol. Interact. 2019, 3, 9. [Google Scholar] [CrossRef] [Green Version]
- Hruby, F.; Ressl, R.; de la Borbolla Del Valle, G. Geovisualization with Immersive Virtual Environments in Theory and Practice. Int. J. Digit. Earth 2019, 12, 123–136. [Google Scholar] [CrossRef] [Green Version]
- Hruby, F.; Castellanos, I.; Ressl, R. Cartographic Scale in Immersive Virtual Environments. KN J. Cartogr. Geogr. Inf. 2020. [Google Scholar] [CrossRef]
- View of The Tangible Map Exhibit | Cartographic Perspectives. Available online: https://cartographicperspectives.org/index.php/journal/article/view/cp82-dooley-et-al/1454 (accessed on 26 January 2021).
- Heidkamp, C.P.; Slomba, J.T. GeoSpatial Sculpture: Nonverbal Communication through the Tactilization of Geospatial Data. GeoHumanities 2017, 3, 554–566. [Google Scholar] [CrossRef]
- Rossetto, T. The Skin of the Map: Viewing Cartography through Tactile Empathy. Environ. Plan. Soc. Space 2019, 37, 83–103. [Google Scholar] [CrossRef]
- domlysz BlenderGIS. Available online: https://github.com/domlysz/BlenderGIS (accessed on 8 February 2021).
- Simon, F. DEMto3D. Available online: https://demto3d.com/en/ (accessed on 8 February 2021).
- Hatch, J. Terrain2STL. Available online: http://jthatch.com/Terrain2STL/ (accessed on 8 February 2021).
- Wilson, D. The Terrainator. Available online: https://terrainator.com/ (accessed on 8 February 2021).
- Reed, H.P. The Development of the Terrain Model in the War. Geogr. Rev. 1946, 36, 632–652. [Google Scholar] [CrossRef]
- Adams, A.M. A Comparative Usability Assessment of Augmented Reality 3-D Printed Terrain Models and 2-D Topographic Maps. Master’s Thesis, New Mexico State University, Las Cruces, NM, USA, 2019. [Google Scholar]
- Priestnall, G. Rediscovering the Power of Physical Relief Models: Mayson’s Ordnance Model of the Lake District. Cartogr. Int. J. Geogr. Inf. Geovis. 2019, 54, 261–277. [Google Scholar] [CrossRef]
- Welter, J. Solid Landscape Models in the Twenty-First Century—A Balanced Approach. Cartogr. J. 2013, 50, 300–304. [Google Scholar] [CrossRef]
- Kete, P. Physical 3D Map of the Planica Nordic Center, Slovenia: Cartographic Principles and Techniques Used with 3D Printing. Cartogr. Int. J. Geogr. Inf. Geovis. 2016, 51, 1–11. [Google Scholar] [CrossRef]
- Oswald, C.; Rinner, C.; Robinson, A. Applications of 3D Printing in Physical Geography Education and Urban Visualization. Cartogr. Int. J. Geogr. Inf. Geovis. 2019, 54, 278–287. [Google Scholar] [CrossRef]
- Horowitz, S.S.; Schultz, P.H. Printing Space: Using 3D Printing of Digital Terrain Models in Geosciences Education and Research. J. Geosci. Educ. 2014, 62, 138–145. [Google Scholar] [CrossRef]
- Jakovina, M.; Ormand, C.; Shipley, T.F.; Weisberg, S. Topographic Map Assessment (Instrument). 2014. Available online: http://www.silccenter.org/index.php/testsainstruments (accessed on 30 December 2020).
- Plant, R.W.; Ryan, R.M. Intrinsic Motivation and the Effects of Self-Consciousness, Self-Awareness, and Ego-Involvement: An Investigation of Internally Controlling Styles. J. Pers. 1985, 53, 435–449. [Google Scholar] [CrossRef]
- Carbonell Carrera, C.; Avarvarei, B.V.; Chelariu, E.L.; Draghia, L.; Avarvarei, S.C. Map-Reading Skill Development with 3D Technologies. J. Geogr. 2017, 116, 197–205. [Google Scholar] [CrossRef]
- Carbonell-Carrera, C.; Jaeger, A.; Shipley, T. 2D Cartography Training: Has the Time Come for a Paradigm Shift? ISPRS Int. J. Geo-Inf. 2018, 7, 197. [Google Scholar] [CrossRef] [Green Version]
- Perkins, C. Cartography: Progress in Tactile Mapping. Prog. Hum. Geogr. 2002, 26, 521–530. [Google Scholar] [CrossRef]
- Götzelmann, T.; Pavkovic, A. Towards Automatically Generated Tactile Detail Maps by 3D Printers for Blind Persons. In Proceedings of the Computers Helping People with Special Needs; Miesenberger, K., Fels, D., Archambault, D., Peňáz, P., Zagler, W., Eds.; Springer International Publishing: Cham, Switzerland, 2014; pp. 1–7. [Google Scholar]
- Schwarzbach, F.; Sarjakoski, T.; Oksanen, J.; Sarjakoski, L.T.; Weckman, S. Physical 3D models from LIDAR data as tactile maps for visually impaired persons. In True-3D in Cartography; Buchroithner, M., Ed.; Lecture Notes in Geoinformation and Cartography; Springer: Berlin/Heidelberg, Germany, 2011; pp. 169–183. ISBN 978-3-642-12271-2. [Google Scholar]
- Voženílek, V.; Růžičková, V.; Finková, D.; Ludíková, L.; Nĕmcová, Z.; Doležal, J.; Vondráková, A.; Kozáková, M.; Regec, V. Hypsometry in Tactile Maps. In True-3D in Cartography; Buchroithner, M., Ed.; Lecture Notes in Geoinformation and Cartography; Springer: Berlin/Heidelberg, Germany, 2011; pp. 153–168. ISBN 978-3-642-12271-2. [Google Scholar]
- Perry, R. Converting Topographic Information with 3D Printed Models and Tactile Maps. Master’s Thesis, School of Information Science, University of Maine, Orono, ME, USA, 2017. Unpublished. [Google Scholar]
- Caldwell, D.R. Physical Terrain Modeling for Geographic Visualization. Cartogr. Perspect. 2001, 66–72. [Google Scholar] [CrossRef]
- Harding, Chris TouchTerrain. Available online: https://github.com/ChHarding/TouchTerrain_for_CAGEO (accessed on 30 December 2020).
- Hasiuk, F.J.; Harding, C.; Renner, A.R.; Winer, E. TouchTerrain: A Simple Web-Tool for Creating 3D printable Topographic Models. Comput. Geosci. 2017, 109, 25–31. [Google Scholar] [CrossRef]
Figure 1.
The Fused Deposition Model (FDM) 3D printing process: the digital model (left) is sliced into layers, layers are printed from bottom to top (center) and are fused into a 3D printed object (right).
Figure 1.
The Fused Deposition Model (FDM) 3D printing process: the digital model (left) is sliced into layers, layers are printed from bottom to top (center) and are fused into a 3D printed object (right).

Figure 2.
TouchTerrain Web Application with Google Maps Window at left and Terrain Settings, Area Selection Box and 3D Printer Options on the right.
Figure 2.
TouchTerrain Web Application with Google Maps Window at left and Terrain Settings, Area Selection Box and 3D Printer Options on the right.
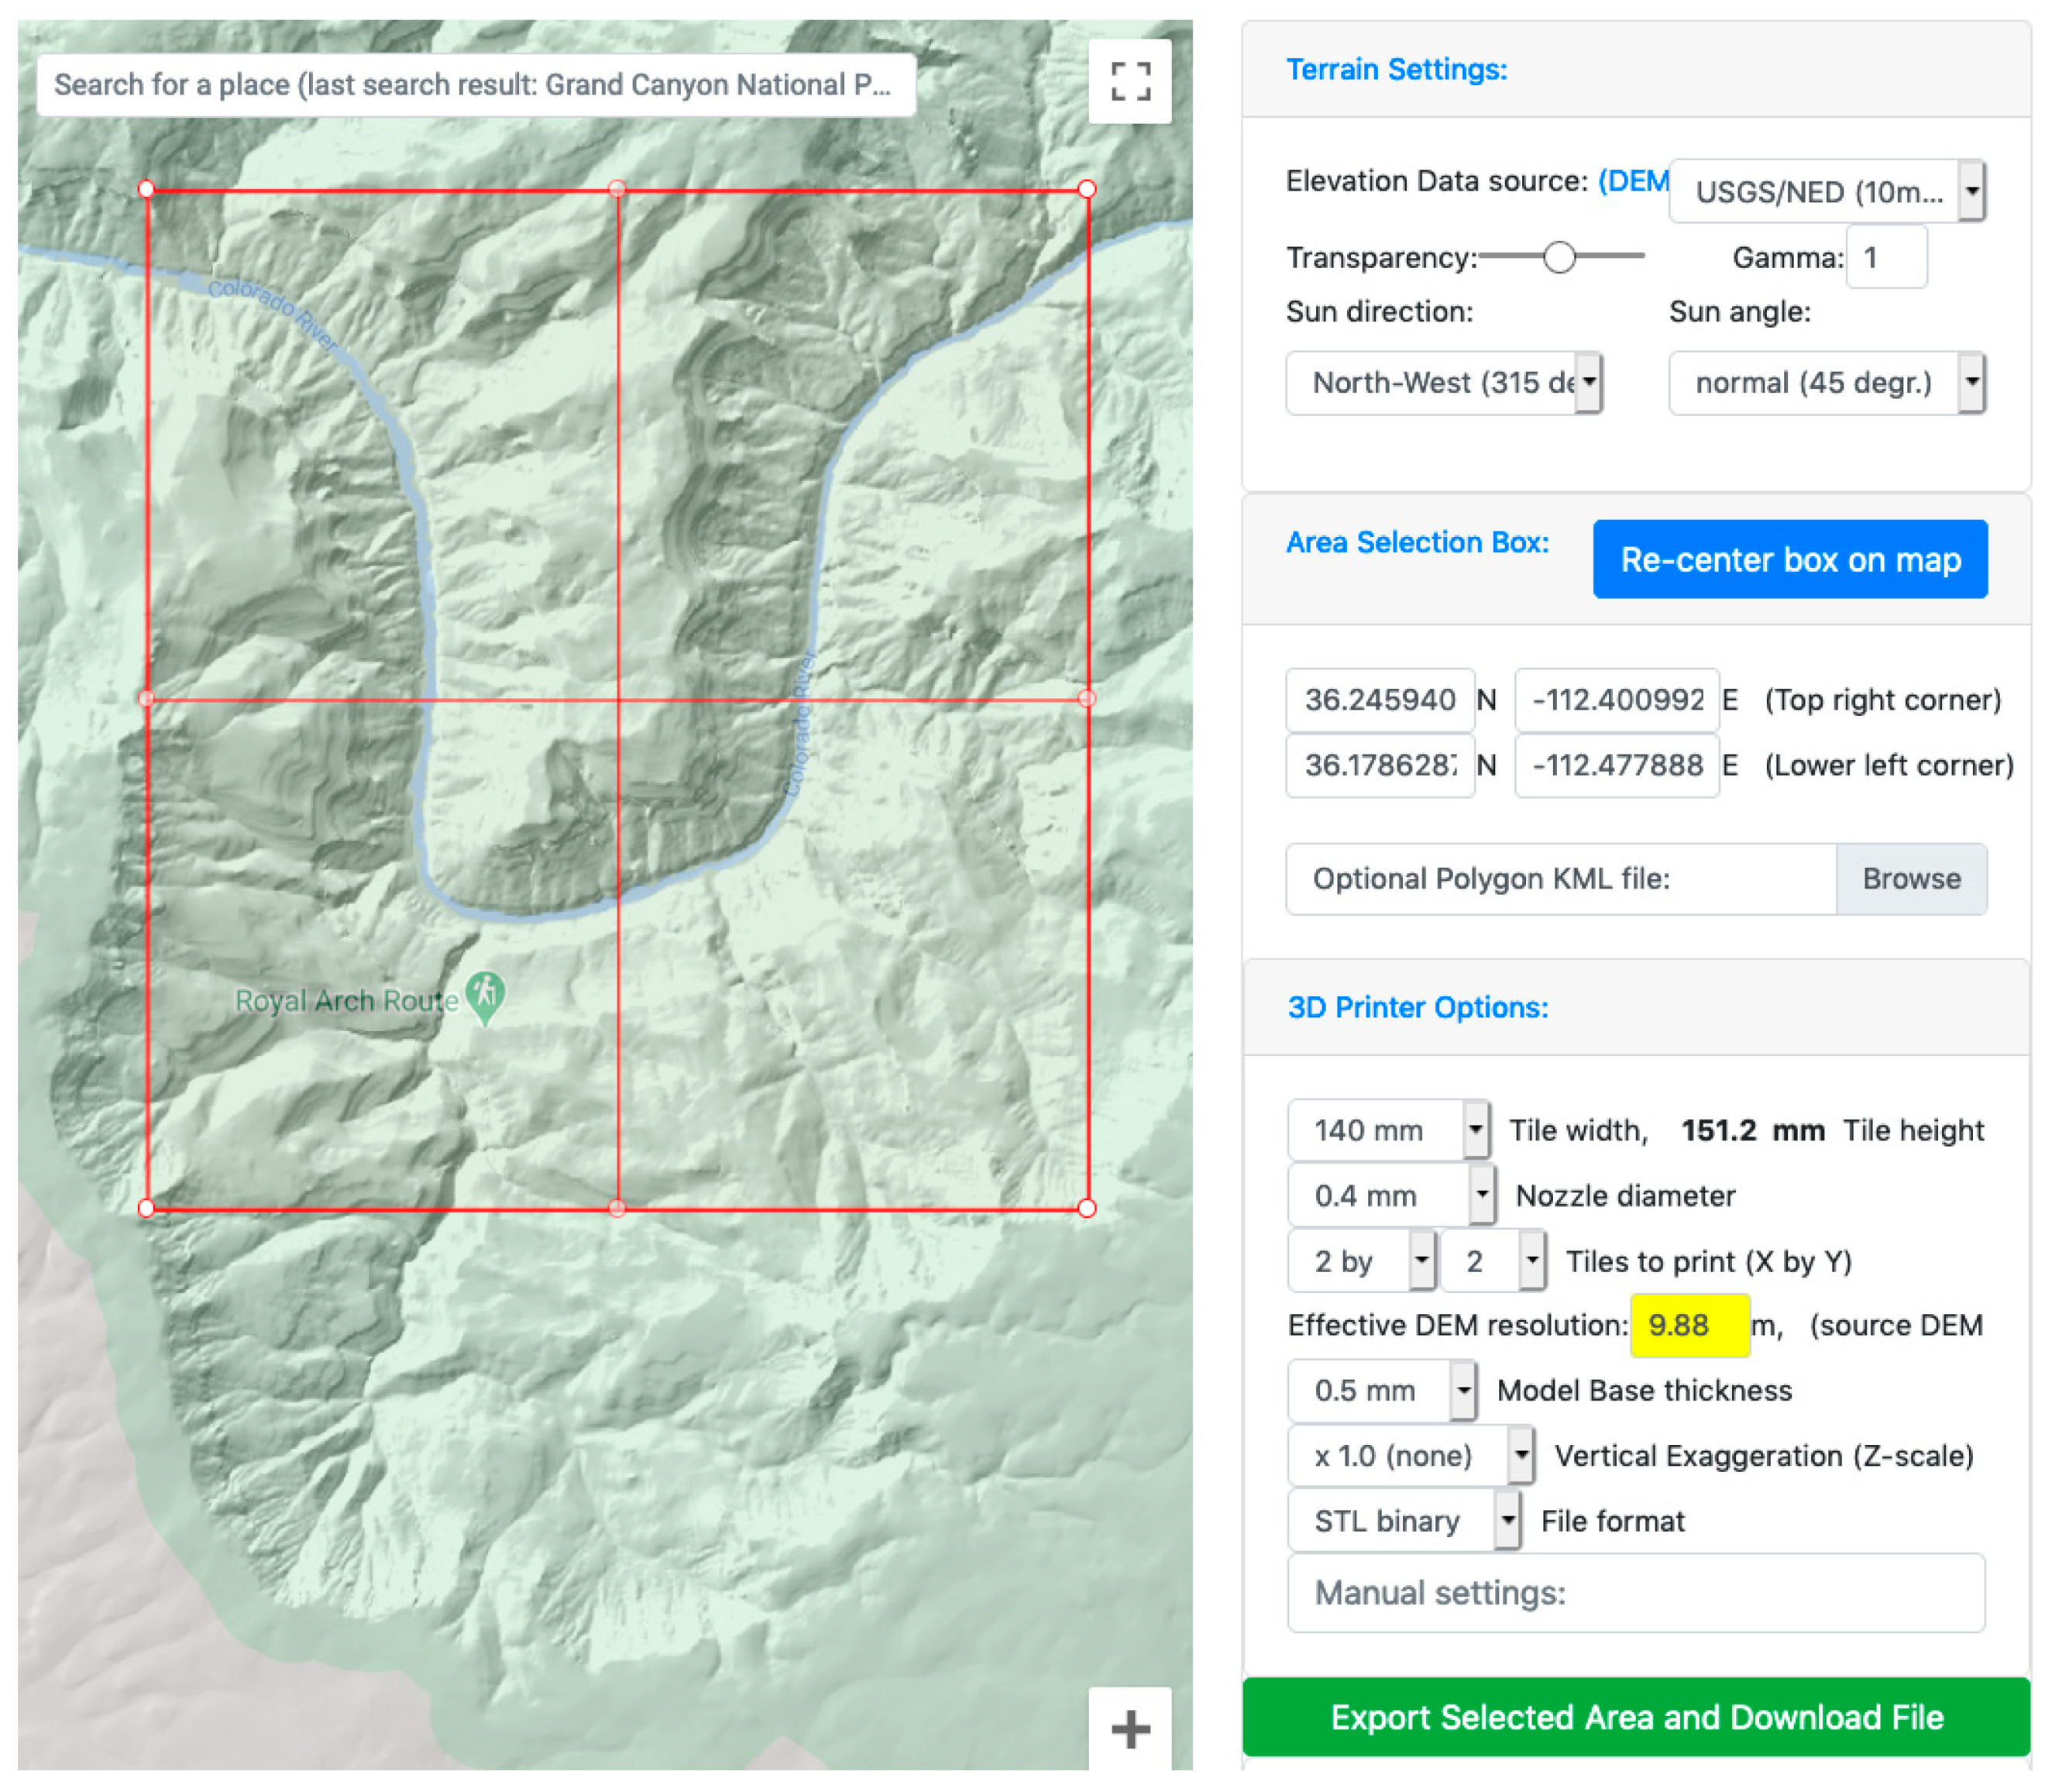
Figure 3.
TouchTerrain processing steps for creating a watertight, 3D printable terrain model. (A) the Digital Elevation Models (DEM) raster (symbolized via a black to white increasing grayscale); (B) the positions of all the corners after they have been extruded from the ground upwards (viewed from above); (C) the top triangle mesh made from connecting the corners (oblique view from South); and (D) the complete model with bottom mesh and a vertical wall along the southern border.
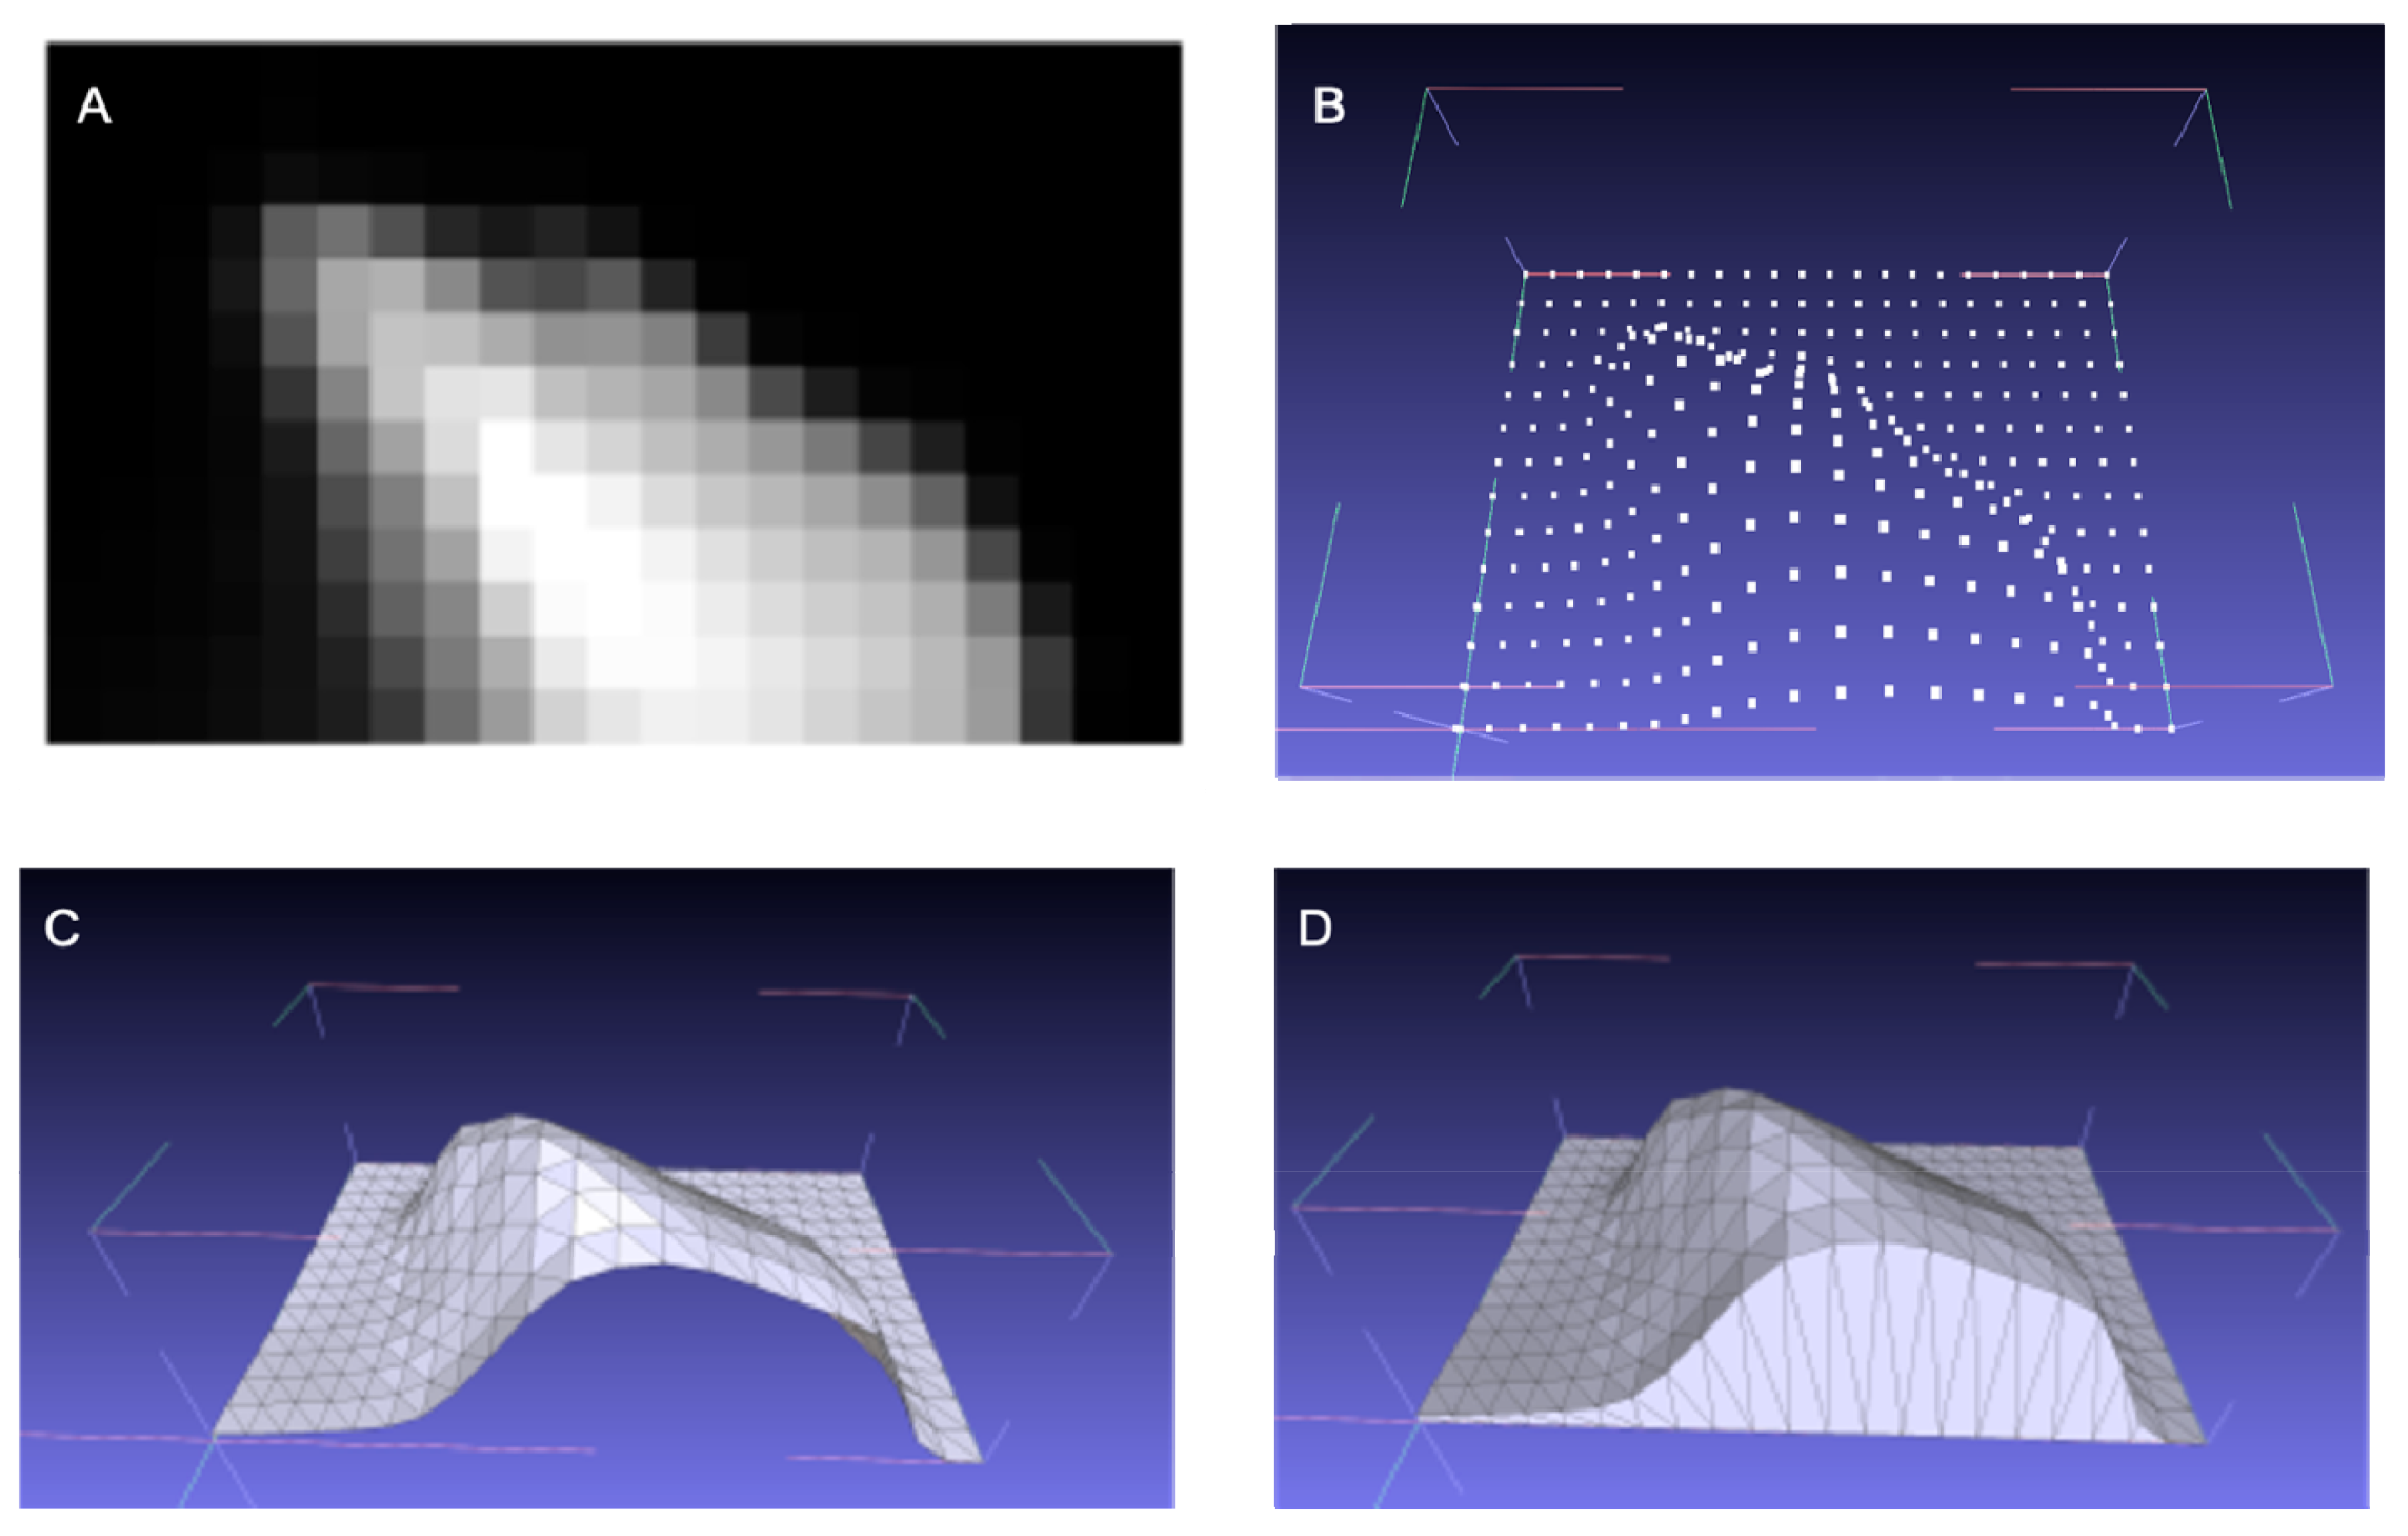
Figure 4.
Optimized triangle structure when using a polygonal outline.

Figure 5.
Assembly of a digital terrain model from four equal sized tiles.

Figure 6.
Effect of the base thickness setting. Left: With 0 mm, the riverbed will not be printed Scheme 0. mm (right) is recommended.
Figure 6.
Effect of the base thickness setting. Left: With 0 mm, the riverbed will not be printed Scheme 0. mm (right) is recommended.

Figure 7.
Digitizing a 3D print area polygon inside the interactive gee map jupyter cell around a set of GPX trails (cyan).
Figure 7.
Digitizing a 3D print area polygon inside the interactive gee map jupyter cell around a set of GPX trails (cyan).

Figure 8.
Effect of using a 8-bit grayscale image (left) to generate a relief effect on the bottom of a terrain model (right).
Figure 8.
Effect of using a 8-bit grayscale image (left) to generate a relief effect on the bottom of a terrain model (right).

Figure 9.
Map of TouchTerrain user locations generated via IP-based geolocation.
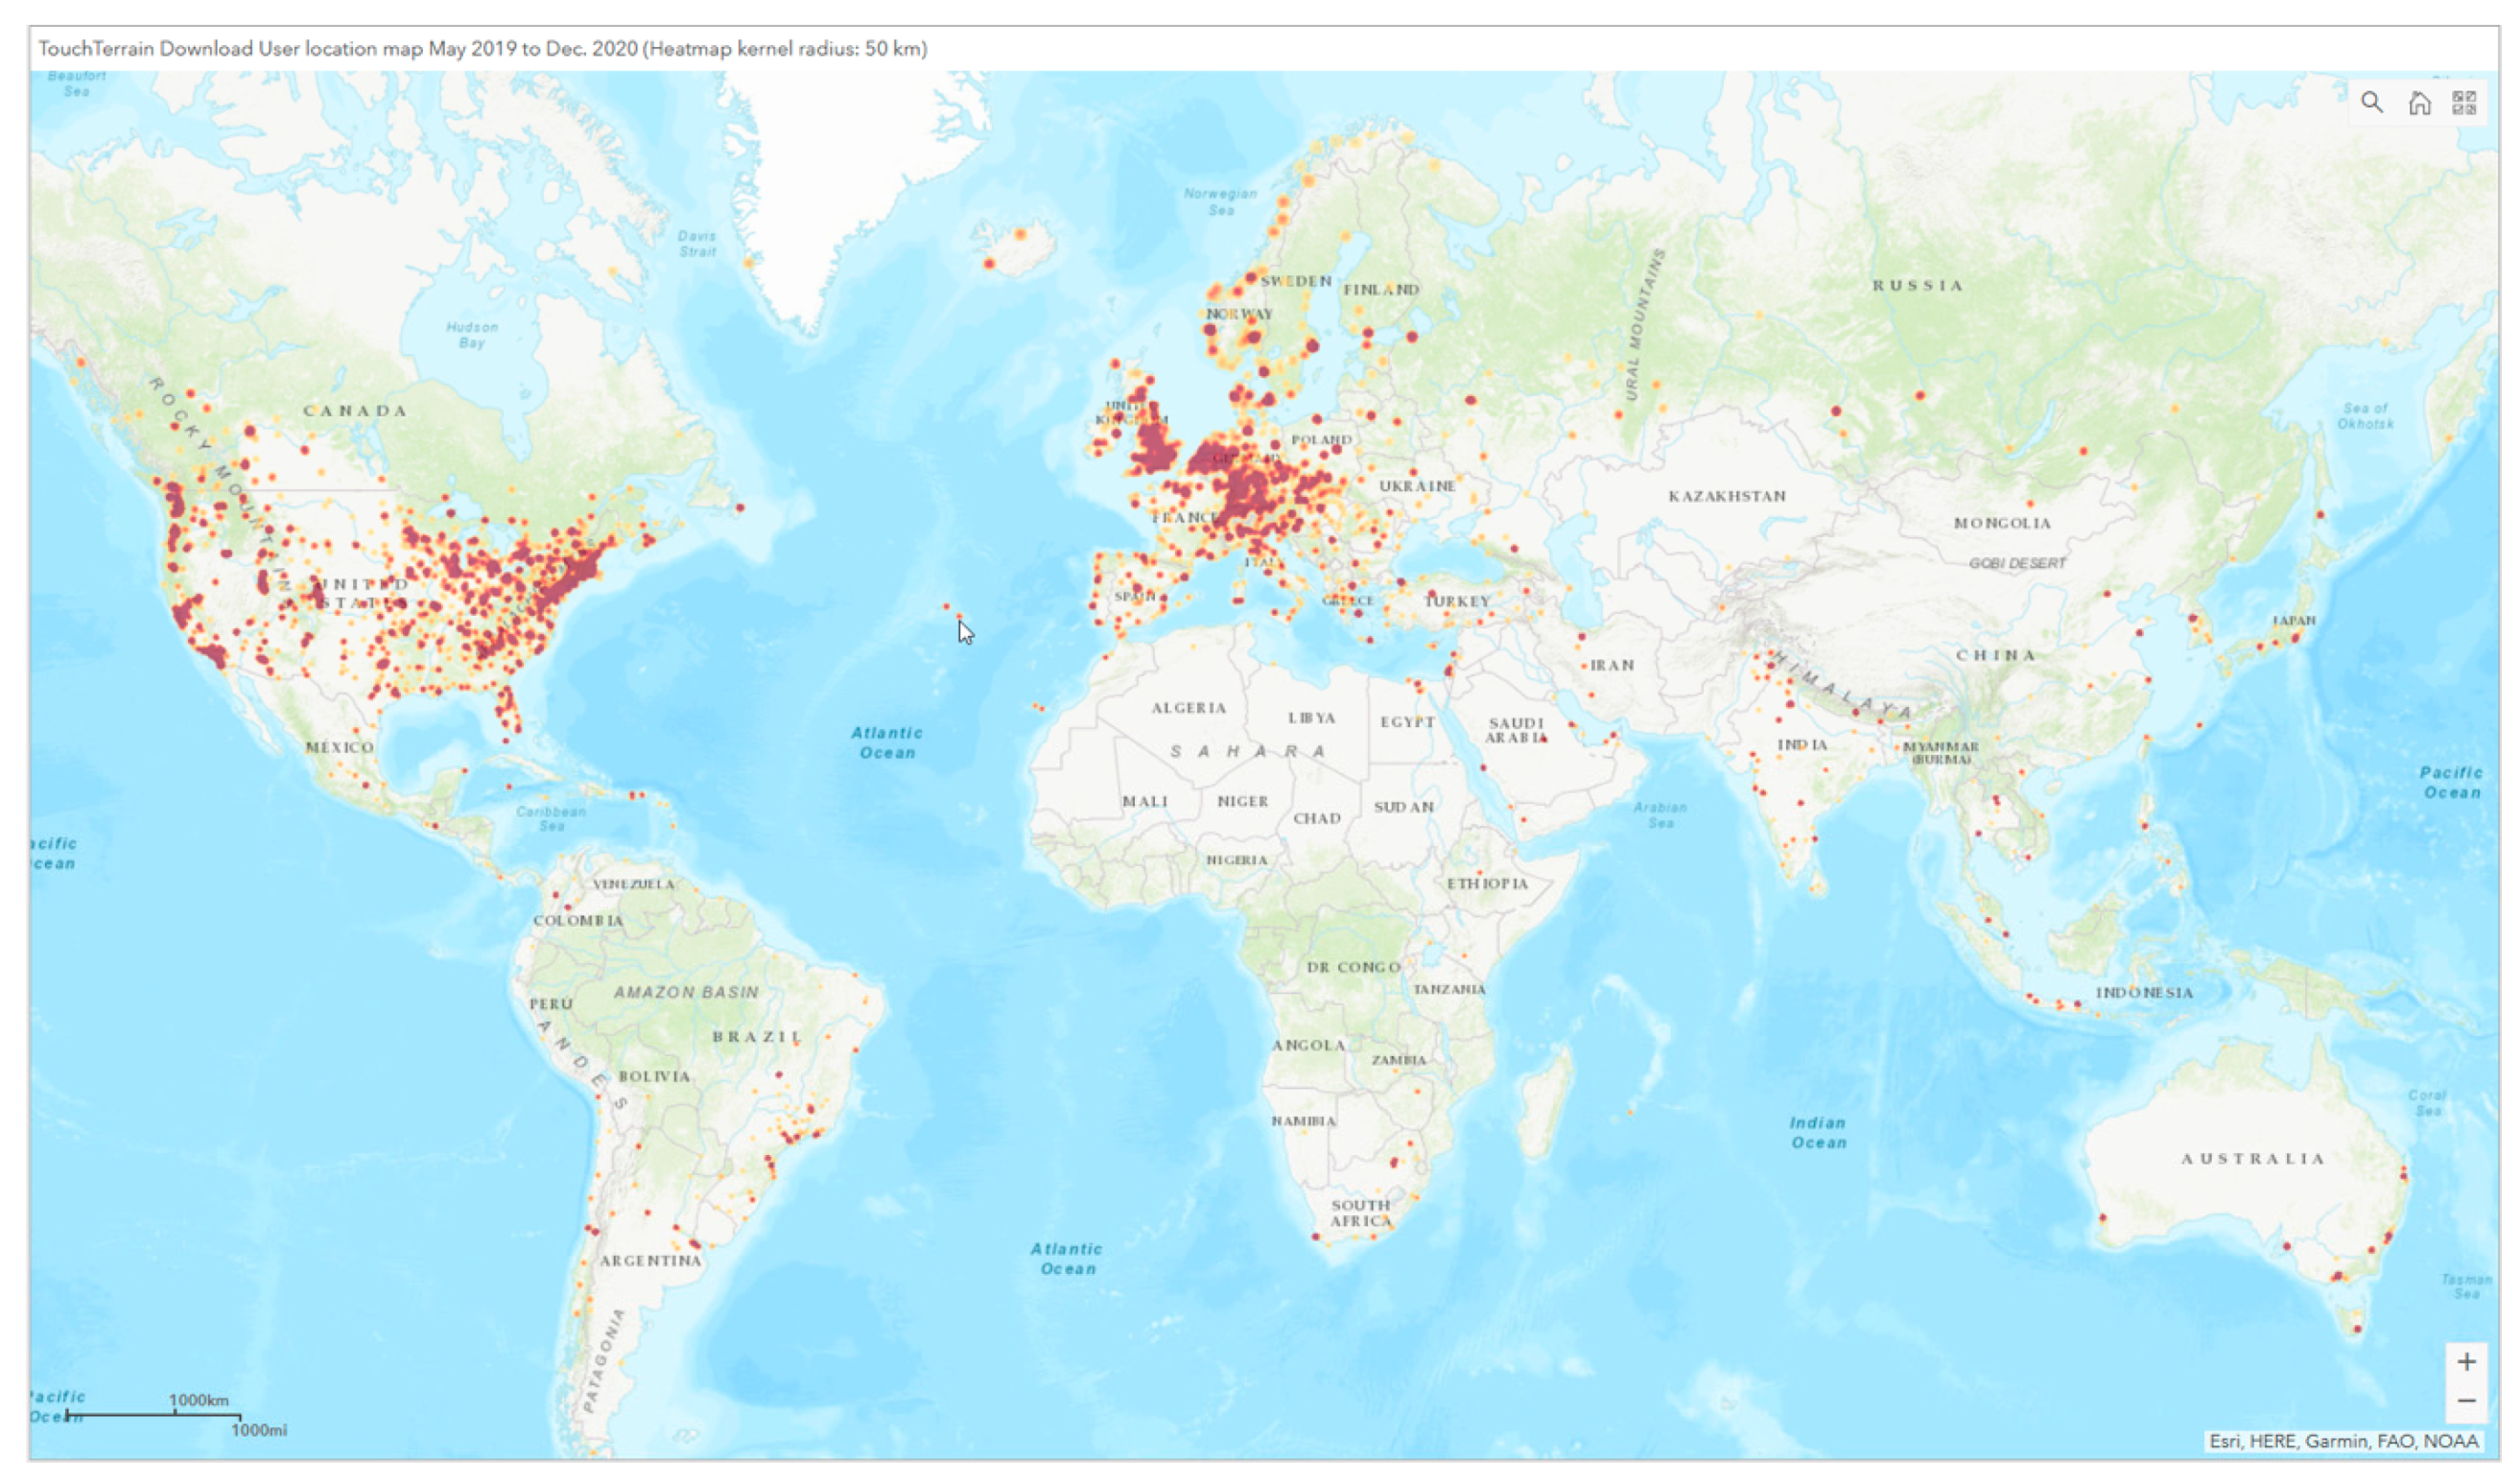
Figure 10.
Map of the centroids of the area boxes that users had selected to print.

Figure 11.
Bounding boxes of areas selected by TouchTerrain users for 3D printing in Europe.

Figure 12.
Histogram of the print areas in square kilometers, using a log10 x-axis.

Figure 13.
Number of comments classified by major category.

Figure 14.
Large 3D Printed model of Death Valley, dubbed “Mordor” by students.

Figure 15.
Iowa State University field camp students discuss their working hypotheses with an instructor using both a satellite image and 3D terrain model during the Alkali Anticline Project.
Figure 15.
Iowa State University field camp students discuss their working hypotheses with an instructor using both a satellite image and 3D terrain model during the Alkali Anticline Project.

Table 1.
Web Usage statistics for version 3, 12 October 2020—26 December 2020 (75 days).
| Event Category | Unique Events | Total Events | Total Event Factor | % of Unique Export Events |
|---|---|---|---|---|
| Export | 5866 | 17,178 | 2.93 | 100% |
| Download | 4826 | 9069 | 1.88 | 82% |
| Preview | 2991 | 8008 | 2.68 | 51% |
| Feedback | 324 | 616 | 1.9 | 6% |
| Place search | 6703 | 8567 | 1.28 | 114% |
Table 2.
Complete listing of the categories and subcategories used to define model use cases.
| Category | Subcategory | Category | Subcategory | Category | Subcategory | Category | Subcategory |
|---|---|---|---|---|---|---|---|
| Art | Art | Education | Art Project | Map | Country | Recreation | Aviation |
| Crafts | Carving | Education | BVI | Map | Farm | Recreation | Biking |
| Crafts | Crafts | Education | College | Map | Instructional | Recreation | Camping |
| Crafts | Furniture | Education | Documentary | Map | Land Use | Recreation | Climbing |
| Crafts | Gift | Education | Education | Map | Landscape | Recreation | Dirt Biking |
| Crafts | Hobby | Education | Elementary School | Map | Map | Recreation | Drone |
| Crafts | Memento | Education | Exhibition | Map | Mountains | Recreation | Gaming |
| Crafts | Puzzle | Education | Field Trip | Map | Neighborhood | Recreation | Hiking |
| Crafts | Railroad | Education | High School | Map | Outdoors | Recreation | Hunting |
| Crafts | Trophy | Education | Learning | Map | Park | Recreation | Leisure |
| Crafts | Wall Art | Education | Library | Map | Property | Recreation | Paraglider |
| Design | 3D Design | Education | Middle School | Misc. | Commercial | Recreation | Radio |
| Design | Architecture | Education | Museum | Misc. | Curious | Recreation | Ski |
| Design | Art | Education | Personal | Misc. | Food | Recreation | Snowmobile |
| Design | Augmented Reality | Education | School Project | Misc. | Fun | Recreation | Sports |
| Design | Decoration | Education | Teaching | Misc. | Message | Recreation | Tourism |
| Design | Diorama | Misc. | Personal | Research | Archeology | ||
| Design | Modeling | Misc. | Private | Research | Geology | ||
| Design | Programming | Misc. | Special | Research | History | ||
| Design | Video Game | Misc. | Unknown | Research | Meteorology | ||
| Research | Research |
Table 3.
Number of comments by category/subcategory and by type of technology used (with examples). Abbreviations: CNC = Computer Numerical Control; 3DP = 3D printing.
Table 3.
Number of comments by category/subcategory and by type of technology used (with examples). Abbreviations: CNC = Computer Numerical Control; 3DP = 3D printing.
| Category | Subcategory | n 3DP | n CNC | n Total | Examples |
|---|---|---|---|---|---|
| Misc | Personal | 182 | 3 | 185 | Model printing and painting as a hobby; 3D print for personal use |
| Education | Education | 176 | 0 | 176 | for educational purposes; school map; Class assignment!; ed printing |
| Crafts | Gift | 141 | 12 | 153 | Print a gift for my Dad - he was born nearby; Anniversary gift for my wife, we hiked here for our honeymoon. |
| Crafts | Carving | 6 | 135 | 141 | 3D carving; CNC carving; CNC Machine; Wood relief; X carve; |
| Map | Map | 94 | 2 | 96 | 3D printing Kauai island since we can’t travel there currently; model of this place where we were with friends. |
| Map | Property | 69 | 1 | 70 | Bought new rural property. Wanted to evaluate and visualize landscape for trail planning and possible cabin locations; My property to teach my kids the boundaries and the land. |
| Misc | Fun | 45 | 0 | 45 | For Fun, conversation; PLAYING AROUND; Just for fun/ unsure yet |
| Education | College | 42 | 0 | 42 | I will teach geomorphology with this model; teaching oceanography course: section on coastal geology |
| Design | 3D Design | 39 | 1 | 40 | Trial terrain in Blender 2.83; Topo Model in Rhino; fusion360 landscape austria |
| Design | Architecture | 36 | 1 | 37 | Understand land, easements, and possible building sites; Student architecture project |
| Recreation | Hiking | 28 | 1 | 29 | Trying to get a realistic model to plan for some climbing; trecking & climbing observation |
| Research | Research | 25 | 0 | 25 | Research of the Buffalo Creek Mining Disaster; Glacial modelling |
| Crafts | Wall Art | 23 | 1 | 24 | make a terrain map of Long Island where i am from to put on my wall; 3d print an area map for my wall |
| Map | Neighborhood | 24 | 0 | 24 | Teaching my kids their surrounds, way to school, beach, woods we visit; neighborhood exploring |
| Recreation | Ski | 22 | 0 | 22 | favorite ski area: Arapahoe Basin Colorado; 3D backcountry ski map |
| Education | School Project | 21 | 0 | 21 | For my Grandson School Project; I am using this for a school project. |
| Crafts | Crafts | 14 | 6 | 20 | 3d printing key chain fob; Carving a door sign; CNC a topo for box lid |
| Education | High School | 17 | 1 | 18 | testing for education, geography course high school; teaching College prep geography students |
| Recreation | Gaming | 17 | 0 | 17 | Hobby for Gettysburg Campaign, personal use w my father; Model of Savo Island for WWII Naval Game |
| Design | Art | 15 | 1 | 16 | Fine Arts project dealing with geography and mapping; concept art illustrations; art show |
| Map | Mountains | 15 | 1 | 16 | I’ve always wanted so much 3D maps of my mountains, it feels like a dream coming true!; cnc carving of the smokies |
| Education | Learning | 15 | 0 | 15 | Learning to 3d Print; Learning |
| Education | Teaching | 15 | 0 | 15 | to teach some stuff to kids during Covid 19 confinment; classroom instruction / data visualization |
| Art | Art | 14 | 0 | 14 | Art |
| Map | Outdoors | 13 | 1 | 14 | to see a river that I kayak; want to cnc a model of Tablerock Lake |
| Misc | Curious | 14 | 0 | 14 | Curious to see what this does!; Satisfying my curiosity |
| Design | Modeling | 13 | 0 | 13 | Model making; modelling; model |
| Recreation | Camping | 12 | 1 | 13 | carving a model of the Philmont Scout Camp located in this area; Commemorate a camping trip |
| Education | Museum | 12 | 0 | 12 | For a museum to illustrate how increased tides will effect the area; display in a children’s museum |
| Crafts | Hobby | 8 | 3 | 11 | A new project for creating collectibles; hobbie |
| Recreation | Tourism | 10 | 0 | 10 | Visualising holiday terrain; view our holiday rides; Tourism |
| Design | Decoration | 9 | 0 | 9 | probably a shelf decoration; Home decoration; Desk Décor |
| Map | Farm | 8 | 0 | 8 | My Dads old farm area; I want a printed 3d model of my farm; Houston Farm Maryville, Missouri |
| Map | Park | 8 | 0 | 8 | Mt. Pisgah State Park; Mammoth Cave National Park; Ohio Pyle SP |
| Research | Geology | 8 | 0 | 8 | attempting to detail area for gold prospecting; We want to use this to learn the country geological. |
| Crafts | Furniture | 5 | 2 | 7 | 3D Wood Carving into a desk top and back filling with epoxy resin; designing a dining table |
| Crafts | Puzzle | 6 | 0 | 6 | For making a jigsaw puzzle. Thank you; puzzle |
| Crafts | Trophy | 6 | 0 | 6 | Make into a trophy for beer Olympics.; Trophy for a friend |
| Education | Elementary School | 6 | 0 | 6 | 3D print for use in a hands-on, 4th grade science unit about flood and drought, looking at a local watershed. |
| Misc | Private | 6 | 0 | 6 | Private use; private |
Table 4.
Number of comments by category/subcategory and by type of technology used (w/o examples).
| Category | Subcategory | n 3DP | n CNC | n Total | Category | Subcategory | n 3DP | n CNC | n Total |
|---|---|---|---|---|---|---|---|---|---|
| Education | Art Project | 5 | 0 | 5 | Recreation | Paraglider | 2 | 0 | 2 |
| Map | Landscape | 5 | 0 | 5 | Recreation | Snowmobile | 2 | 0 | 2 |
| Misc. | Message | 5 | 0 | 5 | Research | Meteorology | 2 | 0 | 2 |
| Education | Exhibition | 4 | 0 | 4 | Design | Augmented Reality | 1 | 0 | 1 |
| Misc. | Special | 4 | 0 | 4 | Design | Diorama | 1 | 0 | 1 |
| Recreation | Aviation | 4 | 0 | 4 | Design | Programming | 1 | 0 | 1 |
| Recreation | Leisure | 4 | 0 | 4 | Education | Bvi | 1 | 0 | 1 |
| Recreation | Radio | 4 | 0 | 4 | Education | Documentary | 1 | 0 | 1 |
| Crafts | Memento | 3 | 0 | 3 | Education | Field Trip | 1 | 0 | 1 |
| Crafts | Railroad | 3 | 0 | 3 | Education | Personal | 1 | 0 | 1 |
| Education | Middle School | 2 | 1 | 3 | Map | Country | 1 | 0 | 1 |
| Map | Land Use | 3 | 0 | 3 | Map | Instructional | 1 | 0 | 1 |
| Recreation | Hunting | 3 | 0 | 3 | Misc. | Food | 1 | 0 | 1 |
| Research | History | 3 | 0 | 3 | Recreation | Biking | 1 | 0 | 1 |
| Design | Video Game | 2 | 0 | 2 | Recreation | Climbing | 1 | 0 | 1 |
| Education | Library | 2 | 0 | 2 | Recreation | Drone | 1 | 0 | 1 |
| Misc. | Commercial | 2 | 0 | 2 | Recreation | Sports | 0 | 1 | 1 |
| Misc. | Unknown | 2 | 0 | 2 | Research | Archeology | 1 | 0 | 1 |
| Recreation | Dirt Biking | 2 | 0 | 2 |
Publisher’s Note: MDPI stays neutral with regard to jurisdictional claims in published maps and institutional affiliations. |
© 2021 by the authors. Licensee MDPI, Basel, Switzerland. This article is an open access article distributed under the terms and conditions of the Creative Commons Attribution (CC BY) license (http://creativecommons.org/licenses/by/4.0/).
Share and Cite
MDPI and ACS Style
Harding, C.; Hasiuk, F.; Wood, A. TouchTerrain—3D Printable Terrain Models. ISPRS Int. J. Geo-Inf. 2021, 10, 108. https://0-doi-org.brum.beds.ac.uk/10.3390/ijgi10030108
AMA Style
Harding C, Hasiuk F, Wood A. TouchTerrain—3D Printable Terrain Models. ISPRS International Journal of Geo-Information. 2021; 10(3):108. https://0-doi-org.brum.beds.ac.uk/10.3390/ijgi10030108
Chicago/Turabian StyleHarding, Chris, Franek Hasiuk, and Aaron Wood. 2021. "TouchTerrain—3D Printable Terrain Models" ISPRS International Journal of Geo-Information 10, no. 3: 108. https://0-doi-org.brum.beds.ac.uk/10.3390/ijgi10030108
Note that from the first issue of 2016, this journal uses article numbers instead of page numbers. See further details here.