Article

Distribution of Lightning Accidents in Sri Lanka from 1974 to 2019 Using the DesInventar Database

by
Mahesh Edirisinghe
* and
Uruvitiya Gamage Dilaj Maduranga
Department of Physics, University of Colombo, Colombo 00300, Sri Lanka
*
Author to whom correspondence should be addressed.
ISPRS Int. J. Geo-Inf. 2021, 10(3), 117; https://0-doi-org.brum.beds.ac.uk/10.3390/ijgi10030117
Submission received: 16 December 2020 / Revised: 30 January 2021 / Accepted: 24 February 2021 / Published: 27 February 2021
(This article belongs to the Special Issue Disaster Management and Geospatial Information)

Abstract

:
The reported lightning accidents that are available in the DesInventar database—which consist of 549 deaths, 498 injured people, 39 destroyed houses, and 741 damaged houses—were analyzed in terms of their geographical and temporal variation. The average lightning flash densities were calculated using zonal statistics using the geographic information system (GIS), referring to the respective raster maps generated based on Lightning Imaging Sensor (LIS) data from the Tropical Rainfall Measurement Mission (TRMM) Satellite. Hence, the variations of the lightning accidents—monthly and climate season-wise—in response to the lightning flash density were also reported. The calculated average lightning flash density in Sri Lanka is 8.26 flashes km−2 year−1, and the maximum average lightning flash density of 31.33 flashes km−2 year−1 is observed in April in a calendar year. April seems to be more vulnerable to lightning accidents, as the maximum number of deaths (150 deaths) and injuries (147 injuries) were recorded in this month. Most of the high-risk lightning accident regions that were identified in Sri Lanka are well known for agricultural activities, and those activities will eventually create the platform for lightning victims. In Sri Lanka, in a year, 12 people were killed and 11 people were injured, based on the reported accidents from 1974 to 2019. Conversely, a substantial increase in the number of deaths, injuries, and incidents of property damage has been observed in the last two decades (2000–2019). On average, for the period from 2000 to 2019, 18 people were killed and 16 people were injured per year. Furthermore, considering the population of the country, 0.56 people per million per year were killed, and 0.51 people per million per year were injured due to lightning accidents based on the reported accidents from 1974 to 2019. Moreover, for the 2000–2019 period, these estimated values are significantly higher; 0.86 people per million per year were killed, and 0.77 people per million per year were injured.

1. Introduction

Lightning is an electrical discharge which is mostly due to an inter-cloud, intra-cloud, or cloud to ground electrical imbalance. It is spectacular, but it is also dangerous. The high values of current and relevant energy of a lightning flash are potent enough to kill people and animals, and destroy property. There are about eight million lightning flashes a day all over the world, and an infrequent 0.2–0.8 people per million per year are killed by lightning in some geographical locations [1,2]. Furthermore, some of the people affected by lightning accidents may experience a variety of injuries, including severe burns, cardiac arrest, or other symptoms, which may last for a longer period.
A comprehensive study about regional lightning activities is an essential requirement to mitigate the lightning hazards of a country by identifying the highly lightning-active seasons and regions of that country. Detailed studies have been conducted concerning the awareness and lightning safety of the community, and it is important to conduct awareness programs, and to make people aware of lightning hazards and the safety methods available for the public community [3,4]. Many countries collect lightning data by using lightning locating systems and satellites, etc., and these data are used to analyze parametric information of lightning [5,6,7]. Moreover, lightning activities are not evenly distributed worldwide, and about 70 % occur in the tropics, mostly over the land [8].
The characteristics and distribution of lightning flashes over Sri Lanka have been studied by researchers using the Lightning Imaging Sensor (LIS) data from Tropical Rainfall Measurement Mission (TRMM) of National Aeronautics and Space Administration (NASA) [6,7,9,10,11,12,13]. Furthermore, as reported in [6], the lightning activities over Sri Lanka are gradually increasing. Moreover, lightning activities and the respective lightning safety levels have been analyzed over the places which are vulnerable to lightning incidents in Sri Lanka [6,7]. The information reported by these studies is critical to enhance the awareness of the lightning safety of the community, and to take appropriate actions to mitigate lightning hazards effectively.
People living in developing countries in South Asia are vulnerable to lightning damage, and—in the Sri Lankan context—it is one of the severe natural hazards which cause impairments to property and people [14,15]. In general, antennas, wired network systems, etc. create an easy path for lightning strikes, and some activities—such as swimming, fishing, and walking in the open area during fatal lightning strikes—will increase the tendency of being victims of lightning hazards.
Furthermore, Sri Lanka is experiencing several types of natural hazards, such as floods, strong winds, drought, heavy rain, and lightning, etc. [15,16]. As has been reported in previous studies, as a tropical country, hazards due to lightning have been identified as one of the dominant natural hazards in Sri Lanka [6,7,10,11,12,14,15,16]. However, due to a lack of detailed information on the distribution of lightning accidents in Sri Lanka, estimating the lightning hazard levels and performing a risk assessment in Sri Lanka are at a primary level. Many countries have already reported their lightning hazard information, such as how many people get killed or injured in a year due to lightning, and related statistical information [1,2]. However, in Sri Lanka, these estimations are yet to be reported, and one of the objectives of this study is to obtain a thorough statistical overview of lightning accidents in Sri Lanka. This paper reveals an analysis of lightning accidents in Sri Lanka from 1974 to 2019, with special attention to the geographical and temporal distribution of deaths, injuries, and property damage (residential houses) in Sri Lanka that occurred due to lightning. Moreover, the study has been extended in order to analyze the variations of lightning accidents monthly and climate season-wise, in response to the respective average lightning flash density of Sri Lanka in each month. The regional characteristics of lightning accidents in response to the respective average lightning flash density of each district were also analyzed. The lightning flash data available from the Lightning Imaging Sensor (LIS) on the Tropical Rainfall Measurement Mission (TRMM) of NASA were used to generate the respective raster maps using geographic information systems (GIS), and the relevant average lightning flash densities were calculated using zonal statistics.

2. Data Collection

The Disaster Management Centre (DMC) and the Department of Meteorology are the two organizations which are responsible for documenting weather-related hazards, deaths, and casualties in Sri Lanka. The database named the ‘Disaster Inventory System’ (DesInventar) is a database available from the Disaster Information Management System, which is maintained by the Disaster Management Centre (DMC), which includes the numerical details of the deaths, injuries, destroyed and damaged houses, and affected people, etc. in Sri Lanka [16,17]. The Disaster Management Centre (DMC) collects all of the information related to every disaster which occurs in Sri Lanka, such as animal attacks, floods, strong winds, fire, drought, heavy rain, and lightning, etc. They collected information about disasters from 1974 to 2006, with the aid of recorded information from several state organizations and published newspapers, etc. The relevant information after 2006 was collected using reported information with a certification of accuracy by the relevant regional officers in the area. Furthermore, the data possession phenomenon in different sectors of state organizations has been established all over the country, with diverse arrangements and formats. This detailed information was deposited into the DisInventer database by the Disaster Management Centre (DMC) in Sri Lanka. For this study, detailed information on lightning-related incidents from 1974 to 2019, which were extracted from the aforementioned database, was used [16,17].

3. Data Analysis

The geographical and temporal distributions of lightning deaths, injuries, and houses that were destroyed and damaged due to lightning activity were analyzed from 1974 to 2019 in Sri Lanka using ArcGIS 10.1 software.
Sri Lanka, an island in the Indian Ocean, consists of nine provinces; they are further subdivided into 25 Administrative Districts (ADs), and each district is divided into several subdivisions named ‘Divisional Administrative Secretaries’. Altogether, the country is divided into 331 Divisional Secretariat Divisions (DSD). Figure 1 shows the geographical distribution of the existing Provinces and Administrative Districts (ADs) in Sri Lanka. The distribution of lightning accidents—such as lightning deaths, injuries, and damage to property—was analyzed on the level of the existing districts in the county.
In a temporal distribution, the lightning accidents were analyzed annually and seasonally. The results were used to identify the maximum and minimum regions and periods which have recorded lightning accidents within the considered period in Sri Lanka.

4. Results

By analyzing the availability of 46-year data from 1974 to 2019, the geographical and temporal distribution of the recorded lightning accidents in Sri Lanka are presented together with their respective statistics. All of the administrative districts (ADs) are represented by relevant numbers (from AD 1–AD 25), as stated in Figure 1.

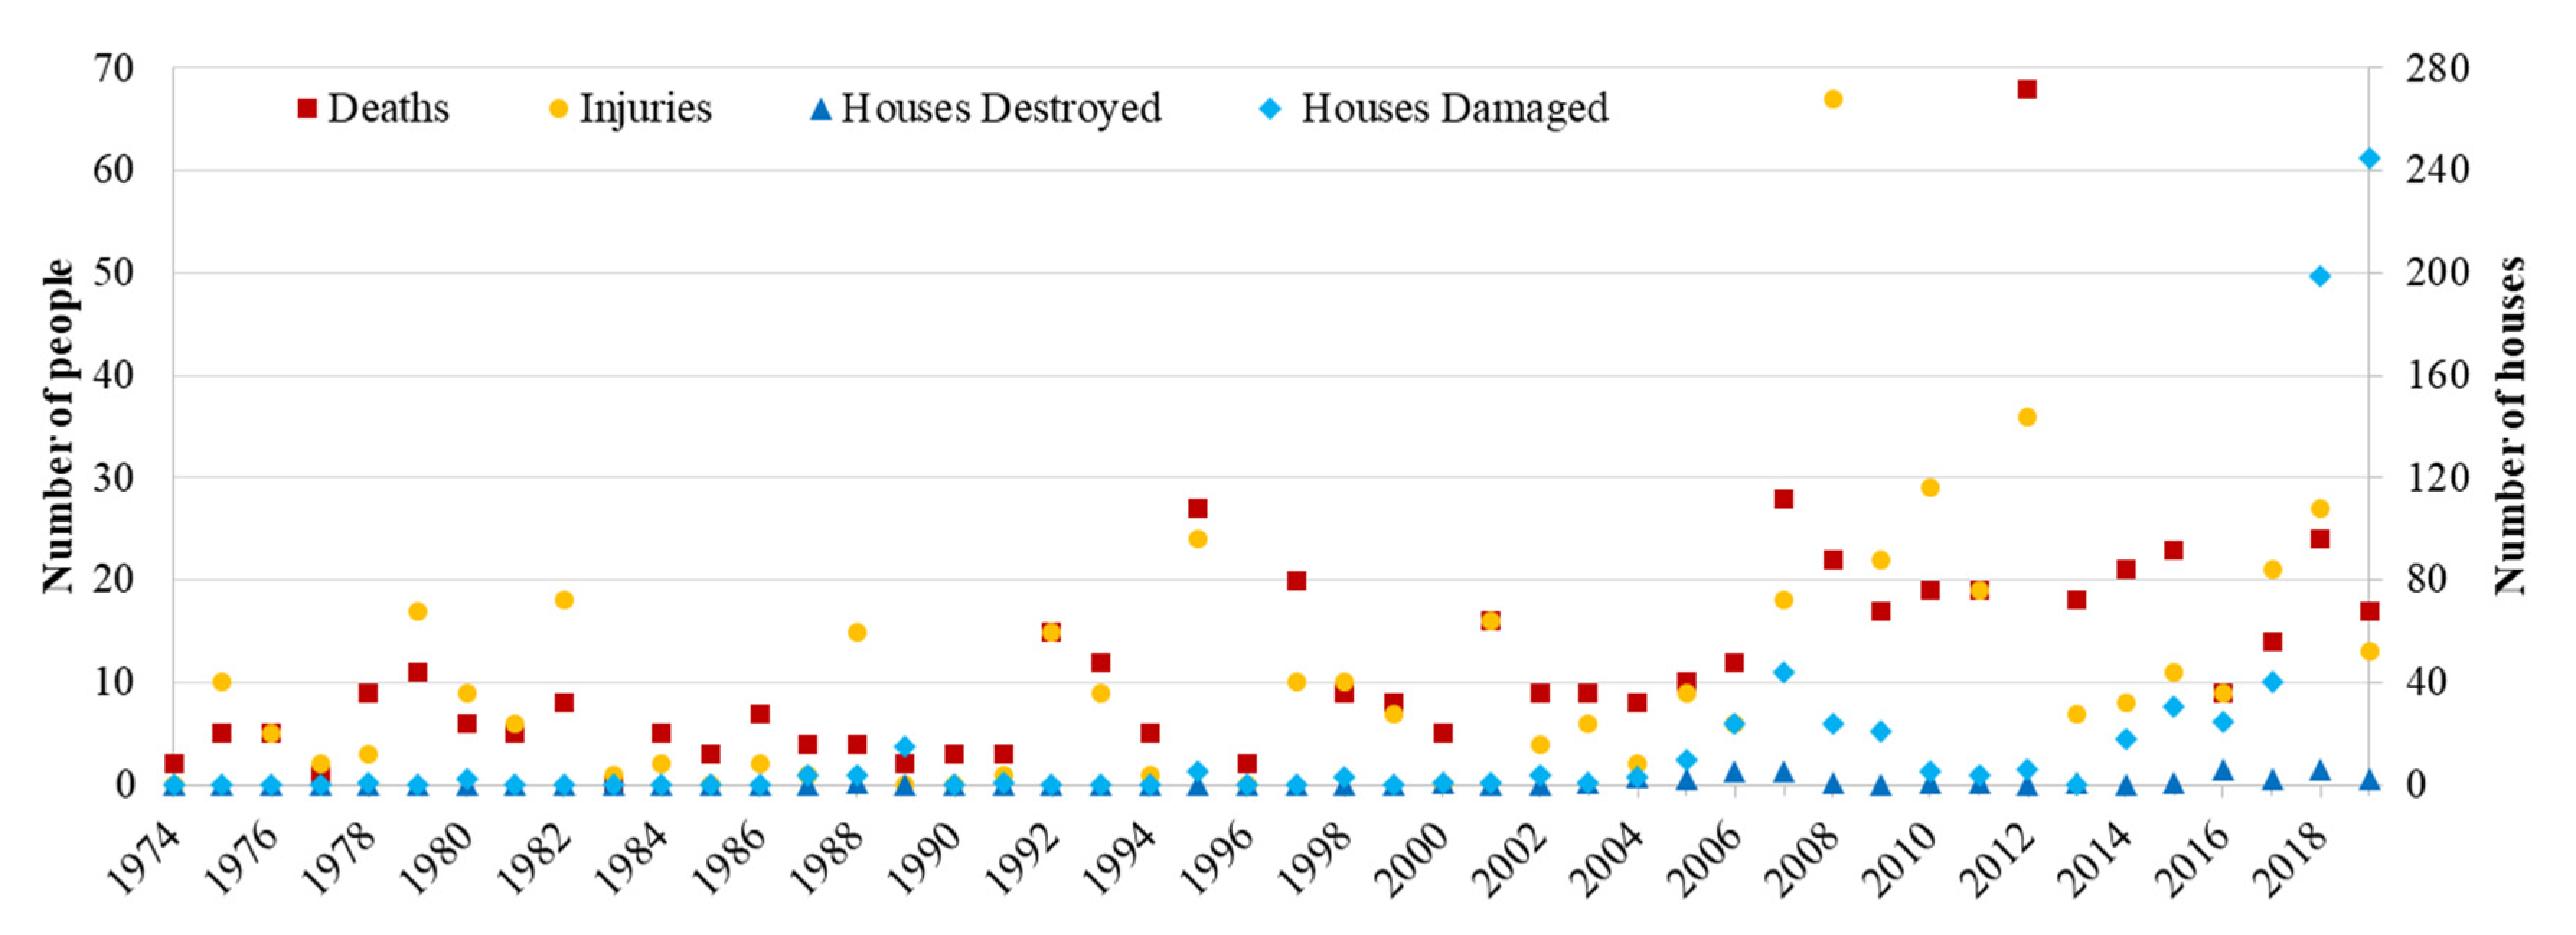
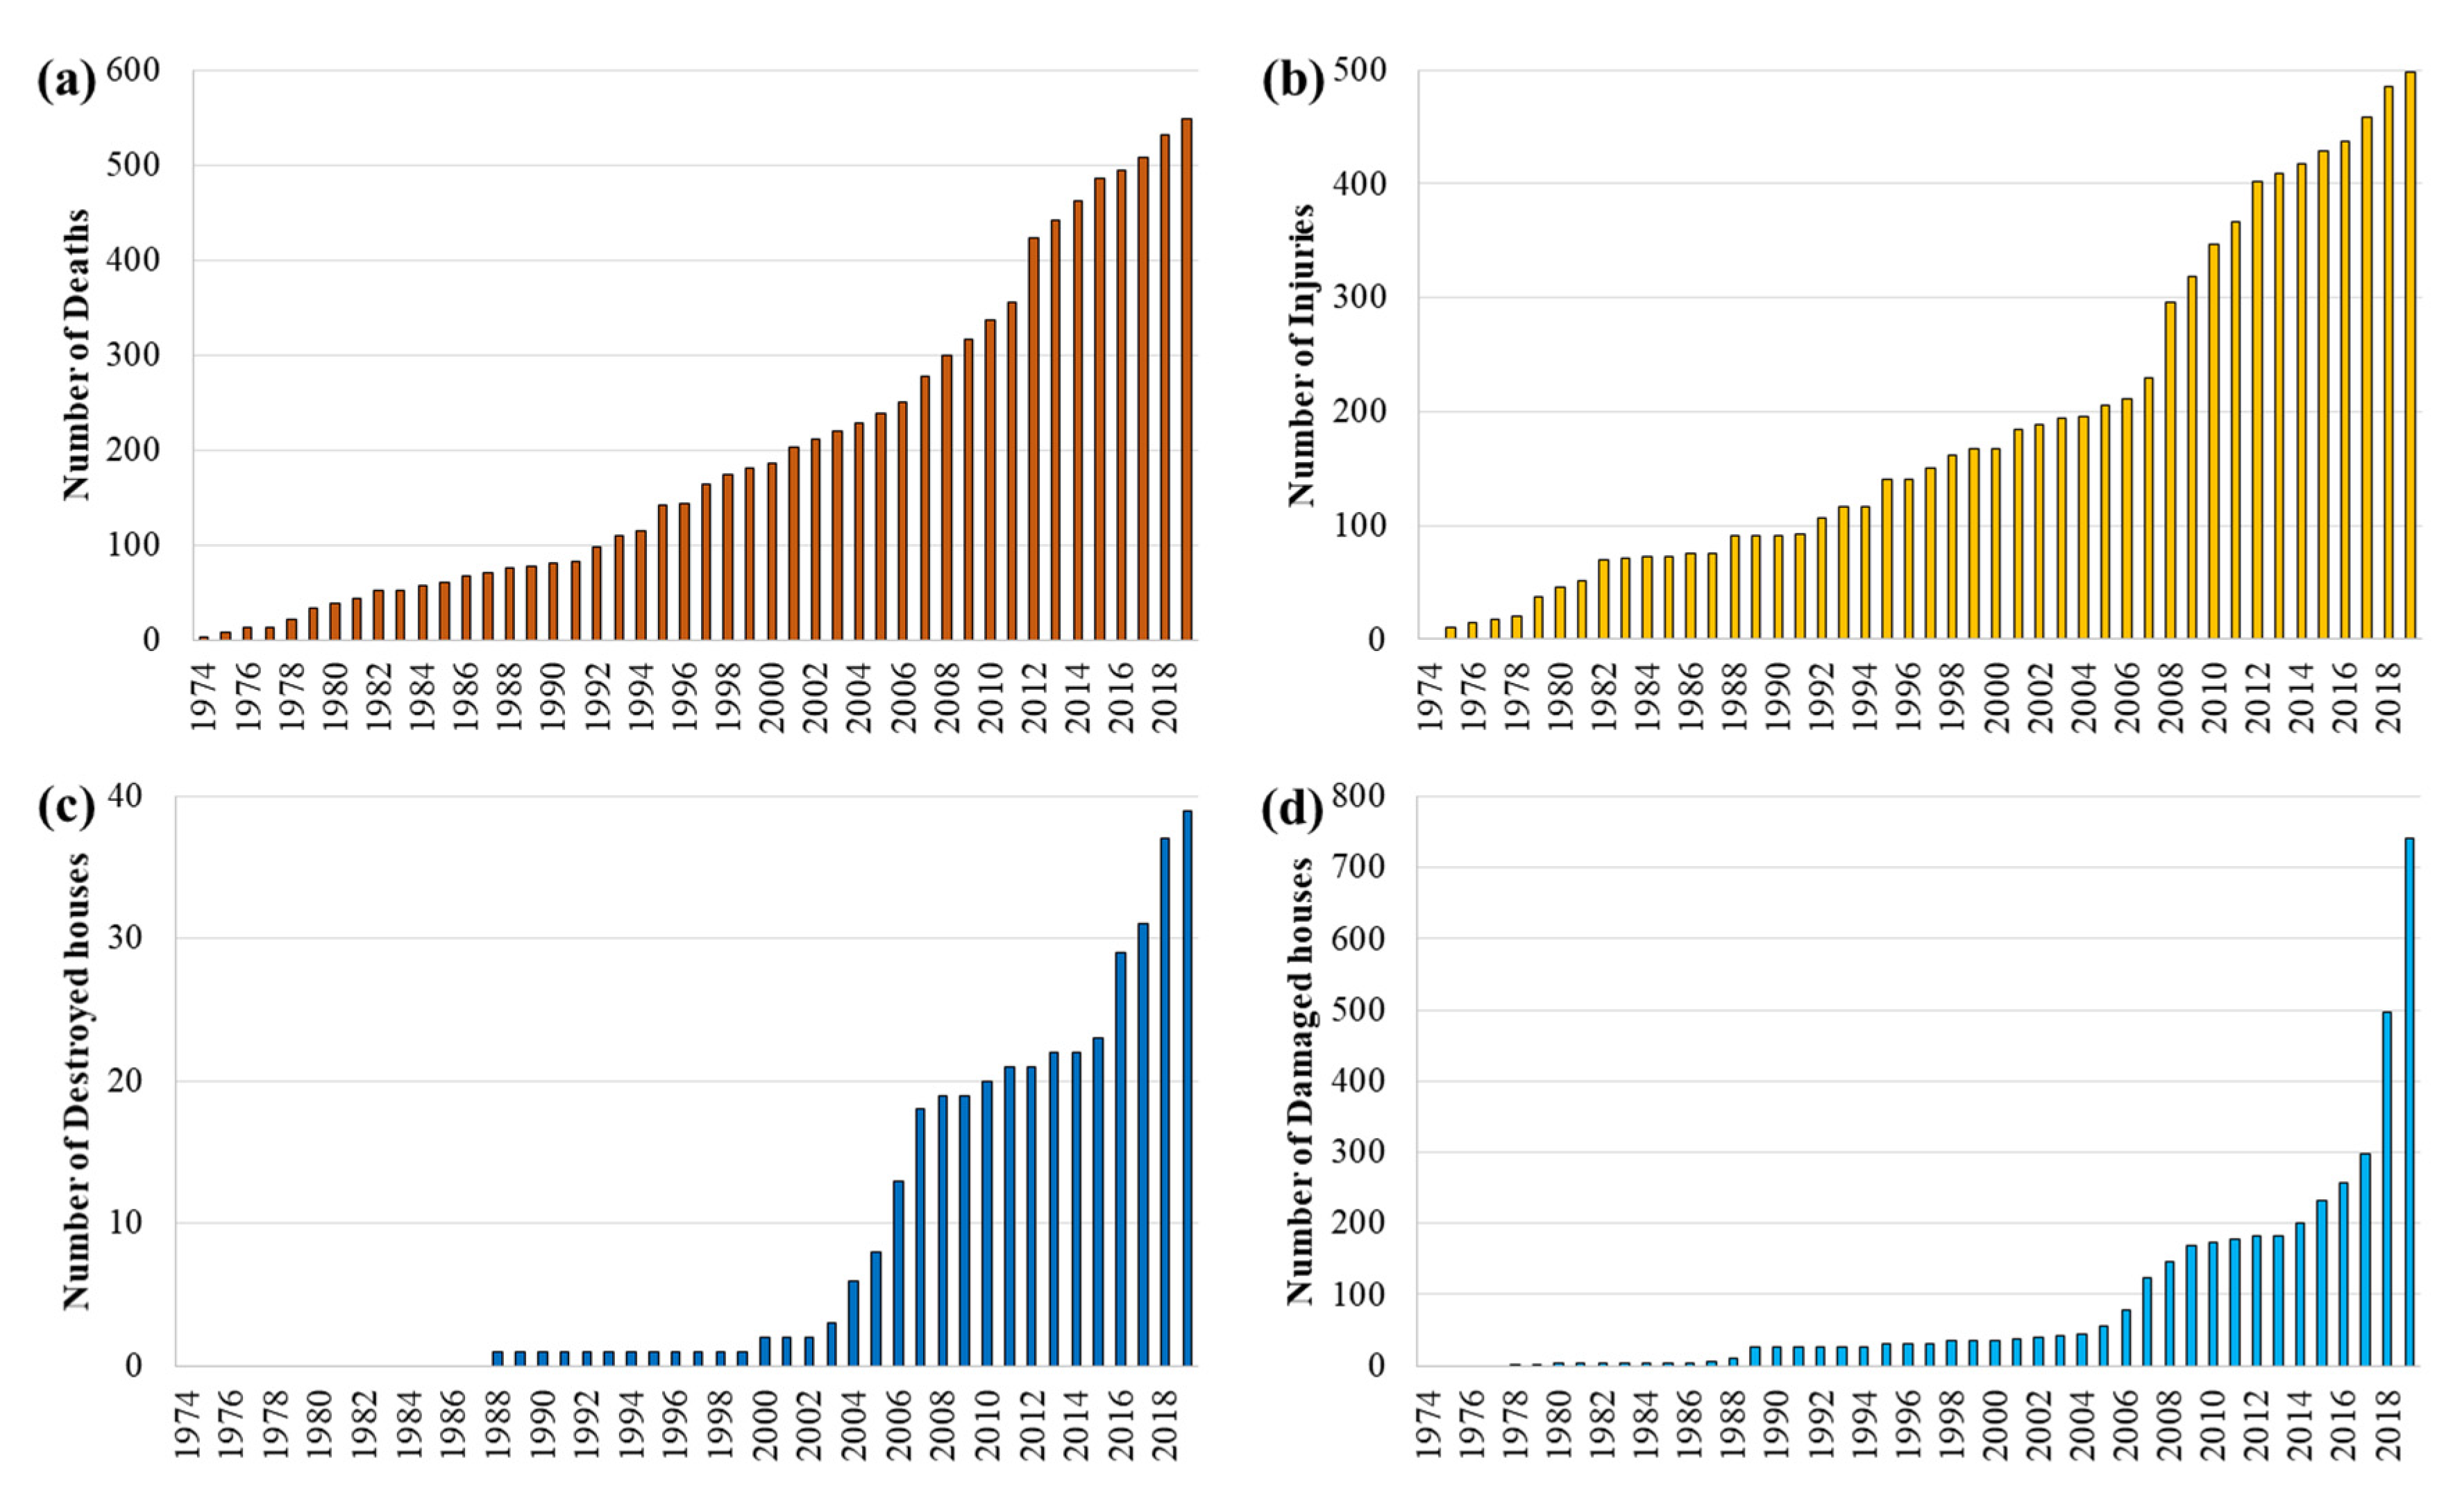
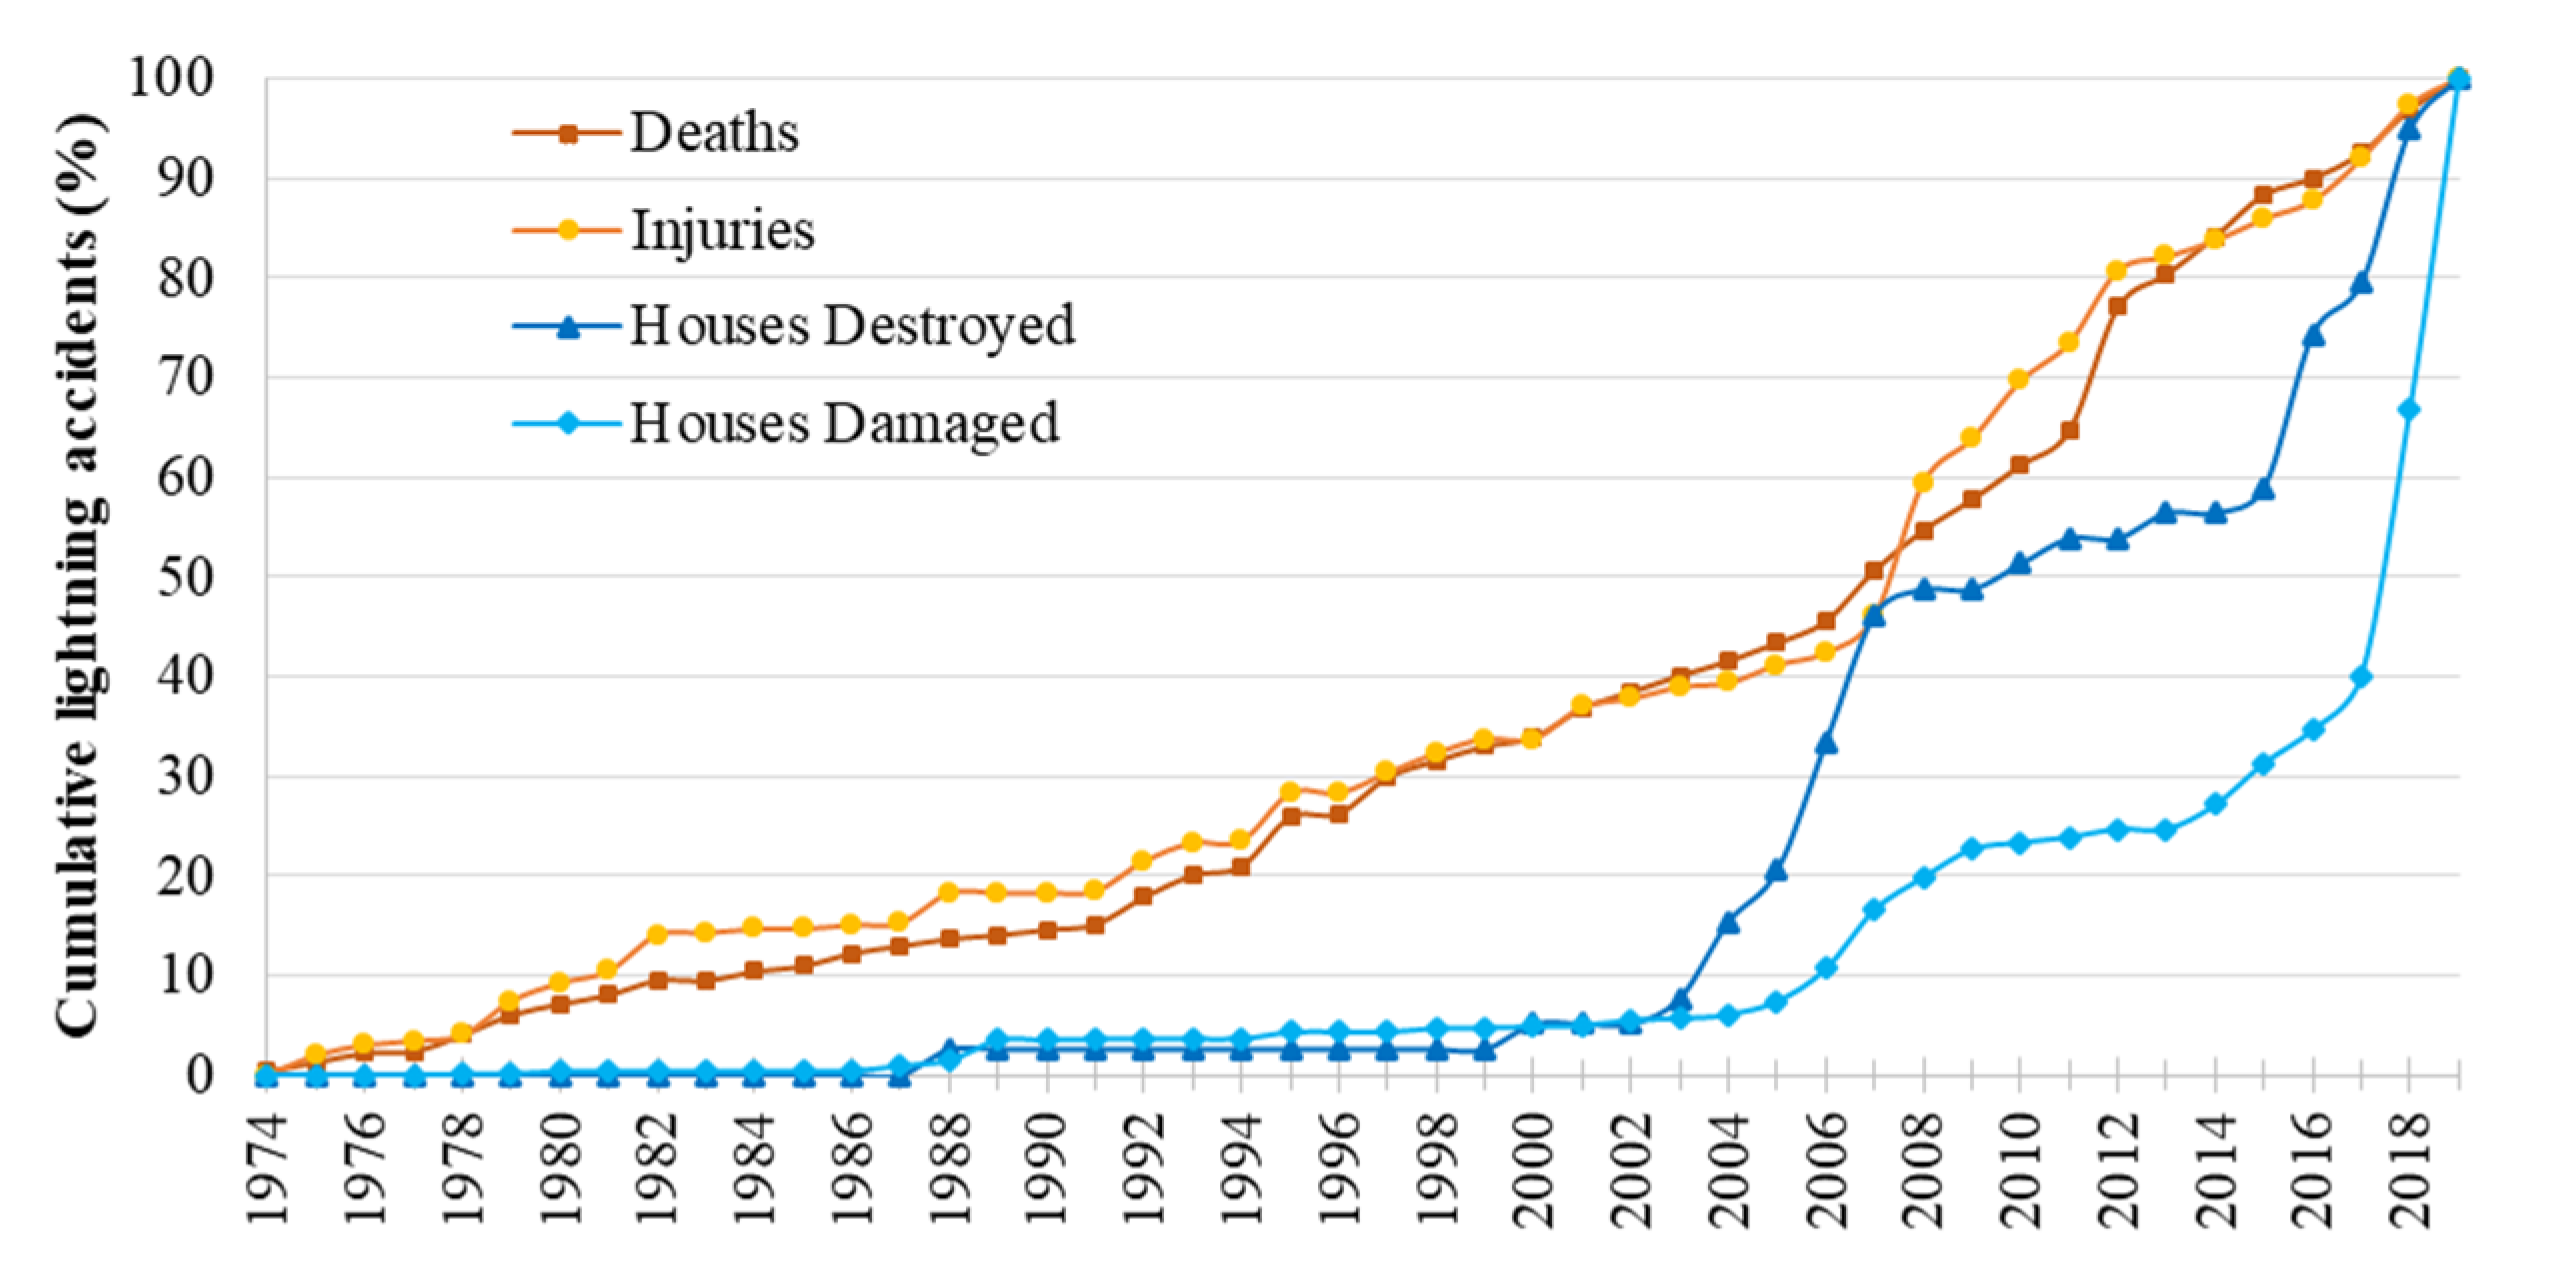
4.1. Temporal Distribution of the Lightning Accidents

Due to the location of the country as an island in the equatorial and tropical zones, the Sri Lankan climate experiences vibrant variations during the 12 months in a year. According to the rainfall profile of Sri Lanka, there are four climate seasons, which classified as two monsoon seasons and two inter-monsoon seasons. The two monsoon seasons are named SWM-southwest monsoon season (May–September) and NEM-northeast monsoon season (December–February), whereas the two inter-monsoon seasons are distinguished as FIM-first inter-monsoon season (March–April) and SIM-second inter-monsoon season (October–November). Table 1 shows the recorded number of deaths, injuries, destroyed houses, and damaged houses due to lightning activity in each AD during all four climate seasons, from 1974 to 2019. Figure 2 shows the distribution of the deaths and injuries due to lightning accidents in Sri Lanka during all four climate seasons, from 1974 to 2019. Figure 3 shows the distribution of damaged houses and destroyed houses due to lightning accidents in Sri Lanka during all four climate seasons, from 1974 to 2019. Stated below are the important observations that were extracted by referring to Figure 2 and Figure 3.
During the first inter-monsoon season, from 1974 to 2019, there were 22 deaths; 20 deaths were recorded in AD 17 and AD 16, respectively, and the maximum number of lightning injuries was recorded in AD 8, with a maximum record of 64 injuries. The maximum number of both destroyed and damaged houses due to lightning was recorded in AD 16 during this season.
Moreover, in AD 3, AD 4, AD 5, AD 6, AD 8, AD 9, AD 10, and AD 13, there were no recorded incidents regarding destroyed and damaged houses due to lightning activities in the first inter-monsoon season during the considered period. In the southwest monsoon season, from 1974 to 2019, the maximum number of deaths—19 deaths—was recorded in AD 8, and the second maximum of 16 deaths due to lightning accidents was recorded in AD 22. There were no deaths recorded in AD 11 and AD 20 for this season. Furthermore, the maximum and second maximum of 34 and 21 injuries due to lightning accidents were recorded in AD 16 and AD 18, respectively, and there were no injuries recorded in AD 11 and AD 5 in the southwest monsoon season during the considered period. There were 113 houses damaged in AD 16, and four destroyed houses were recorded in AD 8 during the southwest monsoon season from 1974 to 2019, whereas, in both AD 3 and AD 12, there were no recorded events of destroyed and damaged houses.
During the second inter-monsoon season, from 1974 to 2019, 14 deaths and 12 deaths were recorded in AD 17 and AD 15, respectively, and the maximum number of lightning injuries was recorded in AD 21, with a maximum record of 13 injuries followed by 12 injuries in AD 4 and AD15. The maximum number of damaged and destroyed houses due to lightning accidents in this season was recorded in AD 16 and AD 14, with 117 damaged houses and 6 destroyed houses, respectively. Moreover, AD 2, AD 6, AD 7, AD 10, AD 11, and AD 13 had no recorded incidents regarding destroyed and damaged houses due to lightning accidents. A maximum number of 10 deaths, and a second maximum of eight deaths were recorded in AD 25 and AD 23, respectively, during the northeast monsoon season, with a maximum record of 12 injuries recorded in AD 20. The maximum number of six damaged houses due to lightning accidents was recorded in AD 5 in this season. Meanwhile, only two administrative districts (AD 5 and AD 15) recorded destroyed houses in this season. In AD 2, AD 4, AD 9, AD 11, AD 12, AD 13, and AD 19, there were no recorded incidents regarding lightning accidents for people or houses in the northeast monsoon season during the considered period.

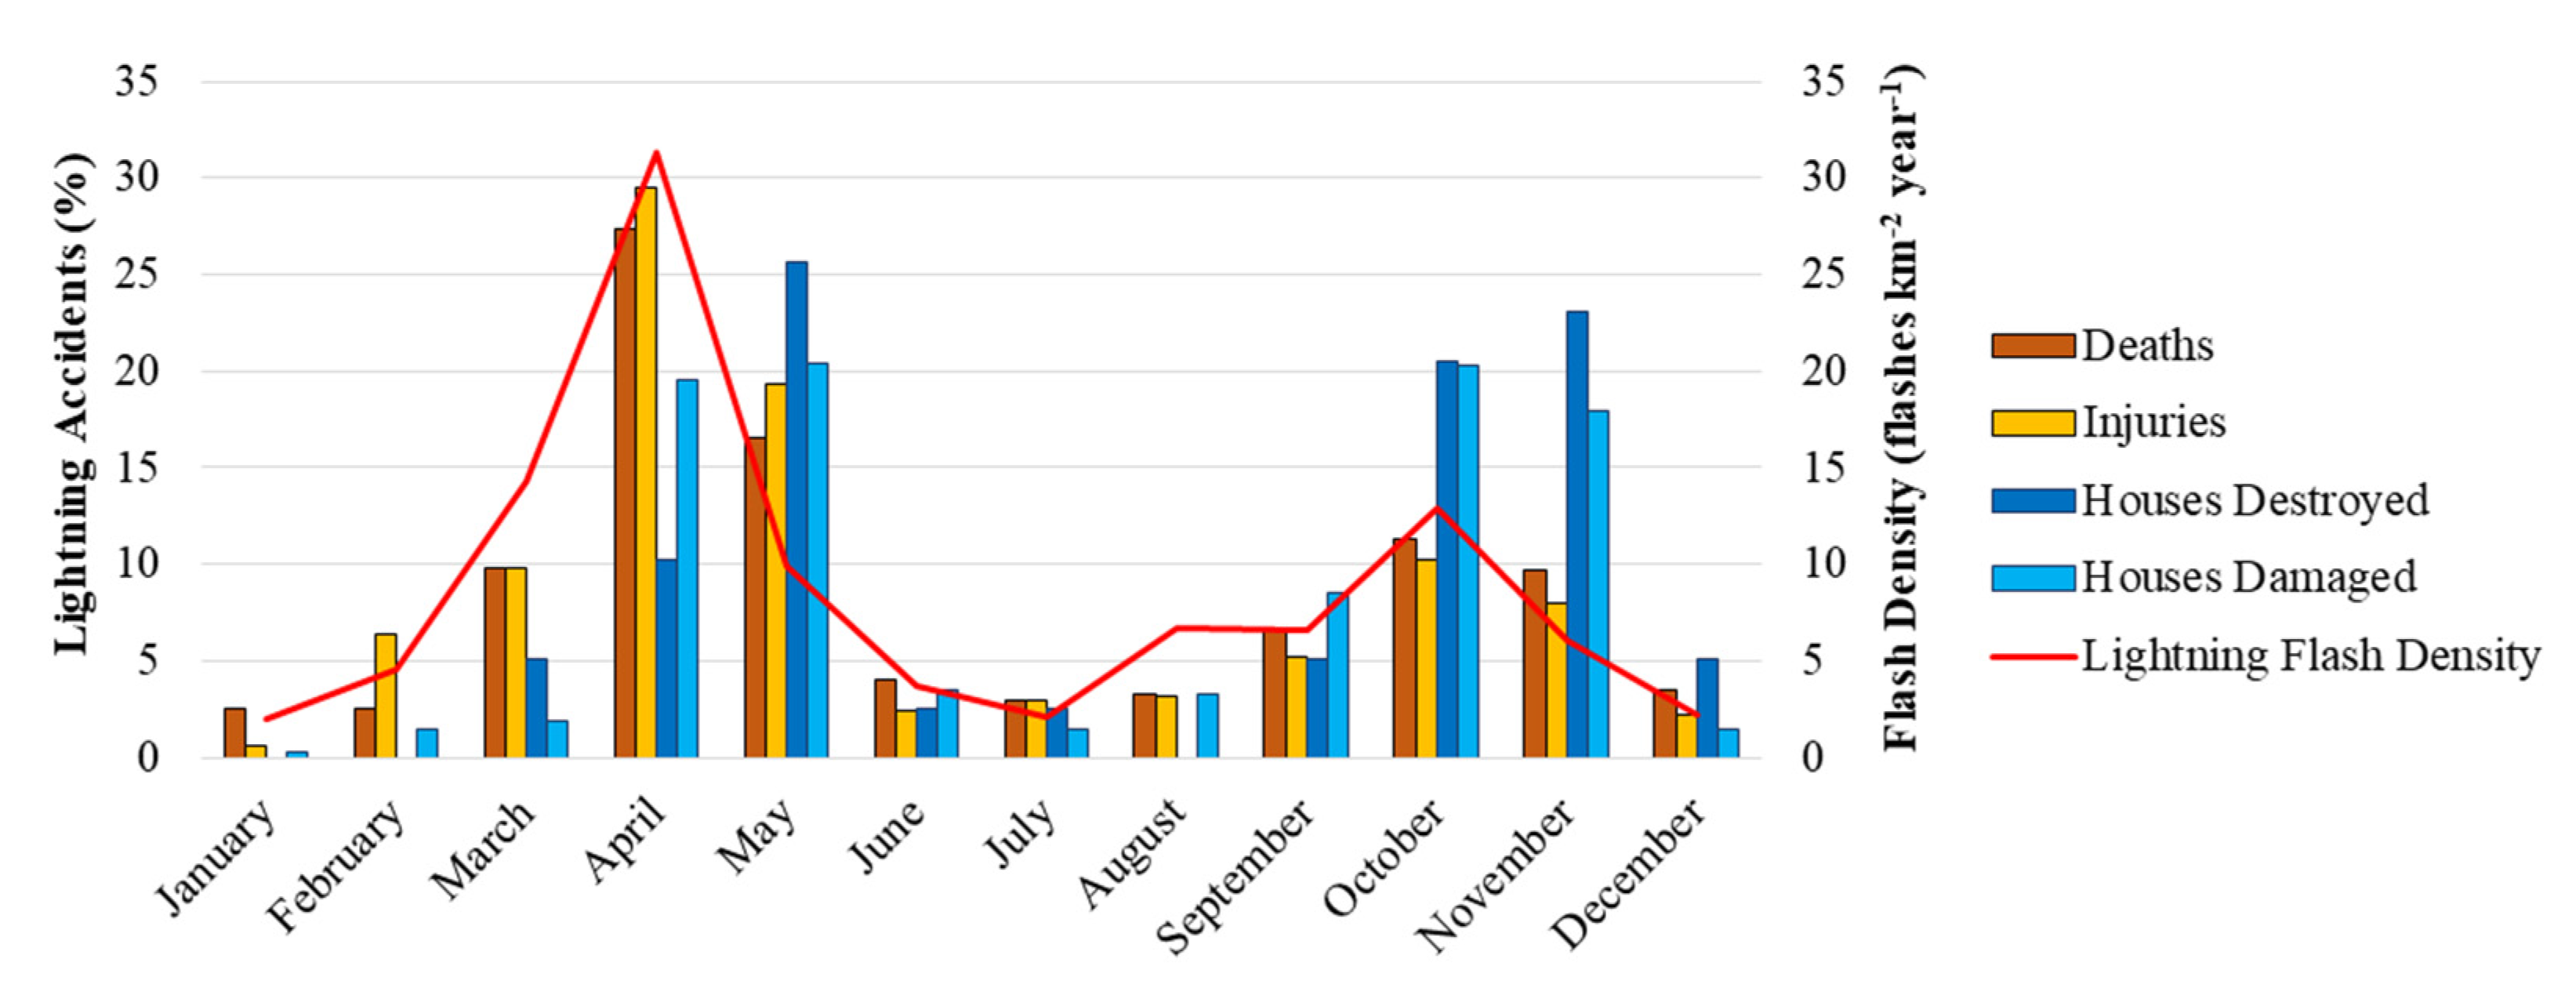
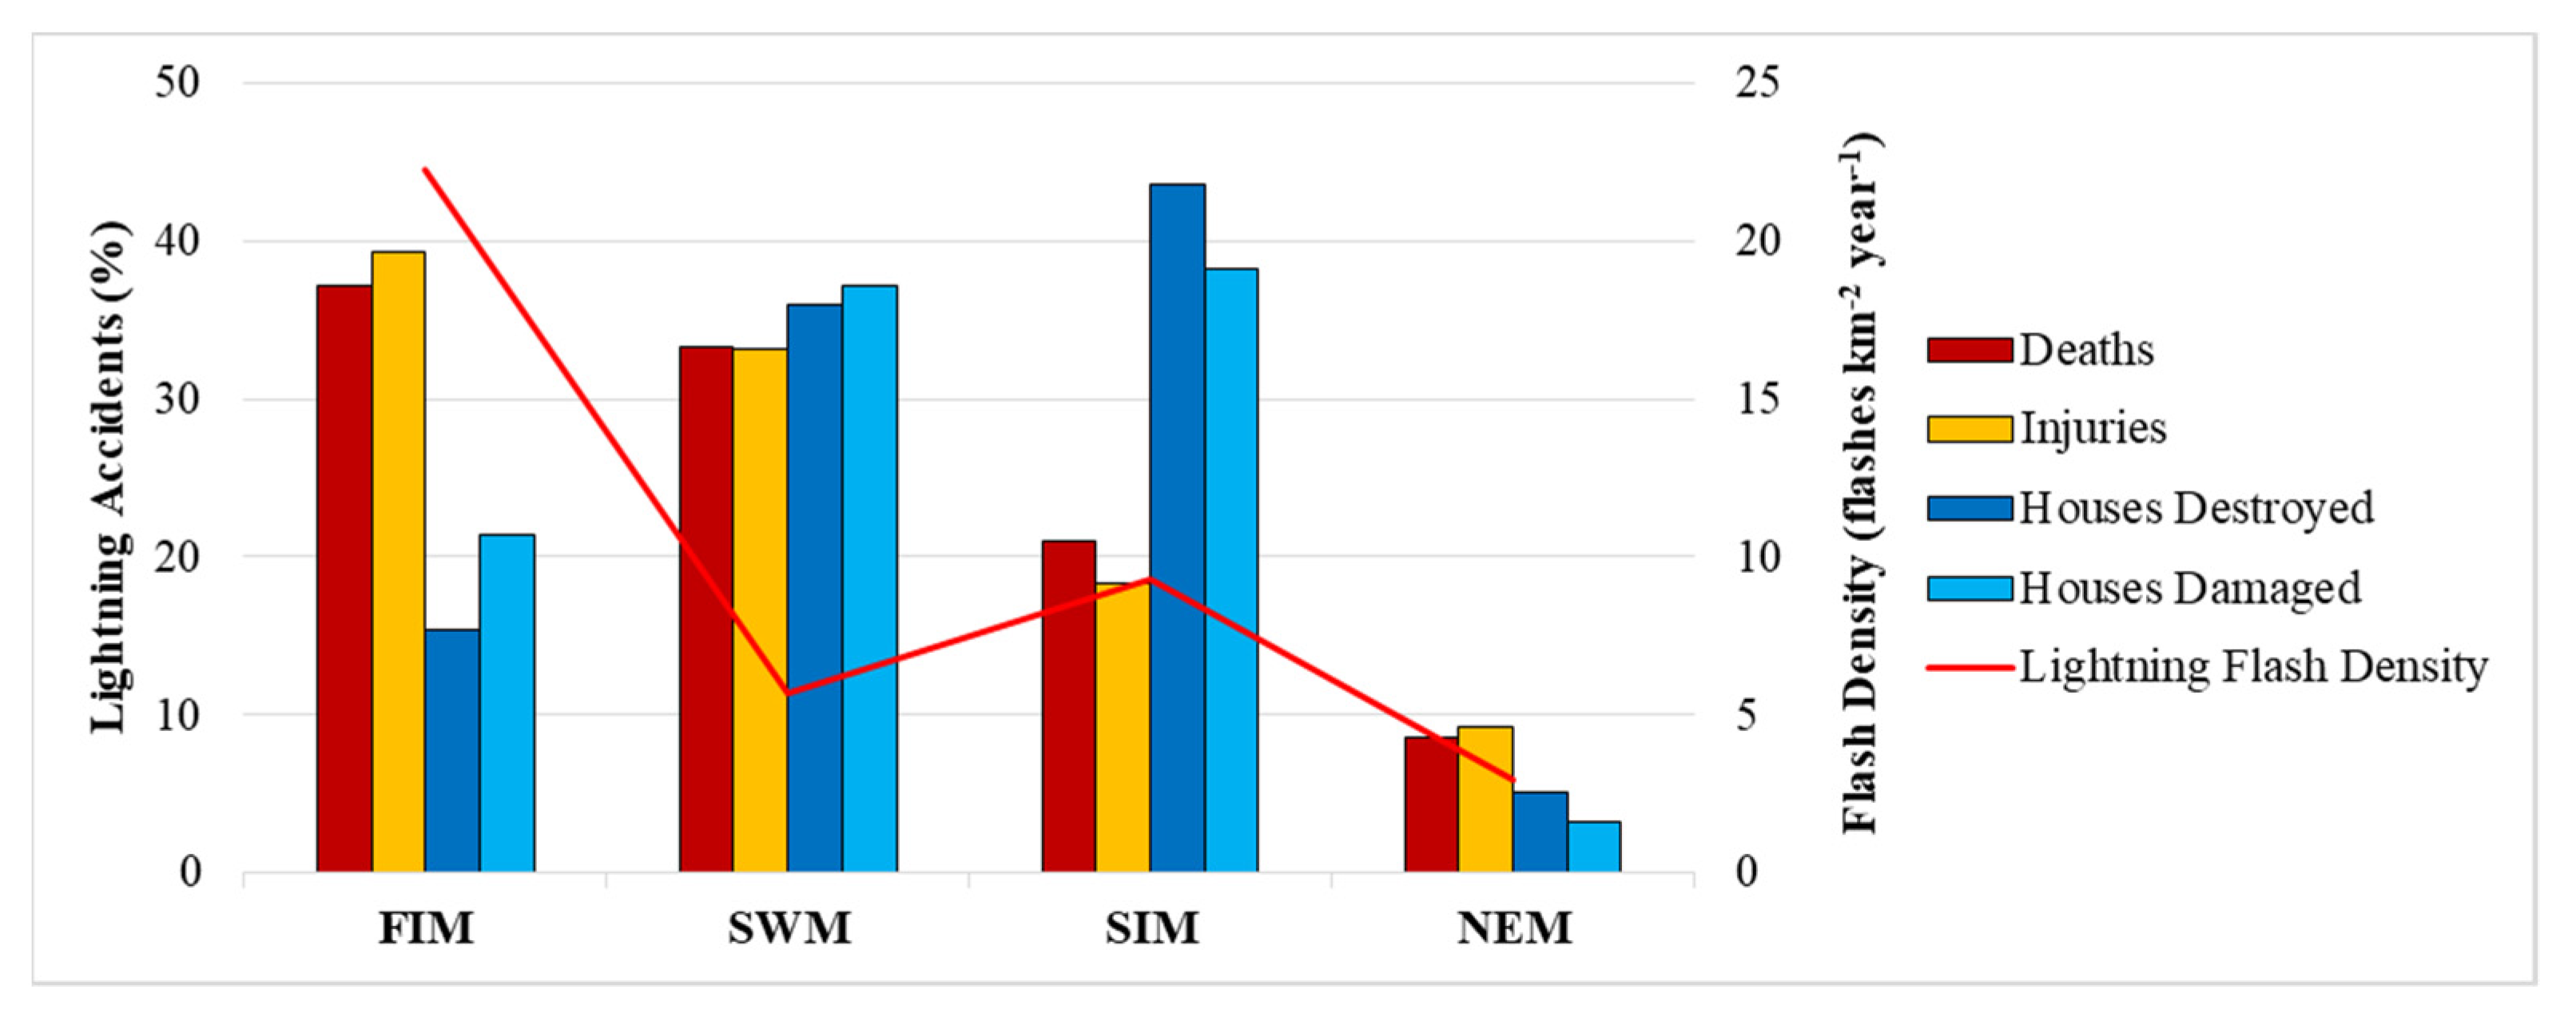
4.2. Monthly Variation of Lightning Accidents

Previous studies have shown that, in Sri Lanka, the maximum number of lightning activities occur in April, followed by the months of March, May, September, and October, which have more accidents than the other months in the year [7,10,11,12]. Table 2 shows the monthly variation of the number of deaths, injuries, destroyed houses, and damaged houses due to lightning accidents in Sri Lanka from 1974 to 2019.
Figure 4 illustrates a graphical overview of the monthly variation of the information tabulated 180 in Table 2.

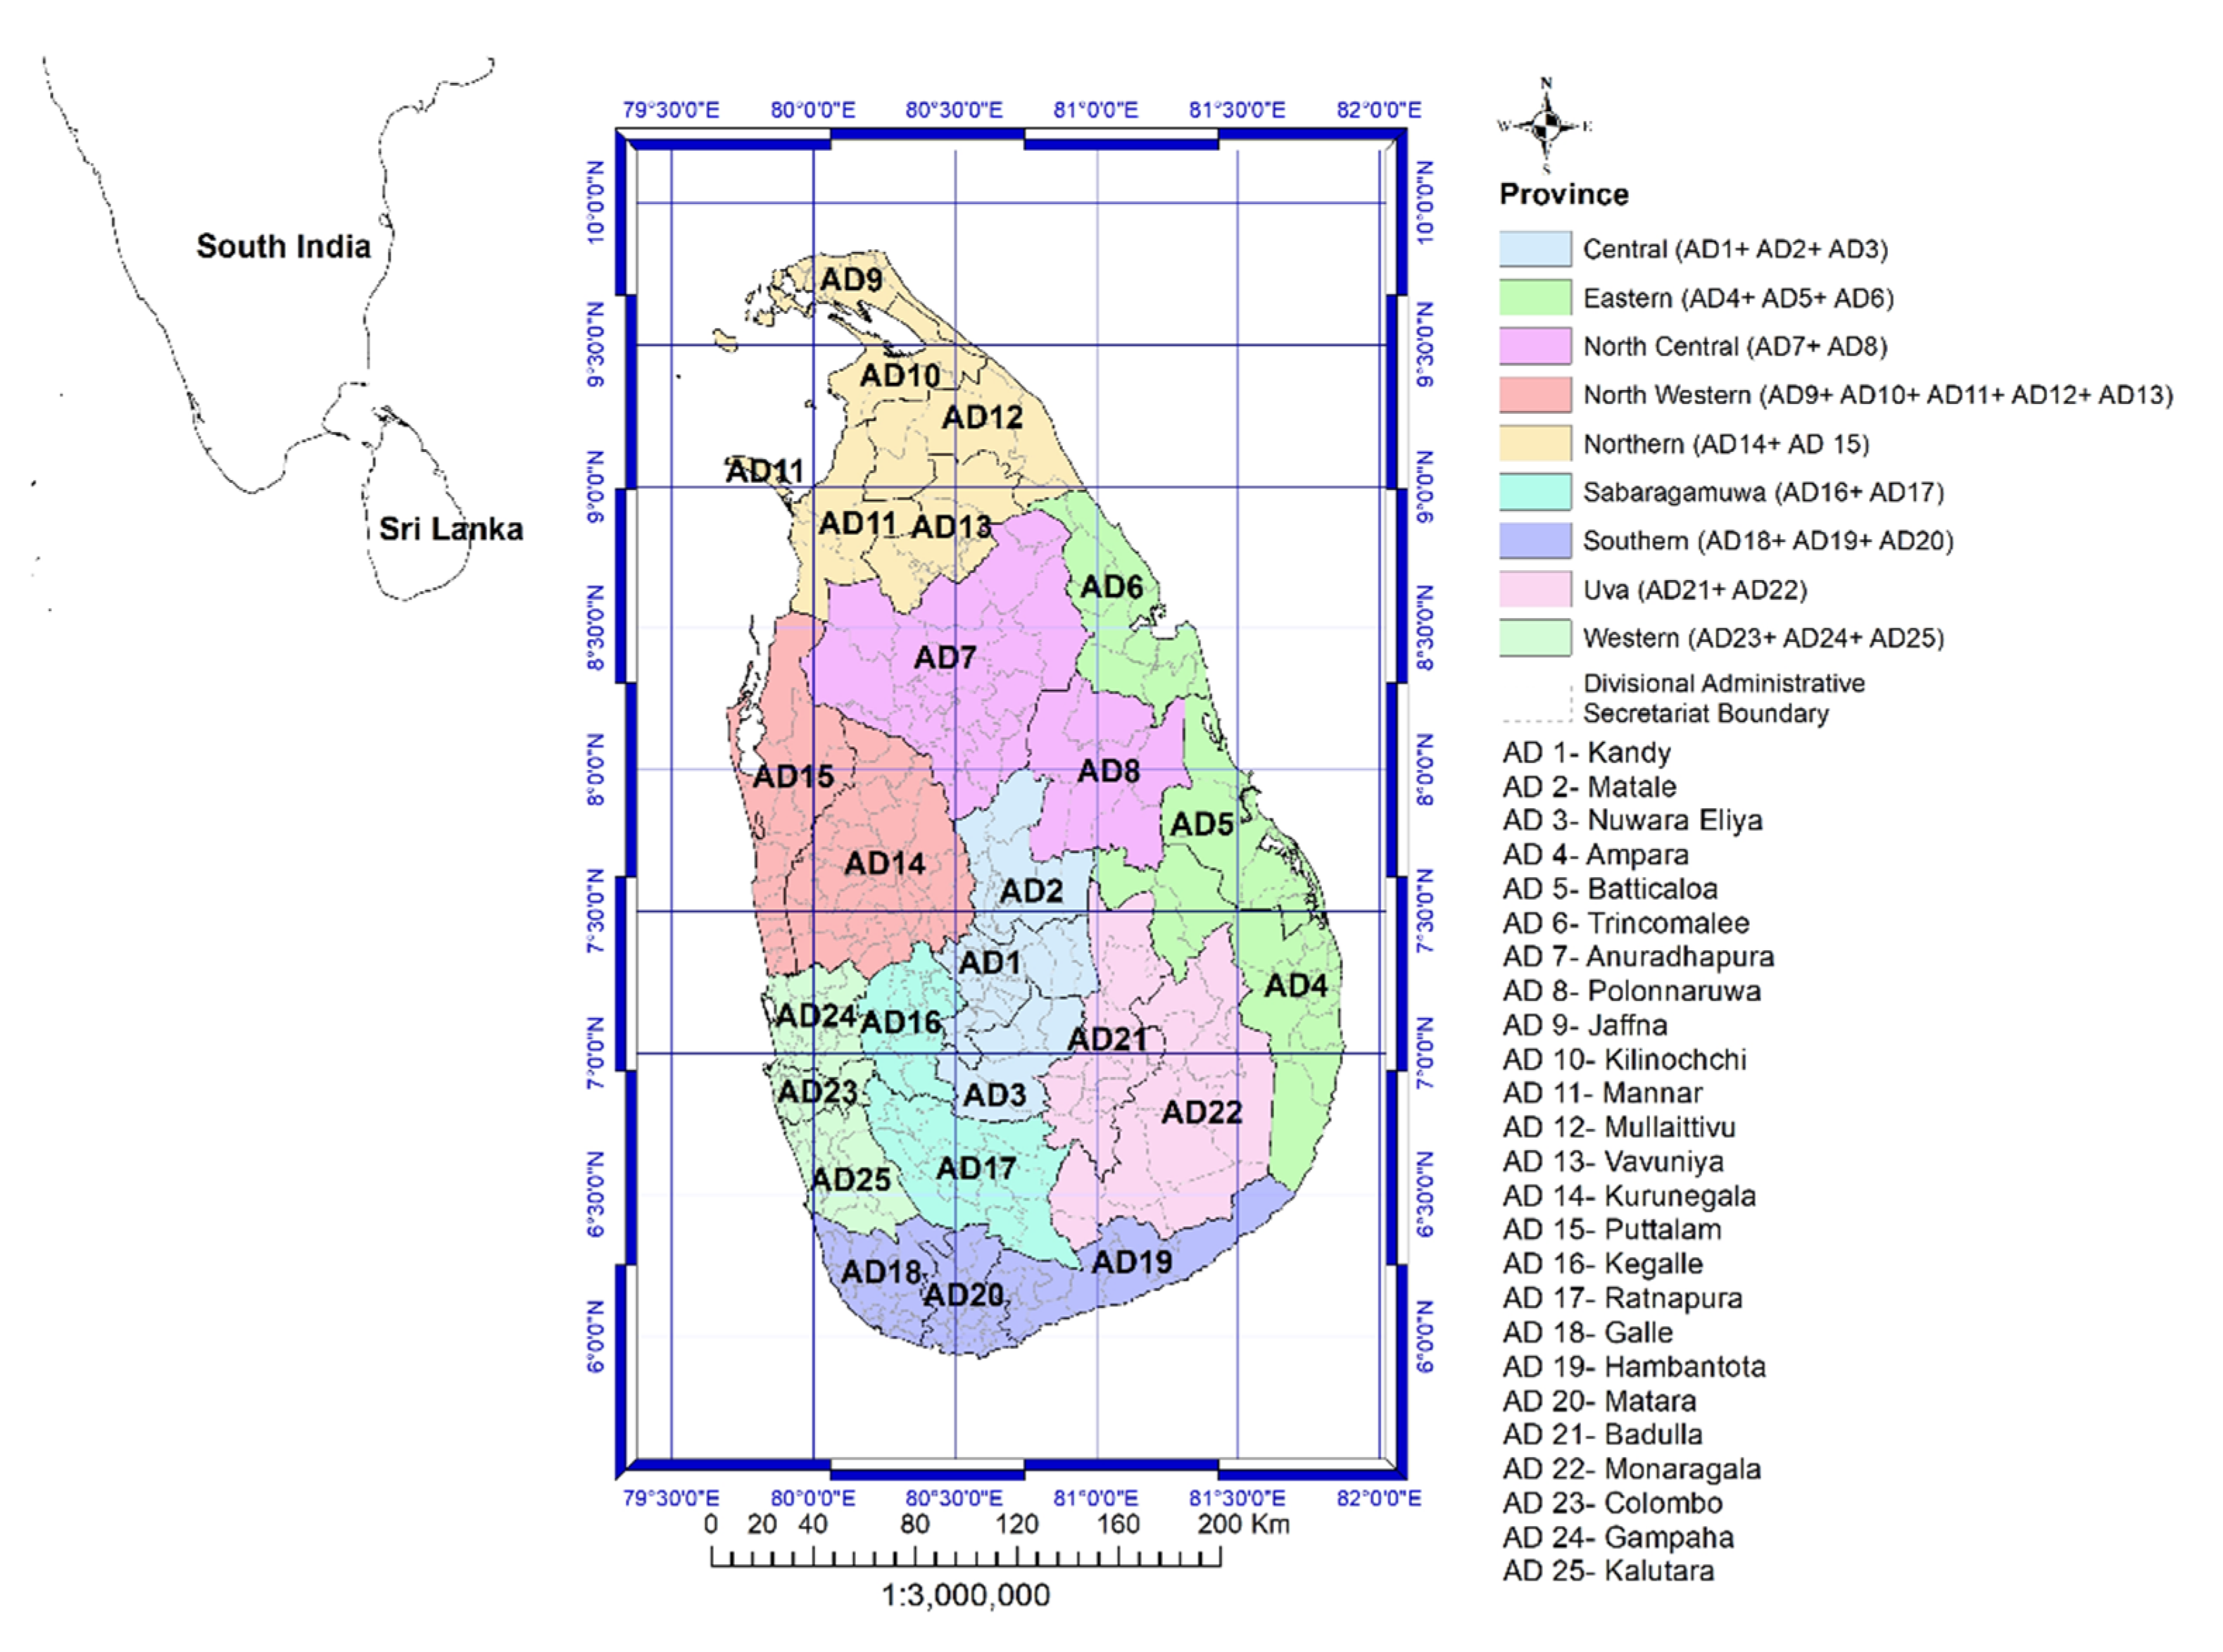
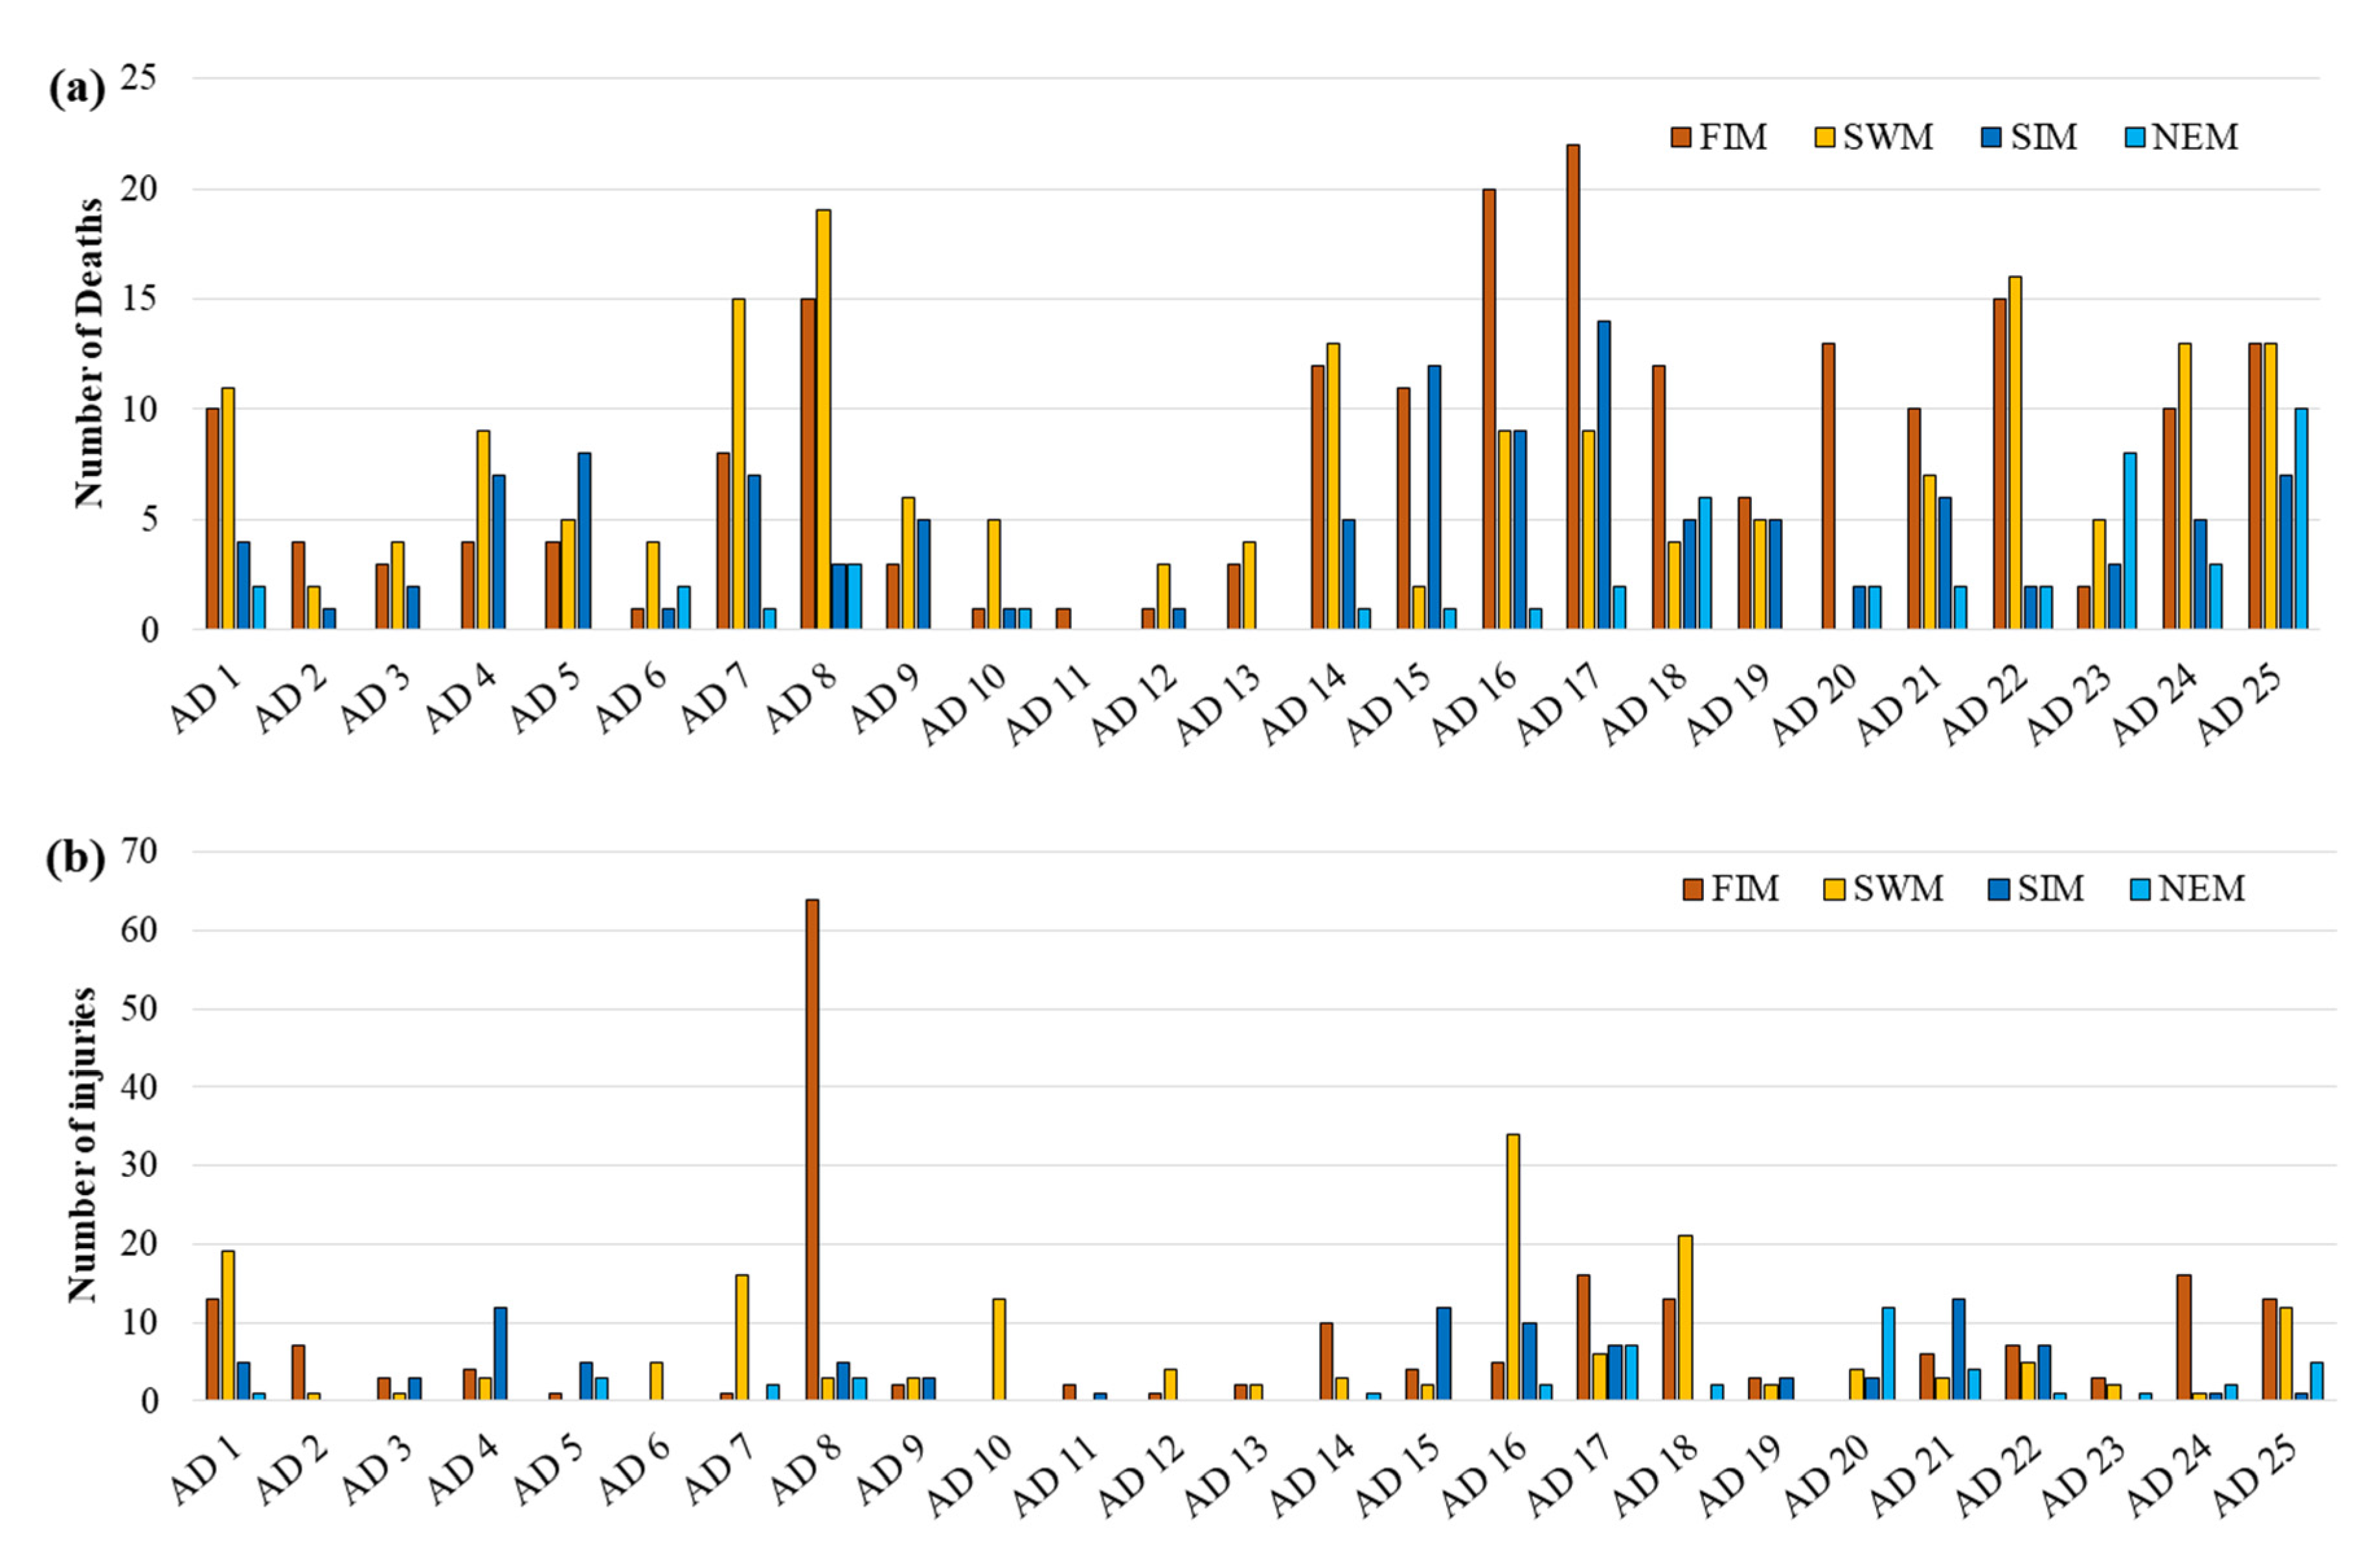
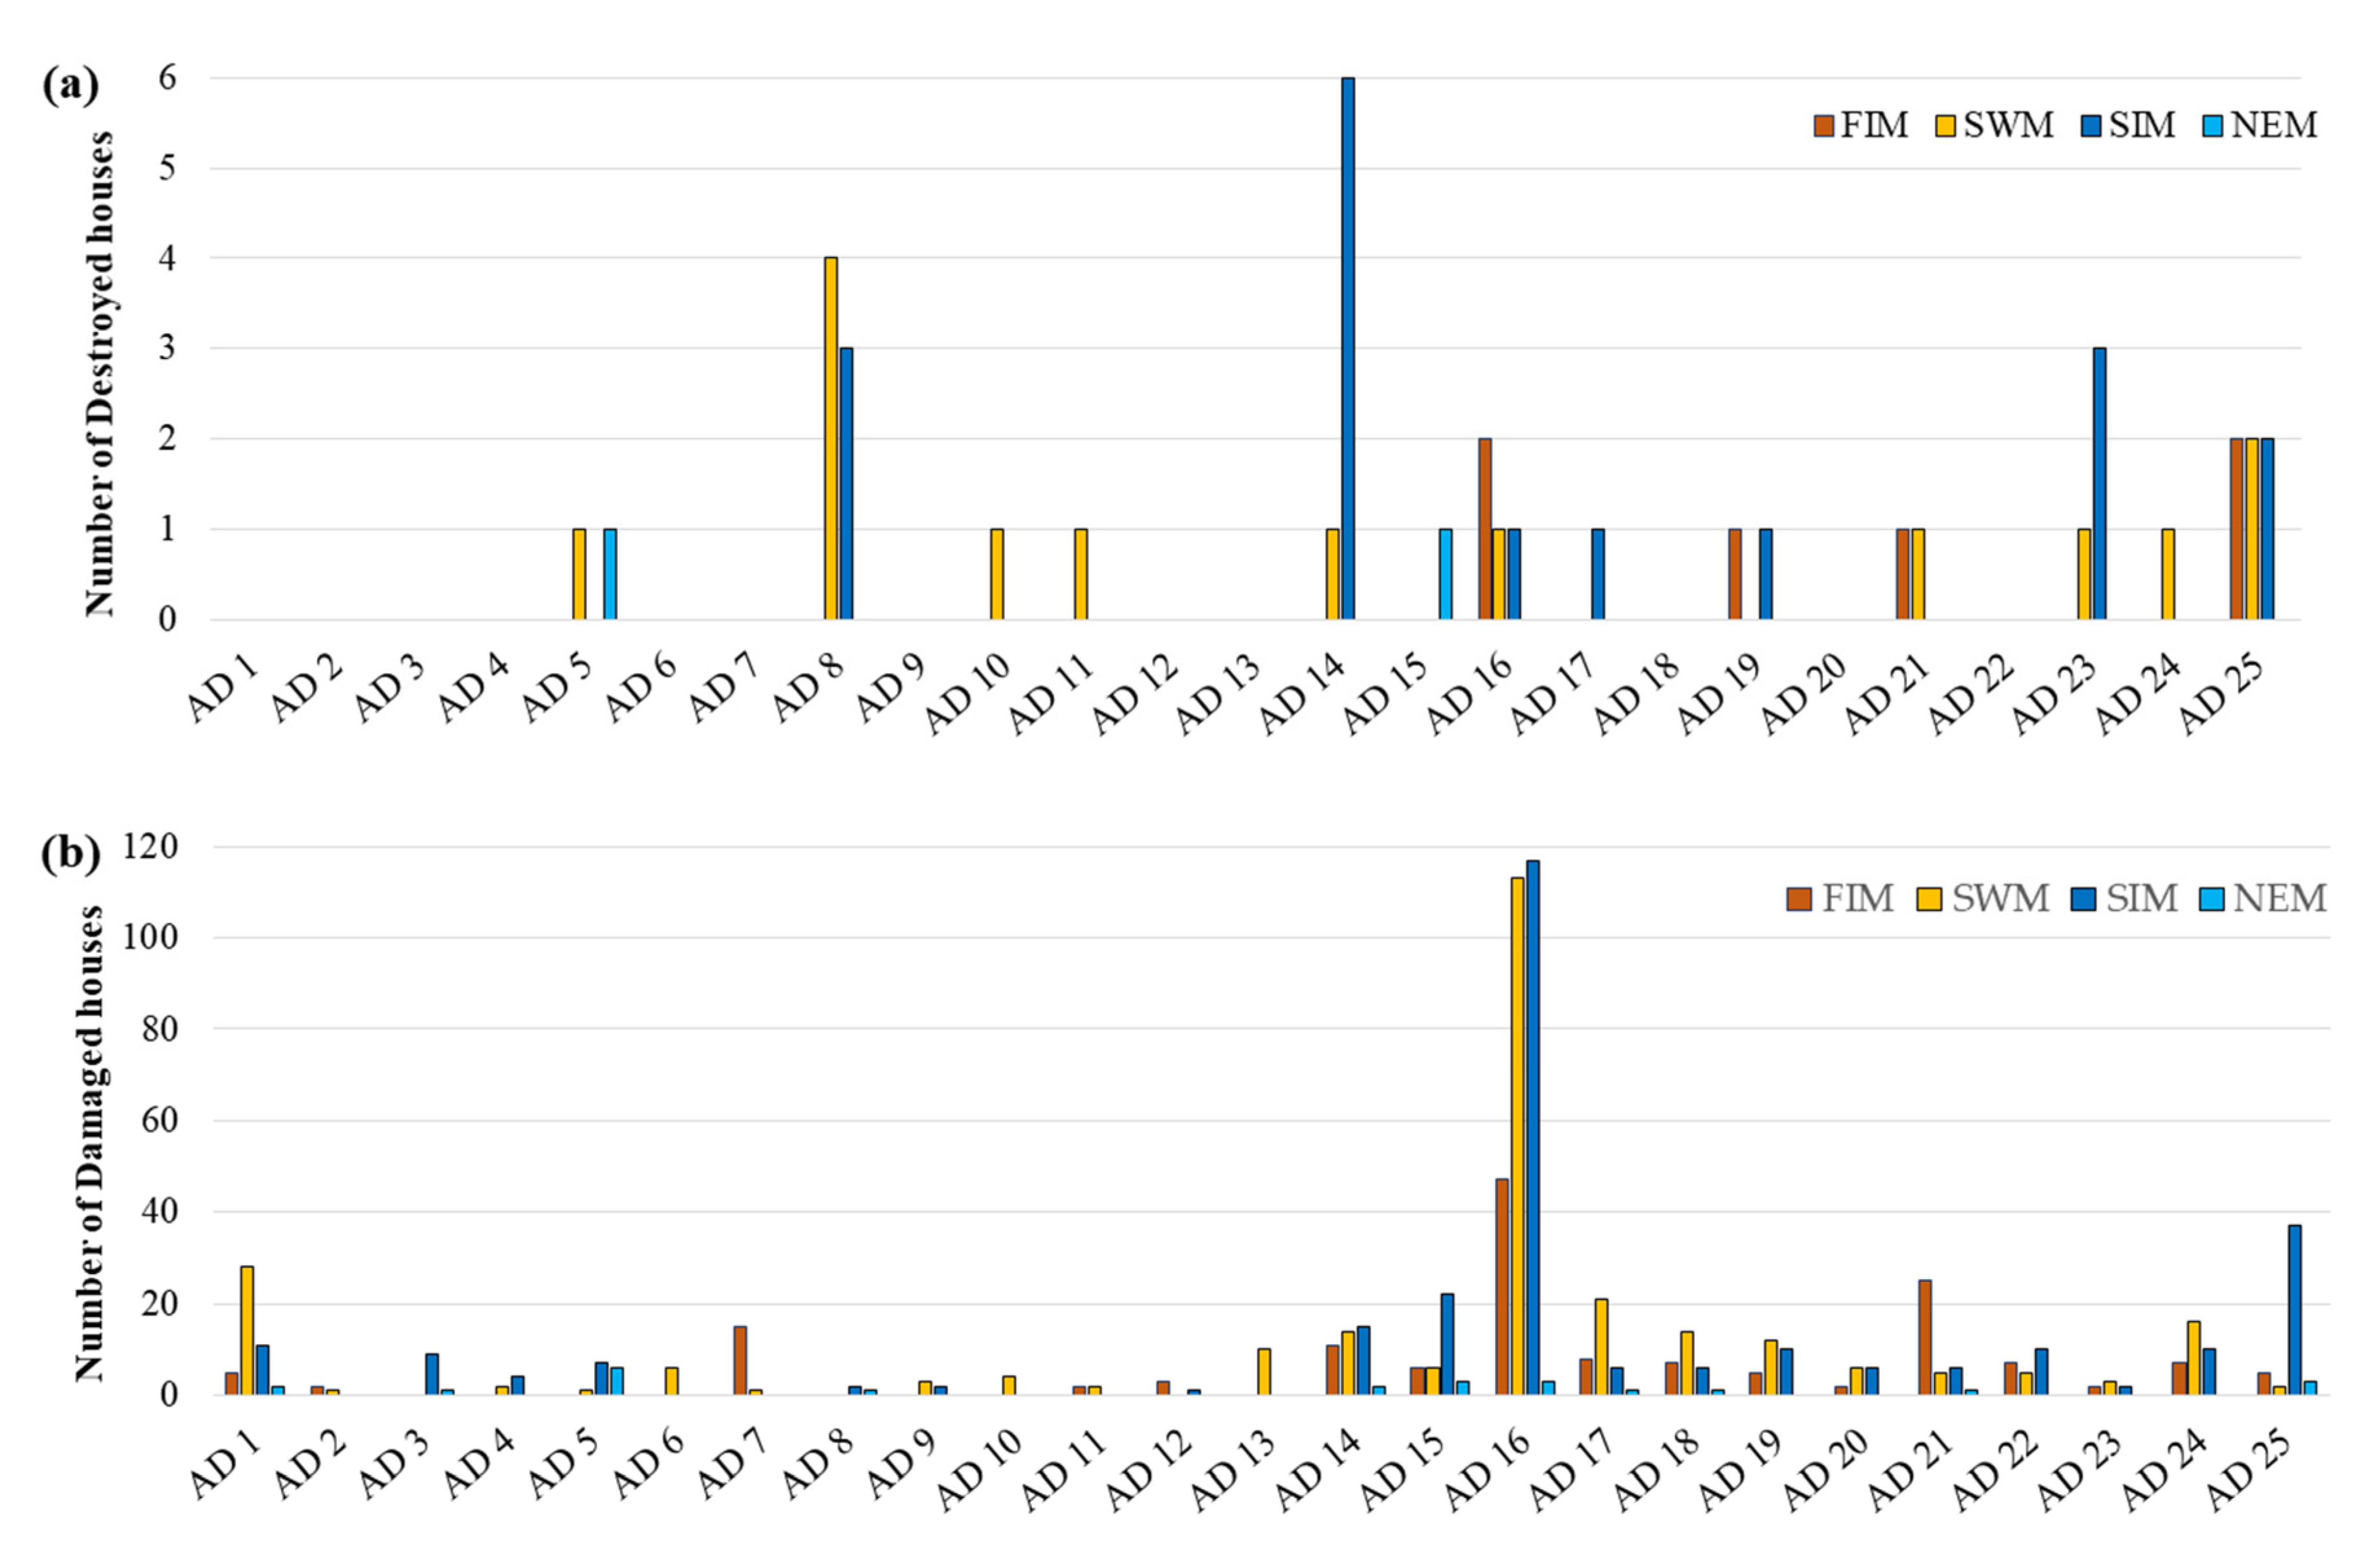
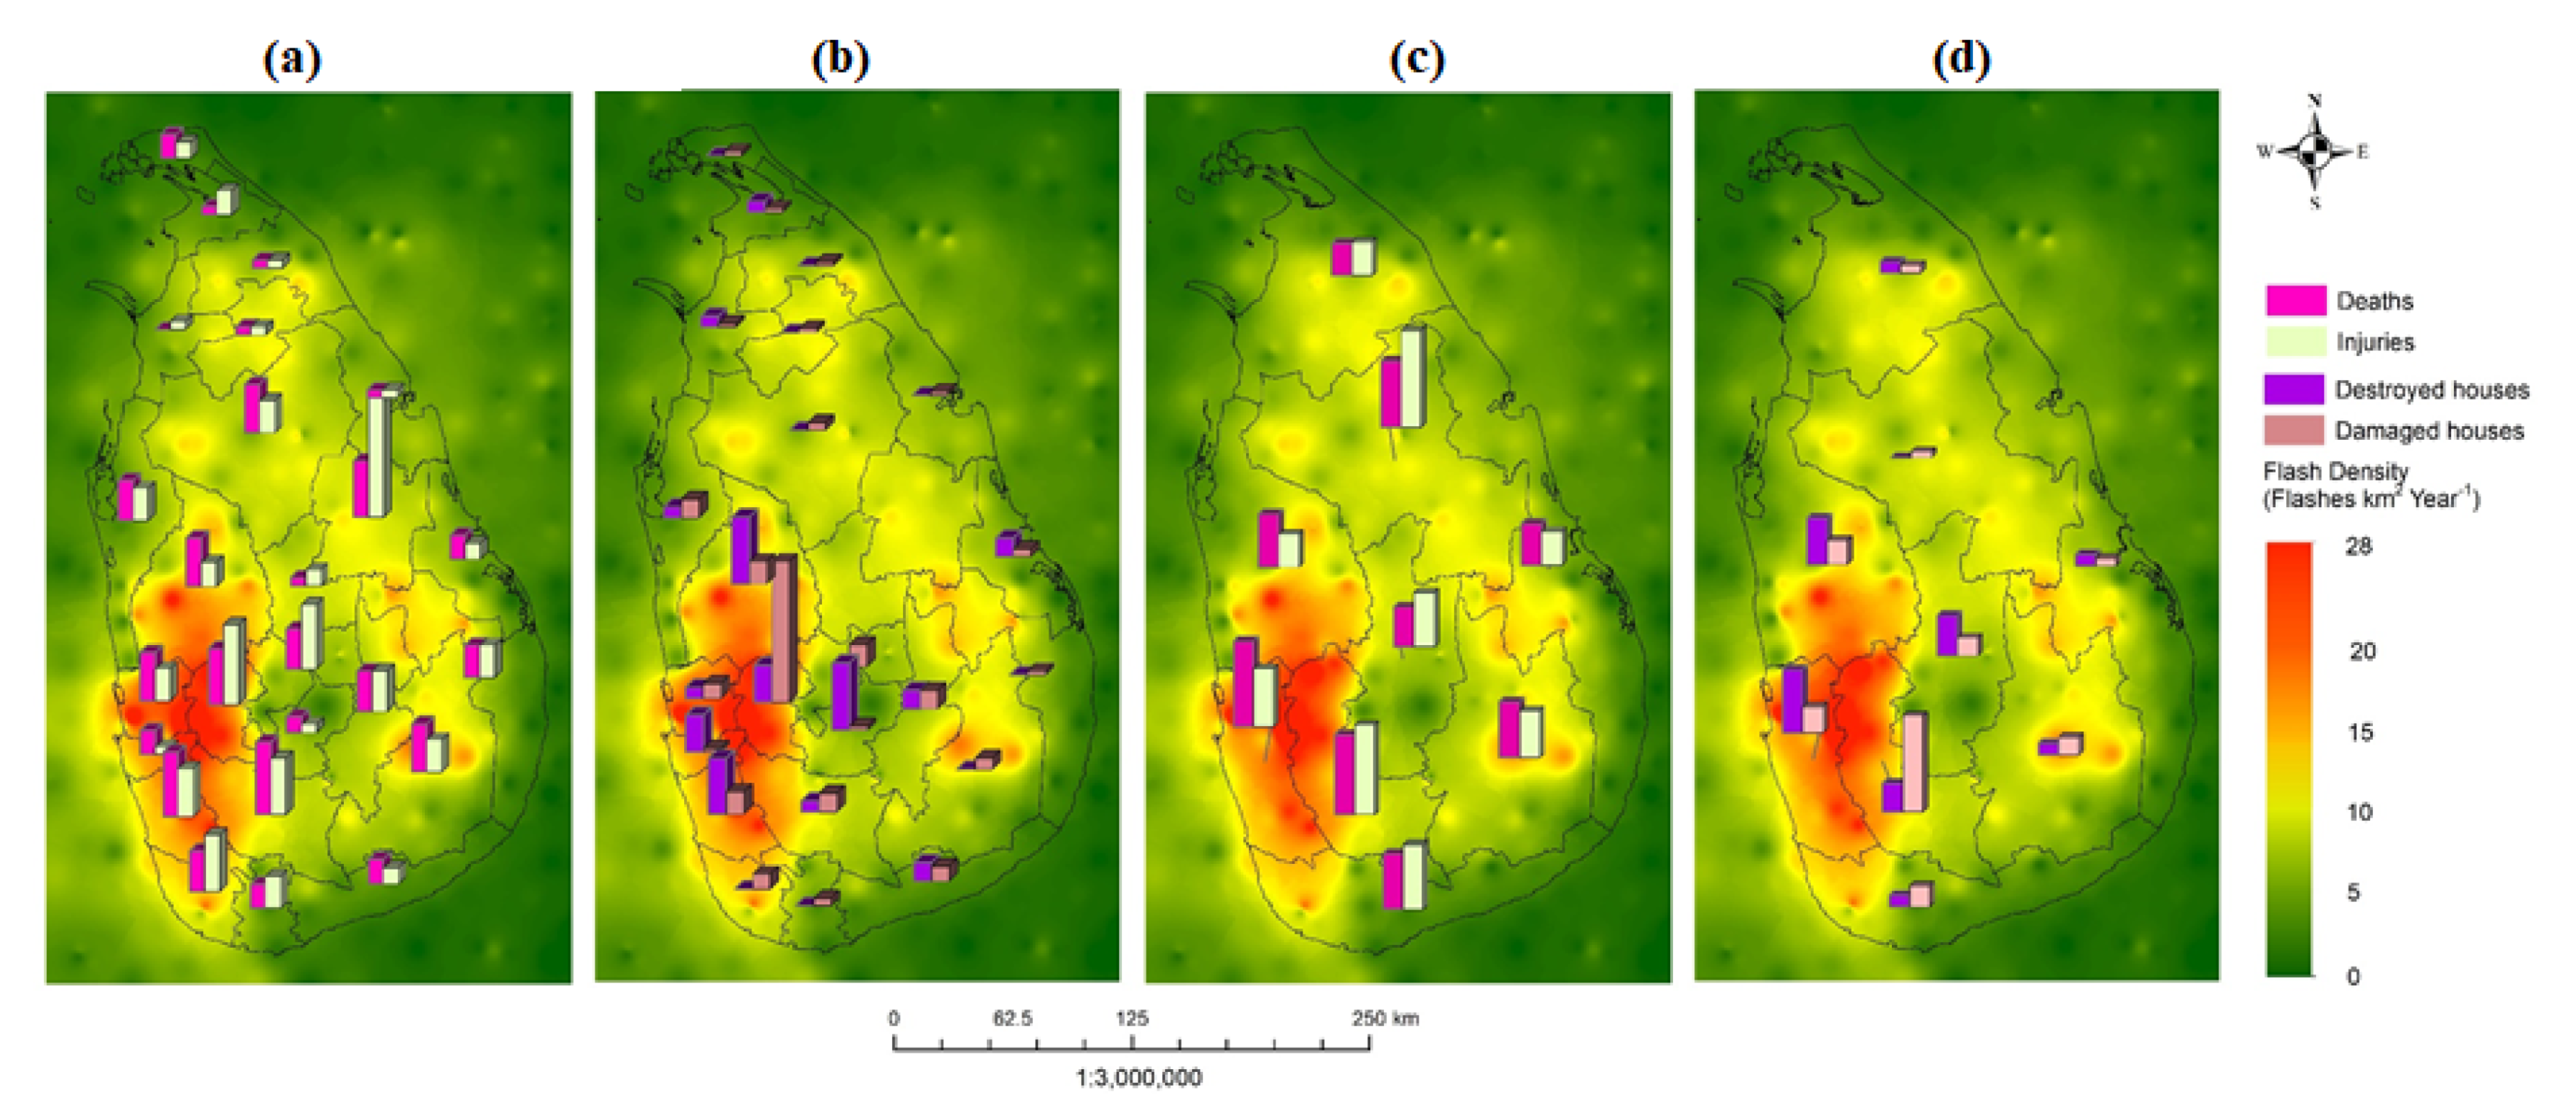
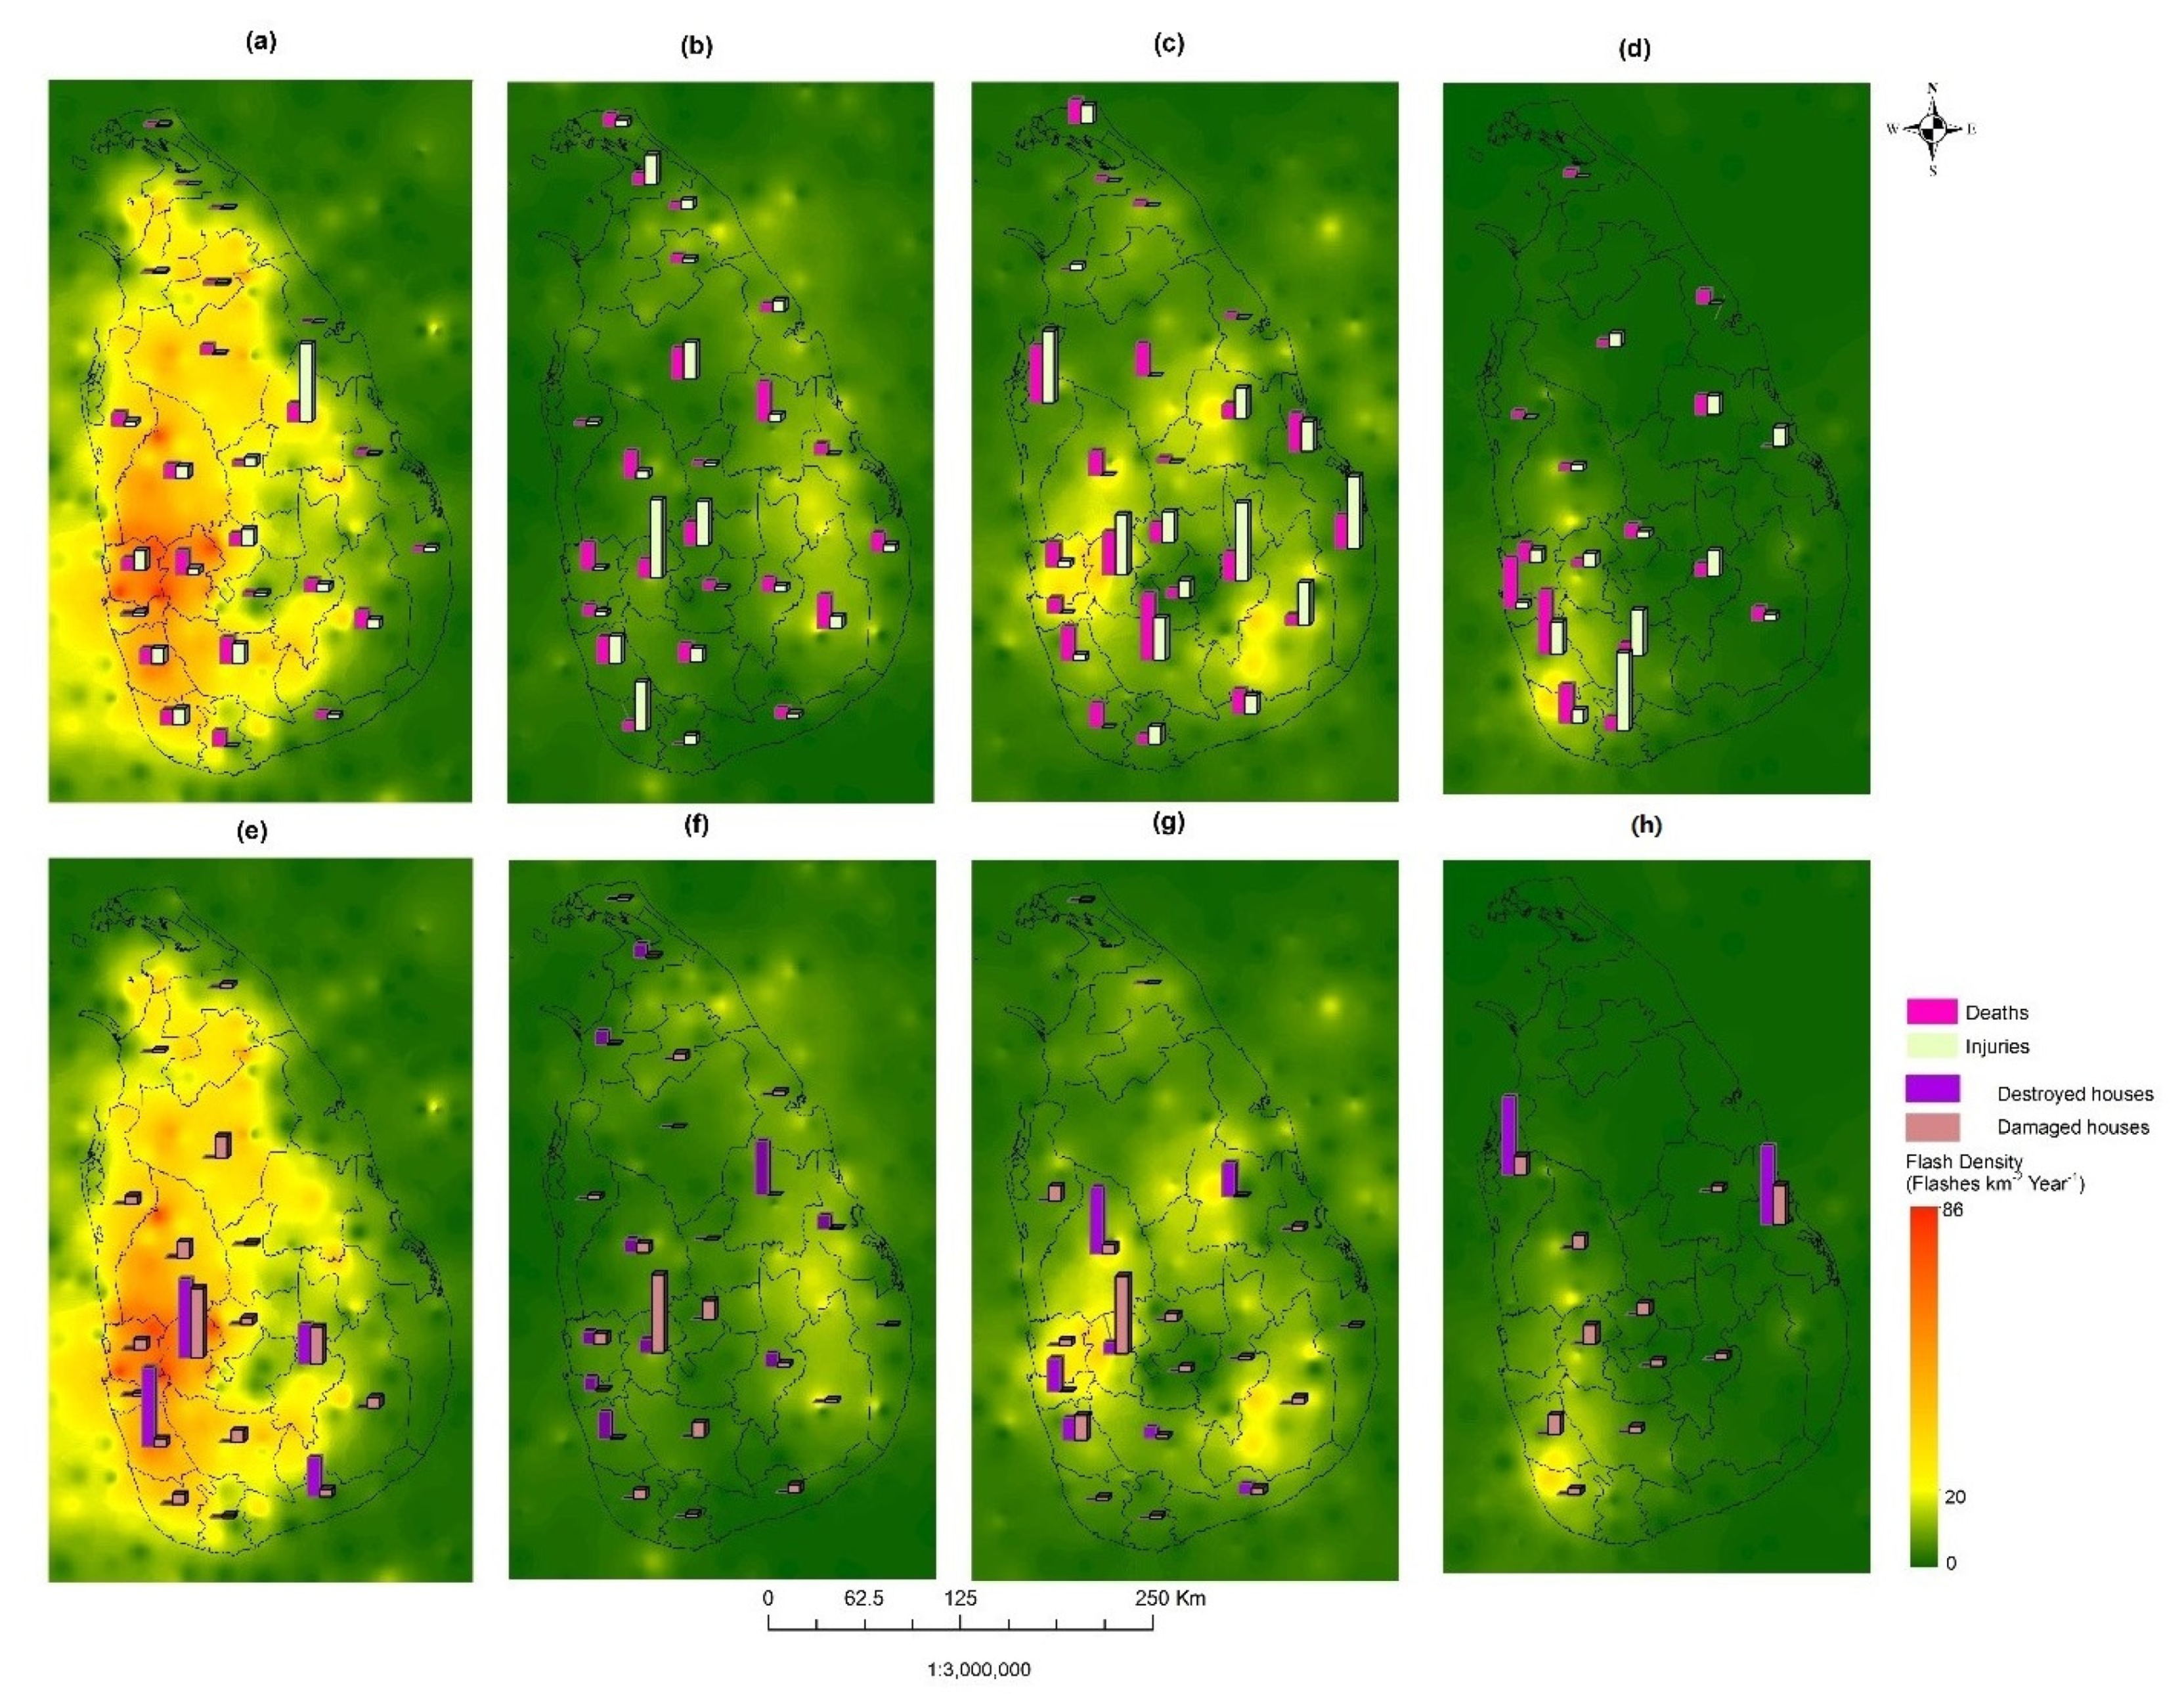
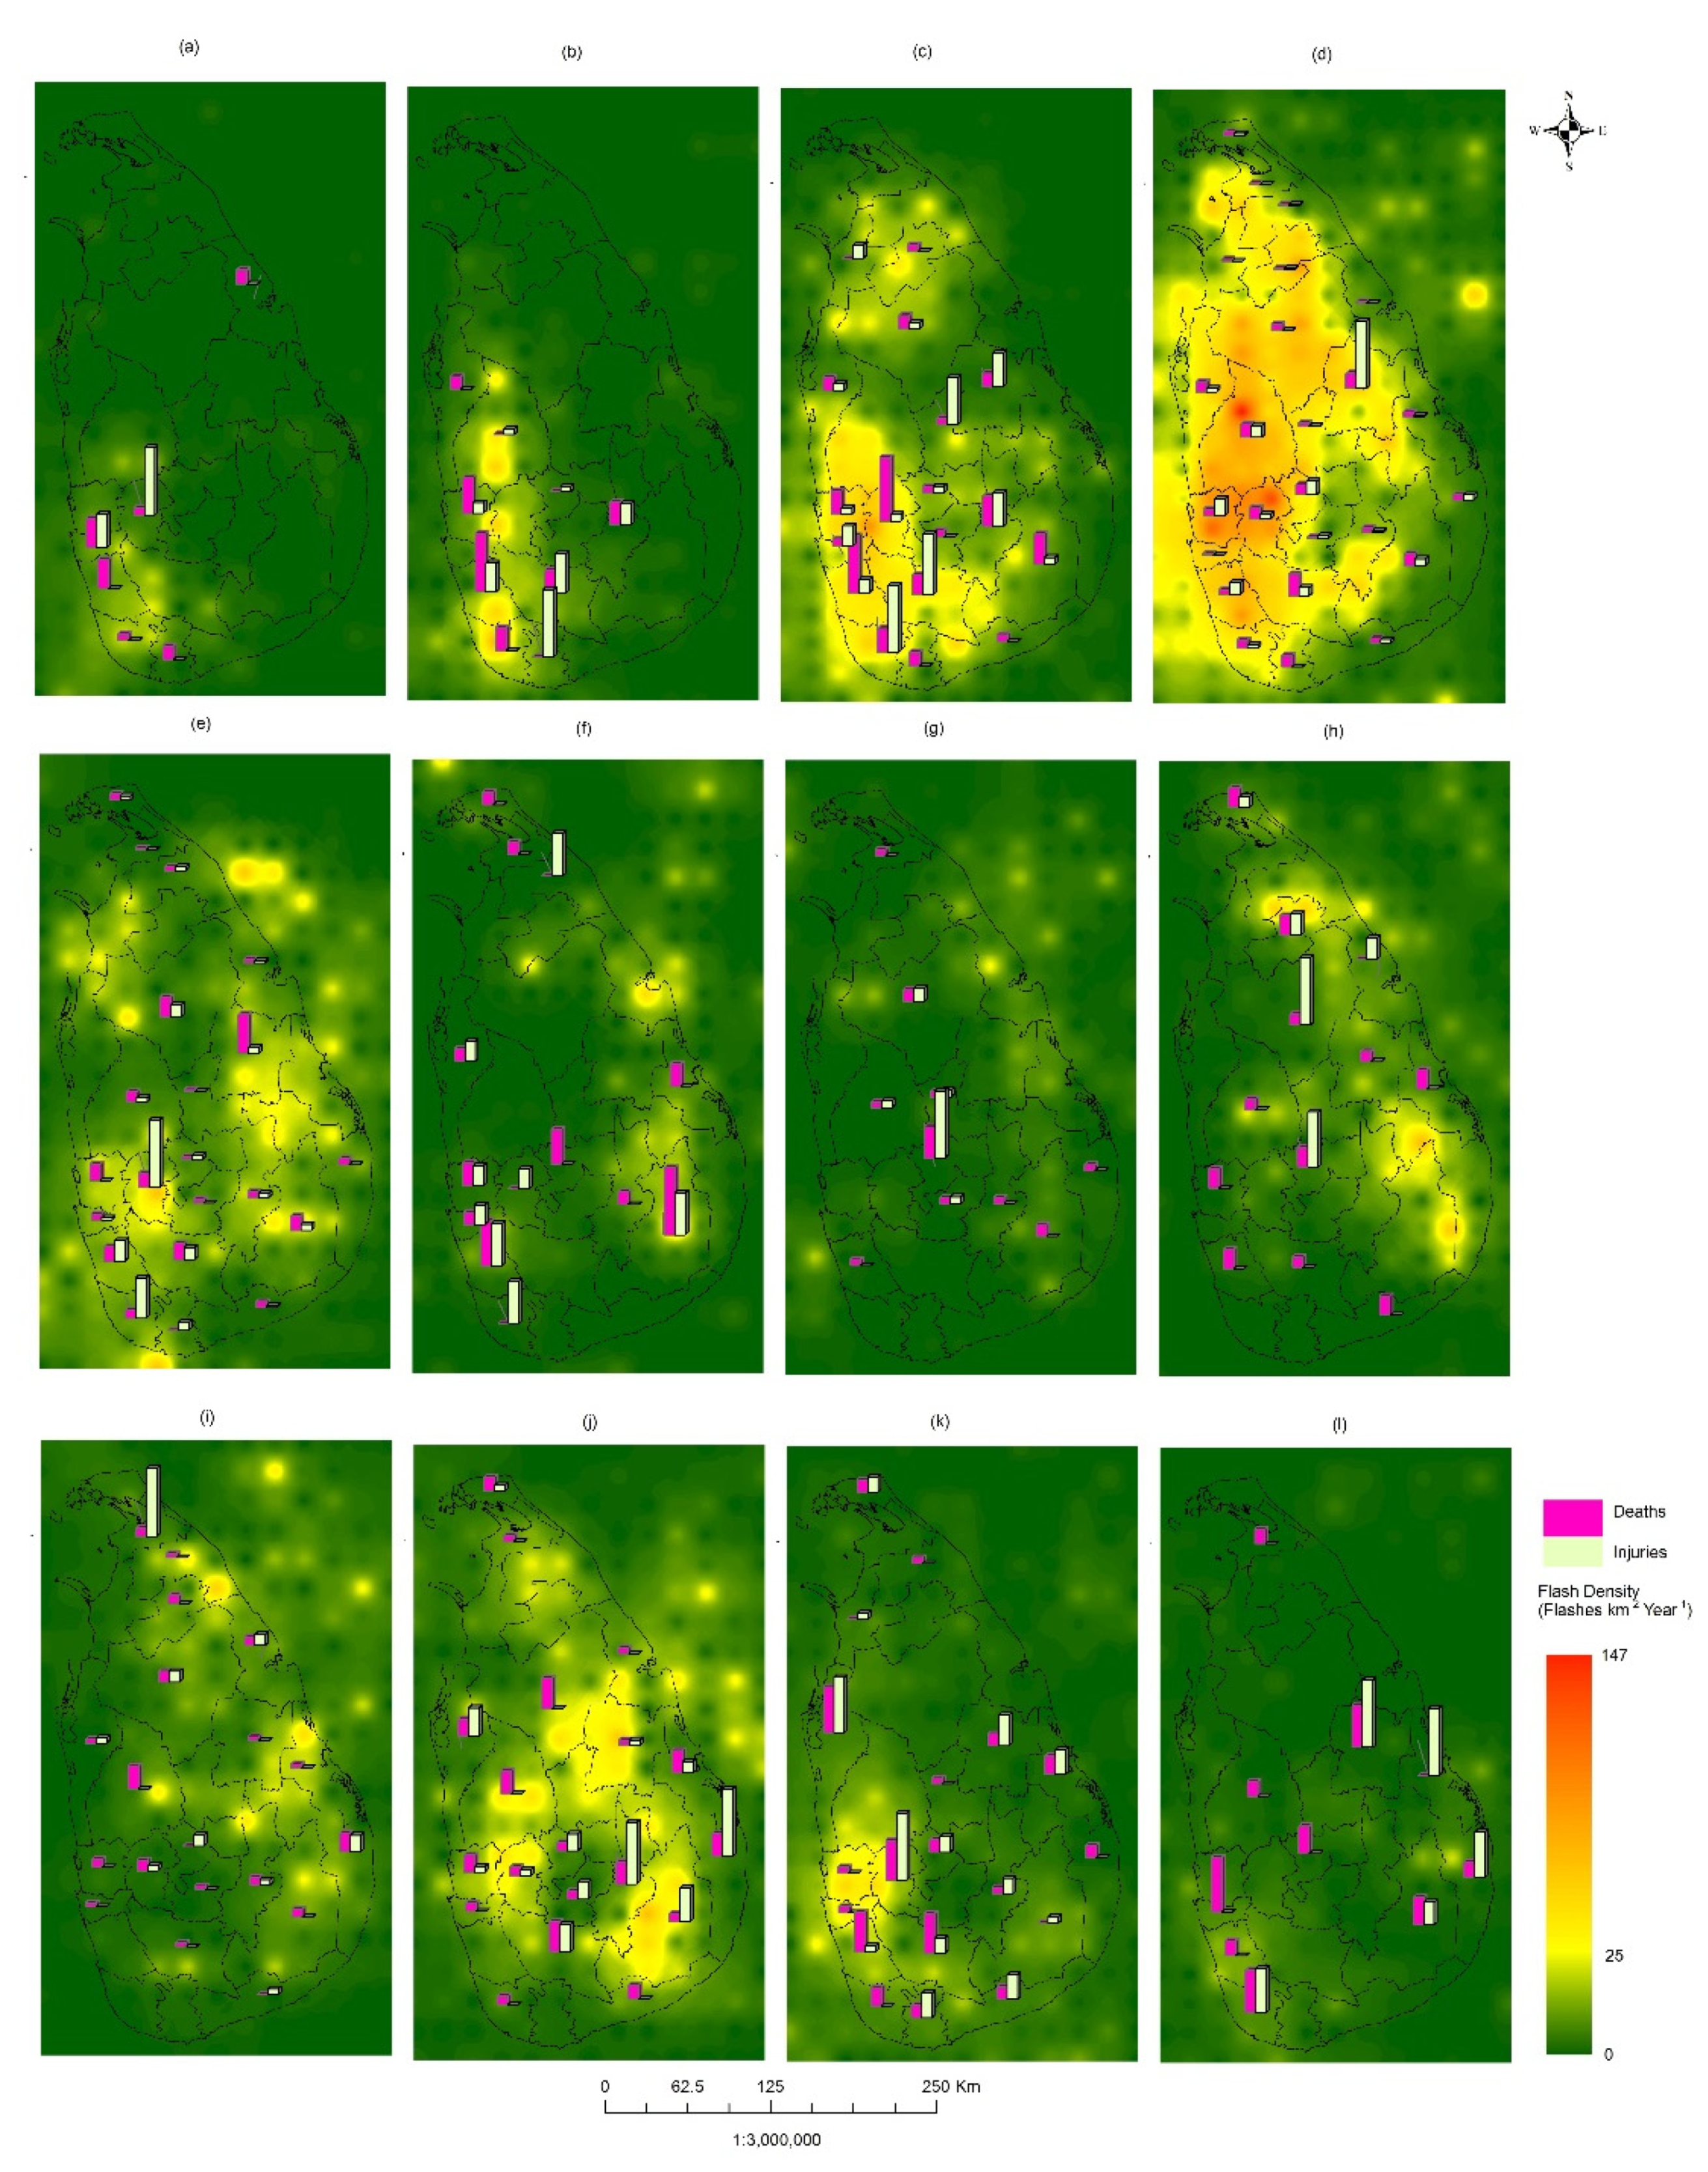
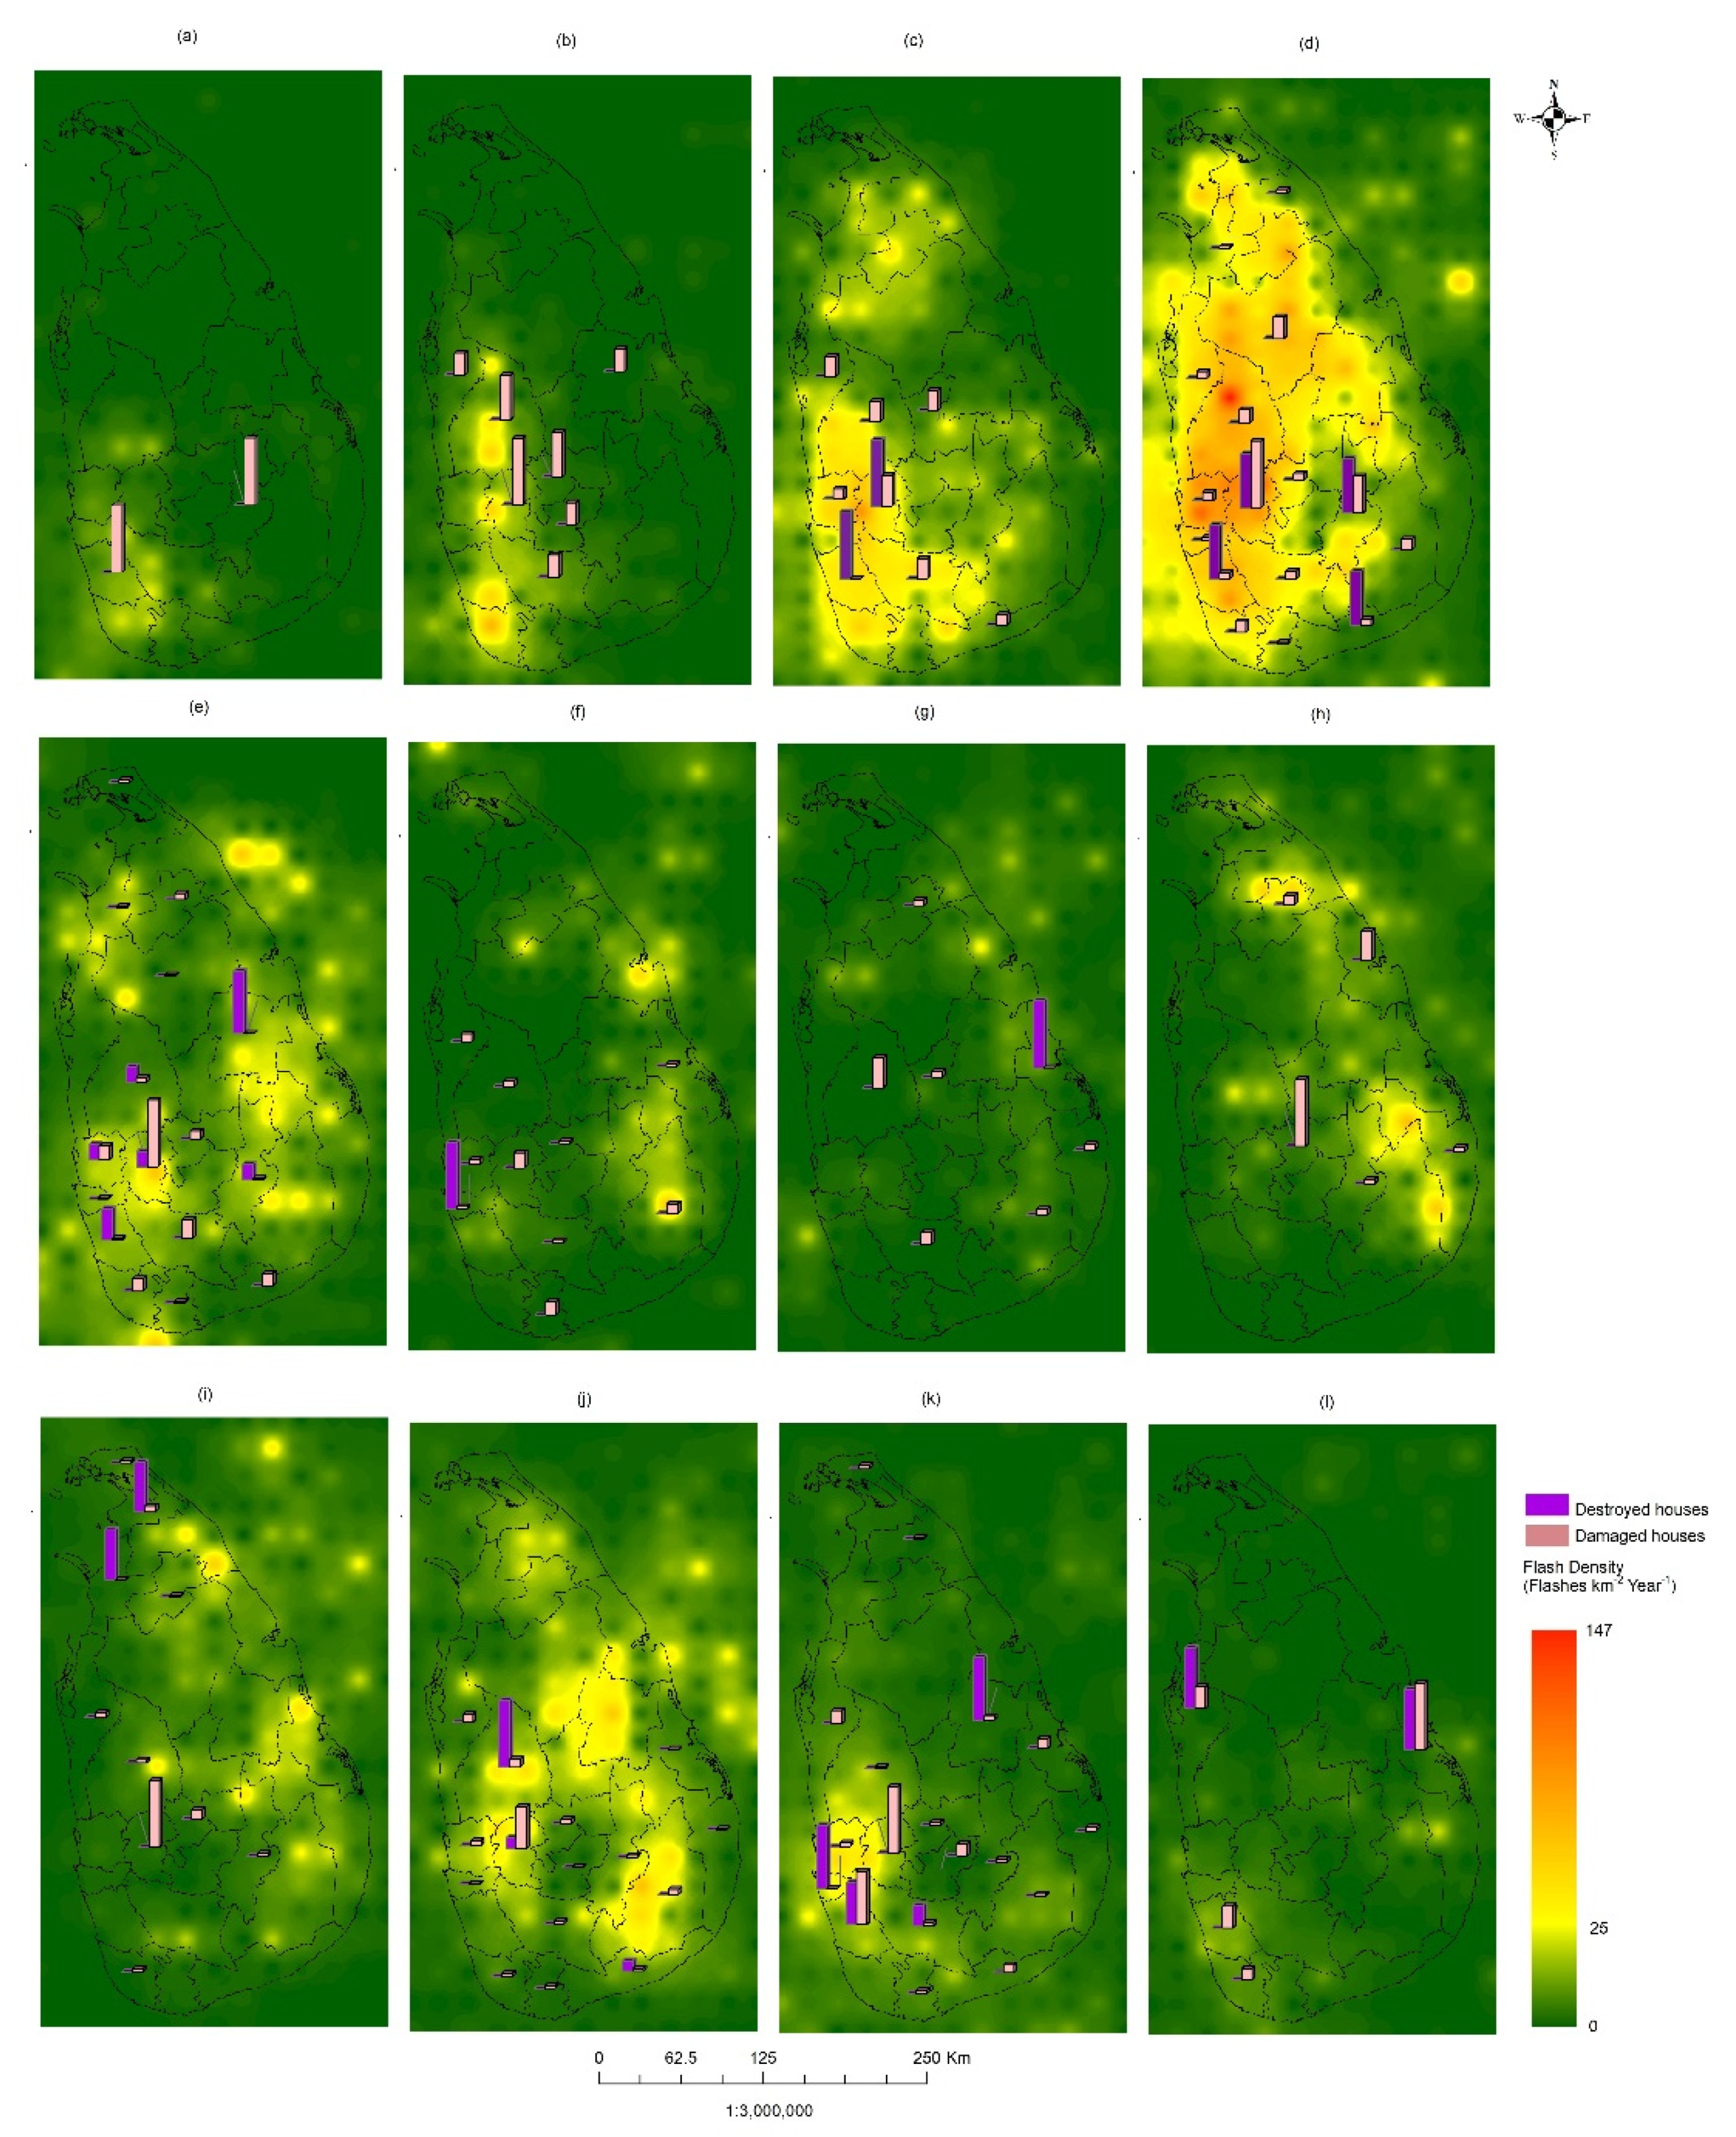
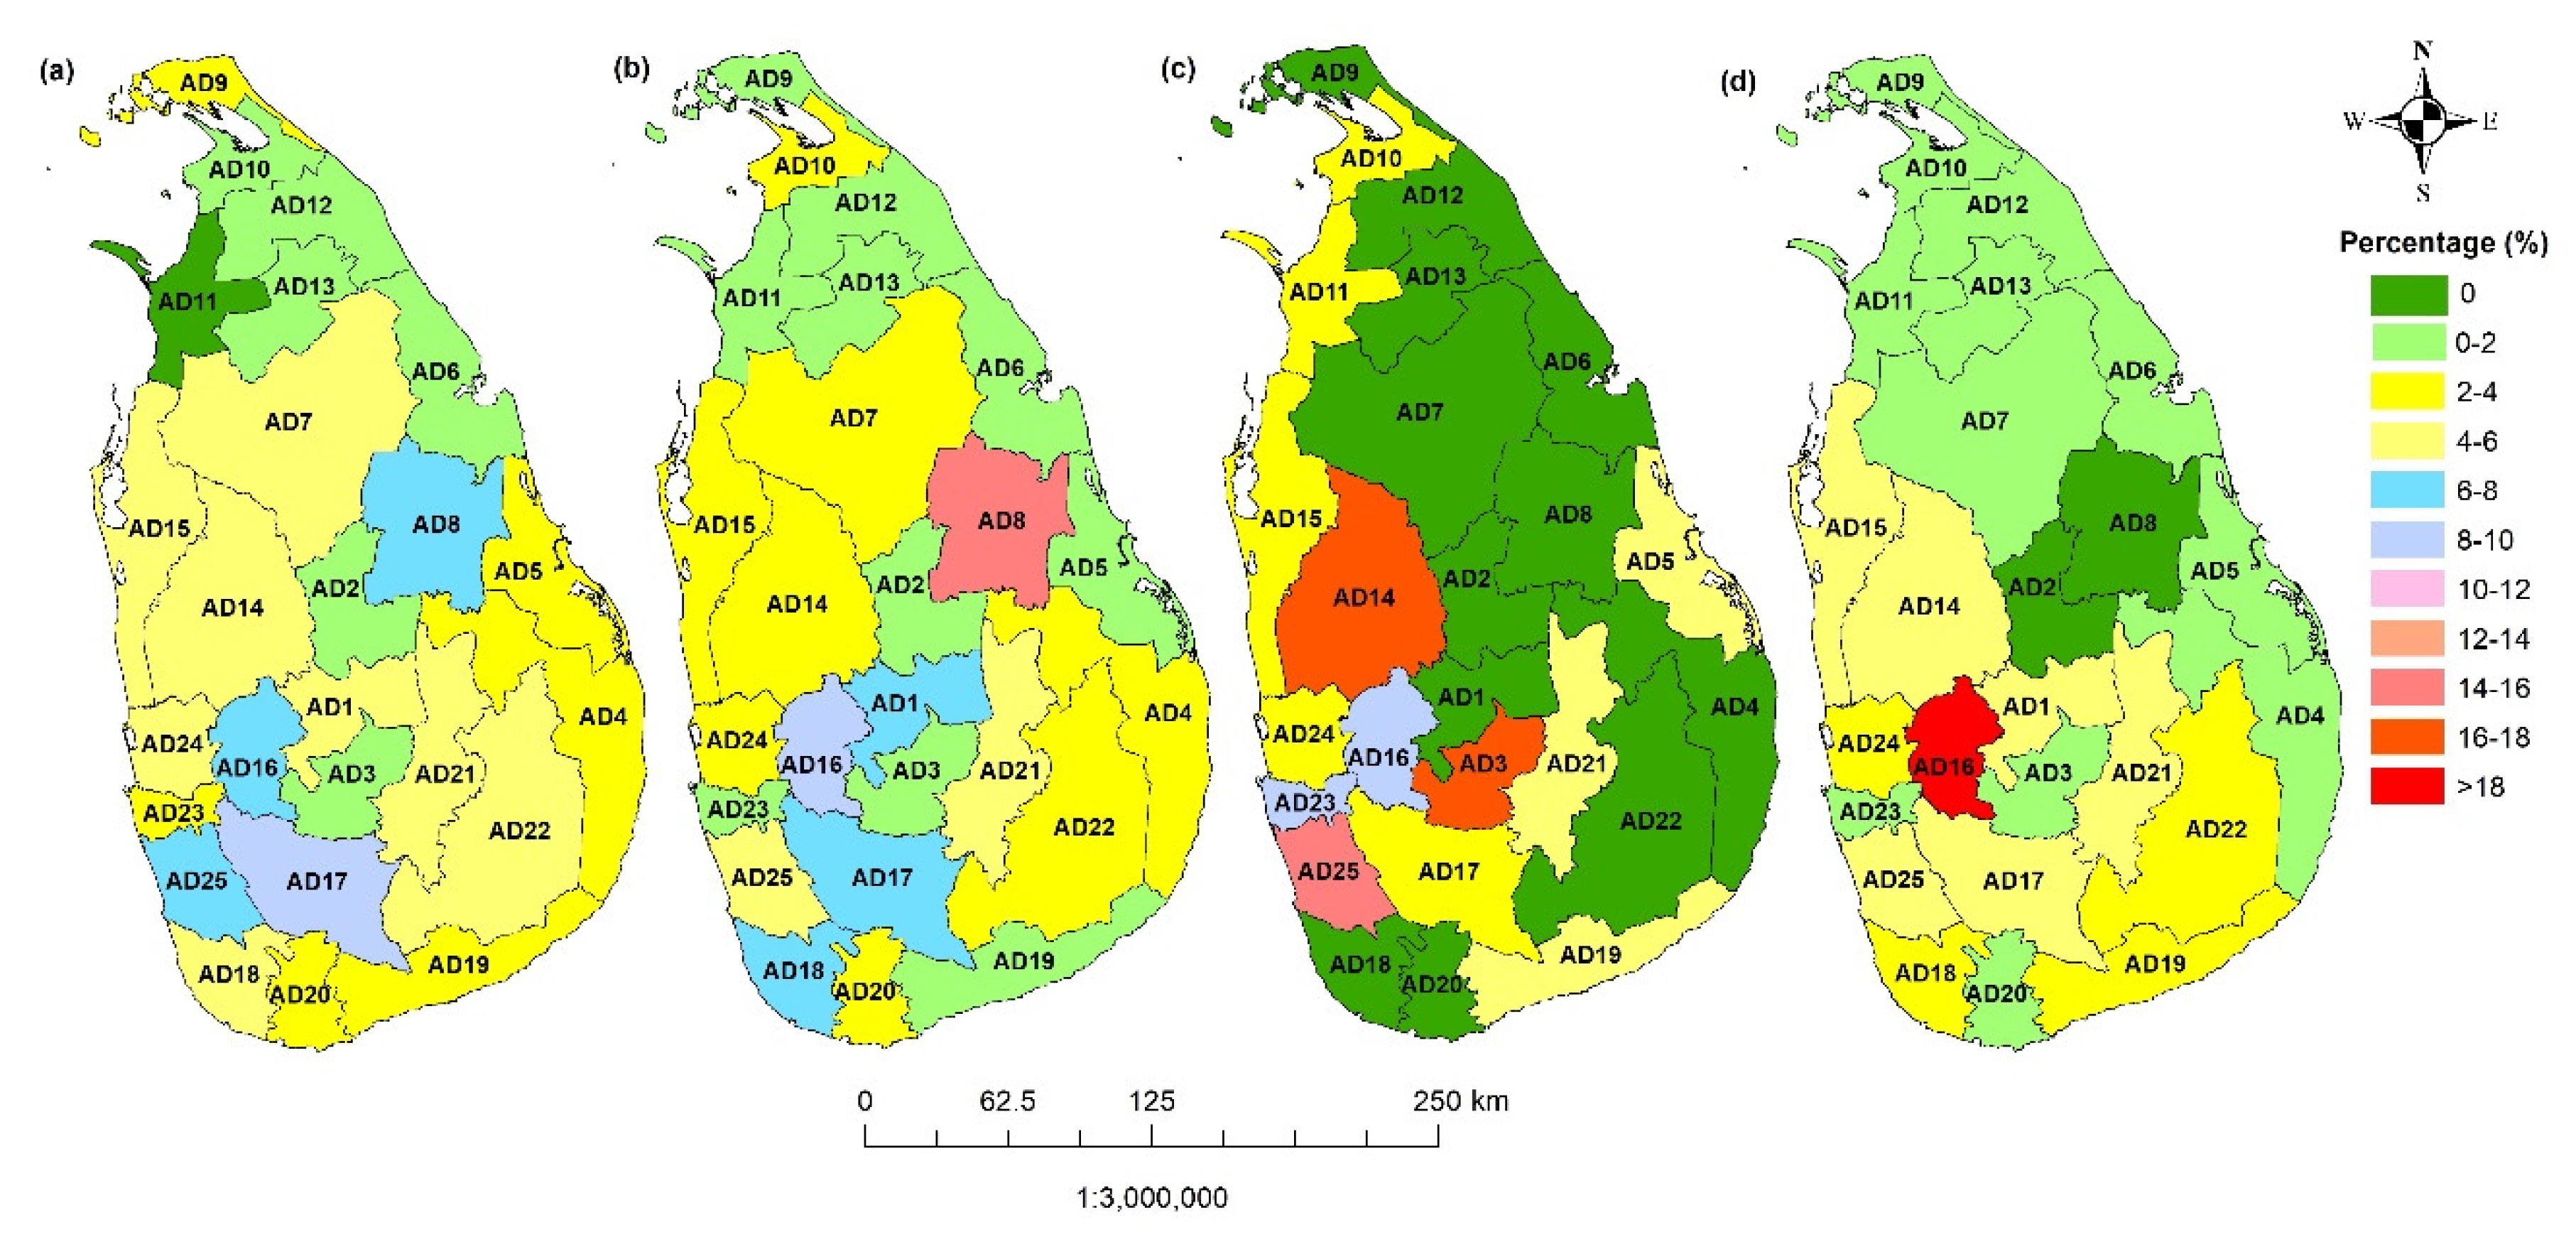
4.3. Geographical Distribution of Lightning Accidents

Table 3 shows the total number of lightning accidents in all 25 administrative districts (ADs) in Sri Lanka, from 1974 to 2019, whereas Figure 5 shows the total number of lightning accidents by their percentage variation for all 25 ADs for the same period.
As indicated in Table 3 and Figure 5, 47 deaths was recorded in the Ratnapura district (AD 17) and 43 deaths was recorded in the Kalutara district (AD 25), i.e., 8.6% and 7.8% respectively from the overall point of view. During the period from 1974 to 2019, only one death happened in the Mannar district (AD 11). Furthermore, within the considered period, the maximum and second maximum of the injuries due to lightning accidents were recorded in the Polonnaruwa district (AD 8) and Kegalle district (AD 16), i.e., 15.1% and 10.2% respectively. There were two administrative districts (AD 11 and AD 13) with a minimum number of lightning injuries during the period from 1974 to 2019, with less than 1% in each district. There were 280 houses (37.8%) damaged due to lightning accidents in the Kegalle district (AD 16), and the minimum number of houses (three) damaged due to lightning accidents was recorded in the Polonnaruwa district (AD 8) and the Matale district (AD 2). Moreover, the maximum number of destroyed houses (seven) due to lightning accidents was recorded in the Nuwara Eliya (AD 3) and Kurunegala (AD 14) districts. Although some damaged houses were recorded due to lightning activity in almost all of the administrative districts, there were no destroyed houses recorded in twelve of the Administrative Districts (AD 1, AD 2, AD 4, AD 6, AD 7, AD 8, AD 9, AD 12, AD 13, AD 18, AD 20, and AD 22).

4.4. Statistical Analysis of the Lightning Accidents

In order to present a general overview of the lightning accidents recorded in Sri Lanka from 1974 to 2019, a comprehensive statistical analysis was carried out. Table 4 and Table 5 show the respective statistics of the monthly variation of lightning accidents—covering deaths, injuries, and property damage—calculated from the recorded incidents in Sri Lanka from 1974 to 2019 whereas Table A1 and Table A2 show the respective statistics at the district level. As indicated in Table 4, the maximum number of deaths was recorded in April, with an average of 3.26 deaths, followed by 1.98 deaths in May, whereas in January and February it was 0.30 deaths, which are the lowest. As per the information stated in Table 4, in general, there could be at least one death due to lightning accidents in March, April, May, October, and November. Moreover, a maximum number of injuries was recorded in April, with an average of 3.20 injuries, followed by 2.09 injuries in May; in January, there were 0.07 injuries at the lowest. Furthermore, it can be stated that there was at least one injury due to lightning accidents in March, April, May, and October.
As indicated in Table 5, throughout the study period, the average number of destroyed houses in any month is insignificant, with a maximum calculated value of 0.22, whereas the average number of damaged houses is approximately three damaged in April, May, October, and November. The calculated statistical overview of the recorded lightning accidents in terms of annual variation is shown in Table 6. Accordingly, for the study period from 1974 to 2019 (46 years), the average number of deaths and injuries in a year could be reported as 11.93 (maximum = 68, minimum = 0, and standard deviation = 11.28) and 10.83 (maximum = 67, minimum = 0, and standard deviation = 12.22), respectively. However, the average number of deaths in a year from 2019, for the last 40 years, 30 years, 20 years, and 10 years, could be reported as 12.90, 15.73, 18.40, and 23.20, respectively, whereas the average number of injuries could be reported as 11.53, 13.57, 16.50, and 18.00. Furthermore, the average number of destroyed houses due to lightning in a year for the study period from 1974 to 2019 is 0.85 (maximum = 6, minimum = 0, and standard deviation = 1.62) whereas the average number of damaged houses is 16.11 (maximum = 245, minimum = 0, and standard deviation = 46.00).
As reported in [18], the population of Sri Lanka was 20.36 million in 2012, and with the reported population growth rate of 0.7 %, the population of Sri Lanka would be 21.38 million by 2019. Therefore, by considering the average number of deaths reported in this study during the period from 1974 to 2019, in Sri Lanka, 0.56 people per million per year were killed by lightning, whereas 0.51 people per million per year were injured. However, by considering the reported accidents from 2000 to 2019, 0.86 people per million per year were killed, and 0.77 people per million per year were injured, which is a significant increase.
Table 7 shows the seasonal variations of the lightning accidents in Sri Lanka that occurred, covering all four climate seasons from 1974 to 2019, whereas Figure 6 illustrates the graphical overview of the same, as generated by referring to Table 1. According to previous studies, the seasonal variation of the lightning activities shows that the maximum lightning activities happen in the first inter-monsoon season, followed to a greater extent by the second inter-monsoon season than the other two seasons [7,10,11,12]. The variation pattern observed in this study for the lightning accidents in Sri Lanka, as shown in Table 7 and Figure 6, is also overlaid with the aforementioned seasonal variation pattern of the lightning activities. The calculated statistics of the seasonal variations of lightning accidents in Sri Lanka, from 1974 to 2019, are tabulated in Table 8.
The maximum number of deaths (204 deaths; average = 2.22, maximum = 29, minimum = 0, and standard deviation = 3.80) and injuries (196 injured people; average = 2.13, maximum = 61, minimum = 0, and standard deviation = 6.89) was recorded in the first inter-monsoon season during the considered period, with 37.2 % deaths and 39.4 % injured people from the overall point of view. The second maximum of the deaths (33.3 %) and injuries (33.1 %) was recorded in the southwest monsoon season. However, the maximum number of destroyed houses (17 houses; average = 0.18, maximum = 5, minimum = 0, and standard deviation = 0.68) and damaged houses (283 houses; average = 3.08, maximum = 83, minimum = 0, and standard deviation = 11.56) was recorded in the second inter-monsoon season, with 43.6 % and 38.2 %, respectively, from the overall point of view.
Noticeably, the minimum number of deaths (47 deaths; average = 0.44, maximum = 14, minimum = 0, and standard deviation = 31.40), injuries (46 injured people; average = 0.56, maximum = 32, minimum = 0, and standard deviation = 3.21), destroyed houses (2 houses; average = 0.01, maximum = 2, minimum = 0, and standard deviation = 0.17), and damaged houses (24 houses; average = 0.25, maximum = 11, minimum = 0, and standard deviation = 1.28) due to lightning accidents occurred in the northeast monsoon season, with 8.6 %, 9.2 %, 5.1 %, and 3.2 %, respectively, within the considered period.
Figure 7 shows the annual variation of the lightning accidents in Sri Lanka, from 1974 to 2019. According to Figure 7, the maximum number of 68 people died due to lightning accidents in 2012, and the maximum number of 67 people were injured due to lightning accidents in 2008. A maximum of six houses were destroyed due to lightning activity in 2016 and 2018. Furthermore, a maximum of 245 houses were damaged due to lightning activity in 2019, and the second maximum of 199 damaged houses was recorded in 2018 within the considered period.
Figure 8 shows the cumulative number of lightning accidents reported in Sri Lanka, from 1974 to 2019. As can be seen in Figure 8, other than the destroyed number of houses, the numbers of deaths, injuries, and damaged houses have shown an incremental trend, moving towards 2019 from 1974. Moreover, according to Figure 8, it can be observed that the reported accidents during the last 20 years (2000–2019) are significantly higher than those reported from 1974 to 1999 (26 years). Accordingly, as indicated in Figure 9, for the study period considered—from 1974 to 2019—67.03 % of the deaths, 66.27 % of the injuries, 97.44 % of the destroyed houses, and 95.28 % of the damaged houses were reported during the last 20 years (from 2000 to 2019).
With regard to the reported lightning accidents, there was a significant increase in the number of deaths, injuries, and property damage in the last two decades. This could be due to the population growth of Sri Lanka during the last few decades, and urbanization. On the other hand, even though there were no incidents recorded on the number of destroyed houses in most of the years in the past, few incidents were recorded in recent years that caused houses to be destroyed. As the population grows, unused landmasses in the country are dwindling at a rapid rate due to the demand for cultivation or housing projects. This could have been a possible reason for such an increase in lightning accidents. However, it is important to mention that the population growth rate has been on a decline since 1974 [18]. Therefore, further investigations are recommended in this regard. Tall buildings and metal structures could be the more dominant constructions at present than in the past, due to urbanization. Furthermore, the usage of sensitive household electrical and electronic devices has increased rapidly with urbanization during the last few decades in the country. Therefore, the tendency of lightning accidents happening to household equipment could have also been increased. Moreover, without having properly coordinated lightning protection systems, they may be vulnerable lightning accidents from a direct lightning hit, a side flash, and a step potential rise, or due to a high induced voltage on the relevant low-voltage transmission lines.

5. Discussion

This study was oriented towards the analysis of the distribution of lightning accidents in Sri Lanka, covering the period of 1974 to 2019. There were 549 deaths, 498 injured people, 39 destroyed houses, and 741 damaged houses recorded in total during the aforementioned 46-year period due to the lightning activities over the land area covered by the island. The aforementioned results of lightning accidents over Sri Lanka are vital to the identification of the high-risk periods in a calendar year, as well as hotspots, by using a spatiotemporal variation of lightning accidents over Sri Lanka.
Figure 10 shows the spatial annual variation of the lightning flash density in Sri Lanka generated using GIS, and the recorded number of total lightning accidents in the percentage-wise distribution in the Districts and Provinces for the period from 1974 to 2019. The lightning flash data which was collected by the Lightning Imaging Sensor (LIS) on the Tropical Rainfall Measurement Mission (TRMM) of NASA, from 1998 to 2014, and were used to calculate the lightning flash density (flashes km-2 year−1) over Sri Lanka and the surrounding coastal belt, in a similar way to that used in previously reported studies [6,7,10,12]. The lightning flash density was presented by the respective 0.20 × 0.20 latitude and longitude grids. This shows a direct relationship between the lightning flash density and the recorded number of lightning accidents over Sri Lanka. As can be observed in Figure 10a,b, ADs with higher lightning flash densities are highly vulnerable to lightning hazards, whilst the provincial-wise view also shows the same trend, as illustrated in Figure 10c,d. Furthermore, according to Figure 10, the administrative districts and provinces with lower lightning flash densities are also show relatively low numbers of lightning accidents. There was a maximum of 15.7 % deaths, 18.9 % injuries, 28.2 % destroyed houses, and 42.6 % damaged houses recorded in the Sabaragamuwa, Northwest, Western, and Sabaragamuwa provinces, respectively.
Similarly, Figure 11 shows the spatial variation of the lightning flash density in Sri Lanka, and the recorded number of total lightning accidents in the percentage-wise distribution for all four climate seasons. Even though a higher lightning flash density dominated in the first inter-monsoon season, together with a significant record of lightning accidents compared to the other three climate seasons, lightning accidents were recorded throughout the country in all four climate seasons. Figure 12 shows the spatial variation of the lightning flash density in Sri Lanka, and the recorded number of total deaths and injuries in the percentage-wise distribution during all 12 months, whereas Figure 13 shows the spatial variation of the lightning flash density in Sri Lanka and the recorded number of damaged properties. The statistical details of the lightning flash density in Sri Lanka—extracted from the aforementioned raster maps using zonal statistics—are tabulated in Appendix A: Table A3, Table A4, Table A5, and Table A6. As stated in Table A3, the annual average lightning flash density of Sri Lanka is 8.26 flashes km−2 year−1 (maximum = 28.05, minimum = 0.84, and standard deviation = 3.88). As stated in Table A4, the highest lightning flash density of Sri Lanka is in April (average = 31.33 flashes km−2 year−1, maximum = 146.76, minimum = 0.02, and standard deviation = 23.31), whereas January recorded the minimum (average = 2.00 flashes km−2 year−1, maximum = 22.78, minimum = 0.00, and standard deviation = 3.84). As stated in Table A5, with regards to the climate seasons, the highest lightning flash density of Sri Lanka was reported in the first inter-monsoon season (average = 22.25 flashes km-2 year-1, maximum = 85.88, minimum = 0.79, and standard deviation = 15.09). Moreover, as stated in Table A6, the Kegalle district recorded the highest lightning flash density (average = 17.27 flashes km−2 year−1, maximum = 27.19, minimum = 7.53, and standard deviation = 3.39), whereas the Jaffna district recorded the lowest (average = 1.87 flashes km−2 year−1, maximum = 3.01, minimum = 0.84, and standard deviation = 0.45). The variations of the average lightning flash densities in terms of months, districts, and seasons are shown in Figure 4, Figure 5, and Figure 7, respectively, together with all of the recorded lightning accidents.
Figure 14a–d shows the district-wise percentage variation of the total lightning accidents reported in Sri Lanka from 1974 to 2019. It is a visual interpretation of the data summarized in Table 3. The administrative districts (ADs) in the western and southwestern regions in the country were more prone to lightning accidents than the ADs in the north and northeastern regions during the considered period.
There could be many other reasons which impact the aforementioned lightning accidents in addition to the influence caused by climate seasons and the respective regional variations of the lightning flash density, together with the geographical location. In a recent study, it was reported that there is an increasing trend of lightning activity in Sri Lanka, with 24 lightning flashes more every year, with an increase of flash density; 0.093 flashes km−2 per year [6].
It is a well-known fact that human activities in the open field are vulnerable to lightning accidents during a thunderstorm. On the other hand, paddy cultivation plays a dominant role in the crop cultivation of Sri Lanka. The two major paddy cultivation seasons are the Maha season and Yala Season. In general, the Yala season overlaps the first inter-monsoon and southwest monsoon rains. The Maha season commences with the beginning of the second inter-monsoon rains. According to this study, there is a high tendency of lightning accidents occurring in highly lightning-active periods, such as the first and second inter-monsoon seasons. Most of the administrative districts that were identified as the dominant lightning accident regions during the aforementioned two inter-monsoon seasons are the well-known prominent districts that perform the paddy cultivation of the country. Therefore, agricultural activities in rural areas may act as a dominant medium for lightning victims, which mostly could be due to either negligence of avoiding lightning accidents in the field, or not following proper outdoor safety guidelines. Therefore, farmers who are engaging in paddy cultivation in the aforementioned districts should completely avoid field activities during a thunderstorm.
Moreover, the community should avoid outdoor activities during the thunderstorm season as much as possible, and they should fix their attention on mitigating lightning accidents. Continuous lightning awareness programs, together with possible mitigation techniques and safety guidelines, should be held in all of the identified districts, and with the relevant stakeholders. Structural and human protection techniques and systems, lightning protection in low voltage power systems, insulation coordination, and effective grounding systems should be the main objectives of the lightning safety awareness programs. As a long-term strategy, it is recommended that these programs could be incorporated into the school curriculum. Moreover, as an effective way of utilizing the findings of this study as practical measurements to make inhabitants safe, it is recommended to incorporate these findings for the aforementioned lightning safety awareness programs, and to add the same into the school curriculum in an appropriate manner. The Disaster Management Centre (DMC) and the Department of Meteorology of Sri Lanka can play an active role in this regard. On the other hand, a considerable number of awareness programs for students and lightning protection workshops for other stakeholders have been conducted in different regions in the country in the past [14]. Furthermore, it is highly recommended to increase public awareness about the importance of adopting the recently-updated lightning protection standards issued by the International Electrotechnical Commission (IEC) during the implementation of new construction projects to mitigate lightning hazards [19,20]. These standards are entwined with different disciplines, such as general principles of lightning activities, risk management, physical damages to structures and life hazards, and the protection of electronic systems from lightning. Moreover, the implemented thunderstorm warning systems based on IEC standards can be recognized as one of the crucial solutions to mitigate unexpected lightning accidents all over the country [21]. Moreover, the findings of this study may be useful for carrying out further investigations to distinguish physical damage (fire, explosion, mechanical damage, etc.) and the damage to electrical and electronic systems within a structure due to the lightning electromagnetic pulse (LEMP). In order to identify the lightning-active periods and areas which are more vulnerable to lightning accidents, studies should be extended to investigate additional effective precautions to mitigate lightning accidents. However, it is a must that the public should regularly practice ordinary safety guidelines to mitigate lightning hazards.

6. Conclusions

This paper reports a study carried out on the recorded number of lightning accidents during the period from 1974 to 2019, which includes 549 deaths, 498 injured people, 39 destroyed houses, and 741 damaged houses. According to the geographical distribution of the lightning accidents, during the period from 1974 to 2019, the maximum number of 47 deaths was recorded in the Ratnapura district (AD 17), and 43 deaths were recorded in the Kalutara district (AD 25), with 8.6 % and 7.8 %, respectively, from the overall point of view, and just one death recorded in the Mannar district (AD 11), which was the minimum. Furthermore, the maximum number of 75 injuries due to lightning accidents was recorded in the Polonnaruwa district (AD 8), followed by 51 injuries in the Kegalle district (AD 16), with 15.1 % and 10.2 %, respectively. The maximum number of damages for houses (280 houses) happened in the Kegalle district (AD 16), with 37.8 % during the considered period. According to the temporal variation of the lightning accidents, the maximum number of deaths (204 deaths) and injuries (196 injuries) was recorded in the first inter-monsoon season, and the minimum number of deaths (47 deaths) and injuries (46 injuries) was recorded in the northeast monsoon season during the period from 1974 to 2019. The maximum number of destroyed (17 houses) and damaged (283 houses) houses was recorded in the second inter-monsoon season. Furthermore, the maximum number of deaths (150 deaths) and injuries (147 injuries) due to lightning accidents was recorded in April. On the other hand, the maximum number of destroyed (10 houses) and damaged (151 houses) houses due to lightning activities was recorded in May. Moreover, as per the recorded data, the maximum number of 68 people died due to lightning accidents in 2012, and the maximum number of 67 people were injured in 2008. It was also observed that there is a relationship between the lightning flash density and the recorded number of lightning accidents over Sri Lanka, and higher lightning flash density in a particular area tends to lead to higher lightning hazards.
Most of the areas that were identified as high-risk lightning accident regions are well known for agricultural activities, and those activities will eventually create the platform for lightning victims. Therefore, it is recommended that people should completely avoid field activities during a thunderstorm as much as possible, or they should regularly follow the lightning safety guidelines. Nevertheless, further studies are recommended in order to investigate additional effective precautions to mitigate lightning accidents.
The results show that, on average, 11.93 people are killed and 10.83 people are injured in a year for the study period from 1974 to 2019. However, based on the reported accidents only for the period from 2000 to 2019, 18.40 people are killed and 16.50 people are injured per year. Furthermore, for the study period from 1974 to 2019, the average numbers of destroyed houses and damaged houses in a year were 0.85 and 16.11, respectively, whereas for the period from 2000 to 2019, these numbers increased to 1.90 and 35.30, respectively. For the study period considered from 1974 to 2019, according to the reported lighting accidents, there was a significant increase in the number of deaths, injuries, and property damage in the last two decades (2000–2019), and for said period, 67.03 % of deaths, 66.27 % of injuries, 97.44 % of destroyed houses, and 95.28 % of damaged houses were reported.
According to the results of this study, it can be concluded that, for the period from 1974 to 2019 (46 years), in Sri Lanka, 0.56 people per million per year are killed, and 0.51 people per million per year are injured due to lightning. Nevertheless, as per the reported accidents from 2000 to 2019 (20 years), these estimated values are significantly higher: 0.86 people per million per year were killed, and 0.77 people per million per year were injured for this period.

Author Contributions

Conceptualization, M.E. and U.G.D.M.; Data curation, U.G.D.M.; Formal analysis, U.G.D.M.; Investigation, U.G.D.M.; Methodology, M.E. and U.G.D.M.; Resources, M.E.; Validation, M.E.; Visualization, M.E. and U.G.D.M.; Writing—original draft, U.G.D.M.; Writing—review and editing, M.E. All authors have read and agreed to the published version of the manuscript.

Funding

This research received no external funding.

Informed Consent Statement

Not applicable.

Data Availability Statement

Lightning accidents data are available at the DesInventar database maintained by the Disaster Management Centre (DMC), Colombo 07, Sri Lanka Sri Lanka (http://www.desinventar.lk:8081/DesInventar/main.jsp (accessed on 24 February 2021)). Lightning flash data are available at Lightning Imaging Sensor (LIS) on the Tropical Rainfall Measurement Mission (TRMM) of NASA (https://lightning.nsstc.nasa.gov/data/data_lis.html (accessed on 24 February 2021)).

Acknowledgments

The assistance provided by the Department of Physics, University of Colombo, is highly acknowledged. The authors are thankful to the Disaster Management Centre, Colombo 07, Sri Lanka, for providing the data in the DesInventar database. The assistance provided by Pradeep Kodippli and Mithma Gunasekera is also acknowledged.

Conflicts of Interest

The authors declare no conflict of interest.

Appendix A

Table A1. Statistical variations of the deaths and injuries in each administrative district of Sri Lanka due to lightning, from 1974 to 2019.
District
Number
DistrictNumber of DeathsNumber of Injuries
AverageMaximumMinimumStandard DeviationAverageMaximumMinimumStandard Deviation
AD 1Kandy0.59501.270.831002.10
AD 2Matale0.15300.600.17600.93
AD 3Nuwara Eliya0.20300.540.15300.63
AD 4Ampara0.43400.860.41701.33
AD 5Batticaloa0.37401.000.20400.72
AD 6Trincomalee0.17200.490.11200.43
AD 7Anuradhapura0.67601.370.41601.29
AD 8Polonnaruwa0.87501.511.636209.15
AD 9Jaffna0.30300.760.17400.68
AD 10Kilinochchi0.17200.490.281101.64
AD 11Mannar0.02100.150.07200.33
AD 12Mullaittivu0.11200.380.11200.43
AD 13Vavuniya0.15300.560.09200.41
AD 14Kurunegala0.67801.430.30601.03
AD 15Puttalam0.57501.110.39501.02
AD 16Kegalle0.85801.401.111702.95
AD 17Ratnapura1.02601.630.78701.80
AD 18Galle0.59401.050.781702.76
AD 19Hambantota0.35300.770.17300.57
AD 20Matara0.37701.160.411201.89
AD 21Badulla0.54601.170.571302.07
AD 22Moneragala0.76901.610.43701.42
AD 23Colombo0.39400.770.13400.62
AD 24Gampaha0.67401.030.431001.63
AD 25Kalutara0.93601.340.67801.69
Table A2. Statistical variations of the property damage in each administrative district of Sri Lanka due to lightning, from 1974 to 2019.
District
Number
DistrictNumber of DeathsNumber of Injuries
AverageMaximumMinimumStandard DeviationAverageMaximumMinimumStandard Deviation
AD 1Kandy0.00000.001.001503.14
AD 2Matale0.00000.000.07100.25
AD 3Nuwara Eliya0.15400.670.22901.33
AD 4Ampara0.00000.000.13100.34
AD 5Batticaloa0.04100.210.30601.17
AD 6Trincomalee0.00000.000.13600.88
AD 7Anuradhapura0.00000.000.351101.72
AD 8Polonnaruwa0.00000.000.07200.33
AD 9Jaffna0.00000.000.11200.43
AD 10Kilinochchi0.02100.150.09400.59
AD 11Mannar0.02100.150.09200.35
AD 12Mullaittivu0.00000.000.09400.59
AD 13Vavuniya0.00000.000.22200.59
AD 14Kurunegala0.15500.760.912303.49
AD 15Puttalam0.02100.150.801603.11
AD 16Kegalle0.09100.286.09110020.98
AD 17Ratnapura0.02100.150.781102.33
AD 18Galle0.00000.000.611302.26
AD 19Hambantota0.04100.210.591402.21
AD 20Matara0.00000.000.30500.84
AD 21Badulla0.04100.210.802904.32
AD 22Moneragala0.00000.000.481101.92
AD 23Colombo0.09300.460.15300.56
AD 24Gampaha0.02100.150.721502.52
AD 25Kalutara0.13200.401.022103.80
Table A3. Statistics of the annual lightning flash density, based on the 1998–2014 LIS Data from the TRMM Satellite.
Annual Lightning Flash Density
(flashes km−2 year−1)
AverageMaximumMinimumStandard Deviation
8.2628.050.843.88
Table A4. Statistics of the monthly variations of the lightning flash density, based on the 1998–2014 LIS Data from the TRMM Satellite.
Month(flashes km−2 year−1)
AverageMaximumMinimumStandard Deviation
January2.0022.780.003.84
February4.6165.880.007.62
March14.3585.670.0012.23
April31.33146.760.0223.31
May9.9358.200.006.76
June3.7457.270.005.29
July2.0825.160.002.60
August6.6659.610.007.37
September6.5549.550.005.78
October12.8759.770.008.60
November6.0945.640.006.47
December2.2020.440.002.75
Table A5. Statistics of the seasonal variations of the lightning flash density, based on the 1998–2014 LIS Data from the TRMM Satellite.
Climate Season(flashes km−2 year−1)
AverageMaximumMinimumStandard Deviation
FIM22.2585.880.7915.09
SWM5.6723.660.163.51
SIM9.2935.650.405.32
NEM2.9931.990.263.91
Table A6. Statistics of the variations of the lightning flash density in each administrative district of Sri Lanka, based on the 1998–2014 LIS Data from the TRMM Satellite.
District
Number
District(flashes km−2 year−1)
AverageMaximumMinimumStandard Deviation
AD 1Kandy7.2916.613.181.95
AD 2Matale8.3810.476.450.74
AD 3Nuwara Eliya6.1814.062.102.01
AD 4Ampara6.4014.741.063.50
AD 5Batticaloa5.5410.931.121.92
AD 6Trincomalee5.988.073.580.80
AD 7Anuradhapura8.0011.735.121.08
AD 8Polonnaruwa8.8113.935.481.06
AD 9Jaffna1.873.010.840.45
AD 10Kilinochchi3.466.541.871.03
AD 11Mannar5.939.831.511.78
AD 12Mullaittivu6.6711.981.982.16
AD 13Vavuniya8.8811.476.090.82
AD 14Kurunegala11.9420.325.242.99
AD 15Puttalam5.7310.952.511.42
AD 16Kegalle17.2727.197.533.39
AD 17Ratnapura10.2221.223.033.70
AD 18Galle10.8216.584.731.83
AD 19Hambantota3.617.681.531.23
AD 20Matara5.2711.281.771.80
AD 21Badulla8.4514.843.361.63
AD 22Moneragala8.2116.251.942.62
AD 23Colombo15.5028.059.113.82
AD 24Gampaha16.7427.945.723.21
AD 25Kalutara14.8419.969.382.31

References

  1. Mistovich, J.J.; Krost, W.S.; Limmer, D.D. Beyond the basics: Lightning-strike injuries. EMS Mag. 2008, 37, 82–87. [Google Scholar] [PubMed]
  2. Aslar, A.K.; Soran, A.; Yildiz, Y.; Isik, Y. Epidemiology, morbidity, mortality and treatment of lightning injuries in a Turkish burns units. Int. J. Clin. Pract 2001, 55, 502–504. [Google Scholar] [PubMed]
  3. Islam, S.; Schmidlin, T.W. Lightning hazard safety measures and awareness. Nat. Hazards 2020. [Google Scholar] [CrossRef] [Green Version]
  4. Mary, A.K.; Gomes, C. Lightning safety of under-privileged communities around Lake Victoria. Geomat. Nat. Hazards Risk 2015, 6, 669–685. [Google Scholar] [CrossRef] [Green Version]
  5. TRMM Lightning Imaging Sensor (LIS) Data Sets NASA. Available online: https://lightning.nsstc.nasa.gov/data/data_lis.html (accessed on 5 June 2018).
  6. Maduranga, U.G.D.; Edirisinghe, C.M.; Gamage, L.V. Annual Variation Trend of Lightning Flash Activities over Sri Lanka. World Sci. News 2018, 114, 256–264. [Google Scholar]
  7. Maduranga, U.G.D.; Edirisinghe, C.M.; Gamage, L.V. Spatiotemporal Variability of Lightning Flash Distribution over Sri Lanka. Int. Lett. Chem. Phys. Astron. 2019, 82, 1–13. [Google Scholar] [CrossRef]
  8. Holton, J.R.; Curry, J.A.; Pyle, J.A. Encyclopedia of Atmospheric Sciences; Academic Press: Cambridge, MA, USA, 2003; ISBN 9780122270901. [Google Scholar]
  9. Huffines, G.R.; Orville, R.E. Lightning Ground Flash Density and Thunderstorm Duration in the Continental United States: 1989–96. J. Appl. Meteorol. 1999, 38, 1013–1019. [Google Scholar] [CrossRef]
  10. Jeyanthiran, V.; Edirisinghe, C.M.; Fernando, M.; Cooray, V. Study of Lightning Activity over Sri Lanka. In Proceedings of the 29th International Conference on Lightning Protection, Uppsala, Sweden, 23–26 June 2008. [Google Scholar]
  11. Jayawardena, W.; Fernando, M.; Sonnadara, D.U.J. Satellite Observation of Lightning Activities Over Sri Lanka. Sri Lankan J. Phys. Inst. Phys. 2014, 30, 61–66. [Google Scholar]
  12. Sonnadara, U.; Jayawardena, W.; Fernando, M. Climatology of lightning flash activities over Sri Lanka. Theor. Appl. Climatol. 2019, 113, 3173–3182. [Google Scholar] [CrossRef]
  13. Kumar, P.; Manish, Y.; Sunita, S.; Kumar, H. The major lightning regions and associated casualties over India. Nat. Hazards 2020. [Google Scholar] [CrossRef]
  14. Jayaratne, K.P.S.C.; Gomes, C. Public perceptions and lightning safety education in Sri Lanka Public Perceptions and Lightning Safety Education in Sri Lanka. In Proceedings of the 2012 International Conference on Lightning Protection (ICLP), Vienna, Austria, 2–7 September 2012. [Google Scholar] [CrossRef]
  15. Disaster Management Centre, Asia Pacific Alliance for Disaster Management Sri Lanka. Impact of Disasters in Sri Lanka in 2016; The Consortium of Humanitarian Agencies (CHA): Colombo, Sri Lanka, 2016; ISBN 9789951041540. [Google Scholar]
  16. Disaster Information Management system in Sri Lanka. Available online: http://www.desinventar.lk:8081/DesInventar/main.jsp (accessed on 23 January 2020).
  17. Undrr, L.R. ”DesInventar—Profile”, Desinventar.net. Available online: https://www.desinventar.net/DesInv,entar/profiletab.jsp?countrycode=lka (accessed on 23 January 2020).
  18. United Nations Population Fund (UNFPA). Census of Population and Housing 2012 Key Findings; Department of Census and Statistics Sri Lanka: Battaramulla, Sri Lanka, 2014; ISBN 9789555779067. [Google Scholar]
  19. Pédeboy, S. Introduction to the IEC 62858: Lightning density based on Lightning Locating Systems. In Proceedings of the ILPS 2018—International Lightning Protection Symposium, Shenzhen, China, 24–27 October 2018. [Google Scholar]
  20. International Standard IEC 62305-2 Edition 2, Protection against Lightning—Part 2: Risk Management; International Electrotechnical Commission: London, UK, 2010; ISBN 978-2-88912-281-3.
  21. Schmitt, S.; Rousseau, A. Thunderstorm Warning Systems: IEC 62793 Standard. In Proceedings of the 33rd International Conference on Lightning Protection (ICLP), Estoril, Portugal, 25–30 September 2016. [Google Scholar]
Figure 1. Existing provinces and administrative districts (AD1–AD25) in Sri Lanka.
Ijgi 10 00117 g001
Figure 2. Lightning accidents in Sri Lanka during all four climate seasons, from 1974 to 2019 (a) number of deaths; (b) number of injuries.
Ijgi 10 00117 g002
Figure 3. Lightning accidents in Sri Lanka during all four climate seasons, from 1974 to 2019: (a) number of damaged houses; (b) number of destroyed houses.
Ijgi 10 00117 g003
Figure 4. Monthly variation of lightning accidents in Sri Lanka from 1974 to 2019.
Ijgi 10 00117 g004
Figure 5. Variations of the lightning accidents in all 25 administrative districts (ADs) in Sri Lanka, from 1974 to 2019.
Ijgi 10 00117 g005
Figure 6. Graphical overview of the seasonal variations of lightning accidents in Sri Lanka, from 1974 to 2019.
Ijgi 10 00117 g006
Figure 7. Annual variation of the lightning accidents in Sri Lanka, from 1974 to 2019.
Ijgi 10 00117 g007
Figure 8. Cumulative lightning accidents in Sri Lanka, from 1974 to 2019: (a) number of deaths; (b) number of injuries; (c) number of destroyed houses; (d) number of damaged houses.
Ijgi 10 00117 g008
Figure 9. Cumulative lightning accidents (in %) in Sri Lanka, from 1974 to 2019.
Ijgi 10 00117 g009
Figure 10. Annual variation of lightning flash density with the recorded lightning accidents (in %) in Sri Lanka, from 1974 to 2019: (a) deaths and injuries according to districts; (b) property damage according to districts; (c) deaths and injuries according to provinces; (d) property damage according to provinces.
Ijgi 10 00117 g010
Figure 11. Variation of the lightning flash density with the recorded lightning accidents (in %) in Sri Lanka, from 1974 to 2019, for all four climate seasons, presented district-wise: (a) FIM deaths and injuries, (b) SWM deaths and injuries, (c) SIM deaths and injuries, (d) NEM deaths and injuries, (e) FIM destroyed and damaged houses, (f) SWM destroyed and damaged houses, (g) SIM destroyed and damaged houses, and (h) NEM destroyed and damaged houses.
Ijgi 10 00117 g011
Figure 12. Variation of the lightning flash density with the recorded deaths and injuries (in %) in Sri Lanka from 1974 to 2019 for all 12 months, presented district-wise: (a) January, (b) February, (c) March, (d) April, (e) May, (f) June, (g) July, (h) August, (i) September, (j) October, (k) November, and (l) December.
Ijgi 10 00117 g012
Figure 13. Variation of the lightning flash density with the recorded property damage (in %) in Sri Lanka, from 1974 to 2019, for all 12 months, presented district-wise: (a) January, (b) February, (c) March, (d) April, (e) May, (f) June, (g) July, (h) August, (i) September, (j) October, (k) November, and (l) December.
Ijgi 10 00117 g013
Figure 14. Distribution of the lightning accidents in the administrative districts of Sri Lanka, from 1974 to 2019: (a) deaths due to lightning strikes, (b) injuries due to lightning strikes, (c) destroyed houses due to lightning strikes, and (d) damaged houses due to lightning strikes.
Ijgi 10 00117 g014
Table 1. Lightning accidents in the administrative districts of Sri Lanka for all four climate seasons, from 1974 to 2019.
District
Number
DistrictFIMSWMSIMNEM
DeathsInjuriesHouses DestroyedHouses DamagedDeathsInjuriesHouses DestroyedHouses DamagedDeathsInjuriesHouses DestroyedHouses DamagedDeathsInjuriesHouses DestroyedHouses Damaged
AD 1Kandy1013051119028450112102
AD 2Matale4702210110000000
AD 3Nuwara Eliya3300410023090001
AD 4Ampara44009302712040000
AD 5Batticaloa4100501185070316
AD 6Trincomalee1000450610002000
AD 7Anuradhapura8101515160170001200
AD 8Polonnaruwa1564001934035323301
AD 9Jaffna3200630353020000
AD 10Kilinochchi10005131410001000
AD 11Mannar1202001201000000
AD 12Mullaittivu1103340010010000
AD 13Vavuniya32004201000000000
AD 14Kurunegala1210011133114506151102
AD 15Puttalam11406220612120221013
AD 16Kegalle205247934111391011171203
AD 17Ratnapura22160896021147162701
AD 18Galle12130742101450066201
AD 19Hambantota631552012531100000
AD 20Matara130020406230621200
AD 21Badulla1061257315613062401
AD 22Moneragala1570716505270102100
AD 23Colombo2302521330328100
AD 24Gampaha101607131116510103200
AD 25Kalutara1313251312227123710503
Total20419661591831651427511591172834746224
Table 2. Monthly variations of lightning accidents in Sri Lanka, from 1974 to 2019.
MonthNumber of DeathsNumber of InjuriesNumber of Houses
DestroyedDamaged
No.%No.%No.%No.%
January142.630.600.020.3
February142.6326.400.0111.5
March549.8499.825.1141.9
April15027.314729.5410.314519.6
May9116.69619.31025.615120.4
June224.0122.412.6263.5
July162.9153.012.6111.5
August183.3163.200.0243.2
September366.6265.225.1638.5
October6211.35110.2820.515020.2
November539.7408.0923.113317.9
December193.5112.225.1111.5
Total54910049810039100741100
Table 3. Recorded number of lightning accidents in each administrative district, from 1974 to 2019.
District NumberDistrictNumber of
Deaths
Number of
Injuries
Number of Houses
DestroyedDamaged
No.%No.%No.%No.%
AD 1Kandy274.9387.600.0466.2
AD 2Matale71.381.600.030.4
AD 3Nuwara Eliya91.671.4717.9101.3
AD 4Ampara203.6193.800.060.8
AD 5Batticaloa173.191.825.1141.9
AD 6Trincomalee81.551.000.060.8
AD 7Anuradhapura315.6193.800.0162.2
AD 8Polonnaruwa407.37515.100.030.4
AD 9Jaffna142.681.600.050.7
AD 10Kilinochchi81.5132.612.640.5
AD 11Mannar10.230.612.640.5
AD 12Mullaittivu50.951.000.040.5
AD 13Vavuniya71.340.800.0101.3
AD 14Kurunegala315.6142.8717.9425.7
AD 15Puttalam264.7183.612.6375.0
AD 16Kegalle397.15110.2410.328037.8
AD 17Ratnapura478.6367.212.6364.9
AD 18Galle274.9367.200.0283.8
AD 19Hambantota162.981.625.1273.6
AD 20Matara173.1193.800.0141.9
AD 21Badulla254.6265.225.1375.0
AD 22Moneragala356.4204.000.0223.0
AD 23Colombo183.361.2410.370.9
AD 24Gampaha315.6204.012.6334.5
AD 25Kalutara437.8316.2615.4476.3
Table 4. Statistics of the monthly variations of deaths and injuries in Sri Lanka due to lightning, from 1974 to 2019.
MonthNumber of DeathsNumber of Injuries
AverageMaximumMinimumStandard DeviationAverageMaximumMinimumStandard Deviation
January0.30200.660.07200.33
February0.30400.840.701602.93
March1.17801.901.071302.64
April3.262904.833.206109.31
May1.981002.342.091704.03
June0.48400.980.26200.61
July0.35500.900.331001.49
August0.39300.830.35601.20
September0.78701.490.571101.73
October1.351602.721.111302.71
November1.151001.890.871102.17
December0.41400.880.24300.79
Table 5. Statistics of the monthly variations of property damage in Sri Lanka due to lightning, from 1974 to 2019.
Number of Houses DestroyedNumber of Houses Damaged
AverageMaximumMinimumStandard DeviationAverageMaximumMinimumStandard Deviation
January0.00000.000.04100.21
February0.00000.000.24801.20
March0.04100.210.30400.81
April0.09200.353.153808.00
May0.22500.813.2884012.82
June0.02100.150.571202.20
July0.02100.150.24500.82
August0.00000.000.521402.23
September0.04100.211.372904.95
October0.17500.773.268300
November0.20300.582.8964010.20
December0.04200.290.24600.97
Table 6. Statistical overview of the lightning accidents reported in Sri Lanka, from 1974 to 2019.
RangeStatisticsNature of Accidents
Number of DeathsNumber of InjuriesNumber of Houses DestroyedNumber of Houses Damaged
1974–2019
(46 years)
Mean11.9310.830.8516.11
Maximum68676245
Minimum0000
Standard Deviation11.2812.221.6246.00
1980–2019
(40 years)
Mean12.9011.530.9818.50
Maximum68676245
Minimum0000
Standard Deviation11.7312.781.7048.96
1990–2019
(30 years)
Mean15.7313.571.2723.83
Maximum68676245
Minimum2000
Standard Deviation12.2513.761.8755.67
2000–2019
(20 years)
Mean18.4016.501.9035.30
Maximum68676245
Minimum5000
Standard Deviation13.2215.272.0265.67
2010–2019
(10 years)
Mean23.2018.002.0057.30
Maximum68366245
Minimum9700
Standard Deviation16.3310.072.2188.43
Table 7. Seasonal variations of lightning accidents in Sri Lanka, from 1974 to 2019.
Number of
Deaths
Number of
Injuries
Number of Houses
DestroyedDamaged
No.%No.%No.%No.%
FIM20437.219639.4615.415921.5
SWM18333.316533.11435.927537.1
SIM11520.99118.31743.628338.2
NEM478.6469.225.1243.2
Table 8. Statistics of the seasonal variations of lightning accidents in Sri Lanka, from 1974 to 2019.
DeathsInjuredHouses DestroyedHouses Damaged DeathsInjuredHouses DestroyedHouses Damaged
Mean2.222.130.071.73FIM0.800.720.061.20SWM
Maximum29612381017584
Minimum00000000
Standard Deviation3.806.890.295.831.542.250.396.36
Mean1.250.990.183.08SIM0.440.560.010.25NEM
Maximum16135831432211
Minimum00000000
Standard Deviation2.332.440.6811.561.403.210.171.28
Publisher’s Note: MDPI stays neutral with regard to jurisdictional claims in published maps and institutional affiliations.

