Article

COVID-19 Infection and Mortality: Association with PM2.5 Concentration and Population Density—An Exploratory Study

1
Department of Land Surveying and Geo-Informatics, The Hong Kong Polytechnic University, Hong Kong, China
2
Research Institute for Sustainable Urban Development, The Hong Kong Polytechnic University, Hong Kong, China
3
Institute of Space and Earth Information Science, The Chinese University of Hong Kong, Hong Kong, China
4
Department of Geography and Resource Management, The Chinese University of Hong Kong, Hong Kong, China
5
Department of Human Geography and Spatial Planning, Utrecht University, 3584 CB Utrecht, The Netherlands
6
Department of Geography, University of Sussex, Brighton BN1 9RH, UK
7
Department of Civil and Environmental Engineering, Yonsei University, Seoul 03722, Korea
8
Hong Kong Observatory, Hong Kong, China
9
Department of Psychology, The Chinese University of Hong Kong, Hong Kong, China
*
Author to whom correspondence should be addressed.
ISPRS Int. J. Geo-Inf. 2021, 10(3), 123; https://0-doi-org.brum.beds.ac.uk/10.3390/ijgi10030123
Submission received: 25 December 2020 / Revised: 17 February 2021 / Accepted: 24 February 2021 / Published: 1 March 2021
(This article belongs to the Special Issue Geospatial Methods in Social and Behavioral Sciences)

Abstract

:
The novel coronavirus disease (COVID-19) has become a public health problem at a global scale because of its high infection and mortality rate. It has affected most countries in the world, and the number of confirmed cases and death toll is still growing rapidly. Susceptibility studies have been conducted in specific countries, where COVID-19 infection and mortality rates were highly related to demographics and air pollution, especially PM2.5, but there are few studies on a global scale. This paper is an exploratory study of the relationship between confirmed COVID-19 cases and death toll per million population, population density, and PM2.5 concentration on a worldwide basis. A multivariate linear regression based on Moran eigenvector spatial filtering model and Geographically weighted regression model were undertaken to analyze the relationship between population density, PM2.5 concentration, and COVID-19 infection and mortality rate, and a geostatistical method with bivariate local spatial association analysis was adopted to explore their spatial correlations. The results show that there is a statistically significant positive relationship between COVID-19 confirmed cases and death toll per million population, population density, and PM2.5 concentration, but the relationship displays obvious spatial heterogeneity. While some adjacent countries are likely to have similar characteristics, it suggests that the countries with close contacts/sharing borders and similar spatial pattern of population density and PM2.5 concentration tend to have similar patterns of COVID-19 risk. The analysis provides an interpretation of the statistical and spatial association of COVID-19 with population density and PM2.5 concentration, which has implications for the control and abatement of COVID-19 in terms of both infection and mortality.

1. Introduction

While not all infectious diseases have been brought to the level of public concern [1], outbreaks of many viral epidemics worldwide have often led to many fatalities. The Severe Acute Respiratory Syndrome Coronavirus 1 (SARS-CoV-1), swine influenza A H1N1 virus (H1N1), and the Zaire Ebolavirus (Ebola) are amongst a few that have attracted wide public attention, given that they have infected thousands of people and resulted in hundreds of deaths [2]. Similarly, COVID-19, the novel coronavirus disease, is an infectious disease caused by the Severe Acute Respiratory Syndrome Coronavirus 2 (SARS-CoV-2). The first case of COVID-19 was reported in Wuhan City, China in December 2019 [3,4]. It has been ascertained that the virus is transmitted from humans to humans with high infection rate; it is not surprising that COVID-19 has caused a worldwide panic [5,6]. The World Health Organization (WHO) reported 102,139,771 confirmed cases and 2,211,762 deaths as of 31st January 2021, covering 223 countries and regions globally [7]. Many countries have taken preventive measures such as lockdown at varying levels to control human movement and prevent the spread of COVID-19. Some countries are currently recovering, while others are still experiencing the most difficult time of the pandemic. Therefore, it is timely and important to identify key factors including COVID-19 and deeply understand how to contain the deadly virus.
People in close contact with those infected with COVID-19 are advised to follow compulsory quarantine arrangements since COVID-19 can be transmitted not only through droplets, but also through personal contact. Demographic factors such as age brackets or sex composition are shown to have affected mortality rates and the growing confirmed cases in different countries. As well, some studies have reported that old-age virus carriers account for a high proportion of confirmed cases and death toll [8,9]. Other studies have suggested that the population flow is a harbinger of future status of COVID-19, as population movements increase the risk of infection with more people being exposed [10,11]. Thus, it is assumed that there is a correlation between population density and COVID-19 severity due to the human-to-human transmission of COVID-19, and it is urgent to explore how population density can affect COVID-19 infection within a country and across country borders.
In addition, air pollution, especially PM2.5 (fine particulate matter with diameters below 2.5 μm), has a negative impact on people’s health. People with long-term exposure to PM2.5 are vulnerable to lung cancer, cardiovascular disease, and cerebrovascular disease, and these diseases have inevitable links to morbidity and mortality [12]. A report by WHO suggested approximately half of the populations of the 765 investigated cities in 67 countries were exposed to long-term PM2.5 concentrations of at least 2.5 times higher than that of the WHO’s air quality standard level, which may cause additional health risks [13]. A number of studies that focused on China’s situation found that the incidence of mortality from COVID-19 is consistent with the previous findings in other infectious diseases including SARS-CoV-1, and there is a positive correlation with the exposure to a high concentration of pollutants exposure [14,15]. Research studies from other countries show similar findings in the relationship between COVID-19 and short-term PM2.5 exposure [16,17,18]. However, there has been no global-scale study assessing the impact of long-term PM2.5 exposure on COVID-19, and this remains a gap in the literature. In addition, most previous studies mainly used statistical methods when analyzing the impact of risk factors on COVID-19, but spatial factors were largely ignored. Spatial variations across different continents may affect the susceptibility to COVID-19, because PM2.5 concentrations are borderless and dynamic. Considering the varying geographical characteristics, national cultures, and borders of each country, the spatial association between COVID-19 and PM2.5 may differ in different countries and regions.
To fill this research gap, this study aims to integrate traditional statistical methods with spatial correlation analysis based on a Geographic Information System (GIS) platform, using spatial methods to explore the spatial relationship between COVID-19, population density, and PM2.5 concentration on a global basis. This paper considers the significance of the correlation of COVID-19 infection with various influencing factors and the spatial distribution of these correlations from a global perspective. This paper is organized as follows: The study and the datasets utilized are introduced in Section 2. The methodology of exploring the relationship between COVID-19 and both population density and PM2.5 concentration is described in Section 3. In Section 4 and Section 5, the correlation between COVID-19 and influential factors is discussed and some implications are provided based on the correlation results. In Section 6, the conclusions are summarized.

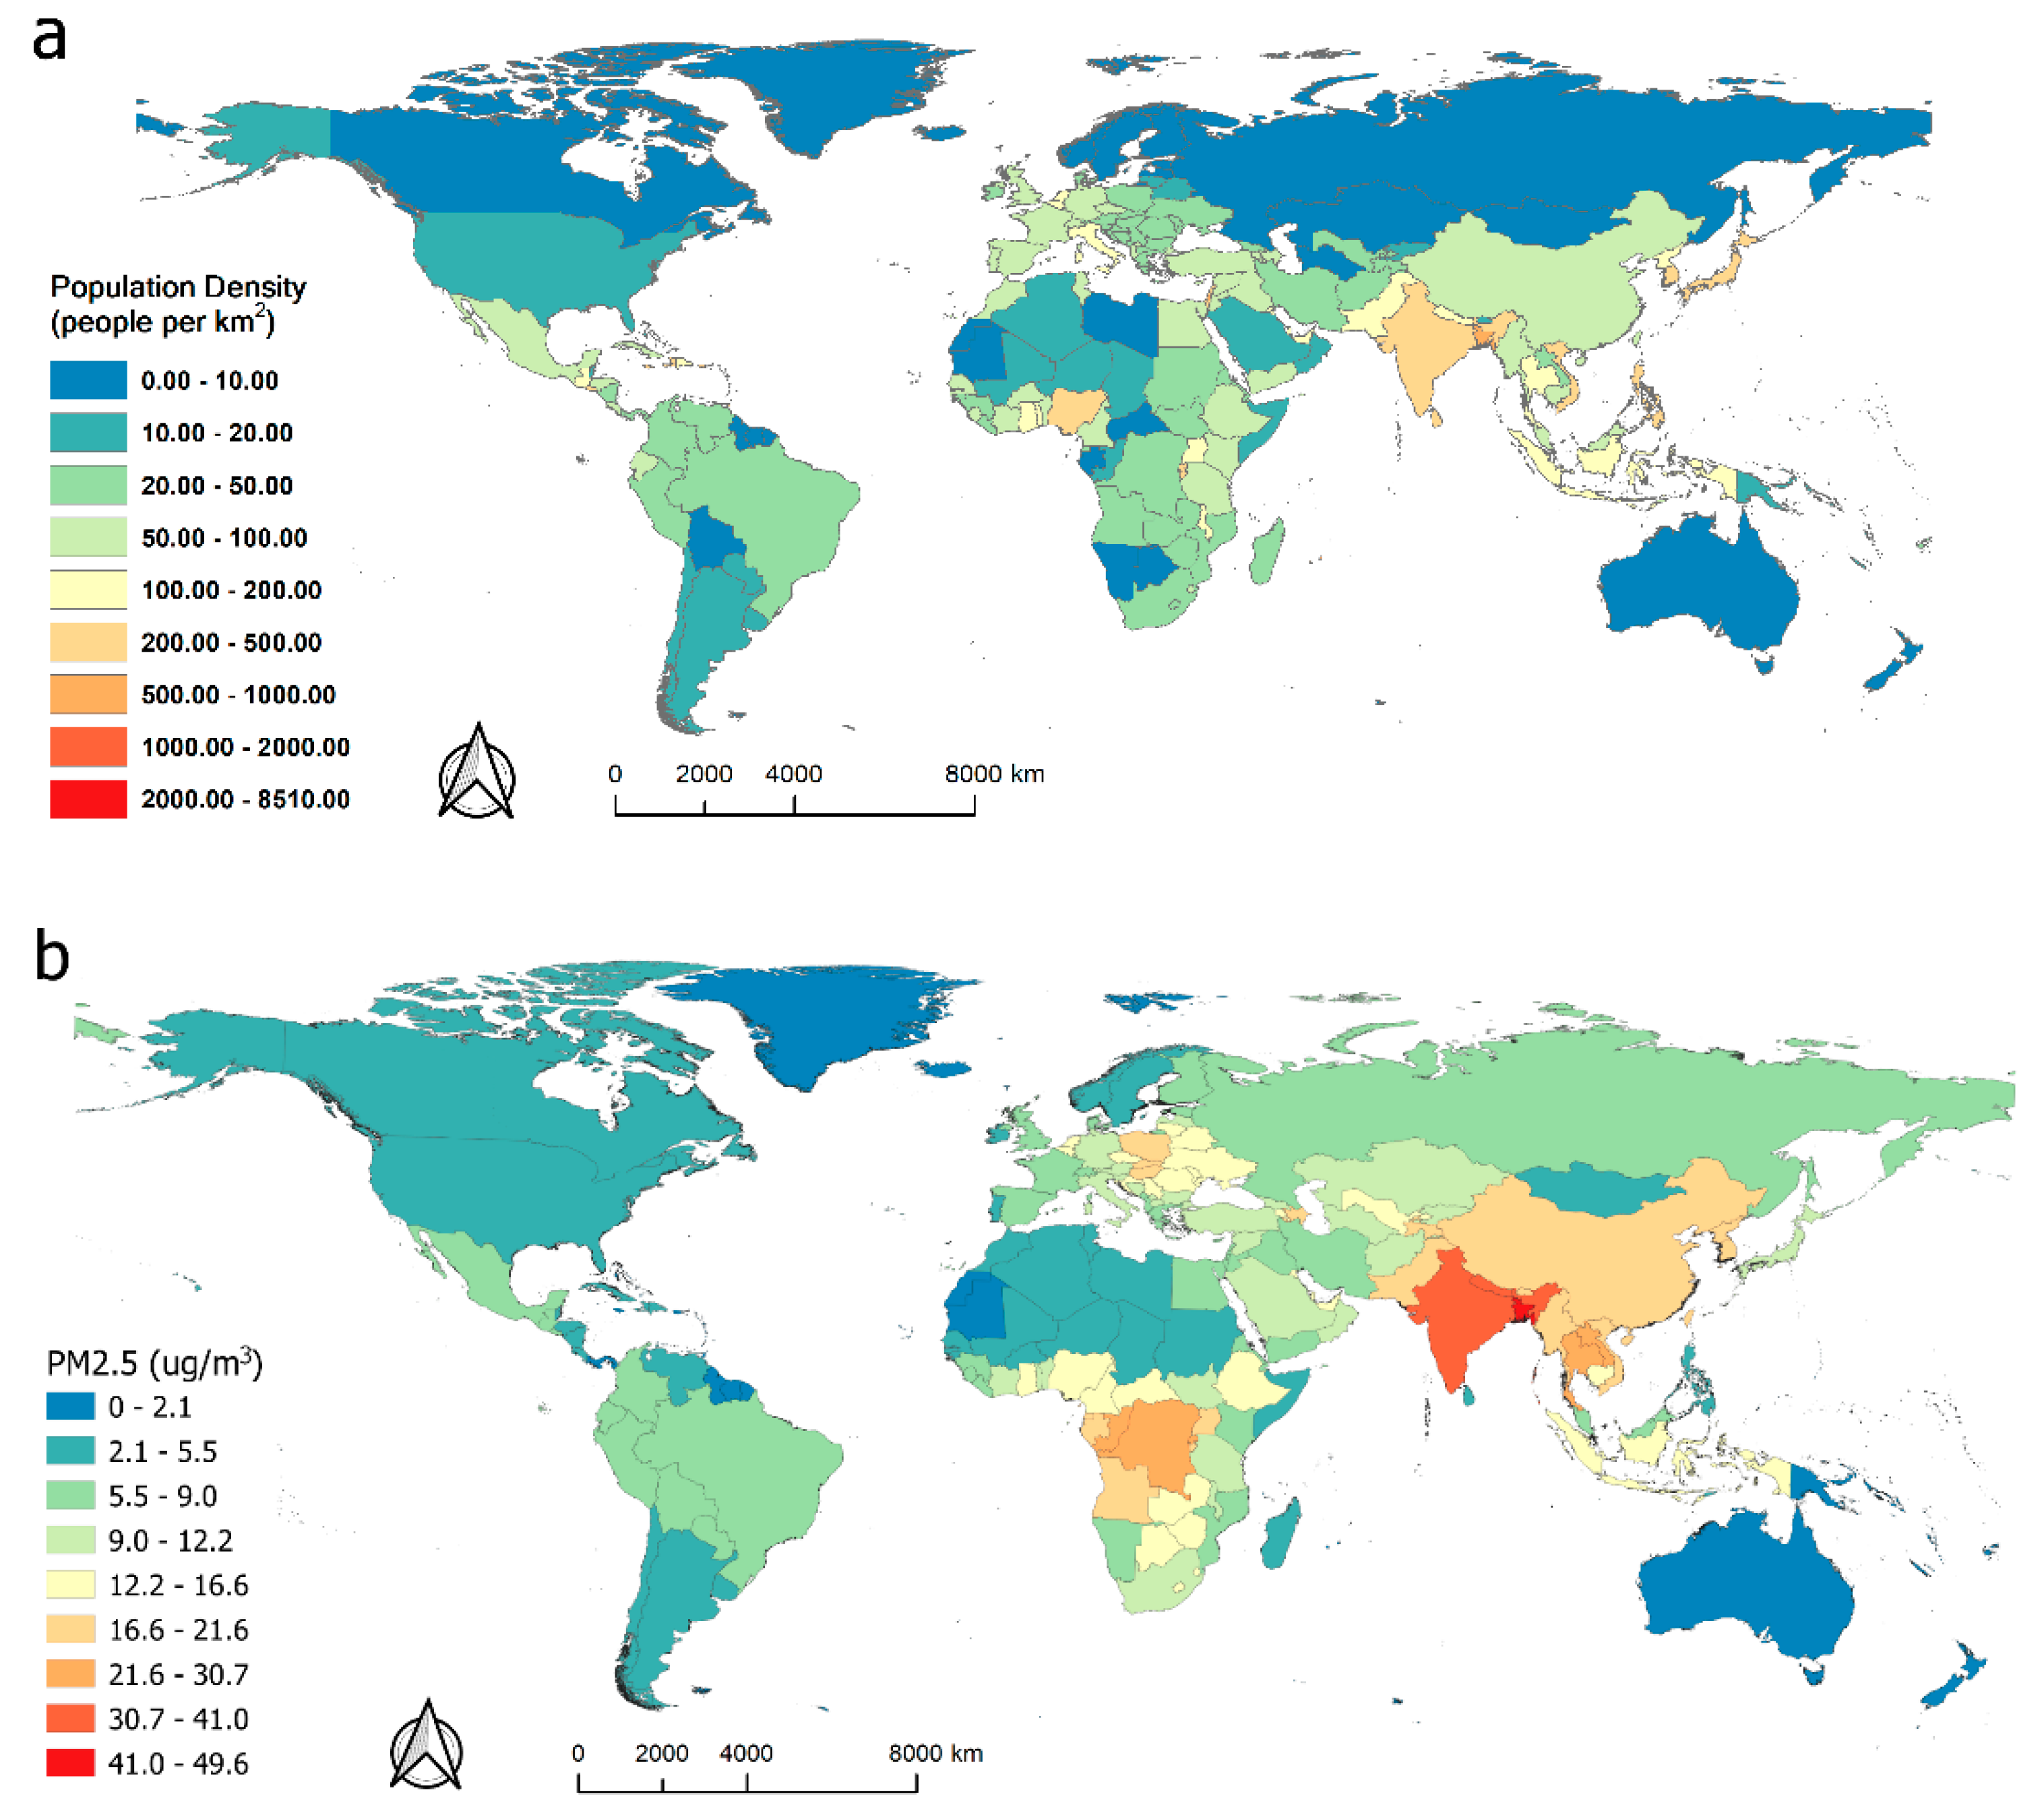
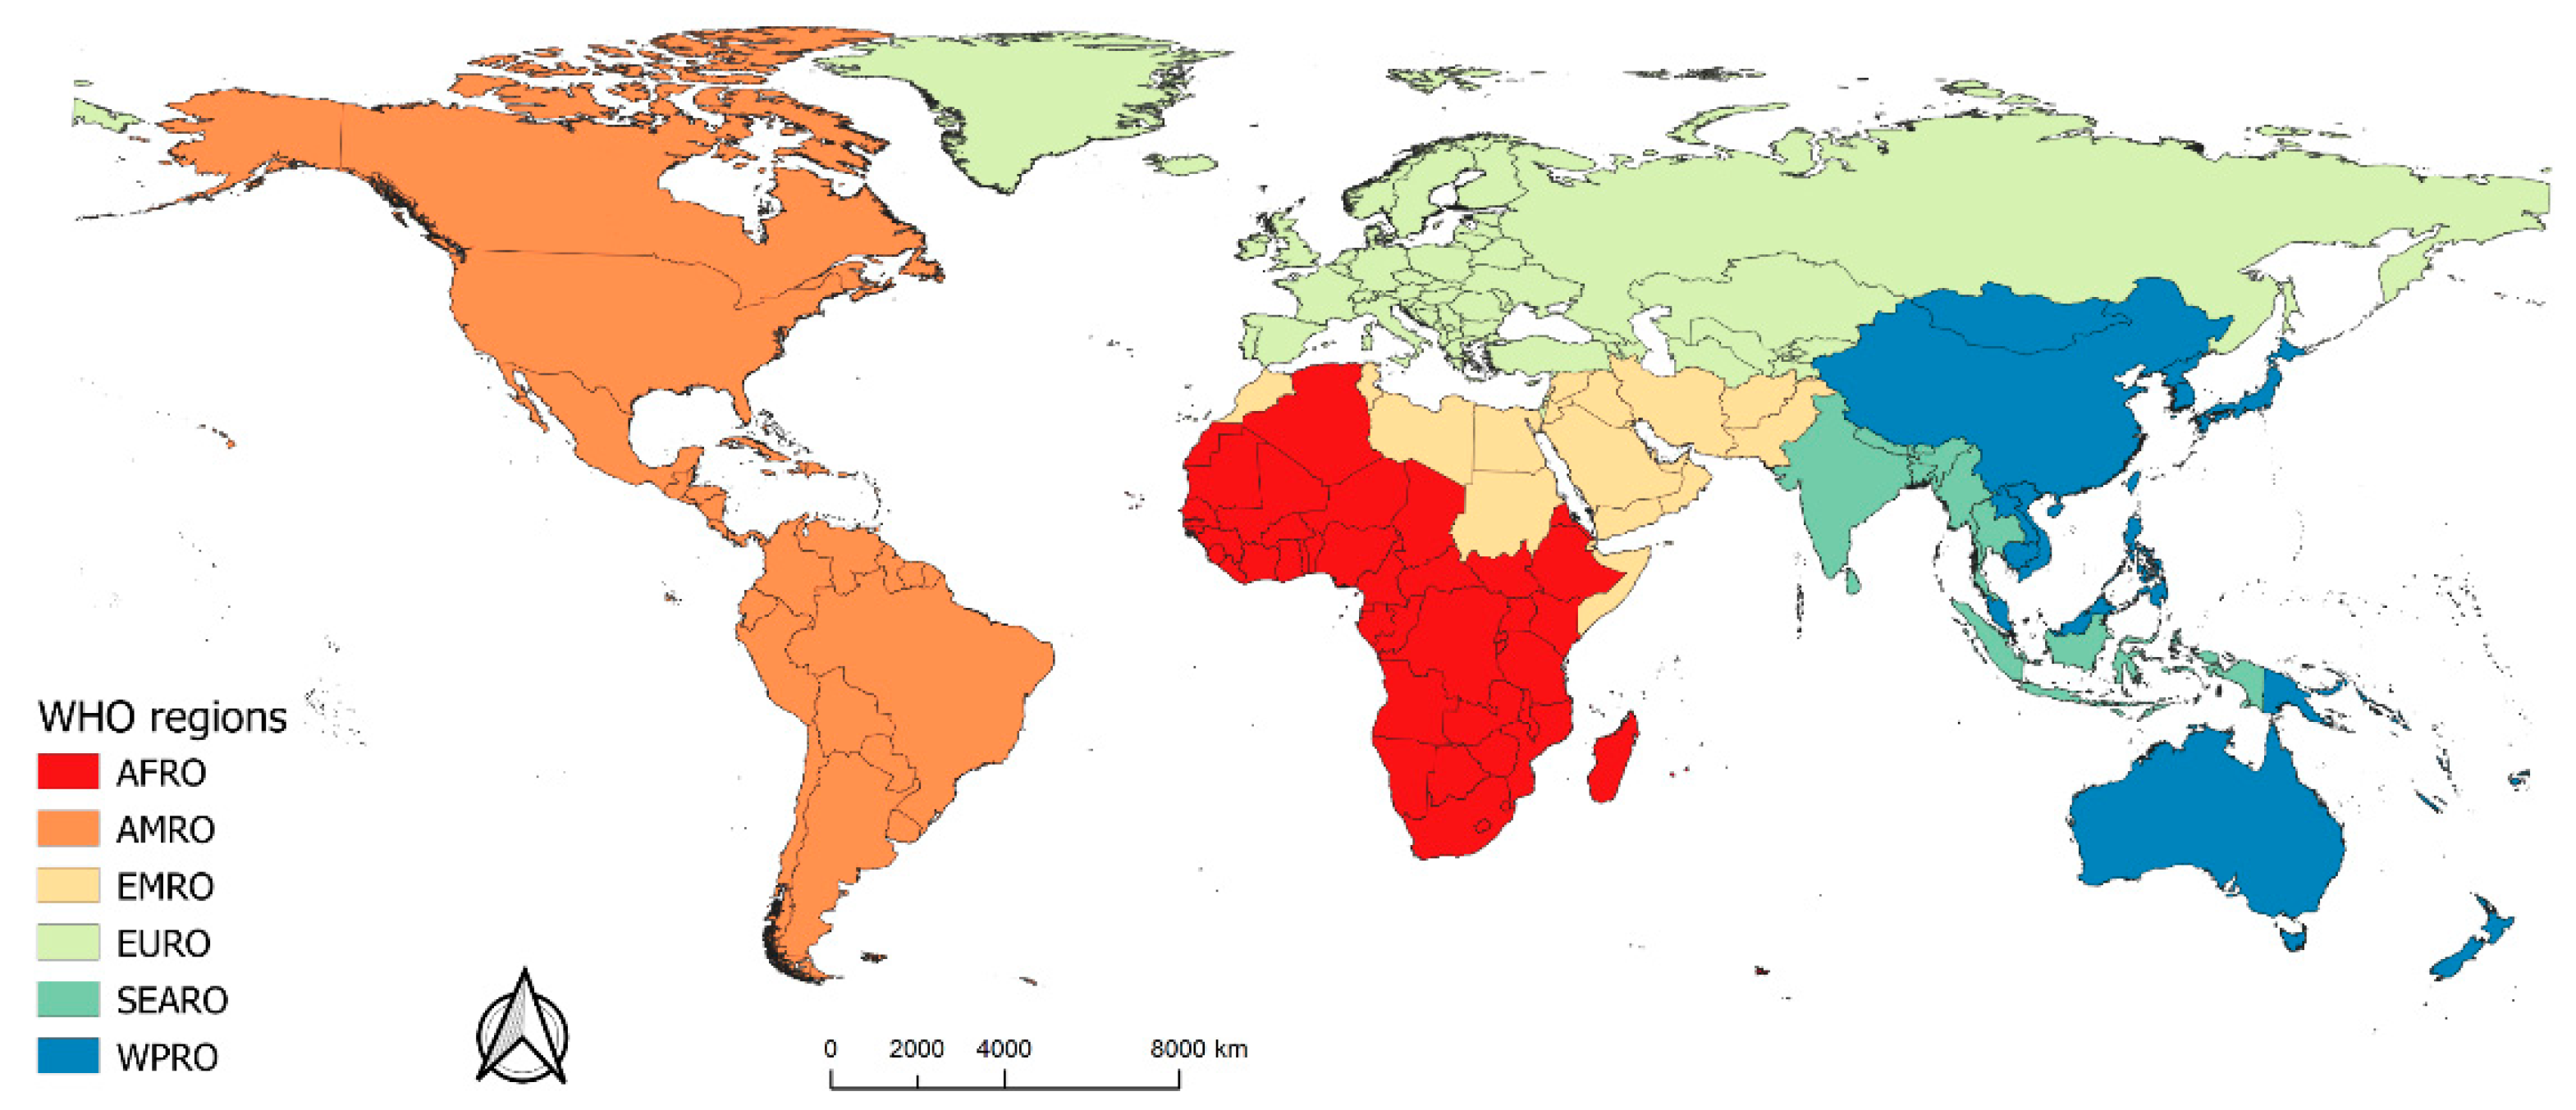
2. Study Area and Data Collection

To understand the effect of PM2.5 concentrations and population density on the severity of COVID-19, this study explored the relationships on a global scale, including 251 countries and regions. Countries with a large number of confirmed COVID-19 cases and deaths per million population are viewed as seriously affected areas. Thus, the number of confirmed COVID-19 cases and deaths per million population were included in this study. In addition, the concentration of PM2.5 (μg/m3), population density (the number of people per km2), Gross Domestic Product per capita based on purchasing power parity after log-transforming to avoid strong positive skew (GDP per capita, US dollars), adult obesity rate (%), smoking rate (%), and the number of hospital beds per 1000 people in this paper are also included.
The number of confirmed COVID-19 cases and deaths per million population was collected from the publicly accessible database compiled by the WHO (https://covid19.who.int/, accessed on 31 January 2021). The data have been available since 8 January 2020, being updated daily; and the data were grouped under different categories, such as province/state, country/region, date, daily COVID-19 confirmed cases, daily deaths, cumulative confirmed cases, and deaths.
Figure 1 shows the global population density distribution, dust, and sea-salt removed PM2.5 concentration. The PM2.5 components in the absence of dust and sea-salt were used in this study instead of total PM2.5 concentration, because it has a close relationship with human activities and has a greater impact on human health [19,20,21]. This study used the satellite-derived PM2.5 concentration data released by the Atmospheric Composition Analysis Group of Dalhousie University (http://fizz.phys.dal.ca/~atmos/martin/?page_id=140, accessed on 7 April 2020). The spatial resolution of this dataset is 0.01° × 0.01° and the data were collected during a long-time span and large coverage from 1998 to 2016 on global scale. The dataset has a high consistency (R2 = 0.81), with the ground data cross-validated [22].
The global population density dataset was derived from the global population size dataset, known as LandScan (https://landscan.ornl.gov/landscan-datasets, accessed on 8 April 2020), which is published by the United States Department of Energy’s (USDOE) Oak Ridge National Laboratory and is a community standard for global population size data. The data, extending from 2000 to 2018, are featured by a resolution of approximately 1 km2 (30″ × 30″) and are estimated by referring to the sub-national census counts conducted in each country, allowing for other spatial data and socioeconomic data, including those in terms of land cover, roads, urban areas, and high-resolution imagery analysis. Thus, LandScan population size data is consistent with each country’s geographical nature and region [23]. Population density of every country can be calculated based on the total population size and the area of every country.
Other factors that are expected to affect the severity of COVID-19 include socioeconomic factors, such as GDP per capita and hospital accommodation. As to our best understanding, in many countries, infected patients are hospitalized and quarantined in a timely manner once they are diagnosed as positive, which can reduce the risk to transmission to family members and other close contacts since COVID-19 virus can be transmitted among humans. For example, the practiced protocol in some countries is by using make-shift modular hospitals to provide more hospital beds for patients infected with COVID-19 as well as to prevent infection and mortality. Thus, the number of hospital beds was included to explore the association with COVID-19 confirmed cases and deaths. As better medical conditions may be provided in countries with higher GDP per capita, and patients are more likely to get timely diagnosis and treatment, so the risk of infection can be reduced [24]. Two additional influencing factors specific to each country, namely smoking rate and obesity rate, are considered to examine the association between COVID-19, population density, and PM2.5 concentration. Smoking and obesity are major health risk concerns prevalent in the world. As past studies observed, the habit of smoking is associated with a higher risk of lung cancer and other cancers, and respiratory diseases. In addition, obesity can weaken the immune response to infectious diseases and increase people’s susceptibility to infections [25]. Although the WHO claims that most infected people would develop mild to moderate respiratory illness, some studies showed that people with obesity are more likely to experience severe COVID-19 symptoms and complications [26,27]. Consequently, smoking rate and obesity rate as health risk factors were investigated in the current study. Table 1 shows the summary of datasets used in this analysis.

3. Methodology

An analysis of the correlation between COVID-19, population density and PM2.5 concentration on a global scale was conducted based on Spearman rank correlation, multivariate linear regression based on Moran eigenvector spatial filtering model, Geographical Weighted Regression (GWR) model, and bivariate local spatial association analysis. Spearman rank correlation, as one of the traditional statistical analysis methods, was used to explore the strength of correlation between two variables due to the large data span between countries. Multivariate linear regression based on Moran eigenvector spatial filtering model was applied to describe the relationship of COVID-19 with population density and PM2.5 concentration when it is also mediated by other influencing factors. These two methods were used to investigate the global association between COVID-19, population density, and PM2.5 concentration. GWR model, as a common spatial regression method, was involved to capture the specific influence of population density and PM2.5 concentration on COVID-19 transmission and death in different regions when controlled by other influencing factors. In addition, bivariate local spatial association method was used to explore the local association between different variables to visualize the relationship of given locations and adjacent areas.

3.1. Spearman Rank Correlation

The correlation between the severity of COVID-19 (confirmed cases and deaths per million population), PM2.5 concentration, population density, and other influencing factors can be investigated with the aid of the Spearman rank correlation coefficient [28], which is a non-parametric correlation method for measuring the strength and degree of association between two variables. Instead of exploring a linear relationship, in the case of Spearman rank correlation, there are no strict conditions on the association, and the observed data are ranked following a specific sequence. The correlation coefficients indicate whether there is a potential relationship between COVID-19, PM2.5 concentration, and population density. The formula below can be used to calculate the Spearman rank correlation coefficient, and r s is as follows:
r s = 1 6 i n d i 2 / n ( n 2 1 )
where d i denotes the ranked difference between the i pairs of variables, and n denotes the number of ranks in each of two variables. The correlation coefficient value ranges from −1 to 1. If r s > 0 , then there is a similar distribution and ranking of variables. If r s < 0 , then the variables are ranked differently. The absolute value of r s represents the degree of correlation. If the value of r s is closer to ± 1 , the correlation between two variables is stronger.

3.2. Multivariate Linear Regression Based on Moran Eigenvector Spatial Filtering for COVID-19

Moran eigenvector spatial filtering (MESF) was integrated into two multivariate linear regression models [29,30,31], which were adopted to explore the relationship between COVID-19 confirmed cases and deaths per million population respectively with other influencing factors. Conventional linear regression can be used to explore the relationship between independent and dependent variables, but it is likely that the spatial autocorrelation effects of variables are omitted. That is, a neighborhood effect, like PM2.5 concentration, tends to be similar within a given neighborhood. Therefore, MESF was involved to deal with spatial autocorrelation in regression analysis in order to filter the variables and separate spatial effects from the variables. MESF was developed based on the Moran coefficient (MC) to filter spatial autocorrelation out of regression residuals and then transferring it to the regression intercept by utilizing a spatial weights matrix [32], which can be expressed as follows:
M C M = ( I 11 T / n ) C ( I 11 T / n ) =   E Λ E T
where I is the n-by-n identity matrix, 1 is the n-by-1 vector whose elements are all 1, T is the matrix transpose operator, and C is the n-by-n spatial weights matrix. For the decomposition, it contains a set of n eigenvalues and the corresponding eigenvectors.   Λ is an n-by-n diagonal matrix whose diagonal elements are the n eigenvalues λ = ( λ 1 , λ 2 , , λ n ) with a descending order. E = ( E 1 ,   E 2 , , E n ) represents the n corresponding eigenvectors to capture the degree of spatial autocorrelation. It should be noted that all eigenvectors are orthogonal and uncorrelated. In this way, MESF introduced a subset of the eigenvectors as control variables in the regression model, which can be expressed as:
Y j = α + β i x i j + β k E k + ε
where, Y denotes the attributes of COVID-19 (total confirmed cases or deaths per million population in the j th country); x i j denotes the i th variable in the j th country, including population density (the number of people per km2), PM2.5 concentration (μg/m3), GDP per capita (US dollars), adult obesity rate (%), smoking rate (%) and hospital accommodation in this paper. E k is a set of the k eigenvectors, β k is the corresponding coefficients.   α represents the intercept, and β i denotes the standardized regression coefficient. ε denotes the error term. This model does not affect spatial autocorrelation because β k E k have already accounted for the effects of spatial autocorrelation, and the criterion are generally made for identifying the candidate subset is when the Moran’s I absolute value is greater than 0.25.
Based on the multivariate regression analysis results, it was determined whether there is a significant positive or negative relationship between COVID-19, population density, and PM2.5 concentration when COVID-19 is affected by certain variables. As the variables in this study are studied in different units and on different scales, the dependent variables and independent variables have been normalized and the standardized regression coefficient is used for the comparison [33]. If β i > 0 ( p < 0.05 ), COVID-19 has a statistically positive relationship with the i th variable. If β i < 0 ( p < 0.05 ), then there is a negative relationship between COVID-19 and the i th variable. The greater the absolute value of the regression coefficient, the stronger the relationship between COVID-19 and the influencing factor.

3.3. Geographically Weighted Regression Model

Different from the multivariate linear regression method, Geographically Weighted Regression (GWR) model as a local spatial regression model was proposed to calculate the local-specific interaction between the dependent and explanatory variables by incorporating geographic context into the regression parameters [34,35], which can be denoted as follows:
Y i = β i 0 + i = 0 m β i k x i k + ε i
where, Y i is the number of COVID-19 confirmed cases and deaths per million population in the i th country, x i k is the k th explanatory variable in location i , β i k is the corresponding regression coefficients, m is the total number of independent variables, β i 0 is the intercept, and ε i is the error term.
GWR assumes that the regression coefficients vary spatially rather than being fixed as the parameters of the global estimation. As the GWR model explains the spatial characteristics of independent variables for the local estimation, the specific impact of every explanatory variable on COVID-19 can be detected in different regions, which reflects the approximate influence of population density and PM2.5 concentration on COVID-19 transmission and death when controlled by other influencing factors.

3.4. Bivariate Local Spatial Association

The bivariate local spatial association depicts and visualizes the local spatial correlation between different variables [36]. It describes the relationship between different values of one variable at a given location and the other variable’s observations at the surrounding locations. It can be defined as:
m a b = Z a W s Z b
where, Z a = ( x a x a ¯ ) / σ a and Z b = ( y b y b ¯ ) / σ b are the standardized values of observations. x a denotes the attribute of COVID-19, and y b denotes the risk factors (population density or the concentration of PM2.5) in each research unit. σ a and σ b denote the variances of the corresponding variables. W s denotes the doubly standardized spatial weight matrix, which means the “neighbor set” for every variable with ono-zero elements for neighbors and zero for others. In this study, the K-Nearest Neighbour (KNN) was adopted and the number of neighbours (k) was defined as seven to construct the spatial weight metrics.
Bivariate analysis results can be divided into four classes: high-high, low-high, low-low, and high-low, respectively; these four classes correspond to four quadrants defined by the x-axis and y-axis. The results of high-high and low-low clusters can be interpreted as the locations compared with adjacent areas, which have high or low values for both variables. While the results of high-low and low-high clusters mean that the locations have high/low values for the first variable but opposite features for the second variable. The groups of high-high and low-low can also be further divided into spatial clusters, and they are distributed in the first and third quadrant, respectively; they represent a positive spatial correlation. In contrast, the groups of low-high and high-low belong to the spatial outliers, and they are located in the second and the fourth quadrant; they indicate a negative correlation between different observations. In this paper, this method was adopted to determine the significantly positive or negative spatial associations between COVID-19, population density, and PM2.5 concentration in specific countries.

4. Results

4.1. Global Correlation between COVID-19 and Impact Factors

The annual averages of PM2.5 concentration, population density, GDP per capita, obesity rate, and the number of hospital beds per 1000 people and the smoking rate in every country were collected to explore their associations with COVID-19 based on the Spearman Rank Correlation method. Table 2 shows the correlations between these factors and the total number of confirmed COVID-19 cases per million population, as well as the number of deaths per million population, where the statistically significant factors are indicated (p < 0.05 and p < 0.01). Both the number of COVID-19 confirmed cases and the death toll per million population display a moderate positive correlation with GDP per capita, population density, the number of hospital beds, and PM2.5 (r = 0.5), and there is also a weaker positive association with the smoking rate and obesity rate (r = 0.2). The correlation coefficients between the confirmed cases of COVID-19 and the influencing factors are slightly higher than those between the deaths and the influencing factors, except obesity rate. This suggests there is a larger number of confirmed cases and deaths per million population in countries with higher GDP per capita level, PM2.5 concentration, and population density. Based on the Spearman correlation results, it can be found that COVID-19 in a specific country is related to the people’s health status and, to some extent, to the country’s socioeconomic and air quality.

4.2. Relationship between COVID-19 and Both Population Density and PM2.5 Concentrations

A multivariate linear regression based on Moran eigenvector spatial filtering model was used to further analyze the relationship between COVID-19 confirmed cases and deaths per million population, population density, PM2.5 concentration, and other variables such as GDP per capita, smoking rate, obesity rate, and the number of hospital beds by splitting the spatial autocorrelation effects of variables. At the same time, the standardized coefficients and significance level are shown in Table 3. This model displays great goodness of fit in both confirmed cases and deaths (p < 0.001), with an adjusted R2 of 0.549 and 0.562, respectively. In the case of cumulative confirmed cases and deaths per million population of COVID-19, it has stronger significant positive associations with GDP per capita, population density, obesity rate, smoking rate, and PM2.5 concentration. Moreover, it presents a negative relationship with the number of hospital beds. The effect of deaths on other variables is similar to that of the confirmed cases, and the main difference is that the regression coefficients become smaller, except that of PM2.5. Collinearities among independent variables can result in biases in the model’s estimation. To determine whether there is collinearity among the various variables, the variance inflation factors (VIF) were applied to detect statistical correlation. Given that the VIF values of all variables range from 1 to 2, we conclude that there is no multicollinearity and autocorrelation between the independent variables in this model. In addition, MESF was used to eliminate the influence of spatial autocorrelation among the observations. It indicates the variables have been pre-filtered for both spatial and statistical autocorrelation; in addition, the regression model is deemed as effective and reasonable.
Among the variables involved, GDP per capita is found to be the most influential factor for COVID-19. With the use of the multivariate regression model, it is predicted that an increase in COVID-19 confirmed cases and deaths of around 0.15 for each unit increase in GDP per capita. More confirmed cases and deaths are in regions with higher GDP per capita where they have relatively higher mobility, which is also a way of transmission for viruses. In addition, countries with high GDP per capita tend to have the ability to do more testing and complete registration of cases and deaths. Population density is another critical factor in COVID-19 outbreaks and transmission at country level, which implies countries with higher population density are more likely to be affected by COVID-19 according to the results. That may be because faster spread within higher population density makes it difficult to control the transmission. The infection risk is more likely to increase as the virus can be transmitted from humans to humans. For the other three factors that have a significant impact on confirmed COVID-19 cases and deaths, there is about a 0.07, 0.02, and 0.01 change for each unit in the corresponding variable, and the difference is adult obesity rate, smoking rate, and PM2.5 concentration, which shows a positive effect, but the effect of hospital accommodation is reversed. It means that regions with severe PM2.5 pollution and high obesity rate are more likely to increase the risk of COVID-19 infection and mortality, while increasing the number of hospital beds is beneficial to control and abate COVID-19. It has been suggested that long-term exposure to PM2.5 pollution, smoking rate, and obesity are harmful to people’s health, and obesity can also weaken human immunity, thereby increasing the risk of infection. In addition, the habit of smoking can depress pulmonary immune function and it is more likely to increase the risk of infection and make more serious outcomes among infected patients [37]. Results also suggested that there were fewer confirmed cases and fewer deaths when there were more hospital beds. The possible reason is people can get better medical care and timely treatment to reduce the risk of mortality as well as to reduce the chance of spreading the virus if the patients are hospitalized.

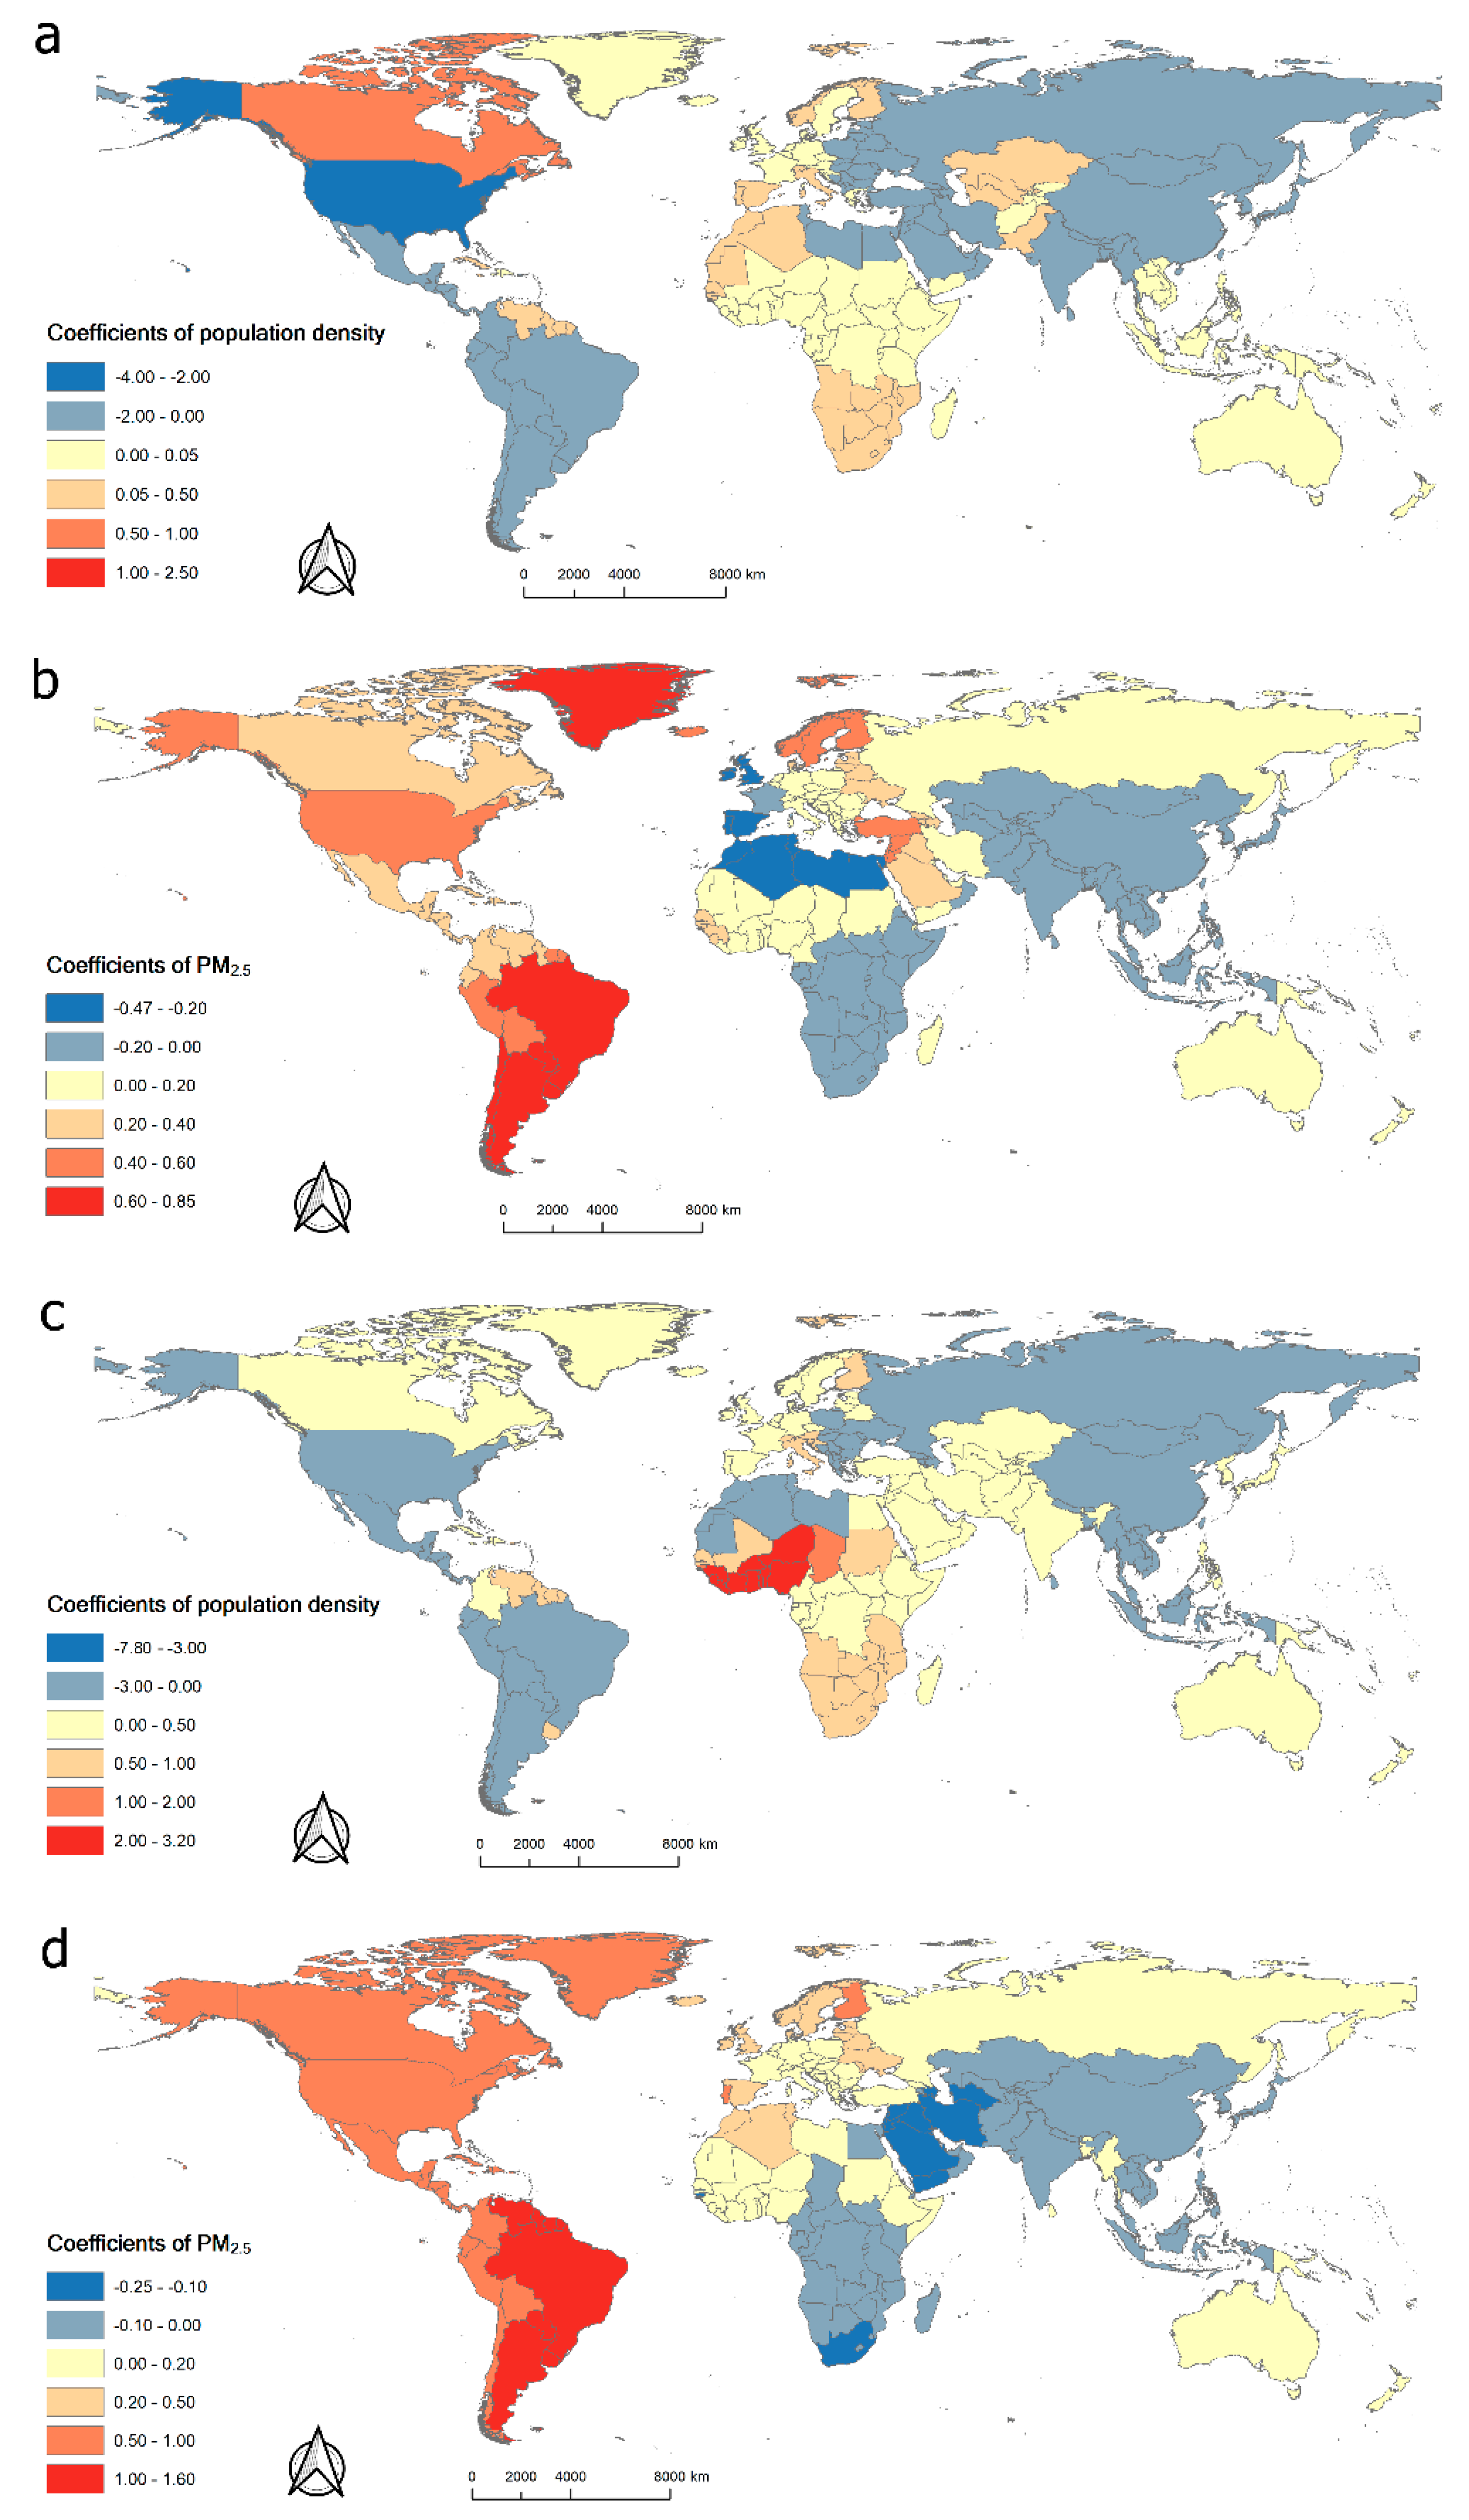
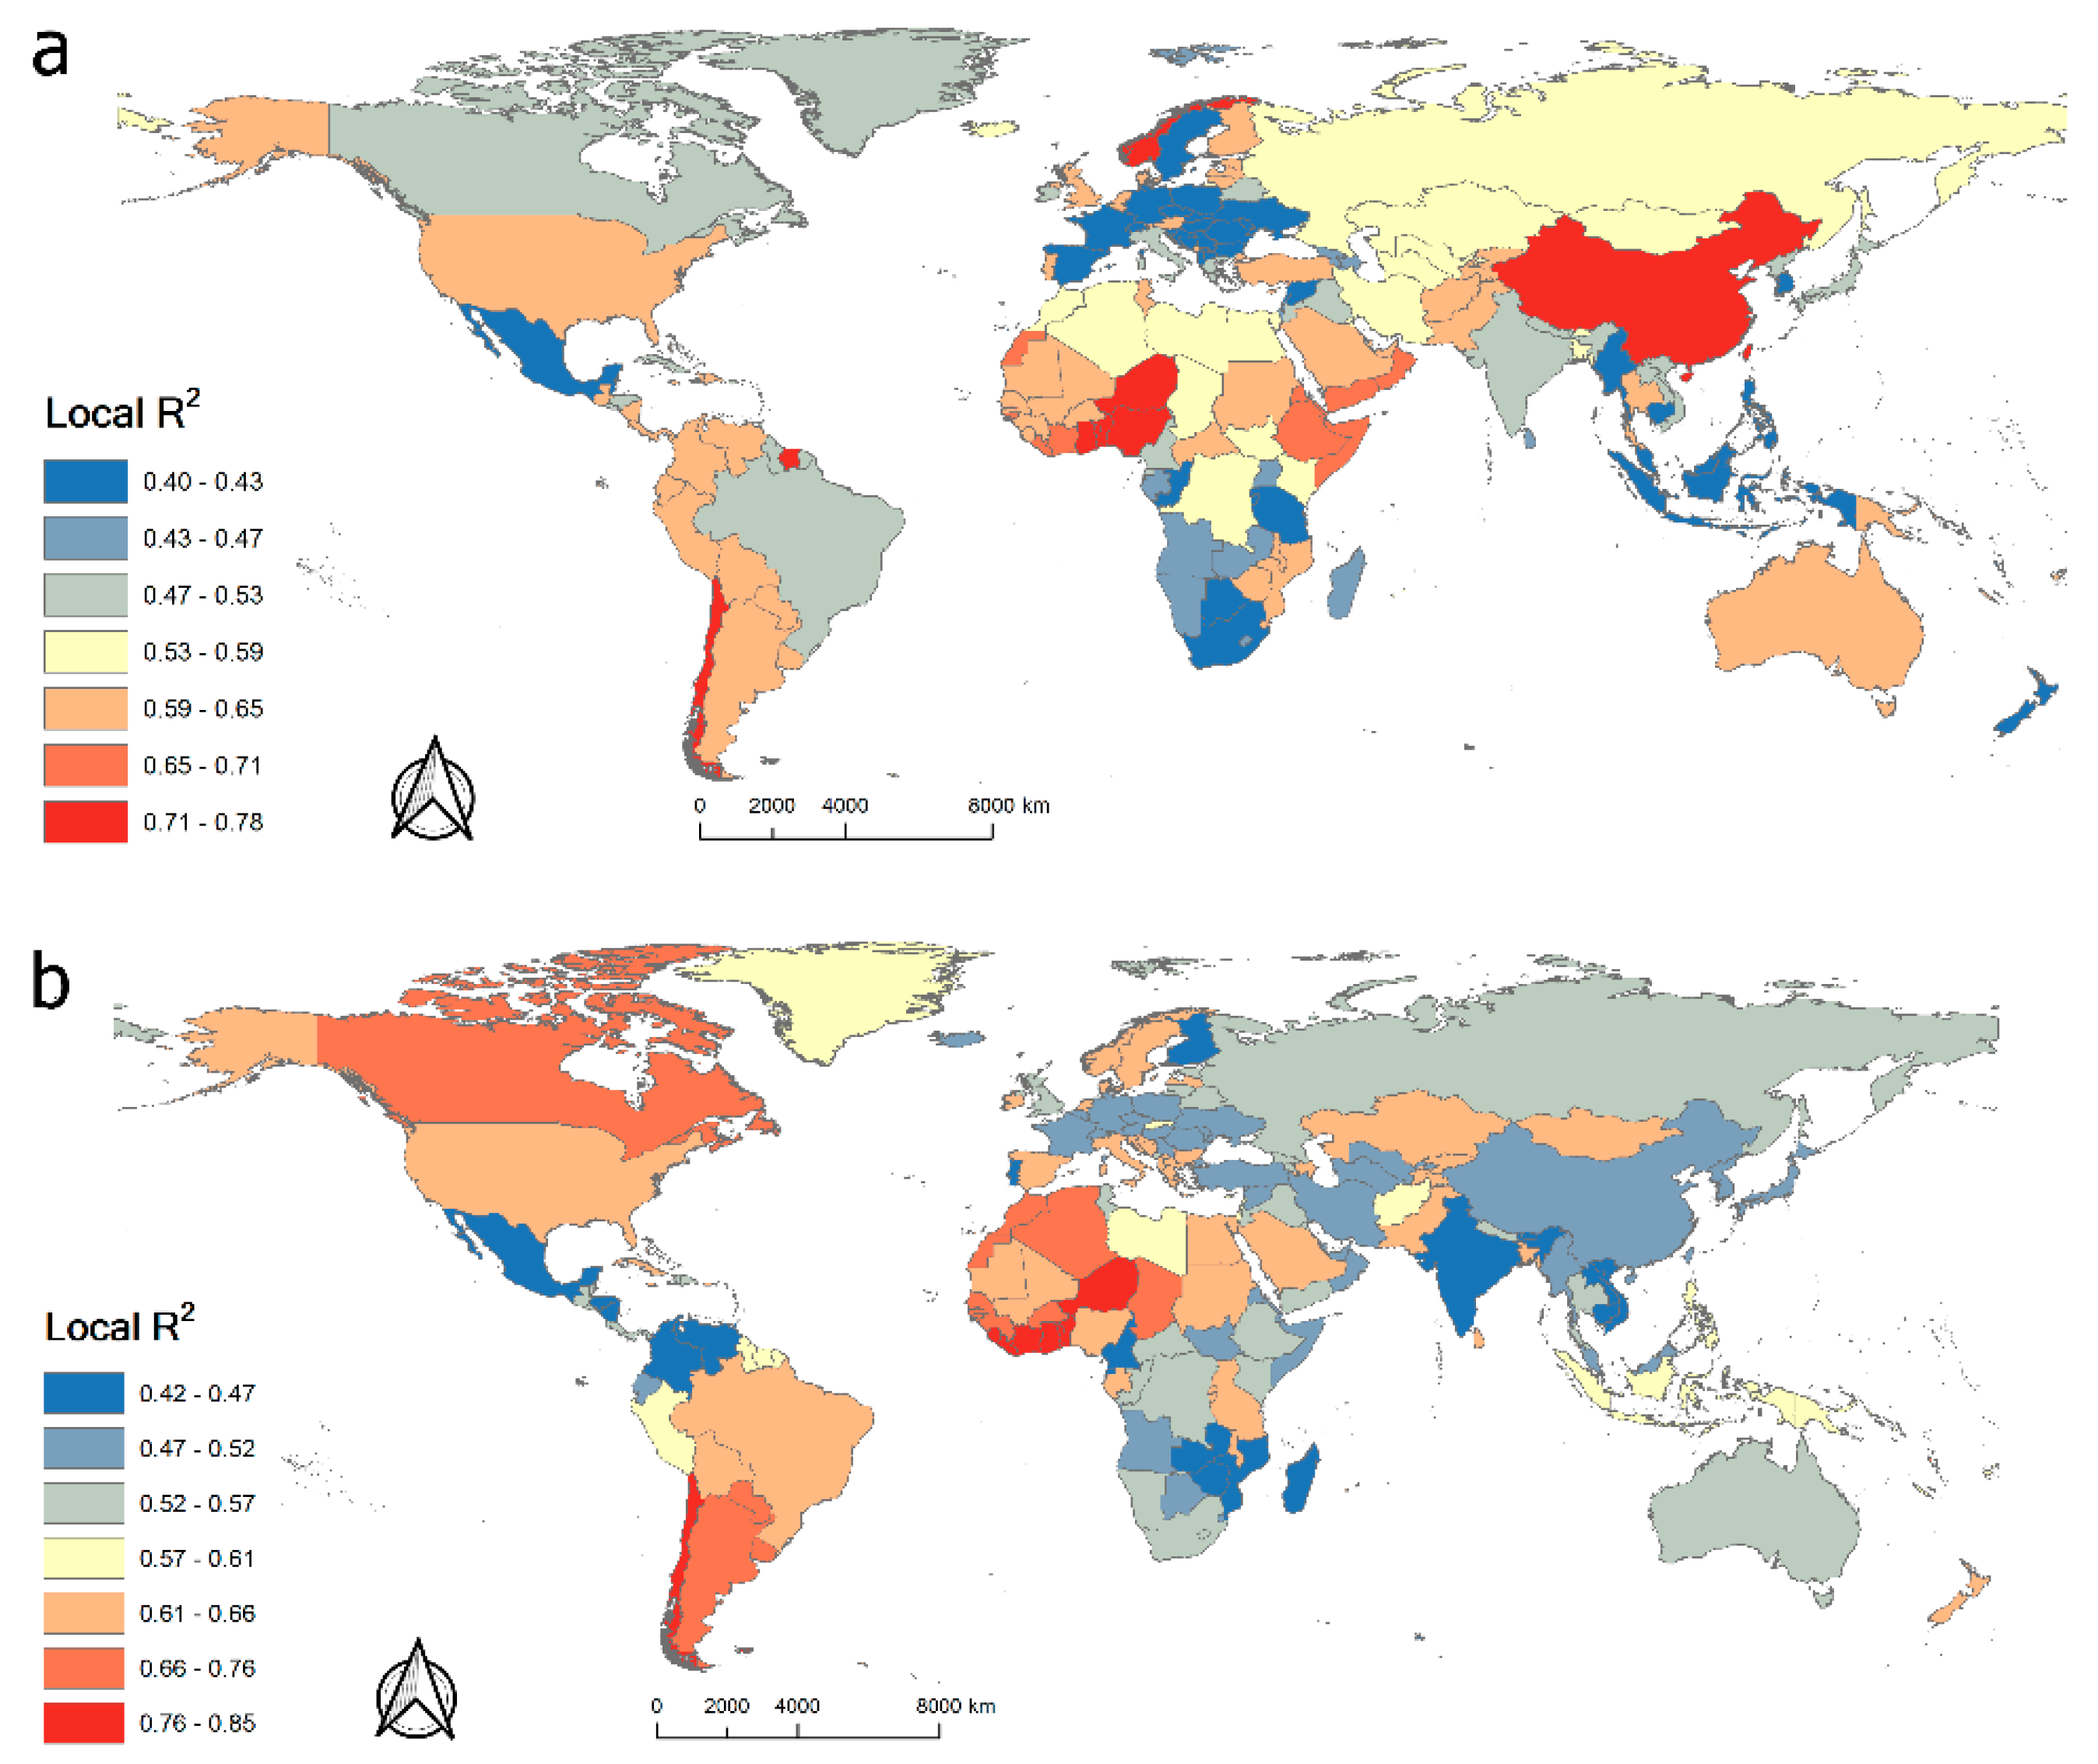
4.3. Spatial Regression Results Based on GWR

Although multivariate linear regression based on MESF model was employed to test the relationship between COVID-19 and the influencing factors with good fitness, the correlation was found to be numerically stable across the study area. Therefore, to explore the local spatial variation in the relationships with the number of COVID-19 confirmed cases and deaths per million population, GWR was adopted to further analyze the influence of population density and PM2.5 on COVID-19. The adjusted R2 for the number of confirmed cases and deaths per million population based on the selected factors (population density, PM2.5 concentration, the number of hospital beds, smoking rate, obesity rate, and GDP per capita) was 0.655 and 0.717, respectively, indicating a very high explanatory performance. The spatial distribution of local R2 was also evaluated and displayed in Figure 2, with a range from 0.40 to 0.78 and 0.42 to 0.85 for confirmed cases and deaths, respectively, which also shows the goodness-of-fit of the GWR model. Relatively higher R2 values were found in most countries, indicating the selected factors could well explain the situation. Although some areas have relatively lower values, close to 0.4, which still maintains an acceptable level.
The spatial distribution of estimated influence of population density and PM2.5 concentration on COVID-19 confirmed cases and deaths per million population was presented in Figure 3, and the coefficients of other influencing factors were displayed as the supplementary materials (Figures S1 and S2). As seen in Figure 3, population density shows a positive effect on both COVID-19 confirmed cases and deaths in most countries located in Africa and Australia, as well as some countries in Europe, but a negative impact in most countries in South and North America. As well, the distribution of coefficients for confirmed cases and deaths has a similar spatial pattern at the country level. There is a negative relationship between PM2.5 concentration and COVID-19 in most Asian countries and some countries in Africa, but a positive correlation in other regions (Figure 3b,d). It can be found that the coefficients of PM2.5 concentration (−0.25~0.85) vary less significantly than population density (−7.8~3.2), which implies population density plays a more important role than PM2.5 concentration in COVID-19 transmission and death, consistent with the results estimated in Spearman correlation model and multivariate linear regression based on MESF model. Compared with the importance of each influencing factor on COVID-19 by region, it can be found that PM2.5 concentration, GDP per capita, and the number of hospital beds play more important roles in North and South America; population density has a larger influence on COVID-19 in most African countries and some European and Asian countries.

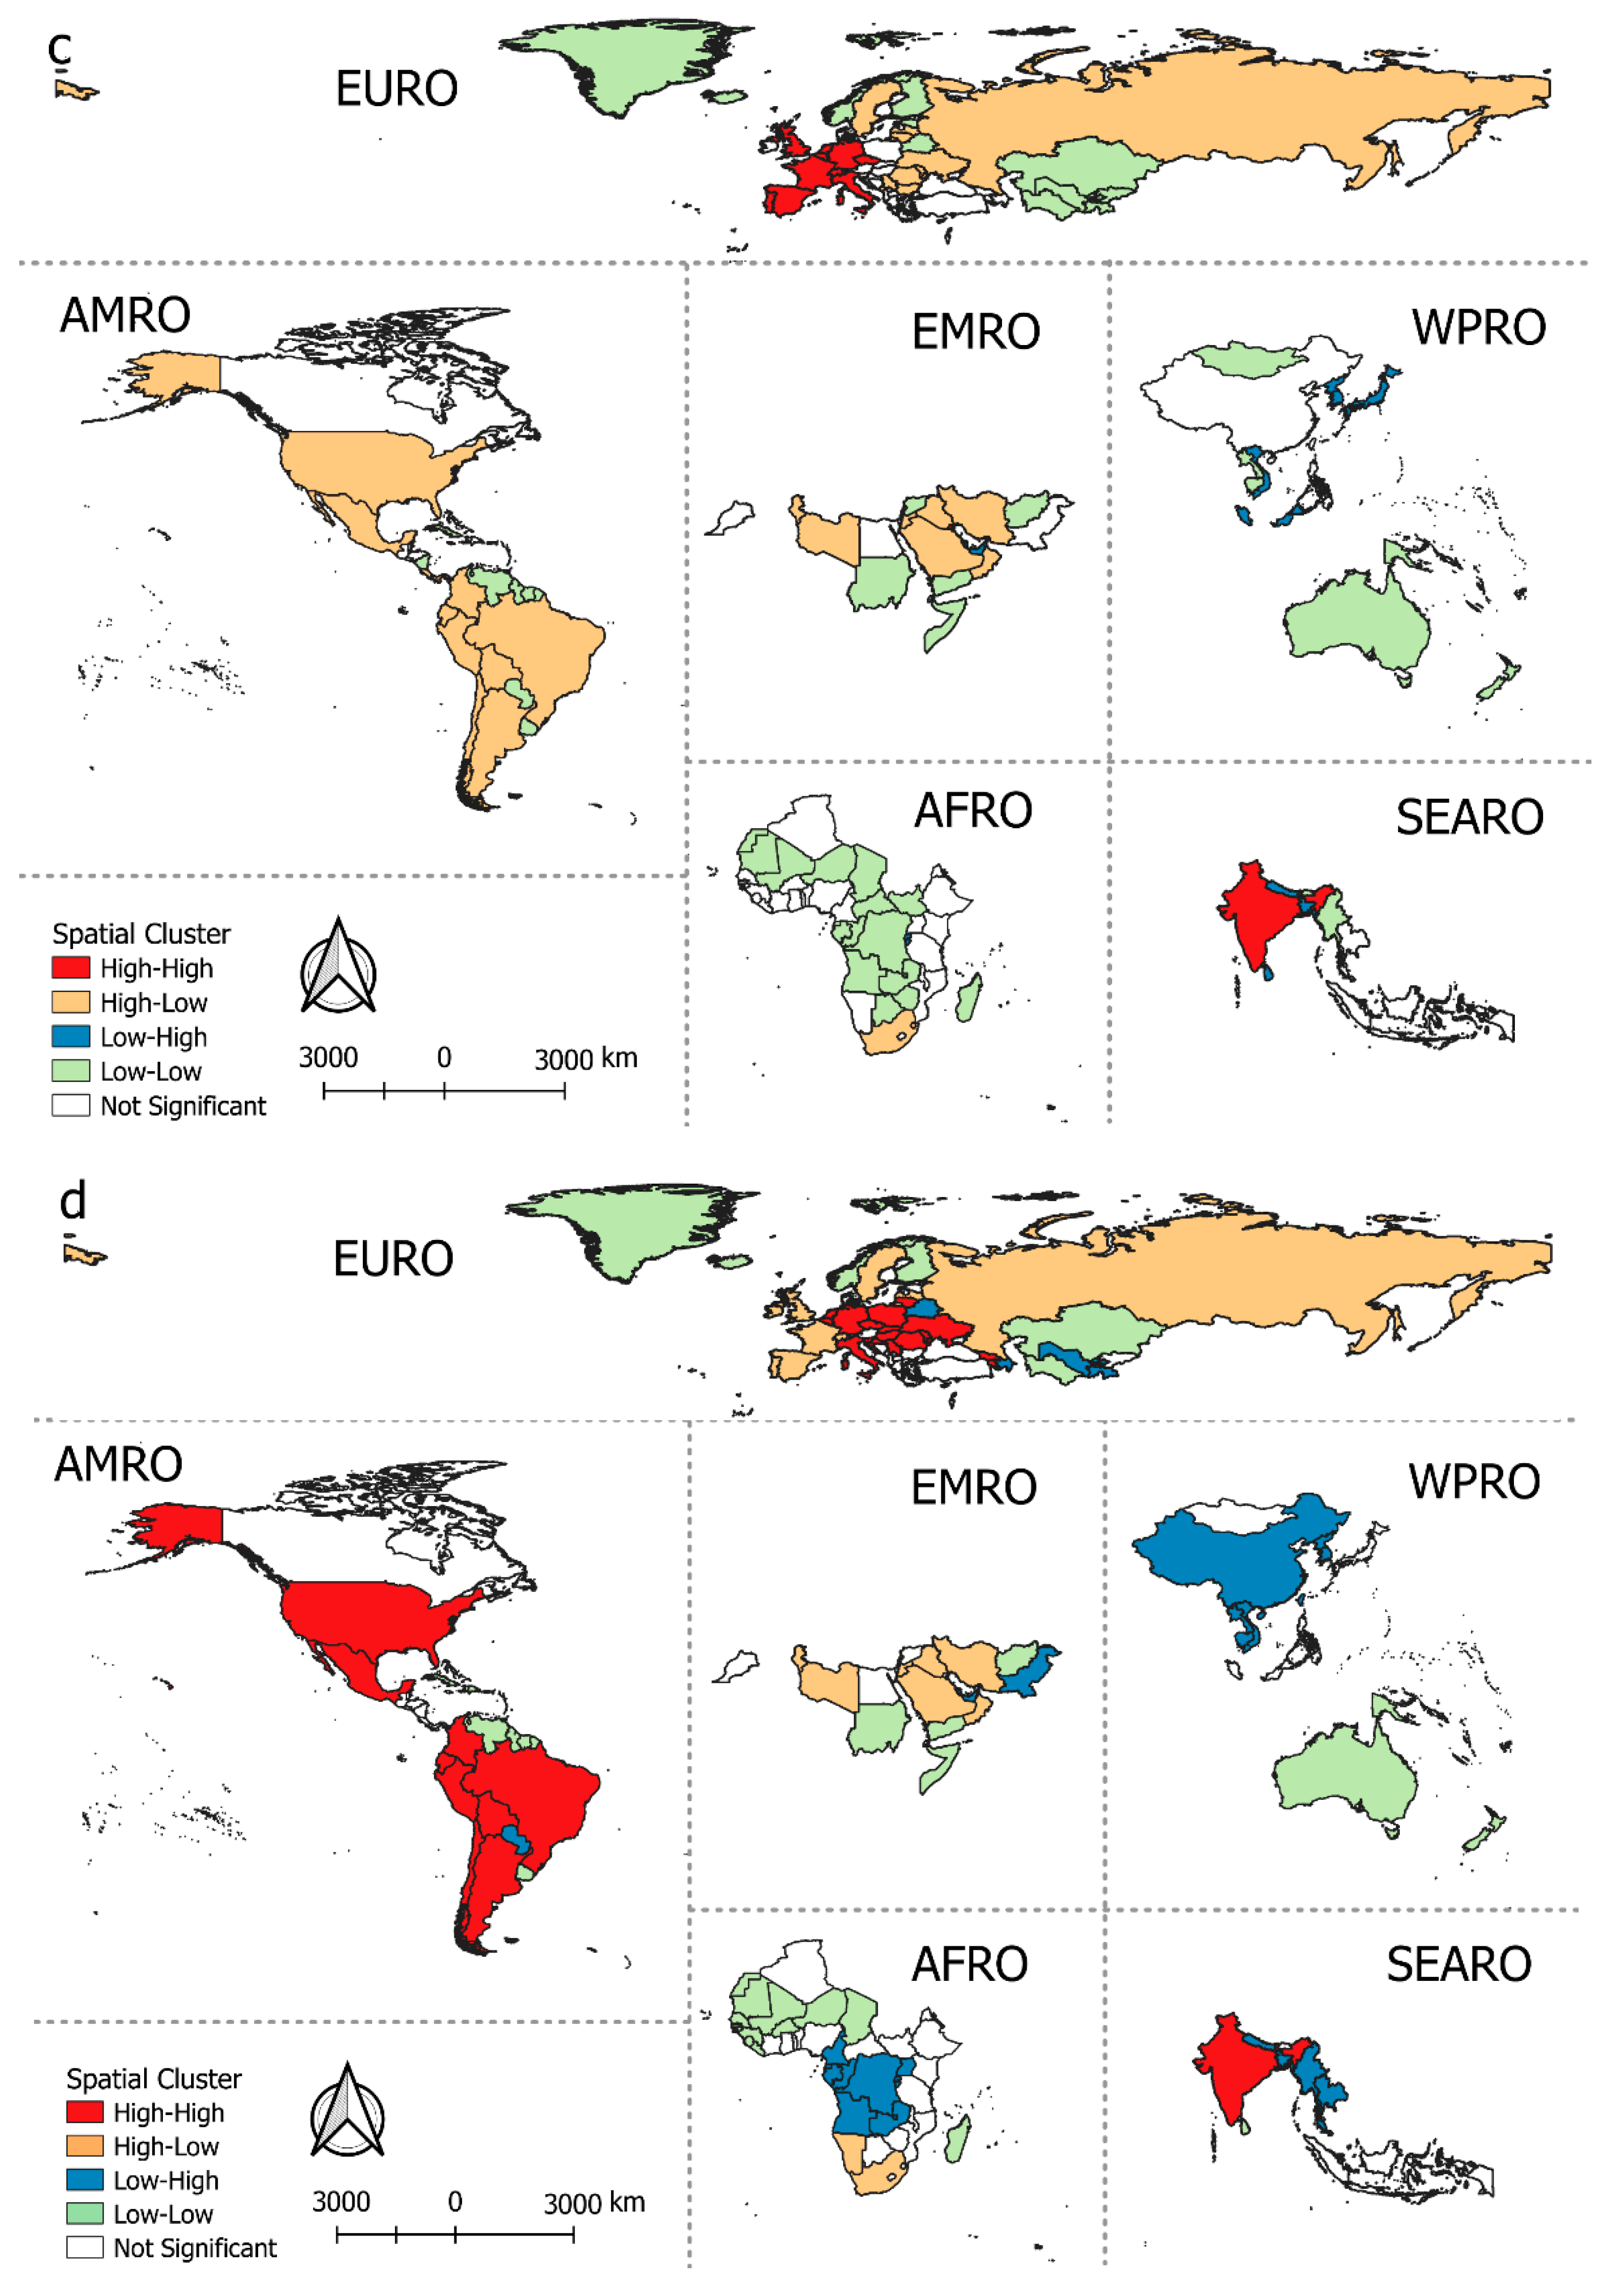
4.4. Bivariate Local Spatial Association Analysis Results

GWR was used to estimate the global relationship between COVID-19 and population density and PM2.5 concentration, and bivariate local spatial association analysis was performed to explore the spatial association of COVID-19 with population density and PM2.5 concentration. This method is intended to capture spatial association between the observations and its geographical neighbors. Besides the values of COVID-19 confirmed cases and deaths per million population, PM2.5 concentration, and population density, the spatial distribution of these variables was also considered to explore their spatial association. To the adjacent attributes, which have similar values, it shows a positive spatial association, and vice versa. The attributes of COVID-19, including cumulative confirmed cases and deaths per million population, were used as the first set of variables in the bivariate local spatial association analysis, respectively; PM2.5 concentration and population density were designated as the second set of variables. The local indicators of spatial association results (high-high, low-low, high-low, low-high and not significant) can be acquired by comparing the values of cumulative confirmed cases and deaths per million population at a given location and the observations of PM2.5 concentration or population density at the surrounding locations. The indicators of high-high and low-low denote the regions have high/low values for both COVID-19 confirmed cases or deaths toll and PM2.5 concentration or population density, while high-low and low-high mean the regions have opposite features for the first set and second set of variables. The indicator of non-significance can be interpreted as the regions that are not statistically significant in the spatial arrangement of the given variables. However, due to the geospatial differences and near places that tend to be similar in certain characteristics [38], it is difficult to obtain reliable spatial association results across a global scale. Thus, we mainly divide the world into six sub-regions according to the definition of WHO Regional groupings, namely, African Region (AFRO), Region of the Americans (AMRO), Eastern Mediterranean Region (EMRO), European Region (EURO), South-East Asia Region (SEARO), and Western Pacific Region (WPRO), respectively (Figure 4), so the geographical demarcation in the current study is not identical with the general geographic divisions of continents. The reason why the WHO regional definition is used instead is because the WHO regions are organized to formulate disease prevention and control strategies for each region. Then the spatial association between COVID-19, population density, and PM2.5 concentrations was explored based on a bivariate local spatial association method in each sub-region. The results are displayed in Figure 5.
The results are mapped according to the countries that have a significant association (Figure 5). Figure 5a shows the bivariate spatial cluster of the total number of confirmed COVID-19 cases per million population and population density, and Figure 5b shows the bivariate spatial cluster results between confirmed COVID-19 cases and PM2.5 concentrations. For the clustering results of high-high, high-low, low-low, and low-high, the first index represents the number of COVID-19 confirmed cases or deaths, and the second index presents population density or PM2.5 concentrations. In AMRO area, the cluster results show that countries with high values of cumulative COVID-19 confirmed cases per million population and population density are located in Saint-Martin, Sint Maarten, and Dominican Republic (Figure 5a). Low values of confirmed COVID-19 cases, population density, and PM2.5 concentrations occurred in countries such as Cuba, Suriname, Venezuela, Guyana, and some island states in Central America. The USA and most countries in South America have a large number of confirmed cases and higher PM2.5 concentrations (Figure 5b), but lower population density (Figure 5a). In EURO, the spatial clustering pattern of a large number of confirmed cases and higher population density (high-high) are found in Belgium, Czechia, United Kingdom, Spain, France, Gibraltar, Luxembourg, Monaco, Netherlands, Portugal, Switzerland, Germany, and Italy, whereas their PM2.5 concentrations are not high enough to be included in this category, with the exception of Italy, Netherlands, Belgium, Czechia, and Germany. The spatial outliers with high confirmed COVID-19 cases and lower population density are found in Eastern European countries and some countries in Southeast Europe such as Moldova, Romania, Serbia, Bulgaria, and Montenegro. The low-low spatial clusters are found in countries such as Greenland, Iceland, Finland, Kazakhstan, Kyrgyzstan, Uzbekistan, Turkmenistan, and Tajikistan. In terms of the association between confirmed cases and PM2.5 concentrations, countries in Central Europe belong to the spatial cluster of high-high, which means PM2.5 concentrations have a positive effect on the confirmed cases in these countries. In the other four sub-regions, that is, India, Japan, South Korea, Nepal, Bahrain, Qatar, United Arab Emirates, Kuwait, Malaysia, and Philippines, those countries display high values of cumulative COVID-19 confirmed cases per million population and population density, considering only one sub-region at a time. Also, India, South Korea, Nepal, Bangladesh, Qatar, and United Arab Emirates are classified in the first quadrant, with high confirmed cases and high concentrations of PM2.5. In contrast, for the third quadrant, the spatial clusters of low-value in both confirmed cases per million population and population density are mainly found in Mongolia, Cambodia, Laos, Papua New Guinea, New Zealand, Bhutan, Madagascar, Mauritania, Mali, Niger, Western Sahara, and most countries in Central Africa, as well as most island states in WPRO area. For the high-low spatial outliers, Tunisia, Libya, Jordan, Saudi Arabia, Iraq, Oman, Iran, Lebanon, and countries in Southern Africa are the countries with a large number of confirmed COVID-19 cases per million populations and lower population density. Vietnam, North Korea, Burundi, and Rwanda are the countries that have larger population density but small confirmed COVID-19 cases per million population. From Figure 3b, most countries in Western Africa have low concentrations of PM2.5 and a small number of confirmed cases. Meanwhile, the spatial outlier of high-low also covers South Africa and Namibia. Fewer confirmed cases but high concentrations of PM2.5 are found in some countries in Central Africa. In WPRO and SEARO areas, countries including China, North Korea, Thailand, Vietnam, Laos, and Cambodia are located in the second quadrant, which means these countries are featured by low confirmed cases but high concentrations of PM2.5. While Sri Lanka is just the opposite. Papua New Guinea, New Zealand, and most island states in WPRO area are located in the third quadrant, with low values of both confirmed cases and PM2.5 concentrations.
Compared with the spatial association of COVID-19 cumulative deaths per million population with population density and PM2.5 concentrations (Figure 5c,d), it is not difficult to find that the spatial clustering results between cumulative deaths per million population and population density are similar to that between cumulative confirmed cases per million population and population density. In General, it is more frequent that a high death toll appears in those countries with a large number of confirmed cases, such as the USA, Brazil, Mexico, the United Kingdom, France, Spain, and Russia. The main difference is that there are fewer deaths from COVID-19 in countries such as Japan, South Korea, Malaysia, Philippines, Sri Lanka, Bhutan, Nepal, Belarus, Qatar, and United Arab Emirates, although a large number of COVID-19 cumulative confirmed cases are identified in these countries. It is worth noting that bivariate local spatial association method is applied based on six sub-regions, which means that the spatial clustering results can only be applied to compare countries in the same sub-region rather than globally. For example, the USA’s PM2.5 concentrations are much lower than that in India (Figure 1b), but they have the same spatial clustering results (high-high). It is not in conflict since they have higher values in their sub-regions and the method is used to indicate the local spatial association.

5. Discussion

Understanding the relationship between COVID-19 confirmed cases and deaths per million population, population density, and PM2.5 concentration could provide appropriate implications to reduce the infection and mortality. Spearman rank correlation, multivariate linear regression based on Moran eigenvector spatial filtering model, geographically weighted regression, and bivariate local spatial association were applied to explore the spatial association of COVID-19 with population density and PM2.5 concentrations in this study. In addition, other influencing factors such as GDP per capita, smoking rate, obesity rate, and the number of hospital beds were included to assess the complicated relationship with COVID-19 infection and mortality. The main findings of this study are summarized as follows.
First, the Spearman rank correlation is adopted to explore the global correlation. The results show that only when the correlation between two variables was discussed, both population density and PM2.5 concentrations displayed a statistically significant positive correlation with COVID-19, which are consistent with previous studies [17]. This means that the countries with a larger population density and severe PM2.5 pollution are more vulnerable to COVID-19 pandemic. Moreover, the concentrations of PM2.5 used in this study were based on 2016 data, indicating possible effects of long-term exposure, which can impair lung function and increase the risk of viral infection [12,13,14,15]. Governments and health authorities of these regions should take more interventions to control the COVID-19 pandemic.
Besides, multivariate linear regression based on MESF was applied to the analysis to explore how population density and PM2.5 concentrations affect COVID-19, when it is affected by multiple risk factors. Results show that factors such as GDP per capita, hospital accommodation, obesity rate, smoking rate, PM2.5 concentration, and population density display a significant influence on COVID-19 confirmed cases and deaths. Amongst them, GDP per capita, population density, obesity rate, smoking rate, and PM2.5 concentrations are related to COVID-19 in a highly positive way, while hospital accommodation is negatively related when the relationship is explored by considering various influencing factors. In addition, GWR was employed to analyze the geographic distribution of the substantial effects of population density and PM2.5 on COVID-19. As shown in Figure 3, the coefficients of population density and PM2.5 coefficient vary significantly across the study area. Both population size and PM2.5 coefficient have a positive relationship with COVID-19 in most countries, which can also be mutually verified with the results estimated by multivariate linear regression based on MESF. The results can provide effective suggestions for non-pharmaceutical intervention measures for health-related authorities to reduce the risk of infection and mortality during the pandemic. For example, we assumed countries with higher GDP per capita could provide better medical care, leading to fewer confirmed cases and deaths by hypothesis [24]. However, results indicate countries with higher GDP per capita tend to have more confirmed cases. That may be due to the fact that people who live in these countries tend to have more social activities and higher mobility [39], increasing the infection risk of COVID-19. In addition, countries with higher GDP per capita are more likely to do more testing and a complete registration of confirmed cases and deaths, thereby identifying a higher proportion of cases. Although GDP per capita has the greatest impact on COVID-19 confirmed cases and deaths, it is an uncontrollable factor. This suggests these countries should take the remedial actions for those factors, which can be controlled and take appropriate policies and measures to restrict population movements during the COVID-19 outbreak. Other factors such as obesity rate and hospital beds seem to be relatively more controllable to mitigate COVID-19 infection and mortality, but they take a longer time to create impact. On one hand, people can strengthen and improve their exercise habits to maintain good health and enhance immunity from the risk of virus infection. On the other hand, there could be more governmental or public health efforts towards increasing the number of hospital beds with mandatory hospitalization, so that patients can be quarantined in a timely manner to reduce the risk of mortality, and to avoid infecting others who are in close contact with them.
Finally, the bivariate spatial cluster method was applied to the analysis of the local relationship between COVID-19 and PM2.5 concentrations and population density. We find the impact of population density and PM2.5 concentrations on COVID-19 in different regions varies because of geographical differences [40,41,42]. The influence of population density on the number of COVID-19 deaths is positive on a global scale as well as positive for confirmed cases in some regions, like AFRO, SEARO, and WPRO, while there is a negative relationship in AMRO and some countries in EURO and EMRO. That may be because population density was calculated based on the total population size and the area of each country, which tends to ignore the heterogeneity between urban and rural areas, especially in larger countries such as the USA, Brazil, and Russia. In this way, the impact of population density on COVID-19 may be underestimated severely. In addition, the infection and mortality risks in these regions may not only depend on population density, which are more associated with local policies, socio-economic conditions, and people’s immune status. It implies that more efficient interventions and policies should be formulated by government to reduce and control the infection and mortality rate of COVID-19. Interestingly, PM2.5 concentrations have a positive impact on COVID-19 in most countries in AMRO, but a significant negative impact was found in EMRO. Even within the same sub-region, the association is also complicated and not always consistent towards one direction. For example, in AFRO, the correlation between PM2.5 concentrations and COVID-19 tends to be more significantly positive in Western Africa, but it is found to almost be negatively correlated in Southern and Central Africa (Figure 5). The results also show other interesting observations that are noteworthy. We found that the adjacent countries in the same sub-region tend to have similar characteristics (i.e., Spain, France and the UK in EURO; the USA, Mexico, Brazil, Peru, and Colombia in AMRO), which implies the strongly spatial interactions between these countries. In addition, rapid migration before lockdown may result in similar patterns in COVID-19 infection risk. However, the results of spatial clustering between COVID-19 and PM2.5 concentrations and population density are complicated. There are some countries with higher PM2.5 concentrations and more confirmed cases. There are also some countries with lower PM2.5 concentrations but more positive COVID-19 cases and deaths (i.e., Russia, Spain, the UK and Iran). On the other hand, there are also some countries with higher PM2.5 concentrations but fewer confirmed cases and deaths; this may be due to the fact that the influence of national policies and interventions related to COVID-19 has been underestimated [43,44,45]. The results provide important implications that adjacent countries in the same sub-region are susceptible to influence from each other, which indicates the spatial patterns of population density and PM2.5 concentrations influence the spatial patterns of COVID-19 outcome across the study area. Thus, taking appropriate cooperation and measures between countries would help control COVID-19 infection and reduce mortality.
Our findings highlight the impact of population density and PM2.5 concentrations on COVID-19 by combining statistical methods with spatial clusters on a worldwide basis, and the associations between each of these variables and COVID-19 are likely to differ in different areas. The results provide a useful and detailed understanding of how the risk factors affect COVID-19 and how they contribute to the transmission and fatality rate of COVID-19. We have done some work in exploring the relationship between COVID-19, population density and PM2.5 concentration, but there are several limitations that are worthy of mention. First, the spatial weight is crucial to bivariate local spatial association analysis, and different spatial weights may lead to changes in the local correlation results. In this study, K-Nearest Neighbour (KNN) was used to build the spatial weight metrics instead of fixed geospatial distance, since the study area was divided into six sub-regions and the distribution between countries is different in each sub-region, so that the actual connections between countries may be ignored to some extent. In addition, the number of COVID-19 confirmed cases and deaths per million population on 31st January 2021 reported by the WHO was used in this study, thereby the results of spatial association may change as the disease progresses over time. Besides, since the lack of precise and detailed level data of COVID-19, as well as maintaining the same spatial resolution as COVID-19, we explore the association with each country as a unit and use a crude measure of some variables, such as extracting population density and annual average PM2.5 concentrations of each country without considering the differences between rural and urban areas; even some previous studies have shown that the influence of population density and PM2.5 concentration on COVID-19 transmission and mortality tends to be different in urban and rural areas and may also be affected by the city size [46,47,48]. The dataset is somewhat dated and has not been updated to match the current situation of COVID-19. For example, some countries have built additional hospital beds to increase accommodation, but there are no up-to-date available records. We recommend in the future research that smaller units of analysis such as provinces, counties or cities should be considered, since the associations may be different accordingly. Also, more variables outside the scope of this current study may be explored, such as the built environment and other controlling measures involving COVID-19, which can provide additional insights. In addition, this study is of an exploratory nature and examined the relationships between COVID-19 and the influencing factors. Relevant country level data were collected to test the hypothesis, and city level or individual level data were not accessible.

6. Conclusions

This exploratory study aims to explore the association between population density, PM2.5 concentration, and COVID-19 at country basis on a global scale. As no single variable can adequately explain the risk of transmission and mortality, other factors such as GDP per capita, obesity rate, smoking rate, and the number of hospital beds are also included. Results from statistical analysis with consideration of other factors, population density is strongly correlated with COVID-19 infection and mortality, as well as PM2.5 concentration. Considering the geographical influencing on spatial distribution, the specific inter-relationship between population density, PM2.5 concentration, and COVID-19 is complex and varies, depending on different countries and regions, while some adjacent countries are likely to have similar characteristics. It suggests that the countries with close contacts and similar spatial patterns of population density and PM2.5 concentration tend to have similar patterns of COVID-19 risk across the same sub-region. Our findings provide some useful insights through which some reasonable and effective measures can be carried out to reduce COVID-19 infection and mortality. In general, based on our findings, continuous efforts should be expended to contain and reduce PM2.5 concentrations, and people’s awareness should be raised by implementing environmental or sustainability policy perspectives in the countries where both PM2.5 concentrations and COVID-19 confirmed cases or deaths are high (high-high), such as strict vehicle emission control, as well as encouraging the use of new energy to reduce air pollution. In addition, appropriate quarantine measures and restricted traveling and block movements should be taken to reduce the influence of population density on the COVID-19 infection.

Supplementary Materials

The following are available online at https://0-www-mdpi-com.brum.beds.ac.uk/2220-9964/10/3/123/s1, Figure S1: The spatial distribution of the impact of (a) GDP per capita on confirmed cases per million population; (b) smoking rate on confirmed cases per million population; (c) hospital beds on confirmed cases per million population; (d) obesity rate on confirmed cases per million population. Figure S2: The spatial distribution of the impact of (a) GDP per capita on deaths per million population; (b) smoking rate on deaths per million population; (c) hospital beds on deaths per million population; (d) obesity rate on deaths per million population.

Author Contributions

Conceptualization, Man Sing Wong, Xinyu Yu, Mei Po Kwan and Janet Elizabeth Nichol; methodology, Xinyu Yu, Man Sing Wong and Rui Zhu; data curation, Xinyu Yu, Man Sing Wong and Coco Yin Tung Kwok; formal analysis, Man Sing Wong, Xinyu Yu, Mei Po Kwan and Janet Elizabeth Nichol; validation, Xinyu Yu, Man Sing Wong, Rui Zhu and Coco Yin Tung Kwok. investigation, Man Sing Wong, Mei Po Kwan, Janet Elizabeth Nichol, Rui Zhu, and David C. W. Chin; visualization, Rui Zhu and Xinyu Yu; writing—original draft, Xinyu Yu and Man Sing Wong; writing—review and editing, Man Sing Wong, Xinyu Yu, Mei Po Kwan, Janet Elizabeth Nichol, Rui Zhu, Joon Heo, Pak Wai Chan, David C. W. Chin, Coco Yin Tung Kwok and Zihan Kan. All authors have read and agreed to the published version of the manuscript.

Funding

This research is partially supported by grants from the Hong Kong Research Grants Council (Grant No. 15602619; Grant no. C7064-18GF), and the Research Institute for Sustainable Urban Development (Grant No. 1-BBWD), the Hong Kong Polytechnic University. Mei-Po Kwan was supported by RGC grants (GRF Grant no. 14605920; CRF Grant no. C4023-20GF) and a grant from the Research Committee on Research Sustainability of Major RGC Funding Schemes of the Chinese University of Hong Kong.

Conflicts of Interest

The authors declare no conflict of interest.

References

  1. Schlagenhauf, P.; Ashra, H. Severe acute respiratory syndrome spreads worldwide. Lancet 2003, 361, 1017. [Google Scholar] [CrossRef] [Green Version]
  2. Wang, L.; Li, J.; Guo, S.; Xie, N.; Yao, L.; Cao, Y.; Ji, J. Real-time estimation and prediction of mortality caused by COVID-19 with patient information based algorithm. Sci. Total Environ. 2020, 727, 138394. [Google Scholar] [CrossRef] [PubMed]
  3. Lancet, T. Emerging understandings of 2019-nCoV. Lancet (Lond. Engl.) 2020, 395, 311. [Google Scholar] [CrossRef] [Green Version]
  4. Li, Q.; Guan, X.; Wu, P.; Wang, X.; Zhou, L.; Tong, Y.; Xing, X. Early transmission dynamics in Wuhan, China, of novel coronavirus–infected pneumonia. N. Engl. J. Med. 2020. [Google Scholar] [CrossRef]
  5. Chan, J.F.W.; Yuan, S.; Kok, K.H.; To, K.K.W.; Chu, H.; Yang, J.; Tsoi, H.W. A familial cluster of pneumonia associated with the 2019 novel coronavirus indicating person-to-person transmission: A study of a family cluster. Lancet 2020, 395, 514–523. [Google Scholar] [CrossRef] [Green Version]
  6. Wang, D.; Hu, B.; Hu, C.; Zhu, F.; Liu, X.; Zhang, J.; Zhao, Y. Clinical characteristics of 138 hospitalized patients with 2019 novel coronavirus–infected pneumonia in Wuhan, China. JAMA 2020, 323, 1061–1069. [Google Scholar] [CrossRef] [PubMed]
  7. Novel Coronavirus (2019-nCoV) Situation Report-1 February 2021. Available online: https://www.who.int/publications/m/item/weekly-operational-update-on-covid-19---1-february-2021 (accessed on 1 February 2021).
  8. Dowd, J.B.; Andriano, L.; Brazel, D.M.; Rotondi, V.; Block, P.; Ding, X.; Mills, M.C. Demographic science aids in understanding the spread and fatality rates of COVID-19. Proc. Natl. Acad. Sci. USA 2020, 117, 9696–9698. [Google Scholar] [CrossRef] [Green Version]
  9. Dudel, C.; Riffe, T.; Acosta, E.; van Raalte, A.A.; Myrskyla, M. Monitoring trends and differences in COVID-19 case fatality rates using decomposition methods: Contributions of age structure and age-specific fatality. medRxiv 2020. [Google Scholar] [CrossRef]
  10. Anderson, R.M.; Heesterbeek, H.; Klinkenberg, D.; Hollingsworth, T.D. How will country-based mitigation measures influence the course of the COVID-19 epidemic? Lancet 2020, 395, 931–934. [Google Scholar] [CrossRef]
  11. Jia, J.S.; Lu, X.; Yuan, Y.; Xu, G.; Jia, J.; Christakis, N.A. Population flow drives spatio-temporal distribution of COVID-19 in China. Nature 2020, 582, 389–394. [Google Scholar] [CrossRef]
  12. Pope Iii, C.A.; Burnett, R.T.; Thun, M.J.; Calle, E.E.; Krewski, D.; Ito, K.; Thurston, G.D. Lung cancer, cardiopulmonary mortality, and long-term exposure to fine particulate air pollution. JAMA 2020, 287, 1132–1141. [Google Scholar] [CrossRef] [PubMed] [Green Version]
  13. Osseiran, N.; Chriscaden, K. Air Pollution Levels Rising in Many of the World’s Poorest Cities; WHO: Geneva, Switherlands, 2016. [Google Scholar]
  14. Huang, J.B.; Cheng, S.Y.; Wu, K.H.; Cheng, F.J. Association between Particulate Matter Exposure and Short-term Prognosis in Patients with Pneumonia. Aerosol Air Qual. Res. 2020, 20, 89–96. [Google Scholar] [CrossRef]
  15. Ogen, Y. Assessing nitrogen dioxide (NO2) levels as a contributing factor to the coronavirus (COVID-19) fatality rate. Sci. Total Environ. 2020, 726, 138605. [Google Scholar] [CrossRef] [PubMed]
  16. Yongjian, Z.; Jingu, X.; Fengming, H.; Liqing, C. Association between short-term exposure to air pollution and COVID-19 infection: Evidence from China. Sci. Total Environ. 2020, 727, 138704. [Google Scholar] [CrossRef]
  17. Bray, I.; Gibson, A.; White, J. Coronavirus disease 2019 mortality: A multivariate ecological analysis in relation to ethnicity, population density, obesity, deprivation and pollution. Public Health 2020, 185, 261. [Google Scholar] [CrossRef] [PubMed]
  18. Piazzalunga-Expert, A. Evaluation of the Potential Relationship between Particulate Matter (PM) Pollution and COVID-19 Infection Spread in Italy. Mimeo. 2020. Available online: https://www.ptpz.pl/wp-content/uploads/2020/04/COVID_19_position-paper_ENG1.pdf (accessed on 8 April 2020).
  19. Yue, H.; Huang, Q.; He, C.; Zhang, X.; Fang, Z. Spatiotemporal patterns of global air pollution: A multi-scale landscape analysis based on dust and sea-salt removed PM2. 5 data. J. Clean. Prod. 2020, 252, 119887. [Google Scholar] [CrossRef]
  20. Evans, J.; van Donkelaar, A.; Martin, R.V.; Burnett, R.; Rainham, D.G.; Birkett, N.J.; Krewski, D. Estimates of global mortality attributable to particulate air pollution using satellite imagery. Environ. Res. 2013, 120, 33–42. [Google Scholar] [CrossRef]
  21. Wu, S.; Deng, F.; Hao, Y.; Shima, M.; Wang, X.; Zheng, C.; Qin, Y. Chemical constituents of fine particulate air pollution and pulmonary function in healthy adults: The Healthy Volunteer Natural Relocation study. J. Hazard. Mater. 2013, 260, 183–191. [Google Scholar] [CrossRef]
  22. Van Donkelaar, A.; Martin, R.V.; Brauer, M.; Hsu, N.C.; Kahn, R.A.; Levy, R.C.; Winker, D.M. Global estimates of fine particulate matter using a combined geophysical-statistical method with information from satellites, models, and monitors. Environ. Sci. Technol. 2016, 50, 3762–3772. [Google Scholar] [CrossRef]
  23. Bhaduri, B.; Bright, E.; Coleman, P.; Dobson, J. LandScan. Geoinformatics 2002, 5, 34–37. [Google Scholar]
  24. Wang, J.; Tang, K.; Feng, K.; Lv, W. High Temperature and High Humidity Reduce the Transmission of COVID-19. 2020. SSRN 3551767. Available online: https://ssrn.com/abstract=3551767 (accessed on 9 March 2020). [CrossRef] [Green Version]
  25. Misumi, I.; Starmer, J.; Uchimura, T.; Beck, M.A.; Magnuson, T.; Whitmire, J.K. Obesity Expands a Distinct Population of T Cells in Adipose Tissue and Increases Vulnerability to Infection. Cell Rep. 2019, 27, 514–524. [Google Scholar] [CrossRef] [PubMed] [Green Version]
  26. Stefan, N.; Birkenfeld, A.L.; Schulze, M.B.; Ludwig, D.S. Obesity and impaired metabolic health in patients with COVID-19. Nat. Rev. Endocrinol. 2020, 16, 341–342. [Google Scholar] [CrossRef] [PubMed] [Green Version]
  27. Kass, D.A.; Duggal, P.; Cingolani, O. Obesity could shift severe COVID-19 disease to younger ages. Lancet (Lond. Engl.) 2020, 395, 1544–1545. [Google Scholar] [CrossRef]
  28. Spearman, C. The proof and measurement of association between two things. Apa Psycnet 1961. [Google Scholar] [CrossRef]
  29. Kabe, D.G. Stepwise multivariate linear regression. J. Am. Stat. Assoc. 1963, 58, 770–773. [Google Scholar] [CrossRef]
  30. Griffith, D.A. A linear regression solution to the spatial autocorrelation problem. J. Geogr. Syst. 2000, 2, 141–156. [Google Scholar] [CrossRef]
  31. Griffith, D.; Chun, Y.; Li, B. Spatial Regression Analysis Using Eigenvector Spatial Filtering; Academic Press: Cambridge, MA, USA, 2019. [Google Scholar]
  32. Griffith, D.A. Spatial Autocorrelation and Spatial Filtering: Gaining Understanding through Theory and Scientific Visualization; Springer Science & Business Media: Berlin/Heidelberg, Germany, 2003. [Google Scholar]
  33. Landis, R.S. Standardized regression coefficients. Encycl. Stat. Behav. Sci. 2005. [Google Scholar] [CrossRef]
  34. Brunsdon, C.; Fotheringham, A.S.; Charlton, M.E. Geographically weighted regression: A method for exploring spatial nonstationarity. Geogr. Anal. 1996, 28, 281–298. [Google Scholar] [CrossRef]
  35. Fotheringham, A.S.; Oshan, T.M. Geographically weighted regression and multicollinearity: Dispelling the myth. J. Geogr. Syst. 2016, 18, 303–329. [Google Scholar] [CrossRef]
  36. Anselin, L.; Syabri, I.; Smirnov, O. Visualizing multivariate spatial correlation with dynamically linked windows. In Proceedings of the CSISS Workshop on New Tools for Spatial Data Analysis, Santa Barbara, CA, USA, 10–11 May 2002. [Google Scholar]
  37. Patanavanich, R.; Glantz, S.A. Smoking is associated with COVID-19 progression: A meta-analysis. Nicotine Tob. Res. 2020, 22, 1653–1656. [Google Scholar] [CrossRef] [PubMed]
  38. Tobler, W.R. A computer movie simulating urban growth in the Detroit region. Econ. Geogr. 1970, 46 (Suppl. 1), 234–240. [Google Scholar] [CrossRef]
  39. Pérez-Rodríguez, J.V.; Ledesma-Rodríguez, F.; Santana-Gallego, M. Testing dependence between GDP and tourism’s growth rates. Tour. Manag. 2015, 48, 268–282. [Google Scholar] [CrossRef]
  40. COVID, T.C.; Stephanie, B.; Virginia, B.; Nancy, C.; Aaron, C.; Ryan, G.; Katherine, R. Geographic Differences in COVID-19 Cases, Deaths, and Incidence-United States. 2020. Available online: https://www.cdc.gov/mmwr/volumes/69/wr/pdfs/mm6915e4-H.pdf (accessed on 17 April 2020).
  41. Wu, X.; Nethery, R.C.; Sabath, B.M.; Braun, D.; Dominici, F. Exposure to air pollution and COVID-19 mortality in the United States. medRxiv 2020. [Google Scholar] [CrossRef] [Green Version]
  42. Fattorini, D.; Regoli, F. Role of the chronic air pollution levels in the Covid-19 outbreak risk in Italy. Environ. Pollut. 2020, 114732. [Google Scholar] [CrossRef] [PubMed]
  43. Hsiang, S.; Allen, D.; Annan-Phan, S.; Bell, K.; Bolliger, I.; Chong, T.; Lau, P. The effect of large-scale anti-contagion policies on the COVID-19 pandemic. Nature 2020, 584, 262–267. [Google Scholar] [CrossRef]
  44. Chen, S.; Yang, J.; Yang, W.; Wang, C.; Bärnighausen, T. COVID-19 control in China during mass population movements at New Year. Lancet 2020, 395, 764–766. [Google Scholar] [CrossRef] [Green Version]
  45. Cheng, C.; Barceló, J.; Hartnett, A.S.; Kubinec, R.; Messerschmidt, L. COVID-19 Government Response Event Dataset (CoronaNet v. 1.0). Nat. Hum. Behav. 2020, 4, 756–768. [Google Scholar] [CrossRef]
  46. Marquès, M.; Rovira, J.; Nadal, M.; Domingo, J.L. Effects of air pollution on the potential transmission and mortality of COVID-19: A preliminary case-study in Tarragona Province (Catalonia, Spain). Environ. Res. 2020, 192, 110315. [Google Scholar] [CrossRef]
  47. Andersen, L.M.; Harden, S.R.; Sugg, M.M.; Runkle, J.D.; Lundquist, T.E. Analyzing the spatial determinants of local Covid-19 transmission in the United States. Sci. Total Environ. 2020, 754, 142396. [Google Scholar] [CrossRef]
  48. Heroy, S. Metropolitan-scale COVID-19 outbreaks: How similar are they? arXiv 2020, arXiv:2004.01248. [Google Scholar]
Figure 1. Global distribution of (a) population density and (b) PM2.5 concentration.
Ijgi 10 00123 g001
Figure 2. Geographic distribution of local R2 for COVID-19: (a) confirmed cases and (b) deaths.
Ijgi 10 00123 g002
Figure 3. The spatial distribution of the impact of (a) population density on confirmed cases per million population; (b) PM2.5 concentration on confirmed cases per million population; (c) population density on deaths per million population; (d) PM2.5 concentration on deaths per million population.
Ijgi 10 00123 g003
Figure 4. Global regions classification map.
Ijgi 10 00123 g004
Figure 5. Bivariate local spatial association results: (a) cumulative confirmed cases per million population and population density; (b) cumulative confirmed cases per million population and PM2.5; (c) cumulative deaths per million population and population density; (d) cumulative deaths per million population and PM2.5.
Ijgi 10 00123 g005aIjgi 10 00123 g005b
Table 1. Publicly available data sources used in this study.
DatasetsDescription and Source
COVID-19 casesThe country-level number of COVID-19 confirmed cases and deaths per million population until 31st January 2021 from WHO (covering 251 countries and regions)
(https://covid19.who.int/, accessed on 8 April 2020)
Population density The population density dataset was derived from the total population size of each country and region in 2018 collected from LandScan
(https://landscan.ornl.gov/landscan-datasets, accessed on 8 April 2020)
PM2.5 concentration The country-level annual average PM2.5 concentration in 2016 collected from Atmospheric Composition Analysis Group
(http://fizz.phys.dal.ca/~atmos/martin/?page_id=140, accessed on 8 April 2020)
GDP per capitaCurrent GDP per capita of each country measured in US dollars in 2019 collected from the World Bank
(https://data.worldbank.org/indicator/NY.GDP.MKTP.PP.KD, accessed on 8 April 2020)
Obesity rateThe prevalence of obesity in adults aged 18 and above in 2016 collected from WHO
(https://apps.who.int/gho/data/view.main.REGION2480A?lang=en, accessed on 8 April 2020)
Smoking rateThe percentage of people aged 15 and older who currently smoke in 2016 collected from the World Bank
(https://data.worldbank.org/indicator/SH.PRV.SMOK, accessed on 8 April 2020)
Hospital accommodation The country-level number of hospital beds per 1000 people in 2015 collected from the World Bank
(https://data.worldbank.org/indicator/SH.MED.BEDS.ZS, accessed on 8 April 2020)
Table 2. Spearman correlation coefficients (r) between COVID and impact factors.
ConfirmedDeathsPopulationPM2.5GDPSmoking RateHospital BedsObesity Rate
Confirmed1.00
Deaths0.905 **1.00
Population0.544 **0.521 **1.00
PM2.50.415 **0.419 **0.613 **1.00
GDP0.474 **0.445 **0.345 **0.201 **1.00
Smoking rate0.278 **0.258 **0.0320.132 **0.0781.00
Hospital Beds0.462 **0.409 **−0.0300.142 *0.126 *0.377 **1.00
Obesity rate0.271 **0.337 **0.322 **0.0820.339 **0.238 **0.241 **1.00
** p < 0.01 * p < 0.05.
Table 3. Multivariate Linear Regression based on MESF results of COVID-19.
VariableCumulative Confirmed (β)p-ValueCumulative Deaths (β)p-ValueVIF
GDP per capita0.150<0.0010.133<0.0011.215
Smoking rate0.0210.0010.0180.0041.402
Hospital beds−0.1020.002−0.0620.0011.760
Obesity rate0.0770.0210.0640.0461.511
PM2.50.0130.0480.0220.0361.325
Population density0.0180.0460.0170.0471.476
Publisher’s Note: MDPI stays neutral with regard to jurisdictional claims in published maps and institutional affiliations.

