1. Introduction
The United Nations [
1] estimates that 68% of the global population will be living in cities or other urban centres by 2050. This predicted rise in the size of urban populations highlights the urgent need to be able to quantify the ambient population. The ability to produce estimates of the ambient population is integral to the management and planning of urban areas and allows the development of insights into socio-economic and environmental issues that impact cities [
2]. In this paper, the ambient population is defined as the number of people within a given geographical area at a specific point in time, excluding individuals at their place of residence and those utilising modes of transport.
This paper assesses the utility of conventional and novel data sources for producing estimates of the ambient population and identifies appropriate data sources recommended for use in future work. A UK-based case study in the city of Leeds, West Yorkshire is utilised to demonstrate spatio-temporal patterns produced by different data sources. This study is widely generalisable as similar data are available worldwide. This work addresses an omission in the existing literature by producing an assessment of potential data sources and recommends the utilisation of a combination of conventional and novel data sources to produce estimates of the ambient population.
There is a clear need to develop estimates of the ambient population in order to better understand urban dynamics and the needs of growing urban populations. Existing studies regarding the ambient population have employed a range of data sources, both conventional and novel; however, there is a lack of research assessing the viability of these data sources. While the systematic literature review by Panczak, Charles-Edwards and Corcoran [
3] identifies potential data sources, it does not assess their suitability for building estimates of the ambient population. This paper assesses the viability of datasets previously employed and identifies those which may be useful and therefore should be validated. This is a necessary step in order to ensure the development of appropriate estimates of the ambient population in future work. The next section of this paper will evaluate conventional and novel data sources identified as potentially useful for quantifying the ambient population.
2. Data Types
Despite estimates of the ambient population being highlighted as beneficial by Boggs [
4] over 50 years ago, there has been limited research within this area. Andresen, Jenion and Reid [
5] suggest that the lack of research is due to temporal and financial constraints. Often novel data were privately owned, thus unavailable or expensive. However, these constraints are no longer as significant due to advances in technology resulting in high-resolution population data being more widely available [
6].
This paper examines what will be referred to as conventional and novel data sources. Conventional data are those typically acquired from surveys, interviews and questionnaires and are available from national statistical agencies. Novel data are those collected from novel sources such as sensors, mobile phones, social media platforms and footfall cameras.
Table 1 provides a summary of the data sources reviewed in this paper. These sources were selected as they are able to provide estimates of population which are relevant to the ambient population. The primary focus is on data available in the United Kingdom, but similar datasets exist in many other countries so the review will generalise widely.
2.1. Conventional Data Sources
This section reviews ‘conventional’ sources that have been used to estimate the ambient population. The utility of conventional data is assessed in order to determine whether data lacking fine spatio-temporal detail have value for building estimates of the ambient population.
2.1.1. Census Data
Estimates of populations have traditionally been derived from household surveys and government data sources, most notably population censuses. Data from the 2011 UK census includes estimates of the usual resident population, mid-year population and workday population. These measures of the population are currently widely used for academic research and industrial purposes [
7,
8]. The usual resident population is the count of the number of individuals usually resident at a given address. Mid-year population estimates are calculated using the most recent census in addition to data regarding internal and external migration, births, deaths, etc. Workday population data were introduced in the 2011 UK Census to quantify individuals at their place of work during typical working hours, in addition to those who are unemployed residents. Workday population data can provide an overview of the usual daytime population, unlike the residential population and mid-year population estimates. However, estimates of the workday population are not universally available thus cannot be adopted in all studies of the ambient population.
Censuses held by national statistical offices represent the gold standard of data collection and are geographically comprehensive [
9].There are examples of the ambient population being constructed from multiple data sources, typically including census data. Bhaduri et al. [
10] used census data as a primary input, combining it with remote sensing images to capture the average ambient population over a 24 h period at a resolution of 1 km
2. Smith et al. [
11] produced a population database for hazard modelling that combined a variety of data sources, including measures from the UK census, leisure facilities and retail data. The limitations of this work included data accuracy and the rapidity with which census data become outdated. Martin, Cockings and Leung [
12] proposed a framework that uses a range of administrative datasets including the census, Higher Education and Hospital Episode Statistics to produce a grid model of the average ambient population [
13]. A weakness of the framework is that it relies on annual data and fails to include data which are produced by novel sources and contain high levels of spatio-temporal detail. However, the authors acknowledge the potential value of novel data which supports the rationale of this work. Highlighting the utility of data from other national censuses, data from the Chinese census were used by Qi et al. [
14] to build daytime population estimates through the addition of tourism, school registration, hospital patient, and land use data. However, this research did little to expand work by Martin, Cockings and Leung [
12] despite the availability of novel data, such as geo-located social media data, in 2015.
Despite these examples, the data are impacted by several issues, including under-enumeration and respondent errors [
15]. In the UK, it can take over 12 months for census data to be processed and released (Office for National Statistics, n.d.); thus, censuses conducted decennially are quickly outdated [
8]. Urban areas are continually in a state of flux, with changes in the residential population and workday population varying significantly within a short period of time. These changes which occur at relatively fine temporal scales cannot be captured by a decennial census.
2.1.2. Travel Survey Data
Data from travel surveys are able to provide detailed information regarding the movements of individuals. Travel surveys are conducted by a number of national and local governments across the world, but there is no general framework, resulting in inconsistent data. The frequency at which these surveys are conducted varies greatly, and many countries do not collect any travel data.
Travel surveys were primarily introduced to inform policymaking regarding transport planning and land-use, but recently they have also been used to examine the ambient population [
16]. Zandvliet and Dijst [
17] use the Netherlands National Travel Survey to examine temporary, visitor populations and determine the demographic characteristics of this temporary population. Similarly, Charles-Edwards et al. [
18] employed the National Australian Visitor Survey to gain insight into the temporary movements of the population, for purposes such as leisure activities. The surveys collect information regarding the typical journeys that people make, including journey length and the purpose of the trip. They are also able to capture valuable socio-demographic information about individuals which many novel data sources are not able to capture.
Many of the studies which utilise travel survey data are now becoming outdated, principally due to the availability of alternative, novel data sources. A primary advantage offered by travel survey data, especially when compared to novel data, is the ability to provide information regarding demographics, reason for travel and mode of transport. These features are not required to quantify the ambient population but may be valuable to future work examining the demographic characteristics of the ambient population.
Estimates of the ambient population can benefit from the use of conventional data sources, primarily due to their extensive geographical coverage. Workday population estimates are able to reveal more detail regarding the geographic location of individuals during a typical working day, deeming them valuable in attempting to quantify the ambient population. Despite the utility of workday population data, these data are still plagued by infrequent data collection and lack estimates of the numbers of people in an urban area for activities, such as shopping, socialising and tourism which are required to produce estimates of the ambient population. Although this limits their use as a sole measure of the ambient population, there may be value in combining these data with others (as
Section 2.2 will discuss in detail). Consequently, the following sections discuss additional data from novel sources that may be useful in building estimates of the ambient population and fill the gaps in the more traditional sources.
2.2. Novel Data Sources
Several data sources have emerged in recent years that provide detailed spatio-temporal data that can be useful for building estimates of the ambient population. Due to the secondary nature of the data, i.e., the data sources were not designed to capture the ambient population, many have limitations and few have been extensively explored [
19]. The utility of novel data sources will be assessed in the remainder of this section.
2.2.1. Mobile Phone Data
Mobile phone activity data have been utilised by several studies that explore the ambient population. Ratti et al. [
20] demonstrate the benefits of mobile phone data for use within urban analytics and city planning through the production of a visual representation of urban activities in Milan, Italy. In a similar study, Reades et al. [
21] employ mobile phone data to build visualisations of mobile phone usage across Rome; however, due to the demographic characteristics of mobile phone users—i.e., a small proportion of the elderly population use a mobile phone—the data fail to reflect the entire ambient population [
21]. Work by Terada, Nagata and Koboyashi [
22] accounts for socio-demographic characteristics such as age and gender and employed mobile phone activity data to produce spatial estimates of the population of Japan. Crucially, Reades et al. [
21] acknowledge that while traditional datasets have limited temporal detail, data access and ethical issues are barriers to the use of mobile phone activity data. He et al. [
23] used geo-referenced mobile phone data as a measure of the ambient population to assess the relationship between larceny (theft) in Xi’an, China. The dataset utilised provided full coverage of all mobile phone users within the study area and includes information such as gender and date of birth. The authors state that the work highlights the utility of mobile phone data for estimating the ambient population; however, they do not acknowledge that access to such a comprehensive dataset is not possible in many countries. Smartphone location data were utilised by Hanaoka [
24] as an estimate of the ambient population. It is unknown whether these data are publicly available or whether similar data are available for other countries. The work fails to assess the representativeness of the data and does not indicate whether the smartphone location data are able to reflect the size of the ambient population. Mobile phone activity data are not analysed in further detail due to the associated ethical concerns and the lack of data available at a sufficiently small geographical scale.
Since the outbreak of COIVD-19, several technology companies, such as Apple and Google, have made mobility data available. Apple produce daily mobility reports which demonstrate the changes in routing requests via the Apple Maps application [
25]. The data are able to indicate changes in the percentage of requests for walking, driving and public transport routes [
25]. While the data are able to depict temporal trends in the percentage change of route requests, the representativeness of the data is a significant concern. Firstly, there is no information regarding whether people take the journeys they requested directions for using the Apple Maps application. Secondly, journeys which are not planned using the application are not captured. It can be assumed that routing requests for journeys made more regularly, such as commuting to work and travelling to the supermarket, are less common. Additionally, the spatial detail of the data is limited and does not provide any indication to the number of journeys made into or out of an area, limiting the use of the data for quantifying the ambient population.
Google mobility reports indicate the percentage change in the visits to different location categories including retail and recreation, supermarket and pharmacy, parks, workplaces and public transport [
26]. The level of spatial detail varies significantly between countries. The data are gathered from Google Account users who have devices that are able to track their movements (typically smart phones) and enable ‘Location History’. Google state that the data may or may not be representative of the wider population [
26]. Unlike Apple mobility data, Google mobility reports indicate journeys which have taken place; however, the number of journeys made and information regarding the representativeness of the data are unknown. Google also state that the reports will only be available for a limited period of time, thus may not be available for use in future research [
26].
Although the data used to generate mobility reports (particularly the traces of an individual’s movements that are used in the Google reports) may provide a valuable source of high-resolution information about the ambient population, at present the products are not released at a sufficient spatial granularity to be of direct use here. Typically, a single mobility estimate covers an entire city or borough. While these estimates may provide a useful picture of regional behaviour change, they are not sufficiently detailed to estimate the dynamics of the ambient population and will not be reviewed.
2.2.2. Geo-Located Social Media Data
Social media platforms are a novel source of vast quantities of real-time volunteered geographic data [
27]. Many social media platforms allow users to share geographic data, including; Facebook, FourSquare and Twitter [
28].
Volunteered geographic data generated on Twitter are noted as being exceptionally well suited to building estimates of the ambient population [
19,
29,
30,
31,
32]. This is due to the open and accessible API and the detailed spatio-temporal information provided. However, if a request through the API exceeds 1% of total Tweets, the data are then limited to a random sample of 1% of all Tweets [
33].
Geo-located social media data have been utilised in diverse applications, from measuring tourism attractiveness [
34] to quantifying human mobility [
35] and predictive crime modelling [
36]. However, there are concerns regarding the generalisability of the data. Socio-economic characteristics, such as age and socio-economic group, have a significant influence on the volume and temporal frequency of geo-located social media data [
37]. For example, in the UK, 95% of 16–24 year olds have at least one social media profile. However, this decreases to 39% of people aged between 65 and 74 [
38]. Twitter data have been used in existing work to quantify the size of the ambient population in order to estimate the size of the population at risk from specific crimes and to test criminological theory [
32,
39,
40].
Geo-located social media data are able to provide insight at fine spatio-temporal scales but are limited by their lack of generalisability. Further research into the representativeness of geo-located social media data would allow these types of data to be utilised within studies of the ambient population. However, the future of Twitter data in academic research may be limited as in 2019 Twitter announced that the option to geo-tag Tweets was going to be removed as most users do not use the feature [
33].
2.2.3. Wi-Fi Sensor Data
Wi-Fi sensors are a potentially viable tool for counting the number of individuals in an area and providing real-time data [
41,
42]. Wi-Fi sensors record a count every time a Wi-Fi probe request is received from a Wi-Fi-enabled device [
43], such as a mobile phone. As a device moves through an urban area, it will attempt to connect to multiple access points, thus is counted at multiple geographical locations, providing detailed spatio-temporal data [
44]. When the sensor data are calibrated and validated, there can be certainty in the numbers of devices counted, but it is not yet evident how many people carry no Wi-Fi-enabled device, or even multiple devices. Given the proliferation of the use of Wi-Fi-enabled smart phones, Wi-Fi sensors are a cheap and feasible method of collecting data regarding the ambient population.
Ethical concerns regarding the use of Wi-Fi sensor data have recently become less significant due to technological developments. Wi-Fi sensors are able to capture the movements of individuals as probe requests contain a device’s unique media access control (MAC) address [
43]. Many mobile device users will be unaware that their device emits probe requests, nor that probe requests would allow them to be tracked [
45]. However, both Apple and Android devices now periodically change MAC addresses to prevent device users from being tracked [
46,
47]. An additional barrier to the use of Wi-Fi sensors data is accessibility. Often the data are privately owned, thus can only be acquired through an agreement, often financial.
Wi-Fi sensor data have not yet been used extensively. However, the small number of studies that have employed them have demonstrated their value. Kontokosta and Johnson [
48] developed a real-time census with hourly estimates of the ambient population for Lower Manhattan, New York City using over 20 million Wi-Fi probe data points, in conjunction with data from conventional sources. User groups, such as daily, weekly, first-timers, or occasional visitors, were identified based upon hourly connections to the Wi-Fi sensors. This enabled the extraction of population estimates for workers, residents and visitors [
48]. The work provided an excellent foundation in using modelling techniques and Wi-Fi data to produce estimates of the population. Highlighting the value of using Wi-Fi sensor data in conjunction with other sources, Crols and Malleson [
41] used a combination of administrative datasets and footfall counts from Wi-Fi sensors to build an agent-based model of demographic characteristics of commuters. A significant limitation of this study was the lack of empirical data; thus, a validation process was not carried out.
While Wi-Fi sensor data may be a useful source of detailed spatio-temporal information for building estimates of the ambient population, the lack of accessible, open Wi-Fi sensor data may be a barrier to its use.
2.2.4. Footfall Camera Data
Footfall cameras are another source of individual movement data and are typically operated by private companies, thus, there is limited information regarding data accuracy. The most commonly used footfall camera technology is target-specific tracking.
Target-specific tracking utilises counting devices mounted on the sides of buildings and CCTV columns. High-definition video is used with image processing algorithms to produce counts of pedestrians as they cross a virtual line. The cameras can be employed outdoors to measure footfall in urban centres. A significant disadvantage of these cameras is the potential to identify and track individuals as some cameras have the ability to capture and store data, which raises questions regarding the security of personal data. Enumerating the ambient population does not require information regarding individuals, therefore these types of camera are not recommended for use.
Footfall cameras rely on a physical device to capture data. Therefore, it is crucial that the cameras are situated in appropriate locations and that there are sufficient devices to capture footfall in different geographical areas. Ensuring the equitable distribution of footfall cameras is a crucial issue [
49]. While sensors are able to produce new data and subsequently new knowledge about urban population, where there is a lack of coverage gaps emerge, resulting in so-called ‘sensor deserts’ [
49].
Counts from footfall cameras have not been employed extensively within academic research, thus it is challenging to assess the potential benefits of the use of footfall camera data. Footfall cameras do offer spatio-temporally detailed data and are an unobtrusive way of quantifying the population. Further exploration of these data is needed to assess their utility and their accuracy.
3. Data Assessment: A Case Study in a Large UK City
This section will assess the suitability of conventional and novel datasets for building estimates of the ambient population by examining their spatio-temporal characteristics. Recall that the aim of this paper is not to create a new estimate of the ambient population, but to assess the viability of the datasets discussed previously and identify those which may be useful.
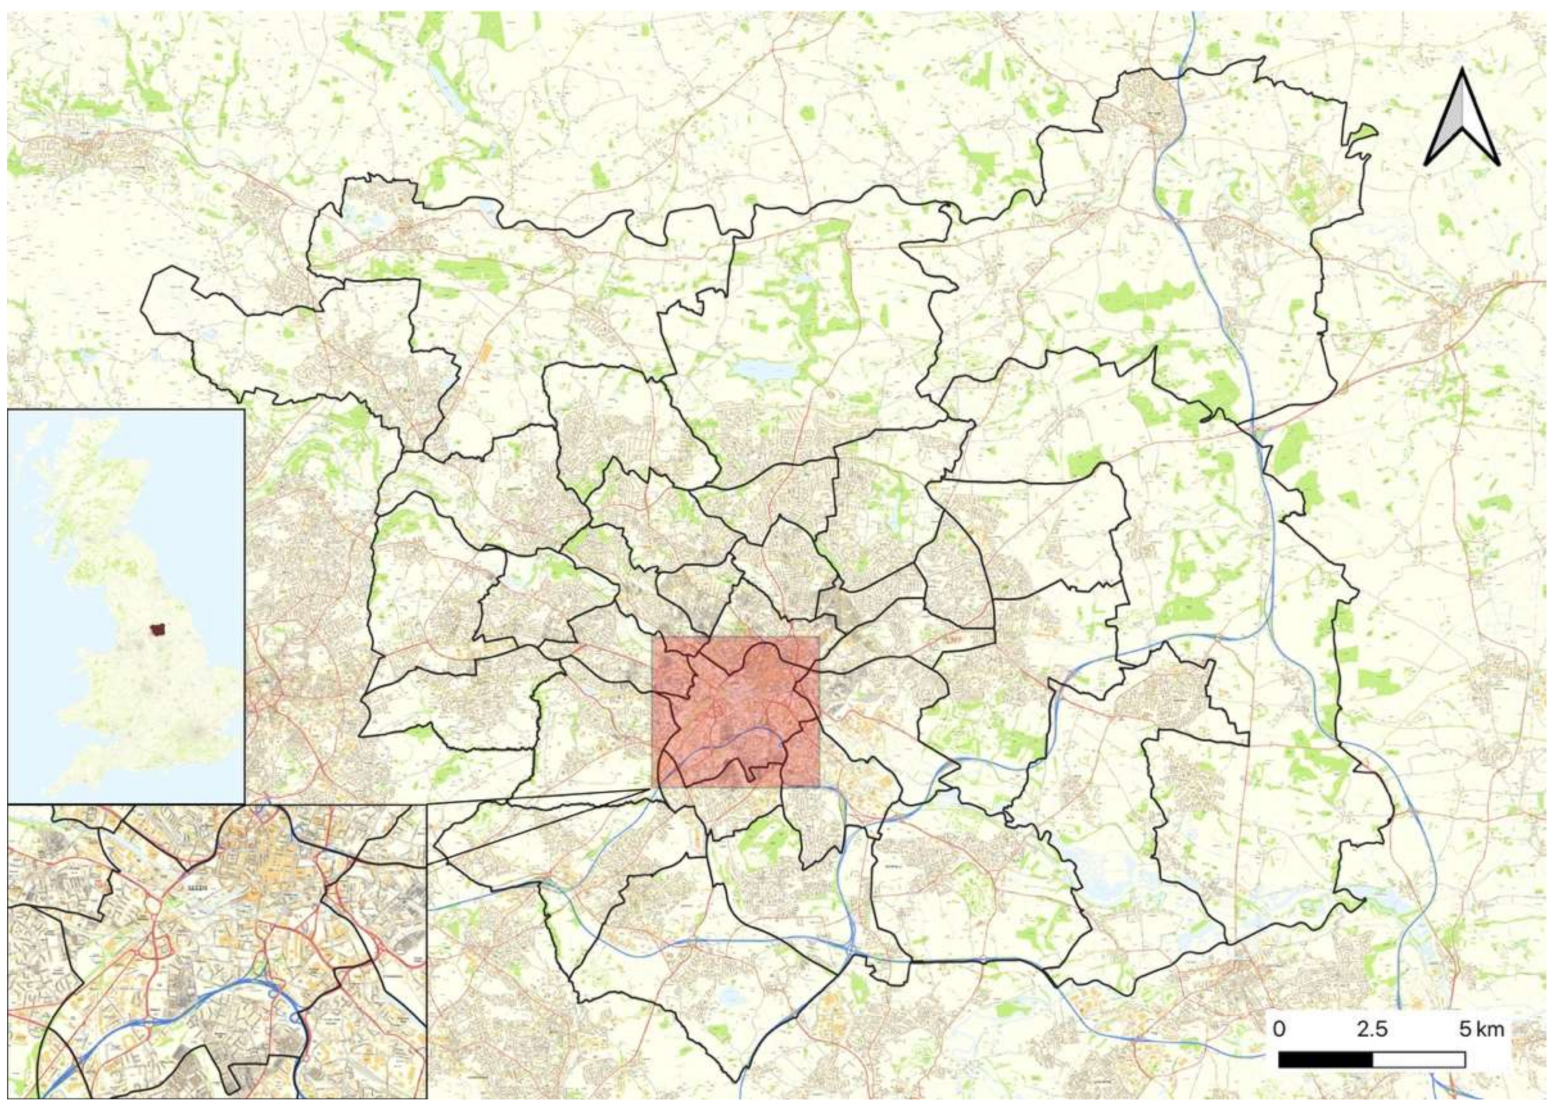
The study area for this section will be the city centre of Leeds, United Kingdom (UK), shown in
Figure 1. While the following analysis benefits from the use of a case study, the findings regarding the efficacy of the datasets are globally generalisable. Leeds is the third-largest city in the UK with a population of 751,485 [
50], while the usual resident population of the study area is 16,022 [
50]. Leeds is the biggest commercial centre in the region, thus experiences high volumes of commuters and is a popular destination for shopping and other leisure activities. Leeds is a major urban centre which experiences fluctuations in the ambient population, making it an ideal testbed for this work. Where data have been aggregated, two administrative boundaries are used: wards (akin to U.S. census tracts) and workplace zones (the lowest level of UK geography).
3.1. Census Data
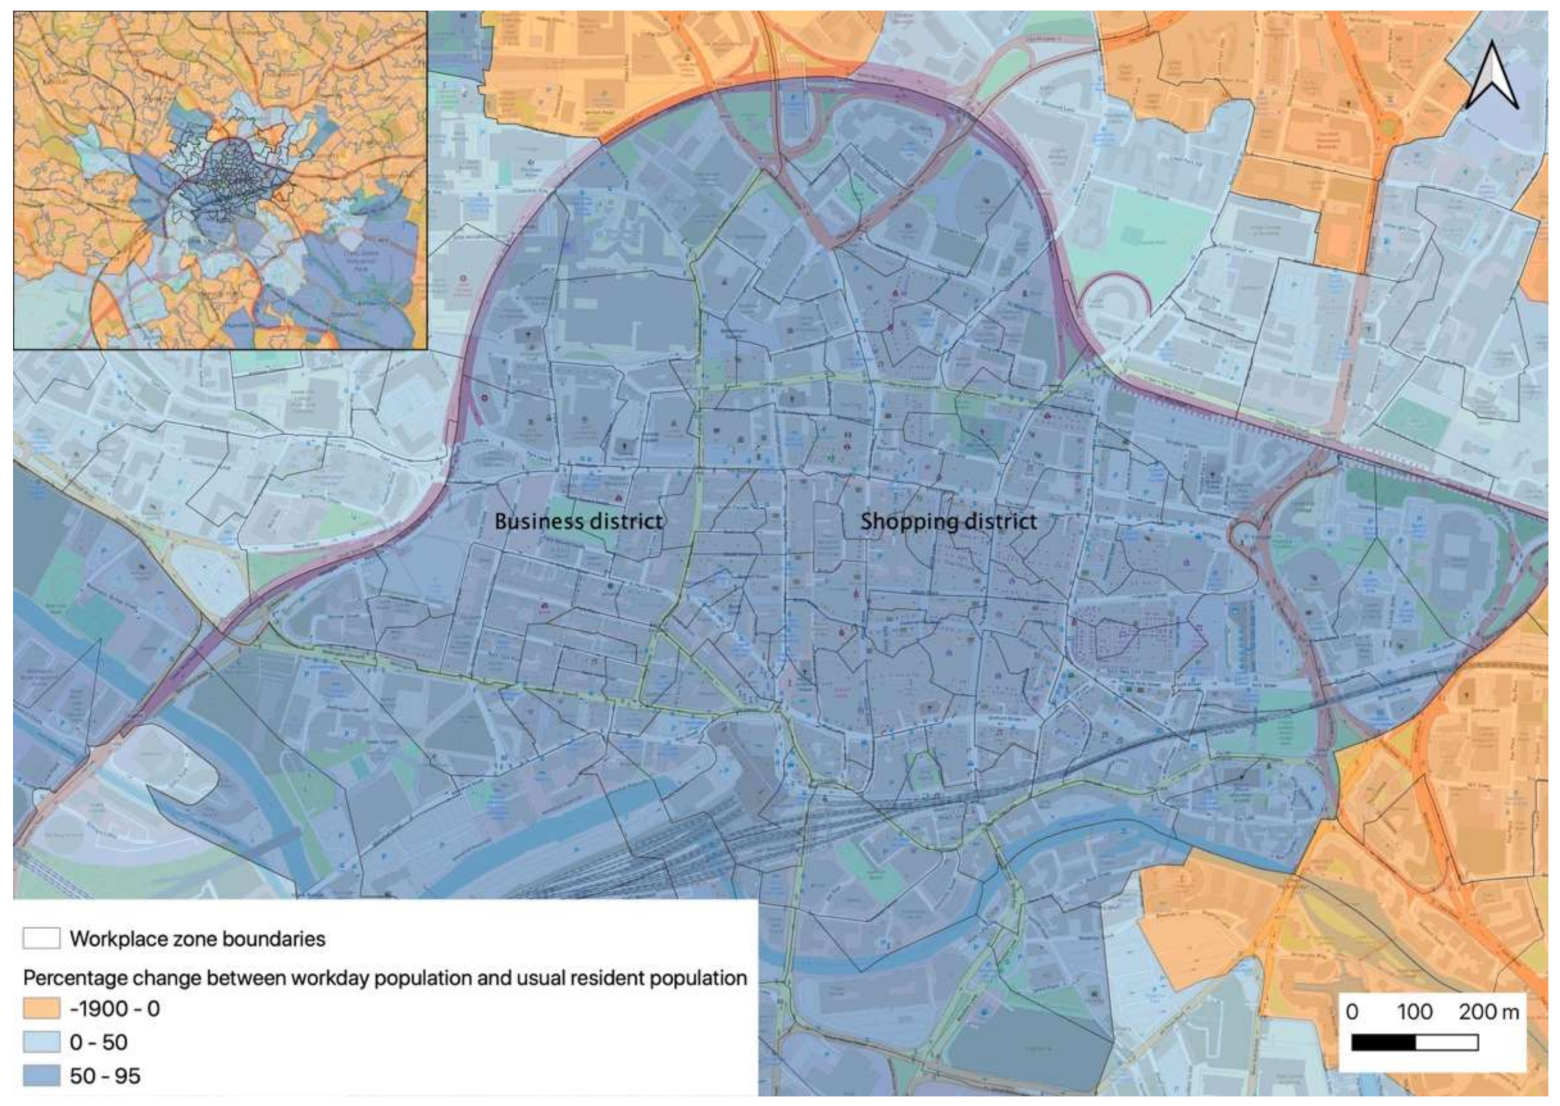
Estimates of the usual resident population and workday population are commonly used in small area estimates of the population. Within Leeds, there are vast differences between the two estimates due to the city centre attracting visitors, shoppers and workers, with the ward of City and Holbeck, which features the city centre, experiencing a 346% increase between estimates of the usual resident and workday populations [
50].
Figure 2 demonstrates the percentage change between workday population and usual resident population estimates from the UK 2011 Census which represent the population on the 27 March 2011. Areas which experience increases in the workday population (workplace zones shaded in blue) can be easily identified. The workplace zones which span the city centre, including the shopping and business districts experience an increase in population between 50 and 95%.
The inset map which highlights the wider Leeds region (see
Figure 2) demonstrates that many of the areas outside of the city centre-based study area experience decreases in population during the working day. As workplace zones within the city centre experience a significant increase in the population during typical working hours—some areas vary by a factor of 2—it supports the rationale for this work to better understand the population of urban areas.
3.2. OpenCellID Data
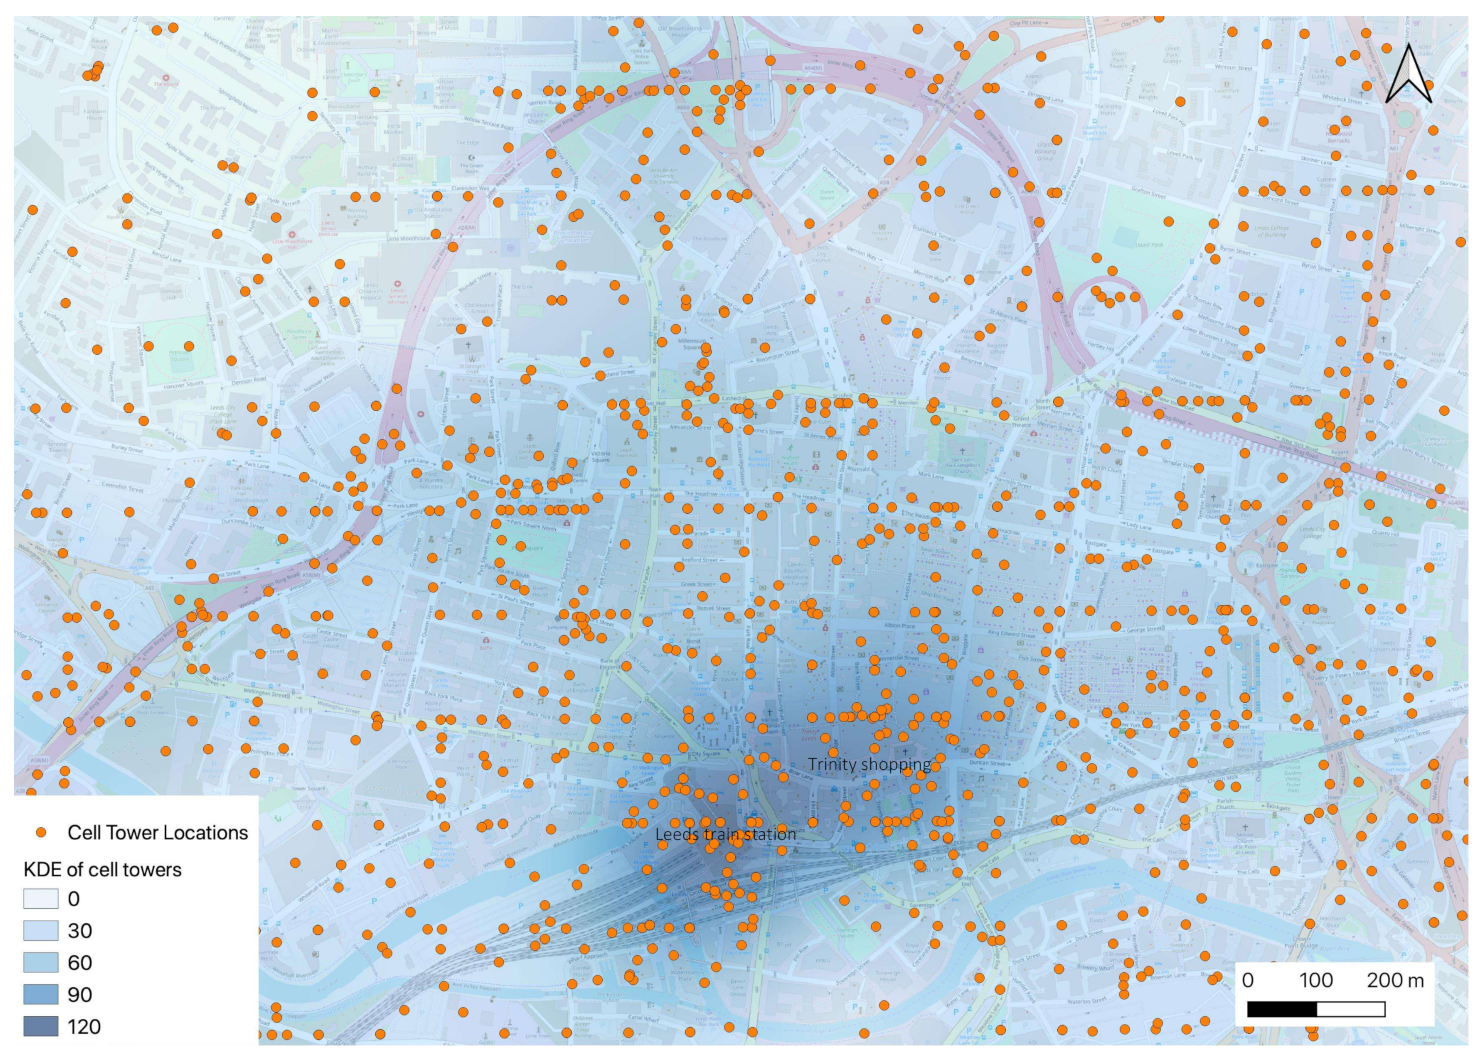
OpenCellID data, highlighted in
Figure 3 represent the density of cell towers within the study area. The data are a cumulative record of cell towers and were downloaded on the 3
rd December 2020. The cell towers are located primarily in the areas around the Leeds train station and the Trinity shopping centre. OpenCellID data are useful in helping to identify areas which are likely to experience high volumes of people. However, there are no data regarding the number of individuals using a mobile device in each location.
3.3. Geo-Located Social Media Data
Social media platforms have recently emerged as a possible source of data for building estimates of the ambient population, with Twitter being the most commonly used source of geo-located data.
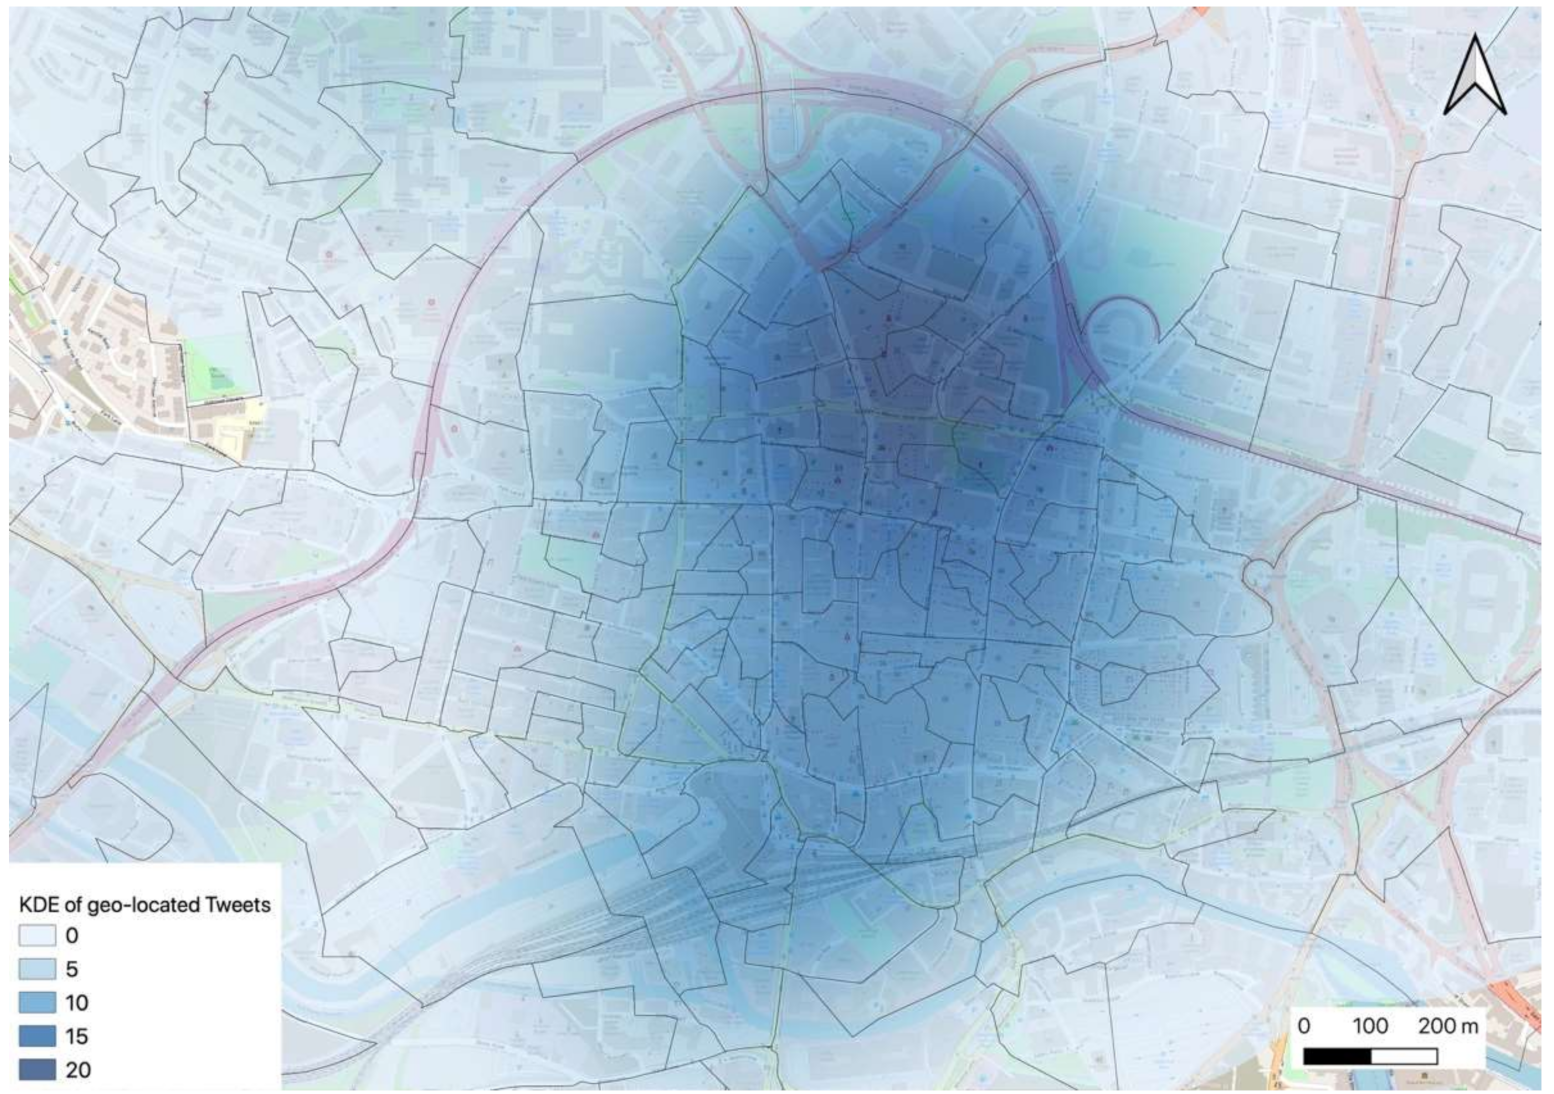
Figure 4 highlights hotspots of a random sample of 10,000 geo-located Tweets in the Leeds local authority district collected from 4 December 2015 to 14 February 2017. The data were collected using the Twitter Streaming API, listening for all tweets within the UK and filtering those with precise coordinates. The KDE of geo-located Tweets has a very different distribution to the KDE of cell towers, as shown in
Figure 3. The areas with the highest density of geo-located tweets are primarily located around the main shopping and leisure areas of the city centre. Towards the west of the city centre, in the business district, the density of geo-located Tweets is lower which suggests that people in the city for leisure purposes are the producers of geo-located Tweets. While the number of Twitter users who send geo-located Tweets can be quantified, it is more challenging to determine their proportion within the ambient population.
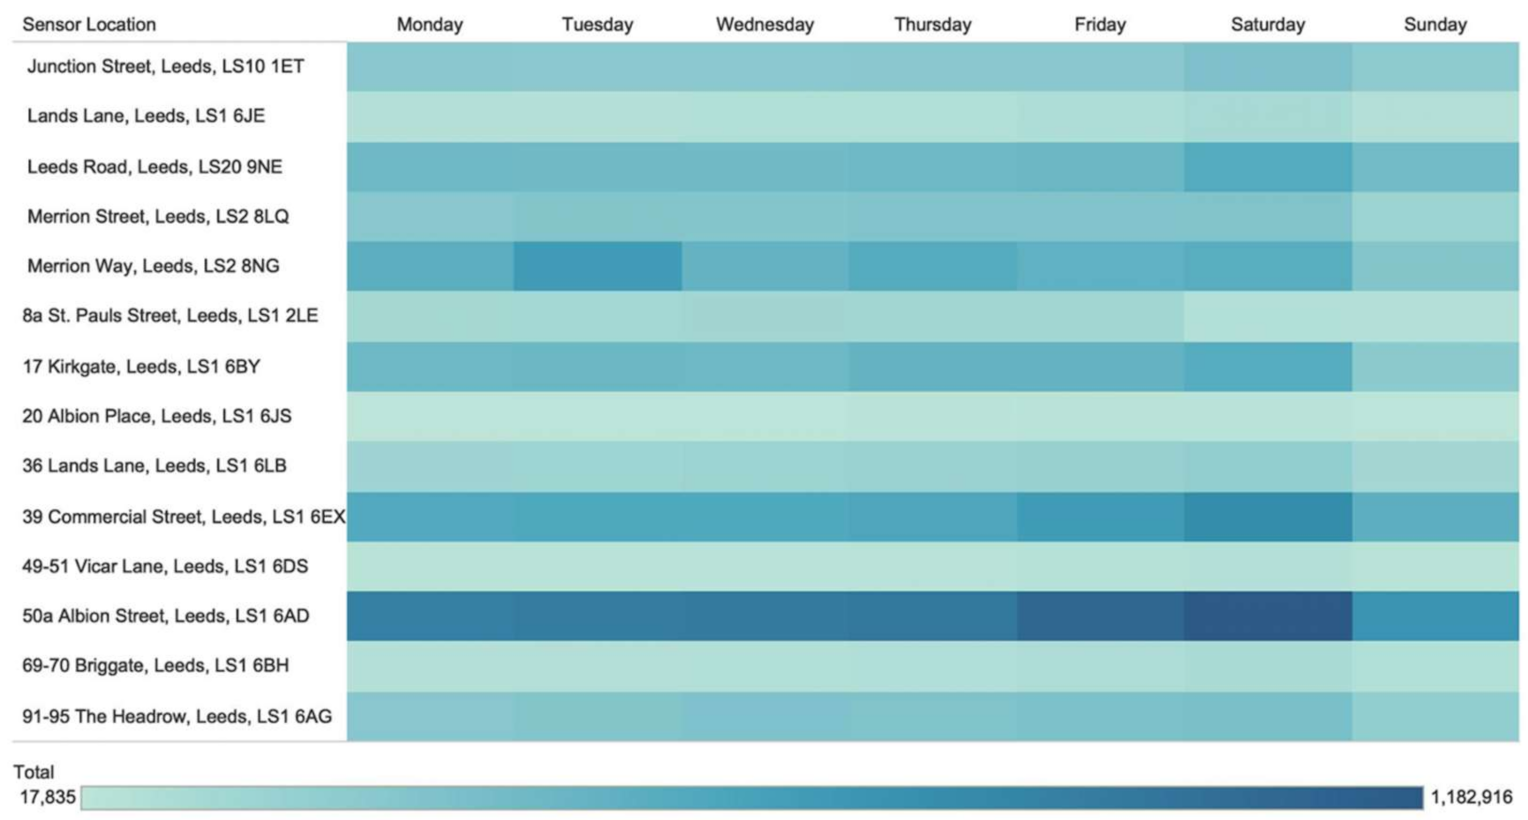
3.4. Wi-Fi Sensor Data
Wi-Fi sensor counts are logs of Wi-Fi probe requests which occur when a Wi-Fi-enabled device passes a Wi-Fi sensor. The Wi-Fi data used in this study were produced by the Local Data Company in partnership with the Consumer Data Research Centre. The sensor data were downloaded at 5 min intervals for the 12 months of 2017. While this example is based in Leeds, there are other examples in cities such as London (UK) and Singapore. As can be seen in
Figure 5, Wi-Fi sensors produce pedestrian counts at specific geographic points and enable the detection of patterns and fluctuations at different temporal levels such as daily or hourly.
Figure 5 also highlights the importance of enumerating individuals who visit the city centre for leisure purposes as Saturday experiences the highest pedestrian count in all locations except St. Pauls Street, which is located in the business district.
3.5. Footfall Camera Counts
Footfall cameras are a novel data source which are able to capture fluctuations in hourly and daily counts of pedestrians. The data examined in this section were aggregated from 8 footfall cameras located in Leeds in May 2018.
Figure 6 highlights the hourly changes in footfall recorded by the footfall cameras. Mondays, Tuesdays and Wednesdays exhibit similar trends in hourly counts, likely to be due to workers in the city. Thursdays and Fridays experience higher footfall than days earlier in the week and footfall in the early evening, between 17:00 and 19:00 is evident. This could be linked to later shop closing times on these days and an increase in people socialising in the city centre towards the end of the typical working week. On both Saturday and Sunday, footfall reaches a peak later in the day, around 14:00, when compared to the working week.
The data offer fine spatio-temporal detail and enumerate non-workers in the city centre, both of which benefit estimates the ambient population. Footfall camera data could be used with workday population data in order to enumerate the ambient population by capturing workers and non-workers in an area.
In
Figure 7, the temporal trends of Wi-Fi sensor counts and footfall camera counts are highlighted. Both data sources demonstrated decreases in counts on 7 May, 14 May, 21 May and 29 May. The peaks in Wi-Fi sensor counts occur more frequently than in the footfall camera data and do not share any overlaps temporally. Reasons for this may include that the Wi-Fi sensors and footfall cameras are located in different parts of the city centre, thus are not enumerating the same spatial locations. Additionally, the counts are captured in different ways; footfall cameras count the number of passing pedestrians, while Wi-Fi sensors count the number of Wi-Fi-enabled devices that emit a probe request. Thus, the counts from the two different data sources would not be expected to be identical. Conducting a validation process will enable better understanding of the accuracy of counts from each data source.
4. Discussion and Conclusions
This paper assesses the utility of conventional and novel data sources that have previously been identified as potential sources of data regarding the ambient population. It provides an assessment of the advantages and disadvantages of data previously employed to quantify the ambient population and identifies potentially useful data for use in future research. Future research may include data validation and the development of a methodological framework to quantify the ambient population. At the time of writing, the authors are unaware of any other study that assesses the viability of data sources for producing estimates of the ambient population and identifies those which may be useful in future work.
This work notes the limited utility of conventional data sources to estimate the ambient population in cities, due to the infrequency of data collection and the lack of spatio-temporal detail provided. However, these data have extensive geographic coverage and enumerate the majority of the population, encapsulating most, if not all, demographic groups. Workday population data were highlighted as a potentially useful measure for estimating the ambient population if used in conjunction with novel data which capture fluctuations throughout the day.
Novel sources of data, previously utilised in existing studies of the ambient population, have been acknowledged to have several significant limitations. OpenCellID data are able to indicate where people are likely to be located, but they are limited by the inability to enumerate the mobile devices connecting to a cell tower. Consequently, the data have limited utility in producing estimates of the ambient population. Geo-located social media data have been identified as being able to provide detailed spatio-temporal logs of the locations of individuals; however, the data only represent a small proportion of social media users and not the entire population of an area. Finally, mobile phone data provide temporally frequent data but are expensive to purchase from network providers, which is a significant research barrier. Additionally, there are significant ethical issues surrounding the consent of mobile service users.
Footfall camera data have limited ethical concerns and are able to capture all individuals who pass the camera, thus can be representative of the whole population. However, it is possible that individuals may be counted by the same camera multiple times or be counted by multiple cameras. As with Wi-Fi sensors, a physical device has to be installed to capture data, therefore ensuring there are sufficient devices within a geographical area is crucial. Footfall camera data are able to capture non-working and atypical working populations at fine spatio-temporal scales. Wi-Fi sensors also offer spatio-temporal detail, but do not capture the entire population. Footfall camera data are able to enumerate the whole population without the bias of the digital divide. The availability of Wi-Fi sensor and footfall camera data remains a significant issue, however this work has provided evidence that they are potentially valuable sources of data for building estimates of the ambient population. Following the direct comparison of footfall camera and Wi-Fi sensor counts, it is clear that a validation process must be undertaken to assess the accuracy of the data.
Assessing the utility of data sources for quantifying the ambient population is a crucial step in producing accurate estimates. While no single dataset is able to capture the ambient population, this paper has highlighted data sources which may be valuable for estimating the ambient population. Estimates of the ambient population would benefit from data which are geographically comprehensive and spatio-temporally detailed. Conventional data sources, such as the census are able to provide data which are geographically comprehensive, but they lack temporal detail. However, workday population estimates are able to provide an indication of work-related temporal fluctuations, in addition to providing an extensive geographical coverage. Footfall cameras and Wi-Fi sensors are able to provide spatio-temporally detailed data which do not have associated ethical concerns, unlike mobile phone activity data. While geo-located social media are also able to provide data at a high spatio-temporal resolution, there is insufficient information regarding the representativeness of the data. Additionally, Twitter data will no longer be geo-located which limits its use in future research. Consequently, Wi-Fi sensor and footfall camera data have been recommended as potentially valuable for estimating the ambient population. Issues such as data access and counting individuals multiple times remain, but validating and exploring these datasets further would enable the development of a framework for building estimates of the ambient population. Future work should include the validation of counts from footfall cameras and Wi-Fi sensors and the production of a comprehensive framework to estimate the ambient population.
Author Contributions
Conceptualization, Annabel Whipp; formal analysis, Annabel Whipp; investigation, Annabel Whipp; writing—original draft preparation, Annabel Whipp; writing—review and editing, Annabel Whipp, Nicolas Malleson, Jonathan Ward and Alison Heppenstall; visualization, Annabel Whipp; supervision, Nicolas Malleson, Jonathan Ward and Alison Heppenstall; funding acquisition, Nicolas Malleson and Alison Heppenstall All authors have read and agreed to the published version of the manuscript.
Funding
This project has received funding from the European Research Council (ERC) under the European Union’s Horizon 2020 research and innovation programme, grant number 757455, the ESRC Training Grant, grant number ES/R501062/1 and the ESRC Alan Turing Fellowship, grant number ES/R007918/1.
Institutional Review Board Statement
Not applicable.
Informed Consent Statement
Not applicable.
Data Availability Statement
The data presented in this study are available on request from the corresponding author.
Conflicts of Interest
The authors declare no conflict of interest.
References
- United Nations Department of Economic and Social Affairs (UNDESA). The State of the World’s Cities 2008/9: Harmonious Cities; Earthscan: London, UK, 2008. [Google Scholar]
- Batty, M. The New Science of Cities; MIT Press: Cambridge, MA, USA, 2013. [Google Scholar]
- Panczak, R.; Charles-Edwards, E.; Corcoran, J. Estimating temporary populations: A systematic review of the empirical literature. Palgrave Commun. 2020. [Google Scholar] [CrossRef]
- Boggs, S.L. Urban crime patterns. Am. Sociol. Rev. 1965, 899–908. [Google Scholar] [CrossRef]
- Andresen, M.A.; Jenion, G.W.; Reid, A.A. An evaluation of ambient population estimates for use in crime analysis. Crime Mapp. 2012, 4, 7–30. [Google Scholar]
- Andresen, M.A. The ambient population and crime analysis. Prof. Geogr. 2011, 63, 193–212. [Google Scholar] [CrossRef]
- Kobayashi, T.; Medina, R.M.; Cova, T.J. Visualizing diurnal population change in urban areas for emergency management. Prof. Geogr. 2011. [Google Scholar] [CrossRef] [PubMed]
- Wardrop, N.A.; Jochem, W.C.; Bird, T.J.; Chamberlain, H.R.; Clarke, D.; Kerr, D.; Bengtsson, L.; Juran, S.; Seaman, V.; Tatem, A.J. Spatially disaggregated population estimates in the absence of national population and housing census data. Proc. Natl. Acad. Sci. USA 2018. [CrossRef] [Green Version]
- Rees, P.; Martin, D.; Williamson, P. The Census Data System; Wiley & Sons: Hoboken, NJ, USA, 2002. [Google Scholar]
- Bhaduri, B.; Bright, E.; Coleman, P.; Urban, M.L. LandScan USA: A high-resolution geospatial and temporal modeling approach for population distribution and dynamics. GeoJournal 2007, 69, 103–117. [Google Scholar] [CrossRef]
- Smith, G.; Arnot, C.; Fairburn, J.; Walker, G. A National Population Data Base for Major Accident Hazard Modelling; Staffordshire University: Staffordshire, UK, 2005. [Google Scholar]
- Martin, D.; Cockings, S.; Leung, S. Developing a Flexible Framework for Spatiotemporal Population Modeling. Ann. Assoc. Am. Geogr. 2015. [Google Scholar] [CrossRef]
- Martin, D.; Cockings, S.; Leung, S. Population 24/7: Building time-specific population grid models. In Proceedings of the European Forum for Geostatistics Conference, Hague, The Netherlands, 4–8 October 2009; 2009. [Google Scholar]
- Qi, W.; Liu, S.; Gao, X.; Zhao, M. Modeling the spatial distribution of urban population during the daytime and at night based on land use: A case study in Beijing, China. J. Geogr. Sci. 2015, 25, 756–768. [Google Scholar] [CrossRef]
- Sullivan, T. Census 2020: Understanding the Issues, 1st ed.; Springer: Cham, Switzerland, 2020. [Google Scholar]
- Nitsche, P.; Widhalm, P.; Breuss, S.; Brändle, N.; Maurer, P. Supporting large-scale travel surveys with smartphones—A practical approach. Transp. Res. Part C Emerg. Technol. 2014. [Google Scholar] [CrossRef]
- Zandvliet, R.; Dijst, M. Research Note—The Ebb and Flow of Temporary Populations: The Dimensions of Spatial-Temporal Distributions of Daytime Visitors in The Netherlands. Urban Geogr. 2005, 26, 353–364. [Google Scholar] [CrossRef]
- Charles-Edwards, E.; Bell, M.; Brown, D. Where people move and when: Temporary population mobility in Australia. People Place 2008, 16, 21. [Google Scholar]
- Steiger, E.; Westerholt, R.; Resch, B.; Zipf, A. Twitter as an indicator for whereabouts of people? Correlating Twitter with UK Census Data. Comput. Environ. Urban Syst. 2015, 54, 255–265. [Google Scholar] [CrossRef]
- Ratti, C.; Frenchman, D.; Pulselli, R.M.; Williams, S. Mobile landscapes: Using location data from cell phones for urban analysis. Environ. Plan. B Plan. Des. 2006, 33, 727–748. [Google Scholar] [CrossRef]
- Reades, J.; Calabrese, F.; Sevtsuk, A.; Ratti, C. Cellular census: Explorations in urban data collection. IEEE Pervasive Comput. 2007, 6, 30–38. [Google Scholar] [CrossRef] [Green Version]
- Terada, M.; Nagata, T.; Kobayashi, M. Population estimation technology for mobile spatial statistics. NTT DOCOMO Techn. J 2013, 14, 10–15. [Google Scholar]
- He, L.; Páez, A.; Jiao, J.; An, P.; Lu, C.; Mao, W.; Long, D. Ambient Population and Larceny-Theft: A Spatial Analysis Using Mobile Phone Data. ISPRS Int. J. Geo Inform. 2020, 9, 342. [Google Scholar] [CrossRef]
- Hanaoka, K. New insights on relationships between street crimes and ambient population: Use of hourly population data estimated from mobile phone users’ locations. Environ. Plan. B Urban Anal. City Sci. 2018, 45, 295–311. [Google Scholar] [CrossRef]
- Apple Mobility Trends Reports. Available online: https://covid19.apple.com/mobility (accessed on 8 February 2021).
- Google COVID19 Mobility Reports. Available online: https://www.google.com/covid19/mobility/?hl=en (accessed on 8 February 2021).
- Goodchild, M.F. Citizens as sensors: The world of volunteered geography. GeoJournal 2007, 69, 211–221. [Google Scholar] [CrossRef] [Green Version]
- Hecht, B.; Stephens, M. A tale of cities: Urban biases in volunteered geographic information. In Proceedings of the 8th International Conference on Weblogs and Social Media, ICWSM 2014, Ann Arbor, USA, 1–4 June 2014. [Google Scholar]
- Stefanidis, A.; Crooks, A.; Radzikowski, J. Harvesting ambient geospatial information from social media feeds. GeoJournal 2013, 78, 319–338. [Google Scholar] [CrossRef]
- Malleson, N.; Andresen, M.A. The impact of using social media data in crime rate calculations: Shifting hot spots and changing spatial patterns. Cartogr. Geogr. Inf. Sci. 2015. [Google Scholar] [CrossRef]
- Hamstead, Z.A.; Fisher, D.; Ilieva, R.T.; Wood, S.A.; McPhearson, T.; Kremer, P. Geolocated social media as a rapid indicator of park visitation and equitable park access. Comput. Environ. Urban Syst. 2018, 72, 38–50. [Google Scholar] [CrossRef]
- Hipp, J.R.; Bates, C.; Lichman, M.; Smyth, P. Using social media to measure temporal ambient population: Does it help explain local crime rates? Justice Q. 2019, 36, 718–748. [Google Scholar] [CrossRef] [Green Version]
- Tucker, R.; O’Brien, D.T.; Ciomek, A.; Castro, E.; Wang, Q.; Phillips, N.E. Who ‘Tweets’ Where and When, and How Does it Help Understand Crime Rates at Places? Measuring the Presence of Tourists and Commuters in Ambient Populations. J. Quant. Criminol. 2021. [Google Scholar] [CrossRef]
- Giglio, S.; Bertacchini, F.; Bilotta, E.; Pantano, P. Using social media to identify tourism attractiveness in six Italian cities. Tour. Manag. 2019, 72, 306–312. [Google Scholar] [CrossRef]
- Roy, K.C.; Cebrian, M.; Hasan, S. Quantifying human mobility resilience to extreme events using geo-located social media data. EPJ Data Sci. 2019, 8, 18. [Google Scholar] [CrossRef] [Green Version]
- Kounadi, O.; Ristea, A.; Leitner, M.; Langford, C. Population at risk: Using areal interpolation and Twitter messages to create population models for burglaries and robberies. Cartogr. Geogr. Inf. Sci. 2018, 45, 205–220. [Google Scholar] [CrossRef] [PubMed]
- Liu, Y.; Liu, X.; Gao, S.; Gong, L.; Kang, C.; Zhi, Y.; Chi, G.; Shi, L. Social sensing: A new approach to understanding our socioeconomic environments. Ann. Assoc. Am. Geogr. 2015, 105, 512–530. [Google Scholar] [CrossRef]
- OFCOM. Adults’ Media Use & Attitudes Report 2020; OFCOM: London, UK, 2020. [Google Scholar]
- Malleson, N.; Andresen, M.A. Spatio-temporal crime hotspots and the ambient population. Crime Sci. 2015. [Google Scholar] [CrossRef] [Green Version]
- Liu, L.; Lan, M.; Eck, J.E.; Yang, B.; Zhou, H. Assessing the Intraday Variation of the Spillover Effect of Tweets-Derived Ambient Population on Crime. Soc. Sci. Comput. Rev. 2020. [Google Scholar] [CrossRef]
- Crols, T.; Malleson, N. Quantifying the ambient population using hourly population footfall data and an agent-based model of daily mobility. Geoinformatica 2019, 23, 201–220. [Google Scholar] [CrossRef] [PubMed] [Green Version]
- Soundararaj, B.; Cheshire, J.; Longley, P. Estimating real-time high-street footfall from Wi-Fi probe requests. Int. J. Geogr. Inf. Sci. 2020, 34, 325–343. [Google Scholar] [CrossRef]
- Freudiger, J. How talkative is your mobile device? An experimental study of Wi-Fi probe requests. In Proceedings of the 8th ACM Conference on Security & Privacy in Wireless and Mobile Networks, New York, NY, USA, 22–26 June 2015. [Google Scholar]
- Oliveira, L.; Henrique, J.; Schneider, D.; de Souza, J.; Rodriques, S.; Sherr, W. Sherlock: Capturing probe requests for automatic presence detection. In Proceedings of the 2018 IEEE 22nd International Conference on Computer Supported Cooperative Work in Design ((CSCWD)), Nanjing, China, 9–11 May 2018; 2018; pp. 848–853. [Google Scholar]
- Vanhoef, M.; Matte, C.; Cunche, M.; Cardoso, L.S.; Piessens, F. Why MAC address randomization is not enough: An analysis of Wi-Fi network discovery mechanisms. In Proceedings of the 11th ACM on Asia Conference on Computer and Communications Security, Xi’an, China, 30 May–3 June 2016. [Google Scholar]
- Martin, J.; Mayberry, T.; Donahue, C.; Foppe, L.; Brown, L.; Riggins, C.; Rye, E.C.; Brown, D. A study of MAC address randomization in mobile devices and when it fails. arXiv 2017, arXiv:1703.02874. [Google Scholar]
- Android Privacy: MAC Randomization. Available online: https://source.android.com/devices/tech/connect/wifi-mac-randomization (accessed on 7 December 2020).
- Kontokosta, C.E.; Johnson, N. Urban phenology: Toward a real-time census of the city using Wi-Fi data. Comput. Environ. Urban Syst. 2017, 64, 144–153. [Google Scholar] [CrossRef]
- Robinson, C.; Franklin, R.S. The sensor desert quandary: What does it mean (not) to count in the smart city? Trans. Inst. Br. Geogr. 2020. [Google Scholar] [CrossRef]
- Office for National Statistics. Office for National Statistics 2011 Census; Office for National Statistics: Wales, UK. Available online: https://www.ons.gov.uk/census/2011census (accessed on 1 March 2021).
| Publisher’s Note: MDPI stays neutral with regard to jurisdictional claims in published maps and institutional affiliations. |
© 2021 by the authors. Licensee MDPI, Basel, Switzerland. This article is an open access article distributed under the terms and conditions of the Creative Commons Attribution (CC BY) license (http://creativecommons.org/licenses/by/4.0/).


