Article

Transfer Learning of a Deep Learning Model for Exploring Tourists’ Urban Image Using Geotagged Photos

Department of Social Studies, Ewha Womans University, Seoul 03760, Korea
*
Author to whom correspondence should be addressed.
ISPRS Int. J. Geo-Inf. 2021, 10(3), 137; https://0-doi-org.brum.beds.ac.uk/10.3390/ijgi10030137
Submission received: 30 December 2020 / Revised: 17 February 2021 / Accepted: 1 March 2021 / Published: 4 March 2021
(This article belongs to the Special Issue Geospatial Artificial Intelligence)

Abstract

:
Recently, as computer vision and image processing technologies have rapidly advanced in the artificial intelligence (AI) field, deep learning technologies have been applied in the field of urban and regional study through transfer learning. In the tourism field, studies are emerging to analyze the tourists’ urban image by identifying the visual content of photos. However, previous studies have limitations in properly reflecting unique landscape, cultural characteristics, and traditional elements of the region that are prominent in tourism. With the purpose of going beyond these limitations of previous studies, we crawled 168,216 Flickr photos, created 75 scenes and 13 categories as a tourist’ photo classification by analyzing the characteristics of photos posted by tourists and developed a deep learning model by continuously re-training the Inception-v3 model. The final model shows high accuracy of 85.77% for the Top 1 and 95.69% for the Top 5. The final model was applied to the entire dataset to analyze the regions of attraction and the tourists’ urban image in Seoul. We found that tourists feel attracted to Seoul where the modern features such as skyscrapers and uniquely designed architectures and traditional features such as palaces and cultural elements are mixed together in the city. This work demonstrates a tourist photo classification suitable for local characteristics and the process of re-training a deep learning model to effectively classify a large volume of tourists’ photos.

1. Introduction

Today, people share ideas, photos, videos, and posts with others; maintain their social relationships; and find news and information through social network service (SNS). As the number of users connected to the SNS platform has increased exponentially, SNS is being utilized as a major source of data in various fields. In particular, user-generated contents in SNS are recognized as a major source of data in grasping the urban image that tourists feel about [1,2,3].
Among SNS data, Flickr, which aims to share photos with users, has been used in various studies as it not only includes location and time information in the metadata of photo but also is open to the public. Using Flickr data, studies such as analysis of region of attraction [4,5], analysis of city image and emotion [6,7,8], and analysis of location-based recommendation system [9,10,11] have been conducted. However, these studies have a limitation to analyze the visual content of the photo due to the lack of methodology and technique.
As a photo is evaluated as reflecting the photographer’s inner feelings, Pan et al. analyzed 145 tourist photos posted in The New York Times and revealed that the landscape contained in the photo is linked to the urban image that tourists feel about [12]. Donaire et al. recognized that a photo plays an important role in the formation of tourism images [13]. They classified tourists into four groups and identified favorite regions of attractions by group through the analysis of 1786 photos downloaded from Flickr. This conventional way of analyzing photos identifies the visual contents manually and uses the text attached on the photos as an auxiliary means. The conventional way has the advantage that it provides a conceptualized framework in the theoretical aspect, but it has the disadvantage that the number of photos is limited and artificial category classification is unstable and irregular [14].
Recently, as computer vision and image processing technologies have rapidly advanced in the AI field, techniques for analyzing visual contents in photo are also increasingly evolving in the field of urban study. Visual content analysis of photos using AI technology has the advantage of being able to quickly classify a large volume of photos into a standardized classification processing. As the convolutional neural network (CNN), one of artificial neural networks, shows high performance in image identification and classification, it is applied widely in the research of analyzing the visual content of the photos. Representative architectures of CNN include AlexNet [15], GoogLeNet [16], ResNet [17], etc. In particular, in the 2012 ImageNet Large Scale Visual Recognition Challenge (ILSVRC), AlexNet showed more than 10% better performance than the existing image recognition models. After that, deep CNN models such as VGGNet [18], DenseNet [19], MobileNet [20], etc. are evolving rapidly.
As CNN models show excellent performance in image recognition, the application of these models to other areas through transfer learning continues to surge. Transfer learning is fine-tuning of CNNs pre-trained on a large annotated image dataset to other domains/tasks [21]. In the field of urban studies, especially in the tourism area, studies to classify tourist photos based on CNN model have begun [14,22,23,24]. However, these studies are limited in reflecting the unique landscape or regional characteristics in the area.
With the purpose of overcoming these limitations of previous studies, this study aimed to apply computer vision and image processing technique to effectively classify a large volume of Flickr photos uploaded by tourists. This study had three objectives: (1) develop a tourism photo classification by analyzing the characteristics of photos; (2) propose detailed procedures of training a deep learning model to enhance the model accuracy; and (3) analyze the urban images of tourists visiting Korea by applying the final model to the entire dataset.

2. Literature Review

In the field of computer vision, studies for image analysis have begun classifying images by assigning a single label to an image. Recently, image analysis has been developed into object detection to extract a specific object from an image [25,26], image captioning to generate textual description of an image [27], and multi-label classification to assign multiple labels to a single image [28].
A labeled dataset is required to train a model in deep learning-based image classification. The ImageNet, a representative database used for deep learning, contains 14,197,122 images labeled with 1000 categories. ImageNet assigns a single label to an object. The performance of deep learning models such as AlexNet, VGG Net, and ResNet is evaluated based on ImageNet dataset. In addition to the ImageNet dataset, SUN [29] and Places365 [30] are datasets that systematically classify scenes. The SUN dataset includes 108,754 images, with 397 scene semantic categories. The Places365 dataset includes 10M images, with 434 scene semantic categories. Recently, as the need to assign multiple tags to a scene has been recognized, Tencent’s multi-label image dataset [28] was released. Scene classification dataset acquired from remote sensing [31] and Place Pulse dataset [32], which evaluates the emotions of urban built environment through street images, were released. In addition to these labeled data, street level images, such as Google Street View (GSV) and Tencent Street View (TSV), and geotagged photos from online photo sharing services, such as Flickr and Panoramio, have become major sources of data for urban studies.
Studies where the CNN model is applied in urban and tourism areas can be divided into two approaches: using a pre-trained model as is and using a re-trained model through transfer learning. Studies that apply the pre-trained model in urban area identify optimal location or evaluate street environments through density analysis after detecting specific objects using an object detection model [33,34]; identify crime scenes or analyze the visual appearance of cities using image segmentation model [35,36]; or cluster or regroup classification results after applying a pre-trained image classification model [37,38].
In addition, several studies have been conducted to analyze the tourist’s urban image by applying the pre-trained model in the tourism area. Chen et al. classified Flickr photos using the ResNet model trained on Places365 dataset and analyzed regions of interest and seasonal dynamics to identify the difference between urban and non-urban areas of London [39]. Payntar et al. analyzed which photos were mainly taken in the World Heritage site of Cuzco, Peru, using the ResNet50 model trained on Places365 dataset [23]. Kim et al. analyzed Seoul tourism images by classifying Flickr photos into 1000 categories using the Inception-v3 model trained on ImageNet dataset [24]. These studies, however, have a limitation on reflecting the local characteristics when the pre-trained models were applied to specific regions. Chen et al. pointed out that the ResNet model pre-trained on Places365 dataset could misclassify Flickr data [39]. Payntar et al. also presented that the pre-trained ResNet model on Places365 dataset had a problem of not reflecting regional characteristics when classifying scenes in cultural heritage regions [23]. In particular, Kim et al. proposed the necessity of creating a photo classification and re-training the model because, when using the pre-trained model, Korean detached houses were misclassified as prisons, and Korean traditional buildings and unusual landscapes were also misclassified. They pointed out that the overall accuracy was only 27.93% when checking the predicted label with “true” or “false” after classifying 38,891 photos [24].
Studies that apply a re-trained model through transfer learning in urban area build a model that predicts human perception of a city, such as scenicness, safety, and quality [40,41,42]; construct a fusion model that predicts the relative evaluation score after learning the features of each image using two networks instead of one network [32,43,44,45,46]; or modify the classifier part of the model while freezing the convolutional part that extracts the features of the image [47,48]. In addition, a few studies have been conducted to analyze the tourist’s urban image by modifying the classifier part of the CNN model in the tourism domain. Zhang, Chen, and Li analyzed the images of tourist attractions using Flickr photos with the Resnet-101 model trained on Places365 dataset, which classified images into 434 scenes [14,22]. They modified the classifier part of the model by regrouping 434 scenes into 103 scenes and applied the model to the cities of Beijing and Hong Kong.
These studies, however, have a limitation when both the pre-trained model as is and the re-trained model through transfer learning are applied in tourism domain. In tourism, the unique scenery, cultural properties, and experience activities of the region are the key to the formation of the tourists’ urban image, but these studies are not able to properly identify tourism elements or regional characteristics. To analyze tourists’ urban image through photos, it is necessary to create a tourism photo classification in consideration of the unique landscape and cultural characteristics of the region. Thus, in this study, we built a tourists’ photo classification by analyzing the characteristics of photos posted by tourists and referring to the tourism classification of the Tourism Organization. In addition, we developed a deep learning model to classify a large volume of photos effectively and consistently according to classification criteria.

3. Methods

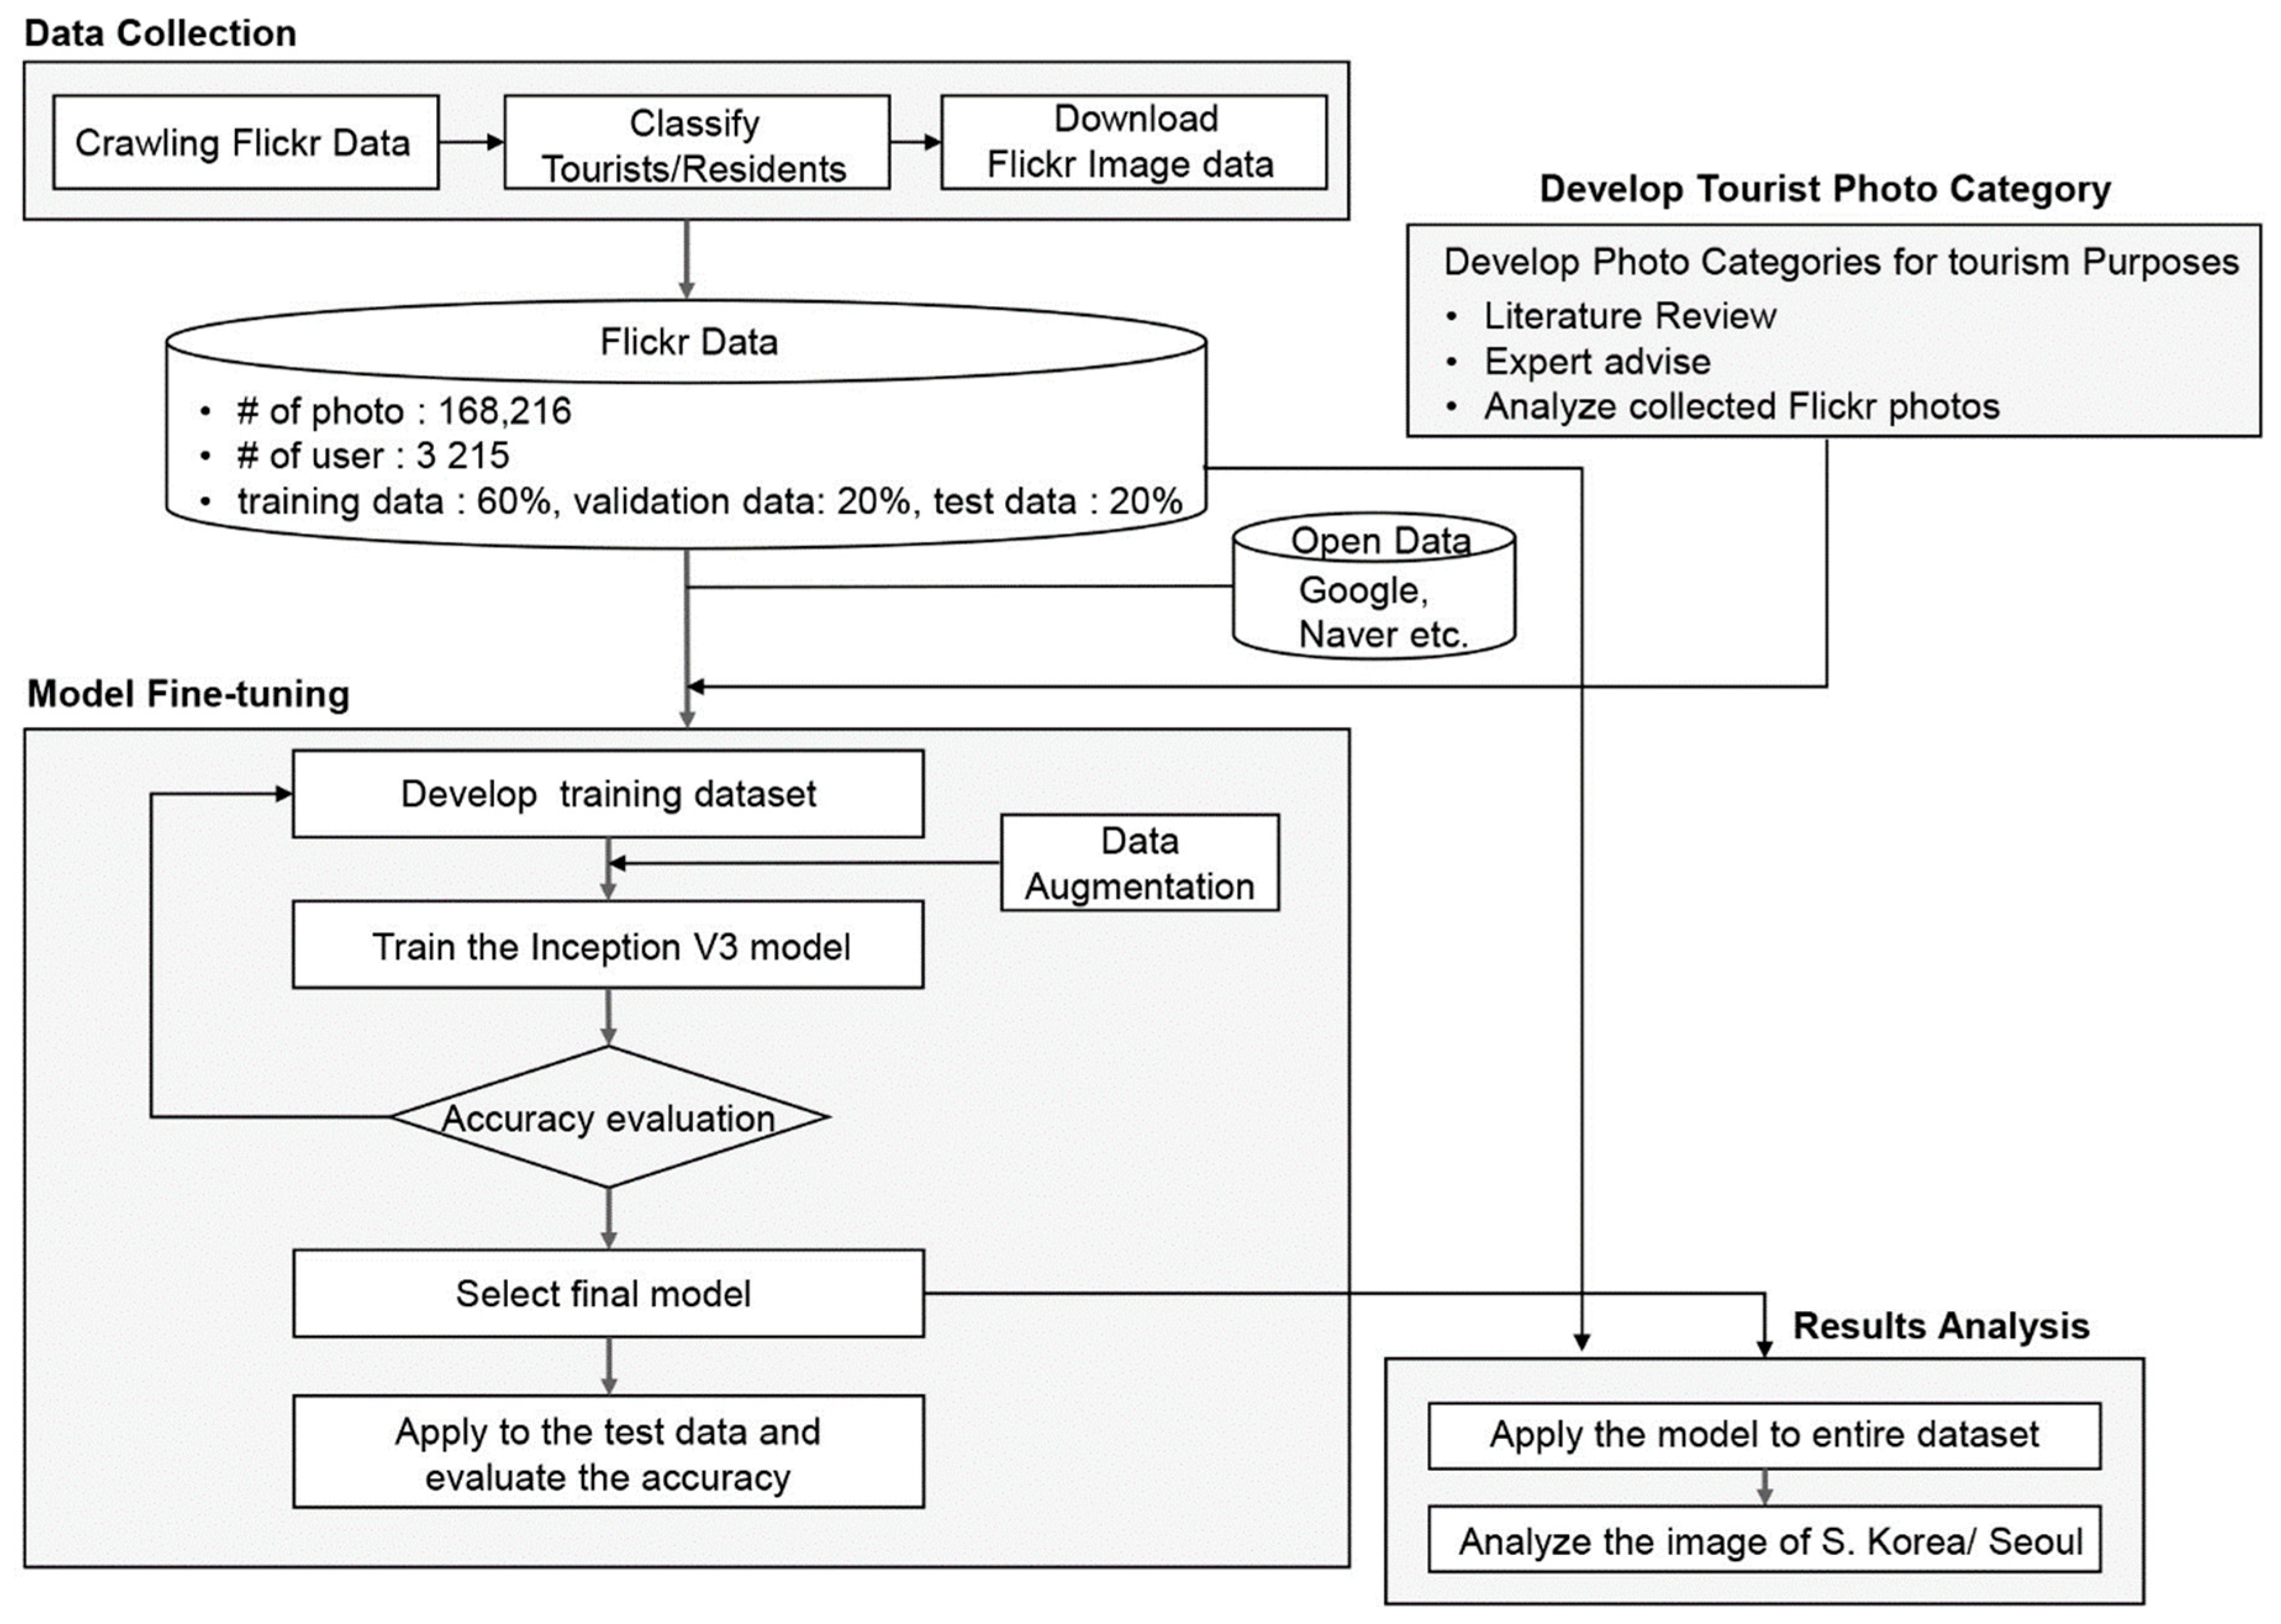
3.1. Research Process

The research flow of this study is shown in Figure 1. First, the photos on Flickr were crawled and divided into photos uploaded by tourists and residents, respectively. Second, tourists’ photo classification was developed by analyzing the characteristics of photos posted by tourists and referring to the tourism classification of the Tourism Organization. Third, a deep learning model was developed by continuously re-training the Inception-v3 model. Lastly, the final model was applied to the entire dataset to analyze regions of attraction and tourists’ urban image in Korea.

3.2. Data Collection and Tourist Identification

Photos on Flickr were collected through a public application programming interface (API) provided by Flickr. The photo collection period was six years from 1 January 2013 to 31 December 2018, and photos uploaded within Korea were crawled. In total, 284,094 photos were collected, and the number of users was 5609. Since residents and tourists are mingled among Flickr users, it is necessary to identify tourists by excluding residents. To track down each user’s country of residence, photos uploaded by users around the world were crawled over the previous three years from the time the photo was last uploaded. In total, 2,281,800 initial photos were collected worldwide, and the number of users was 5609. After removing the posts deleted by the user or the data with latitude, longitude, and temporal errors, 2,281,586 photos were finally collected, and the number of users was 5384. Of the total 5384 users, 2042 users entered their owner location in their profiles, and 3342 users did not provide their owner location. For the 3342 users, tourists were extracted by tracking down the country of residence by calculating the date of stay in a specific country, frequency of visit, and date of stay in Korea [49]. As a result of identification, 3259 users were determined as tourists, and 168,216 photos were extracted.

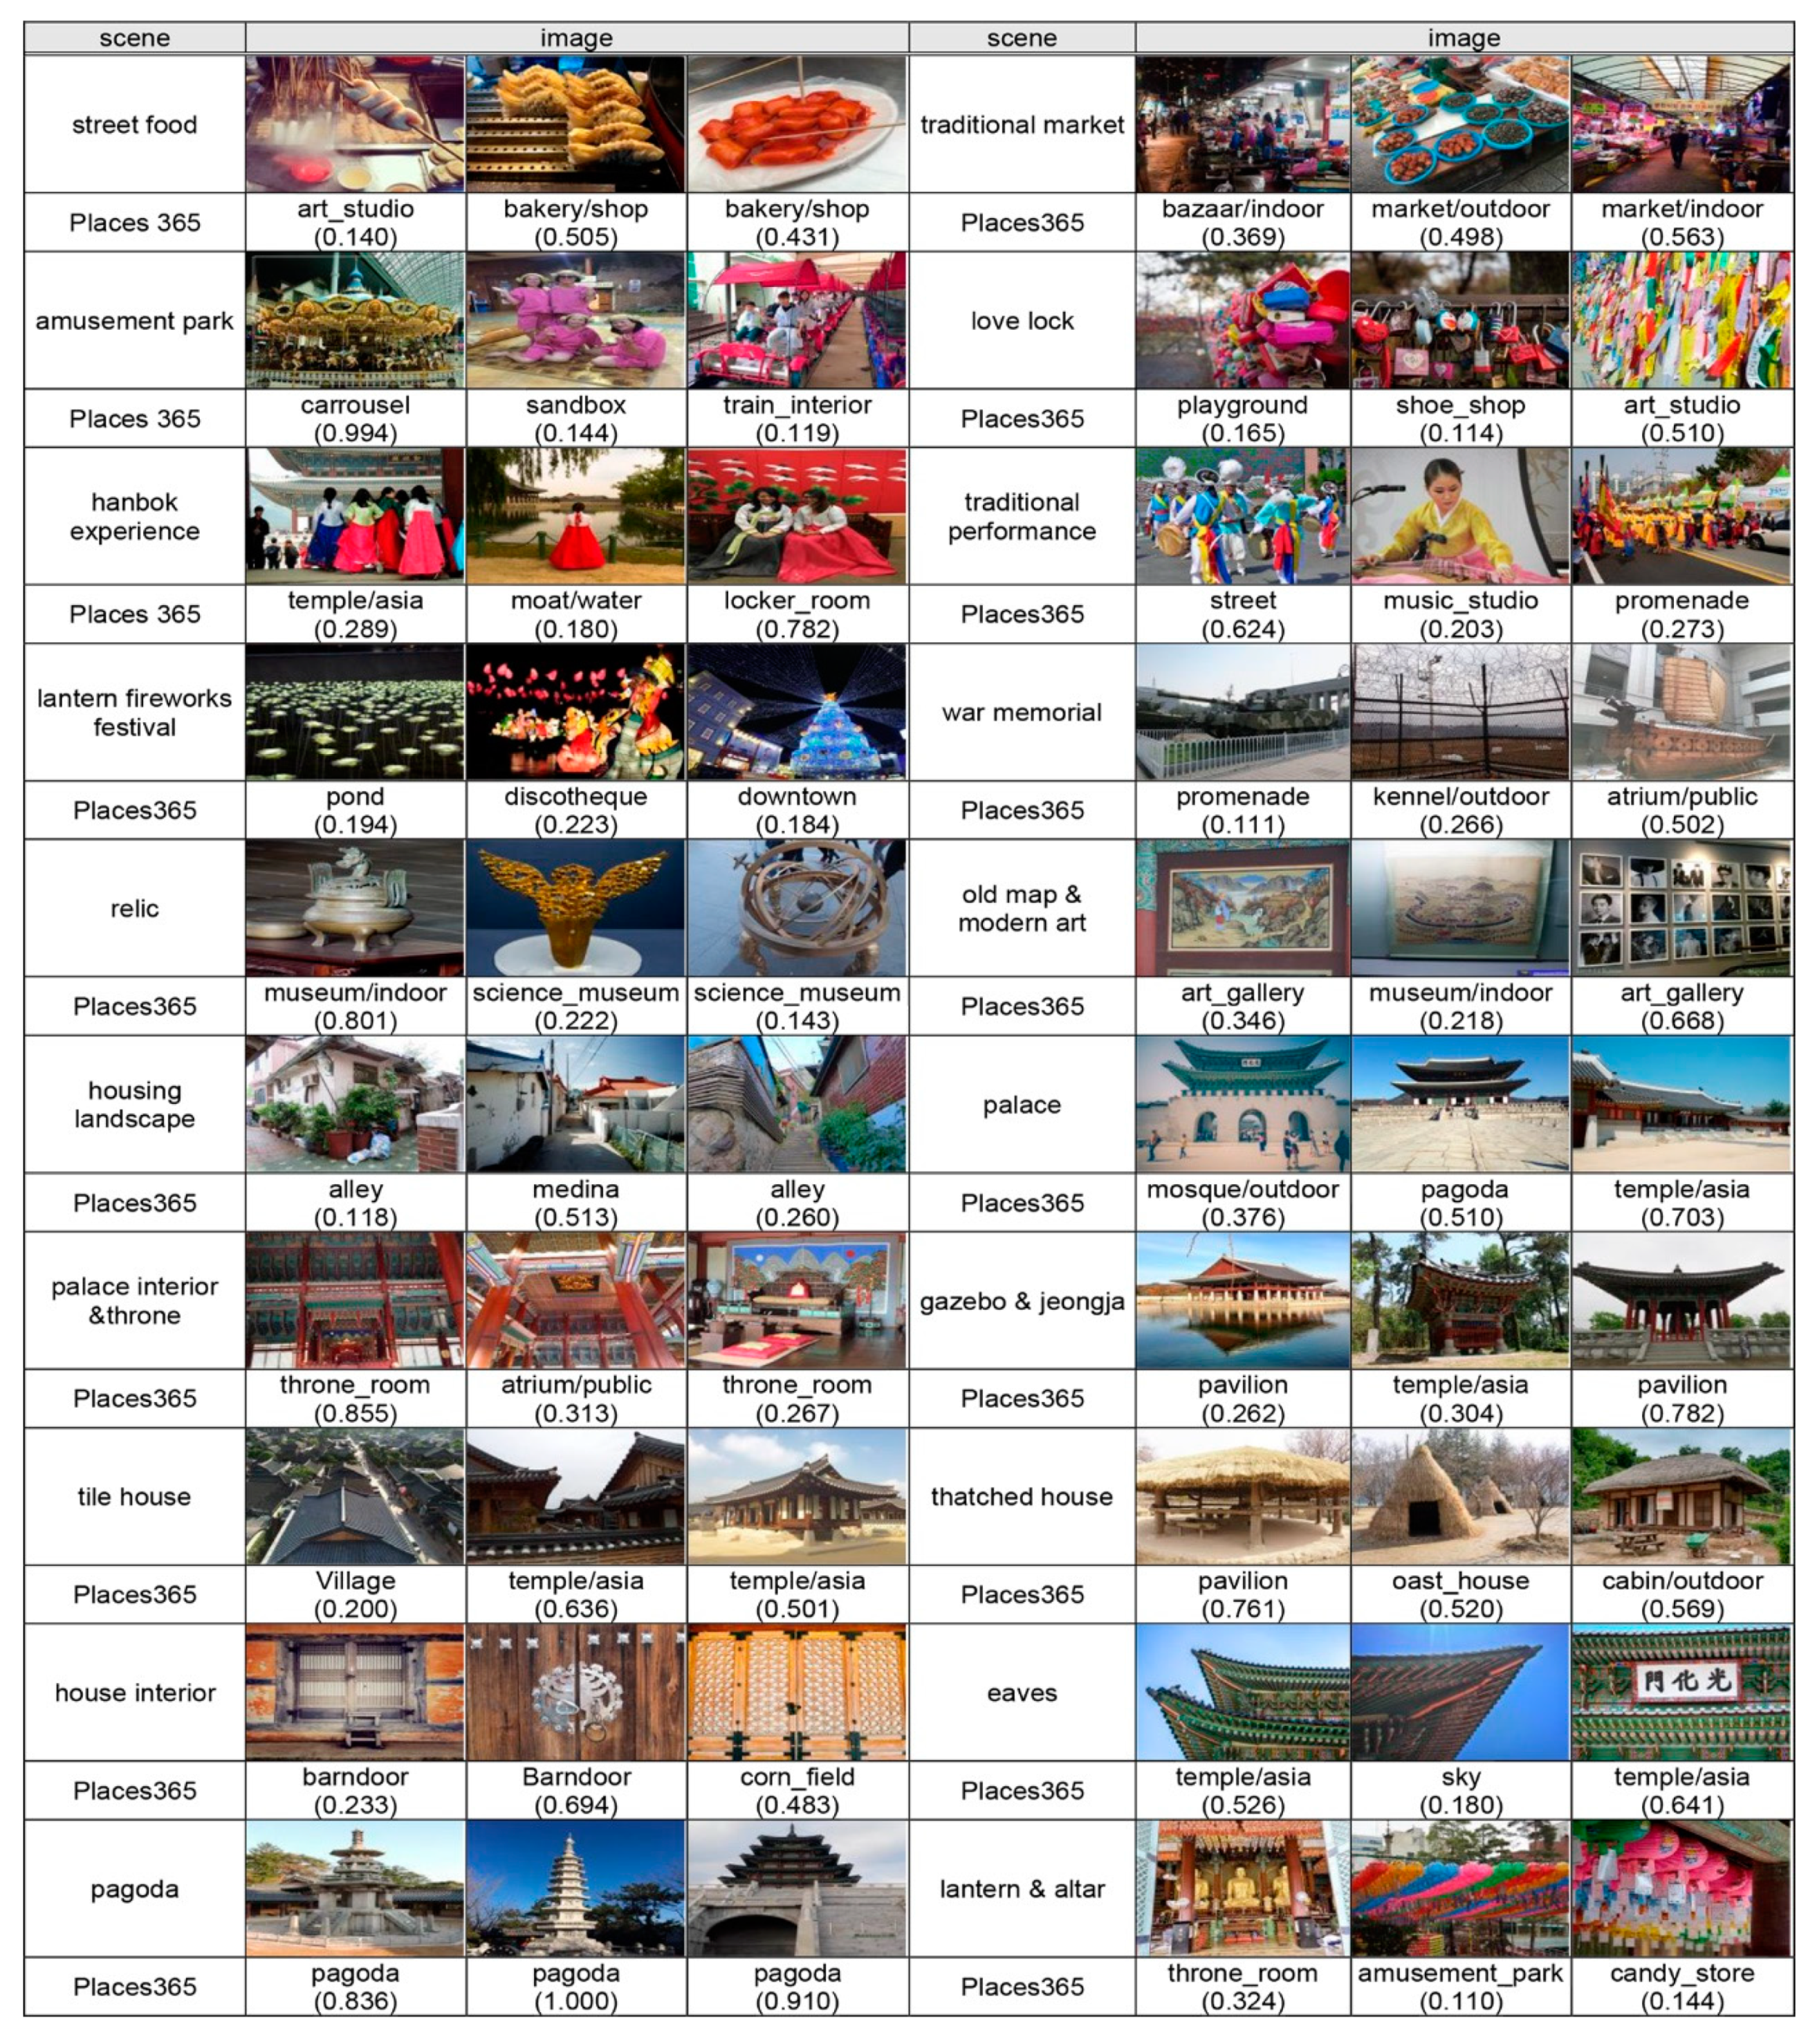
3.3. Classification of Tourists’ Photos

To classify tourists’ photos, the survey of the Korea Tourism Organization and the tourism category of the tourism application were referenced. In addition, after manually labeling 30,000 photos (20% of Flickr photos), the characteristics of tourists’ photos were identified. Through this process, a draft of tourists’ photo classification was developed and updated by running Inception-v3 model, repetitively. Due to the nature of tourists’ photos, it was necessary to segregate selfie photos that occurred frequently in tourism as well as indistinct photos that were difficult to classify such as blurred or enlarged photos.
Through the process of refining photo classification, the tourists’ photos were classified into 75 scenes, including “difficult to classify”. Then, the 74 scenes were grouped into 12 categories to facilitate future interpretation. The final 75 scenes and 13 categories are shown in Table 1. In Table 1, the 75 scenes are divided into the scenes with strong local characteristics, scenes in which local and general characteristics are mixed, and common scenes that can be applied in any region. There are 35 scenes with strong local and local/general characteristics, representing about 47% of the 75 scenes. Scenes with strong local characteristics are Korean palaces, street food, traditional markets, hanbok experience, traditional performances, etc.

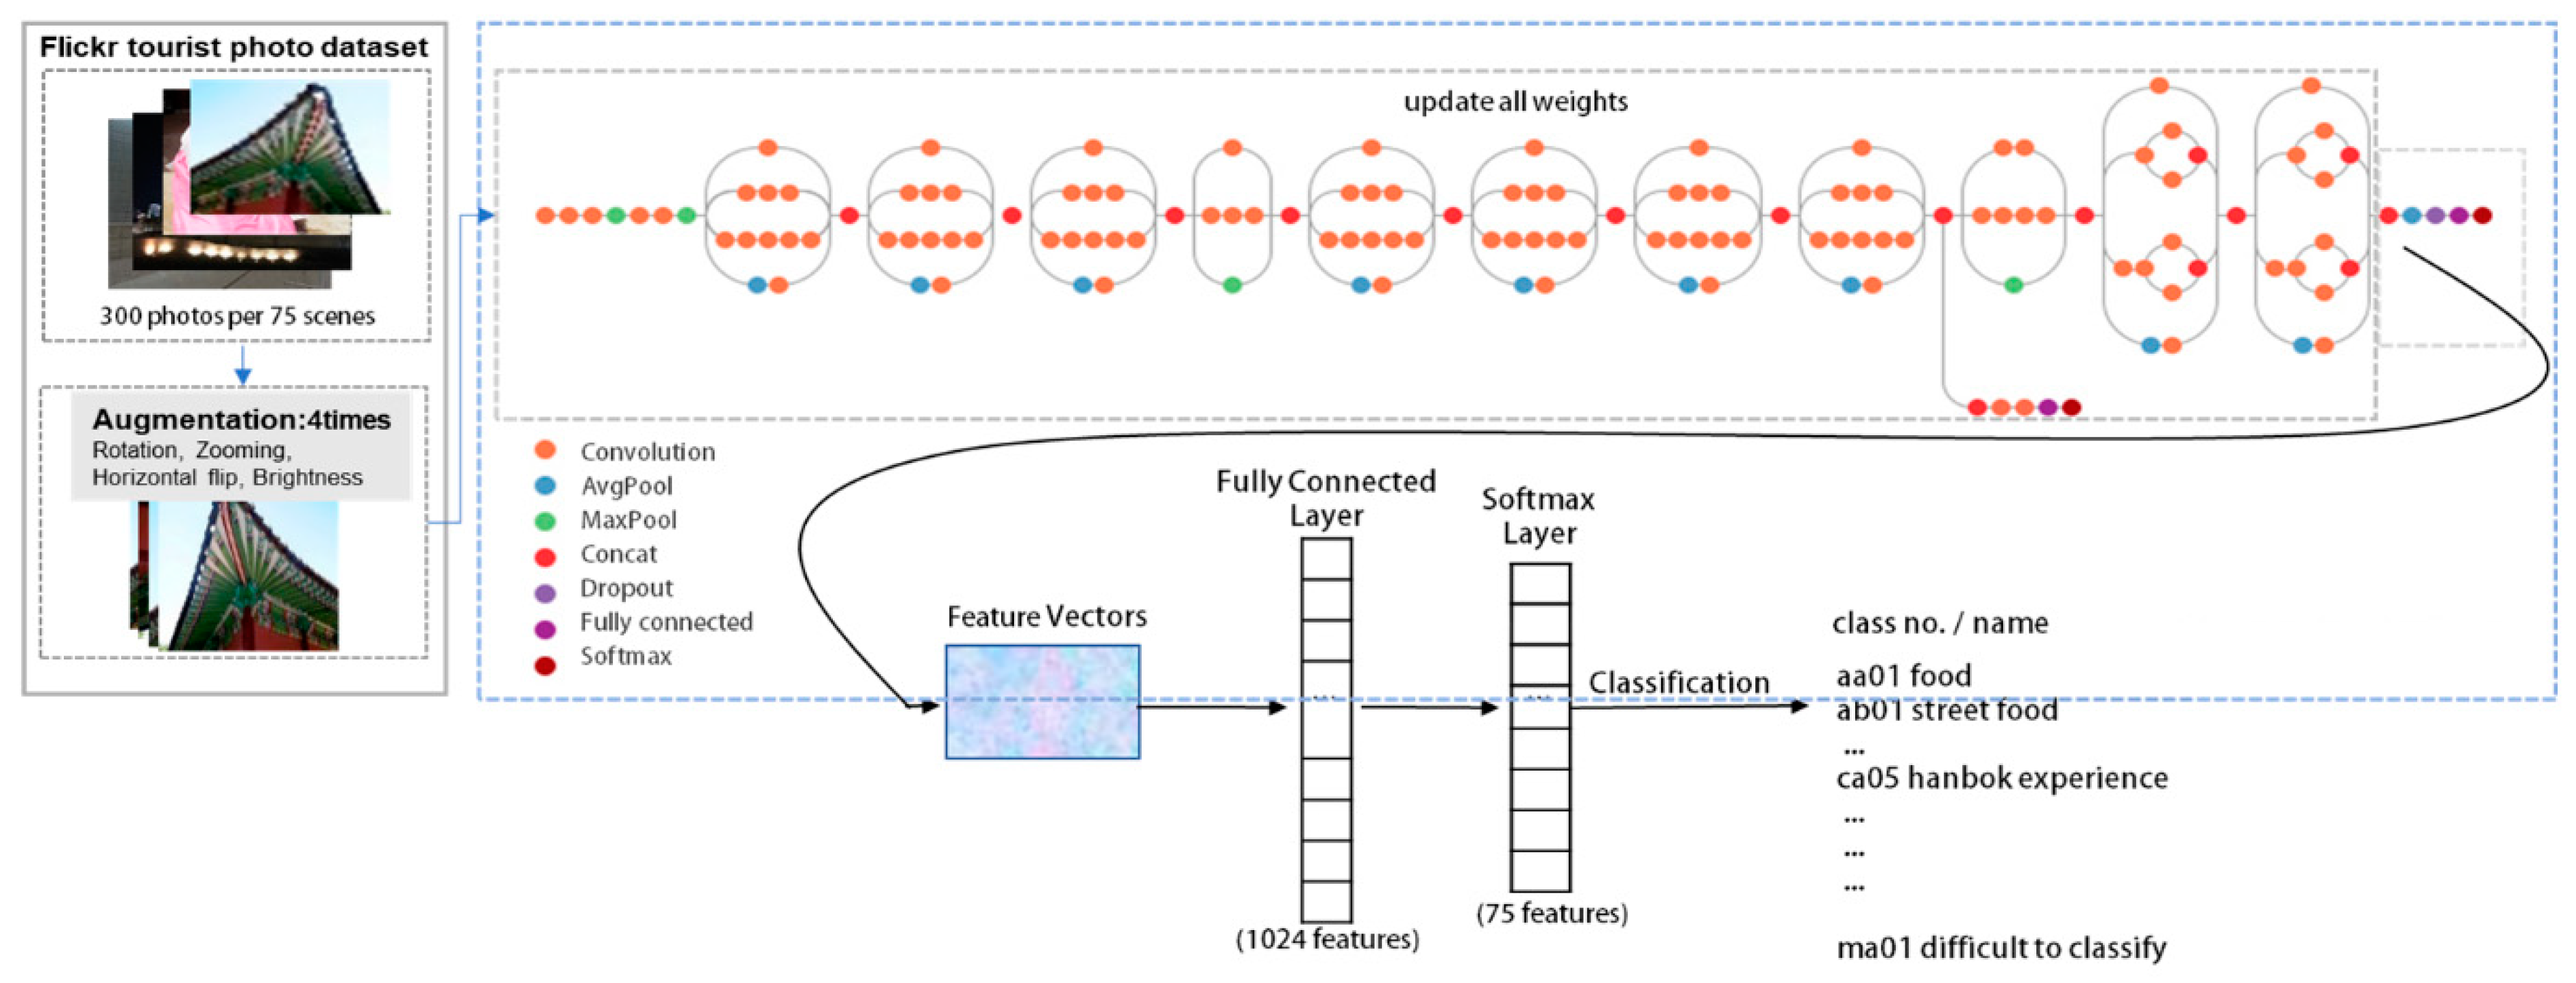
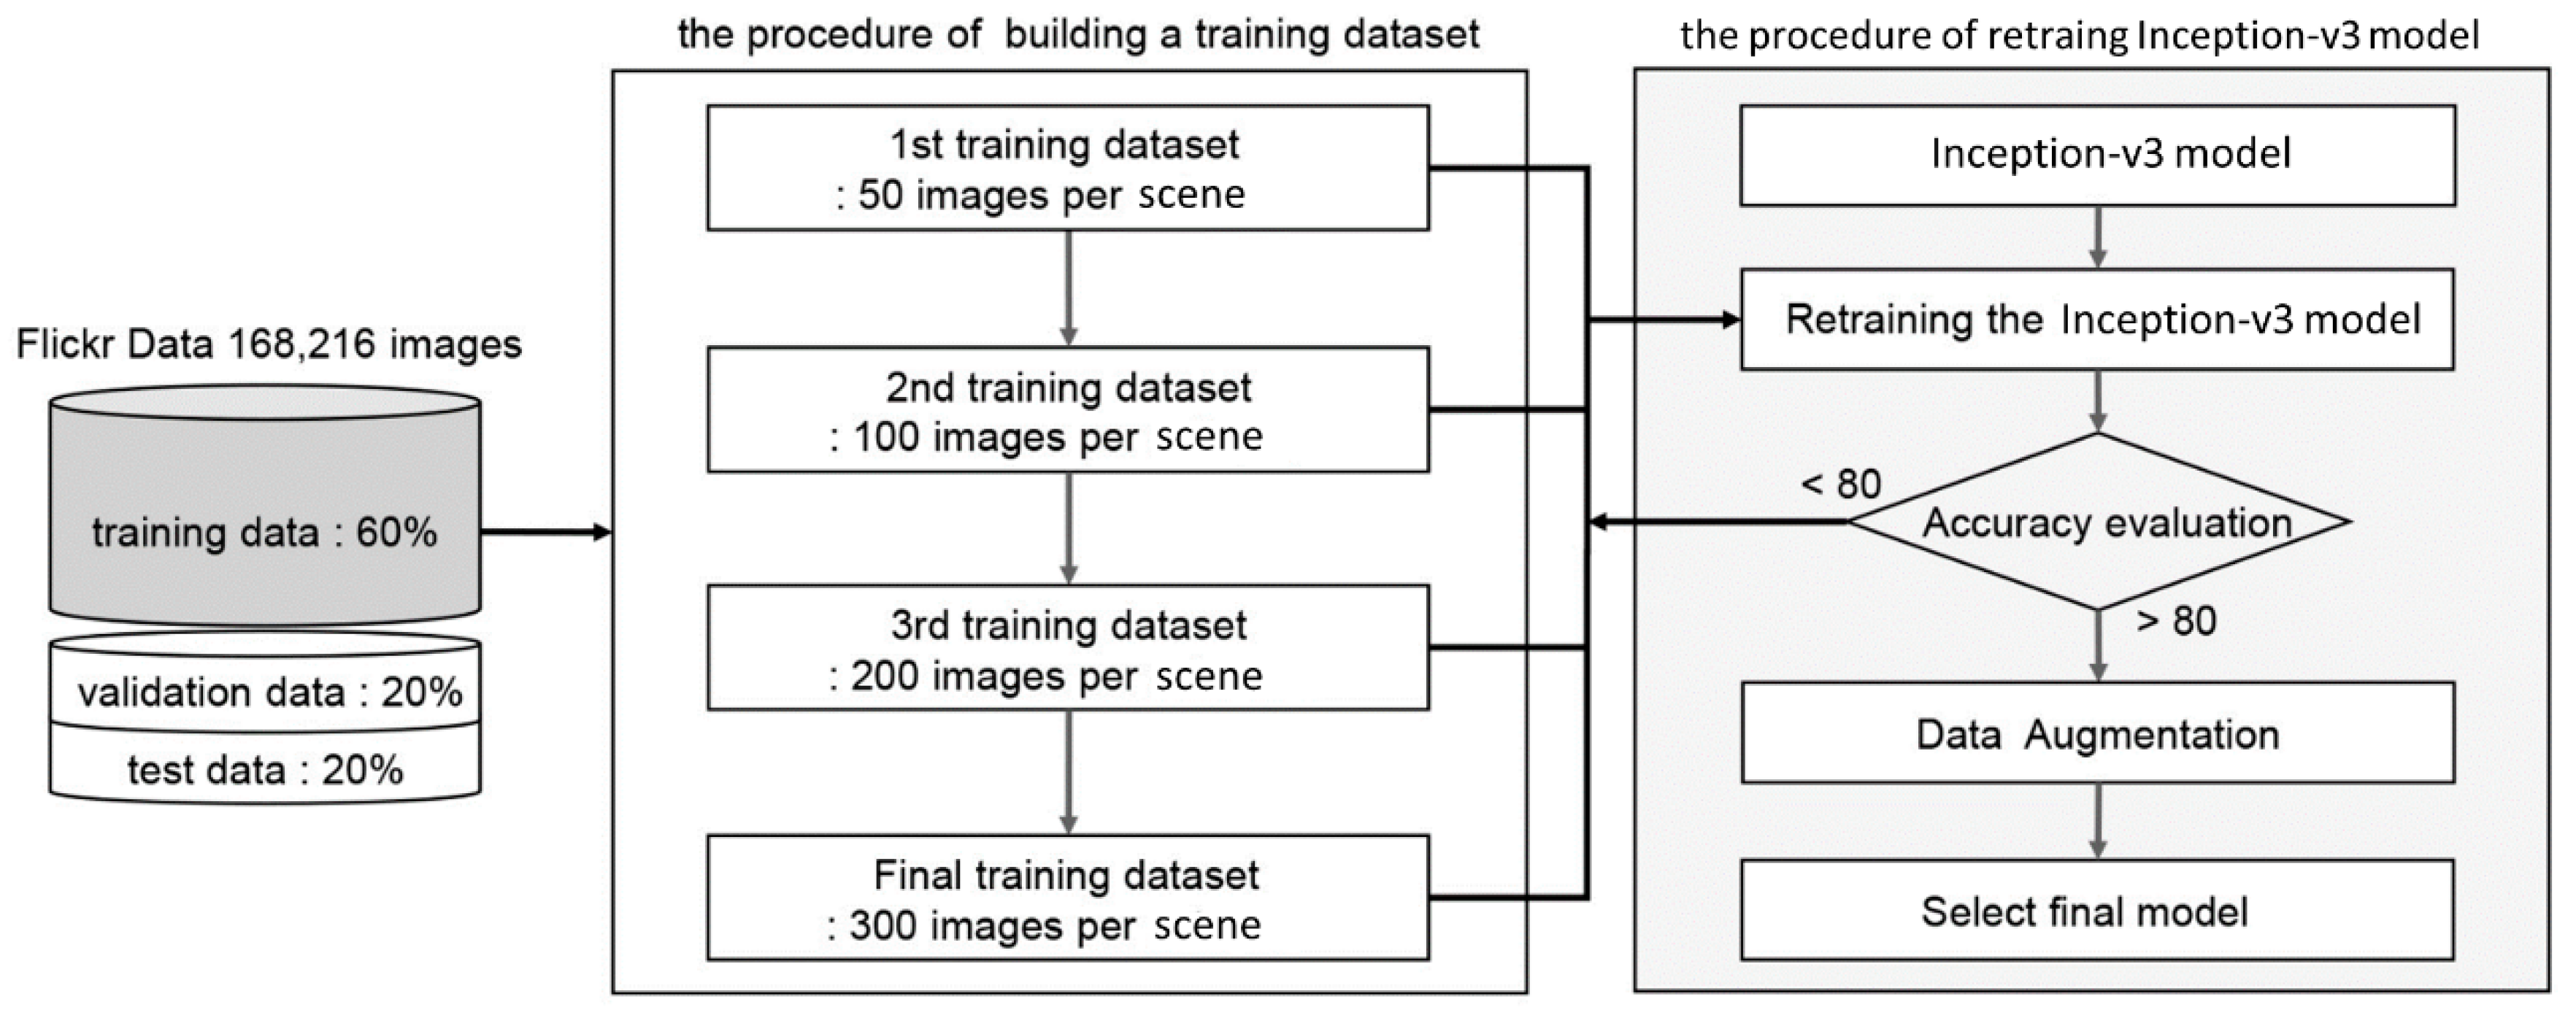
3.4. Training a Deep Learning Model for Classifying Tourists’ Photos

We aimed to develop a deep learning model through transfer learning of Inception-v3 model, which is one of the well-known pre-trained CNN architectures. CNN is one of the deep neural networks, which is the essential technology leading the state-of-the-art in computer vision for a variety of tasks. Although several models have been released thus far, Inception-v3 is still one of the most accurate models in its field for image classification, achieving Top 5 error accuracy of 3.58% and Top 1 error accuracy of 17.3% when trained on ImageNet dataset. In our work, the original network architecture of Inception-v3 was maintained and the pre-trained weights by ImageNet were used to initialize the network. With the process of fine-tuning, the initialized weights were subsequently updated so that the network could learn the specific features of the new task. The model was modified so that it can classify photos into 75 scenes in the last softmax layer, as shown in Figure 2.
In the case of CNN, thousands of parameters have to be trained, so there is a risk of overfitting when training the model with a limited number of training data. The most common way to reduce overfitting is to use a data augmentation technique that artificially increases the training dataset. Data augmentation is a technique that creates a similar but new image by slightly modifying the input image. One can create a new image by applying techniques such as panning, zooming, rotating, brightness adjustment, horizontal flip, vertical flip, and shearing. Through this, an N-size dataset can be increased to a size of 2N, 3N, 4N, etc. [50,51].
The accuracy of the re-trained model was evaluated by calculating accuracy, recall, precision, and F1-score after constructing a confusion matrix [52], as shown in Figure 3. The accuracy was calculated for 75 total scenes, whereas the recall and precision were calculated for each of the 75 scenes. Accuracy refers to the ratio of the true to the predicted values matched in the total classification results. Recall means the ratio of the correctly predicted value to the true value in a corresponding scene. Precision represents the ratio matched with the true value to the predicted value in a corresponding scene. Recall and precision in the confusion matrix can be used in a complementary way. The higher these two indices are, the better the model is. Recall and precision have a trade-off relationship. Thus, the F1-score, which is the harmonic mean of the recall and the precision, is used to evaluate the model performance.
A c c u r a c y   =   T P A + T P B + T P C T P A + T P B + T P C + E A B + E A c + E B A + E B C + E C A + E C B
R e c a l l ( A )   = T P A   T P A + E A B + E A C
P r e c i s i o n ( A ) =   T P A   T P A + E B A + E C A
F 1   s c o r e   = 2 × P r e c i s i o n   × R e c a l l P r e c i s i o n + R e c a l l

3.5. Spatial Analysis of Tourists’ Photos

After selecting the final model from the experiment, we classified the 168,216 photos into 75 scenes and identified the characteristics of tourist visits to Korea by analyzing the dense areas of tourist photos. Two methods are used to analyze dense regions from the tourists’ photos. The first method is Kernel density estimation, which is one of the methods that can effectively represent the point distribution pattern in space as a method of measuring the density from the characteristics of data in the study area [53]. The Kernel function is expressed as K by measuring the density of point data included in a certain radius (bandwidth). In this study, the analysis radius was set to 1 km, and the output grid size was set to 110 m × 110 m. This is expressed in Equation (5):
f h ^ ( x ) = 1 n h d i = 1 n K [ x x i h ]
where f(x): ker ≠ 1 is the function estimate, n is the number of points, h is the bandwidth, d is the data dimensionality, x is an unknown point, and xi is the ith observation point.
The second method is the density-based spatial clustering of applications with noise (DBSCAN), which is used to analyze a specific dense region of a travel category in detail. The DBSCAN algorithm forms the clusters based on the density of data and receives the critical distance eps and the minimum number of data minPts for cluster formation. The core concept of the algorithm is that data form a cluster if the number of data points is more than minPts within the threshold distance eps [54]. To apply DBSCAN, it is necessary to determine the adjacent radius eps and the density threshold value minPts. Therefore, it is important to find appropriate parameter values because the cluster type is different depending on them when forming a cluster. The experiment was conducted with combinations within the range of 150–300 for minPts and 150–500 m for eps. After evaluating whether major tourism destinations are correctly formed or not, the cluster was derived after setting eps to 300 m and minPts to 200 as optimal values.

4. Experiments and Results

4.1. Setup

In this study, Python 3.6.5 was used for data collection, and anaconda 3.5.2 and Tensorflow 1.13.0 were used for transfer learning of the model and image classification. The experimental environment for model training and photo classification was the p3.16xlarge specification provided by Amazon Web Service (OS is Ubuntu 16.04, GPU is NVIDIA Telesa V100 128 GB 8ea, vCPU 64, RAM 488GB). Qgis 3.6, ArcPro 2.20, and Python 3.6.5 were applied as GIS programs for spatial analysis of photo data.
Labeling the photo is a crucial process in building a training dataset and evaluating model accuracy. We used 168,216 photos in this study, with 60% used in the training phase. It was quite challenging to build a training dataset containing 100,000 photos by labeling them consistently. In this study, we used a semi-supervised labeling method in which a model was built using a small number of labeled data, and then applied to a new dataset to label data automatically [55,56]. This method was suitable when building a training dataset based on a large number of unlabeled data and a small number of labeled data. Around 20% of the training data were labeled manually to train the model, and the trained model was applied to a new training dataset to label it automatically. For automatically assigned labels, true or false was checked directly with human eyes. If it turned out to be false, a true label was manually attached.

4.2. Transfer Learning of Inception-v3 Model

All photos were divided into 60% training data, 20% validation data, and 20% test data to train and evaluate the model. First, we selected representative photos for each of the 75 scenes to build a training dataset. We built the first training dataset by extracting 50 photos in each scene after manually labeling 20% of the training dataset. After training the model based on 50 photos per scene, it was applied to other training datasets to check the accuracy of the model. From this, the number of photos in the training dataset was gradually increased to improve the accuracy of the model. The training dataset per scene started from 50 photos and increased to 300 photos per scene, as shown in Figure 4. As the number of photos per scene increased, accuracy improved from 66.99% to 84.23%, as shown in Table 2. The overall accuracy was no longer improved but was similar when the number of photos increased from 200 to 300 in the training dataset. However, the deviation of the accuracy among scenes was smaller when the number of photos was 300 per scene in the training dataset. Thus, 300 photos per scene were applied to the training dataset. A representative photo of each scene is illustrated in Figure 5.
Several considerations exist when building a training dataset. First, we built the training dataset with only photos that clearly contained the characteristics of each scene and used the part of the photo that showed the features of the scene rather than the entire photo, if needed. Second, we cross-checked the photos by scene so that similar photos were not included in different scenes. Third, we equalized the number of photos per scene although the number of photos per scene varied. Fourth, the photos released from open data such as Google photo were added when it was difficult to find representative photos from collected data. Fifth, the indistinct photos were classified as “difficult to classify” scene, as shown in Figure 6.
An experiment was conducted to determine whether data augmentation was necessary to improve the model performance after setting the number of training photos to 300 per scene. The data augmentation-related experiment aimed to review which effects could be used to increase the number of photos and how many times the number of photos would increase. Zooming, rotation, brightness, horizontal flip, and width shift were used as photo effects. In this study, zooming was set to 0.85~1.15, rotation to 10, brightness to 0.5~1.5, horizontal flip to true, and width shift to 0.15. An example of photo effects is shown in Figure 7.
Regarding data augmentation, classification accuracy was confirmed while gradually increasing the number of photos, as shown in Table 3. Case 1 was created with the original training dataset, 22,384 photos, without applying data augmentation. Cases 2–5 were created by increasing the number of original training dataset by 2–5 times, respectively. The hyper-parameters used in the model were set to Adam for the optimizer, 0.0001 for the learning rate, and 128 for the batch size. As shown in Table 3, classification accuracy was improved as the number of photos was increased.
Classification accuracy by case was evaluated with the validation data, as shown in Table 4. For accuracy evaluation, 33,643 photos were labeled as validation dataset, and the Top 1 accuracy, Top 5 accuracy, recall, precision, and F1-scores were calculated. The Top 1 accuracy is the accuracy where the most probable label predicted by the model matches with the true label. The Top 5 accuracy is the accuracy where any one of the five most probable labels predicted by the model matches with the true label. As for the Top 1 accuracy, Case 1 without data augmentation was the highest at 73.51%, and for recall value, Case 5, which increased the number of original photos by five times, was the highest at 0.7631. On the other hand, the Top 5 accuracy, precision, and F1-score showed the best performance in Case 4, which increased the number of original photos by four times. Therefore, Case 4 was selected as the final model.
For accuracy evaluation of the final model, 32,682 photos were used as the test dataset by removing the 510 photos in “difficult-to-classify” scene from the 33,192 total photos. The final model showed the Top 1 accuracy of 85.77%, Top 5 accuracy of 95.69%, and F1-score of 0.8485, as shown in Table 5. The performance of the final model was reasonably good, comparing it with the performance of Inception-v3 model on ImageNet dataset, which showed 82.7% for Top 1 accuracy and 96.42% for Top 5 accuracy. The training dataset for 75 scenes and source code of final model constructed in this study are publicly available on the website: https://github.com/ewha-gis/Korea-Tourists-Urban-Image (accessed on 28 December 2020).
Figure 8 shows the accuracy values in view of precision, recall, and F1-score by scene. The classification performance by scene showed that “bike” scene was highest at 0.9707, followed by “cat” scene at 0.9699, “eaves” at 0.9697, “airplane” at 0.9667, and “food” at 0.9488, based on F1-score. On the contrary, the scene of lowest performance was “amusement park” at 0.6056, followed by “lantern and altar” at 0.6431, “war memorial” at 0.6684, “lantern fireworks festival” at 0.7164, and “view” at 0.7285. These results indicate that the scenes that were clearly recognized by the object or highly differentiated from other scenes could be well classified, whereas the scenes with various objects could be somewhat poorly classified.

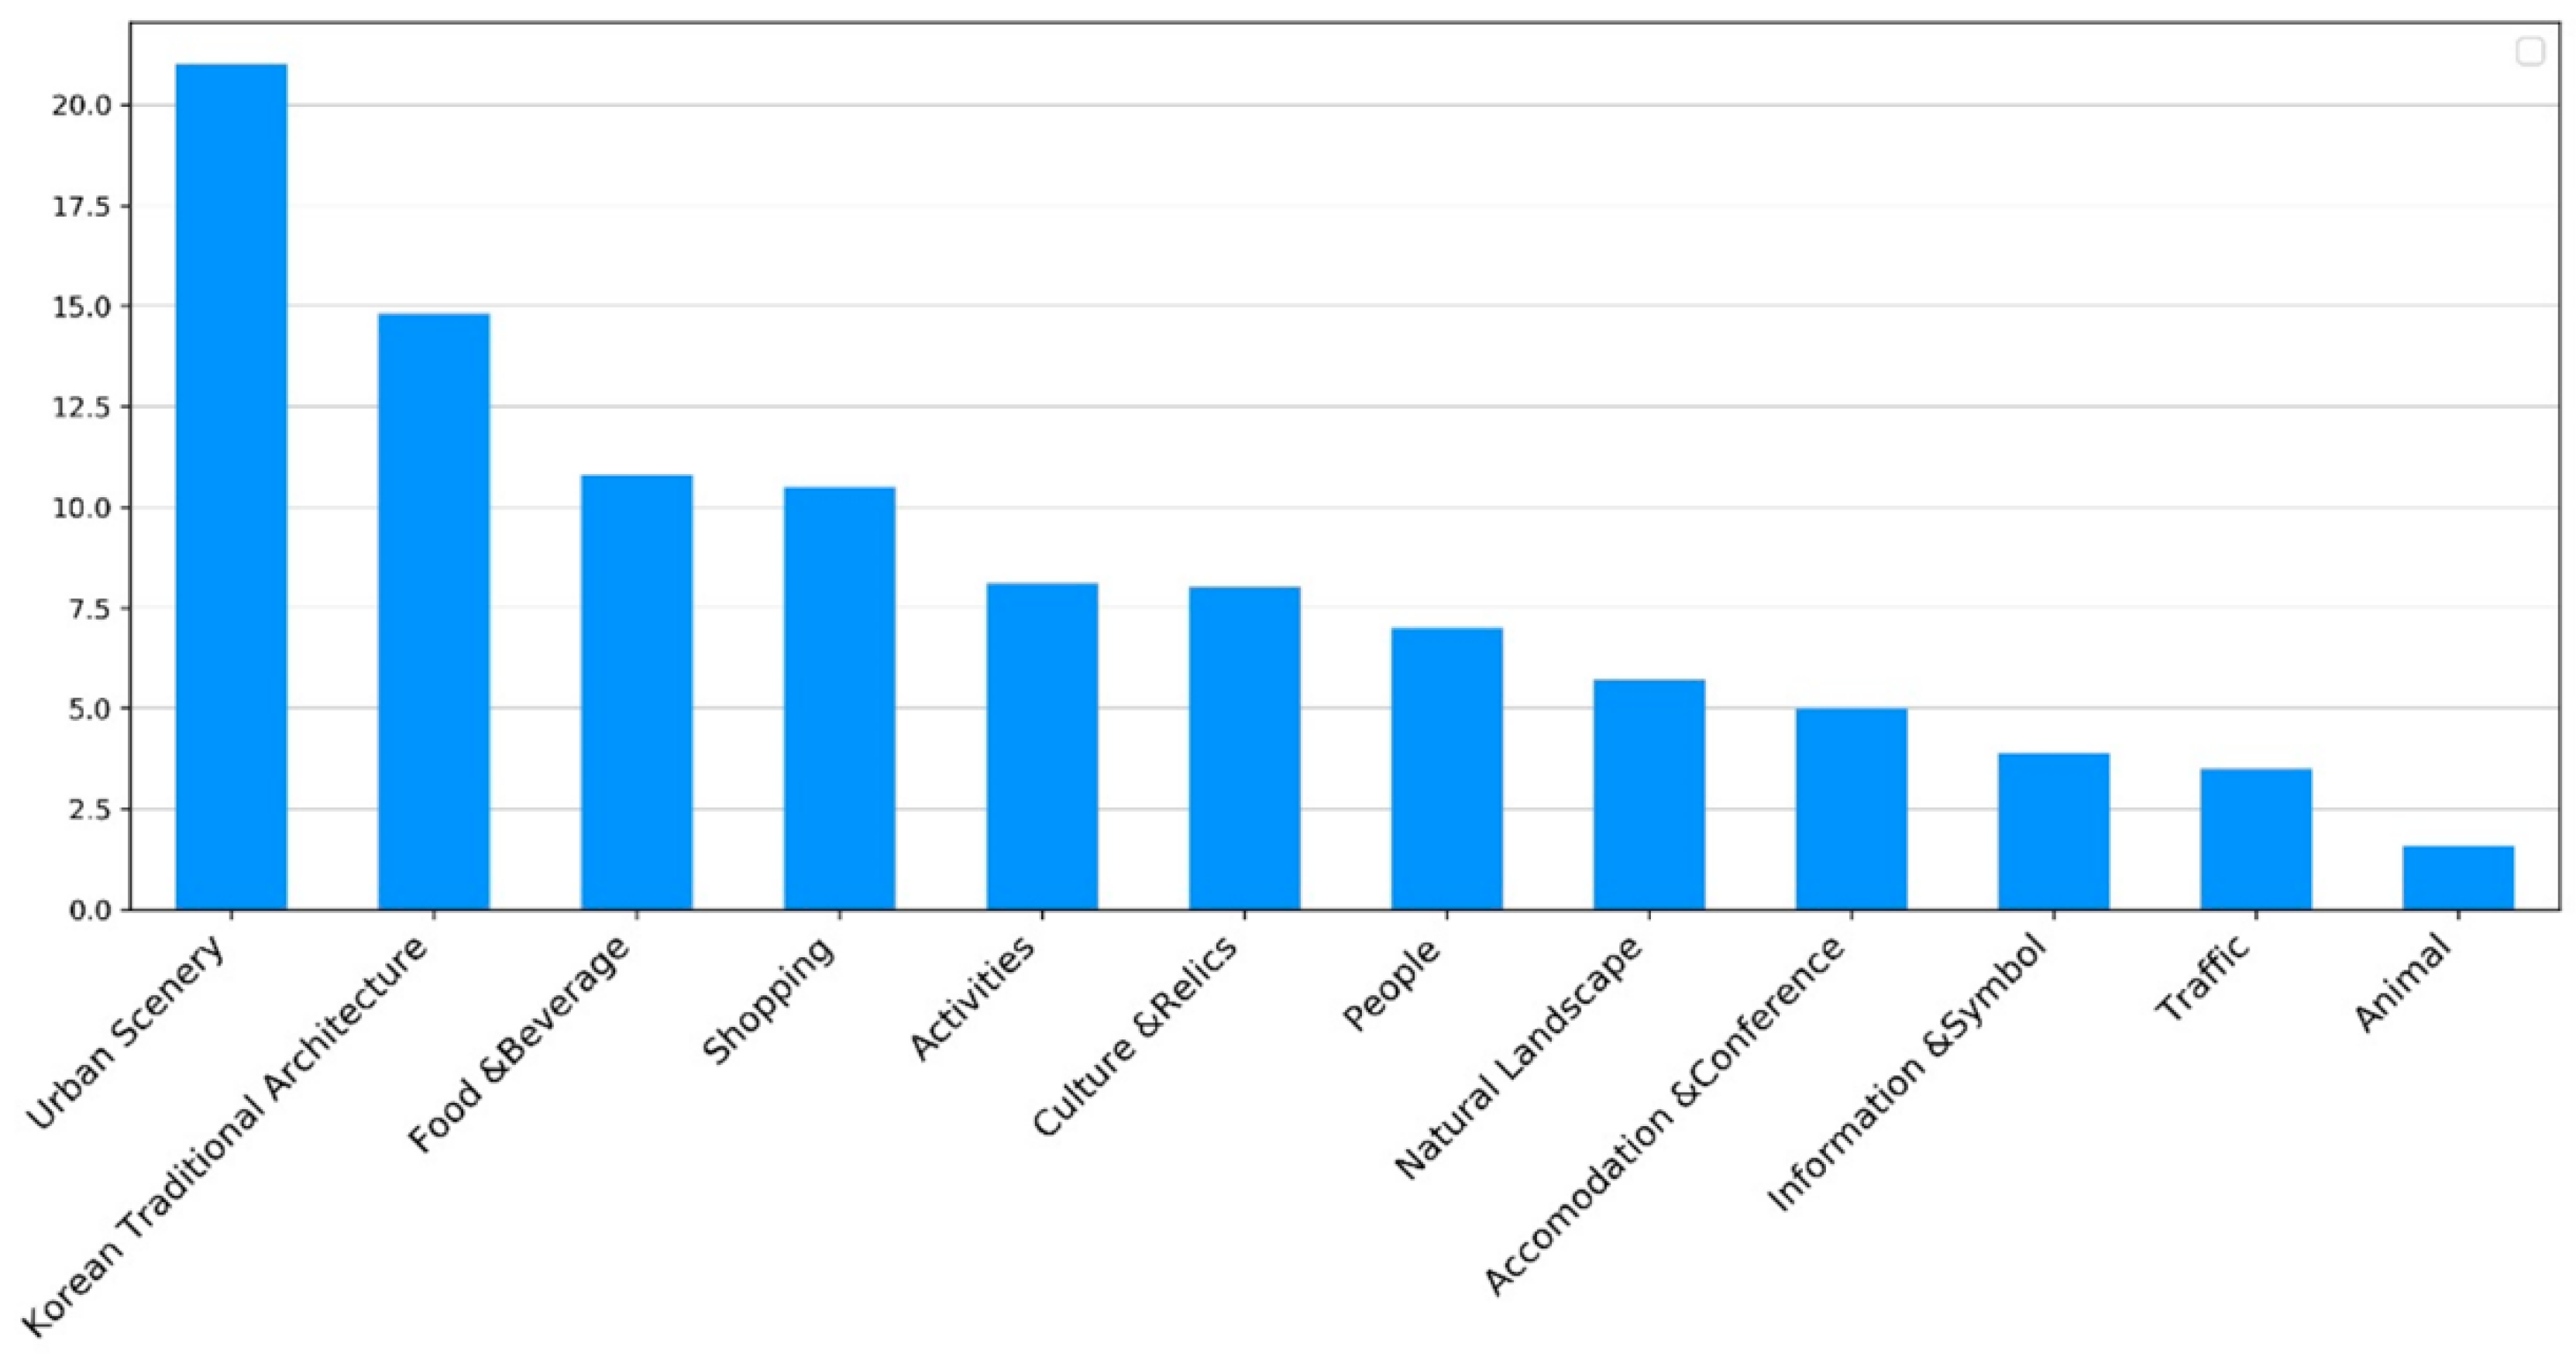
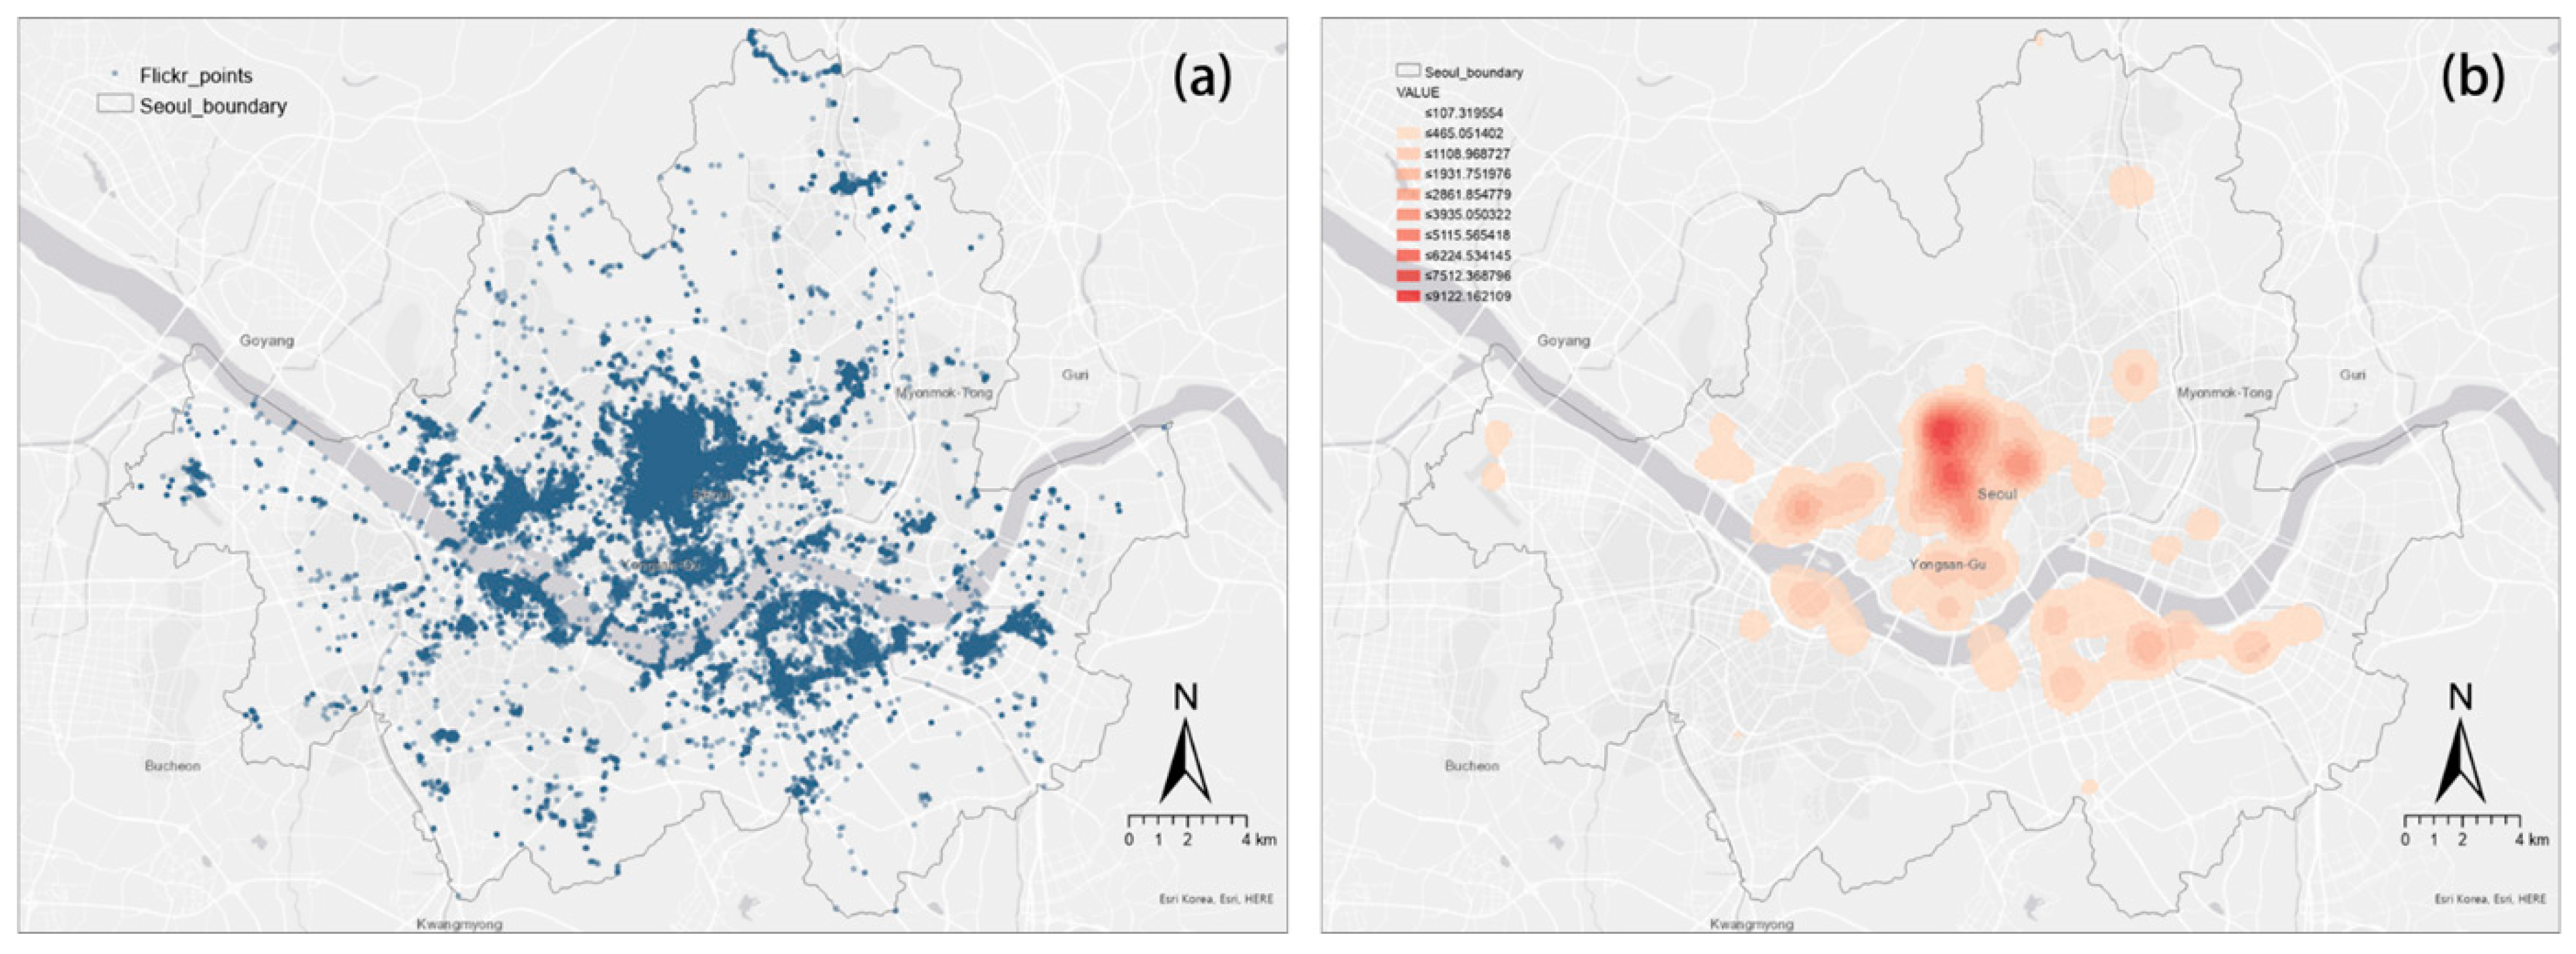
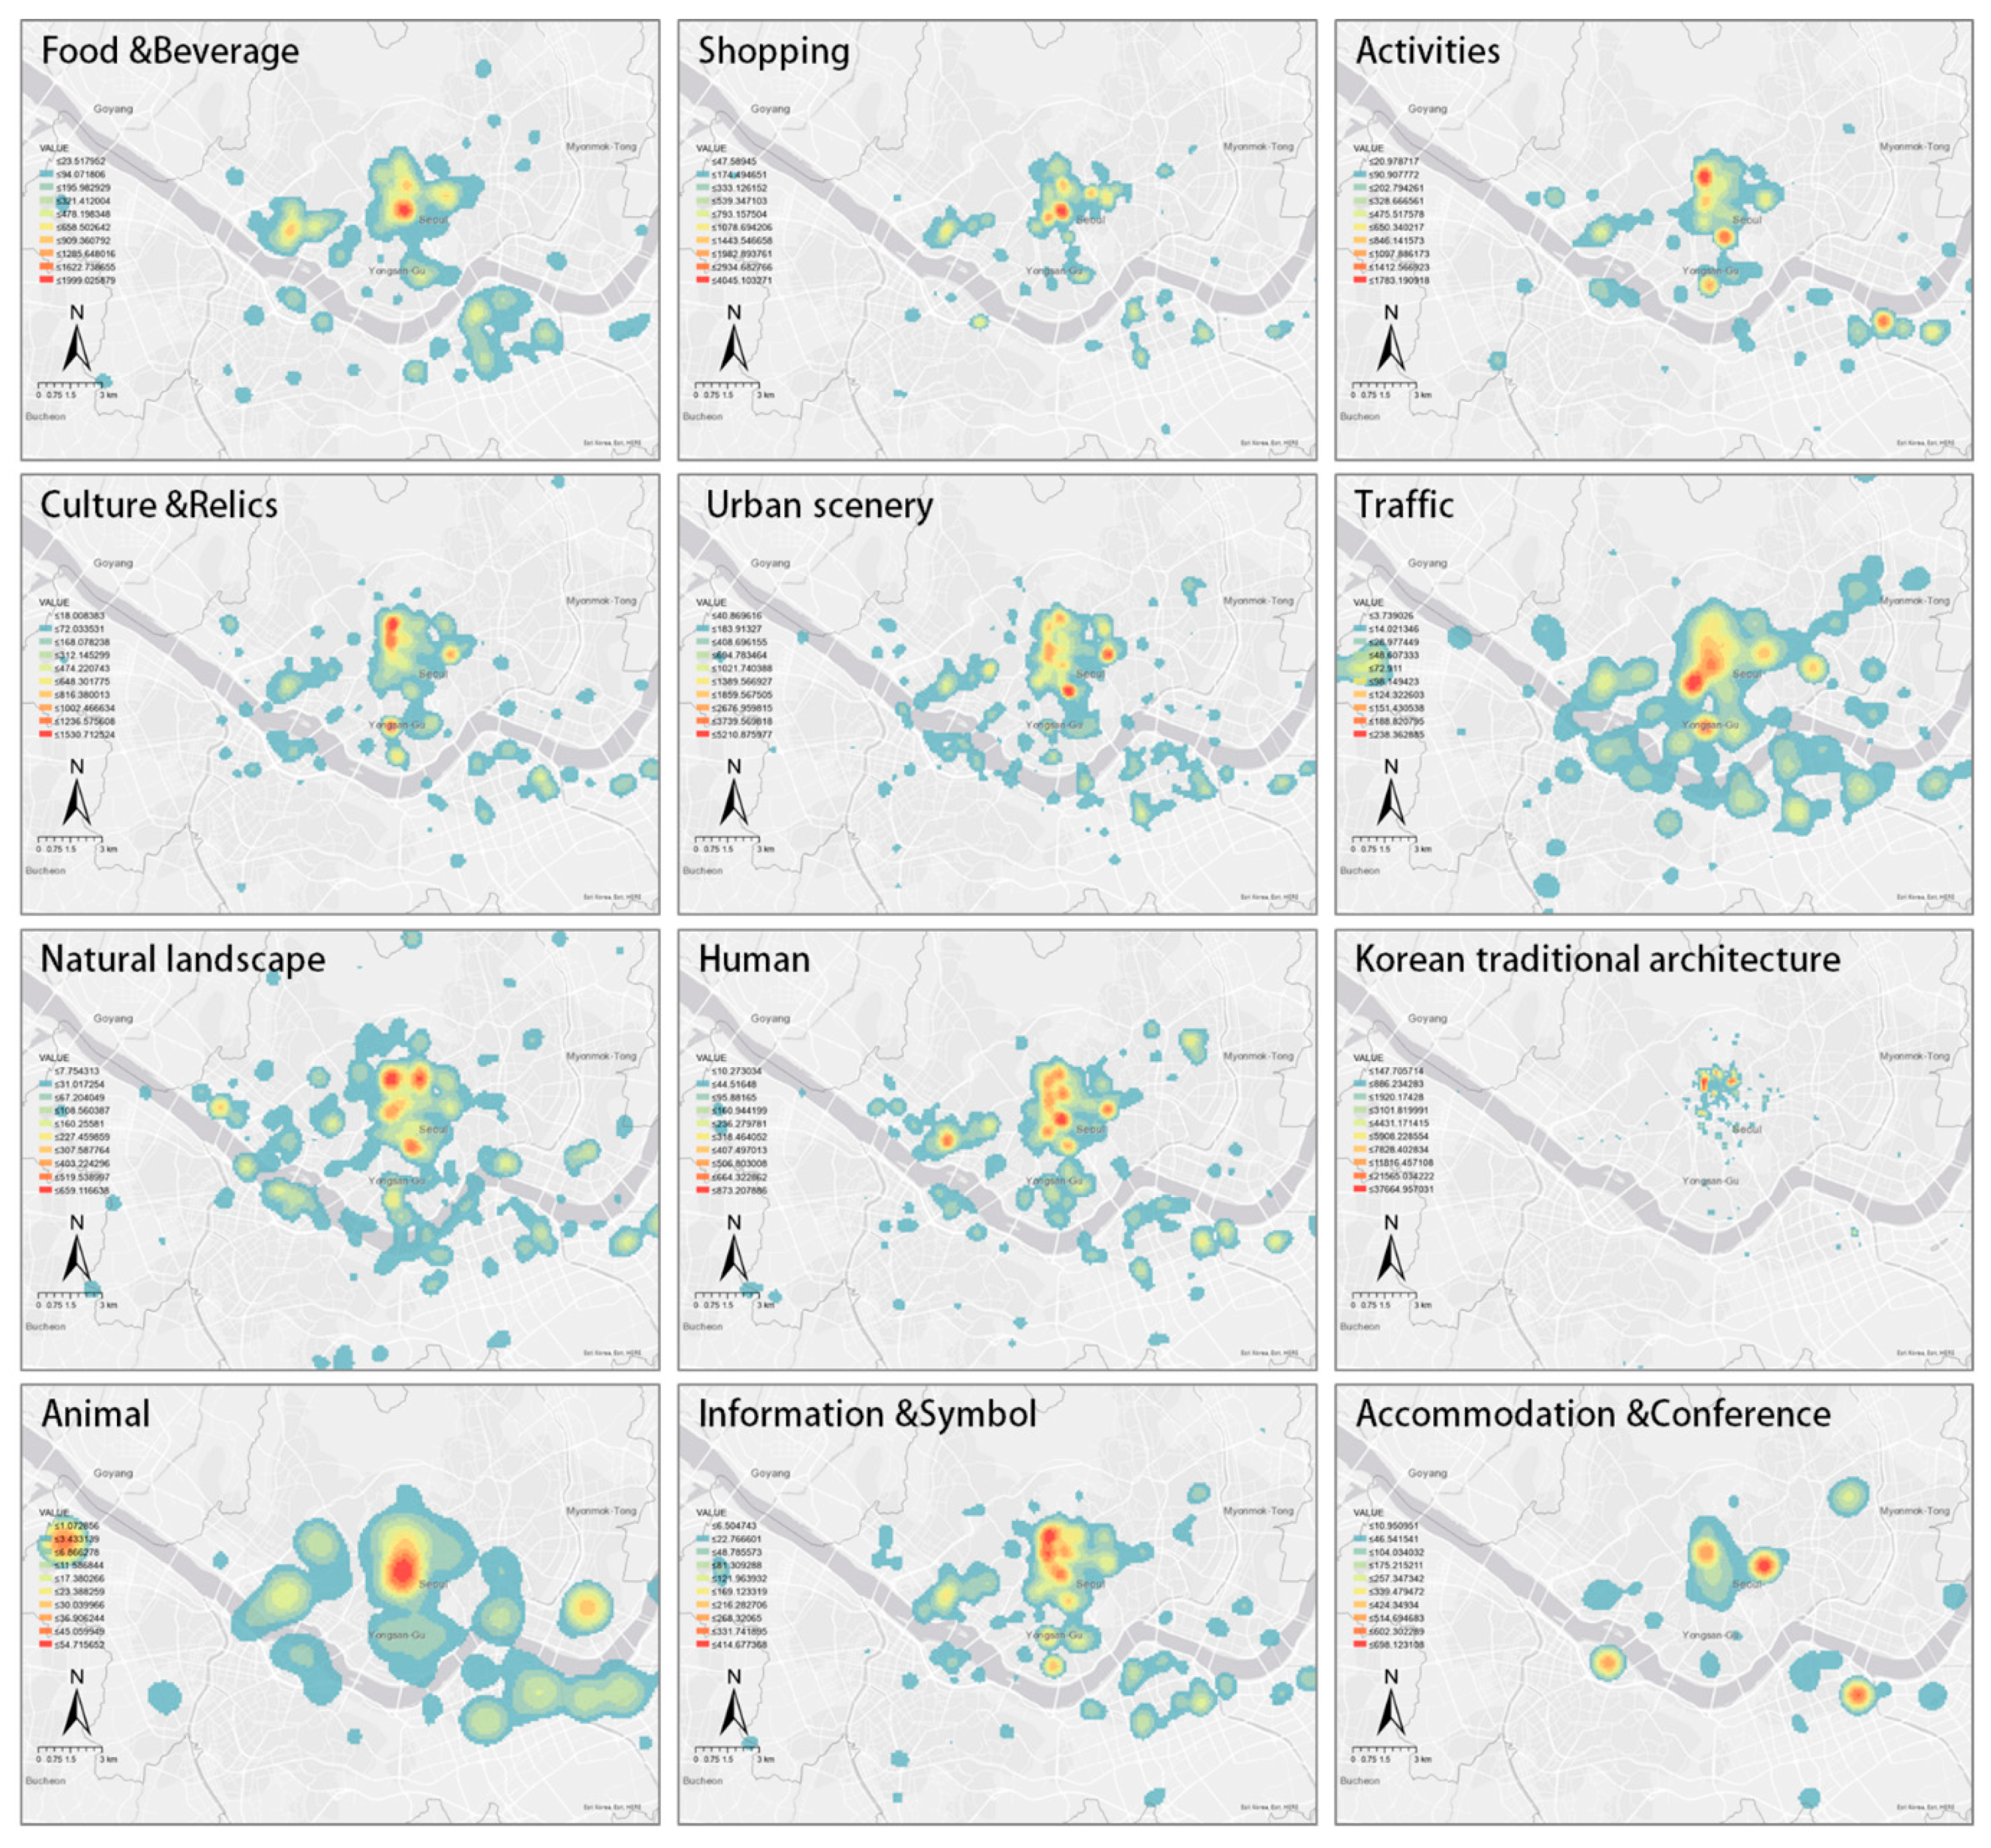
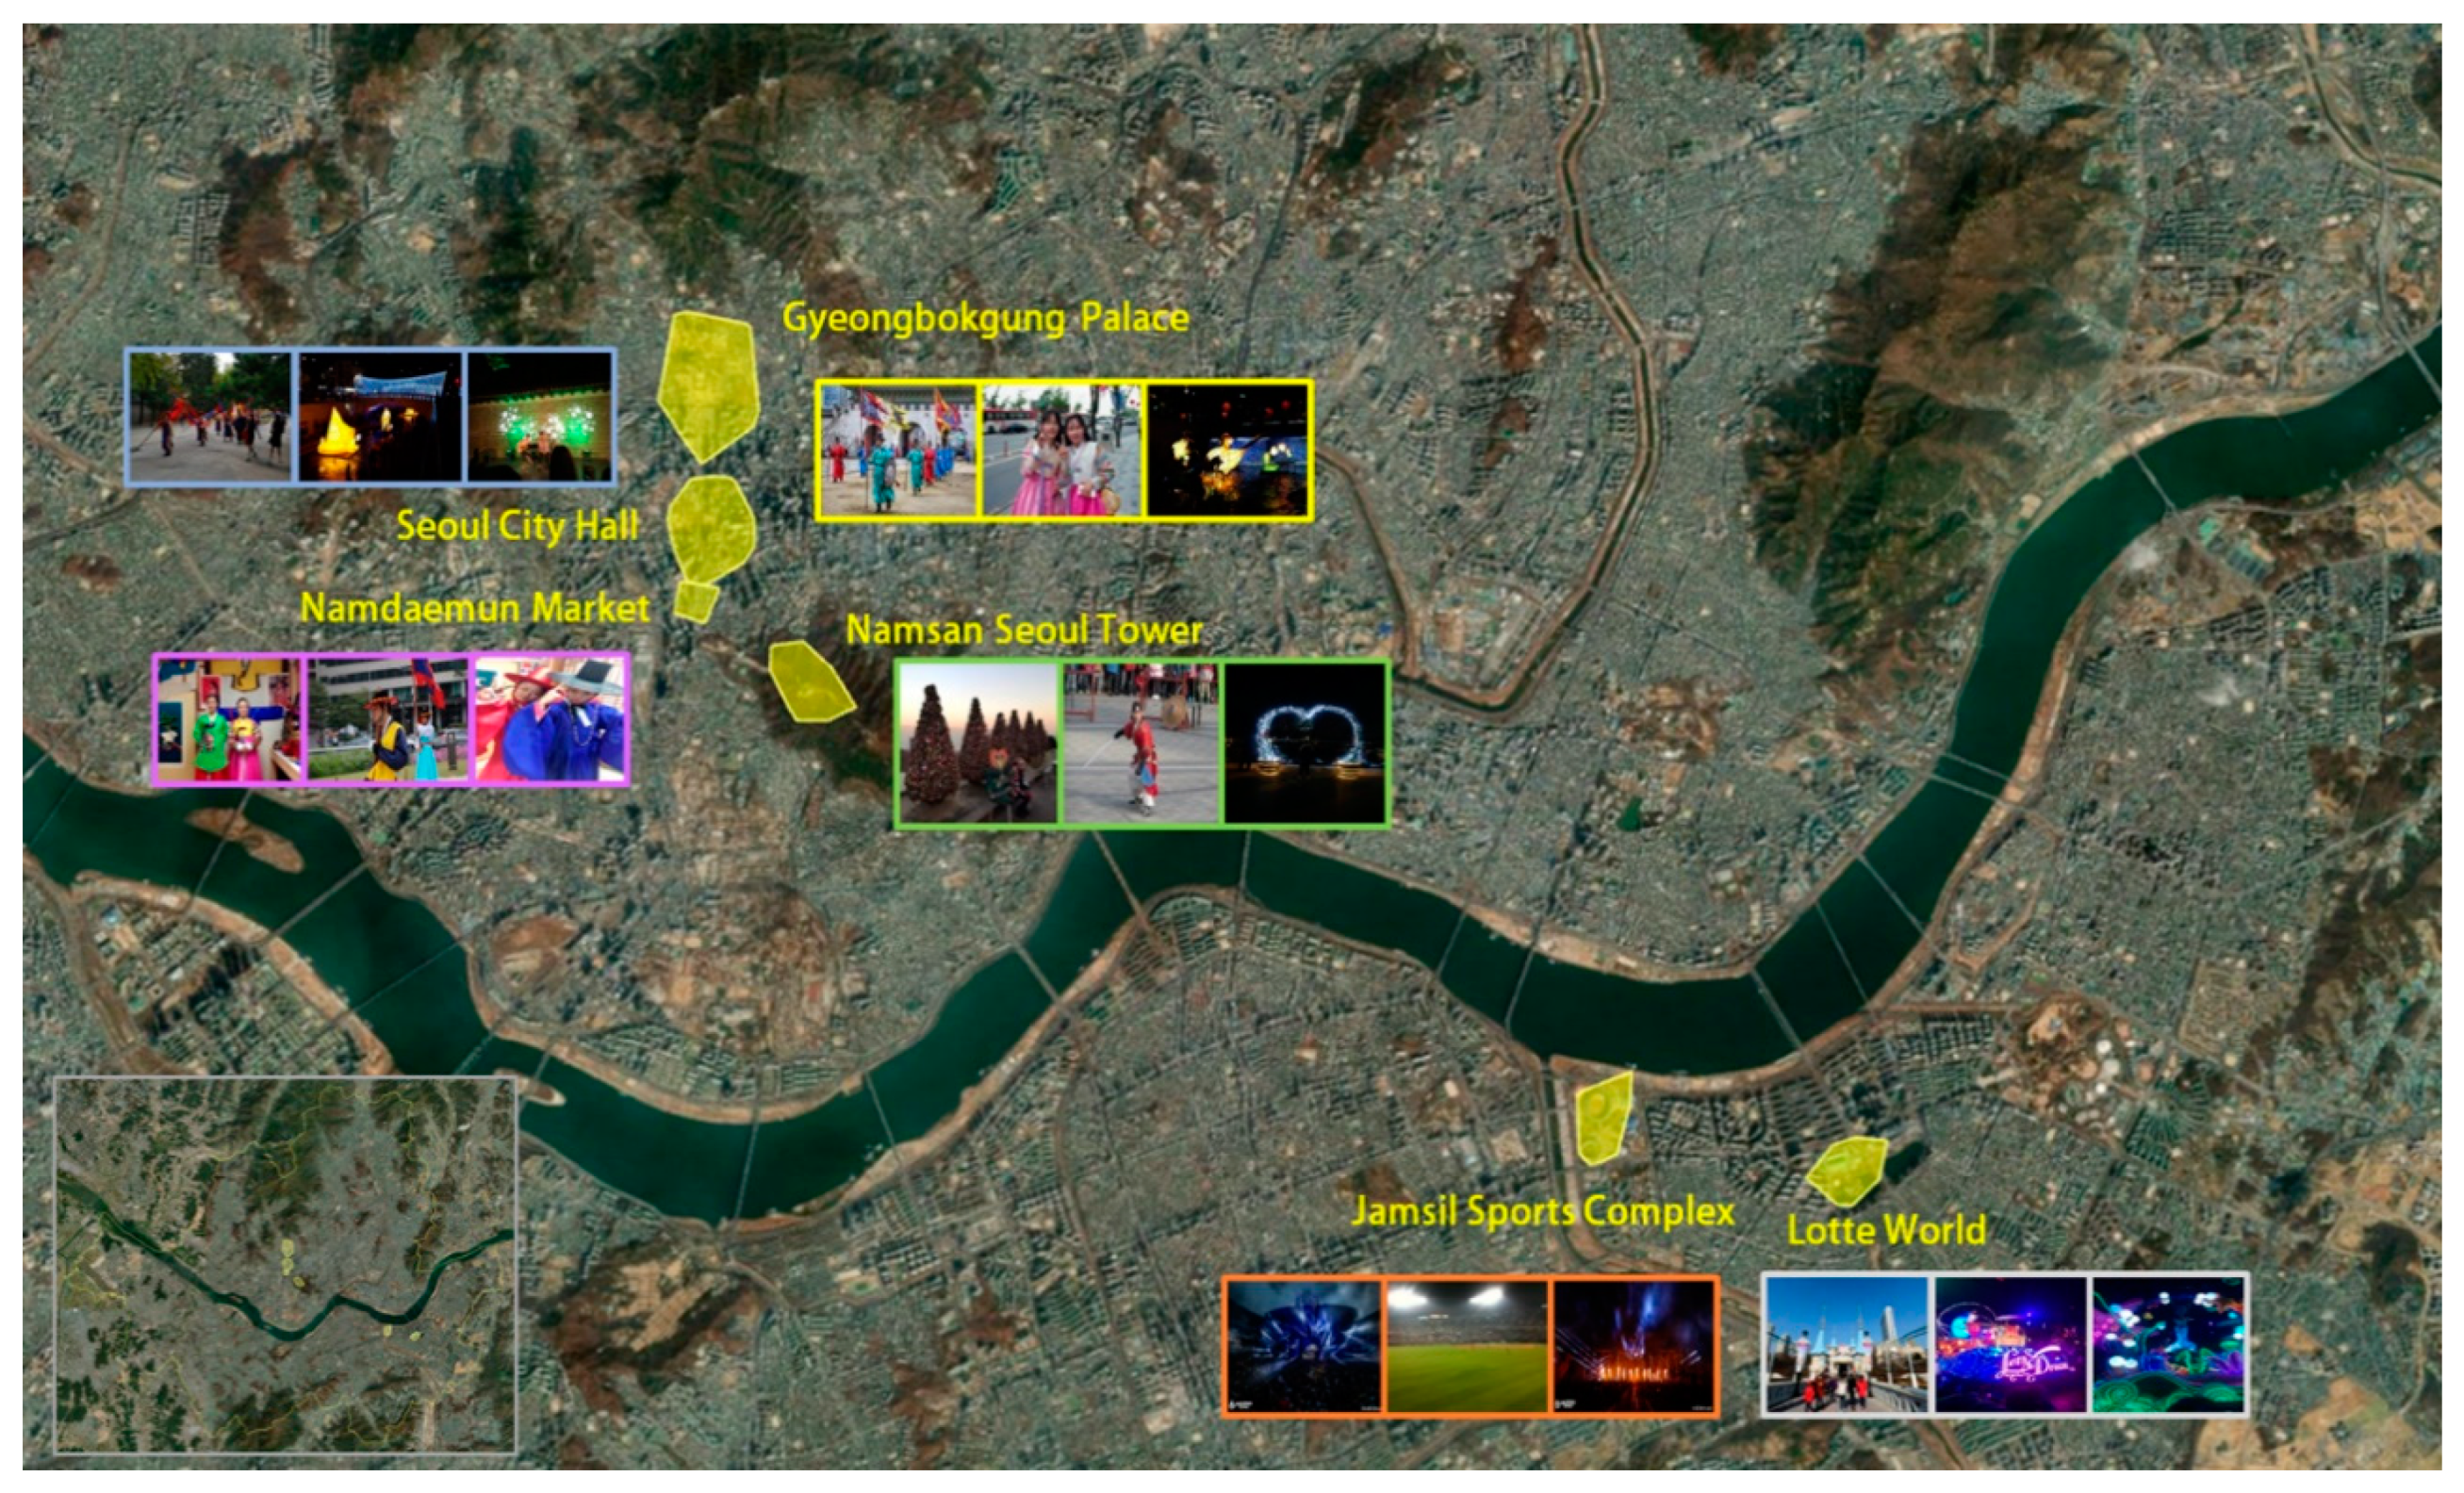
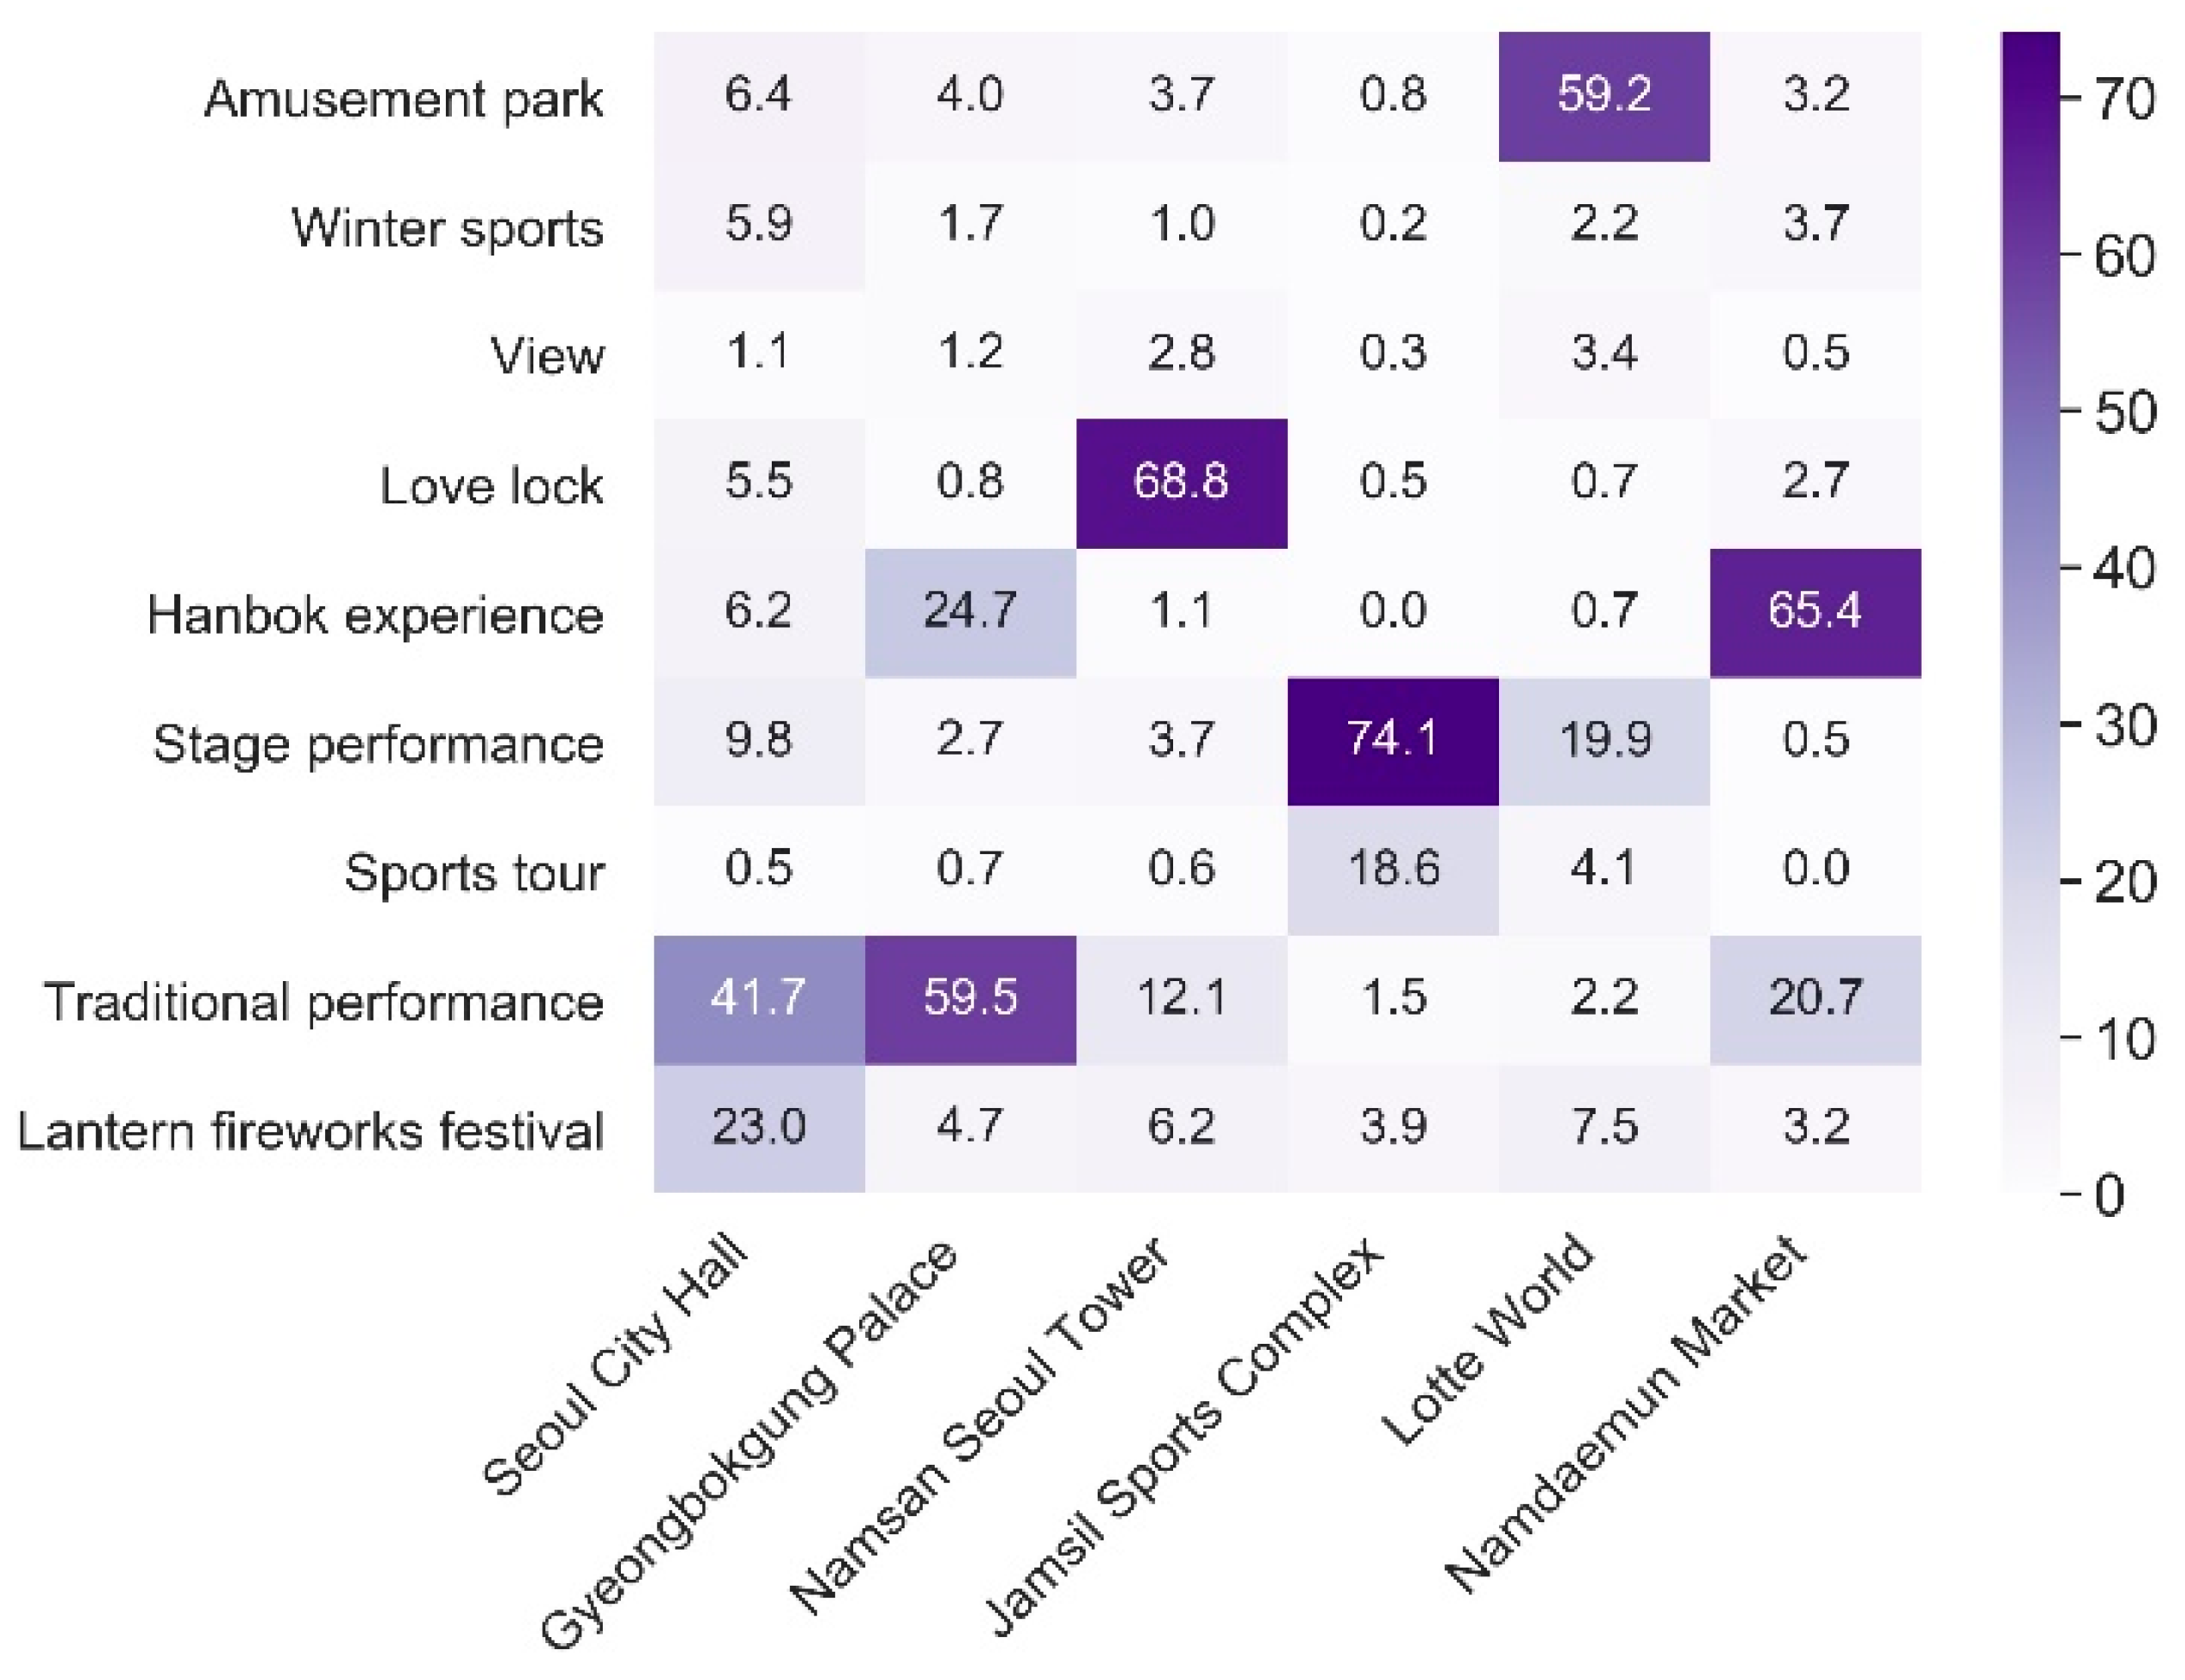
4.3. Spatial Analysis of Tourists’ Photos

By applying the final model to the entire data, the tourists’ urban images were explored in more detail by narrowing down the scope of analysis from Korea to Seoul. Seoul is the capital and largest city in South Korea, mingling unique cultural heritage such as well-preserved royal palaces and Buddhist temples with modern landscapes such as skyscrapers, shopping malls, and K-pop entertainment. Major attractions in Seoul are shown in Figure 9. With respect to the volume of data, 2264 tourists, representing 69.5% of the total 3259 tourists, visited in Seoul, and 80,553 photos, which is 47.9% of the total 168,216 photos, were posted.
The results of classifying photos by applying the final model to the collected 80,553 photos are shown in Figure 10 and Figure 11, which present the percentage of 74 scenes and 12 categories in descending order. The frequency of photos posted in Seoul by scene and category are as follows: “selfies and people”, “food”, “palace”, “conference”, and “building” by scene and “Urban scenery”, “Korean traditional architecture”, “Food and Beverage”, “Shopping”, and “Activities” by category. It can be seen that tourists prefer to take photos of selfies in exotic landscapes, enjoy local food, visit authentic traditional palaces, and see inherent cityscape which can be uniquely enjoyed in Seoul.
The regions where many photos are posted can be recognized as attractive tourist destinations. Figure 12 shows a dot map and a kernel density map using the location information of the photos. Looking at the kernel density map, it can be seen that the photos posted by tourists are concentrated in the downtown area of Seoul.
However, the clustered areas in Seoul appear differently by category. Figure 13 shows the kernel density map by grouping 74 scenes into 12 categories. The kernel density map can be classified into three types. The first type is a category in which one distinct core region appears and the spread to other regions is weak. The “shopping”, “Korean traditional architecture”, and “information and symbol” categories belong to this type. For example, Myeong-dong is a hot spot for shopping, while Gyeongbokgung Palace and Gwanghwamun Gate are the bustling places for Korean traditional architecture.
The second type is a type in which small dense areas are scattered in various places in addition to the city center. The “food and beverage”, “people”, “culture and relics”, and “traffic” categories belong to this type. For the categories of “food and beverage” and “people”, frequently visited regions at a small scale can be found in places around Shinchon-Hongdae, Itaewon, and Garosu-gil in Gangnam. For the “culture and relics” category, frequently visited places at a small scale are found in Namsan Tower, as well as Gyeongbokgung Palace, Gwanghwamun Gate, and Jongro, surrounding areas of the War Memorial Museum, and the Jamsil area. For “traffic”, frequently visited places are found at a small scale at Yongsan Station, Seoul Station, and many various places.
The third type is the type in which the denseness of the city center is relatively weak and the dense areas are somewhat dispersed. “Activities”, “accommodations and conferences”, “animals”, and “natural landscapes” belong to this type. For “activities”, frequently visited places are found in the Namsan Tower and Jamsil area, along with the Gyeongbokgung Palace and Gwanghwamun Gate area. For the “accommodation and conference” category, frequently visited places are found in the City Hall and surrounding area, Dongdaemun, Yeouido, and COEX. For the “animal” category, frequently visited places are the Children’s Grand Park area and cat cafeterias in Gangseo-gu, in addition to urban places, such as Myeong-dong. For the “natural landscape” category, the most sporadic pattern of frequently visited places is found. Many photos are shot in the Gyeongbokgung and Changdeokgung areas and in parks surrounding Namsan Tower, Seoul Forest Park, Bukhansan, Dobongsan, and Gwanaksan.
Urban images through photos posted by tourists can be analyzed in more detail by applying DBSCAN method to a category, for example the “Activity” category. Figure 14 shows six regions of attractions and representative photos. Figure 15 shows the popular activities in six regions of attractions: a traditional performance of the guardianship rotation and a winter lantern festival at Seoul City Hall, a traditional performance and hanbok experience at Gyeongbokgung Palace, a lock of love at Namsan Seoul Tower, various stage performances including K-pop at Jamsil Sports Complex, a theme park at Lotte World, and a hanbok experience at Namdaemun Market.

5. Discussion and Conclusions

In the tourism field, a few studies have emerged to analyze the tourists’ urban image using pre-trained deep learning models such as ResNet or Inception-v3. When photos are classified using the ResNet model trained on Places365 dataset with 434 category or Inception-v3 model trained on ImageNet dataset with 1000 categories, the results of photo classification maintain the category of training dataset, which does not properly reflect regional characteristics. Kim et al. pointed out that the overall accuracy was only 27.93% when checking the predicted label with “true” or “false” after classifying 38,891 photos in Seoul using Inception-v3 model trained on ImageNet dataset [24]. Figure 16 shows how the tourism scenes in our study are classified as the scenes in Places365 on the website http://places2.csail.mit.edu/index.html (accessed on 28 December 2020). The number represents the probability of being classified into that scene. Figure 16 shows that the “hanbok experience” scenes are wrongly classified as temple or water and photos taken in the “love lock” scenes as playground or shoe shop. These kinds of misclassifications are evident in the scenes that can be uniquely observed in Korea such as “street food”, “traditional market”, “traditional performance”, “mural and trick art”, “ lantern fireworks festival”, “lantern and alter”, etc. Thus, it is essential to develop a tourists’ photo classification suitable for local characteristics and classify photos accordingly.
This study has novelty in that it developed a tourist photo classification suitable for local characteristics and showed the process of re-training a deep learning model to effectively classify tourism photos. For tourists’ photo classification, we labeled 30,000 photos (20% of Flickr photos) manually and analyzed the characteristic of photos by referring to the survey of the Korea Tourism Organization and the tourism category of the tourism application. A draft of tourists’ photo classification was developed and updated by running Inception-v3 model, repetitively. Finally, through the comprehensive process of refining photo classification, the tourists’ photos were classified into 75 scenes. There are 35 scenes with strong local and local/general characteristics, representing about 47% of the total 75 scenes. For the process of re-training a deep learning model, we created a “difficulty to classify” category, applied semi-supervised labeling method, selected the representative photos, and performed data augmentation technique to improve the classification accuracy of the model. In addition, we not only adjusted the classifier part to 75, which is common in the transfer learning for a deep learning model, but also updated all weights of the feature extraction part, which requires a lot of effort and creativity. As a result, our final model shows the Top 1 accuracy of 85.77% and Top 5 accuracy of 95.69%. The performance of our final model is reasonably good compared with the performance of the Inception-v3 model on ImageNet dataset, which showed 82.7% for Top 1 accuracy and 96.42% for Top 5 accuracy. The detailed re-training process presented in this study can serve as a guideline for the analysis of tourists’ urban image through photo classification in other regions in the future. In addition, this study is meaningful in that it provides a practical method for classifying diverse and complex photos in urban or regional studies.
However, further studies are needed in the future. It is recommended to develop a deep learning model that can assign multiple labels to a photo or a hybrid deep learning model that can consider text data such as tags and titles in addition to location and photo data. In addition, it is desirable to classify photos using other CNN models such as DenseNet, ResNet, Xception, etc. and compare the model accuracy.

Author Contributions

Conceptualization, Youngok Kang and Nahye Cho; methodology, software, validation, formal analysis, Nahye Cho, Jiyoung Yoon, Soyeon Park and Jiyeon Kim; writing—original draft, Nahye Cho, Jiyoung Yoon, Soyeon Park and Jiyeon Kim; supervision, project administration, funding, writing—review, editing, Youngok Kang. All authors have read and agreed to the published version of the manuscript.

Funding

This research was supported by the Technology Advancement Research Program funded by Ministry of Land, Infrastructure and Transport of Korean government, grant number 20CTAP-C151886-02.

Data Availability Statement

Not applicable.

Conflicts of Interest

The authors declare no conflict of interest.

References

  1. Parra-López, E.; Bulchand-Gidumal, J.; Gutiérrez-Taño, D.; Díaz-Armas, R. Intentions to use social media in organizing and taking vacation trips. Comput. Hum. Behav. 2011, 27, 640–654. [Google Scholar] [CrossRef]
  2. Deng, N.; Li, X.R. Feeling a destination through the “right” photos: A machine learning model for DMOs’ photo selection. Tour. Manag. 2018, 65, 267–278. [Google Scholar] [CrossRef]
  3. Hunter, W.C. The social construction of tourism online destination image: A comparative semiotic analysis of the visual representation of Seoul. Tour. Manag. 2016, 54, 221–229. [Google Scholar] [CrossRef]
  4. Kádár, B. Measuring tourist activities in cities using geotagged photography. Tour. Geogr. 2014, 16, 88–104. [Google Scholar] [CrossRef]
  5. García-Palomares, J.C.; Gutiérrez, J.; Mínguez, C. Identification of tourist hot spots based on social networks: A comparative analysis of European metropolises using photo-sharing services and GIS. Appl. Geogr. 2015, 63, 408–417. [Google Scholar] [CrossRef]
  6. Kisilevich, S.; Keim, D.; Andrienko, N.; Andrienko, G. Towards acquisition of semantics of places and events by multi-perspective analysis of geotagged photo collections. In Geospatial Visualisation; Moore, A., Drecki, I., Eds.; Lecture Notes in Geoinformation and Cartography; Springer: Berlin/Heidelberg, Germany, 2012; pp. 211–233. [Google Scholar]
  7. Rattenbury, T.; Naaman, M. Methods for extracting place semantics from Flickr tags. ACM Trans. Web 2009, 3, 1–30. [Google Scholar] [CrossRef] [Green Version]
  8. Park, Y.; Kang, Y.; Kim, D.; Lee, J.; Kim, N. Analysis of Seoul Image of Foreign Tourists Visiting Seoul by Text Mining with Flickr Data. J. Korean Soc. for GIS 2019, 27, 11–23. [Google Scholar]
  9. Kurashima, T.; Iwata, T.; Irie, G.; Fujimura, K. Travel route recommendation using geotagged photos. Knowl. Inf. Syst. 2013, 37, 37–60. [Google Scholar] [CrossRef]
  10. Parikh, V.; Keskar, M.; Dharia, D.; Gotmare, P. A Tourist Place Recommendation and Recognition System. In Proceedings of the 2018 Second International Conference on Inventive Communication and Computational Technologies (ICICCT), Coimbatore, India, 20–21 April 2018; pp. 218–222. [Google Scholar]
  11. Zhang, J.D.; Chow, C.Y. GeoSoCa: Exploiting geographical, social and categorical correlations for point-of-interest recommendations. In Proceedings of the 38th International ACM SIGIR Conference on Research and Development in Information Retrieval, Santiago, Chile, 9–13 August 2015; pp. 443–452. [Google Scholar]
  12. Pan, S.; Lee, J.; Tsai, H. Travel photos: Motivations, image dimensions, and affective qualities of places. Tour. Manag. 2014, 40, 59–69. [Google Scholar] [CrossRef]
  13. Donaire, J.A.; Camprubí, R.; Galí, N. Tourist clusters from Flickr travel photography. Tour. Manag. Perspect. 2014, 11, 26–33. [Google Scholar] [CrossRef] [Green Version]
  14. Zhang, K.; Chen, Y.; Li, C. Discovering the tourists’ behaviors and perceptions in a tourism destination by analyzing photos’ visual content with a computer deep learning model: The case of Beijing. Tour. Manag. 2019, 75, 595–608. [Google Scholar] [CrossRef]
  15. Krizhevsky, A.; Sutskever, I.; Hinton, G.E. ImageNet Classification with Deep Convolutional Neural Networks. In Proceedings of the 26th Annual Conference on Neural Information Processing Systems (NIPS), Stateline, NV, USA, 3–8 December 2012; pp. 1106–1114. [Google Scholar]
  16. Szegedy, C.; Liu, W.; Jia, Y.; Sermanet, P.; Reed, S.; Anguelov, D.; Erhan, D.; Vanhoucke, V.; Rabinovich, A. Going deeper with convolutions. In Proceedings of the 2015 IEEE Conference on Computer Vision and Pattern Recognition, Boston, MA, USA, 7–12 June 2015; pp. 1–9. [Google Scholar]
  17. He, K.; Zhang, X.; Ren, S.; Sun, J. Deep residual learning for image recognition. In Proceedings of the 2016 IEEE Conference on Computer Vision and Pattern Recognition, Las Vegas, NV, USA, 27–30 June 2016; pp. 770–778. [Google Scholar]
  18. Simonyan, K.; Zisserman, A. Very deep convolutional networks for large-scale image recognition. arXiv 2014, arXiv:1409.1556. [Google Scholar]
  19. Huang, G.; Liu, Z.; Van Der Maaten, L.; Weinberger, K.Q. Densely connected convolutional networks. In Proceedings of the 2017 IEEE Conference on Computer Vision and Pattern Recognition, Honolulu, HI, USA, 21–26 July 2017; pp. 4700–4708. [Google Scholar]
  20. Howard, A.G.; Zhu, M.; Chen, B.; Kalenichenko, D.; Wang, W.; Weyand, T.; Andreetto, M.; Adam, H. Mobilenets: Efficient convolutional neural networks for mobile vision applications. arXiv 2017, arXiv:1704.04861. [Google Scholar]
  21. Hussain, M.; Bird, J.J.; Faria, D.R. A study on cnn transfer learning for image classification. In Proceedings of the 18th UK Workshop on Computational Intelligence, Nottingham, UK, 5–7 September 2018; pp. 191–202. [Google Scholar]
  22. Zhang, K.; Chen, D.; Li, C. How are tourists different?—Reading geo-tagged photos through a deep learning model. J. Qual. Assur. Hosp. Tour. 2020, 21, 234–243. [Google Scholar] [CrossRef]
  23. Payntar, N.D.; Hsiao, W.L.; Covey, R.A.; Grauman, K. Learning patterns of tourist movement and photography from geotagged photos at archaeological heritage sites in Cuzco, Peru. Tour. Manag. 2020, 82, 104165. [Google Scholar] [CrossRef]
  24. Kim, D.; Kang, Y.; Park, Y.; Kim, N.; Lee, J. Understanding tourists’ urban images with geotagged photos using convolutional neural networks. Spat. Inf. Res. 2020, 28, 241–255. [Google Scholar] [CrossRef] [Green Version]
  25. Ren, S.; He, K.; Girshick, R.; Sun, J. Faster r-cnn: Towards real-time object detection with region proposal networks. IEEE Trans. Pattern Anal. Mach. Intell. 2016, 39, 1137–1149. [Google Scholar] [CrossRef] [Green Version]
  26. Redmon, J.; Farhadi, A. Yolov3: An incremental improvement. arXiv 2018, arXiv:1804.02767. [Google Scholar]
  27. Herdade, S.; Kappeler, A.; Boakye, K.; Soares, J. Image captioning: Transforming objects into words. In Proceedings of the 33rd Annual Conference on Neural Information Processing Systems, Vancouver, BC, Canada, 8–14 December 2019; pp. 11137–11147. [Google Scholar]
  28. Wu, B.; Chen, W.; Fan, Y.; Zhang, Y.; Hou, J.; Liu, J.; Zhang, T. Tencent ml-images: A large-scale multi-label image database for visual representation learning. IEEE Access 2019, 7, 172683–172693. [Google Scholar] [CrossRef]
  29. Xiao, J.; Hays, J.; Ehinger, K.A.; Oliva, A.; Torralba, A. Sun database: Large-scale scene recognition from abbey to zoo. In Proceedings of the 2010 IEEE Computer Society Conference on Computer Vision and Pattern Recognition, San Francisco, CA, USA, 13–18 June 2010; pp. 3485–3492. [Google Scholar]
  30. Zhou, B.; Lapedriza, A.; Khosla, A.; Oliva, A.; Torralba, A. Places: A 10 million image database for scene recognition. IEEE Trans. Pattern Anal. Mach. Intell. 2017, 40, 1452–1464. [Google Scholar] [CrossRef] [Green Version]
  31. Gu, Y.; Wang, Y.; Li, Y. A survey on deep learning-driven remote sensing image scene understanding: Scene classification, scene retrieval and scene-guided object detection. Appl. Sci. 2019, 9, 2110. [Google Scholar] [CrossRef] [Green Version]
  32. Dubey, A.; Naik, N.; Parikh, D.; Raskar, R.; Hidalgo, C.A. Deep learning the city: Quantifying urban perception at a global scale. In Proceedings of the 14th European Conference on Computer Vision (ECCV), Amsterdam, The Netherlands, 11–14 October 2016; pp. 196–212. [Google Scholar]
  33. Koylu, C.; Zhao, C.; Shao, W. Deep neural networks and kernel density estimation for detecting human activity patterns from Geo-tagged images: A case study of birdwatching on Flickr. ISPRS Int. J. Geo-Inf. 2019, 8, 45. [Google Scholar] [CrossRef] [Green Version]
  34. Yin, L.; Cheng, Q.; Wang, Z.; Shao, Z. ‘Big data’for pedestrian volume: Exploring the use of Google Street View images for pedestrian counts. Appl. Geogr. 2015, 63, 337–345. [Google Scholar] [CrossRef]
  35. Saikia, S.; Fidalgo, E.; Alegre, E.; Fernández-Robles, L. Object detection for crime scene evidence analysis using deep learning. In Proceedings of the 19th International Conference on Image Analysis and Processing, Catania, Italy, 11–15 September 2017; pp. 14–24. [Google Scholar]
  36. Zhang, F.; Zhang, D.; Liu, Y.; Lin, H. Representing place locales using scene elements. Comput. Environ. Urban Syst. 2018, 71, 153–164. [Google Scholar] [CrossRef]
  37. Xing, H.; Meng, Y.; Wang, Z.; Fan, K.; Hou, D. Exploring geo-tagged photos for land cover validation with deep learning. ISPRS J. Photogramm. Remote Sens. 2018, 141, 237–251. [Google Scholar] [CrossRef]
  38. Richards, D.R.; Tunçer, B. Using image recognition to automate assessment of cultural ecosystem services from social media photographs. Ecosyst. Serv. 2018, 31, 318–325. [Google Scholar] [CrossRef]
  39. Chen, M.; Arribas-Bel, D.; Singleton, A. Quantifying the Characteristics of the Local Urban Environment through Geotagged Flickr Photographs and Image Recognition. ISPRS Int. J. Geo-Inf. 2020, 9, 264. [Google Scholar] [CrossRef] [Green Version]
  40. Seresinhe, C.I.; Preis, T.; Moat, H.S. Using deep learning to quantify the beauty of outdoor places. Royal Soc. Open Sci. 2017, 4, 170170. [Google Scholar] [CrossRef] [PubMed] [Green Version]
  41. Porzi, L.; Rota Bulò, S.; Lepri, B.; Ricci, E. Predicting and understanding urban perception with convolutional neural networks. In Proceedings of the 23rd ACM International Conference on Multimedia, Brisbane, Australia, 26–30 October 2015; pp. 139–148. [Google Scholar]
  42. Liu, L.; Wang, H.; Wu, C. A machine learning method for the large-scale evaluation of urban visual environment. arXiv 2016, arXiv:1608.03396. [Google Scholar]
  43. Ilic, L.; Sawada, M.; Zarzelli, A. Deep mapping gentrification in a large Canadian city using deep learning and Google Street View. PLoS ONE 2019, 14, e0212814. [Google Scholar] [CrossRef]
  44. Xu, Y.; Yang, Q.; Cui, C.; Shi, C.; Song, G.; Han, X.; Yin, Y. Visual Urban Perception with Deep Semantic-Aware Network. In Proceedings of the 25th International Conference on MultiMedia Modeling, Thessaloniki, Greece, 8–11 January 2019; pp. 28–40. [Google Scholar]
  45. Zhang, F.; Zhou, B.; Liu, L.; Liu, Y.; Fung, H.H.; Lin, H.; Ratti, C. Measuring human perceptions of a large-scale urban region using machine learning. Landsc. Urban. Plan. 2018, 180, 148–160. [Google Scholar] [CrossRef]
  46. Boominathan, L.; Kruthiventi, S.S.; Babu, R.V. Crowdnet: A deep convolutional network for dense crowd counting. In Proceedings of the 24th ACM International Conference on Multimedia, Amsterdam, The Netherlands, 15–19 October 2016; pp. 640–644. [Google Scholar]
  47. Law, S.; Shen, Y.; Seresinhe, C. An application of convolutional neural network in street image classification: The case study of London. In Proceedings of the 1st Workshop on Artificial Intelligence and Deep Learning for Geographic Knowledge Discovery, Redondo Beach, CA, USA, 7–10 November 2017; pp. 5–9. [Google Scholar]
  48. Jean, N.; Burke, M.; Xie, M.; Davis, W.M.; Lobell, D.B.; Ermon, S. Combining satellite imagery and machine learning to predict poverty. Science 2016, 353, 790–794. [Google Scholar] [CrossRef] [PubMed] [Green Version]
  49. Kang, Y.; Cho, N.; Lee, J.; Yoon, J.; Lee, H. Comparison of Tourists Classification Methods of Geotagged Photos: Empirical Models and Machine Learning Approaches. J. Korean Soc. for GIS 2019, 27, 29–37. [Google Scholar] [CrossRef]
  50. Shijie, J.; Ping, W.; Peiyi, J.; Siping, H. Research on data augmentation for image classification based on convolution neural networks. In Proceedings of the 2017 Chinese Automation Congress (CAC), Jinan, China, 20–22 October 2017; pp. 4165–4170. [Google Scholar]
  51. Perez, L.; Wang, J. The effectiveness of data augmentation in image classification using deep learning. arXiv 2017, arXiv:1712.04621. [Google Scholar]
  52. Tharwat, A. Classification assessment methods. Appl. Comput. Inform. 2018, 1–13. [Google Scholar] [CrossRef]
  53. Fotheringham, A.S.; Brunsdon, C.; Charlton, M. Quantitative Geography: Perspectives on Spatial Data Analysis; Sage: London, UK, 2000. [Google Scholar]
  54. Ester, M.; Kriegel, H.P.; Sander, J.; Xu, X. A density-based algorithm for discovering clusters in large spatial databases with noise. In Proceedings of the Second International Conference on Knowledge Discovery and Data Mining, Portland, OR, USA, 2–4 August 1996; pp. 226–231. [Google Scholar]
  55. Triguero, I.; García, S.; Herrera, F. Self-labeled techniques for semi-supervised learning: Taxonomy, software and empirical study. Knowl. Inf. Syst. 2015, 42, 245–284. [Google Scholar] [CrossRef]
  56. Gu, Y.; Leroy, G. Mechanisms for Automatic Training Data Labeling for Machine Learning. In Proceedings of the 40th International Conference on Information Systems, ICIS 2019, Munich, Germany, 15–18 December 2019. [Google Scholar]
Figure 1. Research process.
Ijgi 10 00137 g001
Figure 2. Architecture of fine-tuned Inception-v3 model.
Ijgi 10 00137 g002
Figure 3. Confusion matrix for multiclass classification.
Ijgi 10 00137 g003
Figure 4. Process of building training dataset and re-training Inception-v3 model.
Ijgi 10 00137 g004
Figure 5. Example of representative photo for each scene.
Ijgi 10 00137 g005
Figure 6. Example of photos in “difficult to classify” scene: (a) barcode photo; (b) no meaning photo; (c) zoom-in photo of an electronic device; and (d) receipts photo.
Ijgi 10 00137 g006
Figure 7. An example of photo effect: (a) original; (b) zooming; (c) rotation; (d) brightness; and (e) horizontal flip.
Ijgi 10 00137 g007
Figure 8. Precision, recall, and F1-score by scene.
Ijgi 10 00137 g008
Figure 9. Major tour attractions in Seoul.
Ijgi 10 00137 g009
Figure 10. Percentage of photos by 74 scenes in descending order.
Ijgi 10 00137 g010
Figure 11. Percentage of photos by 12 categories in descending order.
Ijgi 10 00137 g011
Figure 12. Kernel density map of tourist photos: (a) dot map; and (b) kernel density map.
Ijgi 10 00137 g012
Figure 13. Kernel density map by category.
Ijgi 10 00137 g013
Figure 14. Six regions of attractions for “Activities” category.
Ijgi 10 00137 g014
Figure 15. Popular activities in six regions of attractions for “Activities” category.
Ijgi 10 00137 g015
Figure 16. Classification results based on Places365 for scenes reflecting Korean characteristics.
Ijgi 10 00137 g016
Table 1. Classification of tourists’ photos.
CategoryScene
Food and Beveragefood *, street food **, dessert, beverage, alcohol *, restaurant *
Shoppingtraditional market **, shopping street *, store, toyshop, packaging products *
Activitiesamusement park **, winter sports *, view *, love lock **, hanbok experience **, stage performance *, sports tour *, traditional performance **, lantern fireworks festival **
Culture and Relicswar memorial **, relic **, old map and modern art **, indoor sculpture, outdoor sculpture, bronze statue
Urban scenerybuilding, interior of building, housing landscape **, skyline *, mural and trick art *, western-style building, road and sidewalk, bridge, square and urban stream, tower, night view **, urban facilities
Trafficcar, bus, train and subway, platform, airplane, bike, ship, vehicle interior
Natural landscapesky, mountain, valley, river, sea, flower, park and trail, seasonal landscape *
Peopleselfies and people, crowd
Korean traditional architecturepalace **, palace interior and throne **, gazebo and jeongja **, tile house **, thatched house **, house interior **, eaves **, pagoda **, lantern and altar **
Animaldog, cat, animal, fish, bird and insect
Information and Symbolsignboard, monument
Accommodation and Conferencerooms, conference
Othersdifficult to classify
* Scene in which local and general characteristics are mixed. ** Scene with strong local characteristics.
Table 2. Classification accuracy according to the number of photos per scene.
Training Dataset1st2nd3rd-13rd-24th
No. of scenes9176797575
No. of photos per scene50100200200300
accuracy66.99%70.39%79.53%84.23%84.23%
Table 3. Comparison of classification accuracy by case with training data.
CaseData AugmentationNumber of PhotosLearning RateStepBatch SizeAccuracy
1Not applied22,3840.000110,0001280.855
22 times44,4330.000115,0001280.888
33 times65,8240.000120,0001280.907
44 times86,6930.000125,0001280.919
55 times106,5410.000130,0001280.921
Table 4. Comparison of classification accuracy by case with validation data.
Case 1Case 2Case 3Case 4Case 5
Top 1 accuracy73.51%72.45%72.78%72.99%72.73%
Top 5 accuracy91.82%92.00% 91.96%92.07%92.00%
Recall0.74890.76130.76100.76070.7631
Precision0.68580.69570.70000.70360.7015
F1-score0.71590.72700.72920.7310250.731021
Table 5. Performance evaluation of the final model.
TrainingValidationTest
Top 1 accuracy91.9%79.58%85.77%
Top 5 accuracy-92.66%95.69%
F1-score-0.79460.8485
Publisher’s Note: MDPI stays neutral with regard to jurisdictional claims in published maps and institutional affiliations.

