1. Introduction
The application of the Findable, Accessible, Interoperable, and Reusable (FAIR) principles for data [
1] results in the existence of data catalogues that give access to numerous data resources. Users usually interact with this data with the objective of analyzing it and extracting new conclusions. In the process, they accumulate information and gain knowledge about the data they use, as well as about the tools they work with. In the scientific domain, at the end of the process, if the results are original and innovative, this knowledge is communicated by writing a scientific paper. On the other hand, governmental agencies publish their results as reports. These ways of disseminating results have three main problems: Firstly, experiences, results and conclusions become disconnected from the data repositories where the original data is available; secondly, many important details about the data itself are lost in the effort of summarizing the conclusions; and thirdly, this information is published only at the end of the process, preventing collective creation of knowledge.
This paper addresses these three issues by studying the current approaches to participative research and development and proposes a way to connect data to dynamic knowledge. The approach is based on a mechanism originally designed to provide user feedback on data, in order to complement and clarify the data quality characterization reported by a provider in the metadata. A 2013 report by the US National Research Council (NRC) [
2] suggests that feedback can be used to transmit knowledge, but does not suggest any concrete recommendation on how to implement this in practice. The solution presented in this paper is a response to this suggestion. The approach deals with knowledge by aggregating and collecting elements originating from different participants and linking them dynamically to the data sources. This solution contrasts with other approaches such as the Data–Information–Knowledge–Wisdom (DIKW) paradigm [
3] proposed by the Group on Earth Observations (GEO), which is based on an information package.
This paper is structured in the following sections:
Section 2 reviews the literature. From this, and from the authors’ past experiences in implementing user feedback, a set of use cases is extracted.
Section 3 presents research methodology, based on a data model that covers the use cases presented in
Section 2, and explains the actual system.
Section 4 presents the research and development and main results.
Section 5 outlines the evaluation of the system by showing how it is being integrated in existing data catalogues. The paper ends with discussion in
Section 6 and conclusions in
Section 7.
2. Literature Review
Sometimes a user of data is actively willing to contribute their knowledge so that others can take advantage of it. One of the common mechanisms that the Web offers is blog pages, which can become a supplement to scientific literature and provide a reliable source of mentorship and networking for those in isolation [
4]. Even so, these solutions are disconnected from the actual data and from the direct experience which the contributor gained about what was and was not useful in the course of their data use. Baeza-Yates et al. [
5] discuss a framework for explicit (and implicit) feedback where a user provides information about the relevant results in a list of resources returned by a query to a data catalogue. The final aim is to refine query results, by including user feedback in search algorithms. Another form of user feedback is applied when users are questioned to determine the quality of image classification. For example, in a user interface organized as a game, people are provided with examples of automatically classified objects and they are asked to determine whether the classification matches the reality, and, if not, to correct the classification [
6]. This approach is found in the LACO-Wiki platform [
7] which supports citizen science in the form of volunteer data validations. In citizen science, people interested in a topic contribute their time and their local or domain knowledge to carry out a task relating to a place or theme that interests them. This volunteered data has great potential to enrich the currency and granularity of datasets by embedding the knowledge of local experts and observers. However, contextual information about that data and its use/re-use is less frequently captured, partly because of a lack of standardized tools and information models for this. This paper focuses on collecting and aggregating explicit feedback about datasets, in order to both enhance the producer’s data quality reports and advance knowledge about the area and topic of the dataset.
A digital dataset should be accompanied by metadata. Metadata is composed of information that helps the user assess the usefulness of a dataset relative to a user problem or need. Unfortunately, metadata is usually generated by the producer, and as a result it reflects production interests and incorporates what is easiest to measure and describe for producers [
8]. This is illustrated by the wide variety of ISO 19115 elements related to the nature and origin of data, such as LI_Lineage, MD_Distribution, MD_Constraints, and MD_SpatialRepresentation. End-users can potentially provide additional facets of metadata that are more desirable for other users. For example, a scientist using the data and producing an academic paper is reflecting their experience with the data, and typically describes use cases, as well as difficulties. Experts can report positive and negative experiences using the data, and can relate the dataset to other datasets and provide a comparison report. In addition, when using geospatial datasets, users with different backgrounds can assess the dataset from varying points of view: Application domain expertise (e.g., ecology, epidemiology, transportation, security), information technologies expertise (e.g., system engineers and database designers) and Geospatial Information Technology (GeoIT) expertise (e.g., geomatics engineers, GIS developers, geographers). Considering the differences in perspectives, backgrounds and objectives between the different experts, a complementarity in the way they perceive the dataset may exist [
9]. One of the few examples of user perspective metadata in the existing geospatial metadata standards can be found in ISO 19115, where the element MD_Usage is designed to report what should or did happen to the data after its publication. Initially containing only 4 elements (specificUsage, usageDateTime, userDeteminedLimitations and userContactInfo), in 2013 MD_Usage was extended to include a response to the issue as well as two citations about additional documentation and identified issues (additionalDocumentation and identifiedIssues). Without a feedback mechanism, producers need to have a very active role in finding out new usages of the data. This is typically achieved by sending questionnaires to their registered user base, or by collecting indirect information from their user support lines. Despite the existence of the MD_Usage element, a typical metadata document is not sufficient to effectively communicate all the components that determine data fitness-for-purpose across a variety of domains and user expertise levels [
10].
Metadata contained in catalogues are of great value in the discovery of datasets and in evaluating whether the characteristics and reliability of those datasets meet a user’s particular needs. As the number of published datasets and services increases, it becomes more of a challenge for users to assess the fitness-for purpose of all possible options which are discovered. In addition, metadata are often incomplete [
11], sometimes due to a lack of time on the part of the producers and sometimes because information is lost in translation between different standards, since not all available standards encode all the information which real-world users seek. The introduction of user feedback in metadata catalogues is expected to improve dataset search [
12]. Comber et al. [
13] argued the case for enriching metadata records with references to relevant literature (e.g., information on citations), less formal opinions from the data producers; expert opinions of data quality, and user feedback regarding previous data use. The introduction of informal voluntary user feedback and commentaries can also facilitate a more “user-centric approach” to geospatial metadata [
14]. Geospatial data users want to have information about the data producers, traceability information (i.e., full lineage), and both statements and quantitative information on data quality. All of this can be found in traditional metadata. However, end-users also have the desire for more user-focused metadata information including dataset citations in publications, user feedback on dataset quality and trustworthiness, and expert reviews and recommendations [
15].
In response to the need to better consider the user perspective, the Open Geospatial Consortium (OGC) started a work item based on the results of the EU FP7 GeoViQua project. The result was the approval of 2 international standards: A conceptual model for Geospatial User Feedback (GUF) [
16] and an XML encoding [
17] that extended ISO 19139 to consider GUF in accordance with the conceptual model. The GUF standard provides a data model that includes ratings, comments, usage reports, citations to publications, additional quality reports and description of significant events, and is the starting point for the work presented in this paper. Other recommendations and standards are proposed to recognize and aim to address the same needs: For example, in 2016, the W3C finalized its work on the “Data on the Web Best Practices: Dataset Usage Vocabulary (DUV)”. This vocabulary relates a dataset distribution to usage reports (including usage tools), user feedback ratings and user quality reports (both special cases for annotations), and bibliographic references [
18]. The DUV vocabulary can extend the domain-independent metadata represented by the GeoDCAT-AP profile [
19] to include user feedback, thus creating a catalogue that combines producer metadata and user feedback [
20]. Despite these recommendations and recent standards, reviews suggest that these theoretical recommendations have not yet impacted many real implementations in the geospatial domain [
20,
21].
Recently, another gap in geospatial data and metadata was identified by the Groups on Earth Observation (GEO); an organization that is building the Global Earth Observation System of Systems (GEOSS). For GEO, supporting the current strategic objectives of the United Nations Sustainable Development Goals (SDG) requires a change of paradigm, moving from a data-centric approach to a more information and knowledge-centric approach. In the Data-Information-Knowledge-Wisdom (DIKW) paradigm [
3], information is an added-value product resulting from the comprehension of available data and of its relationship with physical and/or social phenomena. In turn, knowledge is generated by understanding information and extracting and articulating valuable patterns. Indeed, the knowledge gained from producing and using datasets is not often gathered, partly due to the lack of an easy way to record it and curate it in a single place. Commonly, a searchable Knowledge Base is considered as the best solution to capture and share knowledge about a particular domain. This is the proposed definition of the GEOSS Knowledge Base: “A dynamic and evolvable information framework, organized as repository of existing and distributed knowledge bodies, to facilitate Information and Knowledge generation and sharing from Earth observation”. A knowledge base should collect, formalize, share, and facilitate the use of a set of knowledge bodies, including data, processing algorithms/codes, business process models (implemented as workflows), publications, computing infrastructures references, etc. [
22]. The GEO Secretariat considers that a Knowledge Hub should be designed as a centralized knowledge base; a trusted digital repository providing access to all components needed to build a given EO application, including research describing methods; algorithms, software, and cloud computing resources used for processing; relevant EO data; and results for verification [
23]. All these components will be packed in an information package and made available in the Hub. The authors believe that this approach will indeed contribute to the preservation and dissemination of knowledge, and support traceability and reproducibility of the conclusions contained in an information package, but it will not actively contribute to the incremental creation of knowledge as a community effort.
While the GEO Knowledge Hub focuses on collecting consolidated knowledge, this paper proposes to extend the user feedback concept to support the continuous process of knowledge creation. We propose an extended user feedback model which addresses the difficulties in understanding some automated models—often the biggest impediment in using such techniques in decision-making. There is a need for the analytics system to incorporate human-understandable feedback to explain analytics results and the steps taken to obtain them [
2], since a lack of understanding affects not only the decision makers but also other stakeholders such as customers or the general public. The creation of shared feedback about analytical results can also be a supporting tool for group-based analytics. In visual analytics, teams ranging from tens to thousands of analysts may be working on a single problem, such as global change. Steps of analytics, visualization, and statistical analysis can be shared as pieces of software code and scripts. The progress of any individual contributor in the understanding of the data or in generating intermediate results can be transmitted as feedback items and requires that credit is attributed to each one of them. The combination of the feedback contributions relating to a particular dataset will represent the overall knowledge gained by the community using that dataset.
Another possible approach was developed by ReviewNB (
https://www.reviewnb.com/ accessed on 4 March 2021) as an extension for Jupyter Notebooks. Jupyter Notebooks are becoming popular because they expose data, code and data analytics results in combination with narrative text. Typical contexts where Jupyter notebooks are useful are data cleaning and transformation, numerical simulation, statistical modelling, data visualization, machine learning, and remote sensing processing. Some authors consider Jupyter notebooks an alternative to WebGIS as the front-end interface to provide a consistent and agile playground for both developers and users [
24]. By using Jupyter notebooks, users gain knowledge about the data or gain knowledge by analyzing model results. Since a Jupyter notebook can be accessed by many people, the notebook can benefit from having an environment where users provide comments, suggestions or report findings. ReviewNB is a commenting plugin for Jupyter Notebooks that makes it possible to see a sequence of comments provided by users at the bottom of the page. Internally, those comments are stored in a common repository. This paper represents an effort to implement the NRC recommendation based on an extension of the GUF standard, in such a way that collaborative knowledge by many users can be created and retrieved for a certain resource.
In conclusion, we have seen that a collaborative system for aggregating feedback on datasets and knowledge gained from use of the data has multiple target users with different aims, who are performing different actions in response to their needs. Each action carried out in the context of a larger activity can be expressed as a use case sentence, and can essentially be classified under two aims—quality and knowledge.
Quality refers to use cases that describe the properties of a resource and how they meet the user’s purpose.
Knowledge refers to the findings that arise when a resource is used, including results or conclusions that are reached through this usage. A system that helps to fulfil these needs should use a data model with a set of elements corresponding to the requirements of the use cases.
Table 1 presents a list of use cases extracted from the literature review and from the authors’ past experiences in implementing user feedback, which should be covered by the system presented here.
The following data model and system implementation is designed to respond to the use case needs. After explaining the GUF data model and its proposed extension to represent knowledge, we present a detailed example of how the model combines some of the previous use cases in a user story.
3. Research and Development Methodology
To fulfill the aims of this paper we present a methodology based on extending the official Geospatial User Feedback (GUF) model to store knowledge elements. The OGC GUF Conceptual Model [
16] was designed to provide a standard way to communicate individual user feedback elements and relate them to datasets. These feedback elements complement producer metadata. One assumption is that any dataset can be uniquely identified by a universal and persistent ID [
25]. This way both the producer metadata [
26] and the feedback elements will refer to this universal ID and a relationship between them, and with the data, can be maintained.
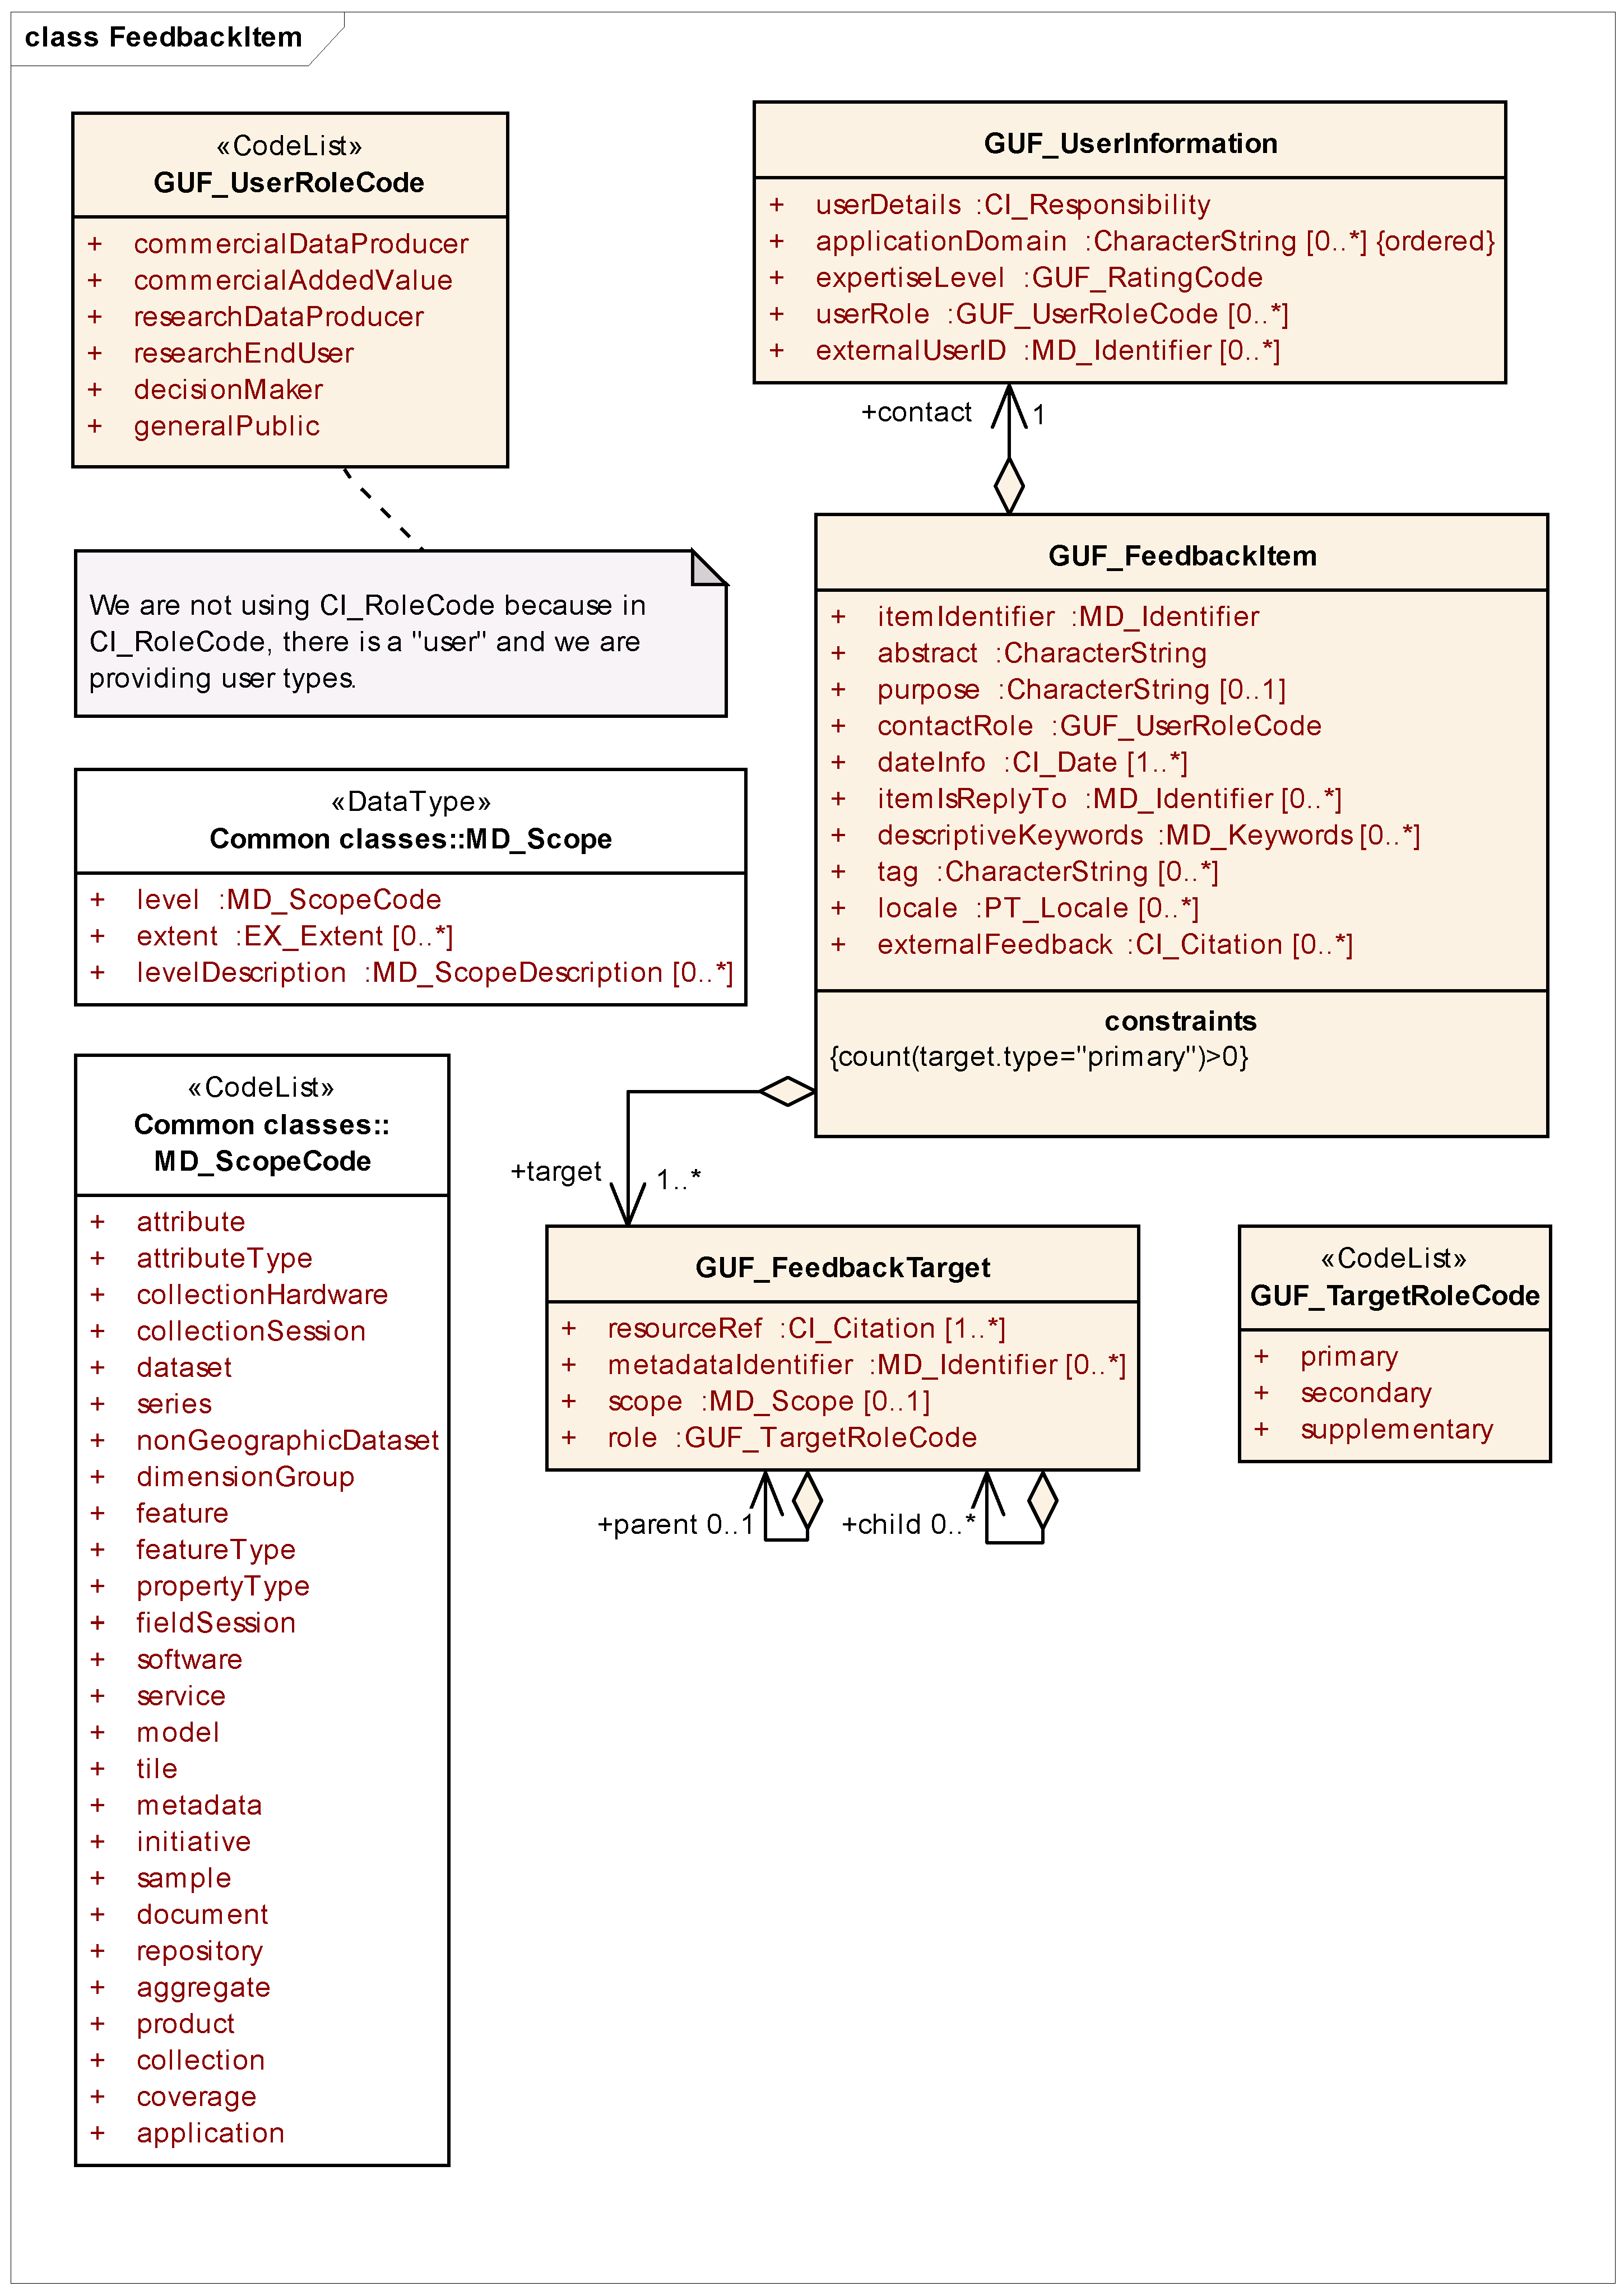
The main element in the GUF is the feedback item (GUF_FeedbackItem): A single element of user feedback; for example, a comment on a dataset backed by a report.
Figure 1 shows a part of the UML representation of GUF. In UML, boxes without header or with
<<DataType>> header represent classes with their attributes listed in red. Each attribute has a name (e.g., itemIdentifier or abstract) a data type (e.g., MD_Identifier or CharacterString) and its multiplicity (if absent 1..1 is assumed). Additional attributes of a class may be specified as arrows connecting to other classes (as “contact”). Boxes with
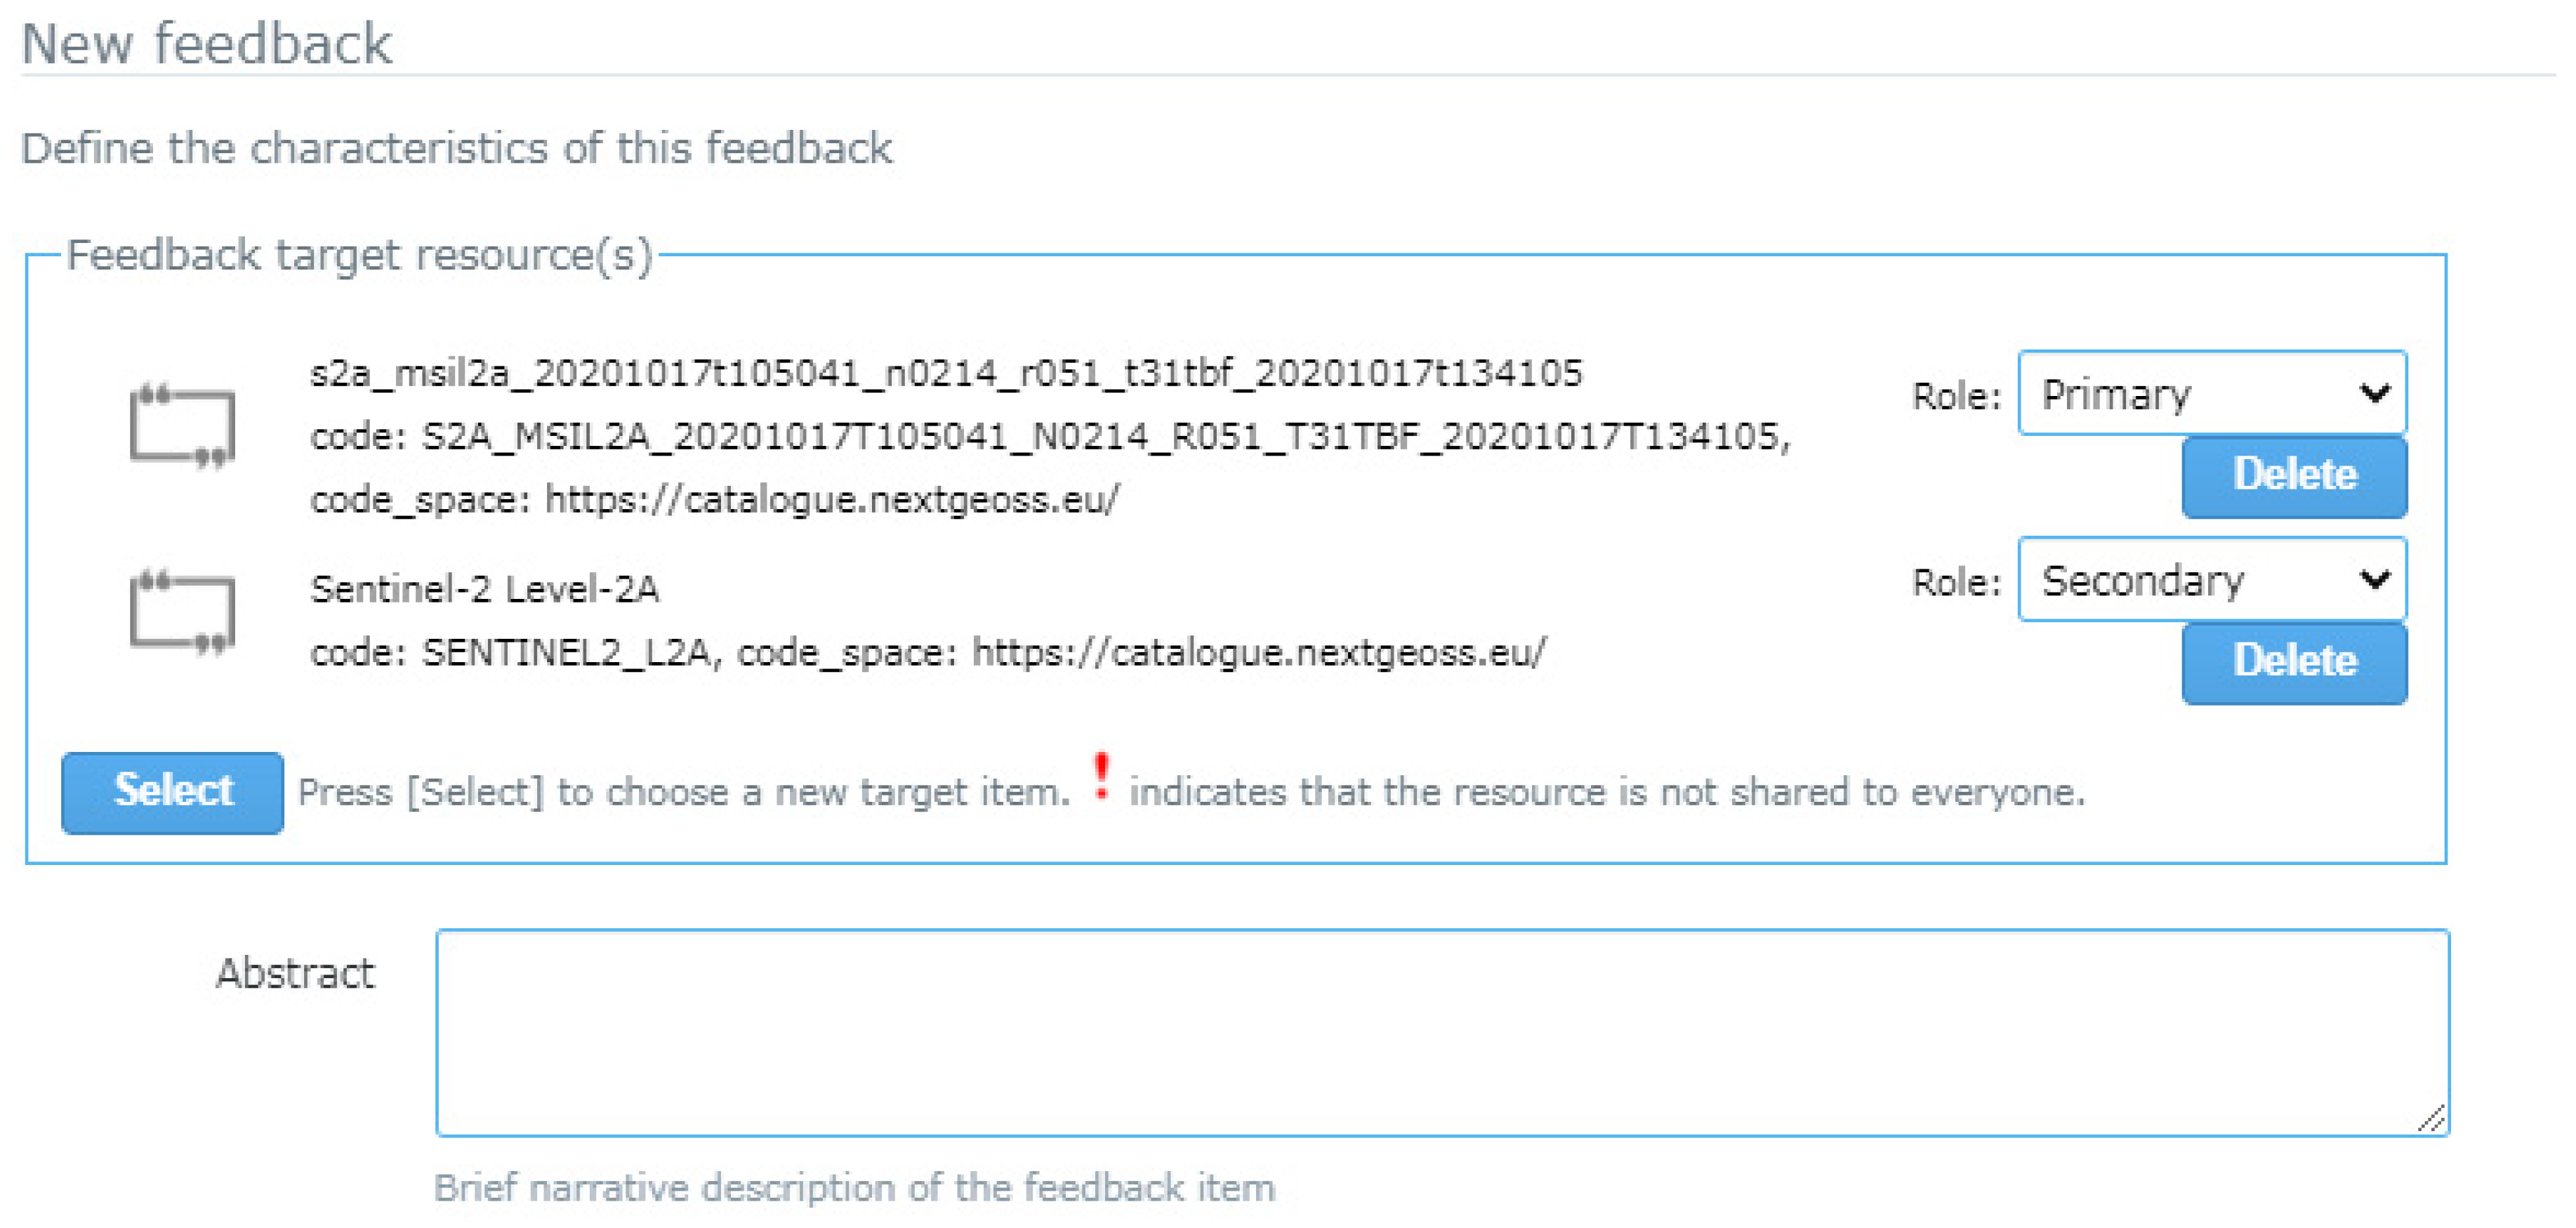
<<CodeList>> header are not classes but contain lists of allowed values, for example GUF_TargetRoleCode for target role. The item’s targets (GUF_FeedbackTarget) uniquely identify the dataset or a subset of the resources. A role
primary is used to point to the main target dataset or resource the feedback is about. A role
secondary is used to refer to target resources that might be relevant to the referenced resource and thus to a user searching for feedback. To add additional references, a target role
supplementary can be used. In remote sensing applications, when a scene or sheet of a product is used, we found it useful to make the primary target point to the specific scene used and the secondary target to the complete product or time series. The user information (GUF_UserInformation) contains self-asserted information about the user which may be used to qualify the feedback s/he produces. This includes information on the user’s role and application domain and their own assessment of their expertise.
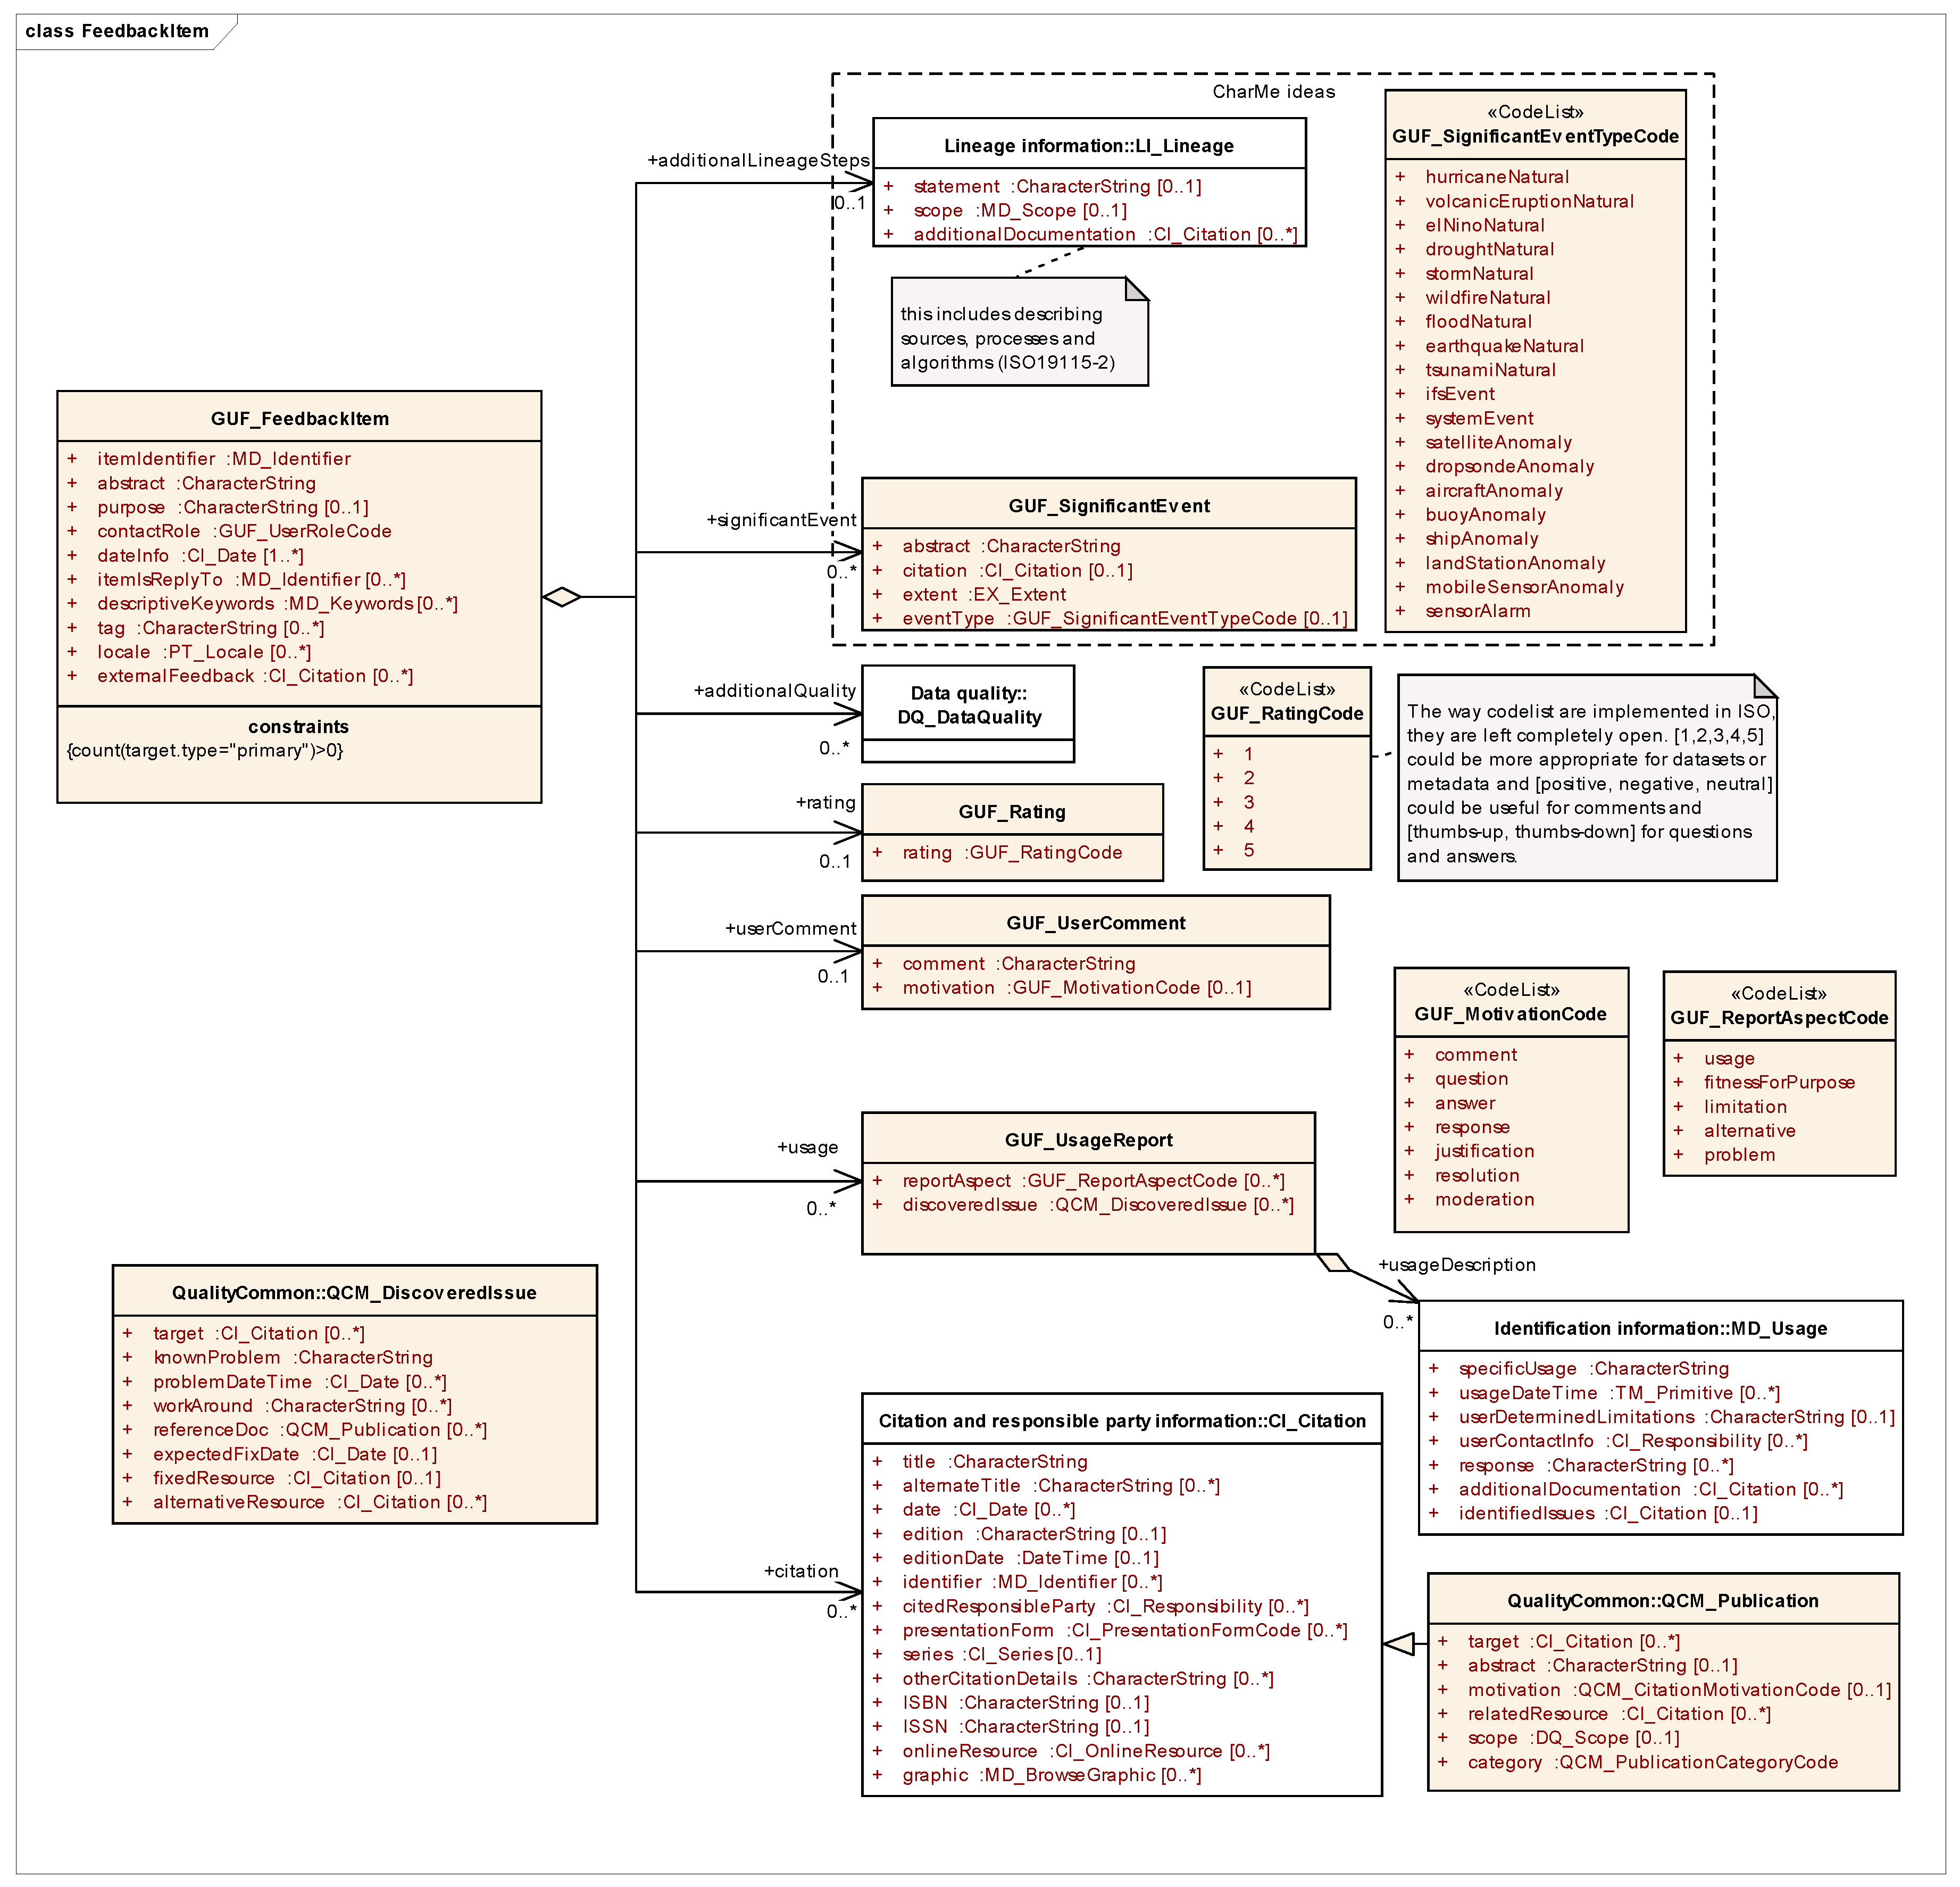
A feedback item contains at least one of the following elements (see
Figure 2):
rating, a
userComment, an
additionalQuality (a full data quality report which may supplement the producer quality information), a usage report, a citation (a reference to a publication),
additionalLineageSteps and a
significantEvent (a description of an event that conditions the interpretation of the data).
The original elements of the GUF were designed to complement the producer quality assessment and, more generally, to give indications to other users on fitness-for-purpose. In the light of recent implementations of the GUF, we realized that most of the elements are actually used broadly to communicate information and knowledge gained by using the dataset, except for “rating”. An illustration of this possibility is the fictitious user story where
additionalLineageSteps was used to report on how to better tidy the data [
27] in preparation for analysis related to a
significantEvent (GUF_SignificantEvent) that was related to a
wildFire (GUF_SignificantEventCode). In this context, the
userComment (GUF_UserComment) was used to report an
answer (GUF_MotivationCode) to a scientific question about fire propagation that is explained in detail in a
usage report (GUF_UsageReport, extension of MD_Usage). The usage resulted in a scientific publication that is provided as a
citation (QCM_Publication; extension of CI_Citation; QCM is for “quality common”) that can be trusted because a validation of the original data was also provided as
additionalQuality.
The elements needed to communicate knowledge can vary depending on the source describing the knowledge. In remote sensing, annotations are a way to tag features present in the data that incorporate information that can be later useful for others [
28]. Annotations are a common way to generate knowledge from remote sensing images, to support clustering of the data into classes for later statistical analysis [
29]. According to GEOSS [
23], the main components of knowledge are: (a) Research papers and reports describing methods and results; (b) software algorithms and cloud computing resources used for processing; (c) in situ and satellite imagery data used; and (d) results for verification. We should also consider the four most common sections present in any scientific abstract as candidates for knowledge elements: Objectives, methods, results and conclusions (
https://wts.indiana.edu/writing-guides/writing-abstracts.html, accessed on 4 March 2021).
Considering these approaches, there are three things the official GUF standard does not directly allow: Creating annotations, reporting explicit conclusions and including specific code used in the analysis of the data. This paper proposes an extension to the OGC GUF model to support these three new requirements. Firstly, regarding annotations, userComment (GUF_UserComment) can be extended to include a new value in the GUF_motivation code list to allow motivation=annotation. The MD_Scope element in GUF_FeedbackItem permits linkage of the annotation in a precise way (e.g., pointing to a concrete area in space and time, or to a specific feature id).
Secondly, extensions are needed to model conclusions, as well as objectives, methods and results. Objectives can be presented in the form of questions and can be encoded in the official GUF as a list of userComment (GUF_UserComment) with motivation=question. The results may be also expressed in the official GUF as answers to these questions in a userComment (GUF_UserComment) with motivation=answer. In the open participatory model enabled by the GUF, a discussion on a particular question and answer can continue through contributions of other parties providing new userComment (GUF_UserComment) until an agreement is reached and a conclusion can be formulated as a resolution of the discussion (existing in the official version of the standard codeList). However, to be more precise, we propose to extend the GUF_MotivationCode to include the value conclusion to better express the semantics—i.e., the final or summary nature of a particular comment. The section in the abstract about methods (in fact related to the third requirement, code used) requires more detailed attention and is described in the next paragraph.
The third new requirement that is addressed in the extension is the capacity to encode code, which is a specialization of the general need to encode methods. In this case, the official GUF standard provides the
additionalLineage element that allows for a detailed indication of chains of processing functions that were used with the data. This can be complemented by a textual description of the
usage in the
usageDescription element of the GUF_UsageReport. While these existing elements are useful to textually describe the methods used, none of them allows provision of detailed information about the code used, in such a way that the method can be reproduced and replicated by others. Reproducibility is the capacity to obtain results consistent with a prior study, using the same materials, procedures, and conditions of analysis. Replicability is the capacity to obtain consistent findings across studies that aim to answer the same question but with each study collecting and using its own data. Reproducibility is central to the scientific method based on the skeptical evaluation of claims, to scrutinizing methodologies for possible identification and correction of mistakes, and to appraising scientific explanations [
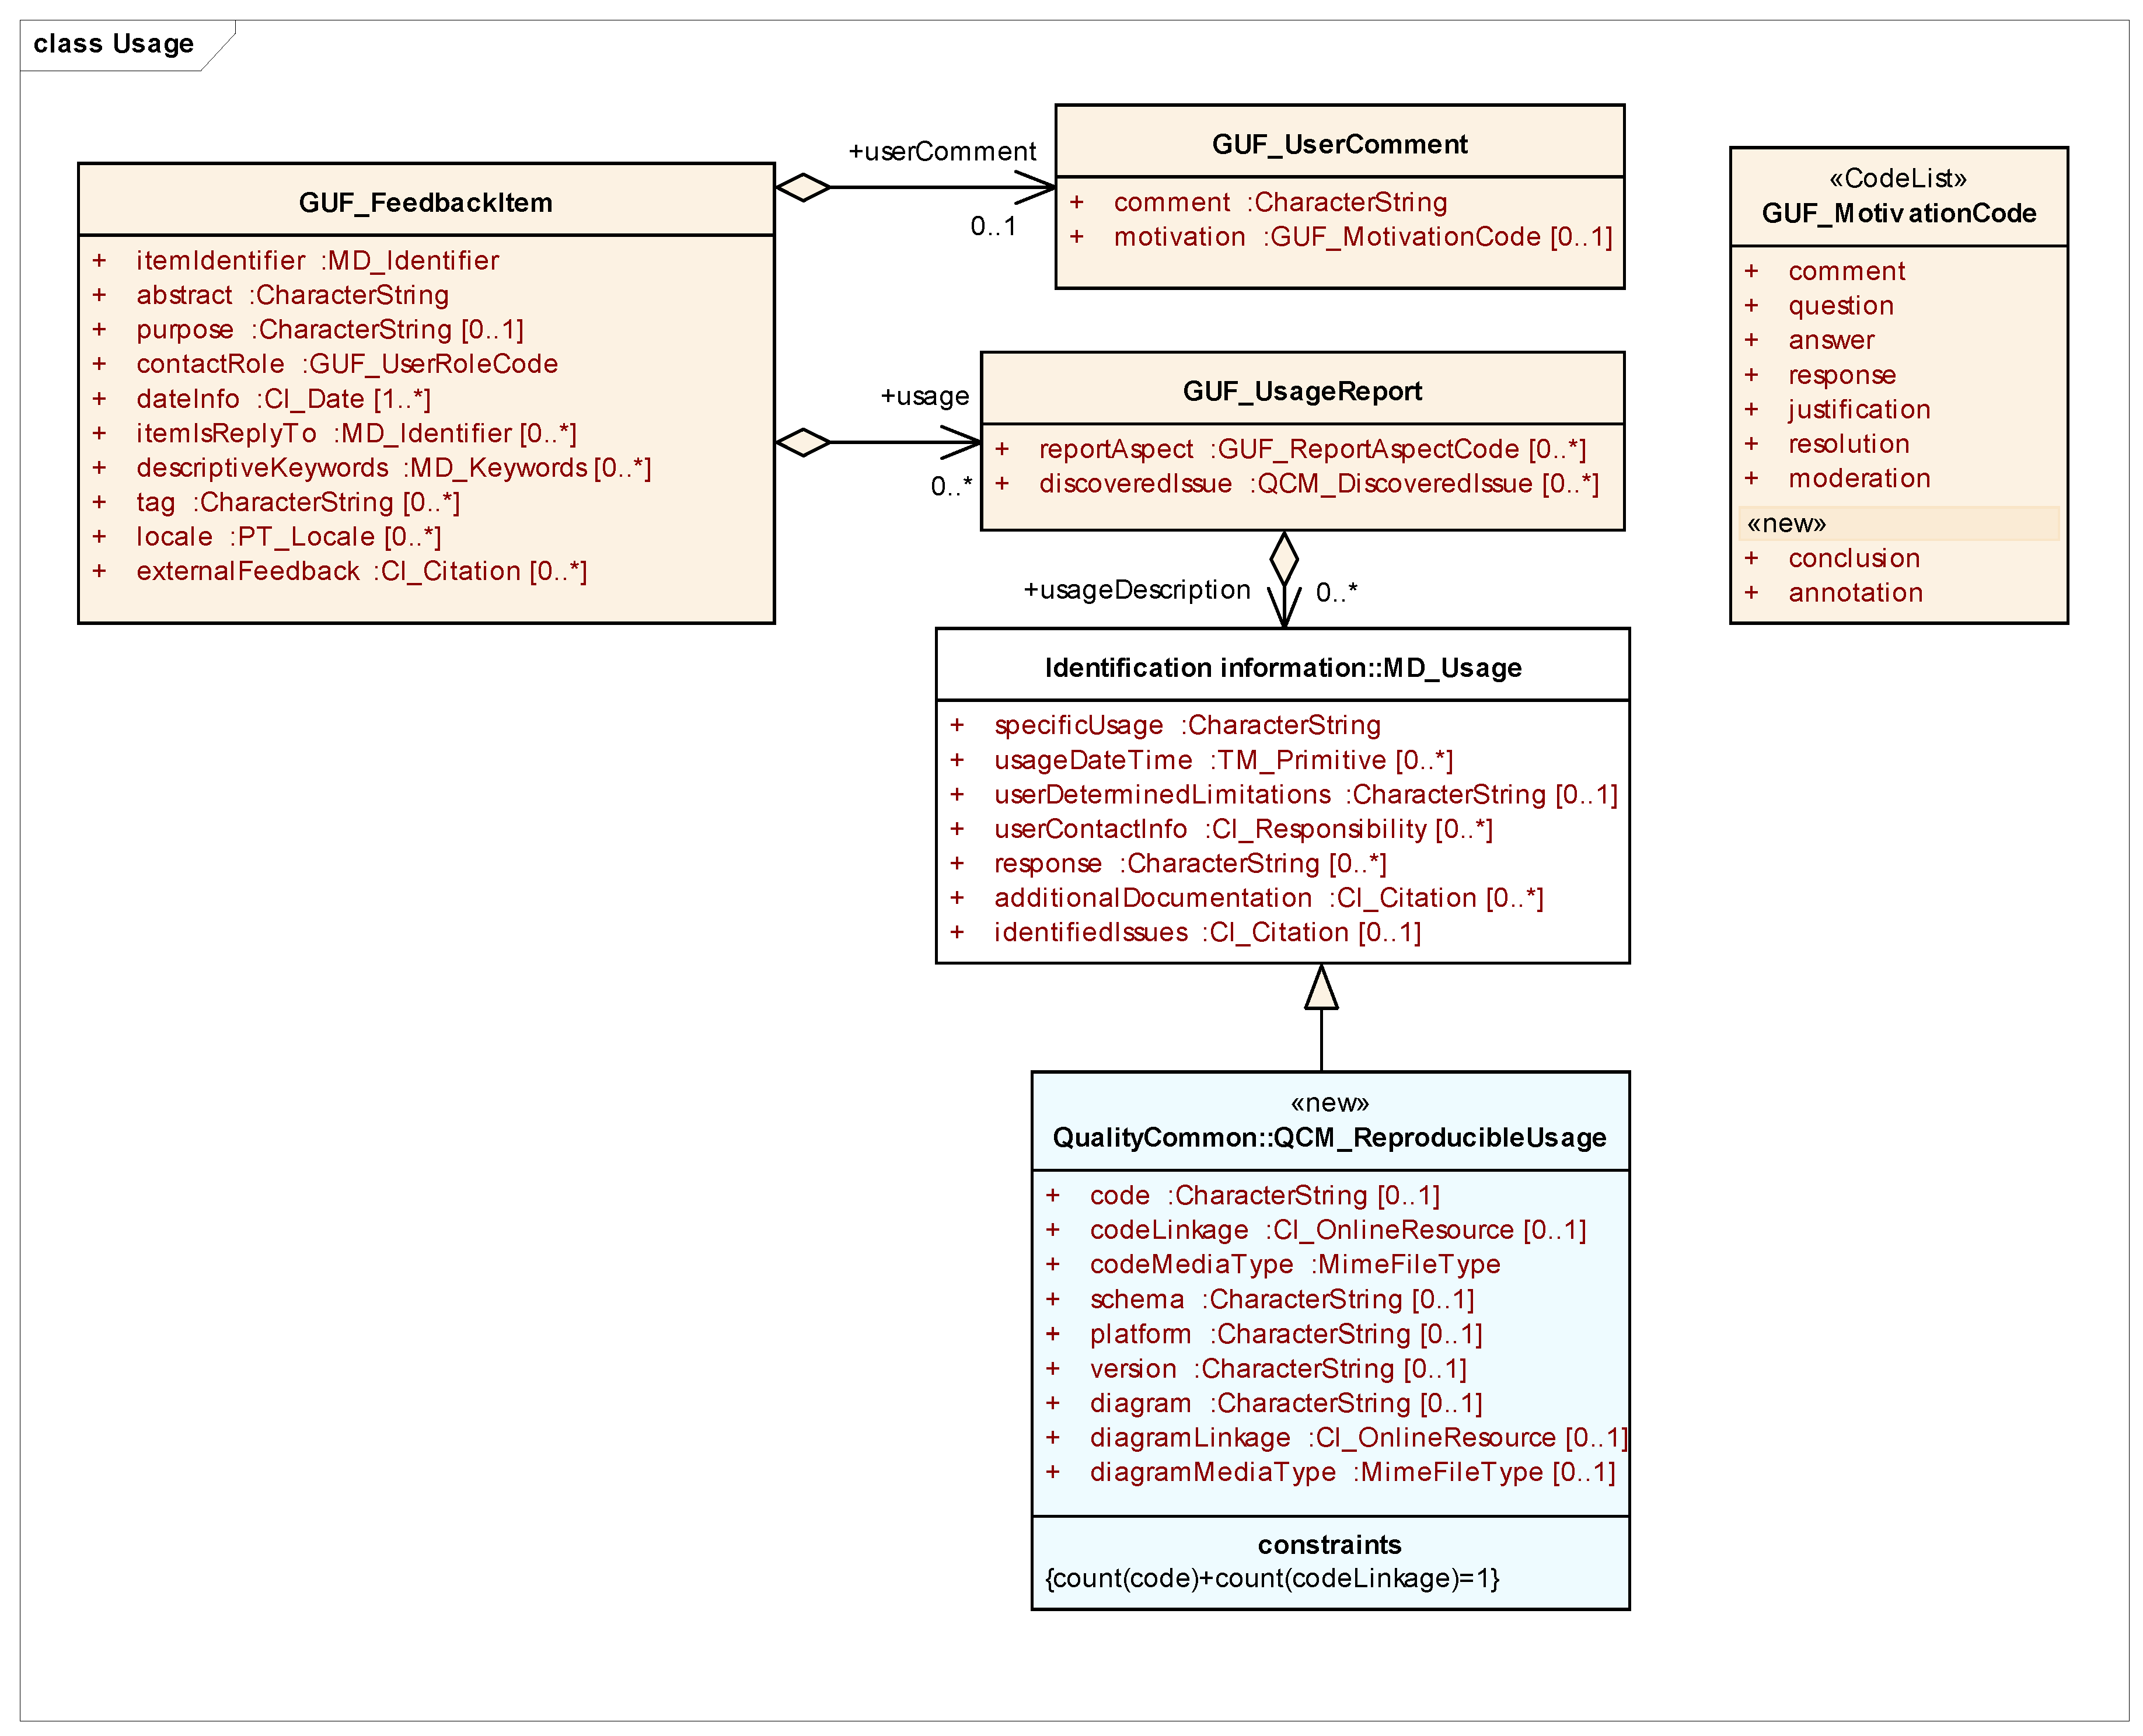
30]. This paper proposes to extend MD_Usage class to include explicit code and additional descriptions of the processing chains (see
Figure 3). The extended element is called QCM_ReproducibleUsage and it includes the common elements of MD_Usage as well as a
code, (or a
codeLinkage),
codeMediaType,
platform,
version,
schema,
diagram, (or a
diagramLinkage), and
diagramMediaType. The elements
code,
codeLinkage and
codeMediaType allow for communication of pieces of code that follow a particular data model, represented by a
schema name. This
code provided was executed in a specific
version of a software
platform (i.e., MiraMon map browser) and can be reproduced again using the same or a compatible configuration in a specific
application (or instance) of the platform and version (i.e., the ECOPotential web map browser). In addition, a processing chain
diagram,
diagramLinkage in a particular
diagramMediaType such a picture in, e.g., UML or CWL (Common Workflow language) file can be provided.
In the original GUF standard, the assumption was that users voluntarily decided when to provide feedback and would manually type descriptions of their experiences using the data. Thus, the focus was on providing (a) a clear Web user interface to guide the user to populate the different elements of the model and (b) a database to store the feedback and present it to other users for reading. This approach was taken for the first implementation during the GeoviQua project [
31] and was the initial approach in the NiMMbus system, presented in the next section of this paper. The only items automatically added to feedback records in these first implementations were the dataset identifier(s) and title. In implementations of the knowledge extension, the user also voluntary decides when and what to share. The user will still manually document an abstract and the reason and purpose for sharing this knowledge element, but we do not expect them to manually type software code directly into a user interface. Nor do we expect the typical user retrieving a feedback item to read the software code. Instead, the implementation should automatically record the code that corresponds to the functionality we would like to share and expose, and other users should be able to voluntarily adopt, execute and reproduce the functionality provided by the code in their systems. The next section describes an implementation of the presented model and its particularities.
A user wants to report a publication which uses two global land cover maps enclosing a certain time window to assess forest change. During her analysis, she assessed the local accuracy of the land cover maps against concurrent in situ data, to estimate error margins on the final analysis, and also wishes to share these insights.
She creates a GUF_FeedbackItem with two primary targets pointing at the identifier of the two-time frames of the land cover maps and a secondary target pointing at the global product time series. She also adds a descriptiveKeywords to the GUF_FeedbackItem which reports (by mapping to a GEneral Multilingual Environmental Thesaurus (GEMET) vocabulary or other concepts dictionary) that she focused on forest change mapping.
She supplies some user information about herself (at minimum, this will contain a CI_Role of researchEndUser, but if she adds expertiseLevel it will help users looking for trustworthy commentary on this dataset).
She adds a GUF_UsageReport to the item whose reportAspect=usage and describes what she did with the data in the usageDescription.
She adds an additionalQuality element to her feedback, which documents a Kappa Coefficient from her quality check. As another secondary target, she adds the ground truth dataset which she used and explicitly records in the scope for that target the spatial bounds of the local region to which that localized quality assessment applies.
If she noted significant bias in the global map during her quality check, she could also add to the usage report a QCM_DiscoveredIssue with some text describing the knownProblem (e.g., particular class confusions or overestimations). She can specify workarounds and alternative datasets if she wishes.
She uses a QCM_ReproducibleUsage to report the script used to do the time comparison as well as the platform and version of the software used to create the result.
She uses a GUF_UserComment with motivation=conclusion to report the conclusions of the study in terms of amount of forest loss.
Once the study is published as a scientific paper, she uses a QCM_Publication to add another feedback item about the same datasets—effectively, a citation.
4. Research and Development Results
The application of the methodology (a.k.a. the proposed extended model) results in an evolution of the NiMMbus system. NiMMbus (
http://www.opengis.uab.cat/nimmbus accessed on 4 March 2021) is a solution for storing geospatial resources on the MiraMon private cloud. MiraMon [
32] is a family of GIS products developed since 1994 and includes a desktop GIS, a Web map browser [
33] and the NiMMbus system. NiMMbus refers to the Latin word for cloud,
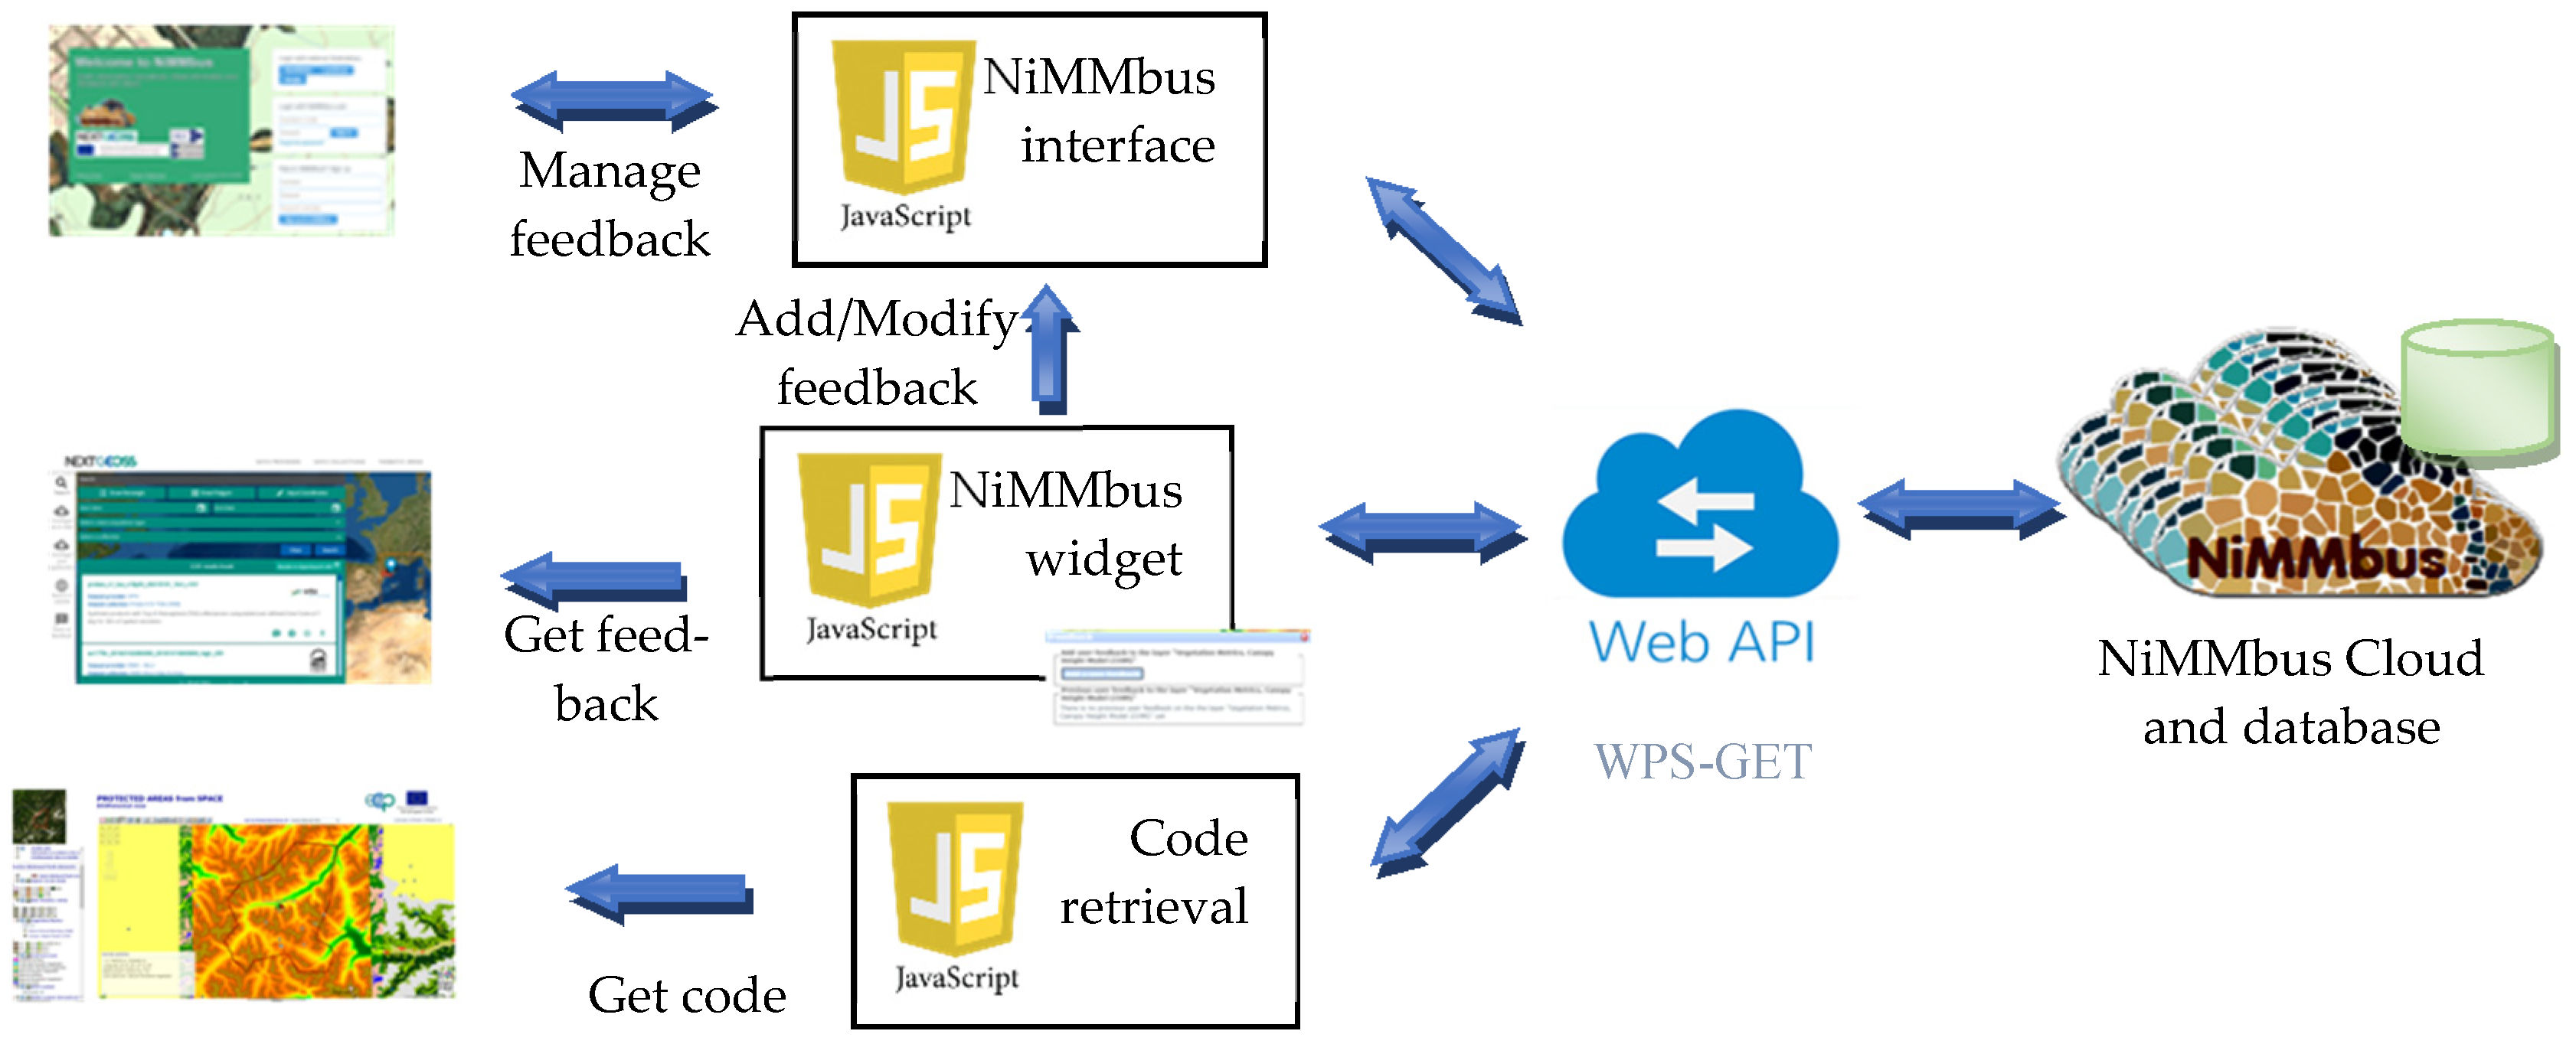
nimbus, but with a double “m” consistent with the MiraMon branding. The main goal of the NiMMbus is to provide an interface for user feedback that can be easily integrated into existing data catalogues on the Web. NiMMbus user feedback records are linked to catalogue records by a data or metadata identifier. The implementation is based on an API that gives access to a database of GUF_FeedbackItem residing in a private cloud. To simplify integration into existing catalogues, three other components are built on top of the API: A user interface to create or modify use feedback, a widget to show existing user feedback about a dataset in the catalogue and a JavaScript library to retrieve code (see
Figure 4).
4.1. Interface for User Feedback
NiMMbus was originally created to store geospatial resources such as points of interest or hyperlinks to geospatial resources in the Web. This initial implementation of NiMMbus was extended during the European Union H2020 NEXTGEOSS project (
https://nextgeoss.eu/ accessed on 4 March 2021, the project itself will be introduced in the Integration section) [
34] to support storage of feedback items as specified in the OGC GUF standard [
16]. The implementation allows users to provide comments, ratings, questions, etc. Moreover, NiMMbus also implements the GUF extension for knowledge which was delineated in the previous section. In our implementation, we are not directly linking feedback with geospatial assets on an external catalogue using a data/metadata identifier. Instead, we create a full citation to the external resource that contains both an identifier to the external resource and also a link to it in the external catalogue or repository. The user interface is a complete user feedback management system. It can be used to read and query user feedback, but when integrated to a data catalogue its main purpose is to act as a Web interface to create or modify user feedback entries.
The NiMMbus system is based on a client-server architecture. The client is the interface with the user, and it is an open-source JavaScript client (
https://github.com/grumets/nimmbus/tree/master/client_js accessed on 4 March 2021) under GNU Affero General Public License. The client allows creation and modification of feedback items related to one or many targets. The interface also allows creation of related elements needed for the feedback items, such as the citation(s) to the target(s) and to related publications (e.g., to describe a related scientific paper) or other citations (e.g., a link to alternative resources). To create feedback elements, the user needs to be logged in to the system with a NiMMbus user or any of the Single-Sign-On (SSO) systems supported: NEXTGEOSS (documented in
https://github.com/ec-nextgeoss/nextgeoss-integration-guide-um accessed on 4 March 2021) and LandSense [
35] (that includes EduGain and the most common social network authentication providers).
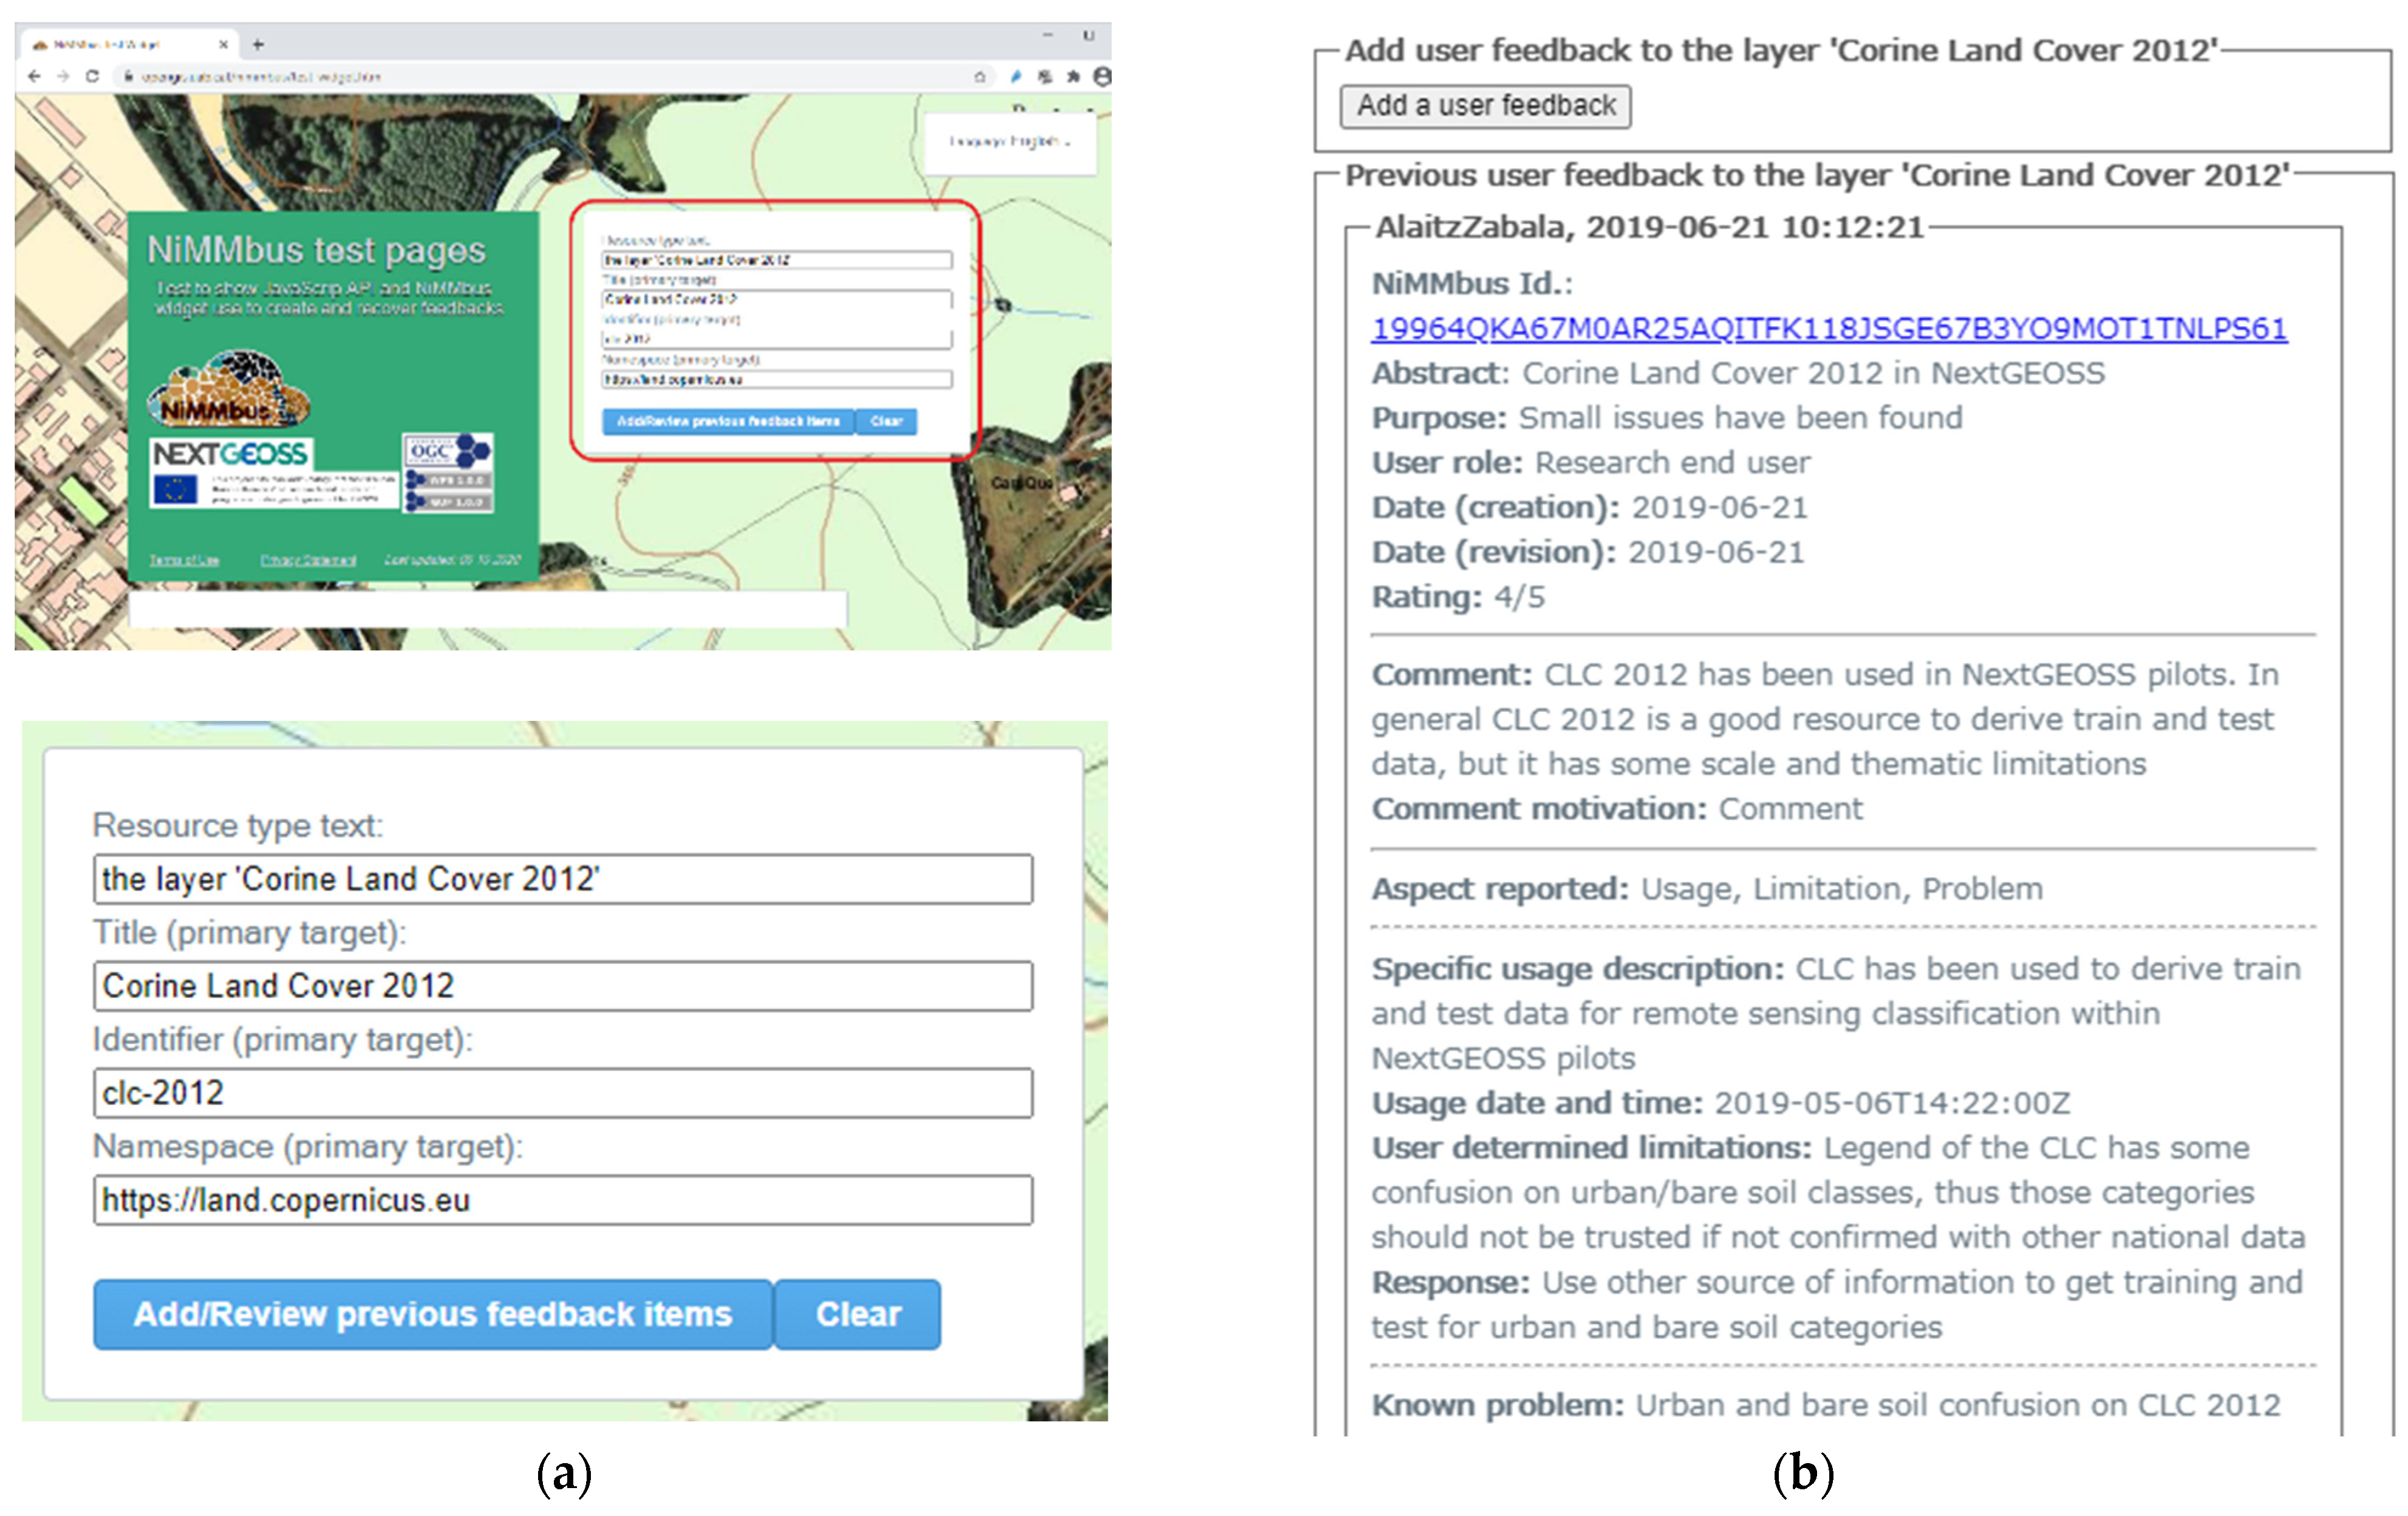
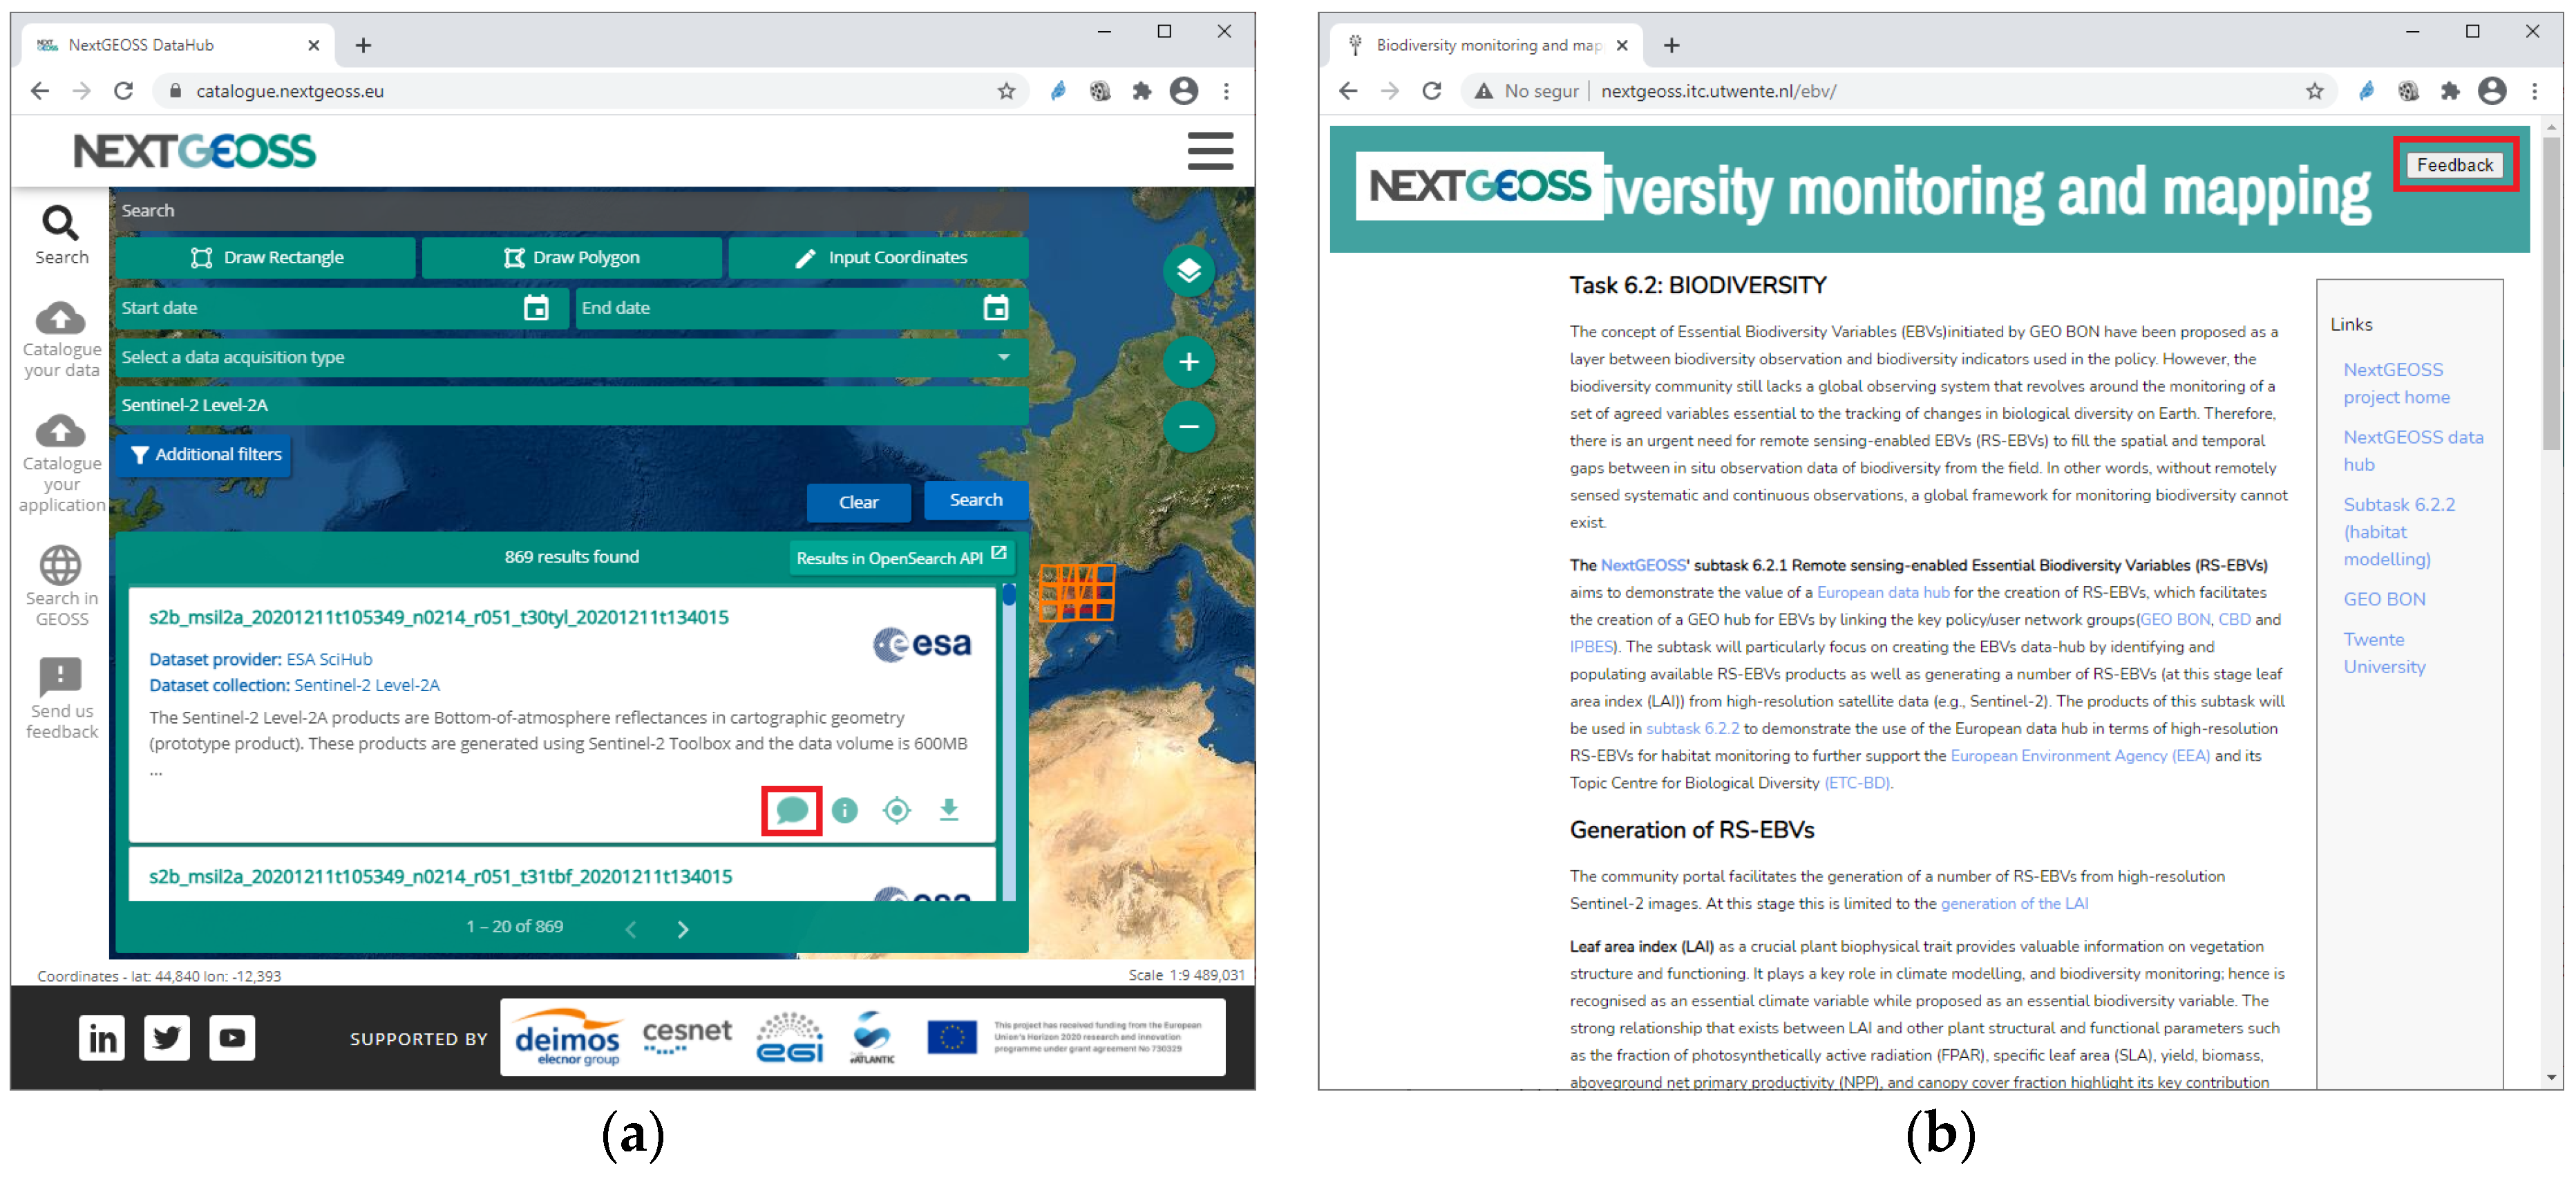
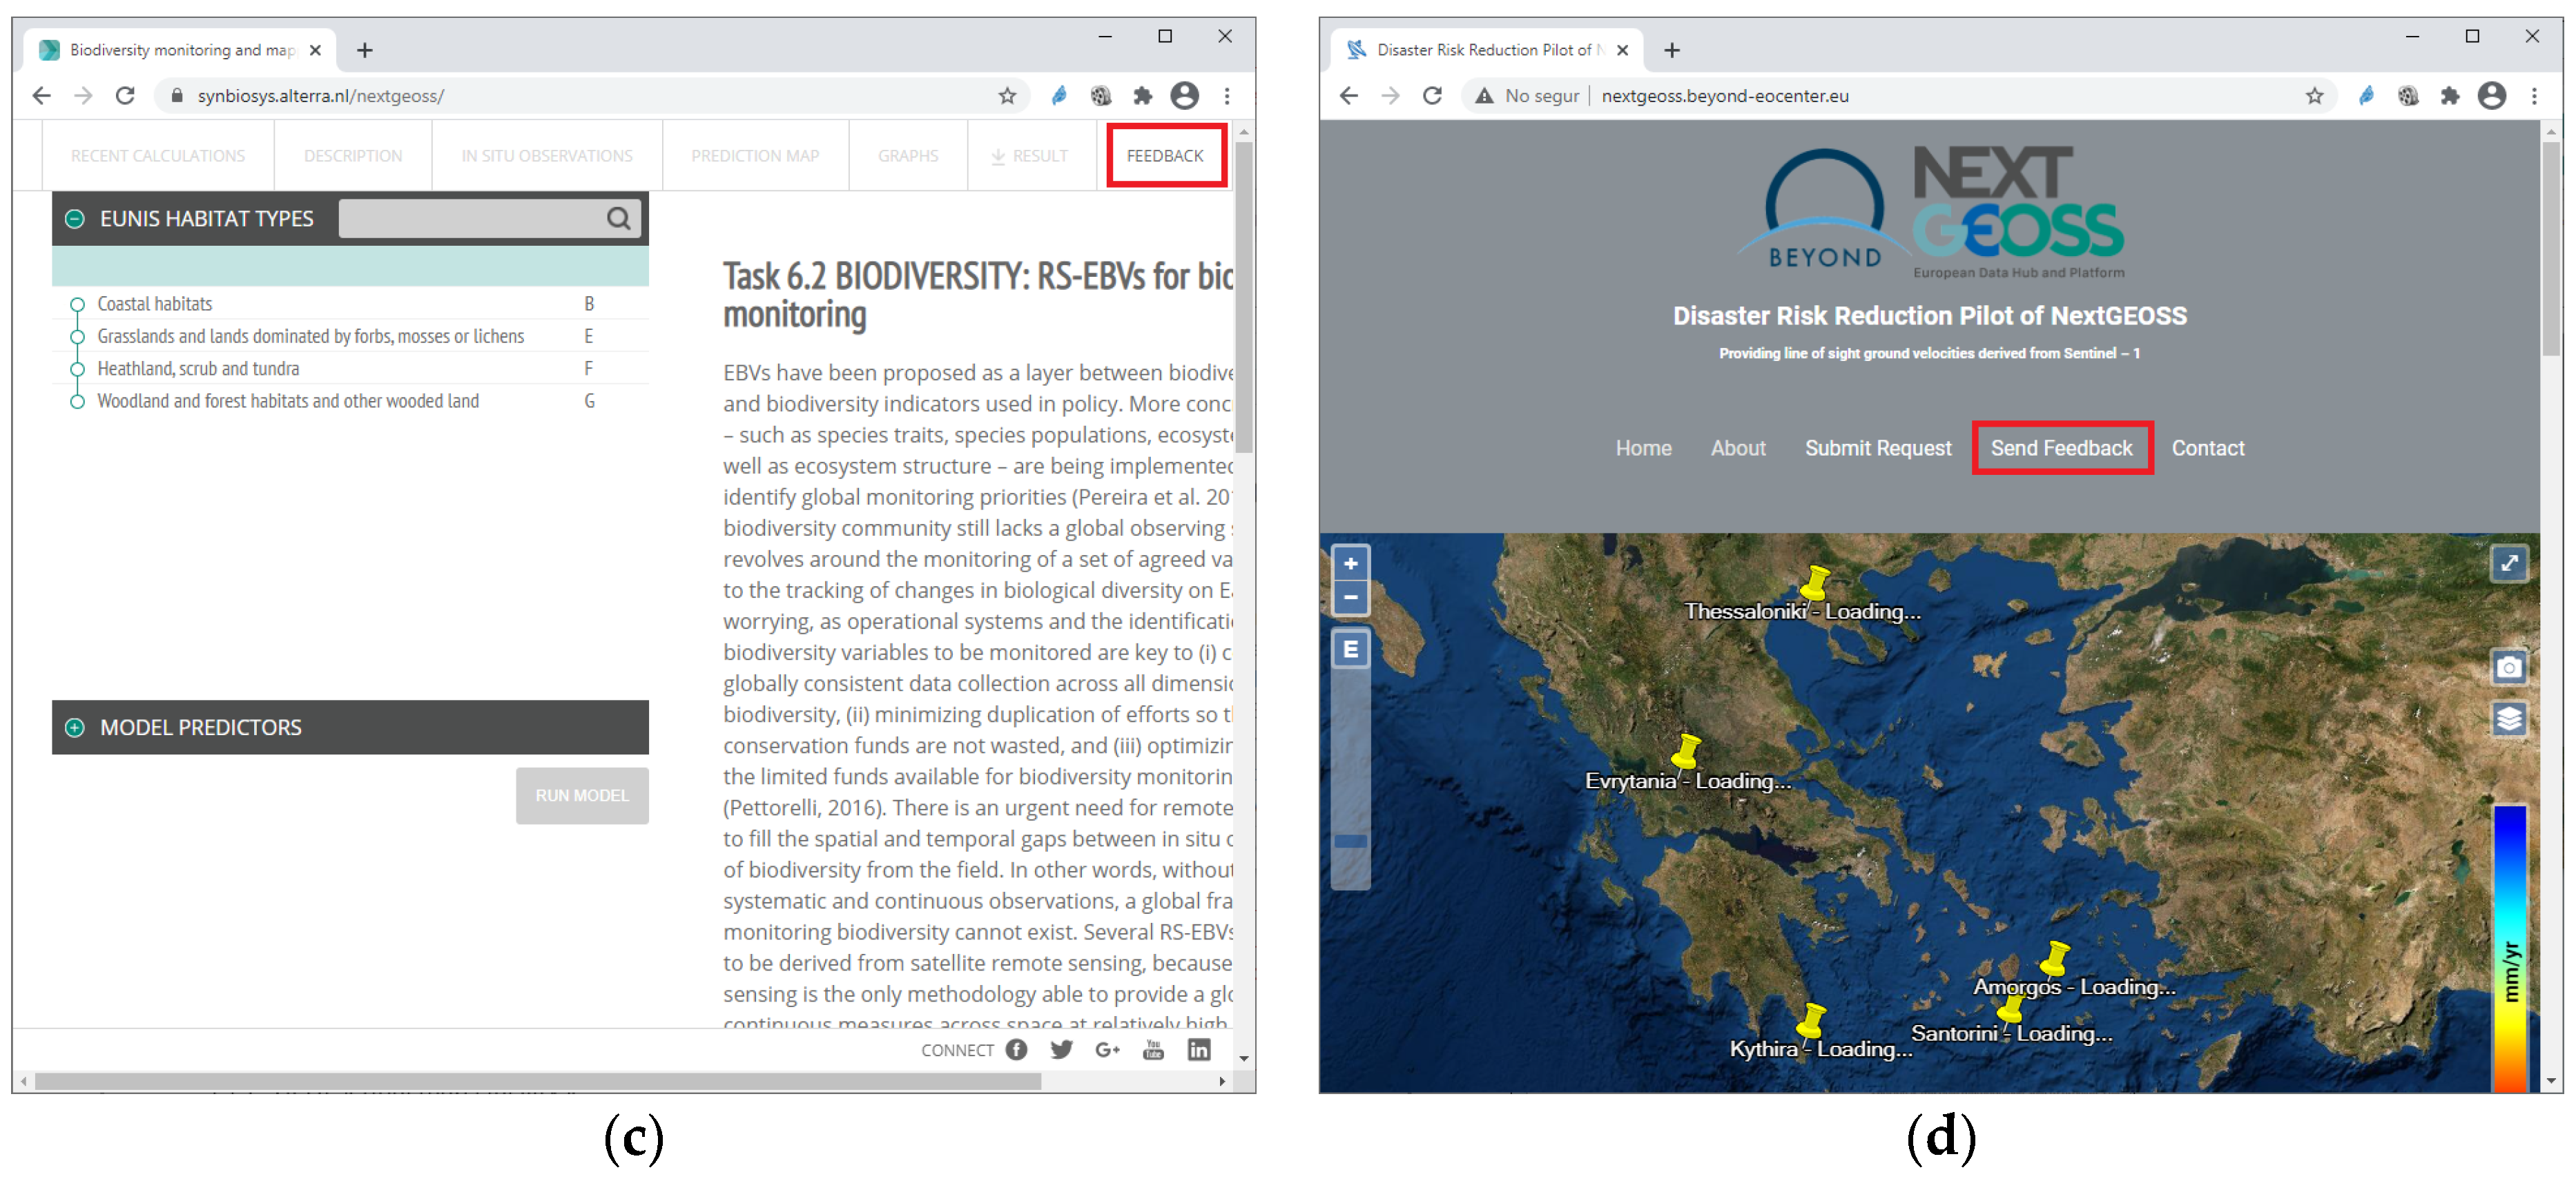
The entry page supports parameters that are useful to directly jump into a function, altering the normal interaction flow with the user. This is particularly useful to facilitate integration with data catalogues as the parameters to create a feedback item can trigger the NiMMbus system to be opened directly in the feedback item page, directly setting the target of this feedback item to be the one defined in the parameters. From the user point of view, this allows immediate access from a catalogue or portal to create feedback on any of its resources (see
Figure 5). This functionality is encapsulated in a widget (described below) which allows easy integration of NiMMbus from any portal.
When used without parameters, the interface presents a general list of resources, that gives access to a specific page for each resource type available, such as feedback items, citations, publications, individuals, or organizations. In this page, elements can be filtered by type or by ownership (owned, shared directly with me, shared publicly) using dropdown lists as can be seen in
Figure 6. All the information is retrieved using our OGC Web Processing Service (WPS) RESTful API.
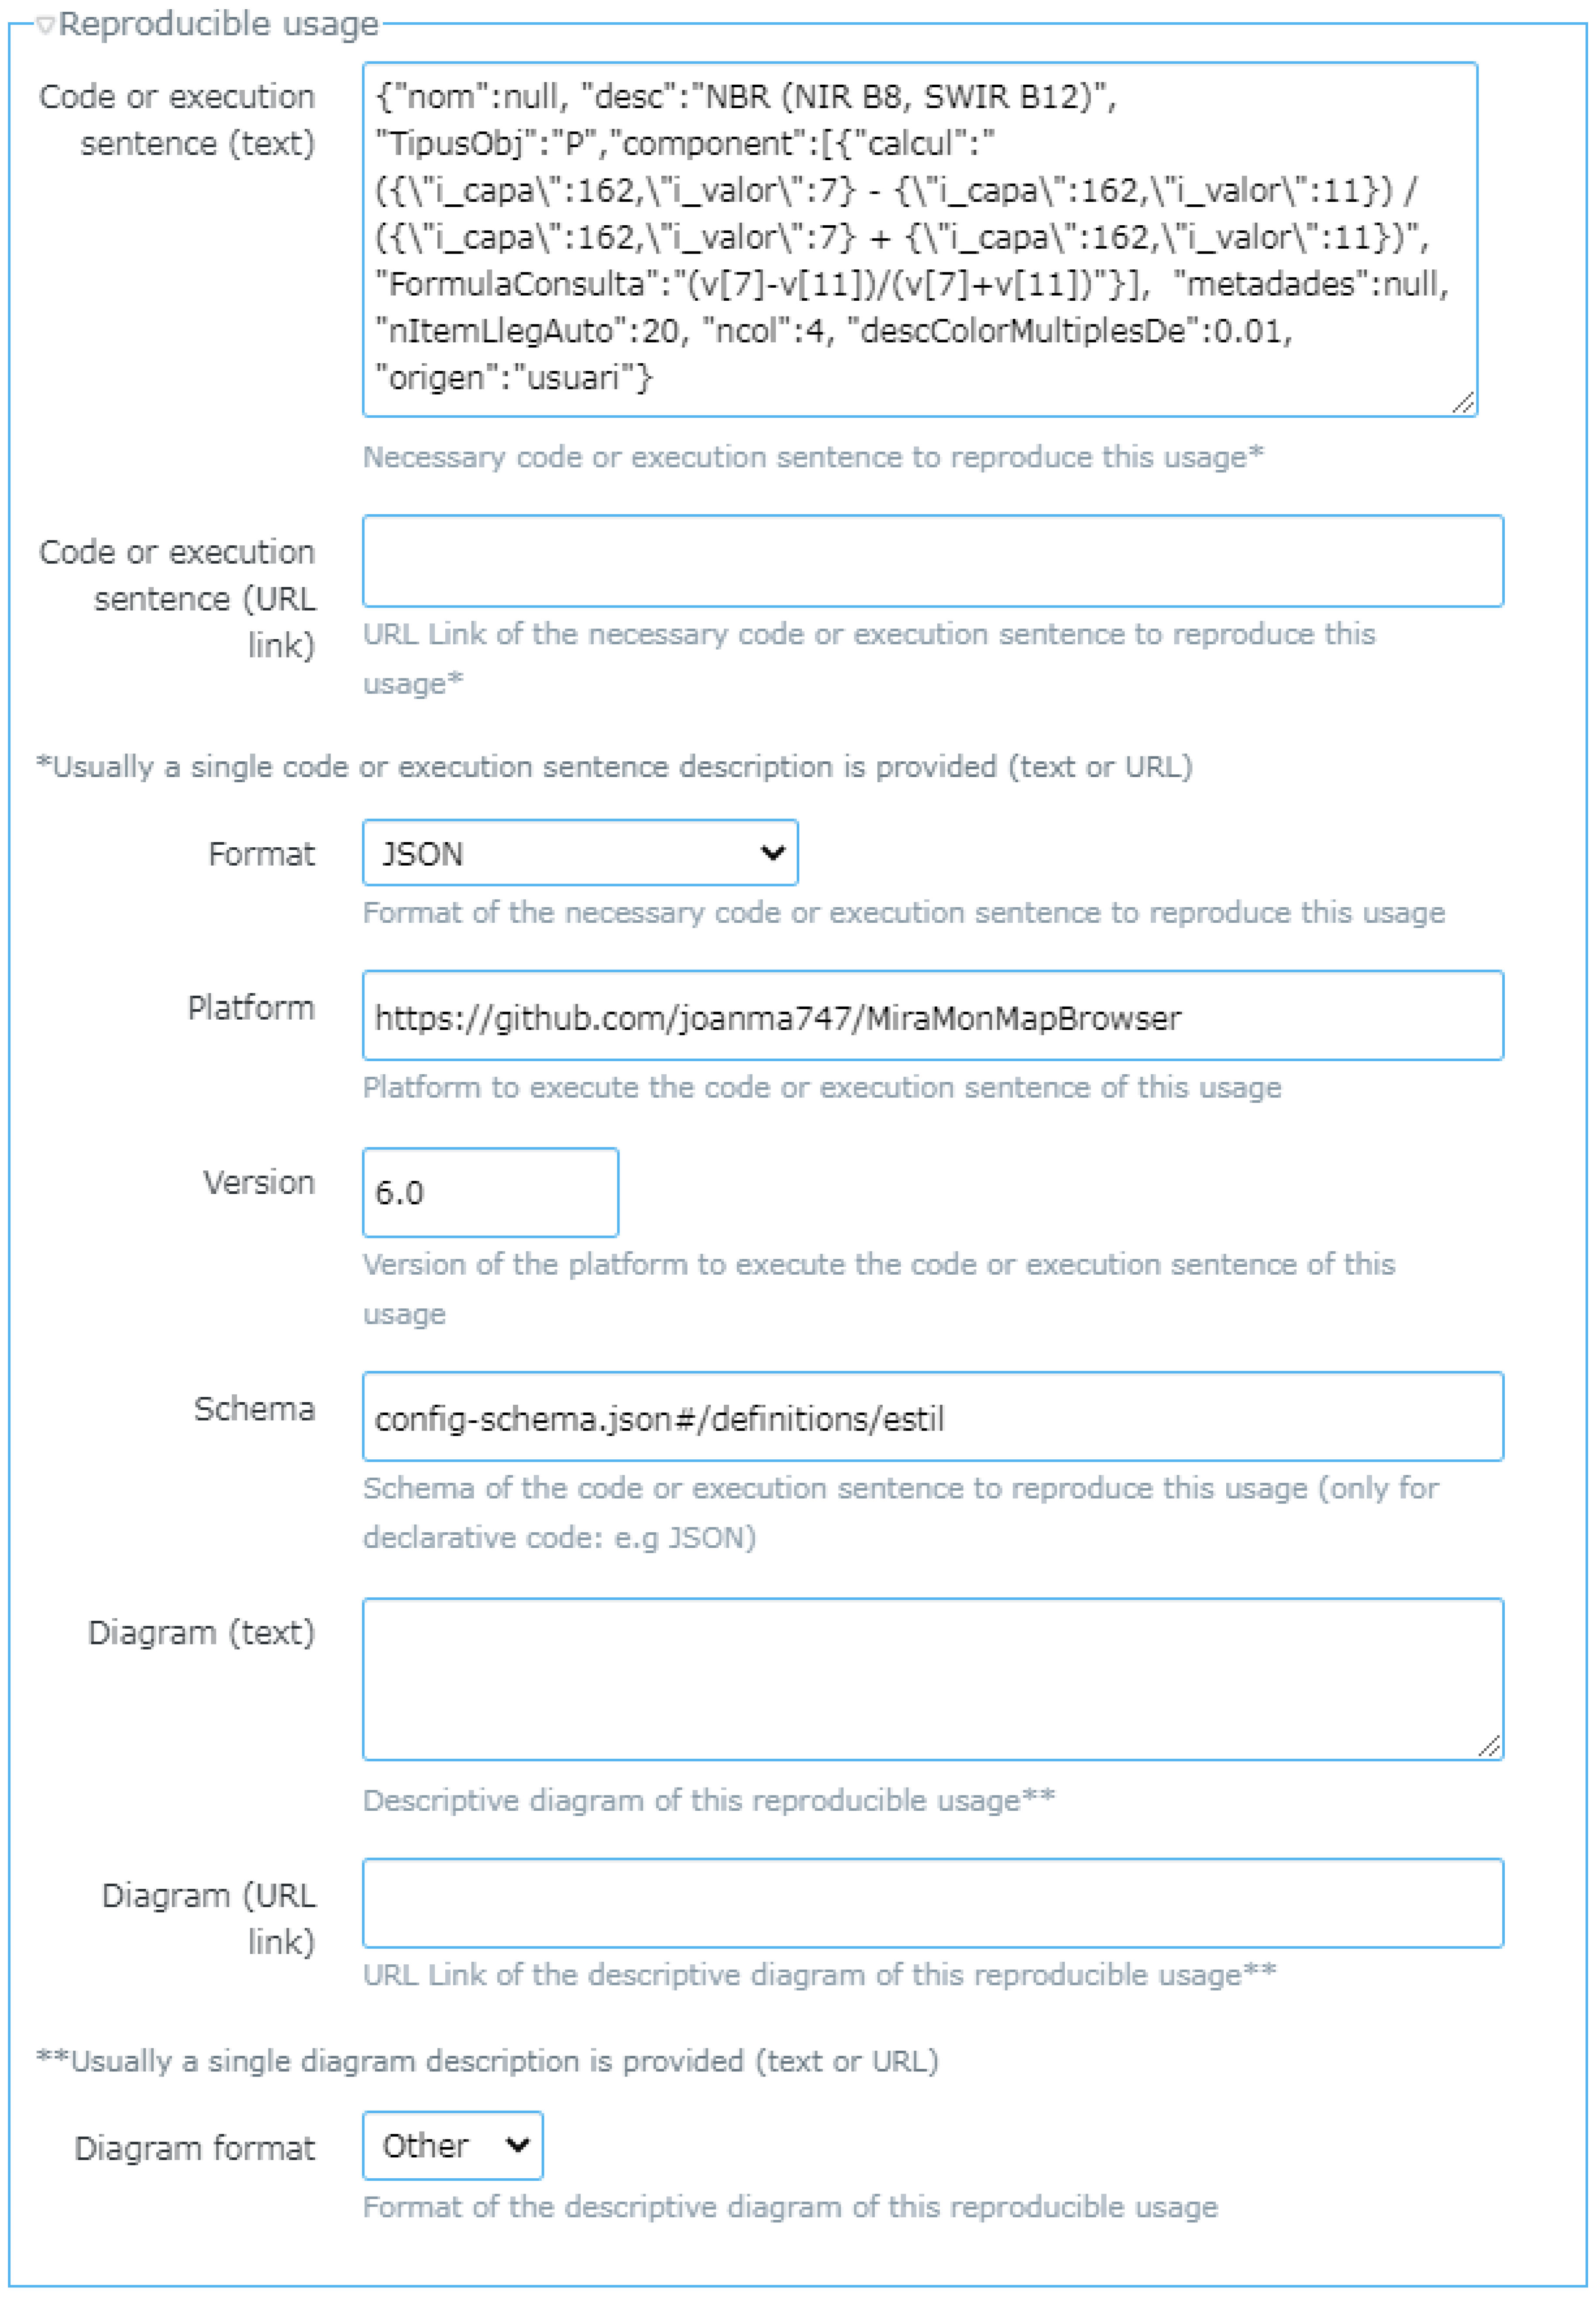
The user feedback page contains all the elements that can be documented and allows direct selection or creation of the related elements (i.e., citations or publications). In order to simplify the use of the form, a drop-down strategy is applied in order to easily fold or unfold sections. Empty sections are folded by default. When submitting the form, the necessary operation (create, update, or delete) is sent to the server side using an OGC WPS RESTful API. As explained in the previous section (see
Figure 3), the usage section in GUF has been extended to include reproducible usage and is implemented as seen in
Figure 7.
4.2. API to Interact with the Service
The server side is a Common Gateway Interface (CGI) program maintained as part of the MiraMon developments in the C language. Both the service and the client are managed by Internet Information Services version 8.5. The hardware running the services is hosted in CREAF facilities in a cluster of 6 identical computers with 6 databases configured to expose a single URL using Network Load Balance. A piece of software ensures that the 6 databases are constantly synchronized. The CGI implements the NiMMbus API.
The NiMMbus API is based on the CRUD (create, retrieve, update, and delete) four basic functions for persistent storage/management of objects (
https://en.wikipedia.org/wiki/Create,_read,_update_and_delete accessed on 4 March 2021). The API defines a set of object classes and provide the primary four CRUD operations plus some additions when considered necessary. In this way, it also mimics some RESTful design principles. The full NiMMbus API reference can be found in
https://github.com/grumets/nimmbus/tree/master/API (accessed on 4 March 2021), and is the API used by the JavaScript client used as an interface and described in the previous section.
The OGC is currently engaged in a process to transform the old Web services into Web APIs. The manner in which WPS will be transformed into a Web API is still under discussion. Meanwhile we are using some of the concepts in Representational State Transfer (REST) but we are also considering an easy-to-use approach for browsers based on GET requests. We will consider adopting the new OGC API Processes when it becomes available and approved. Currently, the NiMMbus API uses the OGC WPS 1.0 standard [
36] but with 2 significant modifications: 1/ WPS abstract model implemented as GET requests and 2/ asynchronous operations responding to a synchronization ID (equivalent to the “job id” introduced in OGC WPS 2.0 standard [
37]).
All requests are in key-value pair (KVP) and have three parameters: SERVICE=WPS, REQUEST=EXECUTE and IDENTIFIER=NB_{class_type}:{operation}. There are four class types to group requests related to a certain type: USER for requests to create, modify, validate,… a user; RESOURCE to create, modify, retrieve, enumerate,… resources in the system; SHARE to add, modify or remove the sharing of resources between users and finally TOKEN and SYNC that are used to execute tokens and determine the success of previous requests, respectively. All responses follow the WPS 1.0 specified XML syntax except the NB_RESOURCE:ENUMERATE request that follows ATOM syntax [
38] (that is ideal to enumerate a list of resources that match a query result). All responses follow the WPS 1.0 specified XML syntax for exceptions.
The Web API is a more flexible (but also more complex) alternative means for any Web application to interact with the server directly, creating its own independent client to define feedback elements, or integrating the client functions in any other software (e.g., in a desktop GIS metadata manager). The API can be used from any application such as a GIS desktop solution or a JavaScript client. When JavaScript is used, the developer needs to deal with responses to requests to feedback items encoded in XML and should generate a presentation themself. This guarantees full control over how the content is shown on screen, but it requires considerably more knowledge of JavaScript programming, including XML parsing and Asynchronous JavaScript And XML (AJAX) calls. To simplify the use of the API, a widget is also provided, and this is the easiest-to-use solution in most common cases.
4.3. JavaScript Widget for Easy Integration
A widget was developed to facilitate the addition of GUF in a HTTP Web portal for each resource. These resources can be part of a data catalogue or individual Web pages. Actually, a “resource” can be anything that has an identifier in the Web, but it is expected that resources have some spatial component (e.g., a geospatial dataset or a geospatial process generating datasets). Detailed instructions on how to integrate NiMMbus can be found in GitHub (
https://github.com/grumets/nimmbus/tree/master/GUF_integration accessed on 4 March 2021).
We adopted the same approach as ISO 19115 Geographic Information—Metadata, where resources are uniquely identified in the catalogue using a code (a.k.a. an identifier). This code needs to be unique in a codespace (e.g., an Internet domain name). The combination of code and codespace provides a global and unique identifier.
To integrate the widget in a portal, a simple three-step process is followed. First, the JavaScript library guf.js needs to be included in the HTML page, and secondly a division should be defined. Finally, the division needs to be filled in by the GUF Widget. There are several options for the widget, depending on the complexity needed:
Generic widget simple approach for feedback related to a single target resource, the simple function can be used: GUFShowFeedbackInHTMLDiv(). The parameters for the function should identify at least the division in the HTML, and the title, code, and codespace of the resource. Optional parameters are the language and access token type to allow smooth integration if SSO credentials are already validated.
Generic widget second approach for feedback related to several target resources, the function to be used is GUFShowFeedbackMultipleTargetsInHTMLDiv(). The only difference from the previous function is that an array of targets is used instead of a several parameters for a single target description. The same elements for each target should be described: Title, code and codespace, as well as the role of each of them (primary, secondary or supplementary).
Specific widget to share reproducible usage: there are two functions to be used, one for creating the feedback item which includes reproducible usage (GUFCreateFeedbackWithReproducibleUsage()), and another one to retrieve it (GUFShowPreviousFeedbackWithReproducicleUsageInHTMLDiv()). The integration is a bit more complex for the developer, but transparent to the user, who only triggers the NiMMbus from the portal, and then land to the usual feedback item page with some pre-loaded content (typically the code, platform and schema, as seen in
Figure 7).
In addition to the JavaScript functions used in the widget, a Cascading Style Sheet (CSS) is provided, to give developers control on the characteristics of the sections filled in by the widget, for example in order to harmonize with the style of the portal calling the widget. The list of the classes defined in guf.css stylesheet, and which part of the feedback item description they refer to, is described in the documentation in GitHub. Finally, some test pages have been created, to demonstrate how the widget is integrated and how the style/content customization can be applied.
Figure 8 show the usage of the widget in the main test page.
6. Discussion
Most of the time, user opinions on data products are only heard when producers actively elicit their needs, for example through questionnaires. Users should have not to wait until they are asked for this information, and can help each other by making public their feedback and knowledge. Supplementary data models, technical tools, and APIs can facilitate this publication, and thus help to support fitness-for-purpose assessment among the many geospatial resources now on offer. The models and tools presented here are designed to fill the gaps identified by Comber et al. [
42] for ensuring that data descriptions are more relevant to users:
Critiques of the data from academic and industrial papers: The GUF provides numerous opportunities to link metadata to publications of various types, to make continued linkages over the lifetime of a published dataset, and to facilitate direct access to the cited documents through use of DOIs and other resolvable links.
Expert opinions of relations to other datasets: The GUF permits exactly such networks of links to be built up by the use of secondary and supplementary targets. Maintenance of such links permits a much-improved process of data discovery and potentially allows datasets to be grouped according to the data against which they have been benchmarked, derived, or combined.
Experiential metadata: The GUF gives a wide range of opportunities for comments, usage reports, etc. to be associated with a dataset. Moreover, the extension permits the delivery of code and tools to process and visualize the data in reproducible ways; generating new information that incrementally creates knowledge by communicating methodologies and conclusions of studies. In other words, this allows to describe experiences of using the data, either organized from an application or disciplinary perspective.
These needs have been covered by the evolution of the OGC GUF standard. Since many producers generate and distribute ISO 19139 based geospatial metadata describing the resources, we recognize the value of aligning feedback to the ISO process. Actually, the Joint Advisory Group (JAG) was created with the mission of harmonizing ISO and OGC efforts and to proposing new working items to the ISO TC 211. Technically GUF reuses elements from ISO 19139, and GUF XML codification was done with the same methodology as ISO uses to transform UML models into XML schemas. That is why feedback item files have the look and feel of ISO XML documents.
Usually metadata records about a resource are created by the producer of the resource using ISO 19139 XML files, with a MD_Metadata root element. In GUF each feedback can be represented in an independent XML file with a GUF_FeedbackIteem root element. A new class could be created to integrate producerMetadata (MD_Metadata) and an array of feedbackItems (GUF_FeedbackItem) in a single document. Nevertheless, we think it is necessary to gather user feedback independently from the producer metadata to guarantee their independence and the transparency of the process.
We have demonstrated that, technically, the system can be integrated in different catalogues, no matter what type of data they are offering. It is possible to report feedback and knowledge on raster data (e.g., remote sensed), vector datasets (official street centerlines, crowdsourced OpenStreetMap) or in-situ data (e.g., observation datastreams), and even on more novel and unstructured content, as long as resources have global and unique identifiers. In fact, the system presented here was integrated in modeling tools (e.g.,
http://nextgeoss.itc.utwente.nl/ebv/ accessed 4 March 2021) as well as in nodes of a network graph (e.g.,
http://www.eneon.net/graph accessed 30 November 2019). We have demonstrated that the integration in web pages using the presented widget is simple and can be done in a couple of hours with minimum knowledge about HTML or JavaScript. It is also possible to integrate the system in desktop applications but this will require the use of the service API. This API gives more control on the information retrieved but requires more time and experience for integration.
To make the widget as natural and usable as possible, the amount of information presented and the aesthetics can be controlled by a CSS stylesheet. Some users of the system suggested that the presentation of the list of previous feedbacks could be improved by including a heading with summaries and aggregated information. An initial section may include overall ratings as well as the number of comments and references. In fact, a data model for feedback summaries was introduced in the official GUF standard but has not yet been implemented. Another suggestion for increasing usability was related to remote sensing time series. Initially, feedback was only associated to individual scenes of a time series, but for some products, there are so many scenes that it is rare to find two users interested in the same scene. By associating the time series identifier as a secondary target of feedback items, we were able to make feedback more visible to users. Finally, users have expressed the need for specifically responding to a feedback or knowledge item; a functionality which is foreseen in the official GUF model (adding dependencies between feedback items), but not yet implemented.
Motivating users to provide feedback and knowledge to the system is difficult and takes time. The incentives and barriers for participation have been recently studied in another form of distributed participation: The citizen science domain [
43]. Incentives and barriers can be understood following the theory of planned behavior that classifies the factors that facilitate participation in: Personal attitudes, normative forces, and constraint conditions [
44]. People may approach a participatory system out of technological curiosity, or a wish for fun or entertainment. However, they will only remain engaged with it if it provides a way to expand their skills, get attribution or satisfy their information needs and socialization demands. People contributing experiences and ideas about a dataset will expect some social recognition, but also a more direct response from the producers of the data. This could take the form of advice on how to solve an issue found on data, rectification of mistakes observed, direct access to more documentation or even free access to high resolution data or processing facilities. The lack of clarity on the attribution policies that obfuscates recognition could be a key barrier to users actively considering participation [
45].
Perhaps a better way to ensure that researchers and technicians openly approach a user feedback and knowledge system is to create a moral or legal obligation to do so. During the last years, the European Commission has promoted the adoption of open access for scientific research result [
46]. The obligation to make project results open is now part of EC research contracts, and dissemination efforts go beyond the scientific community. Some journals have also opened the peer review process and further changes in the landscape will emerge. We believe that more collaborative knowledge sharing and data user feedback should be part of this transformation and should be gradually accepted and morally valued by the community.
7. Conclusions
Despite the efforts made by standards organizations, such as the OGC Geospatial User Feedback and the W3C Dataset Usage Vocabulary, that define data models for interoperable exchange of user feedback attached to datasets, there are not many implementations that go beyond star ratings and comments. This paper covers this need by proposing a comprehensive implementation (covering a richer set of use cases) that can easily be integrated in existing Web data catalogues and data portals. The popularity of the Web APIs is fast growing because they facilitate a well-documented set of operations to interact with services. Unfortunately, implementing them on an HTML and JavaScript portal still requires advanced programming skills, in particular when dealing with asynchronous calls. JavaScript libraries responding to user events (e.g., mouse clicks) are a much easier option to implement and hide the complexities of the APIs. The implementation, integrated in the NEXTGEOSS data hub and community portals and in the GEOEssential dashboard, covers most of the identified use cases and demonstrates the validity of the data model.
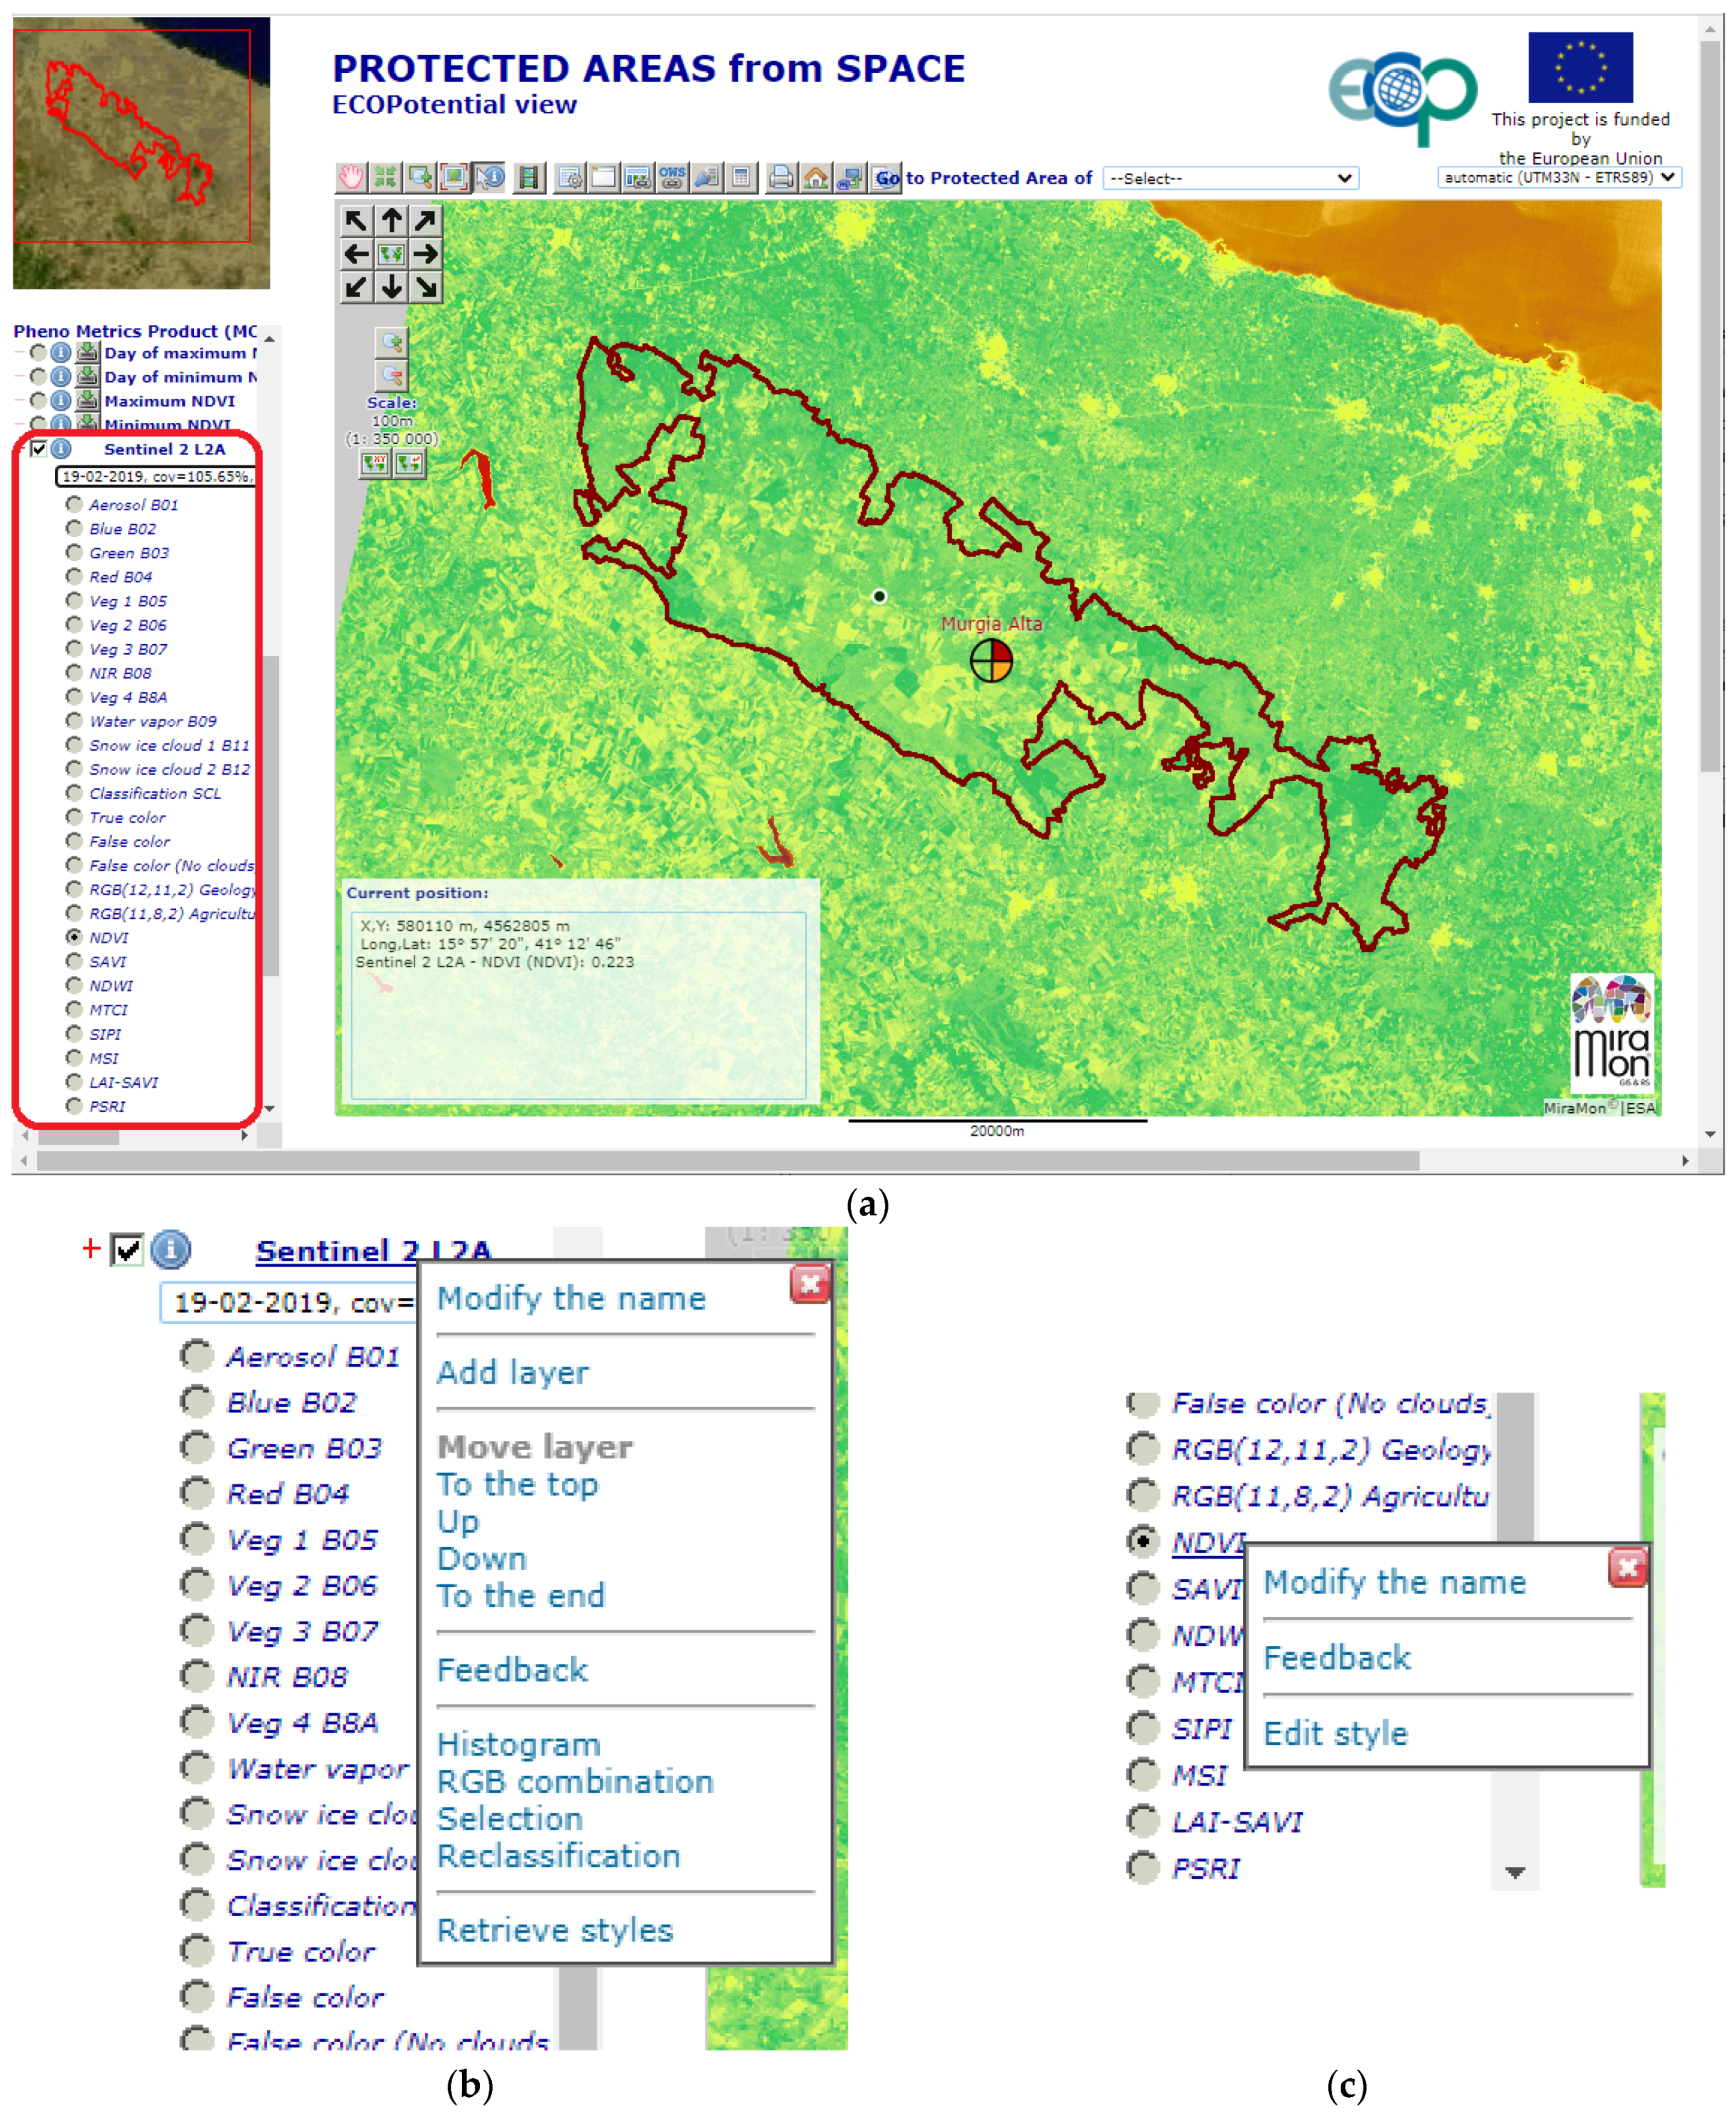
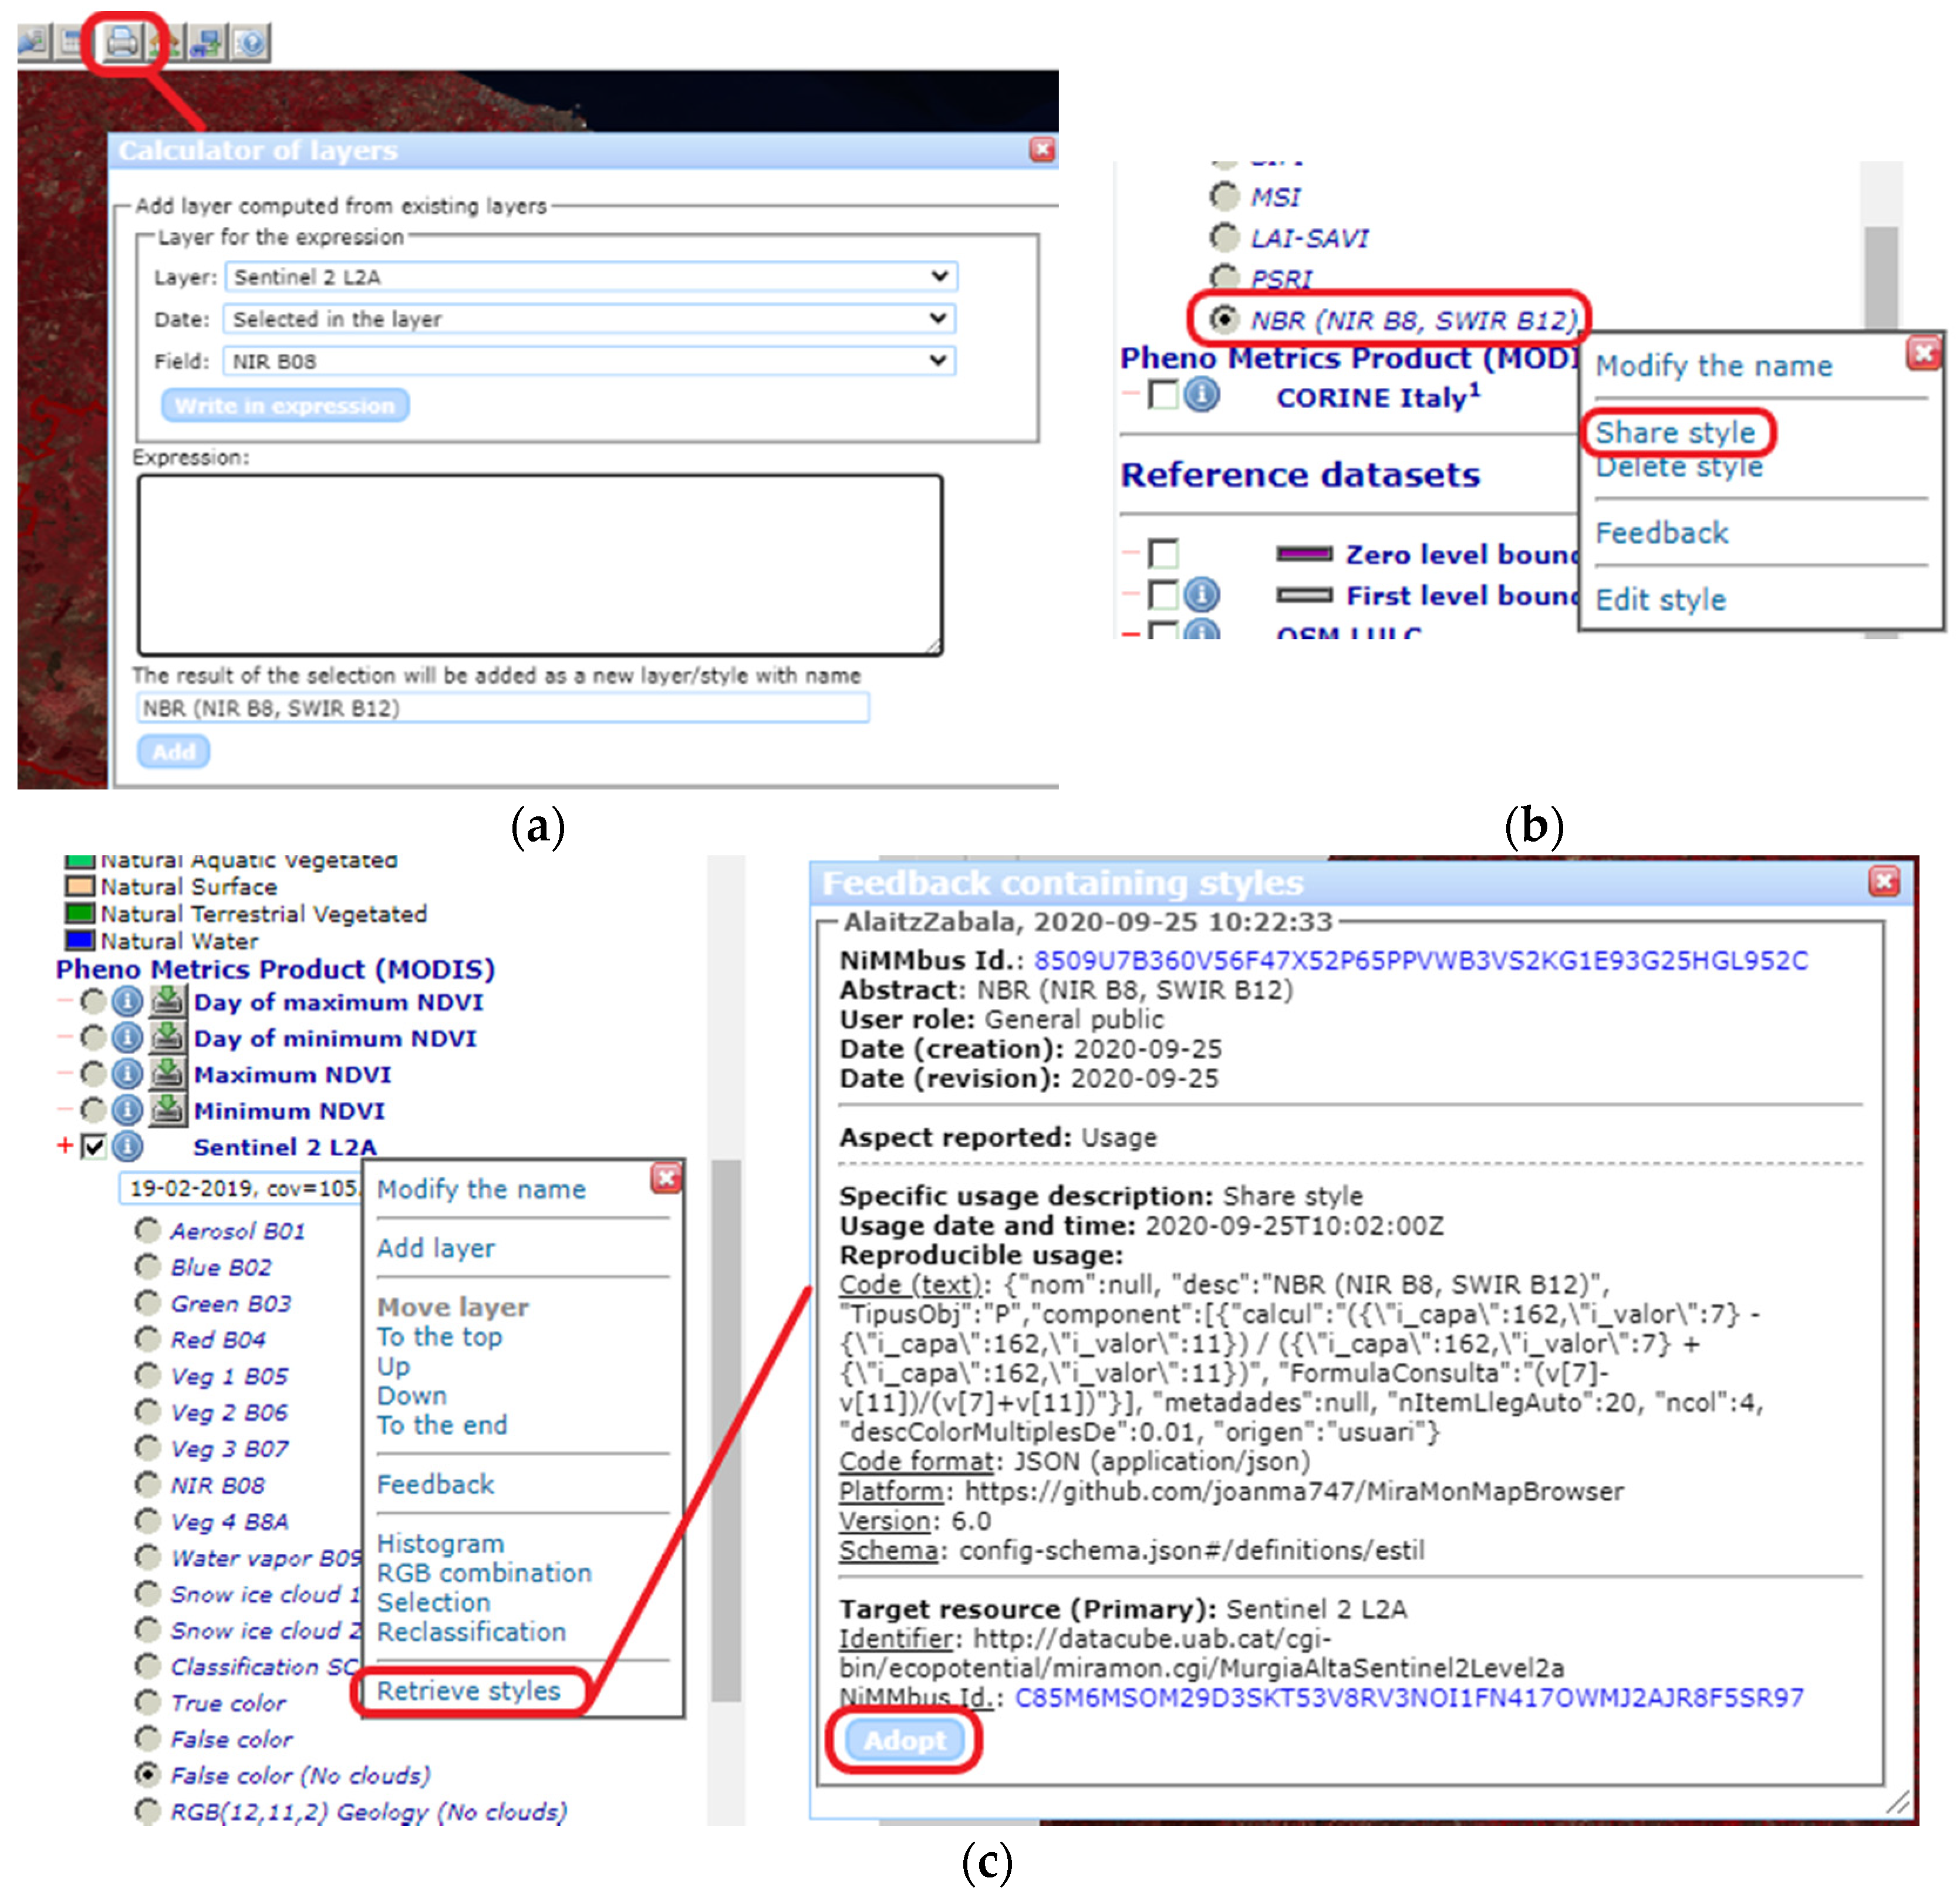
This paper demonstrates that, with minimum modifications, the user feedback model can be used to cover experiential metadata and knowledge. Following this approach, anyone using the same dataset can benefit from the previous knowledge created, can learn from previous experiences and can contribute to the repository of knowledge. Most of the official elements of the OGC GUF standard can be used to communicate knowledge, but, with the small modifications proposed, the data model is capable of making this description reproducible by others and conclusions testable. The implementation presented on top of the ECOPotential data portal illustrates how to share knowledge together with the operations that led to it in different protected areas.
The approach presented here supports the collaborative process where users and groups incrementally and dynamically create knowledge elements and link them to the data sources. It is complementary to the more static approach proposed by other knowledge bases (such as the GEOSS Knowledge hub) where knowledge elements are aggregated and distributed as a package. Traditional producer information is thus enriched by and connected to dynamic user reports, allowing fuller evaluation of datasets’ relevance and resulting in enhanced traceability, trustworthiness and transparency within GEOSS.
In the future, other extensions of the GUF model can be proposed for example to explore how the presented feedback mechanism can be combined with more classical approaches that producers apply to find out about new usages of the data; such as responses to questionnaires sent to customers or information collected in user support lines. Another extension could deal with the capability to chain feedback elements to build a narrative composed by a sequence of steps (feedback item workflows) or to build a story map created as a sequence of data views, analytical operations and results.
Regarding the implementation, the use of co-design methodologies with broader involvement of users is necessary to improve the usability of the interfaces and prioritize their favorite functionalities. These conversations can also result in the detection of new requirements not covered by the current model which will lead to further GUF extensions. All efforts will be in vain if we cannot keep users motivated. There is a need for applying social science theory on behavior habits to study the factors that increase motivation and to remove participation barriers. The NiMMbus system will be constantly promoted in different context to extend the pool of users contributing feedback and collaboratively creating knowledge.


