
The Extended Concept of the Map in View of Modern Geoinformation Products


1
Faculty od Geodesy and Cartography, Warsaw University of Technology, 00-661 Warszawa, Poland
2
Department of Geodesy and Geoinformation/Research Division Cartography, Vienna University of Technology, A-1040 Vienna, Austria
*
Author to whom correspondence should be addressed.
ISPRS Int. J. Geo-Inf. 2021, 10(3), 142; https://0-doi-org.brum.beds.ac.uk/10.3390/ijgi10030142
Submission received: 21 January 2021
/
Revised: 24 February 2021
/
Accepted: 1 March 2021
/
Published: 5 March 2021
Abstract
:In the face of strikingly intense technological development, there have been significant discrepancies in the understanding of the concept of the map; an understanding that is fundamental to cartography and, more broadly, GIScience. The development of electronic products based on geoinformation has caused a growing need for the systematization of basic concepts, including defining what a map is. In particular, the modification of the idea of the map may profoundly influence the future development of cartography. The comprehensive and innovative use of maps, for example, in location-based service (LBS) applications, may contribute to more in-depth analyses in this area. This article examines how the concept of how the map is used in technological or scientific literature about the latest geoinformation applications, as well as analyzing the survey results that confirm the change in social perception of the concept of the map in cartography. The article also refers to the role of the map in the process of indirect cognition and understanding of geographical space—cognition realized through maps. A social understanding of mapping concepts is evolving and covers the entire spectrum of geoinformation products. It seems that the latest geoinformation solutions, such as navigation applications and, in particular, applications supporting the movement of autonomous vehicles (e.g., self-driving cars), have had a particular impact on the concept of the map. This is confirmed by the results of a survey conducted by the authors on a group of nearly 900 respondents from a variety of countries. The vast majority of users are convinced that the contemporary understanding of the concept of the map is a long way from the classic definition of this concept. Therefore, in the opinion of the authors of this article, it is worth undertaking research that will become a starting point for a discussion about the broader definition of the map in GIScience.
1. Introduction
There are many contexts in which the terms “map” and “mapping” are used, for example, in mathematics, logic, biology, cartography, robotics, and computer technology. These terms are fundamental for cartography, as it is this discipline that deals with the art, science, and technology of making and using maps [1]. The current ICA (International Cartographic Association) definition of a map is as follows: “a symbolized representation of geographical reality representing selected features or characteristics, resulting from the creative effort of its author’s execution of choices, and is designed for use when a spatial relationship is of primary relevance”. However, very often one can still find definitions similar to the following: “a map: graphic representation, drawn to scale and usually on a flat surface, of features—for example, geographical, geological, or geopolitical—of an area of the Earth or any other celestial body” [2].
The broad meanings of the terms “map” and “mapping” are worth analyzing because it also raises the possibility of a universal look at the map in the cartographic sense. Due to limitations and assumptions, however, this paper mainly focuses on the cartographic/geoinformation context.
Princeton’s WordNet [3] defines mapping as “a mathematical relation such that each element of a given set (the domain of the function) is associated with an element of another set (the range of the function)”. Mapping in mathematics “applies to any set: a collection of objects, such as all whole numbers, all the points on a line, or all those inside a circle” [4]. Based on studies in mathematics (e.g., [5]), we can also conclude that “a map is often associated with some structure, particularly a set constituting the codomain”.
In cartographic theory, the term “map” is often used as a synonym for morphism or arrow; thus, it is more general than function [6]. A map is usually the result of mapping [7,8]. A specific case of mapping is cartographic modeling, in which objects and phenomena in space (usually geographical) are assigned their representations in such a way as to be able to analyze the spatial relationships between them. Although, it should be noted that the concept of cartographic modeling has, so far, been considered in a narrow sense, often in the context of so-called Map Algebra, a vocabulary and conceptual framework for classifying ways to combine map data to produce new maps [9]. In this work, we will use the concept of cartographic modeling in a broader sense as a subset of the process of conceptual modeling defined in ISO 19101. According to Baranowski, Gotlib, and Olszewski [10,11], cartographic modeling should be understood both as the process of creating a conceptual model of space and as the process of modeling cartographic presentation. The fundamental advantage of cartographic modeling is that a map, despite a significant reduction in spatial dimensions compared to reality, allows the mutual distribution of important objects and phenomena to be shown and analyzed regardless of the size of the modeled area [12].
In the age of the Industry 4.0 revolution and the emerging geoinformation society, it is not only cartographers who define the map concept or its essence, function, and meaning but also the users of various geoinformation products. The map, understood as a model, enables not only the methodical inventorying of the surrounding space but also its changes to be forecast, as well as enabling its analysis, multi-criteria evaluation, and understanding. Despite technological progress, the essence of the cartographic method for modeling space has not changed, and the ability to abstract and extract spatial properties at a given level of conceptual generalization still plays a focal role. However, new challenges emerge, such as those resulting from the development and dissemination of VR technology. So far, cartography has visualized spatial data from the outside, that is, from a third-person perspective, while users of VR (Virtual Reality) applications experience immersive environments rather from the inside, that is, from the first-person viewpoint [13]. The concept of abstraction in cartography is also taking on a new meaning as the representation comes closer and closer to the original in terms of both scale and appearance.
The scope of the methodology and tasks facing modern cartography hinges on the definition of the map and its purpose. If the map is defined only as a graphic representation of reality, then the development of the methodology will focus on visualization. In this case, the emphasis is on developing a clear graphic presentation. The interpretation of such a map requires a visual analysis by the user. However, if we conclude that the purpose of the map is to provide information about geographic space using sound, or text, or even only bits, if we consider the map as a structure for providing information, then cartographic methodology will begin to develop in a new direction in line with the latest technological trends. This is, of course, just a simplified example. The ongoing development of cartographic products raises the question as to whether the development of geoinformatics, the changes in recording information about space (a digital form using spatial databases), and communication methods alter the essence of cartographic activity. Is it possible to claim that the essence of modeling remains unchanged despite the revolutionary development of geoinformation/IT tools that automate the process of cartographic modeling?
The authors of this article wanted to research how the development of modern digital technologies, especially geoinformation technologies, affects the understanding of what a map is. It is interesting, both from a practical and from a scientific perspective, to determine whether the map is now associated with both a graphic image and a visualization process, and if so, to what extent. The authors have hypothesized that the map concept employed in the field of geoinformation is used, in practice, very widely and not only in the context of visualization; however, at the same time, there are significant discrepancies in its understanding. If this is true, it means that efforts should be made to refine and universally define the concept of the map in a way that accounts for the extremely rapidly changing technologies. The purpose of the analyses carried out by this article’s authors was to join the discussion on the theoretical foundations of cartography and contribute to the in-depth research on the essence of the modern map, as well as attempting to formulate some universal design principles that are common to both traditional and the most innovative cartographic products, for example, maps for autonomous navigation. It is also important to analyze the perception of the role played by the map and the way it is understood in social terms, as well as juxtaposing academic definitions with the map user’s understanding. Due to the development of the information society and the widespread use of geoinformation technologies, it is also interesting to ask about the role and nature of the contemporary map. Is it a source of the objective cognition of space or a subjective reflection of this space that carries the message of its creator?
Analyzing the way in which location-based service (LBS) applications operate on spatial information (acquisition, processing, and transferring) should help in the debate on map definition.
2. Related Works
Andrews [14] presented as many as 321 different definitions for the term “map”, most of which include the following wording: “[the] map is a representation of […]”. Around 80% of these definitions discuss “visual representation” or “graphic representation”, but some deal with representations or models in a more generalized sense without referring to visualization. Kraak and Fabrikant [15] also raised this issue, writing that a map plays the role of “a visual interface to a virtual or real environment, and shows only a selection, thus an abstraction, of the envisaged environment”.
Over thirty years ago, Visvalingam [16] stated that spatial databases are not just data repositories but rather digital models of geographical space. Spatial databases constitute a holistic model of geographical space. Furthermore, Clarke, Johnson, and Trainor [17] have now claimed that “maps are models of the earth because they are simplified abstractions of earth’s attributes distributed over space”. The authors also assert that “maps are components in data fusion in that they are a chief means to relate data by colocation in time and space, and that they provide important inputs for models that can be descriptive, interpretive, predictive, and probabilistic”. However, the limitations imposed by the authors in modeling only the Earth are debatable since the cartographic modeling process can be used to abstract objects, phenomena, and processes in a given space; for example, celestial bodies or imagined worlds in computer games, etcetera.
Cartwright and Ruas [18] claimed that “the increasing availability of data about the world, and maps that represent this data, creates both a tremendous potential source of knowledge, but also generates the need for methods, models, and expertise to turn this data into usable information to gain new knowledge about the world […]”.
In a general, mathematical sense, mapping is a transformation from one form to another. According to Rystedt [7], a map should be the result of mapping, and these terms should be considered in a geospatial context. Geographic databases and virtual realities are the results of a mapping process, which is a transformation from observation to a digital representation.
Wood [19] states that “cartography should be defined as a unique facility for the creation and manipulation of visual (or virtual) representations of geospace […] to permit the exploration, analysis, comprehension, and communication of information about that space”. While Gartner [20] claimed that “cartographic principles remain unchanged, the most important one being that maps are an abstraction of reality”.
There appears to be a significant difference between these approaches. The second one is more universal, disentangling the concept of the map from a form of cartographic communication, as well as justifying the classification of many new digital products as maps.
This issue of defining the map was also discussed in research by Harley [21], Robinson et al. [22], Kraak and Ormeling [23], Sismondo and Chrisman [24], Jacob [25], and Kitchin and Dodge [26]. All of these works, to a greater or lesser degree, associate cartography with visualization.
What seems to remain unquestioned is that the map is a model of reality, a concept that dates back as far as the work of Board [27] and Kolácný [28]. However, over recent decades, the idea has evolved, both in its essence and in its significance. A map is a model with specific characteristics that distinguish it from other models [16,29]. Spatial models are almost exclusively recorded using technological or IT methods, and their creation conforms to the same—or similar—rules as any other IT product.
The process of cartographic modeling should be equated with emphasizing the multiscale relations between phenomena modeled at different levels of generalization [29]. It is close to the approach used in data mining techniques: data processing serves to explicitly reveal connections and relationships that occur implicitly in the source database. This allows us to state that the goal of cartography is to model space and not only to visualize spatial data using defined libraries of graphic symbols.
Lapaine [8] proposed his own definition for cartographic mapping, being a “process that associates a set of spatially related data with another set called a representation or model or map while preserving spatial arrangements and by simplifying detail”. It should be noted that this is a universal definition of a map, which does not identify the mapping process with the visualization of spatial data.
The importance of non-graphical forms of cartographic model representation is particularly evident in LBS applications, especially for autonomous navigation systems.
Vardhan [30] argues that “in this era of autonomous vehicles, where machines and robots need to make decisions on roads, we need a new set of maps, purposefully built for robotic systems”. The development of autonomous vehicle (AV) technology also necessitates a reflection on the cartography area. The map is one of the key components of such systems. Imagine something similar to that used in standard car navigation applications, only with much higher resolution, and the creation of the vehicle’s surroundings in real mode, are both used (HD Maps). In most cases, the map used to be a product whose end-user was a human being; but in this case, the map is to be used by a machine/computer. From the perspective of cartographic theory, this poses new methodological challenges. To what extent are we dealing with a map, and to what extent solely with data? The technical literature or publicity material provided by the companies creating systems for autonomous vehicles commonly uses the terms “HD Map” or “map data” [31,32].
The following interesting view on the map concept was presented by Chellapilla:
- (1)
- Mapping as pre-computation: from self-driving technology, the mapping operation includes everything we can do to pre-compute things before the AV starts driving.
- (2)
- Map as a unique sensor: at runtime, the map is viewed by the autonomy system as a sensor with unique perception and prediction capabilities.
- (3)
- Map as a shared data structure that lives both in the cloud and also docked in each of the AVs. [33]
Other interesting considerations on the connection between modern geoinformation products and cartography are presented in [13]. In their research, the authors analyze VR technology, which may appear at first to be a far cry from the principles of cartographic presentations. They focus on the issue of scale, which, in this case, can be described as 1:1, and argue that geovisualization immersive virtual environments should be objects of cartographic research. Therefore, in research in the field of cartography and broadly geoinformation, particular attention should be paid to this type of product and its impact on changes in the social perception of the concept of the map.
3. Research Methodology
The inspiration for this research came from long-term observations of market trends in new geoinformation products, following cartographic literature, and repeated discussions on the importance of cartography and the concept of the map within the scientific milieu and the production environment of cartographers and geoinformation specialists. Despite the unprecedented rate of development of products that provide information about space, there has been very little, if any, proportional increase in the number of cartographic publications or cartographic research teams. The mere number of scientific journals with the word “cartography” in the title confirms this, as the favored expression is either the broader concept of “geoinformation” or “GIScience”.
With these observations as a starting point, the authors adopted the following research methodology: first, various definitions used in cartography and beyond for the word “map” were reviewed. An analysis of all cartographic products, including the latest, is an enormous and time-consuming task that goes beyond the first planned stage of this research. Therefore, the authors decided to, first, analyze those most recent products that had undergone the most dynamic changes and that had strong links to the latest technological trends (big data, cloud computing, augmented reality, Internet of Things, artificial intelligence). These products included location-based services [34]. In this group, navigation systems—the most innovative of which are car navigation systems without a driver—received the most attention. The use of these systems has not become ubiquitous yet, but the world’s most significant car and IT companies (Google, Tesla, BMW, Audi, Nissan, Toyota, NVIDIA, Microsoft, Intel, TomTom, Here, etc.) are currently researching this area. In the authors’ research, this constituted a case study. The authors assumed that the recent period of technological development has often seen revolutionary changes, first in enterprises, and only then followed by the development of pertinent scientific theories. Thus, the authors decided to review technical and popular science publications issued by companies that create innovative navigation solutions.
On the other hand, the authors also assumed that when discussing such a widely used concept as the map, it is also necessary to analyze its contemporary social perception. Therefore, the authors devised a survey that was initially carried out on a group of several hundred people from Poland. Conducting preliminary research allowed a hypothesis to be formulated regarding the broad understanding of the term “map” by people who were not professional cartographers, as well as by specialists in this field. Because the survey was conducted only among Polish-speaking people, verification of the research hypotheses required a significant expansion of the group of respondents. The authors decided to develop three additional language versions of the survey for people who speak English, German, and Chinese. The German language was selected as a result of an Austrian university’s inclusion in the research, while English was chosen as it serves as the primary language of science and is used globally. The authors considered the Chinese questionnaire to be supplementary; it allowed for preliminary checks on whether there were significant differences in map perception outside European countries and in a language that was completely different and outside the Indo-European family. It also acted as an introduction to broader future research. After the analysis, the authors decided to show these studies at the present stage. The research carried out in the second phase not only allowed the initial research concepts to be verified but also an introduction to future broader research of the analysis of cultural and linguistic similarities and differences related to the social perception of the map concept.
The authors began their research by surveying a group of their students, as well as scientists from their universities and friends. An online link to the survey was also made available on internal cartographic forums. With the research being conducted remotely and anonymously, the questions, content, and form of the online survey were checked with a team from applied social sciences and approved by the ethics board.
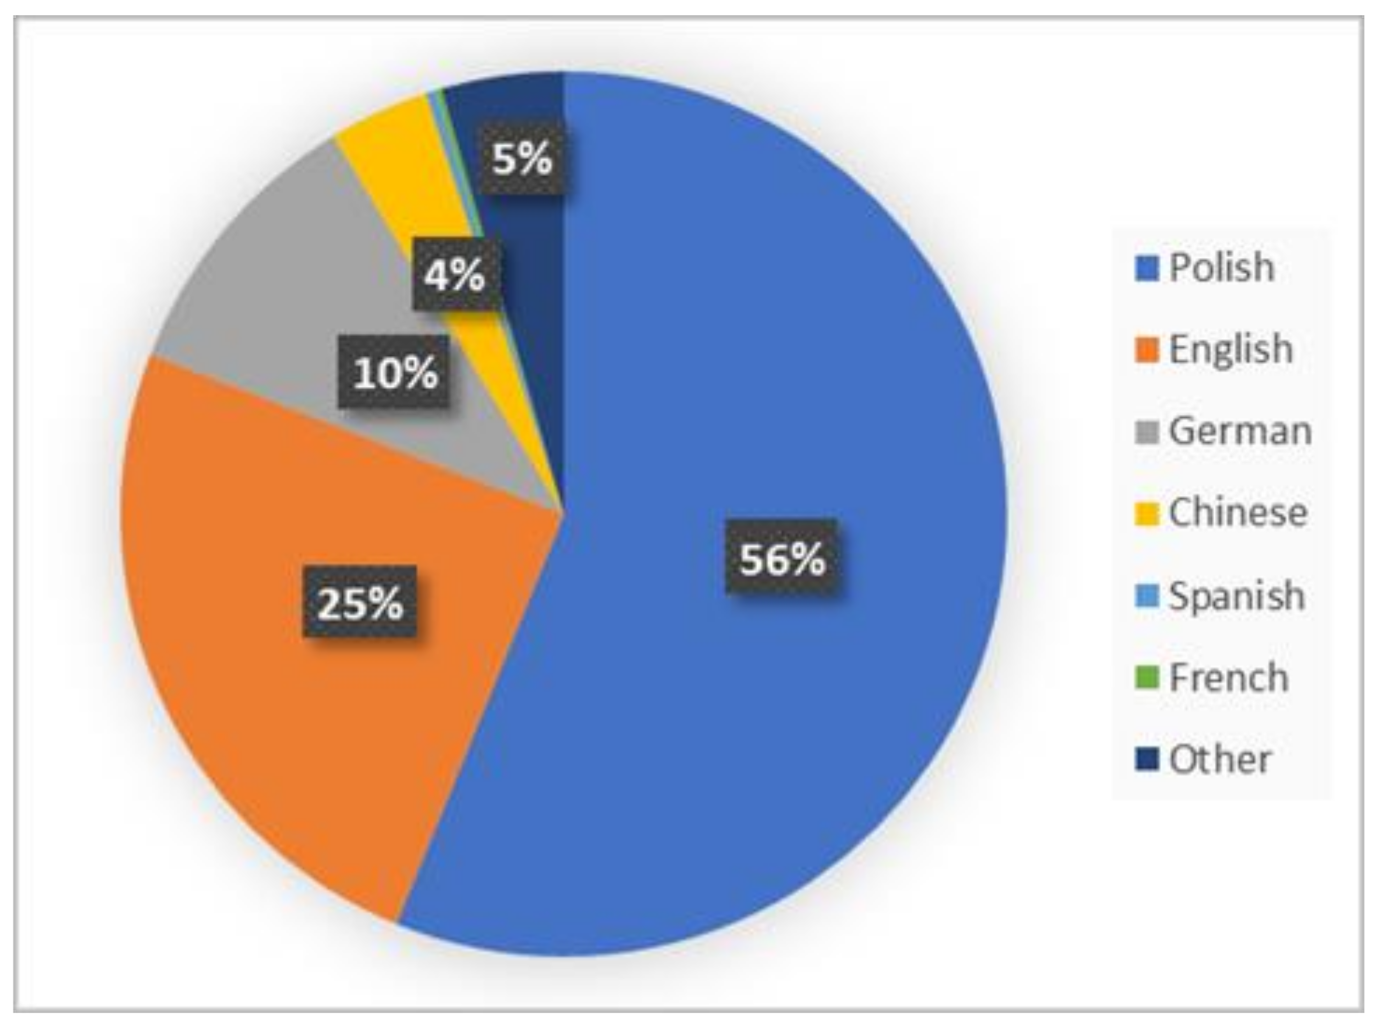
The first phase of the research was carried out by the Warsaw University of Technology (WUT) on a sample of people from Poland between November 2018 and April 2019; while the second phase of the survey was carried out in cooperation with the Vienna University of Technology (TU Wien) between March 2020 and April 2020 on a sample of people from many other countries. Research questionnaires are still available online, and the research is continuing. The participation of language groups in the survey is shown in Figure 1.
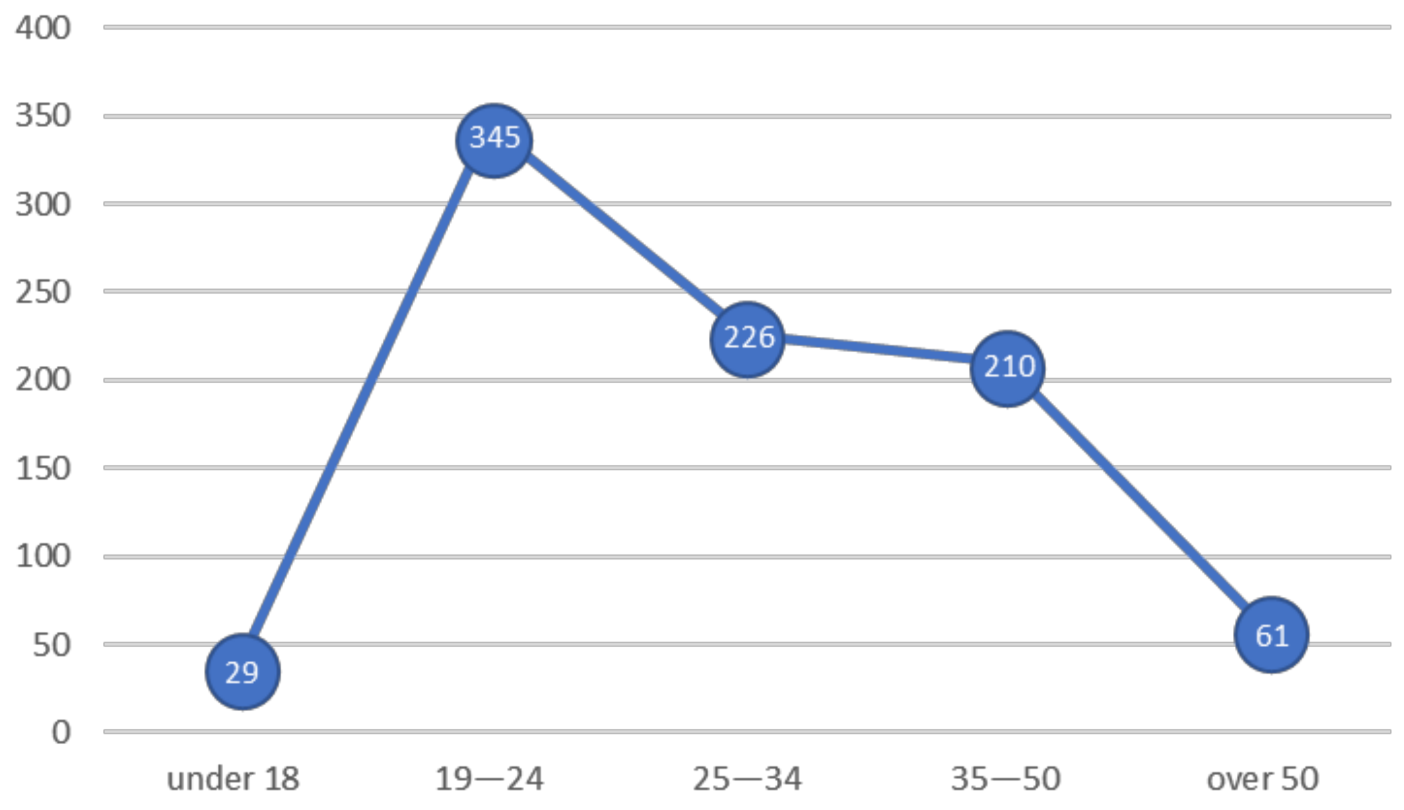
A greater number of language groups are presented in the diagram than there were language versions of the questionnaire, as people from a greater number of countries participated in the study. In the first phase, students from several Polish universities, high school students, professional cartographers and geoinformation experts, working people, and retirees were encouraged to participate in the survey. In the second phase, the research focused on, among others, students from TU Wien university, professional cartographers and geoinformation experts from various universities around the world, as well as users of social networking sites related to geoinformation applications (mainly geoawesomeness.com and related Facebook, Twitter, LinkedIn pages). A total of 874 people took part in the survey. Both professionals dealing with cartography (49%) and non-professionals (51%) were part of the research. Nearly half of the participants (49%) “often use analog maps” and 82% “often use digital maps”. Nearly 42% of participants were women, and 59% were men. Five hundred fifty-three respondents (63%) held a university degree. One-third of respondents dealt with IT (in a broad sense), and every third participant had an engineering education. The age distribution of participants is presented in Figure 2. All age groups were represented, but the vast majority of users were in the range of 19–50 years, with the largest group being students.
The respondents answered the following questions:
- Whether giving voice instructions or graphical navigation instructions (e.g., turn right, go straight, etc.), does your navigation system use a map?
- Do you think blind people can use a map?
- Do you think the autopilot uses a map to control the flight?
- Do you think a map can be three-dimensional?
- Do you think that autonomous cars (self-driving cars) need a map to move correctly?
- In your opinion, can a map be virtual, i.e., not have a physical form, e.g., paper?
- Do you think that it is possible to use a map in a navigation system without looking at a screen?
- Do you think a map is an objective or a subjective reflection of reality by the cartographer?
- Please assess which product can be considered, in your opinion, as a map, which uses a map and which cannot be considered a map?
A list to choose from:
Google Maps Portal; Database with the location of roads, addresses, and road signs used by the car navigation application; Satellite image of the Earth’s surface; Photo of the city taken from a tall building; Schema of a metro line; Architectural and constructional design of the building; Illustration showing historical changes in the country’s borders in a school textbook; Drawing of ski trails on an information board in the mountains; Paper road atlas; GPS-based application supporting a tourist’s movements in the mountains; Dynamic visualization overtime of the weather forecast showing expected rainfall; Voice guide advising a tourist on the route and describing the monuments and views on the way; Car navigation application; Globe showing the countries of the world.
The respondents had to answer “Yes”, “No”, “I don’t know”, or “It depends” for the first eight questions. For the ninth question, a list of products was given, and respondents had to choose one of four answers: “Can be considered a map”, “Uses a map”, “Cannot be considered a map”, or “I don’t know”, The products mentioned in this question were selected in such a way that not all were related to maps; in some cases, these products were very far removed from cartography. This approach limited the set of suggestions available for each of the answers the users responded to.
In addition to simple answers (selection from the list), respondents could present their views in the form of an open comment (this was usually possible after choosing the “It depends” option). Participants in the research could also express their views on the definition of the concept of the map. This option was used unexpectedly often by the respondents who spoke English, German, Chinese, and Polish.
The remaining questions were aimed at defining age, gender, language used, education, and experience in using maps. These were standard questions, constituting research metrics that were necessary to determine the demographic and social characteristics of the respondent and the statement. A potential effect of these characteristics on the expressed views was assumed”.
The research team conducted a series of discussions that preceded the process of defining these questions. The team hypothesized that new geoinformation products, particularly modern navigation systems, have broadened the past understanding of the term “map” (i.e., that from several years or decades ago). The literature analyses, including the vocabulary used in technological studies, confirmed this. Consequently, the authors decided to ask questions (1–8) that were related to LBS products and products that deviated from the classic definition of a map as a graphic image on a plane with a scale. The selected questions were thought-provoking, without obvious answers, and devised so that negative answers were produced among respondents with a predominantly classical approach to the concept of the map in cartography. At the same time, question number 9 presented a range of products associated with spatial presentation, but that partially deviated from even the broad understanding of the cartographic concept of a map. To some extent, these questions were to enable control over the consistency of the answers to questions 1 to 8 and, at the same time, divert the respondents’ attention from concentrating on LBS-related products. The list of products in question 8, resulted from previous research on selecting cartographic modeling features, presented, for example, in Baranowski et al. [10].
4. Results and Discussion
4.1. Results of the Questionnaires: The Multi-Choice Questions
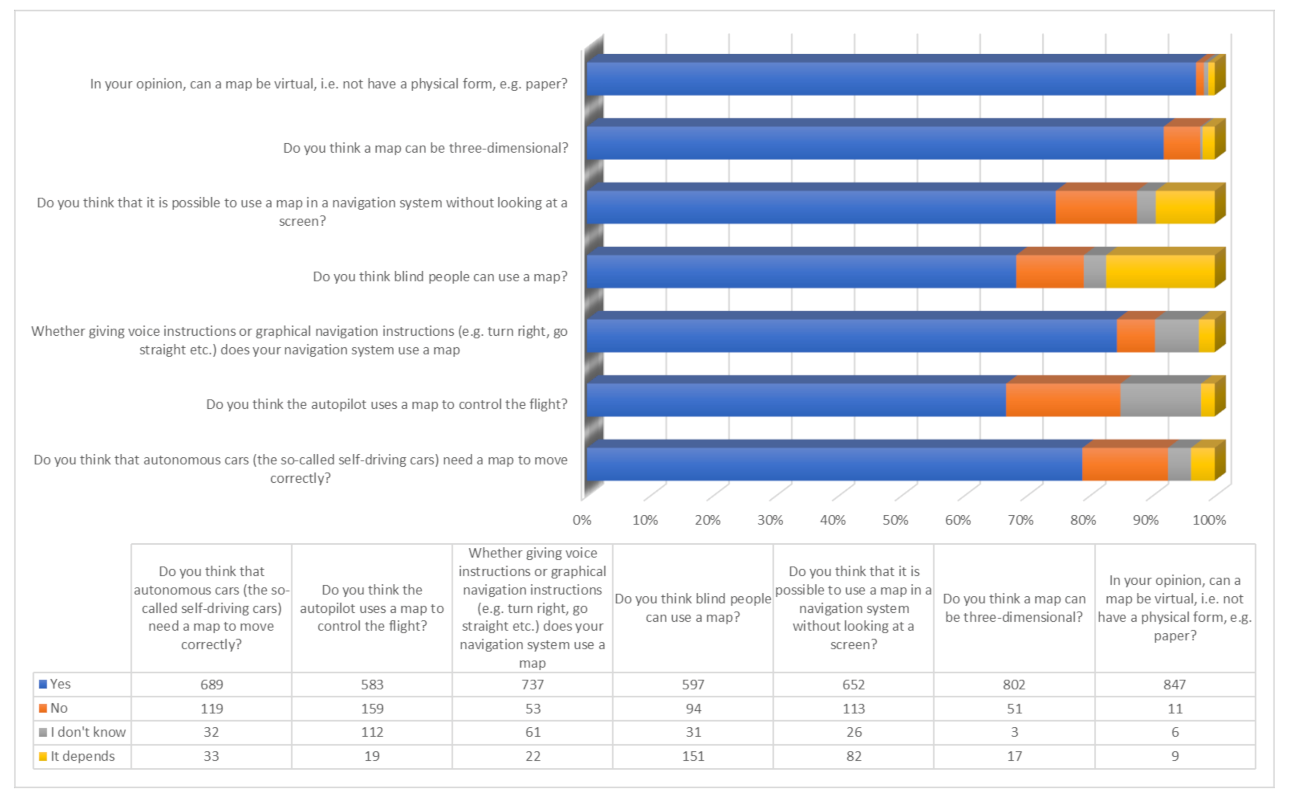
Figure 3 presents a summary of the answers to the first five key questions and two additional questions.
It is worth paying attention to several of the results. The research showed that almost three-quarters of respondents believed that they could use a car navigation system without looking at the screen. Nearly two-thirds of respondents believed that the visually impaired could use a map. The same number of respondents stated that an airplane autopilot also uses a map. The vast majority of respondents (as many as 689, nearly 80%) claimed that autonomous cars need a map to drive correctly. Note that the vast majority of respondents concluded that a map could be three-dimensional (91%) as well as virtual (96.8% of respondents).
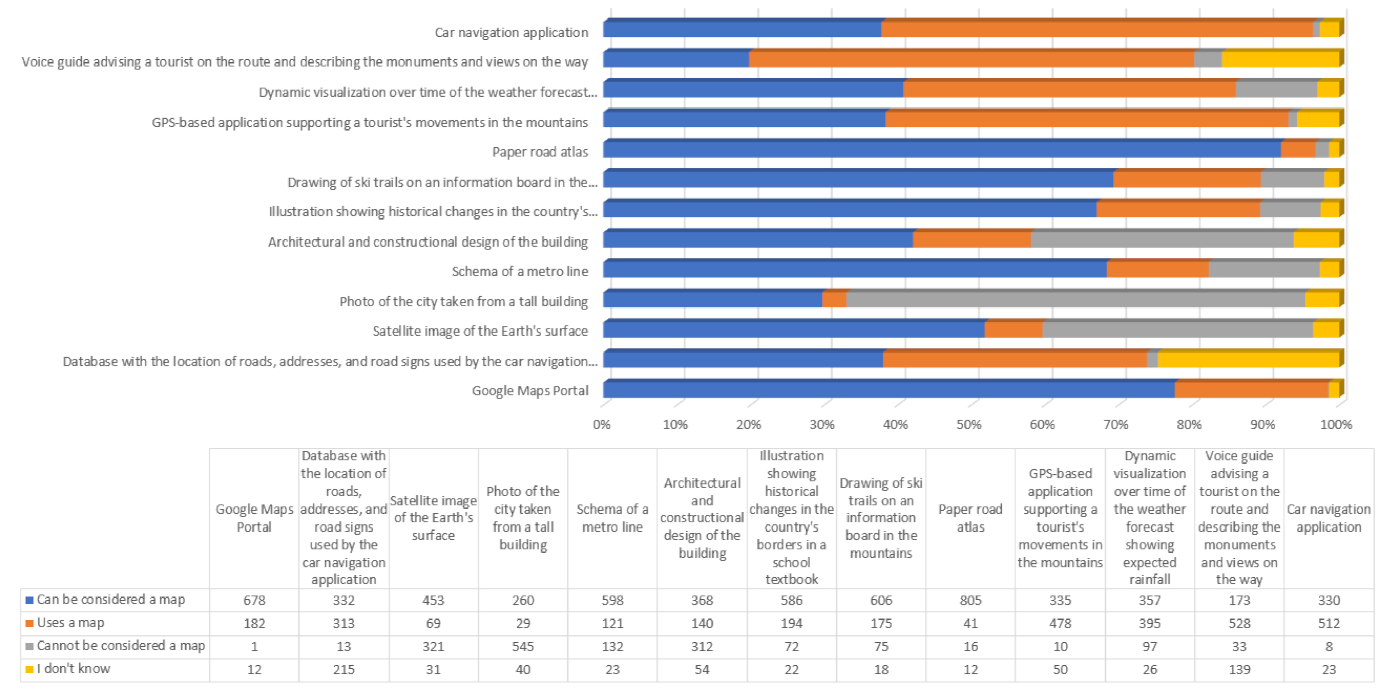
Figure 4 presents a review of the answers to the question concerning what respondents were willing to consider a map. In addition, respondents also considered classic cartographic products, such as a topographic map, a globe, or a road atlas. They were also asked for their opinion on various types of images, photos, and drawings. In the context of this article, the answers to these questions were only auxiliary, and an analysis of them will be carried out separately.
Most respondents believed strongly that LBS applications are maps or use maps. The difference in the assessment of “Car navigation application” and “Google Maps Portal” (web site) is very interesting. While in the first case, 40% of study participants held the view that such a product could be considered a map, in the second case, it was as much as 80%. Although Google Maps is used as a navigation system and web version, it is, in fact, a quite similar product, especially in terms of its description of space and information content (the main difference is in the way it is used). The answers to the question about “Database with the location of roads [...]” were also significant: in this case, almost three-quarters of respondents associated this product with the concept of a map.
When analyzing the respondents’ answers, it should be stated that some questions raised further doubts. For example, 453 respondents considered a satellite image of the Earth’s surface to be a map, while 321 were of the opposite opinion.
When answering the various questions, respondents rarely chose the “I don’t know” option. The only notable exception was when they were asked about the database used by car navigation systems. In this case, probably because some specialist knowledge was required, more than 25% (215 people) were unsure which answer was right.
When analyzing the survey results, it should be emphasized that the vast majority of responses to individual questions were consistent across respondents using different languages. The only exception was the issue of the subjectivity/objectivity of the cartographic information message. The map was a cartographer’s subjective way of seeing reality for 62% of English-speaking respondents (14% were of the opposite opinion). The people who spoke German thought similarly (49% against 34%, respectively). Opinions on this issue were evenly distributed among Polish respondents, while for most Chinese people (57%), the map was an objective reflection of reality; only 30% of Chinese speakers said the opposite.
The issue of the subjectivity or objectivity of cartographic products certainly affects the way maps are defined. This issue of objectivity (or subjectivity) of the cartographic message also influences the way the recipient learns about and understands the world through maps. It is, therefore, worth considering this problem in more detail and, in fact, recalling previous research in this field. The reason why the authors of this article asked this question was due to the epistemological concepts used in cartography and the assumption that during the cognition process, the map mediates between the cognizing subject and the cognized object [35]. Thus, Aslanikashvili [36], a Georgian cartographer, stated that working on a map is tantamount to learning about a certain aspect of reality—the space of objects and phenomena. The concept of the Georgian cartographer was further developed by Weibel [37,38]. He emphasized that a cartographic modeling process requires an understanding of space. The sense of this understanding is to get to know the spatial distribution of objects and phenomena, their mutual interactions, as well as the processes that shape geographical space and manifest different intensities, depending on the observational scale being considered. Therefore, if a map is a tool for learning about geographical space, then the question of the objectivity/subjectivity of the map is of key importance. This question was posed by both Salishcev [39] and Robinson et al. [22].
This issue can also be viewed through the eighteenth-century transcendental philosophy of Immanuel Kant [40]: Are map models objective representations of reality? Or do they shape the subjective image of reality created by a cartographer and reflected in the mind of the recipient? On the one hand, “to represent reality” means to reflect the elements of the outside world through maps, which implies objectivism and empiricism (sensible knowledge). On the other, the second approach, “to create reality”, means that maps are manifestations of the author’s subjectivism and idealism. Wood [41] claimed that maps are “weapons of power that create the territory desired by those empowered to make and enforce maps”, so cartographers construct the world, they do not reproduce it. Thus, one cannot build a concept of what things are that is separate from our senses. Based on Kant’s philosophy, it can be stated that the essence of the mapping process is the methodical modeling of transcendental reality in the form of a cartographically structured spatial knowledge base.
Considering the question of how objective or subjective a map—understood as a model of geographical space—is for the recipient of a cartographic product, the authors of this article defined this question in the survey. In analyzing these results, however, it is necessary to take into account the diverse character of the completed questionnaires across different languages (Figure 1).
4.2. Results of the Questionnaires: The Open Question
Apart from analyzing the answers to the closed questions, the reflection on the definition of the term “map” by individual respondents was also interesting. The vast majority of people taking part in the survey decided to answer this question. The way in which the essence of the map is defined differs significantly depending on the nationality of the people participating in the survey.
Of those who completed the English-language questionnaire (66% of all respondents), 169 provided their own definitions for the concept of the map. Of these, 109 provided definitions that referred to other forms of maps and not only to the graphical form or visualization. In turn, 46 people related their definition closely with graphics (visualization), while in the case of 13 answers, it was difficult to assess the definition in terms of a connection with visualization.
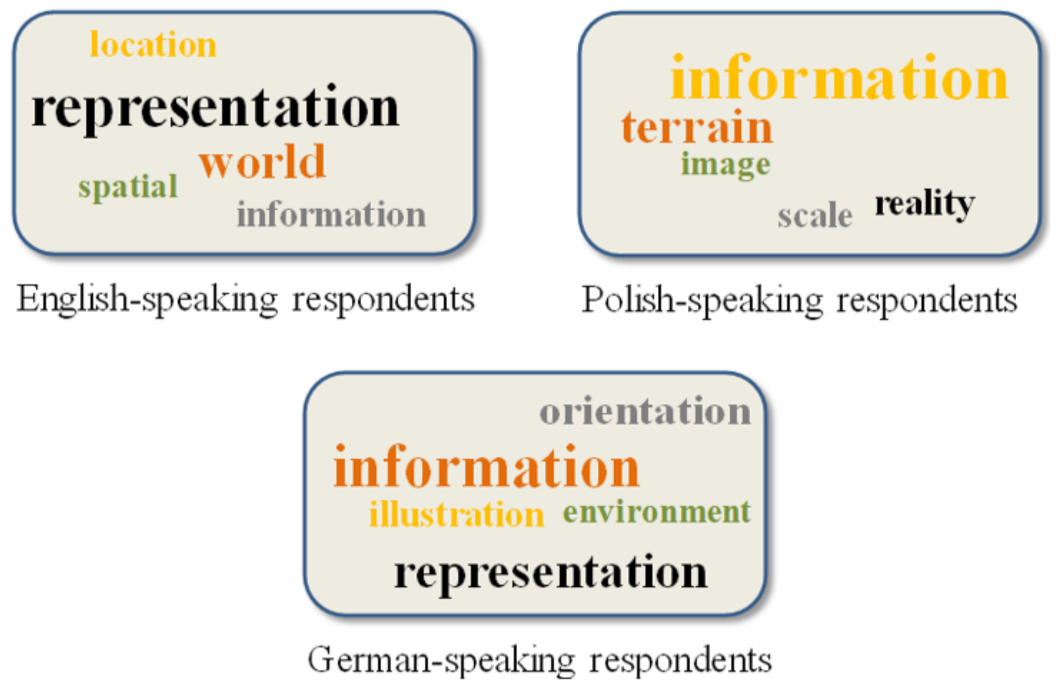
An analysis of the participants’ own definitions allowed the five most frequently used words to describe the essence of maps to be selected. For English-speakers, these were representation, information, spatial, world, and location (See Figure 5). None of these words refer directly to the concept of visualization and the graphical way of presenting spatial data.
Out of those people who completed the German-language questionnaire (49%), 40 respondents provided their own definitions. Of these, 22 provided definitions that referred to other forms of maps and not only to the graphical form or visualization, while 11 people related them closely with graphics (visualization). In seven answers, it was difficult to assess the definition in terms of a connection with visualization. The five most common words used to describe maps by German-speaking respondents were Darstellung, Abbildung, Orientierung, Umgebung, and Informationen (in translation: presentation, illustration, orientation, environment, and information) (see Figure 5).
Of the respondents who completed the Polish-language questionnaire (13%), 63 provided their own definitions. Of these, 29 provided definitions that referred to other forms of maps and not only to the graphical form or visualization, and 24 people related their definition closely with graphics (visualization). The five most common words used to describe a map by Polish-speaking respondents were (translated into English. See Figure 5) information, reality, image, terrain, and scale.
Due to a lack of linguistic qualifications, and the low number of definitions provided by the Chinese survey (only 20), the authors refrained from carrying out a detailed analysis at this stage.
The selected keywords in Figure 5 are merely an outline. There was no detailed linguistic analysis, and the authors only used the vizzlo.com tool and automatically generated words after removing conjunctions, prepositions, prefixes, and similar short words. The authors continue their research in this area and plan on presenting more detailed analyses in a separate paper.
4.3. Summary
In summing up this research, it should be stated that for the dominant part of respondents, who in representing different cultures, places of residence, and different languages, had an extremely broad understanding of maps, and for whom the cartographic modeling process was characteristic. There was no significant relationship between the responses and the gender of the research participants. As shown in Figure 4, the respondents called the following items, maps: traditional car atlases, navigation applications, geoportals, ski trail diagrams, the architectural and construction drawings of buildings, road databases, satellite images, and even ordinary photos. Of course, these were not the answers given by all respondents. In some cases, the respondent was very uncertain, for example, concerning car navigation databases. A comparable number of people considered such products to be maps and had the opposite opinion. A similar group stated that this type of product only uses maps.
The distribution of answers shows the logic of the respondents’ statements–they were not accidental. The smallest percentage of respondents considered a photo taken from a building to be a map (while the largest number of people rejected it). The largest percentage of respondents considered a traditional car atlas to be a map. It is worth noting that the Google Maps portal was definitely treated as a map. However, the respondents generally had a problem determining which product was a map and which only used a map.
The answers to the first seven questions turned out to be very clear. This can be seen in Figure 5. The respondents had no doubts that a map can be virtual and three-dimensional, that we can use the map in navigation systems without looking at the screen, that blind people can use a map, and that a map is used by navigation applications, steering systems for autonomous vehicles, and autopilot in an airplane.
Thus, in a more or less conscious way, the respondents confirmed that, for them, the graphic form of a map was not crucial in calling the product a map. They were also aware that the recipient (user) of the map was no longer necessarily a human being.
In the authors’ opinion, the definitions proposed by the users indicate that there is a lack of significant differences caused by the use of different languages and that there is a similar social understanding of the term “map”. The vast majority of respondents considered maps to be models of geographical space that facilitate (or even enable) navigation. A significant proportion of the study’s participants also indicated that maps were carriers of information, not graphic images. This broad understanding of the role played by the map today is particularly valuable in an era of widespread use of navigation and LBS applications.
The results of the survey lead to the conclusion that the contemporary public’s perception of the concept of the map is extensive and far different from the “flat graphic representation at a specific scale”. Indirectly, the respondents declared that they did not associate the concept of the map solely with a visualization. Visualization is not a prerequisite for the existence of maps. The research, therefore, confirms that the map is a model of geographical reality that can be communicated to the recipient in many ways by utilizing many senses. Equally important, these results confirm the thesis that the respondents recognized that the recipient of the cartographic modeling process does not have to be a human; it may well be a machine, understood, for example, as an autonomous vehicle.
5. Conclusions
The research conducted by the authors of this article has demonstrated that the development of technology (primarily digital technology) significantly influences the public perception of the role of cartography and the meaning of the map. The concept of a map is understood much more broadly now than in the era of analog cartography. The survey results also show that the respondents, regardless of their age, gender, or language, recognize the association between modern geoinformation products and the map understood as a model of reality. Therefore, modern cartography’s role is to adapt geoinformation products to the needs of a wide range of consumers of contemporary maps, including those who do not use graphic images as a source of information about surrounding space.
When understood as an organized spatial dataset, a map becomes an essential element not only of interpersonal communication but also in the decision-making processes performed by robots, as exemplified by M2M (machine to machine) communication. Therefore, the contemporary definition of the map should be more universal, covering current and, if possible, future needs and technologies. We can make the determination that “a map means arranging data and giving them a proper structure in a way that is appropriate for cartography, according to a particular data model, to ensure optimal spatial information communication” [42,43].
The scientific research and, especially, the technological considerations presented in this article demonstrate that maps are becoming a fully-fledged and, sometimes, a fundamental component of information systems. Consequently, it is essential to look at the process of map design and definition as being akin to the other elements of IT systems.
According to the assumptions adopted by the authors, the cartographic symbolization’s language does not have to be limited to graphic symbols.
Taking into account the results of the research, one may state that the current ICA [1] definition for maps: “a symbolized image of geographical reality […]”, may remain relevant in the context of developing these new cartographic products, but when assuming a broad understanding of the word “symbolized”. That is, only if the understanding of this term is not limited to graphic symbols but applies to various forms of transferring information, in particular, bit representation, which is understood by machines. On the other hand, there is yet another way of thinking that treats a map only as one of several forms of spatial information communication (alongside sound, text, etc.). However, one should analyze the consequences of this approach for the development of cartography. This greatly limits this field of research as well as implementation activities. Perhaps, in this case, the ICA [1] definition of cartography could be modified without limiting it to “making a map and using a map” (understood in such a narrow sense). The authors of this research are inclined to state that a map should be treated as a specific, ordered information structure and not as a method of presenting spatial data. However, this requires further research and discussion among the broader scientific community.
Author Contributions
Conceptualization, Dariusz Gotlib and Robert Olszewski; methodology, Dariusz Gotlib, Georg Gartner and Robert Olszewski; validation, Georg Gartner, Dariusz Gotlib and Robert Olszewski; investigation, Georg Gartner, Dariusz Gotlib and Robert Olszewski; data curation, Dariusz Gotlib; writing—original draft preparation, Dariusz Gotlib and Robert Olszewski; writing—review and editing, Georg Gartner, Dariusz Gotlib and Robert Olszewski; funding acquisition, Georg Gartner, Dariusz Gotlib and Robert Olszewski. All authors have read and agreed to the published version of the manuscript.
Funding
This work was supported by the Warsaw University of Technology and the Vienna University of Technology (TU Wien).
Institutional Review Board Statement
Ethical review and approval were waived for this study, due to the research was carried out in the form of a fully anonymous online survey with no sensitive questions. All questions were consulted with the team conducting applied social research at the Warsaw University of Technology. People taking part in the survey consciously consented to answering individual questions.
Informed Consent Statement
Informed consent was obtained from all subjects involved in the study.
Data Availability Statement
Data sharing not applicable—no new data generated.
Acknowledgments
We want to express our sincere thanks to Francisco Porras, Silvia Klettner, and Wangshu Wang from the Research Division Cartography (Department of Geodesy and Geoinformation|TU Wien) for their support in the preparation of the multilingual research questionnaires.
Conflicts of Interest
No potential conflict of interest has been reported by the authors.
References
- International Cartographic Association (ICA). Available online: https://icaci.org/mission/ (accessed on 8 January 2021).
- Encyclopedia Britannica, Map|Cartography. Available online: https://www.britannica.com/science/map (accessed on 13 October 2020).
- Mapping. WordNet: A Lexical Database for English; Princeton University: Princeton, NJ, USA. Available online: https://wordnet.princeton.edu/citing-wordnet (accessed on 15 October 2020).
- Encyclopedia Britannica, Mapping|Mathematics. Available online: https://www.britannica.com/science/mapping (accessed on 13 October 2020).
- Apostol, T.M. Mathematical Analysis; Addison-Wesley: Boston, MA, USA, 1981; p. 35. [Google Scholar]
- Simmons, H. An Introduction to Category Theory; Cambridge University Press: Cambridge, UK, 2011; p. 2. [Google Scholar]
- Rystedt, B. New Trends and Developments in Cartography. International Cartographic Association. In Proceedings of the CODI-2, Addis Ababa, Ethiopia, 4–7 September 2001. [Google Scholar]
- Lapaine, M. Mapping in Cartography. Proceedings of the International Cartographic Association. 2019. Available online: https://www.proc-int-cartogr-assoc.net/2/70/2019/ (accessed on 14 December 2020).
- Tomlin, C.D. Geographic Information Systems and Cartographic Modeling; Prentice Hall: Upper Saddle River, NJ, USA, 1990. [Google Scholar]
- Baranowski, M.; Gotlib, D.; Olszewski, R. Properties of Cartographic Modeling under Contemporary Definitions of a Map. Pol. Cartogr. Rev. 2016, 48, 91–100. [Google Scholar]
- Baranowski, M.; Gotlib, D.; Olszewski, R. In Search of the Essence of Cartography. In Advances in Cartography and GIScience. ICACI 2017. Lecture Notes in Geoinformation and Cartography; Peterson, M., Ed.; Springer International Publishing: Cham, Switzerland; New York, NY, USA, 2017; pp. 525–536. [Google Scholar]
- Ostrowski, W. Semiotyczne Podstawy Projektowania Map Topograficznych na Przykładzie Zabudowy, Praca Habilitacyjna Semiotic Basics of Topographic Map Design on the Example of Buildings. Habilitation Thesis, University of Warsaw, Warsaw, Poland, 2008. [Google Scholar]
- Hruby, F.; Castellanos, I.; Ressl, R. Cartographic Scale in Immersive Virtual Environments. J. Cartogr. Geogr. Inf. 2020. [Google Scholar] [CrossRef]
- Andrews, J. What Was a Map? The Lexicographers Reply. Cartographica 1996, 33, 1–12. [Google Scholar] [CrossRef]
- Kraak, M.-J.; Fabrikant, S.I. Of Maps, Cartography and the Geography of the International Cartographic Association. Int. J. Cartogr. 2017, 3, 9–31. [Google Scholar] [CrossRef]
- Visvalingam, M. Cartography, GIS and Maps in Perspective. Cartogr. J. 1988, 26, 26–32. [Google Scholar] [CrossRef]
- Clarke, K.C.; Johnson, J.M.; Trainor, T. Contemporary American Cartographic Research: A Review and Prospective. Cartogr. Geogr. Inf. Sci. 2019, 46, 196–209. [Google Scholar] [CrossRef]
- Cartwright, W.; Ruas, A. Mapping the World. Int. J. Cartogr. 2015, 1, 1–4. [Google Scholar] [CrossRef]
- Wood, M. Cartography in the Age of Geographic Information Science. Geogr. Cas. 2003, 4, 271. [Google Scholar]
- Gartner, G. User-Centred Approach is the Key. Geospat. World 2013, 4, 48–50. [Google Scholar]
- Harley, J.B. Deconstructing the Map. Cartographica 1989, 26, 1–20. [Google Scholar] [CrossRef] [Green Version]
- Robinson, A.; Morrison, J.; Muehrcke, P.; Kimerling, A.; Guptill, S. Elements of Cartography, 6th ed.; John Wiley & Sons: New York, NY, USA, 1995. [Google Scholar]
- Kraak, M.-J.; Ormeling, F.J. Cartography, the Visualization of Spatial Data; Addison Wesley Longman: London, UK, 1996. [Google Scholar]
- Sismondo, S.; Chrisman, N. Deflationary Metaphysics and the Natures of Maps. Philos. Sci. 2001, 68, 38–49. [Google Scholar] [CrossRef]
- Jacob, C. The Sovereign Map: Theoretical Approaches in Cartography throughout History; University of Chicago Press: Chicago, IL, USA, 2005. [Google Scholar]
- Kitchin, R.; Dodge, M. Rethinking Maps. Prog. Hum. Geogr. 2007, 31, 331–344. [Google Scholar] [CrossRef]
- Board, C. Maps as Models. In Models in Geography; Chorley, R.J., Haggett, P., Eds.; Methuen: London, UK, 1967; pp. 671–725. [Google Scholar]
- Kolácný, A. Cartography Information: A Fundamental Concept and Term in Modern Cartography. Cartogr. J. 1969, 6, 47–49. [Google Scholar] [CrossRef]
- Mackaness, W.; Ruas, A.; Sarjakoski, T. Generalisation of Geographic Information: Cartographic Modeling and Application; Elsevier: Amsterdam, The Netherlands, 2007. [Google Scholar]
- Vardhan, H. HD Maps: New Age Maps Powering Autonomous Vehicles. Geospatial World. 22 September 2017. Available online: https://www.geospatialworld.net/article/hd-maps-autonomous-vehicles/ (accessed on 14 December 2020).
- ABI Research, the Future of Maps: Technologies, Processes, and Ecosystem, ABI Research. 2018. Available online: https://www.here.com/sites/g/files/odxslz166/files/2019-01/THE%20FUTURE%20OF%20MAPS.pdf (accessed on 14 December 2020).
- TomTom Company’s Information Materials. 2019. Available online: https://www.tomtom.com/automotive/automotive-solutions/automated-driving/hd-map-roaddna/ (accessed on 14 December 2020).
- Chellapilla, K. Rethinking Maps for Self-Driving. Medium. 15 October 2018. Available online: https://medium.com/lyftlevel5/https-medium-com-lyftlevel5-rethinking-maps-for-self-driving-a147c24758d6 (accessed on 17 November 2020).
- Huang, H.; Gartner, G.; Krisp, J.M.; Raubal, M.; Van de Weghe, N. Location Based Services: Ongoing Evolution and Research Agenda. J. Locat. Based Serv. 2018, 12, 63–93. [Google Scholar] [CrossRef]
- Czerny, A. Orientacje Problemowe w Kartografii Teoretycznej (Problem Orientations in Theoretical Cartography); Polski Przegląd Kartograficzny (Polish Cartographical Review): Warsaw, Poland, 1990; T. 22 nr 4. [Google Scholar]
- Aslanikashvili, A.F. Metakartografija; Osnownyje Problemy: Tbilisi, GA, USA, 1974. [Google Scholar]
- Weibel, R. Amplified Intelligence and Rule-Base Systems. In Map Generalization: Making Rules for Knowledge Representation; Buttenfield, B., McMaster, R., Eds.; Longman: London, UK, 1991. [Google Scholar]
- Weibel, R. Map Generalization in the Context of Digital Systems. Cartogr. GIS 1995, 22, 259–263. [Google Scholar] [CrossRef]
- Salishchev, K.; Kartovedenie, A. Izdatel’stvo; MUG: Moscow, Russia, 1976. [Google Scholar]
- Kant, I. Kritik der Reinen Vernunft [The Critique of Pure Reason]; Hackett Publishing Co.: Indianapolis, IN, USA, 1781; translated by Werner Pluhar. [Google Scholar]
- Wood, D. The Power of Maps; Guilford Press: New York, NY, USA, 1992. [Google Scholar]
- Gotlib, D. Methods of Cartographic Presentation for Mobile Navigation and Location-Based Systems. Geodezja; Oficyna Wydawnicza Politechniki Warszawskiej: Warsaw, Poland, 2011; Volume 48. [Google Scholar]
- Gotlib, D. Mobile Maps: Modelling of Cartographical Presentation. Geoinform. Pol. 2012, 11, 57–65. [Google Scholar] [CrossRef]
Figure 1.
The participation of language groups in the survey.

Figure 2.
The age distribution of participants.

Figure 3.
The first group of questions: summary of the answers from the study.

Figure 4.
The answers to question No. 9.

Figure 5.
The five most common words used by respondents from the main linguistic groups to define the term “map”.
Figure 5.
The five most common words used by respondents from the main linguistic groups to define the term “map”.


Table 1.
Samples of the definitions of a map.
| Native Language | Definition of the Term “Map” |
|---|---|
| English | an abstract representation of spatial relationships a representation of spatial information spatial organization of geographically referenced data |
| Definition of the term “map” (in English translation) | |
| German | a simplified and generalized representation of the world a representation and illustration of reality used to transmit information a representation of spatial information, using such forms as text, voice, graphics, etc. |
| Polish | a model of reality that shows the position of objects and phenomena a simplified description of reality an image of the world in greater or lesser distortion |
Publisher’s Note: MDPI stays neutral with regard to jurisdictional claims in published maps and institutional affiliations. |
© 2021 by the authors. Licensee MDPI, Basel, Switzerland. This article is an open access article distributed under the terms and conditions of the Creative Commons Attribution (CC BY) license (http://creativecommons.org/licenses/by/4.0/).
Share and Cite
MDPI and ACS Style
Gotlib, D.; Olszewski, R.; Gartner, G. The Extended Concept of the Map in View of Modern Geoinformation Products. ISPRS Int. J. Geo-Inf. 2021, 10, 142. https://0-doi-org.brum.beds.ac.uk/10.3390/ijgi10030142
AMA Style
Gotlib D, Olszewski R, Gartner G. The Extended Concept of the Map in View of Modern Geoinformation Products. ISPRS International Journal of Geo-Information. 2021; 10(3):142. https://0-doi-org.brum.beds.ac.uk/10.3390/ijgi10030142
Chicago/Turabian StyleGotlib, Dariusz, Robert Olszewski, and Georg Gartner. 2021. "The Extended Concept of the Map in View of Modern Geoinformation Products" ISPRS International Journal of Geo-Information 10, no. 3: 142. https://0-doi-org.brum.beds.ac.uk/10.3390/ijgi10030142
Note that from the first issue of 2016, this journal uses article numbers instead of page numbers. See further details here.