Article

Changes of Spatiotemporal Pattern and Network Characteristic in Population Flow under COVID-19 Epidemic

1
Chinese Academy of Surveying and Mapping, Beijing 100830, China
2
College of Geodesy and Geomatics, Shandong University of Science and Technology, Qingdao 266061, China
*
Author to whom correspondence should be addressed.
ISPRS Int. J. Geo-Inf. 2021, 10(3), 145; https://0-doi-org.brum.beds.ac.uk/10.3390/ijgi10030145
Submission received: 24 December 2020 / Revised: 19 February 2021 / Accepted: 23 February 2021 / Published: 8 March 2021
(This article belongs to the Special Issue Geovisualization and Social Media)

Abstract

:
The COVID-19 pandemic is a major problem facing humanity throughout the world. The rapid and accurate tracking of population flows may therefore be epidemiologically informative. This paper adopts a massive amount of daily population flow data (from January 10 to March 15, 2020) for China obtained from the Baidu Migration platform to analyze the changes of the spatiotemporal patterns and network characteristics in population flow during the pre-outbreak period, outbreak period, and post-peak period. The results show that (1) for temporal characteristics of population flow, the total population flow varies greatly between the three periods, with an overall trend of the pre-outbreak period flow > the post-peak period flow > the outbreak period flow. Impacted by the lockdown measures, the population flow in various provinces plunged drastically and remained low until the post-peak period, at which time it gradually increased. (2) For the spatial pattern, the pattern of population flow is divided by the geographic demarcation line known as the Hu (Heihe-Tengchong) Line, with a high-density interconnected network in the southeast half and a low-density serial-connection network in the northwest half. During the outbreak period, Wuhan city appeared as a hollow region in the population flow network; during the post-peak period, the population flow increased gradually, but it was mainly focused on intra-provincial flow. (3) For the network characteristic changes, during the outbreak period, the gap in the network status between cities at different administrative levels narrowed significantly. Thus, the feasibility of Baidu migration data, comparison with non-epidemic periods, and optimal implications are discussed. This paper mainly described the difference and specific information under non-normal situation compared with existing results under a normal situation, and analyzed the impact mechanism, which can provide a reference for local governments to make policy recommendations for economic recovery in the future under the epidemic period.

1. Introduction

Human mobility is an important indicator and carrier of regional socioeconomic activities. The human mobility reflects, to a certain extent, the functional relationship between cities [1,2]. Traditional human mobility/population flow research has been conducted primarily based on static data, such as census data or statistical yearbooks, which are unable to dynamically capture the spatial patterns of rapid mobility and urban development in real time and thus cannot directly and accurately reflect the directions and patterns of population flow. With the development of mobile technology, behavioral big data containing the positional information of individual users, such as Sina Weibo check-in, mobile operators [3] and localized mobility data, which can be used to monitor the mobility of people, have continued to emerge [4]. Due to the price, incompleteness, or other objective criteria, mobile operator data is usually unavailability. Compared with mobile operator data, localized mobility data is more available. It denotes the location tracking data from some mobile location service, and is in principle similar to data from mobile operators [5]. For instance, Google location data, which is collected by Google if a Google Maps user agrees to share their location, is widely used in the countries of Europe. Similarly, in China, Baidu Map location data launched in 2014 and has attracted wide attention. This data is similar to Google location data, but only provides daily trajectories of population flow publicly [6].
Certain recent studies have analyzed human mobility of human mobility by using localized data, such as the global variation in human mobility [7], human mobility characteristics during typical flow periods like the Spring Festival [8]. Toward the end of 2019, a coronavirus strain called coronavirus disease-2019 (COVID-19) emerged in Wuhan, China, and proved to be transmissible from human to human [9]. To understand the impacts of COVID-19 disease on human behavior, several studies about this have already been published worldwide, such as in the United States [10], Europe [5], China [11], and other countries. Different than other countries, the COVID-19 outbreak in China coincided with the Chinese Lunar New Year’s Eve, which is related to the annual mass movement. Nationwide transportation and travel restrictions were put in place to limit the spread of the pandemic. Some studies have analyzed the impacts of COVID-19 on human mobility [12,13] and inter-city transportation demand [14] during lockdown periods at national and prefecture-level cities scales, as well as economy recovery evaluation based on mobility operators and Baidu location data. However, the existing studies do not pay much attention to comprehensive comparisons of human mobility under both “pre-outbreak period” and “epidemic period”. Indeed, the pre-outbreak period (such as from 10 to 22 January 2020 in China) can reflect human mobility at normal situation to some extent. In addition, human mobility of a city reflects the status of this city in urban network, the current studies few focused on the status and structure of China’s urban network impacted by COVID-19. These concerns motivated the research.
Based on Baidu location data, the objectives of this study are (1) to analyze the spatiotemporal patterns of human mobility between prefectures of China during different periods, and compare their differences, as well as the differences in the same period in previous years, and (2) to assess the changes of city network status compacted by COVID-19 by using the network analysis method. This study enhances our understanding of the spatiotemporal changes and network structure of intercity population flow in China during the COVID-19 pandemic and provides a reference for the future management of public health emergencies on a nationwide scale and for the assessment of regional differences in urban development [15].
The paper is organized as follows: Section 2 discusses related work analyzing the spatiotemporal characteristics of urban population flow. Section 3 introduces the data sources and methodology. Section 4 discusses the changes of the spatiotemporal patterns and network structure in population flow. Section 5 presents the conclusions and future work.

2. Literature Review

Understanding human mobility and how it manifests across spatiotemporal scales has important significance, and many related researches have been conducted [16]. For instance, Kraemer et al. (2020) used smartphone location data from Google Location History to analyze global human mobility patterns and found that compared with high income people, the moving distance of people with low incomes is over 10 times shorter and the moving speed is 40% slower [7]. Ruktanonchai et al. (2018) collected Google Location History (GLH) data by Android smartphones from October to December 2016, to assess human mobility patterns in the United Kingdom, and provided some insights based on GLH data, including infrastructure planning, infectious disease control, and response to catastrophic events [17]. Xu et al. (2017) studied the spatiotemporal characteristics and network characteristics of population migration based on Tencent’s travel data during the Spring Festival, and analyzed the unbalanced migration between cities and the differences in development. The study found that cities along the east coast are the most attractive to migrant laborers, whereas cities located in the central part of China are mostly labor force exporters [18]. Wang et al. (2019) used mobile phone positioning data during the Spring Festival in 2016 to analyze the effect of socioeconomic factors on the spatial patterns of population mobility [19]. Based on the population migration data, Li et al. (2016) studied the spatiotemporal characteristics of the Spring Festival travel rush in 2015 and found that the Baidu and Tencent migration data are more accurate than those of Qihoo [8]. Kraemer et al [7] described global human mobility patterns, based on the data from mobile phones whose users opted in to Google Location History (https://support.google.com/accounts/answer/3118687, accessed on 13 April 2019).
The outbreak of the novel coronavirus pandemic at the end of 2019 has prompted some scholars to use LBS data to study human mobility [20], city transportation demand, and economy recovery evaluation during the pandemic [21,22]. For instance, both Apple and Google provided a dataset to deal with human mobility and trace individuals infected with COVID-19 (Apple Inc., 2020, https://www.apple.com/cz/newsroom/2020/04/apple-and-google-partner-on-covid-19-contacttracing-technology/ (accessed on 7 March 2021)) [23]. Bonaccorsi et al. (2020) analyzed the effect of Italy’s lockdown measures on socioeconomic conditions based on real-time human movement data and found that the lockdown measures had a greater effect on population mobility in cities with higher economic development [24]. Based on data from Google Location Service, Pászto et al. (2021) conducted a micro-study describing and interpreting changes in the behavior of people in three months before and during the COVID-19 pandemic [25]. Santamaria et al. (2020) analyzed the mobility patterns of the EU population using a population mobility indicator derived from anonymous mobile positioning data and found that COVID-19 restrictions significantly affected population mobility in the EU [26]. Pászto et al [5] offered unique information about changes in human activity due to the pandemic based on COVID-19 Community Mobility Reports dataset, and showed how this dataset can be utilized in terms of geovisual analytics and clustering in order to reveal the spatial pattern of such changes in human behavior. Jia et al [12] used anonymous mobile operator data in China to analyze the flow of more than 11 million people who stayed in Wuhan at least two hours from 10 January to 24 January 2020, and reported that lockdown restrictions have been very effective in reducing human mobility significantly. Desjardins et al. (2020) used the scan-statistics method to detected the active clusters and potential clusters of contagion [27], and Wellenius et al. (2020) evaluates the impacts of state-of-emergency declarations, social distancing policies on human mobility by using Google Location data during COVID-19 pandemic in the United States [28]. Xu et al [11] used big data from the Baidu Migration platform to analyze the return of population, urban traffic conditions, and the resumption of social production and life at a provincial scale across China after the 2020 Spring Festival holiday. Tong et al. (2020) reveals the daily characteristics and spatiotemporal patterns of the short-term impact of the COVID-19 epidemic at multiple scales, and evaluated the Chinese urban resilience by using Baidu migration data [13].
Although there have been studies examining the patterns of human mobility during COVID-19, the majority have focused on the spatiotemporal patterns of human mobility, the transportation and economy situations during the COVID-19 periods. Whereas, few studies have reported on the changes of city network status compacted by COVID-19.

3. Data and Methodology

3.1. Data Sources

The population mobility data used in this study are obtained from the Baidu Map Smart Eye through the Baidu Migration platform (referred to as Baidu Migration). Baidu is the largest electronic map and LBS provider in China, the data is collected if a Baidu Maps user agrees to share their location, which is determined not only based on the location of nearby BTS stations but also by connection to Wi-Fi networks (by IP address) and especially via GPS (if this option is enabled on the user’s device). The Baidu Migration platform displays the daily population flow in real time and records the migration paths of hundreds of millions of people, which represent the intensity and direction of population flow over a certain period of time. Baidu migration big data provides China’s immigration index and emigration index recorded in days at a provincial scale and city scale, as well as the Top 100 cities with the most moving population for each city or province. For instance, for city A, the data records the top 100 cities for moving in the city and their inflow ratios, as well as the top 100 cities for moving out of the city and their outflow ratios, as described in Table 1. The temporal resolution of this data is per day, and the spatial resolution is prefecture-level city in China.
The data can be derived from the website of http://qianxi.baidu.com (accessed on 16 March 2020). Baidu Maps data is updated every hour, and the flow data reflect the changes in population mobility during the preceding eight hours. In this study, Python 3.3.3 software was used to capture the data from the Baidu Migration platform based on its open API. Firstly, query the immigration index of a city, and then use the browser to view the source code of the website page and query the “hearers” parameter, to obtain the server address of the request immigration index. Then batch set the date and City ID, and build a circular statement. After repeated debugging and manual inspection, all data can be derived.
The data used in this study cover a period from 10 January to 15 March 2020, including the period of the novel coronavirus outbreak in China and the Spring Festival travel rush. Using the Baidu Migration platform, we obtain the relative proportions of population flow of the top 100 migration flow sources and destinations among 336 cities of China (excluding Hong Kong, Macao, Taiwan, Sansha, and some cities in Hainan) over a period of 66 days. More than 443 million flows were captured. To further explore the effect of the epidemic outbreak on China’s population mobility, the study period is divided into three stages based on the development of the outbreak: the pre-outbreak period (10 January to 23 January 2020), the outbreak period (23 January to 20 February 2020), and the post-peak period (20 February to 15 March 2020).

3.2. Methodology

3.2.1. Data Standardization

The data provided by Baidu Migration are the relative weight proportion of the total inflow and outflow of each city, rather than the actual population flow data, and thus the data need to be standardized before analysis. Based on the principles of data standardization [29], this paper first uses the min-max normalization method (Equation (1)) to standardize the data; then, by combining the migration scale index horizontally between cities, the migration index ratio in 2020 relative to the same period in 2019 is obtained. Finally, based on the index ratio, the standardized data are corrected again, and finally, the scores of the top 10 inflows or outflows for each city in the population mobility network are obtained. The general formula for min-max normalization is given as:
y i j = x i j min ( x j ) max ( x j ) min ( x j ) ( i = 1 , 2 , , n ; j = 1 , 2 , , m )
where x i j is the j-th weighted ratio of the i-th city, min (𝑥𝑗) is the minimum value of the index 𝑗, and max (𝑥𝑗) is the maximum index of the index 𝑗.

3.2.2. Calculation of Total Population Mobility

Based on the standardized data, with the outflow cities on the ordinate and the inflow cities on the abscissa, input the connectivity data of the top 10 cities with the highest population mobility to construct the adjacency matrix table of the population flow between 336 cities over 66 days, and ultimately obtain 66 (336 × 336) directional multivalued network matrices R = ( R i j ) , R_ij is the population flow intensity from city i to city j, as shown in Equation (2) [30].
R = j 1                     j 2                 j n 1             j n i 1 i 2 i n 1 i n [ 0 R 12 R 1 ( n 1 ) R 1 n R 21 0 R 2 ( n 1 ) R 2 n R ( n 1 ) 1 R ( n 1 ) 2 0 R ( n 1 ) n R n 1 R n 2 R n ( n 1 ) 0 ]
The total flow G M i _ d a y (gross migration) i measures the daily total population flow of city i , the net migration value N M i _ d a y (net migration) measures the daily net population inflow ( N M i _ d a y > 0 ) and the net population outflow ( N M i _ d a y < 0 ) of city i , and G M i _ d a y and N M i _ d a y are given as [20]:
{ G M i d a y = R i T +   R i N M i d a y = R i T   R i
where R i is the population flow matrix and R i T is the transpose of R i .

3.2.3. Network Feature Analysis Method

The complex network is a network with the of small-word and scale-free characteristics and a community structure between regular networks and random networks. In reality, most networks are complex networks, and population mobility networks also have complex network characteristics. Therefore, this paper uses a complex network analysis method to explore the characteristics of China’s urban population mobility network. Complex networks focus on the study of nodes and the topological relationships between the nodes and grasp the connections between individuals through the study of node relationships, thereby revealing the integrity and hierarchy of the network. Currently, complex network analysis methods have been applied in many research fields [31]. The following indices of the network characteristic index are used in this paper: degree and its probability, centrality, clustering coefficient and characteristic path length.
(1) Degree and probability analysis
The degree value represents the number of adjacent city nodes for the focal city node and is the simplest but most important feature of that city node. The inflow and outflow degrees reflect the attraction and radiation capabilities of a city node to other city nodes, respectively. To a certain extent, the total degree indicates the degree to which a city node is at the center of the network; that is, the network status. If the number of city nodes with k-degrees in the network is nk, then the degree distribution is given as:
p ( k ) = n k N
(2) Network centrality
Centrality is a structural location indicator that can measure the influence and control of a city node in the population mobility network, and the closer to the center it is, the greater its influence. Among them, middle centrality represents the ratio of the number of all the shortest paths in the network that go through a city node to the total number of all city nodes that include the shortest paths. This indicator characterizes the probability of population flow to the focal city node in the network, and the higher the value, the better the connectivity of the city. The centrality B i of city n o d e i is given by:
B i = s v t i δ s t ( i ) δ s t
where δ s t ( i ) is the number of shortest paths between city-node pair ( s , t ) and city node i , and δ s t is the number of shortest paths between city-node pair ( s ,   t ) .
(3) Clustering coefficient
The clustering coefficient is a parameter that reflects the local clustering of a network and describes the local attributes of a network connection, and it is often used to analyze a group’s relational network formed by a common relationship in the social network [32]. The clustering coefficient is given by:
C i = 2 v m i ( m i 1 )
where v is the number of paths between the city node and its m i neighboring nodes.
Ucinet software is used in this study to conduct complex network analysis. Ucinet is a social network analysis program developed by Stephen Borgatti, Martin Everett and Linton Freeman. The program is distributed by Analytic technologies. It can read and write a multitude of differently formatted text files, as well as Excel files. In addition, this program has strong matrix analysis routines, such as matrix algebra and multivariate statistics, which can analyze a complex network well.

4. Results and Discussion

To better understand the human mobility in different during different situations, this paper first analyzes the temporal and spatial patterns of population flow in prefectures during three different periods. Due to that human mobility can reflect the status of a city in the city network, in order to evaluate the impact of epidemic on city network status, the changes in the flow network characteristics are analyzed, which is of significance to understand the functional robustness of Chinese prefectures under health emergencies.

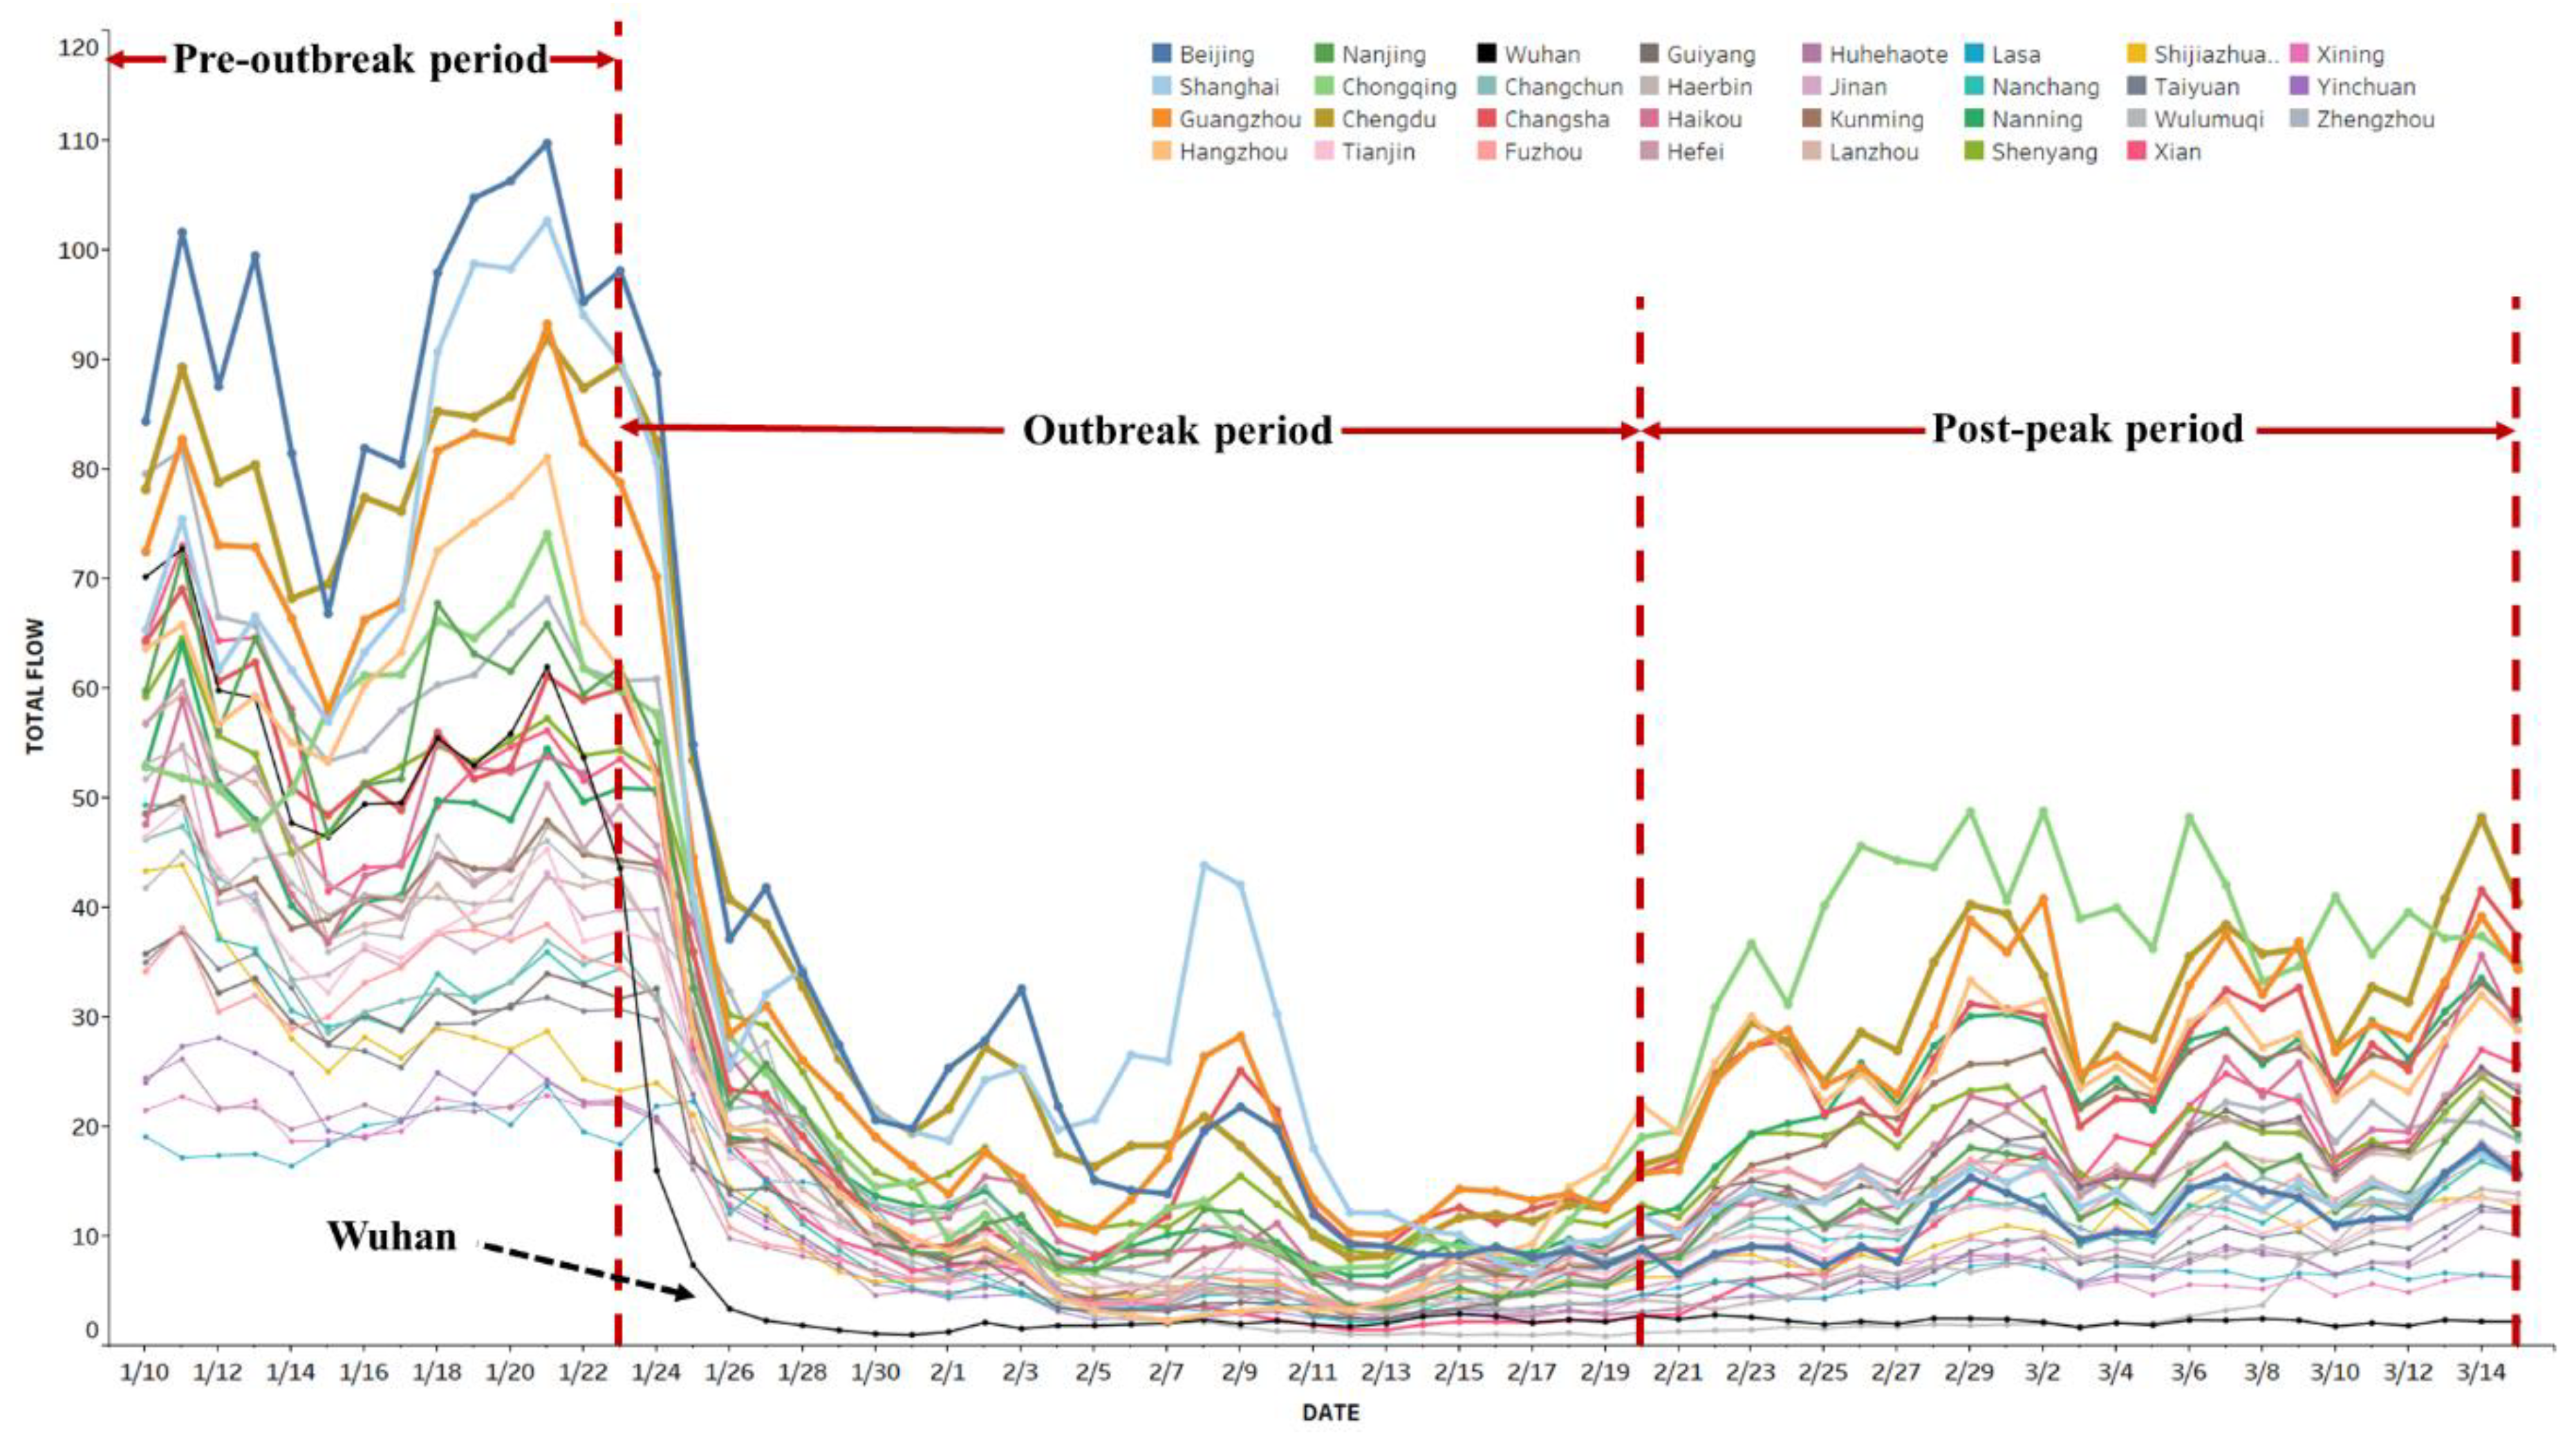
4.1. Temporal Characteristics of Population Mobility

In view of their large number, carrying out a time-series analysis of prefecture-level cities may affect the presentation of data patterns and analysis results. Therefore, this paper selects a total of 31 provincial capitals/municipalities in China to analyze the characteristics of the population mobility time series. These selected cities have a high administrative level, a well-developed economy and high population attraction and radiation, and the total population flow accounts for nearly 30% of China’s total population flow. Figure 1 shows the time-series distribution of the daily total population flow based on the province as a unit. On the whole, the scale of China’s total population flow varies significantly in different periods, showing a trend of incubation period > post-peak period > outbreak period. During the pre-outbreak period, the scale of population movement in a first-tier city, like Beijing, Shanghai was at the forefront, whereas a southwest city, like Lhasa, Xining were relatively low. Since 17 January, the population flow of most provincial capitals has increased significantly because of the “homecoming tide” before the Chinese New Year. However, there are significant differences in the magnitude of the changes among provinces, with the greatest changes occurring in the representative first-tier cities. The reason for this is that these cities have a more developed economy and attract a large number of laborers from other cities, indicating that behind the migration of population is actually a manifestation of the attractiveness and competitiveness of a city. This result is similar to the finding of Li et al [8].
Unlike the same periods with a normal situation, following 25 January (Lunar New Year in China), the population flow of various provinces plunged drastically, especially in Wuhan. Wuhan, as the outbreak epicenter, had the most stringent prevention and control measures and was affected by the epidemic earlier than other cities. When Wuhan was quarantined on 23 January—the day before Lunar New Year’s Eve—its population mobility fell almost to 0. However, in fact, by this time, many people have already migrated from Wuhan before New Year’s Eve. According to the government report of Wuhan municipal, by 23 January, approximately 5.2 million people flow out of Wuhan, of which more than 70% of the flows to prefectures within Hubei Province. Based on Baidu migration index in this paper, the movements to other prefectures were evaluated. The flows to Huanggang city (about 800 thousands), Xiaogan City (about 700 thousands) and Jingzhou City (350 thousands) were the most, which is similar to the finding of Liu et al [33]. From 23 January to 15 March, Wuhan was in quarantine, and the counts of population inflow and outflow were nearly zero. After Wuhan was quarantined, most of the remaining cities also began to show a downward trend starting on 24 January, with a slight delay. On 31 January, the population mobility in a few cities, including Beijing and Shanghai, saw a small increase, which was the “return to work” following the Spring Festival. However, due to the epidemic, only a small portion of the labor force returned to their cities of employment, which is similar to Xu et al [11]. During the Lantern Festival on 8 February, some cities experienced “small ups” but movement rapidly declined in the subsequent two days. It is worth noting that during the outbreak of the epidemic, there was still a small-scale population movement in various cities, possibly due to the constant flow of medical personnel and material transportation teams throughout the country traveling to assist Hubei Province. As of 21 February, China’s epidemic prevention and control situation has gradually improved, the national resumption of work and production has advanced steadily, and epidemic control has gradually entered a phase of relaxation. During this period, the population flow in most southern cities and first-tier cities increased gradually.
Figure 2 shows the time-series distribution of the net population flow by province. Generally, during the pre-outbreak period, the human mobility of first-tier or new-first-tier cities, like Shanghai, Beijing, Guangzhou, Chengdu, and Hangzhou were predominantly an outflow. Tourism-oriented cities or labor export cities, like Chongqing, Nanchang, and Lanzhou, are represented by a net population inflow. During the outbreak period, some first-tier cities showed a reverse trend in the population flow, and a population inflow gradually emerged. This is consistent with the findings of Lai et al [34], but the scale of the reverse trend was much smaller than that before the Spring Festival. It should be noted that Chongqing had the most obvious trend of population inflow followed by outflow, similar to the finding of Xu et al [11], which may be because in recent years, as a popular “net celebrity city”, attracted a large number of tourists on the eve of the Spring Festival. A considerable number of tourists remained in the city after the epidemic outbreak and gradually flowed out as the epidemic eased.

4.2. Spatial Characteristics of City Population Mobility

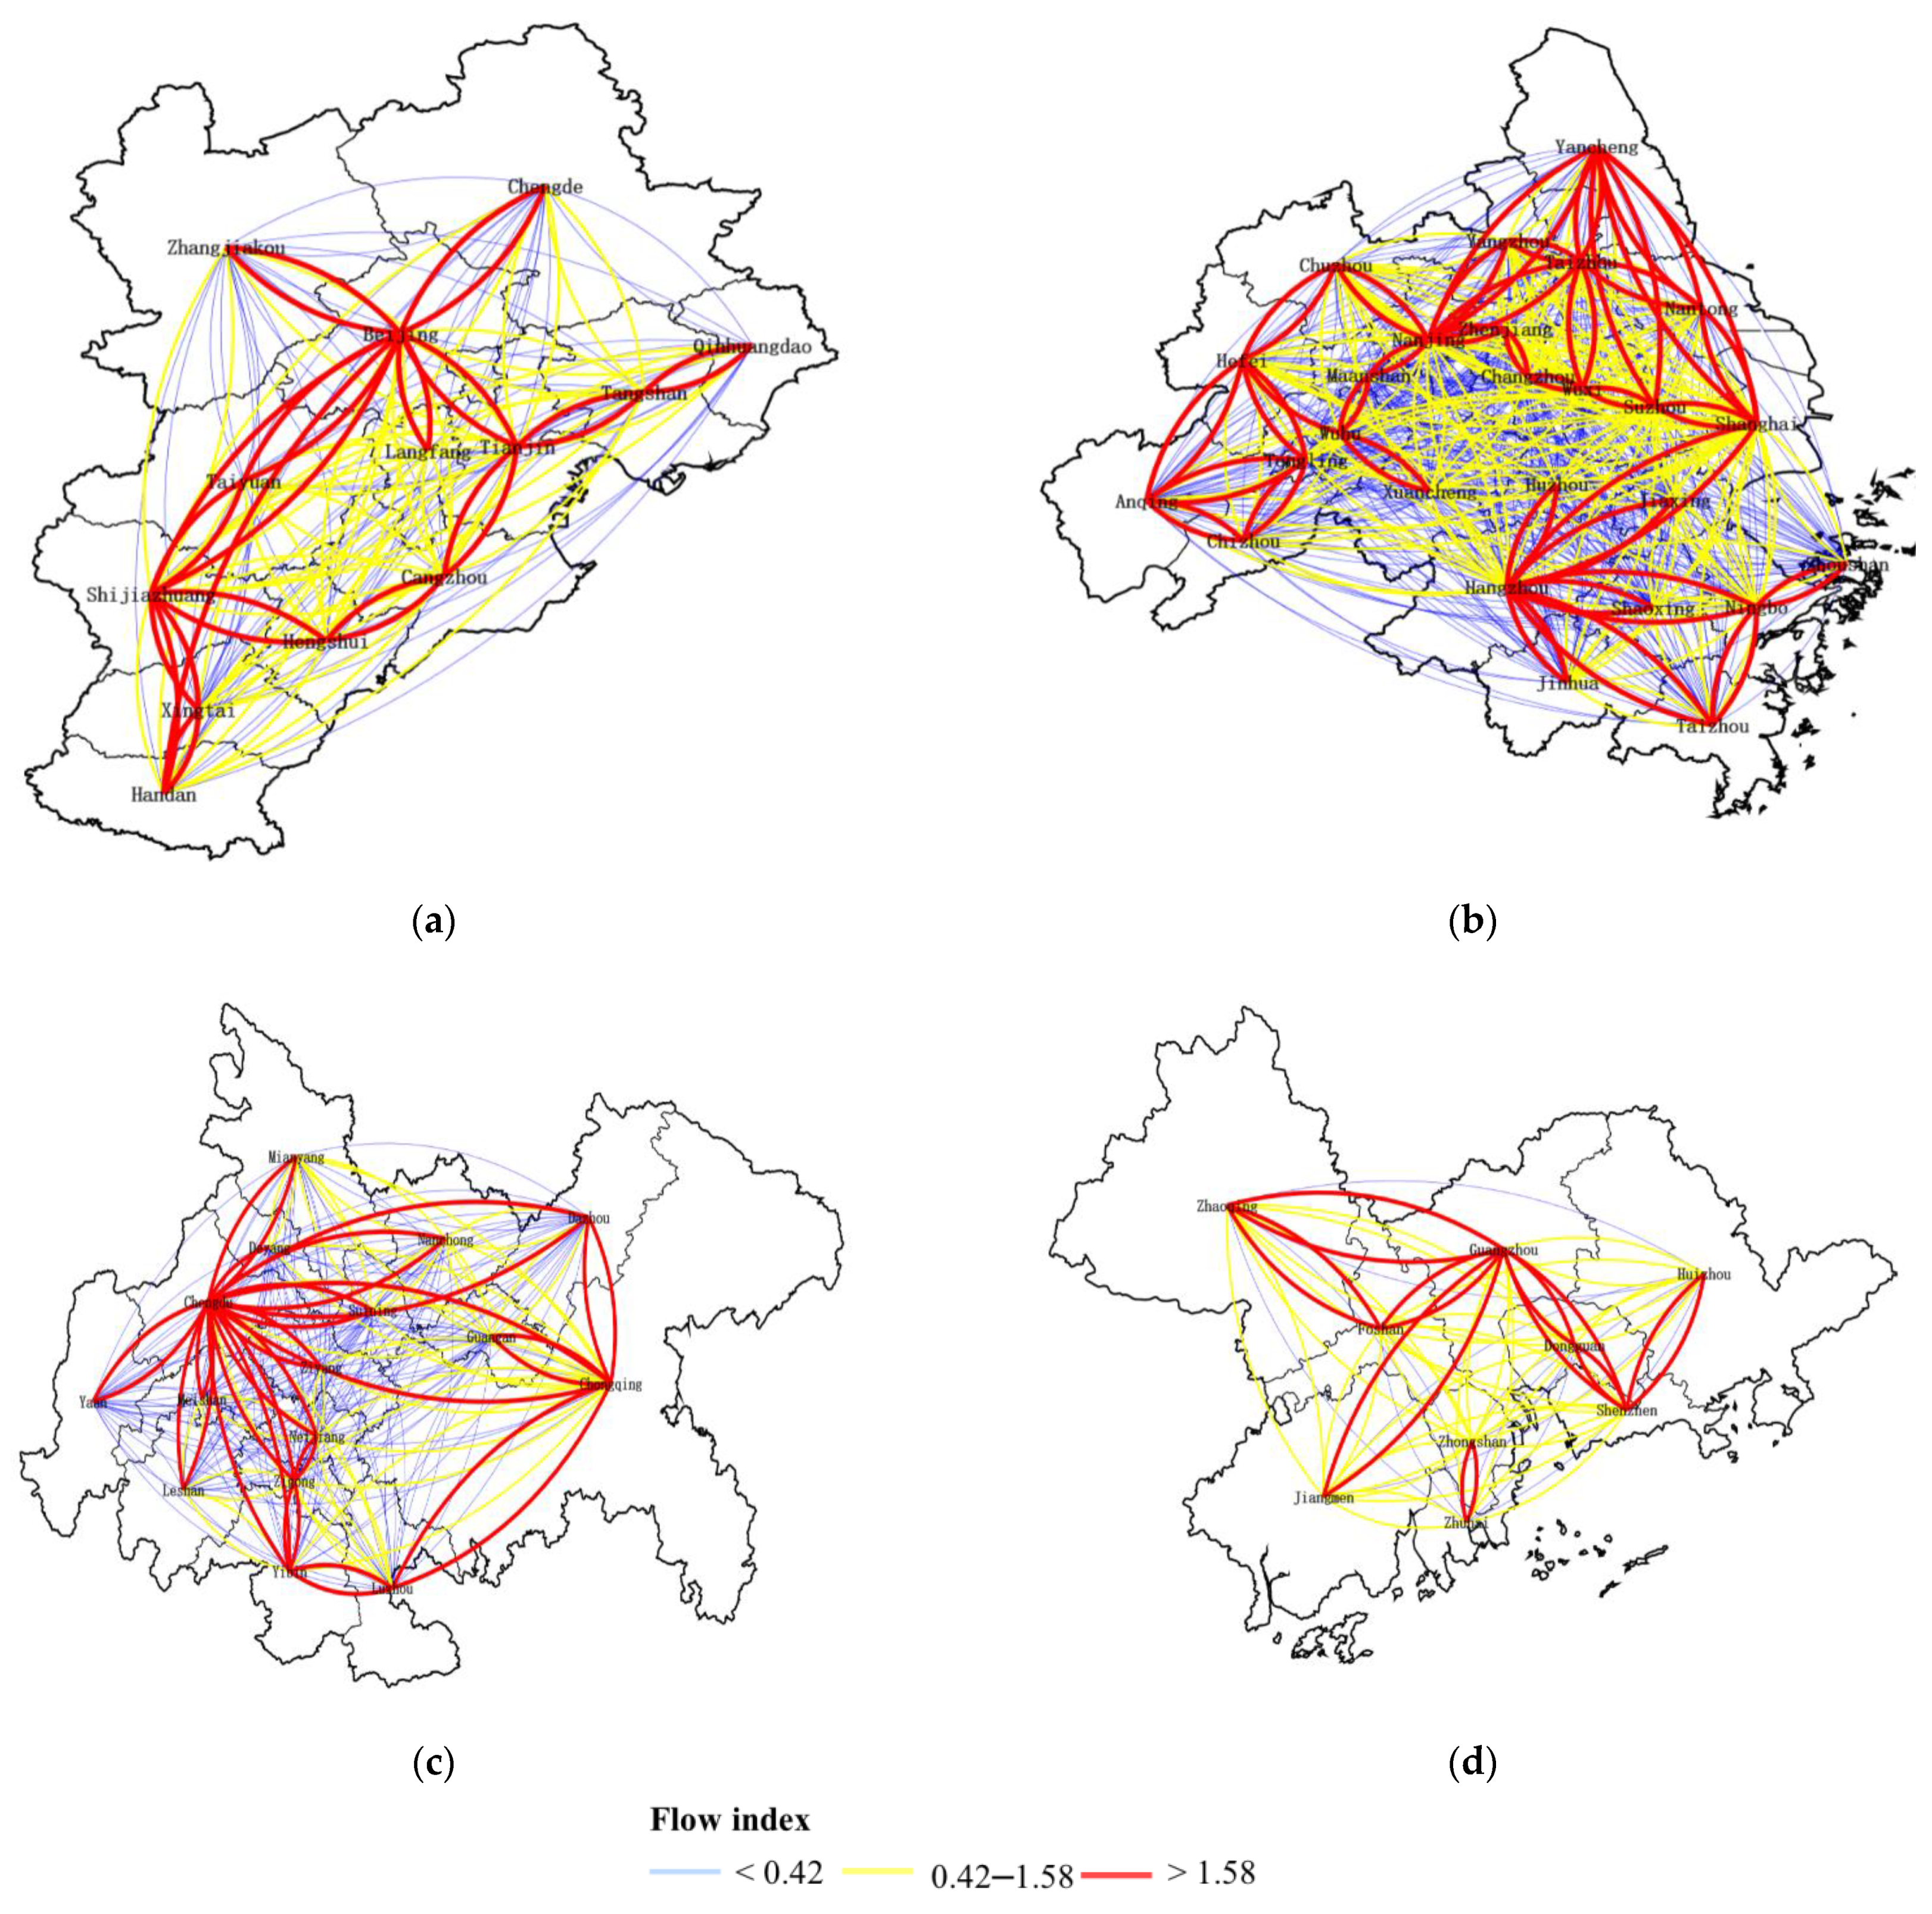
4.2.1. The Spatial Pattern of Population Mobility during Pre-Outbreak Period

Figure 3 shows the spatial pattern of the average daily population flow scale during the pre-outbreak period, which reflects human mobility at normal situation to some extent. The average of the flow distance is about 1150 km. As illustrated by Figure 3, the population flow network is clearly divided by the Hu Line (Heihe-Tengchong Line), showing a high-density pattern in the east and a low-density pattern in the west. The two ends of the Hu Line form a relatively stable population flow pattern [35]. This study finds that the spatial associations of cities to the west of the line are mostly connected in series, and the population flow of these cities occurs mainly to establish connections with other cities through specific gateway cities. For example, Urumqi is a gateway city in Xinjiang, Xi’an and Lanzhou are the gateways to the northwest, and Chengdu and Chongqing are gateway cities in the southwest. The population flow east of the Hu Line is mostly parallel, and the flow between various cities is highly interoperable [36]. The human mobility is mainly distributed in the eastern coastal and central transportation-hub regions, and the rhombus structure formed by the Beijing-Tianjin-Hebei, Pearl River Delta, Yangtze River Delta, and Chengdu-Chongqing urban agglomerations as the apex contains most flows in the country, which directly reflects the important role of these four major agglomerations in the pattern of population flow. Furthermore, the population flow has the characteristics of spatial proximity; that is, population flow mainly occurs between regional core cities and their neighboring cities. This core-periphery structure can be found at both the national and regional scales, which proves that the population outflow area and inflow destination are more prone to migration.
The four agglomerations contain most flows in China, and to better understand their human mobility during the pre-outbreak period, this paper further analyzes the population flow pattern and their internal and external movements in detail, as shown in Figure 4. For Beijing–Tianjin–Hebei urban agglomeration, Beijing, Tianjin, and Shijiazhuang are the core cities and have the highest migration index. It is evident that Beijing–Tianjin–Hebei urban agglomeration has gradually formed the development pattern of the Beijing-Tianjin development axis, the Beijing–Baoding–Shijiazhuang axis, and the Beijing–Tangshan–Qinhuangdao axis. The total population flow within this agglomeration accounts for 48.2% of the total population flow, indicating that this agglomeration is equally attractive to population flow for internal and external cities. For Yangtze River Delta agglomeration, Shanghai, Nanjing, and Hangzhou have the highest population flow. Hangzhou is interconnected mostly with cities in Zhejiang Province, which is inconsistent with some studies [6] in 2016 that found Shanghai has high connectivity with Zhejiang and Jiangsu. Similar to the Beijing–Tianjin–Hebei urban agglomeration, the total population flow within the Yangtze River Delta agglomeration accounts for 51.2% of the total population flow, suggesting that its internal and external flows are relatively balanced. The Chengdu-Chongqing urban agglomeration exhibits a network system centered on Chongqing and Chengdu, of which Chengdu is the main distribution city. It is the strategic support of the Yangtze River Economic Belt, and its population flow accounts for 54.1% of the total population flow. Guangzhou, Shenzhen, and Foshan are the core cities of the Pearl River Delta urban agglomeration. It is one of the most dynamic economic regions in the Asia-Pacific region, and its internal flow accounts for 27.8%, while its external population flow accounts for 72.2%. The significant imbalance in the population flow shows that the Pearl River Delta has a more significant spatial siphon effect on external cities, driving the development of South, Central, and Southwest China.

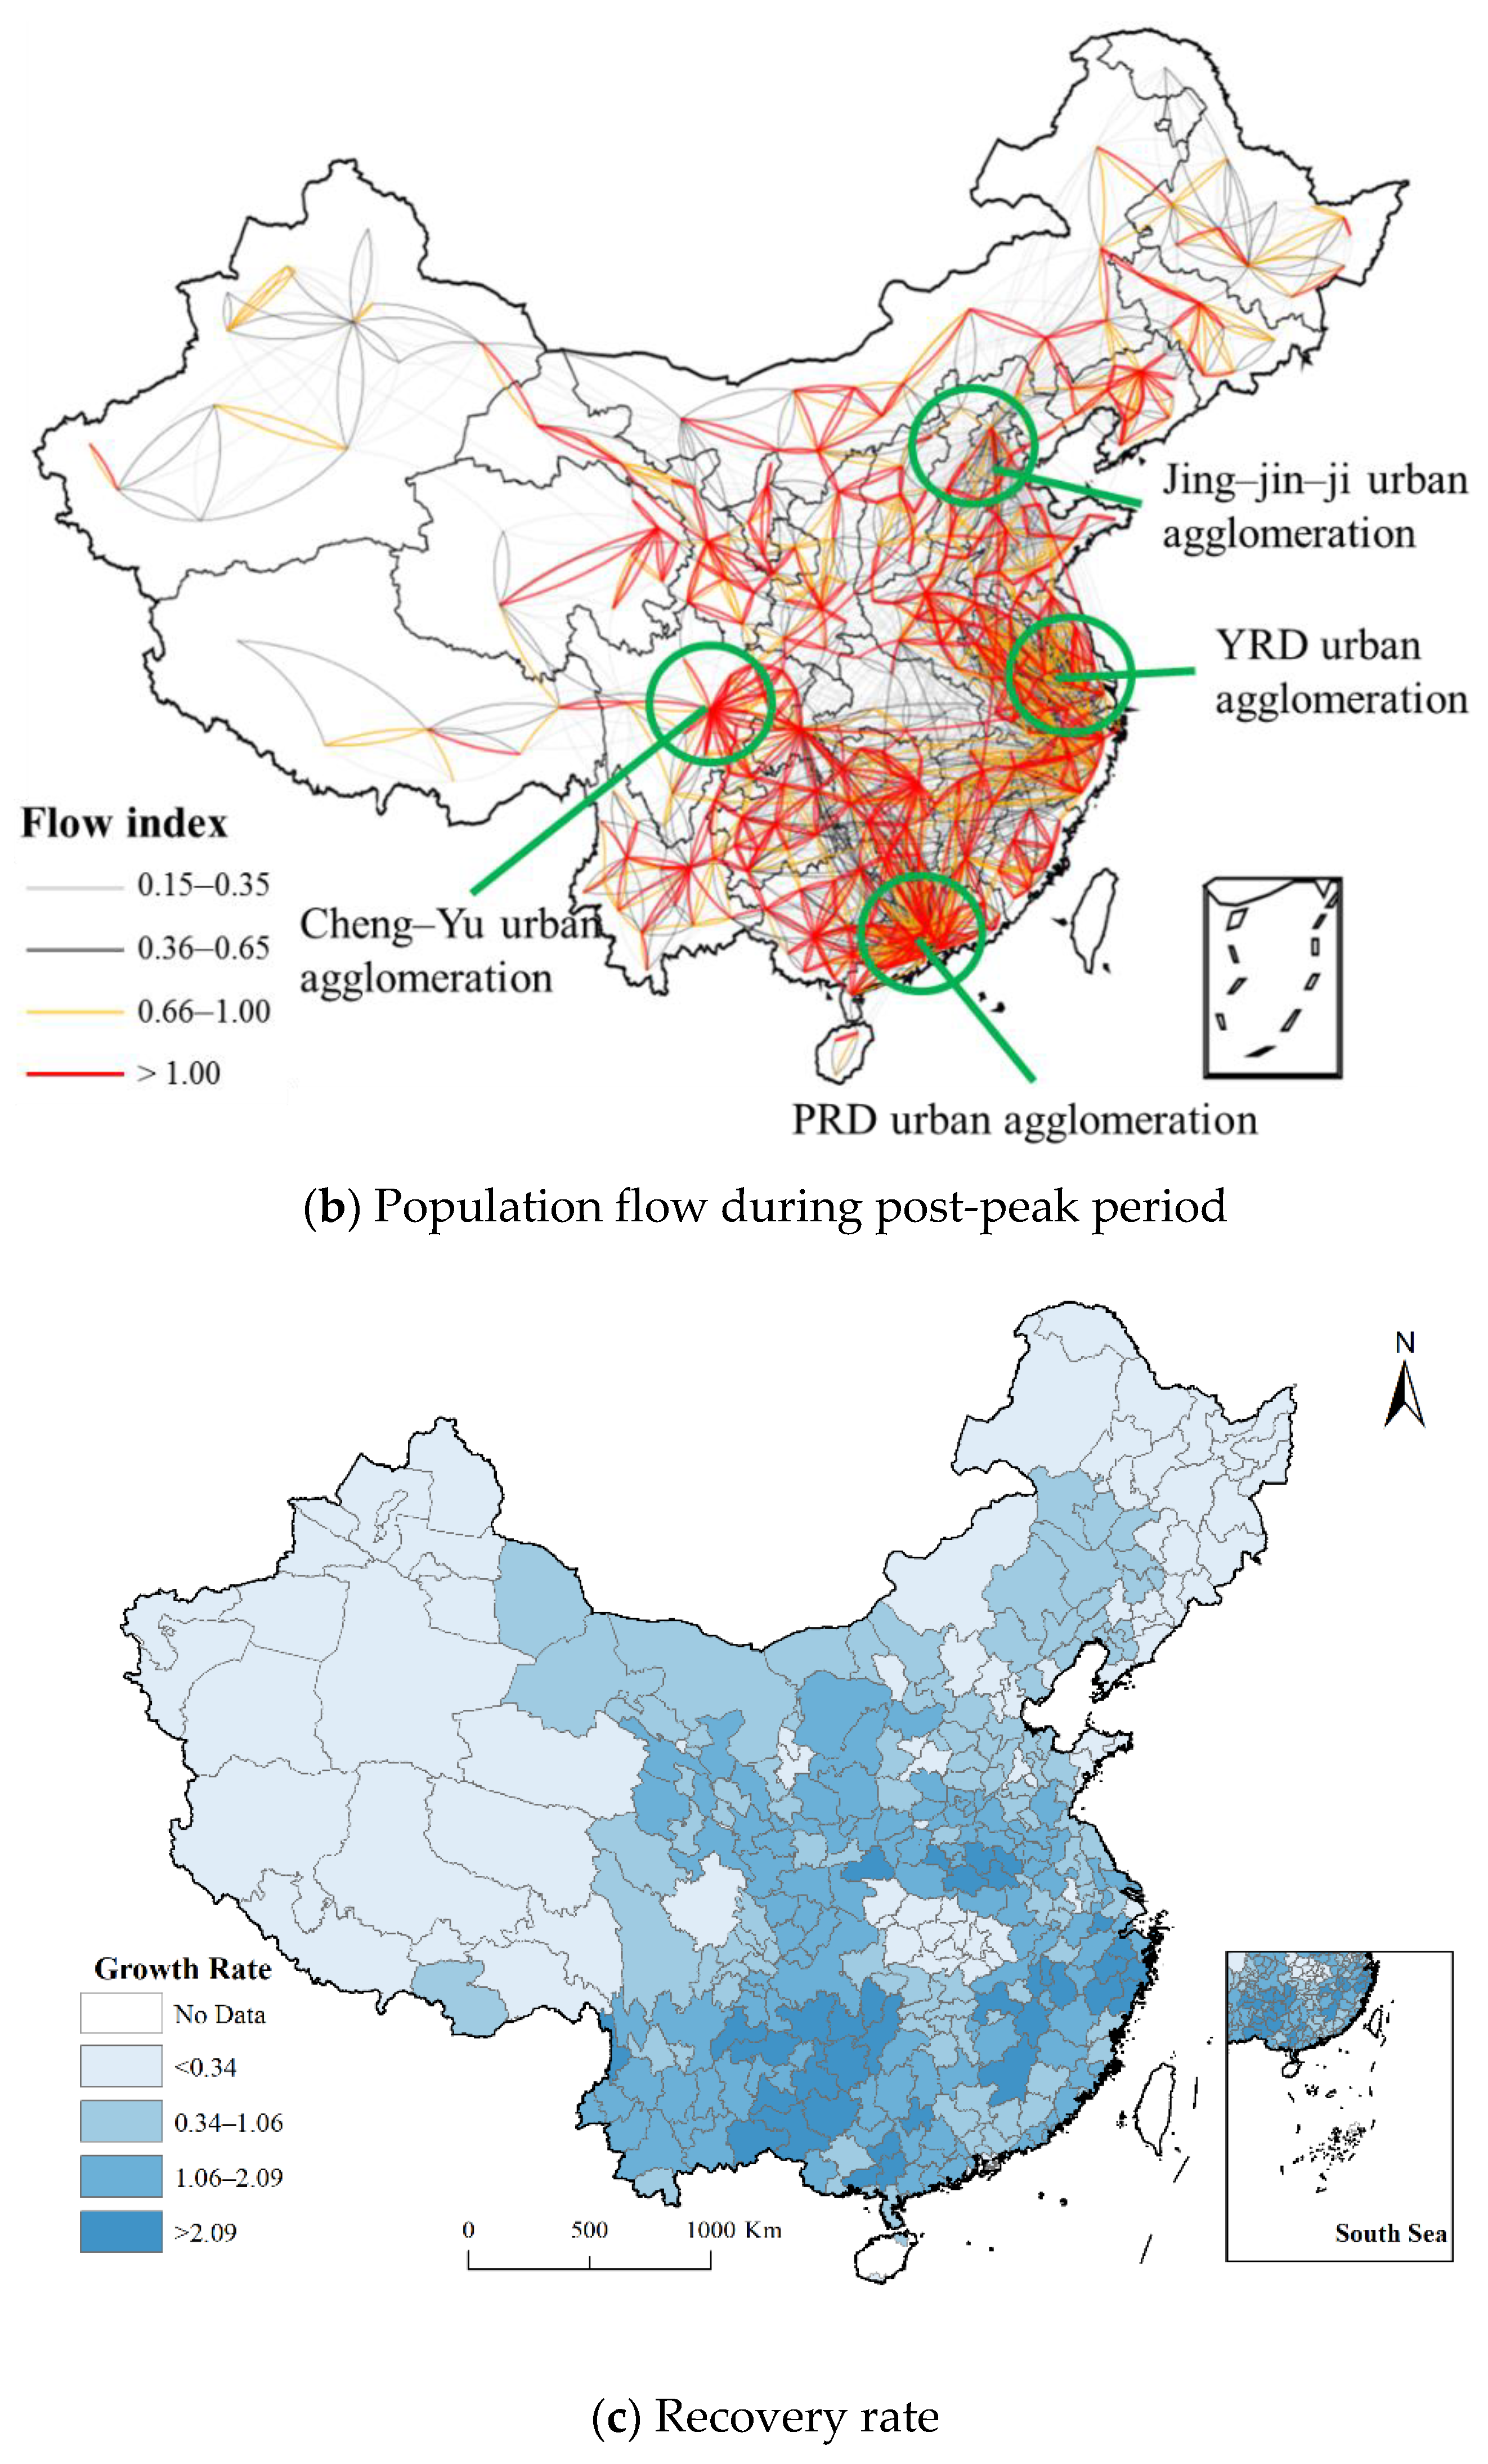
4.2.2. The Spatial Pattern of Population Mobility during Outbreak and Post-Peak Periods

The intensity of population flow dropped significantly during the outbreak period, the distance traveled in the population flow has been significantly shortened (about 483 km), and interprovincial population mobility has almost disappeared. In addition, the overall distribution of intercity population flow is relatively scattered, as illustrated in Figure 5. The four major urban agglomerations and their nearby cities are no longer the main distribution areas. Hubei Province, especially Wuhan City, appears as a hollow in the population flow, which indicates that the impact of the complete lockdown on Wuhan’s population flow was much higher than the impact on other cities in China, reflecting the key role of Hubei Province and Wuhan City in preventing the epidemic.
With the situation of the epidemic basically stable, the population flow gradually recovers during the post-epidemic period. It is found that the intensity of population mobility in China’s provinces has increased significantly, which is closely related to the active promotion of the resumption of work and production in various provinces. The average of the flow distance increased to 725 km. However, most of the intra-provincial population flow is dominated by cities in southern China, such as Guangdong, Shanghai, Jiangsu, and Zhejiang. This is related to the issue of specific regulations on the resumption of work by government. In addition, as seen from Figure 3, some interprovincial flows have begun to gradually appear, and the distribution pattern of population mobility is gradually picking up. To further explore the recovery of cities in this period, the growth rate of population flow (recovery rate) compared with the outbreak period, is calculated. Figure 4 shows that most of the cities with high recovery rates are located in China’s southern provinces, such as cities in Yunnan and Guizhou, whereas cities with the lowest recovery rates are located in Hubei Province. It is notable that the recovery rates in West and Northeast China are also relatively low, which are located along less developed regions. In addition, affected by the culture of ethnic minorities, these regions are relatively closed, resulting in low population exchange activity. Some first-tier cities, such as Beijing had a recovery gap occur. These findings are similar to the resumption studies of Tong et al [13] and Xu et al [14].

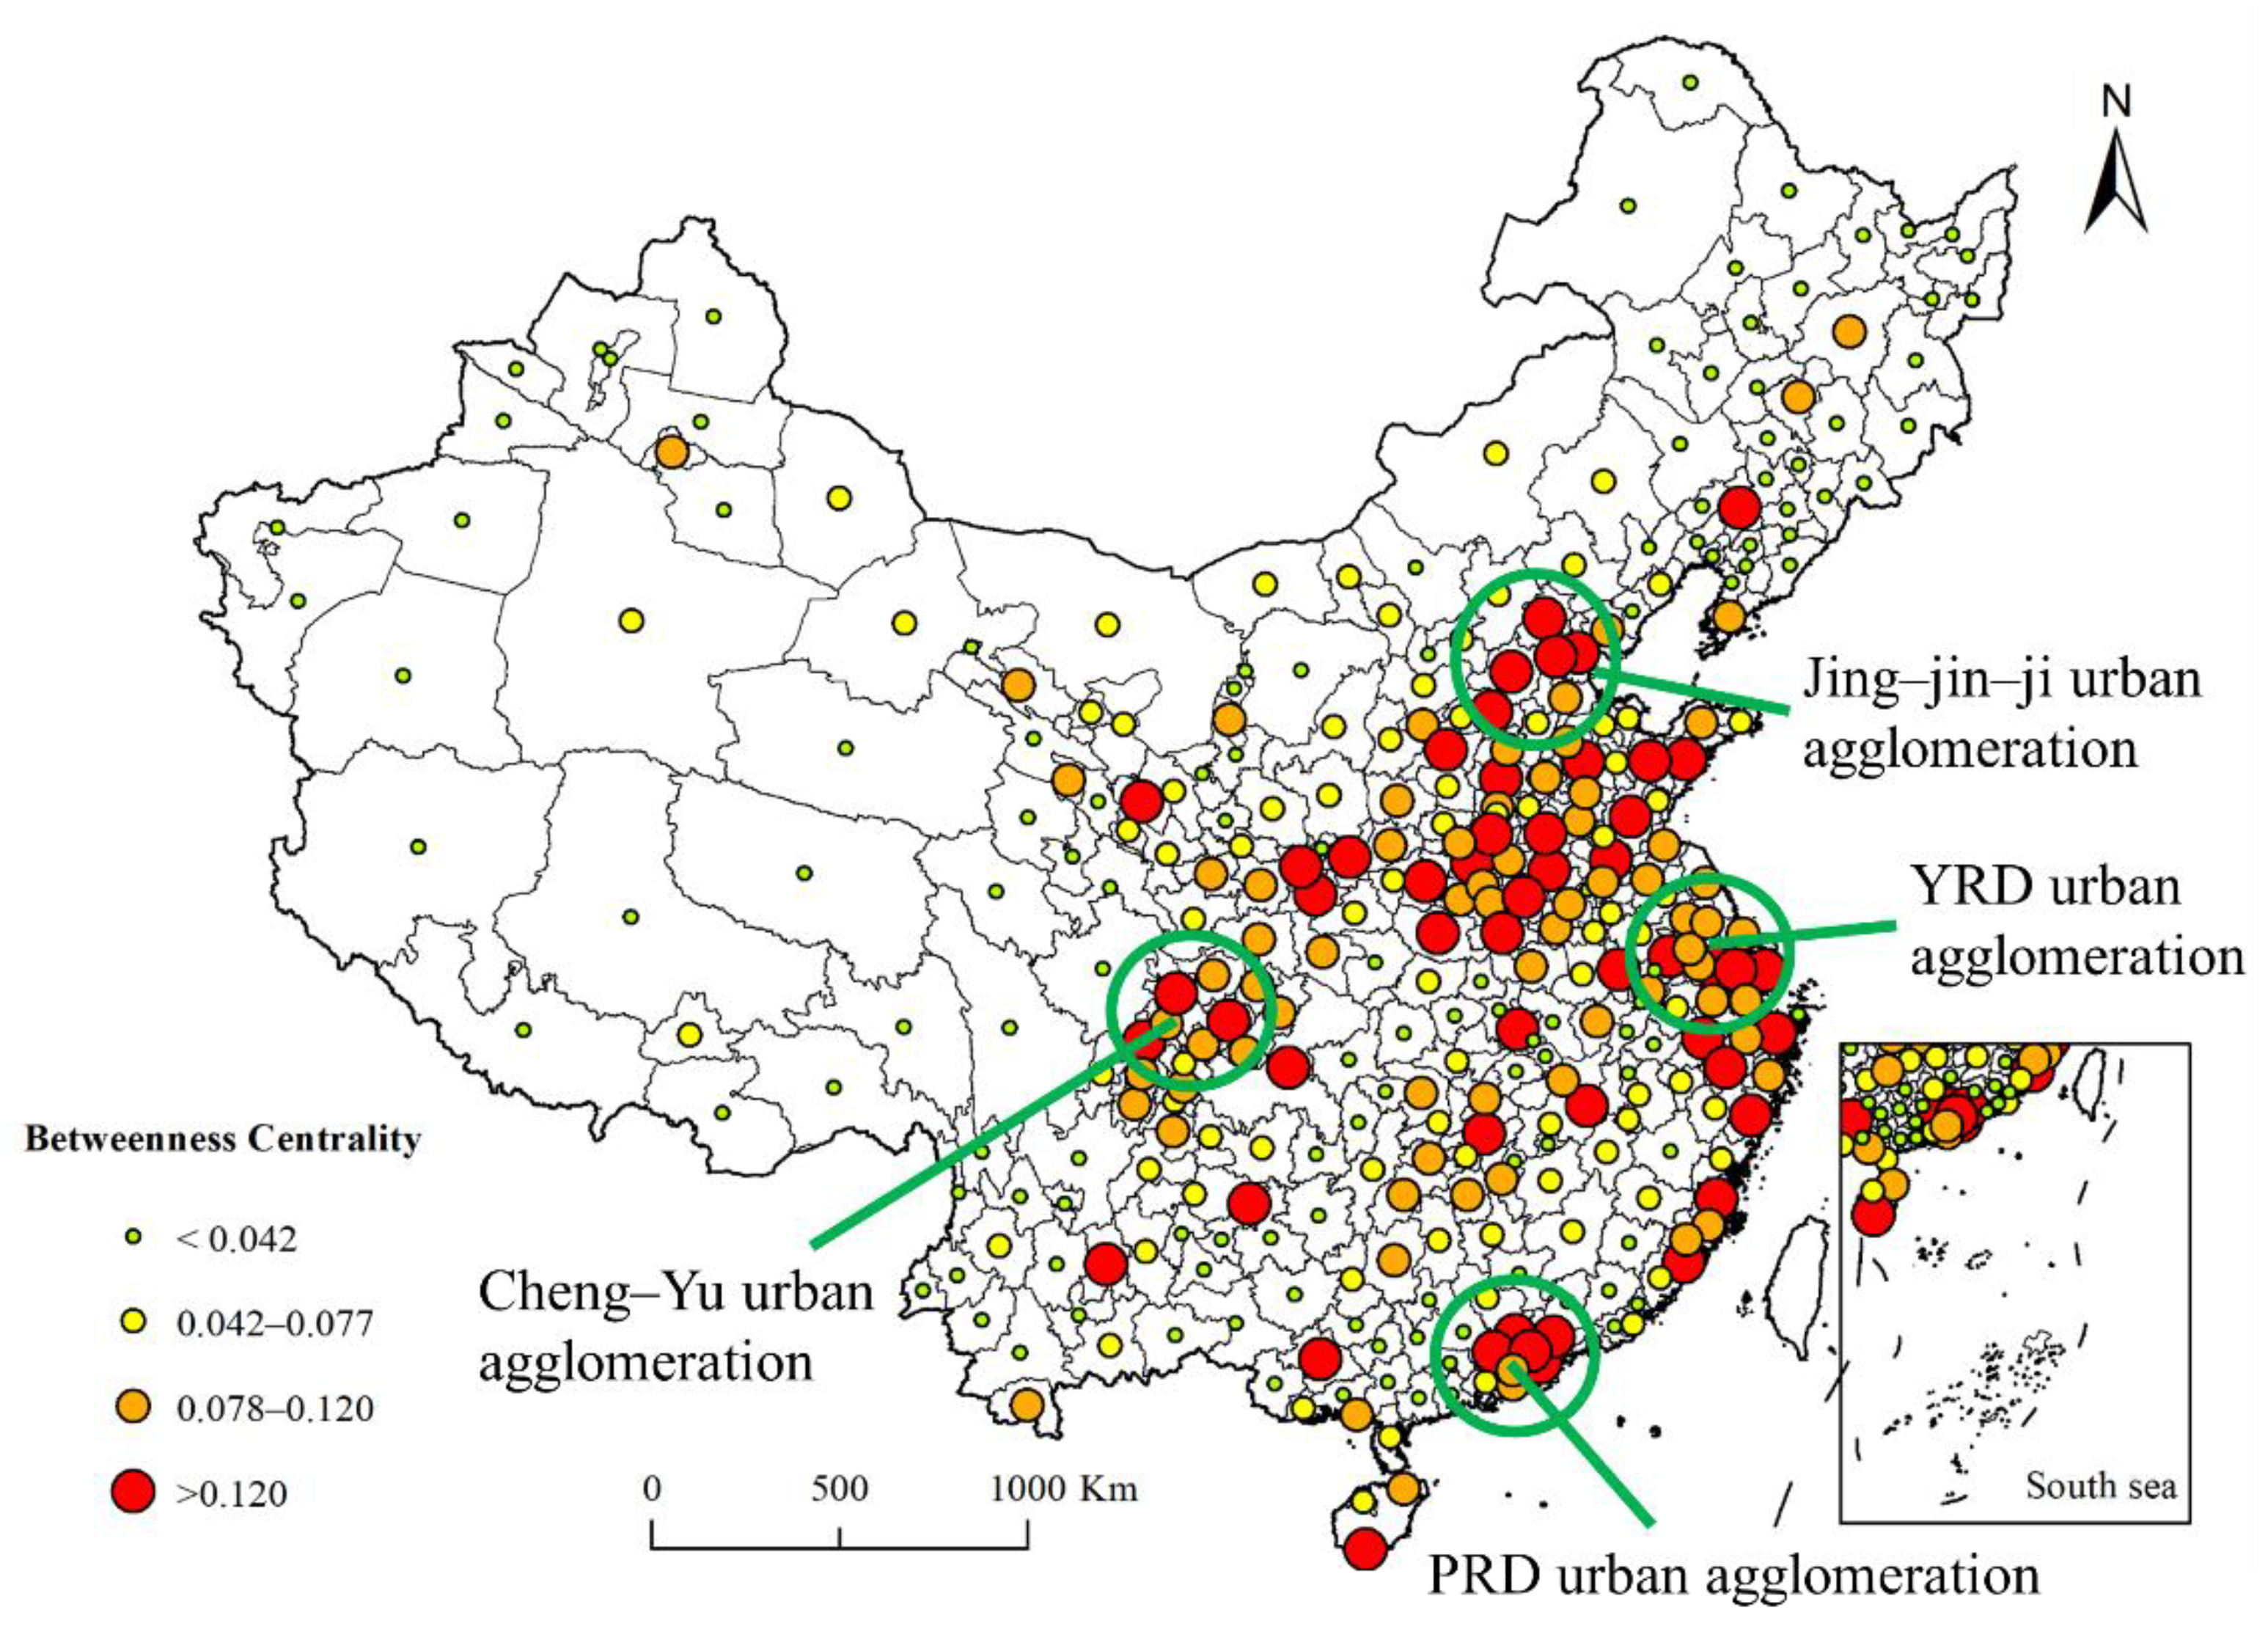
4.3. Changes in the Structure of the Urban Population Mobility Network

As depicted in the above sections, the population mobilities of prefectures were impacted by the COVID-19 epidemic significantly. Actually, human mobility of a city reflects the status of this city in the city network, and in order to further evaluate the changes of the cities’ function impacted by COVID-19, the status and structure of China’s urban network during outbreak period is discussed, which has important practical significance for the management of future public health emergencies between cities. The population mobility network degree, centrality, and clustering of 336 cities in China are calculated during the COVID-19 epidemic. Then, we compare our results with the network structure during a non-pandemic period to reflect the differences in the network status, connectivity, and clustering trends of Chinese cities during the epidemic.
(1) Changes in the urban network status
The degree value can well reflect the importance of different city nodes in the network, that is, the city’s network status. This study uses weighted network methods to calculate the degree value. Due to the large number of prefectures, this study only sorts out the total degree values and ranking of cities that are provincial capitals and above in China during the epidemic outbreak period (Table 2). In general, it was found that there are large discrepancies between the total degree values of each provincial capital city, Beijing ranked first with a total degree value of 2853, while Altay ranked last with a total degree of only 24, with an overall trend of directly under the central government > sub-provincial cities > ordinary provincial capitals > prefecture-level cities, which indicates that during the epidemic period, first-tier cities, regional central cities still produce a non-negligible effect. However, the differences in the network status of cities at different administrative levels in this study are much smaller than those found by Lai et al [36] during a non-pandemic period; for example, the average total degree value of directly administered municipalities is 1.5 times that of sub-provincial cities (2.4 times in existing research), 2.0 times that of ordinary provincial capitals (5.5 times in existing research), and 4.4 times that of prefecture-level cities (9.4 times in existing research). It is reasonable to conclude that the impact of the epidemic outbreak and the network status gap between cities have narrowed. It is worth noting that the total degree of Tianjin during outbreak period was relatively low compared with its administrative level, which was related to the outbreak of infection in department stores on 10 February in Tianjin, which reduced the population flow in Tianjin.
To further analyze the differences between different level cities during the outbreak period, the natural break point classification method (Jenks) was used to classify the total degree values of 336 cities (Table 3), which is similar to the conclusion of existing studies for non-epidemic periods; that is, the hierarchy has a pyramid distribution structure, indicating that hierarchical distribution played an important role in the urban population flow network during the epidemic period. However, unlike in other studies, the network status of some cities was inconsistent with their administrative level. For example, the network status of some cities has been reduced: Wuhan has been reduced from a national network subcenter to a local network center; Xiamen, Jinan, and Qingdao have been reduced from regional to local network centers; and Xi’an has been reduced from a national network subcenter to a regional network center. These cities are more severely affected by the epidemic outbreak and are popular tourist cities and therefore more affected by epidemic control measures than other cities. In addition, there are also a few cities whose network-level status has risen; for example, Nanning has risen from a local network center to a national network subcenter, Zhengzhou and Suzhou have risen from a regional network center to a national network subcenter, and Hengyang has risen from a local to a regional network center. These cities are basically located in the southern regions of China, where the epidemic situation is relatively stable, and have been less affected by the epidemic outbreak so that the population flow did not change substantially.
(2) Changes in urban connectivity
The betweenness centrality of a city node reflects the city’s connectivity in the population flow network. Cities with high betweenness centrality play a role as a bridge in the connection between the regional population flow. This paper used the natural break point classification method to classify the centrality of city nodes (Figure 6). During the outbreak period, the betweenness centrality and total degree show a positive correlation, cities with high betweenness centrality are concentrated primarily in the diamond-shaped region formed by Beijing, Shanghai, Guangzhou, and Chengdu, and most city nodes with high centrality are also located in the well-developed eastern coast region and the central and western provincial capital regions, which is consistent with the findings for the non-pandemic period. Among them, cities such as Beijing, Shanghai, Guangzhou, and Shenzhen still maintained their central functions. However, Wuhan, as a high-value intermediate central city ranks 48th in centrality but only 202nd in terms of the total degree, which may be caused by Wuhan being the epidemic epicenter, receiving the assistance of medical staff and shipments of medical equipment and supplies from all over the country, leading to its high connectivity ranking. Similarly, affected by the epidemic, the centrality value of western cities such as Urumqi and Lanzhou are also significantly higher than their total degrees, becoming a transportation hub city that undertakes population movement during the epidemic. This may be because its location in the northwest region of China is relatively unaffected by the epidemic, and then took on the role of a transfer hub between the western region and other regions. In contrast, Shenyang is an important hub city in the three eastern provinces, its betweenness centrality is less than its total degree value ranking, the reason is that impacted by the epidemic, its population flow is coming primarily from its neighboring cities, which reduces its connectivity.
(3) Changes in urban agglomeration trends
The clustering coefficient is used as a parameter for the local clustering of a network. This study calculates the average clustering coefficient of the entire network during the outbreak as 0.679 based on the clustering coefficient formula, which indicates strong clustering. At the same time, a random network with 336 nodes was constructed, and the average clustering coefficient of this random network was calculated as 0.249, which is much lower than 0.679 of the population network; the average characteristic path length of the random network is 1.501, which is slightly larger than the population network (1.405) in this study, indicating that the population flow network has a shorter average characteristic path length and a higher average clustering coefficient, thus suggesting that the urban population flow network has small-world characteristics during the pandemic period and a certain degree of internal cluster structure [37]. Then, we calculated the cluster structure and obtain the cluster structure distribution of the population mobility network during the epidemic outbreak (Figure 7). According to the number of cities included in the cluster and spatial coverage, the cluster structure is divided into large cluster covering 5 or more provinces, medium cluster covering less than 5 or more than 2 provinces, and small cluster covering 2 or less. The large clusters contain Northwest Cluster composed of 31 cities such as Gansu, Qinghai and Inner Mongolia; Southwest Cluster composed of 38 cities such as Chongqing, Sichuan and Guizhou; Northern Cluster composed of 65 cities such as Beijing, Hebei, Shandong. The three medium clusters include East Cluster composed of 41 cities such as Shanghai, Jiangsu and Zhejiang; South China Cluster composed of 60 cities including Jiangxi, Hunan and Guangxi; Northeast Cluster composed of 40 cities including Liaoning, Jilin and Heilongjiang. The small clusters contain Hubei-Shanxi City Cluster composed of 25 cities, Xinjiang City Cluster composed of 16 cities in Xinjiang, Yunnan Small Cluster composed of 15 cities in Yunnan, Fujian City Cluster composed of 9 cities in Fujian, and Hainan City Cluster composed of 3 cities in Hainan. It can be seen from Figure 7 that during the epidemic outbreak, cities with the same cluster structure are located in adjacent provinces, and the cluster boundaries closely follow provincial boundaries, reflecting the administrative characteristics of the connections between cities in a province, which is inconsistent with the findings of [38] during a non-holiday period and those of Pan et al [38], who found that during the Spring Festival, urban population flow has a trans-provincial clustering structure. The main reason for the results of the analysis is that the epidemic has caused a significant reduction in the distance traveled by the population flow, highlighting the fact that population flow is subject to geospatial factors.

4.4. Discussions and Policy Implications

Comparing the existing findings of human mobility under the COVID-19 pandemic. The COVID-19 pandemic is a major problem facing humanity throughout the world. Rapid and accurate tracking of population flows may therefore be epidemiologically informative. The geographers conducted researches by adopting timely geographic big data and GIS technology, such as the relationship between human mobility and confirmed COVID-19 cases, the evaluation of further spread of the disease cities, in order to better understand the pandemic consequences and how to prevent in the future. By using Baidu migration data, this paper showed that there are about 78.95% and 21.05% movements from Wuhan city to prefectures within Hubei, which is similar to the results of Jia et al [12] in a study (75.67% and 24.33%) by using mobile phone data from individuals leaving or transiting through the prefecture of Wuhan. This suggests that the study of population mobility by using Baidu migration data is feasible to some extent. Impacted by COVID-19, the human mobility decreased steeply in Spring Festival, and the people return is significant reduced in scale and extended of the time span. This is consistent with many of the current studies that have found the number of returning people remained low and stable [11,12,13]. In addition, and similar to the study of Xu et al [11], cities in west China, such as Hohhot, Xining, Yinchuan, and Lhasa, were less effected by the pandemic, due to these cities having a lower level of urbanization, low population density and less developed transportation. These indicate that the Baidu migration data used in this paper can adequately reflect the changes in human mobility during the pandemic.
Comparing human mobility during the pre-outbreak period with the same period in previous years. The specific population movement changes with that in previous periods are assessed to capture the development of prefectures of China in these two years. Compared with previous years, this study reported that popular destinations are still first-tier cities, regional central cities and labor-intensive cities, and the four major urban agglomerations have still embraced most population movements in China. However, some gateway cities, such as Lhasa and Urumqi, have begun to establish certain connections with cities in the central and eastern regions, which is inconsistent with the conclusions of Liu in 2016 [6], illustrating the shift in the labor force back from the eastern regions to the central and western regions due to the shift of industries. Different with the finding in last two years that Shanghai has high connectivity with Zhejiang, this paper found that Hangzhou, as a new-first-tier city, has played a more prominent role in driving the economic development of other cities in Zhejiang in these two years.
Target suggestions for government to control infection can be provided. Although the fact that lockdown measure would lead to the reduction of population flow, thus reducing the contact opportunity between people, is known, it is also necessary to better capture the time and space scope of the specific impact of the epidemic. Firstly, the correlation between population density, population flow from Wuhan (1 to 24 January) and confirmed cases (till 20 February) in prefectures were calculated, the results show that the relationship between population density and confirmed cases is not significant (p = 0.858), but the Pearson between population flow and confirmed cases is 0.96 with p < 0.005, which is similar to the findings of Jia et al [12] and Li et al [39]. This suggests that the assessment of the population flow can reflect the spread of the epidemic to some extent. Secondly, based on the findings of this paper, target suggestions and policies for government to control infection during outbreaks can be provided. In the future, the government’s epidemic prevention should focus more on dense movements in cities, as a larger number of population flows means a higher risk of cross infection incidents. For example, for cities with large outflow degrees, the population outflows should be controlled; for cities with large inflow degrees, the entry of outsiders should be strictly controlled to reduce the risk of the epidemic. Through the analysis and comparison of the network status of prefectures in China during the outbreak period, it is found that under the public health emergencies, although the population flow and the risk of the epidemic is high in eastern China, due to their sound economic foundation and convenient transportation, some cities, like Shanghai, Chengdu and Guangzhou, can still play a leading role for the promotion of work resumption. But some eastern cities, such as Xiamen and Qingdao, are more vulnerable, and many functions of these cities are lost, such as the function of betweenness centrality. On the contrary, for the southwest cities, although their economy is lagging compared with the eastern cities, their functional status is relatively stable under epidemic, and they can also be temporarily used as important functional centers in China, such as Lanzhou. Finally, based on the detailed analysis for the four major urban agglomerations, for public emergencies in the future, the population flow in the inner cities of Chengdu-Chongqing urban agglomeration should be concerned, and for the Pearl River Delta urban agglomeration, the population movement from cities outsider the urban agglomeration should be focused strictly, such as movements from Jiangxi and part of Hunan.
This paper used the data in this study are the population flow weight ratio data from Baidu Migration, although the overall result is relatively reasonable due to the min-max normalization method and can truly reflect the projection of human activity on geographic space, there remains some discrepancy compared with the actual population flow. Baidu is the largest electronic map and LBS provider in China, the migration data is collected if a Baidu Maps user agrees to share their location. These data may not be representative of the population as a whole; for instance, the migration data cannot be captured if a person doesn’t agree to share his/her location or there is no Baidu product in the user’s device, which lead some discrepancy with the actual flows. Next, actual population flow data or other timely location data, such as mobile operators and Google location data, should be integrated into our research to correct and expand the weighted ratio data.

5. Conclusions

Population flow between cities is an important aspect of urban systems research. In this study, we used Baidu Migration data to explore the spatiotemporal patterns and network characteristics of population flow from 1 January to 15 March. The results of this research are of significance for enhancing the awareness of network connections and status changes between cities before and after the epidemic in China. The main findings are as follows:
(1) For temporal characteristics of population flow, the scale of total population flow in China varied significantly in the different periods, showing a trend of pre-outbreak period > post-epidemic period > outbreak period. The first-tier cities and new-first-tier cities have a large population flow. Affected by the control of the epidemic, the population flow of various provinces plunged drastically during the outbreak period, and the population flow of various cities increased gradually when the epidemic eased.
(2) For a spatial pattern of the population flow, during the pre-outbreak period, Hu Line serves to divide a spatial pattern of the dense east and the west. The four major urban agglomerations occupy an important position in the spatial pattern of population flow. During the outbreak period, the spatial distribution of the population flow was relatively scattered, with Hubei Province, especially Wuhan City, appearing as a hollow area. During the post-epidemic period, although the scale of population flow increased, it was primarily focused on intra-provincial flow and mainly concentrated in the southern region.
(3) For the changes of the population flow network structure, compared with the non-epidemic period, the network status gap of cities at different administrative levels was greatly reduced during the outbreak period. And cities with similar cluster structures in China are all neighboring provinces during the outbreak period, reflecting the close administrative characteristics of close connections between cities in the province under outbreak conditions.
This study is of great significance for an in-depth understanding of the spatiotemporal changes in intercity population flow in China and the impact of the epidemic on the characteristics of the urban network structure before and after the epidemic breakout, and it can serve as a reference for the management of public health emergencies between cities in the future. However, there are still some shortcomings in this study. First, the other location data from official or trustworthy entities should be integrated. In addition, we will carry out a comparative analysis of more time-series data to compare urban network changes during the non-epidemic and epidemic periods more deeply. And more driving factors that influencing the population movements and confirmed cases, such as the population density, economy situation, will be introduced to study the spread mechanism of epidemic in depth, thus providing a reference for the future management of public health emergencies on a nationwide scale.

Author Contributions

Conceptualization, Chengming Li; Data curation, Zheng Wu; Formal analysis, Lining Zhu and Li Liu; Funding acquisition, Chengming Li; Investigation, Zheng Wu; Methodology, Chengcheng Zhang; Resources, Chengcheng Zhang; Software, Li Liu; Supervision, Chengming Li; Writing—original draft, Chengcheng Zhang; Writing—review & editing, Chengming Li. All authors have read and agreed to the published version of the manuscript.

Funding

This research was funded by the National Key Research and Development Program of China, 2018YFB2100704; National Natural Science Foundation of China under grant number 41871375 and 41907389.

Institutional Review Board Statement

Not applicable.

Informed Consent Statement

Not applicable.

Data Availability Statement

Not applicable.

Conflicts of Interest

The authors declare no conflict of interest.

References

  1. Wei, Y.; Song, W.; Xiu, C.; Zhao, Z. The rich-club phenomenon of China’s population flow network during the country’s spring festival. Appl. Geogr. 2018, 96, 77–85. [Google Scholar] [CrossRef]
  2. Feng, Z.; Zhang, Y.; Wei, Y.; Zhao, Z.; Pang, R.; Wang, S. Spatial-Temporal Pattern and Dynamic Mechanism of Population Flow of Changchun City During Chunyun Period Based on Baidu Migration Data. Econ. Geogr. 2019, 39, 101–109. [Google Scholar]
  3. Xu, Y.; Shaw, S.L.; Zhao, Z.; Yin, L.; Fang, Z.; Li, Q. Understanding aggregate human mobility patterns using passive mobile phone location data: A home-based approach. Transportation 2015, 42, 625–646. [Google Scholar] [CrossRef]
  4. Wang, X.; Hui, E.; Sun, J. Population migration, urbanization and housing prices: Evidence from the cities in China. Habitat Int. 2017, 66, 49–56. [Google Scholar] [CrossRef]
  5. Paszto, V.; Burian, J.; Macku, K. Covid-19 data sources: Evaluation of map applications and analysis of behavior changes in Europe’s population. Geografie 2020, 125, 171–209. [Google Scholar] [CrossRef]
  6. Liu, W.; Shi, E. Spatial pattern of population daily flow among cities based on ICT: A case study of “Baidu Migration”. J. Geogr. Sci. 2016, 71, 1667–1679. [Google Scholar]
  7. Kraemer, M.U.G.; Sadilek, A.; Zhang, Q.; Marchal, N.; Tuli, G.; Cohn, E.; Hswen, Y.; Perkins, T.; Smith, D.; Reiner, R., Jr.; et al. Mapping global variation in human mobility. Nat. Hum. Behav. 2020, 4, 800–810. [Google Scholar] [CrossRef]
  8. Li, J.; Ye, Q.; Deng, X.; Liu, Y.; Liu, Y. Spatial-Temporal Analysis on Spring Festival Travel Rush in China Based on Multisource Big Data. Sustainability 2016, 8, 1184. [Google Scholar] [CrossRef] [Green Version]
  9. Guo, Y.R.; Cao, Q.D.; Hong, Z.S.; Tan, Y.; Chen, S.; Jin, H.; Tan, K.; Wangm, D.; Yan, Y. The origin, transmission and clinical therapies on coronavirus disease 2019 (COVID-19) outbreak—An update on the status. Mil. Med. Res. 2020, 7, 11. [Google Scholar] [CrossRef] [PubMed] [Green Version]
  10. Sirkeci, I.M. Murat Yüceahin. Coronavirus and Migration: Analysis of Human Mobility and the Spread of COVID-19. Migr. Lett. 2020, 17, 379–398. [Google Scholar] [CrossRef] [Green Version]
  11. Xu, X.; Wang, S.; Dong, J.; Shen, Z.; Xu, S. An analysis of the domestic resumption of social production and life under the COVID-19 epidemic. PLoS ONE 2020, 15, e0236387. [Google Scholar] [CrossRef]
  12. Jia, J.; Lu, X.; Yuan, Y.; Xu, G.; Jia, J.; Christakis, N. Population flow drives spatio-temporal distribution of COVID-19 in China. Nature 2020, 582, 1–11. [Google Scholar] [CrossRef]
  13. Tong, Y.; Ma, Y.; Liu, H. The short-term impact of COVID-19 epidemic on the migration of Chinese urban population and the evaluation of Chinese urban resilience. Acta Geogr. Sin. 2020, 75, 2505–2520. [Google Scholar]
  14. He, L.; Yu, Q.; Li, W.; Li, J.; Yang, D. Inter-City Transportation Demand under the COVID-19 Pandemic. Urban Transp. China 2020, 18, 51–61. [Google Scholar]
  15. Zhou, C.; Su, F.; Pei, T.; Zhang, A.; Du, Y.; Luo, B.; Cao, Z.; Wang, J.; Yuan, W.; Song, C.; et al. COVID-19: Challenges to GIS with Big Data. Geogr. Sustain. 2020, 1, 77–87. [Google Scholar]
  16. Salvati, L.; Serra, P.; Bencardino, M.; Carlucci, M. Re-urbanizing the European City: A Multivariate Analysis of Population Dynamics During Expansion and Recession Times. Eur. J. Popul. 2018, 35, 1–28. [Google Scholar] [CrossRef] [PubMed]
  17. Ruktanonchai, N.; Ruktanonchai, C.; Floyd, J.; Tatem, A. Using Google Location History data to quantify fine-scale human mobility. Int. J. Health Geogr. 2018, 17, 28. [Google Scholar] [CrossRef] [PubMed] [Green Version]
  18. Xu, J.; Li, A.; Li, D.; Liu, Y.; Du, Y.; Pei, T.; Ma, T.; Zhou, C. Difference of urban development in China from the perspective of passenger transport around Spring Festival. Appl. Geogr. 2017, 87, 85–96. [Google Scholar] [CrossRef]
  19. Wang, Y.; Dong, L.; Liu, Y.; Huang, Z.; Liu, Y. Migration patterns in China extracted from mobile positioning data. Habitat Int. 2019, 86, 71–80. [Google Scholar] [CrossRef]
  20. Frith, J.; Saker, M. It Is All About Location: Smartphones and Tracking the Spread of COVID-19. Soc. Media Soc. 2020, 6, 2056305120948257. [Google Scholar] [CrossRef]
  21. Oliver, N.; Lepri, B.; Sterly, H.; Lambiotte, R.; Vinck, P. Mobile phone data for informing public health actions across the COVID-19 pandemic life cycle. Sci. Adv. 2020, 6, eabc0764. [Google Scholar] [CrossRef]
  22. Huang, X.; Li, Z.; Jiang, Y.; Li, X. Twitter, human mobility, and COVID-19. arXiv 2020, arXiv:2007.01100. [Google Scholar]
  23. Apple Inc. Apple and Google Partner on COVID-19 Contact Tracing Technology. 2020. Available online: https://www.apple.com/cz/newsroom/2020/04/apple-and-google-partner-on-covid-19-contacttracing-technology/ (accessed on 8 May 2020).
  24. Bonaccorsi, G.; Pierri, F.; Cinelli, M.; Flori, A.; Galeazzi, A.; Porcelli, F.; Schmidt, A.; Valensise, C.; Scala, A.; Quattrociocchi, W.; et al. Economic and social consequences of human mobility restrictions under COVID-19. Proc. Natl. Acad. Sci. USA 2020, 117, 15530–15535. [Google Scholar] [CrossRef]
  25. Pászto, V.; Burian, J.; Mack, K. Changing Mobility Lifestyle: A Case Study on the Impact of COVID-19 Using Personal Google Locations Data. Int. J. E-Plan. Res. IJEPR 2021, 10, 66–79. [Google Scholar]
  26. Santamaria, C.; Sermi, F.; Spyrato, S.; Lacus, S.; Vespe, M. Measuring the impact of COVID-19 confinement measures on human mobility using mobile positioning data. A European regional analysis. Saf. Sci. 2020, 132, 104925. [Google Scholar] [CrossRef]
  27. Desjardins, M.; Hohl, A.; Delmelle, E. Rapid surveillance of COVID-19 in the United States using a prospective space-time scan statistic: Detecting and evaluating emerging clusters. Appl. Geogr. 2020, 118, 102202. [Google Scholar] [CrossRef]
  28. Wellenius, G.; Vispute, S.; Espinosa, V.; Fabrikant, A.; Tsai, T.; Hennessy, J.; Williams, B.; Gadepalli, K.; Boulanger, A.; Pearce, A. Impacts of state-level policies on social distancing in the United States using aggregated mobility data during the COVID-19 pandemic. arXiv 2020, arXiv:2004.10172. [Google Scholar]
  29. Liu, J.; Zhang, K.; Wang, G. Comparative study on data standardization methods in comprehensive evaluation. Digit. Technol. Appl. 2018, 36, 84–85. [Google Scholar]
  30. Zhao, Z.; Wei, Z.; Pang, R.; Wang, S.; Feng, Z. Alter-based centrality and power of Chinese city network using inter-provincial population flow. J. Geogr. Sci. 2017, 72, 1032–1048. [Google Scholar]
  31. Zhang, X.; Song, Y.; Wang, H.; Song, Y. Epidemic Spreading Combined with Age and Region in Complex Networks. Math. Probl. Eng. 2020, 2020, 1–7. [Google Scholar] [CrossRef]
  32. Jiang, X.; Wang, S.; Yang, Y. Research on China’s Urban Population Mobility Network Based on Baidu LBS Big Data. Popul. Dev. 2017, 23, 13–23. [Google Scholar]
  33. Liu, Z.; Qian, J.; Du, Y.; Wang, N.; Yi, J.; Sun, Y.; Ma, T.; Pei, T.; Zhou, C. Multi-level spatial distribution estimation model of the inter-regional migrant population using multi-source spatio-temporal big data: A case study of migrants from Wuhan during the spread of COVID-19. J. Geo-Inf. Sci. 2020, 22, 147–160. [Google Scholar]
  34. Lai, J.; Pan, J. Spatial pattern of population flow among cities in China during the spring festival travel rush based on ‘Tecent Migration’ data. Hum. Geogr. 2019, 34, 108–117. [Google Scholar]
  35. Qi, W.; Liu, S.; Zhao, M.; Liu, Z. China’s different spatial patterns of population growth based on the “Hu Line”. J. Geogr. Sci. 2016, 26, 1611–1625. [Google Scholar] [CrossRef]
  36. Zhao, Z.; Wei, Z.; Pang, R.; Yang, R.; Wang, S. Spatiotemporal and structural characteristics of interprovincial population flow during the 2015 Spring Festival travel rush. Prog. Geogr. 2017, 36, 952–964. [Google Scholar]
  37. Watts, D.; Strogatz, S. Collective dynamics of ‘small-world’ networks. Nature 1998, 393, 440–442. [Google Scholar] [CrossRef] [PubMed]
  38. Pan, J.; Lai, J. Research on spatial pattern of population mobility among cities: A case study of “Tencent Migration” big data in “National Day-Mid-Autumn Festival” vacation. Geogr. Res. 2019, 38, 1678–1693. [Google Scholar]
  39. Li, H.; Cheng, Z.; Huang, Y.; Liu, J. Study on the relationship between the 2019 Novel Coronavirus Disease epidemic in China and population migration from Wuhan. Chin. J. Med. Sci. Res. Manag. 2020, 33, E007. [Google Scholar]
Figure 1. Total population flow in various provinces in China.
Ijgi 10 00145 g001
Figure 2. Net population flow in China’s provincial capital cities.
Ijgi 10 00145 g002
Figure 3. Spatial pattern of the average daily population flow.
Ijgi 10 00145 g003
Figure 4. Spatial patterns of population flow in the four major agglomerations. (a) Beijing-Tianjin-Hebei urban agglomeration; (b) Yangtze River Delta agglomeration; (c) Chengdu-Chongqing urban agglomeration; (d) Pearl River Delta urban agglomeration.
Ijgi 10 00145 g004
Figure 5. Spatial pattern of the average daily population flow and recovery rate. (a) Population flow during outbreak period, (b) Population flow during post-peak period, (c) Recovery rate.
Ijgi 10 00145 g005aIjgi 10 00145 g005b
Figure 6. Betweenness centrality in the outbreak period.
Ijgi 10 00145 g006
Figure 7. Urban clustering distribution.
Ijgi 10 00145 g007
Table 1. Description of the Baidu migration data.
OrderCity of ImmigrationRatioCity of EmigrationRatio
1City B23.1%City F34.1%
2City C18.0%City G14.0%
3City D14.1%City H11.1%
100City W0.2%City S1.0%
Table 2. Degree and ranking of cities at different administrative levels.
Administrative LevelTotal DegreeRankAdministrative LevelTotal DegreeRank
Directly administered municipalityProvincial capitals
Beijing28531Changsha17819
Shanghai24812Nanning150511
Chongqing17828Shanghai145012
Tianjin114023Hefei136113
Average2064 Zhengzhou130315
Sub-provincial cityKunming117321
Shenzhen24213Lanzhou112224
Guangzhou24164Fuzhou90834
Chengdu24015Shijiazhuang88836
Shenyang18247Guiyang87940
Nanjing133214Nanchang85543
Hangzhou128616Taiyuan82347
Dalian124417Urumqi73374
Changchun118219Lhasa69481
Harbin118120Xining69083
Qingdao106025Hohhot65793
Ningbo105127Yinchuan598117
Jinan97929Average1025
Xi’an93631Prefecture level city average472
Xiamen81949
Wuhan440202
Average1371
Table 3. Urban hierarchy in the population flow network.
Level (Total Network Value)City
National network center (>2000)Beijing, Shanghai, Shenzhen, Guangzhou, Chengdu, Dongguan
National network subcenter (1301–2000)Shenyang, Chongqing, Changsha, Suzhou, Nanning, Haikou, Hefei, Nanjing, Zhengzhou
Regional network center
(1001–1300)
Hangzhou, Dalian, Foshan, Changchun, Harbin, Kunming, Hengyang, Tianjin, Lanzhou,
Qingdao, Xi’an, Ningbo
Local network center
(501–1000)
134 cities including Yongzhou, Jinan, Yancheng, Zhoukou, Ganzhou, Fuzhou, Linyi, Shijiazhuang
Local network nodes (<500)185 cities including Danzhou, Kashgar, Ma’anshan, Liupanshui, Baoshan, Putian, Yueyang, Xiaogan, Datong
Publisher’s Note: MDPI stays neutral with regard to jurisdictional claims in published maps and institutional affiliations.

