
Effectiveness of Memorizing an Animated Route—Comparing Satellite and Road Map Differences in the Eye-Tracking Study


Department of Cartography and Geomatics, Faculty of Geographical and Geological Sciences, Adam Mickiewicz University, 61-712 Poznań, Poland
ISPRS Int. J. Geo-Inf. 2021, 10(3), 159; https://0-doi-org.brum.beds.ac.uk/10.3390/ijgi10030159
Submission received: 21 January 2021
/
Revised: 25 February 2021
/
Accepted: 11 March 2021
/
Published: 12 March 2021
(This article belongs to the Special Issue Multimedia Cartography)
Abstract
:There is no consensus on the importance of satellite images in the process of memorizing a route from a map image, especially if the route is displayed on the Internet using dynamic (animated) cartographic visualization. In modern dynamic maps built with JavaScript APIs, background layers can be easily altered by map users. The animation attracts people’s attention better than static images, but it causes some perceptual problems. This study examined the influence of the number of turns on the effectiveness (correctness) and efficiency of memorizing the animated route on different cartographic backgrounds. The routes of three difficulty levels, based on satellite and road background, were compared. The results show that the satellite background was not a significant factor influencing the efficiency and effectiveness of route memorizing. Recordings of the eye movement confirmed this. The study reveals that there were intergroup differences in participants’ visual behavior. Participants who described their spatial abilities as “very good” performed better (in terms of effectiveness and efficiency) in route memorizing tasks. For future research, there is a need to study route variability and its impact on participants’ performance. Moreover, future studies should involve differences in route visualization (e.g., without and with ephemeral or permanent trail).
1. Introduction
Cartographic animations often depict spatio-temporal phenomena. They use dynamic variables defined by DiBiase et al. [1] to make the impression of dynamic change of visual variables such as the movement of point symbols [2,3]. Nowadays, popular information (e.g., The Guardian, Business Insider) and educational services (e.g., openculture.com, battlefields.org) use animated maps. Animation has become ubiquitous, not only in cartography but also as a visualization tool in other areas such as medicine [4], gaming [5], virtual reality [6], or architecture [7]. The animation method is very successful in non-conventional cartographic products such as anaglyphs, along with the use of timeline [8]. Despite its popularity, animation faces several perceptual problems [9,10]. Most of them are related to the fact that working memory is not able to store a large amount of information, which appears in subsequent scenes of the animated map [11]. This problem translates into the ability to memorize information, such as the route [12].
Current research in cartography has confirmed the fact that animated maps are more demanding than their static counterparts in some map-reading tasks [13,14,15]. This is mainly since, as Kraak [16] notes, changes on the map may be different (e.g., appearance/disappearance, increase/decrease, or shrink/expand). However, some animated maps may still be more effective than others. More abstract maps support route remembering much more than those having many details [17]. Satellite photographs are more detailed than abstract images and might lead to cognitive overload [18]. However, abstract maps require symbol interpretation, and therefore, a priori knowledge [19]. Several factors could influence the perceptive processing of each cartographic background. Some are related to individual features of map users [20]. Others could be related to spatial or cartographic factors such as screen resolution [21] or location of areas of interest [22]. The growing number of details on the map is associated with technological development but also with the fact that people trust images that are more realistic or graphically attractive [23,24]. Effectiveness in reading animated maps is also dependent on the difficulty of the map-reading task. Regarding memorizing the route, it can be the number of turns or the length of the entire route. Keil et al. [25] noticed that adding landmark pictograms after a route learning task leads to a decrease in effectiveness and an increase in higher false alarm rates. Recent research shows that the effectiveness and efficiency of a given map can be explained by how the user observes it. In this case, eye-tracking studies are helpful [26,27].
Eye-tracking is an objective method for assessing the user’s visual strategy while memorizing and then recalling the route from memory. It can assess how people visually process maps and the visual processing may affect how efficiently and effectively people memorize a route. The user’s eye movement analysis provides many useful indicators that complement standard methods, such as the questionnaire [28]. The most basic metrics are fixations—relatively stationary visual gaze on a single location, and saccades—a rapid movement of gaze to another location [29]. However, during observation of a cartographic animation, smooth pursuit occurs. This is a slow eye-tracking of a moving stimulus [30]. However, both saccadic and pursuit eye movement are independent and, in many circumstances, these two types of eye movement act conjointly, e.g., saccades supplement smooth pursuit [31]. Differences, e.g., in time to the first fixation or the length of the saccades between individual persons in the sample group, may explain different visual strategies depending on the characteristics such as gender or education. Some studies showed that age differences in route memorization are a crucial factor, and young adults are more effective in this type of task [32]. However, extending the research to an older group of people could support other interesting results. Knowing how people recall the route from memory and what is the actual effectiveness and efficiency concerning the degree of difficulty and the cartographic background is helpful for dynamic map designers [33]. Intergroup differences sometimes explain the reasons for the different effectiveness and efficiency of map-based route memorizing tasks [34,35].
Concerning issues raised, several questions arise: does the complexity (number of turns, dot speed) of the animated route have the same impact on the effectiveness and efficiency of maps with road and satellite background? Does the user’s visual behavior (eye movement metrics) differ depending on the cartographic background? Are there intergroup differences in the study sample? To answer the question posed, conducted research involves users route memorizing tasks and eye-tracking technology. It is also significant to distinguish between map-based route learning, which is an application in this study, from navigational route learning and wayfinding. Map-based route learning is a situation in which a user studies a map alone, which might precede further spatial navigation [36]. The main goal of this research is to determine the effectiveness and efficiency in route memorizing tasks on the basis of animated maps with a different cartographic background. To reach this goal, this study developed a set of animated maps with road and satellite backgrounds based on Google Maps. Additionally, to examine how the effectiveness and efficiency change concerning the complexity of the route, this study took into account the variable number of turns between individual maps. In order to define individual and intergroup differences between users’ visual behavior, this study used eye movement registration.
2. Related Research
Klippel et al. [13] presented a study based on animated route maps. They found that spatial chunking of route segments is a helpful strategy. The experimental procedure of that study included two groups (static and dynamic conditions). In the static presentation, the route was visible on a map. In the dynamic conditions, the researchers used an animated route. The participants’ task was to give verbal instructions on the basis of the route they saw. Klippel et al. [13] concluded that static presentation allows more spatial chunking than an animated map.
Assessing the performance of route recalling was conducted in the experiment by Tom and Denis [37]. They found that participants memorized routes better when they processed landmarks rather than street names. In the route comparison task, landmark information was also responsible for higher efficiency (less time needed for response). In their conclusions, Tom and Denis [37] confirmed the significant impact of landmarks on route perception. Tom and Tversky [38] presented another route-remembering study based on street names and landmarks. They referred to previous studies and claimed that names of landmarks were more vivid and distinctive than street names. They concluded that vividness/distinctiveness is a major factor of route memorization. This corresponds to Cybulski and Medyńska-Gulij’s [39] findings that cartographic redundancy is influential in the change detection of animated stimuli.
Designing an animated route map is possible, thanks to a vast number of available tools (on-line applications, commerce software, etc.). However, there is less research on the effectiveness of these maps. Çöltekin et al. [17] found that more abstract road maps are more effective in the process of memorizing the route by men than those using a satellite background. They also determined the impact of spatial abilities on memorizing the route and found that people who described their spatial abilities as high (in mental rotation task) performed slower with satellite images.
Previous studies in visualization by Brucker et al. [40] confirmed these conclusions. However, the research did not determine what impact the route’s difficulty has on the effectiveness and efficiency of these maps. The study of the degree of realism, which is related to the complexity of the image, was the subject of studies on memorizing the route in virtual reality [41]. They confirmed that mixed realism (high realism with abstract elements) is the most optimal solution in route-learning tasks in virtual reality. Lokka and Çöltekin [42] point out that the realistic view was the most attractive to users even though it was not the most effective. General studies on the effectiveness of memorizing information based on animation are mostly unanimous and state that animation is more problematic than a static image [8,42]. However, a certain novelty in this type of study reveals how to estimate user correct response. In cartographical effectiveness studies, the user’s response could be accurate or inaccurate [8,43,44,45]. On several occasions, researchers have highlighted the need to develop a more detailed effectiveness measurement methodology [8,46,47,48]. This article relates to previously applied research approaches that allow for estimating the effectiveness of memorizing the route in map-based tasks.
In addition to effectiveness and efficiency tests, cartographic research increasingly includes methods that allow for the registration of the user’s eye movement [49,50,51,52]. In an animated route, a crucial element is the movement of an object that goes from the origin to the destination point. Krassanakis et al. [50] researched this issue with the use of eye-tracking equipment. They noted that object movement is the main factor that attracts the user’s attention, while several static details could distract user attention. This knowledge is based on eye movement recording and suggests that a more realistic background could cause distraction and may result in less effective route memorization. In Dong et al.’s [52] research, they found that various visual variables of animated maps differ in the level of effectiveness, and the size proved to be the most effective. However, in memorizing the route on the basis of animation, the most crucial variable is location because the object moves from the starting point to the destination point. The eye-tracking used in cartographic studies often uses devices with 60-120 Hz sampling frequency and 0.5° of spatial accuracy and were validated as suitable for scientific research [53,54].
Unfortunately, there are not many studies dedicated to animated routes in particular in the cartographic context. For this reason, the presented research is a voice in the discussion on the impact of the number of turns on the effectiveness and efficiency of animated routes and their visual perception.
3. Methodology
3.1. Animated Route Maps
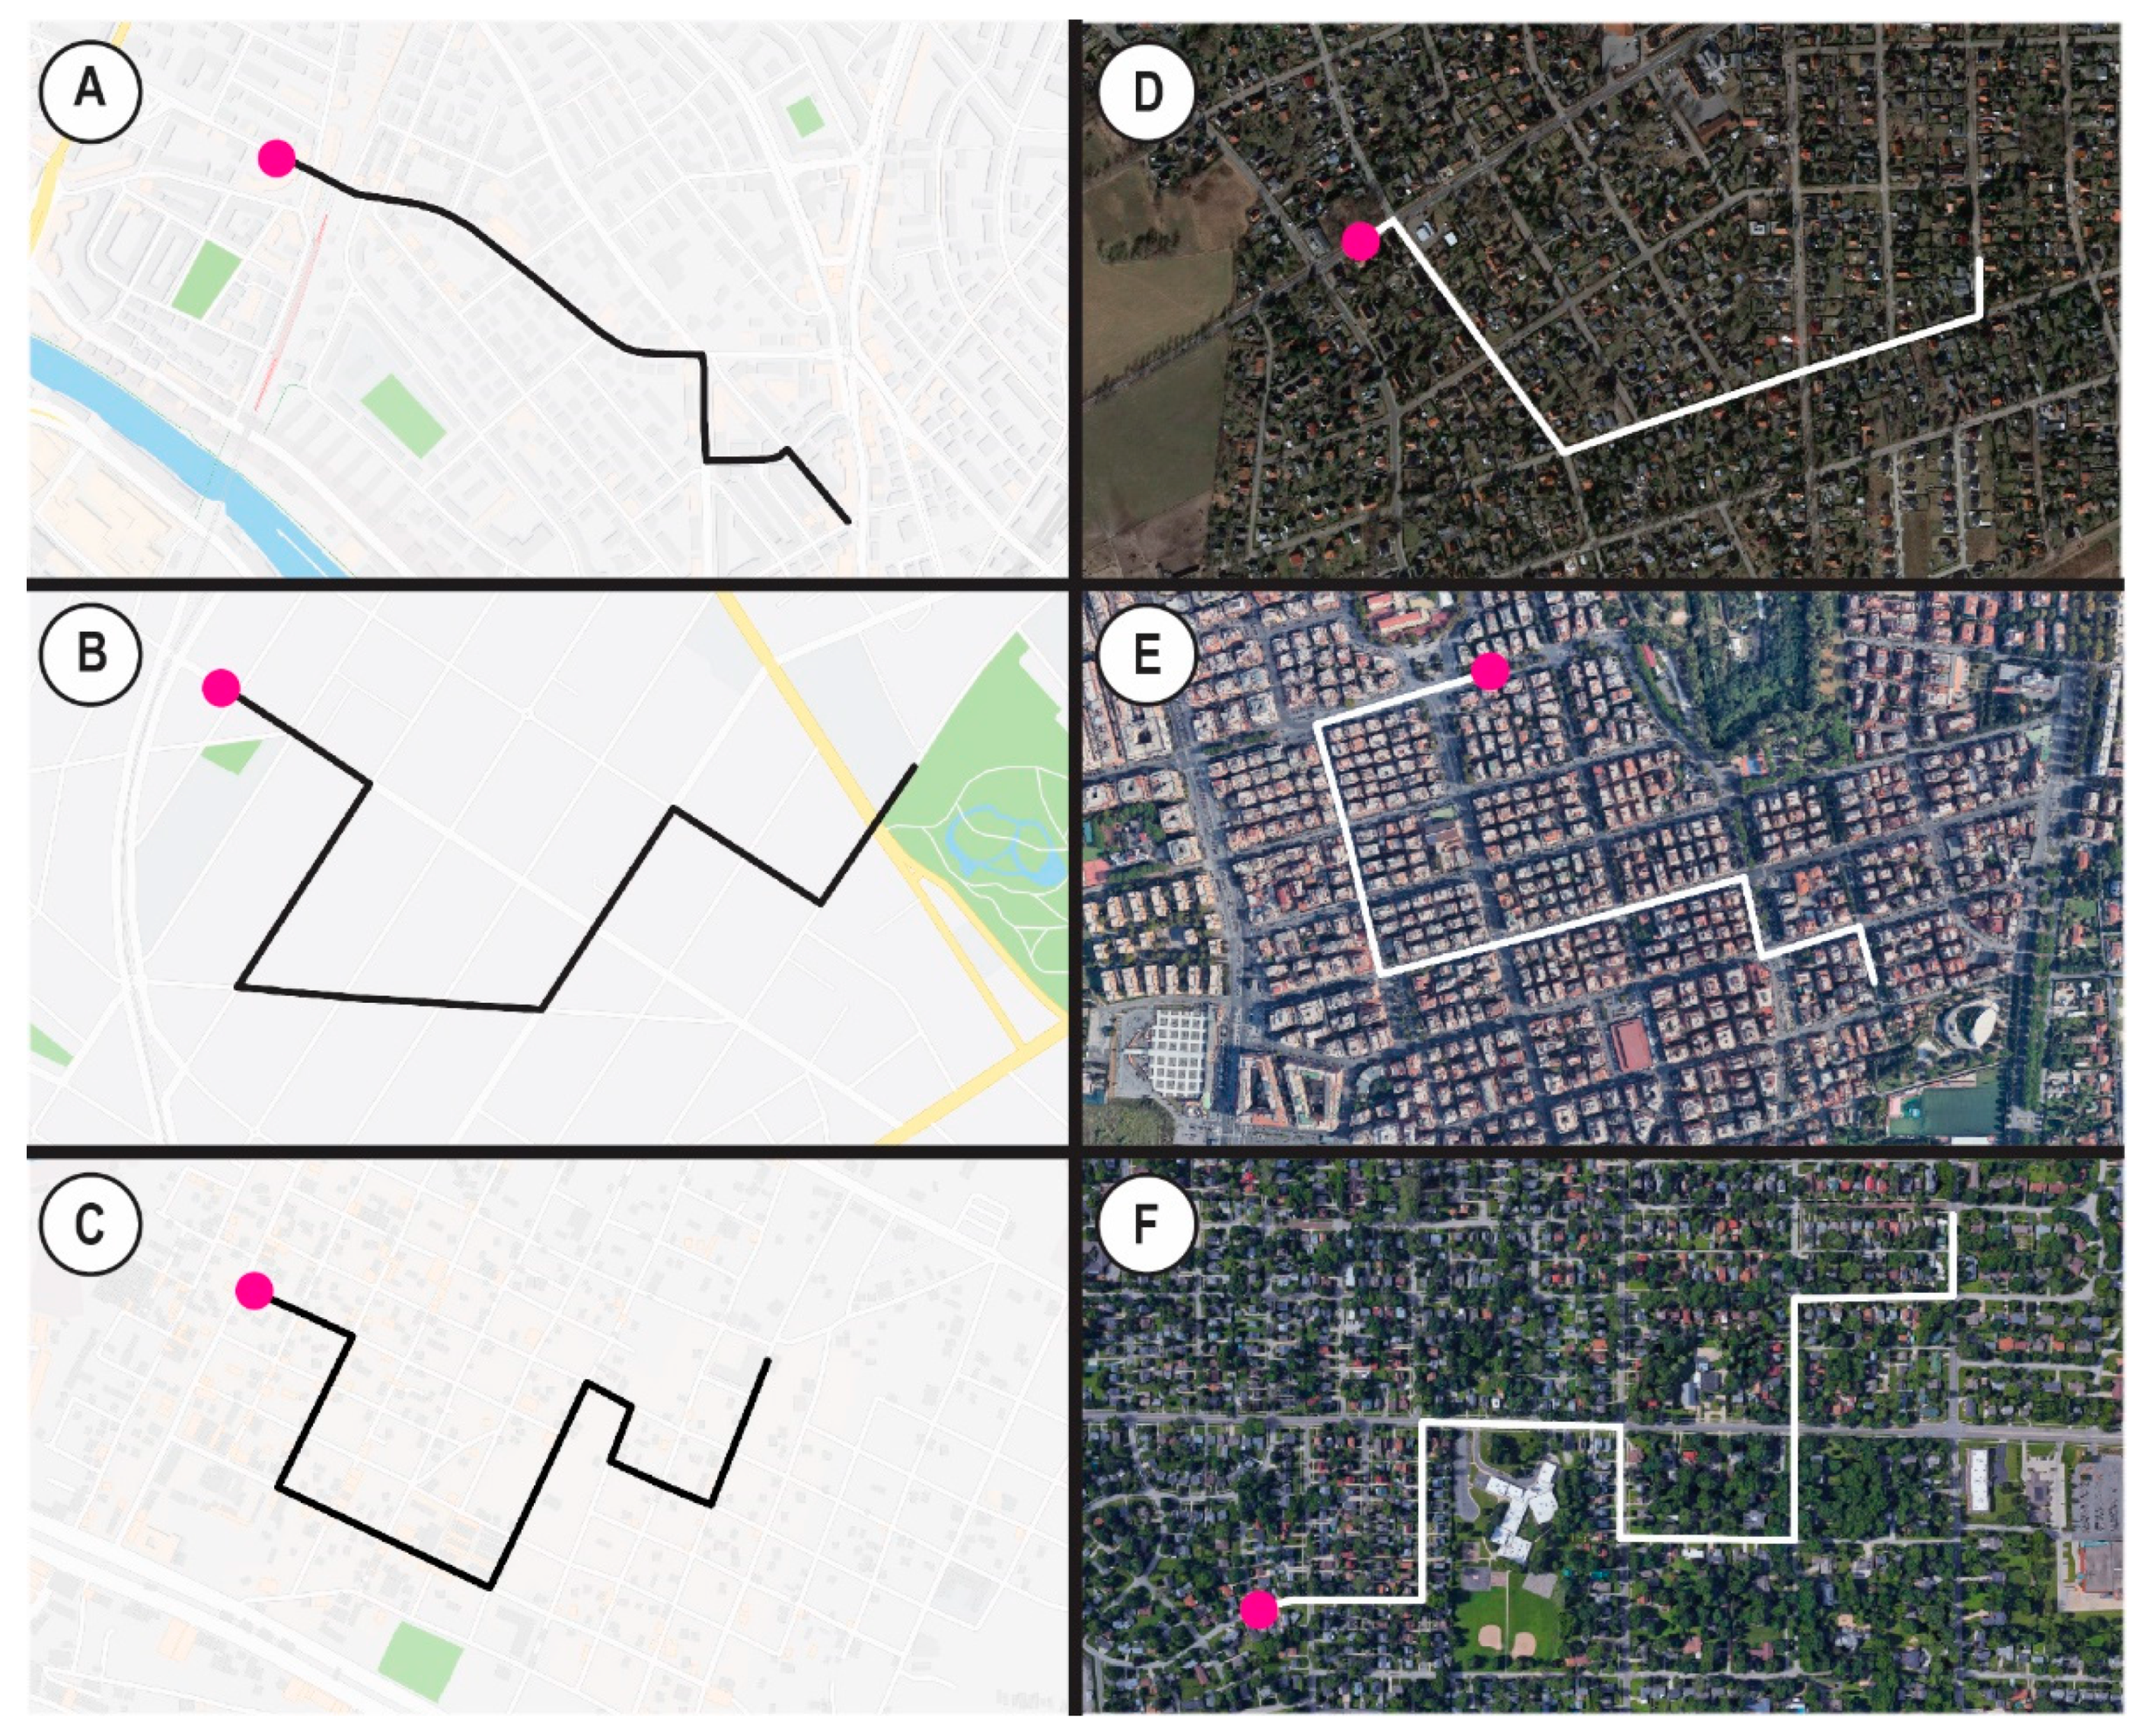
The study used a total of 60 maps (30 maps with a road background and 30 maps with satellite background). The maps had 3 levels of route difficulty: the first level had 3 turns and 0.9–1.1 km route length (dot speed 2.8 cm/s), the second level had 5 turns and 1.2–1.4 km (dot speed 3.7 cm/s) route length, and the third level had 7 turns and 1.5–1.7 km (dot speed 4.7 cm/s) route length. There were 10 road and 10 satellite maps in each level of route difficulty (60 maps in total). In this study, the turns were understood as junction-dependent, a change of direction. The sharp turn could also function as a turn. However, all cases were road junction-based. Figure 1 presents examples of designed maps. Each route was unique and was not presented on both backgrounds. The increase in the number of turns in urban areas with a similar density of buildings naturally caused the route elongation. Maintaining a similar density of the road network requires cartographic background with the more urbanized area. This would entail a lack of uniformity in the cartographic background. Therefore, designing the maps required reducing the route uniformization at the expense of more uniform backgrounds. Therefore, the design assumed route length ranges. This resulted in a variable dot speed but within constant values.
Study participants viewed a total of 60 maps. Presenting identical routes on both cartographic backgrounds could result in a participants’ learning effect, despite the randomization. For this reason, the design required the development of unique routes on the maps.
All maps were developed in HTML5 standard on Google Maps background with labels removed. They all had a similar level of visual complexity, road density, and included urbanized areas. The method of assessing these factors is similar to Çöltekin et al.’s [17] research. Complete unification of maps was not possible; however, the author believes that the content, level of route difficulty (in terms of turns and dot speed), and the constant scale were controlled across all stimuli. All maps had a button that started and repeated the animation, and participants could observe the route twice. This is considered as a basic interaction on an animated map, and it was optional [55]. Each route had a starting position marked by a dot. After pressing the “start” button, the dot moved to the destination place and stopped (there were no route marking). Each route, regardless of the difficulty level, lasted 8 s. As a result, each difficulty level had a slightly different dot speed, however, the route difficulty was obtained by certain criteria. This value was selected after a series of trials. This value corresponds to the values indicated in the research by Cybulski and Wielebski [45] regarding the effective duration of cartographic animations, which was defined between 8 and 11 s for 1 dynamic stimulus. Moreover, in similar research on memorizing the animated route, Çöltekin et al. [17], in one of their tasks, used 8.4 s of animation. For displaying stimuli, the study used a 15.6-inch laptop with an LCD screen and pixel resolution 1920 × 1080 in controlled lab conditions.
3.2. Experimental Procedure
The study begins with calibration with an eye tracking device. If the calibration results were unsatisfactory, the participant repeated calibration. Recording of eye movements starts from this moment. After that, participants proceeded to deliver demographic information (age, gender). Additionally, study participants determined their spatial abilities. Unlike Çöltekin et al. [17], participants did not use MRT (mental rotation task), but subjective declarations instead. The question was, “rate your spatial abilities on a scale of 1 to 5”. There were 5 possible answers arranged on a Likert-type rating scale: 5—very good; 4—good; 3—average; 2—bad; 1—very bad. The study consisted of 3 main parts. The first part consisted of completing the familiarization task. After making sure that participants understood what the task would be like, participants moved to the second part of the study. It consisted of watching the 8-second route animation twice and trying to memorize it. The animated route lasted 8 seconds and could be watched twice, however, participants had unlimited time to respond. The task was to “watch the animation and try to remember the route”. When they were ready to recall the route after watching the animation, they pressed the F10 button. The third part of the task consisted of drawing the route on the previously displayed background. Each participant had the “clear” button at his disposal so that in case of a mistake, they could draw the route again. If they finished drawing the route, they pressed F10 to proceed to the next animation. Each participant observed maps in random order (with no repetitive maps). Therefore, each participant viewed all of the 60 maps. The drawing algorithm used the D3 library (a JavaScript library).
3.3. Participants
In the study, 132 people participated (78 of them were male and 54 were female). The age range of participants was from 22 to 36 years. All of them were extramural students of Adam Mickiewicz University Poznan. Participant selection was based on other related studies [56,57,58]. The participants subjectively assessed their spatial abilities. They were told that this is the subjective measure of their space-related abilities. Most of them rated them as “good” (68 answers). A relatively large group assessed their abilities as “average” (40 answers), and the lowest amount of people evaluated themselves as “very good” (24 answers). Interestingly, only males rated their abilities as “very good”. Most females assessed spatial abilities as “good” (29 answers).
3.4. Effectiveness and Efficiency Evaluation
Effectiveness in this study is understood differently from the recent effectiveness studies of Çöltekin et al. [17]. In their work, effectiveness was a ratio between the number of correct answers and all answers expressed as a percentage. However, when it comes to remembering the route, one can recall it in some parts. Then the effectiveness of the animated route map will be the ratio of the correctly remembered section to the entire route (length and location). If the participant memorized the entire route (i.e., correctly drew shape, location, and length), then the effectiveness is 100%. However, if the participant drew a longer route than the one observed in the animation, the effectiveness decreased by a percentage of the extra route length (in a ratio to the entire length). The participants did not have to precisely draw the road along its geometrical axis. The effectiveness assessment was topologic. Participants needed to approximately follow the route and make all the correct junction turns.
Efficiency is a time in which a participant proceeded to the route drawing stage. In the study, this time was counted in seconds from the beginning of the animation to its end, which was followed by the drawing stage (pressing the F10 button). The shorter the time necessary to proceed further, the higher the efficiency. It is worth noting that efficiency is not the time needed to recall the route from memory and draw it. Mainly this is because, when drawing sketches, participants are focused on correct drawing. They are not attempting to draw the route fast [59,60]. Moreover, the ability to draw with a computer mouse could affect efficiency.
3.5. Eye movement Metrics
The analyzed eye movement metrics in this study are saccadic amplitude in degrees (which corresponds with saccade length), an overall number of saccades and fixations, fixation duration, and the number of fixations on the route. Tobii Eye-Tracker X2-60 recorded and collected eye movement metrics with a spatial accuracy of 0.5 degrees of visual angle, and Tobii Studio software processed the data for identification of fixations and saccades. The equipment used in the study captured gaze position every 16.67 ms. The Tobii I-VT Fixation Filter (velocity-based) divided eye movement into fixations and saccades [61].
The use of these metrics is essential. Fixations allow 1 exact determination of the user’s focused attention, and together with saccades are elementary components of eye movement [62,63]. Fixations are responsible for the processing of visual information. On the other hand, the saccadic movement does not process visual information [64,65].
4. Results
4.1. Effectiveness and Efficiency Analysis
Table 1 presents the animated route map effectiveness results. The analysis used the median due to the non-normal distribution of the data. It turns out that the effectiveness decreased as the number of turns increased, but the most significant effectiveness decrease concerned maps with seven turns. This observation applies to both cartographic backgrounds used in the experiment. In the case of maps with a road background, the Mann–Whitney test [66] showed statistical significance in the decrease in the median effectiveness between three and five turns (p < 0.01), between five and seven turns (p < 0.0001), and between three and seven turns (p < 0.0001). In the case of satellite background, the Mann–Whitney test proved statistically significant differences between maps with three and five turns (p < 0.0001), five and seven turns (p < 0.0001), and three and seven turns (p < 0.0001). The differences in effectiveness between the road and satellite background with the same number of turns are minimal and are not statistically significant.
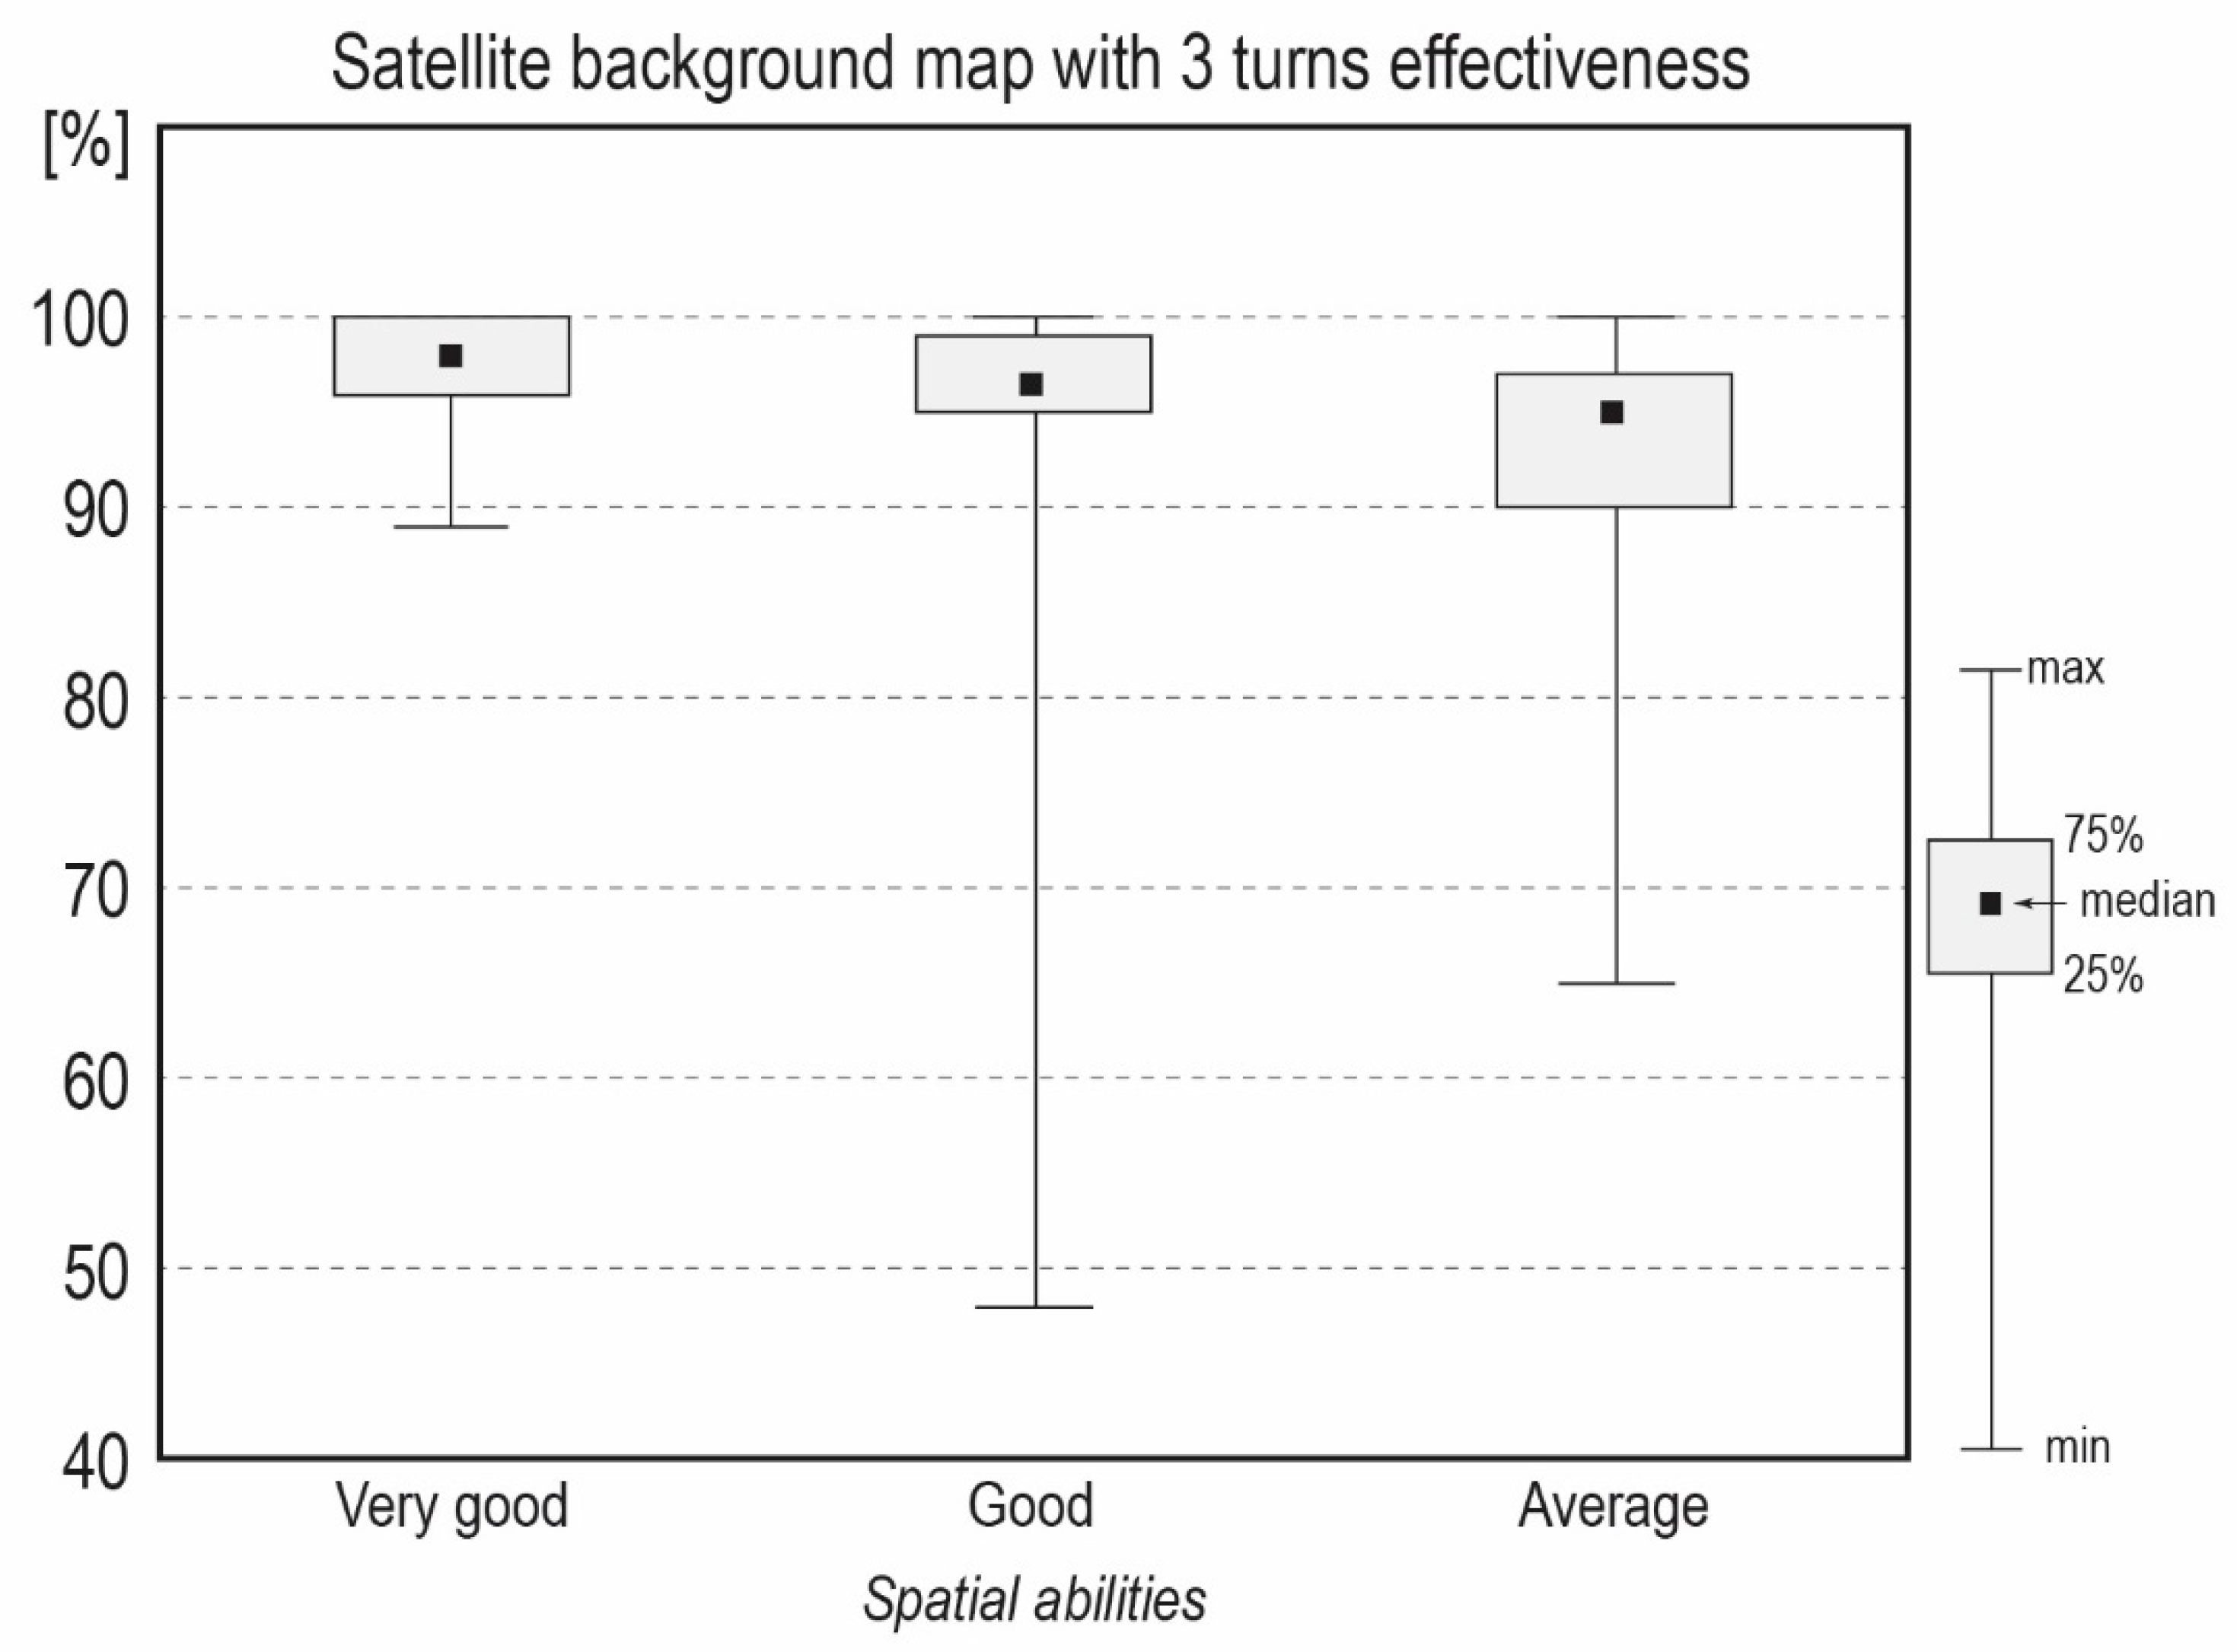
Effectiveness determination consisted of the various levels of route complexity concerning gender differences with Kruskal–Wallis ANOVA [67]. The statistical test did not report significant variation in effectiveness between genders. There were also no differences in the influence of cartographic background on effectiveness among males and females. However, there were statistically significant differences (p<0.05) in the route memorization effectiveness in terms of the satellite map with three turns among spatial abilities groups. Participants who assessed their spatial abilities as very good achieved 98%, good achieved 96%, and average achieved 94.5% effectiveness. Figure 2 presents the detected variation with maximum and minimum values among spatial abilities and effectiveness on satellite background map with three turns.
Table 2 presents the efficiency results. As in the case of effectiveness, the analysis used the median due to the distribution of data. The efficiency remained at a similar level regardless of the number of turns. In the case of a satellite background, the time needed to solve the task was slightly longer. Interestingly, seven turns had a standard deviation greater than the rest. The Mann–Whitney test showed no significant median differences between maps with road background. The same was the case for the maps with satellite background. There were also no significant differences between the road and satellite backgrounds (comparing the same number of turns).
Kruskal–Wallis ANOVA in gender groups did not reveal any significant differences in the efficiency of route memorization. However, spatial abilities groups reported significant difference (p < 0.005) among efficiency in road map background with three turns. Figure 3 presents differences among efficiency and spatial abilities on road background map with three turns. In terms of the spatial abilities groups, very good participants achieved 20.6 s, good achieved 24.0 s, and average achieved 24.0 s.
4.2. Eye Movement Analysis
Table 3 presents the median saccadic amplitude, which corresponds to the saccade length. Saccadic amplitudes were similar, despite the growing number of turns. The Mann–Whitney test indicated statistically significant differences in saccadic amplitude between road and satellite background with five turns (p < 0.05).
However, there were statistically significant differences in the saccadic amplitude between females and males using Kruskal–Wallis ANOVA, as shown in Figure 4. In the case of the road background in the conditions of three and five turns, females had longer saccadic amplitudes (3.3° for male vs. 3.7° for female in the case of three turns—p < 0.05, and 3.2° for male vs. 4.0° for female in the case of five turns—p < 0.0001). Only in the case of road background with seven turns were the differences not statistically significant. The situation was similar in the case of the satellite background. Females had longer saccadic amplitude than males in all number of turns (3.1° for males vs. 3.5° for females in the case of three turns—p < 0.05, 2.9° for males vs. 3.6° for females in the case of five turns—p < 0.001, and 3.1° for males vs. 3.6° for females in the case of seven turns—p < 0.01).
There were also statistically significant differences in the saccadic amplitude between groups with different spatial abilities. Overall, participants whose spatial abilities were very good had shorter saccadic amplitudes. In particular, on the road background, participants with average spatial abilities had a median saccade of 4.0° (three turns) and 3.8° (five turns), while participants with very good spatial abilities had 2.9° (three and five turns). The p-value for both maps was <0.001. Moreover, on the satellite background, participants with very good spatial abilities had shorter saccadic amplitudes than those who had average abilities. In particular, participants with average spatial abilities had a median saccade of 3.6° (five turns) and 3.5° (seven turns), while participants with very good spatial abilities had 3.0° (five and seven turns). The p-value for both maps was <0.05.
Since smooth pursuit was observed on the animated route map, the number of saccades was found to be greater than the number of fixations. On the road background with three turns, 91 saccades occurred; with five turns, 88 saccades occurred; and seven turns had 96 saccades (all medians). On the satellite background, there were 100 saccades (three turns), 90 saccades (five turns), and 102 saccades (seven turns). However, these differences between each background and the number of turns (in terms of the number of saccades) were not statistically significant.
Table 4 presents the median number of overall fixations. The number of fixations increased when comparing maps with three and seven turns. However, on a satellite background, the differences were smaller. Additionally, the number of fixations on the satellite background was only slightly higher than on the road background. The Mann–Whitney test partially confirmed this. There were statistically significant differences between road background with three and seven turns (p < 0.05). However, there was no difference between five and seven turns. The same was the case with the satellite background.
The median number of fixations positively correlated with efficiency measures (seconds of viewing the map) for both backgrounds and all turns. This was an expected effect because the longer the user watched the animation, the more fixations there would be in general. For the road background, the strength of the correlation was r = 0.71 for three turns, r = 0.70 for five turns, and r = 0.72 for seven turns in the Spearman correlation test. For the satellite background, the strength of the correlation was r = 0.72 for three turns, r = 0.78 for five turns, and r = 0.77 for seven turns (p-value for all correlations in both backgrounds was <0.0001).
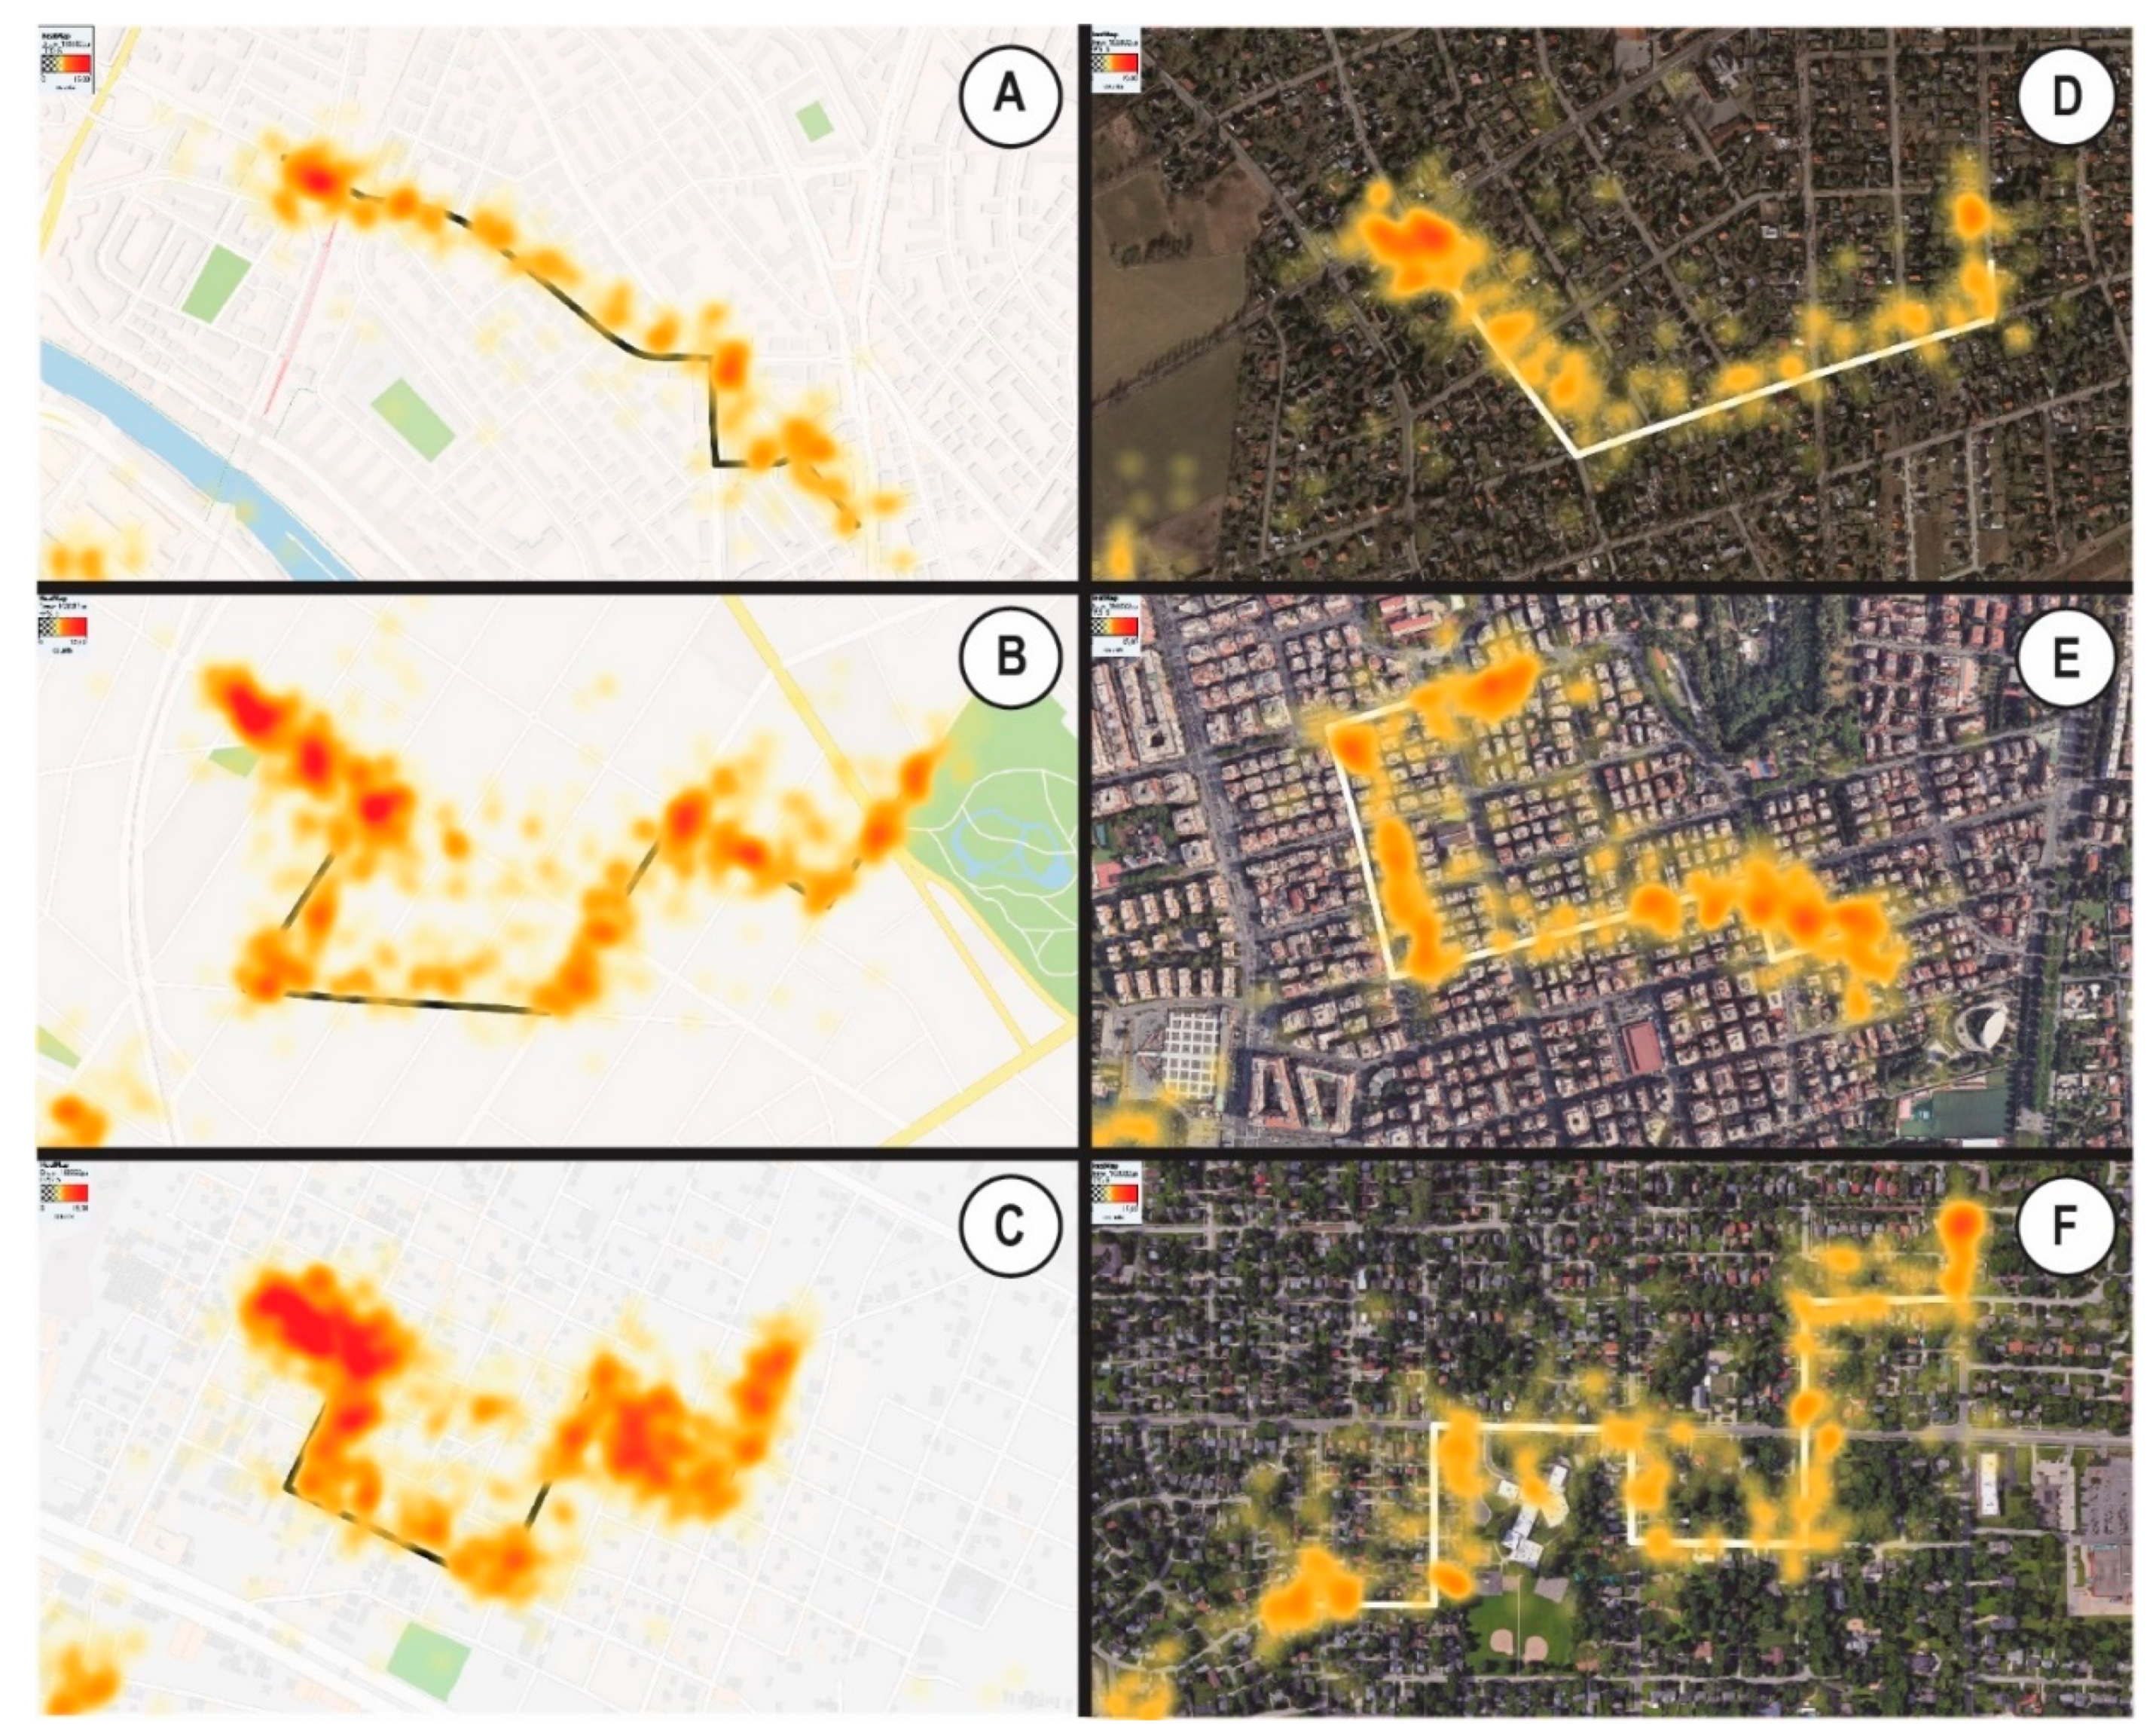
Figure 5 presents the spatial distribution of fixations while watching different route animations. As the selected examples show, and confirmed by other cases, most fixations occurred at the beginning of each route. Despite this, the most errors in drawing the route concerned the correct determination of the beginning of the route. Despite different backgrounds and the number of turns, the median number of fixations on the route were similar. The median varied between 33 and 35 fixations. In this case, this meant that about half of the fixations were on the route. The rest included the direct surroundings of the route, the animation start button, and the background. Dispersed fixations around the route (in its direct neighborhood) are related to a smooth pursuit, which causes oscillation of the gaze [68].
5. Discussion
The Çöltekin et al. [17] research has shown that road maps (being more abstract) make it easier to memorize the route concerning satellite maps. Brucker et al. [40] came to similar conclusions except for users with high spatial abilities. However, the studies presented here do not support these conclusions. Çöltekin et al.’s [17] research determined the correctness of memorizing the route on the principle of true/false. Here, the effectiveness of the animated route map was the ratio of the correctly drawn section to the entire length. Like Çöltekin et al. [17], participants’ spatial abilities were part of the analysis. However, the participants did not take part in the study under competitive conditions but had the time limit for observing the animation. According to the study presented, this is the main reason why there are no statistically significant differences between a satellite background and an abstract road map in memorizing route effectiveness. Already, Wilkening and Fabrikant [69] noticed in their research that time pressure negatively affects map-based related tasks. The difficulty is an aspect of the animation that is crucial for effectiveness, as has been proven in many recent studies [8,25,39]. Moreover, this study proves that the number of turns of an animated route reduces the effectiveness of memorizing by several percent. This applies to both the road and satellite background.
On the basis of this experiment design, this study found that three different variables (number of turns, route length, and dot speed) impacted task difficulty. It is impossible to say which of these factors was the most influential on effectiveness or efficiency. Despite the isolation of the number of turns, there was still the conjunction of both factors (dot speed and line length), which lacked isolation as individual variables. Therefore, this is the main limitation of this research. The results follow from a group of variables. This might be a bias in efficiency and effectiveness, which resulted in the uniformization of participants’ performance. In the examination of reasons behind the effectiveness and efficiency, there is a need for isolation of each of these factors.
Efficiency was related to the time needed to proceed to the drawing stage. Although the study used a fixed time of route presentation, participants sometimes decided not to repeat the animation (12 participants proceeded to the drawing phase watching animation only once). On the other hand, participants had unlimited time for proceeding further after viewing the animation twice. Some of them needed additional time before they were ready to draw the route. It was noticed that some of the participants helped themselves with the mouse cursor and followed the dot during the animation and right after it ended. The presented study determined efficiency based on participants’ performance in time.
As in the research by Çöltekin et al. [17], there were no statistically significant differences in efficiency while memorizing a route on a road or satellite background. This seems justified because, in this type of task, where the background context is not of primary importance, the users’ attention ignores the background [70]. There was also no relationship between efficiency and effectiveness. Lokka and Çöltekin [41] confirmed that in virtual reality, the most supporting solution for route memorizing is a mixed reality that consists of realistic and abstract objects. The conducted study did not take into account such a variant of maps that would have mixed background.
However, when it comes to the visual behavior of the participants, some similarities, as well as intergroup differences, can be noticed. The noticeable increase in median number fixation was visible only on the map with a road background between the route with three and seven turns. This is also confirmed by the saccadic amplitude, which was relatively the same in all studied cases. It is the basis for the claim that a more realistic cartographic background does not affect the visual behavior of the user in a specific task that is memorizing the animated route. However, there were statistically significant differences in the saccadic amplitude between females and males. It turns out that, in terms of this study, females had slightly longer saccades than males, regardless of the number of turns or the cartographic background. This may indicate female’s lower spatial abilities, typical for non-expert users [36,71], although the conducted study does not confirm this. Participants with declared average spatial abilities did indeed have longer saccadic amplitudes, but this was not related to efficiency or effectiveness.
6. Conclusions
Cartographic animation methods are widespread on the Internet. The animation not only concerns the car route, but there are numerous examples of people’s migration routes; culture or language migration routes; and money, marathons, and capital flow routes. Many of these cartographic messages reach wide viewers through news portals or social media. In the context of the presented study, animated route visualizations determine specific visual behavior. This behavior is not dependent on the cartographic background nor complexity of the route. The principal part of the observed area is the animated route. The differences in visual behavior are gender-specific. It turns out that females have longer distances between fixations while watching the route. However, this does not translate in any way into the effectiveness or efficiency of memorizing the route. Moreover, participants declaring “very good” spatial abilities also had shorter saccadic amplitudes than those declaring “average”. An interesting observation was that the starting position of the animated route was the most observed point, even though most errors were related to estimating the starting position in the drawing phase.
The study also showed that the effectiveness of memorizing the route depends mainly on the difficulty (expressed in the number of turns) and not on the cartographic background, as was suggested by a previous study by Çöltekin et al. [17]. However, the contrast between these conclusions may result from the various environmental approaches. The previous study on this topic validated effectiveness in competition conditions that are responsible for causing negative effects on learning [69,72]. Using more visually realistic images as a background does not translate into higher or lower effectiveness of route memorizing in time-limited conditions. However, it turned out that the easiest tasks, with only three turns, were best solved by people who described their spatial abilities as “good” and “very good”. This applies to both the road and satellite background.
In the context of the methodology, it is necessary to note that the presented method is more detailed in determining the effectiveness of memorizing a route than the true/false paradigm [17,73]. Thanks to it, the scoring system includes an implicit way to contain a degree of correctness. However, the problem of automating the route comparison process remains. The user drew a route, and the geometrical comparison of both drawn and actual routes were possible. However, it would be desirable in the future to check the convergence of the drawn route in real time. In addition to the complexity of tasks (based on the number of turns), measures such as average darkness, image compression, or edge detection determine the map complexity [74]. Therefore, differences in the graphic load of road maps with the satellite and vector background may affect the results.
The knowledge gained from this research allows for a better look at the perception of maps. When memorizing the animated route in time-limited and non-competitive conditions, one finds that the cartographic background does not affect visual behavior. It also does not affect the efficiency or effectiveness presented in the context of this study. It turns out that the subjective spatial abilities do not affect effectiveness or efficiency, however, they are related to the visual behavior (in the group of participants with average, good, and very good spatial abilities). However, a particular drawback of the study is the unrepresentativeness of the participants whose spatial abilities are bad or very bad. Moreover, the data supports males’ overconfidence position, which is not reflected in performance. Thanks to this knowledge, map designers can choose the cartographic background more consciously, knowing the advantages and disadvantages of their choice. They can also expect a particular reaction from the end-user. The research confirms that the importance of the cartographic background is of secondary importance during the activity related to memorizing the animated route. The recorded eye movement confirms that the route itself is of the greatest importance.
For the future, it is worth continuing research on the subjective opinions of map users. As shown by a few studies (e.g., [75,76]), subjective feelings guide users in choosing mapping applications, which does not always translate into the most effective. Thus, by studying the choices of users, one can improve the design of effective solutions so that they meet the expectations of users, and at the same time maintain their effectiveness. Future studies should also involve characterization of route complexity using ht-index and fractal dimension as an individual factor [77,78]. The form of the route may be a significant variable to alter. There is a difference with the form of the animated route that leaves a trail and a moving point object that leaves no trail. The view of the entire route would be a valuable support for users. On the other hand, the dot-only mode is a more basic option. It occurs, for example, on mini-maps in computer games [79]. Future research studies should incorporate this issue in experimental design. It turns out that finding the starting point of the animation is problematic. Therefore, future research should consider methods of emphasizing the initial position and appearance of the cartographic symbol. Future research should extend the research sample to include people without academic experience, more diverse age structure, or different study backgrounds. Along with various sample groups, further research might consider a selection of preferred backgrounds. This could reveal participants’ preferences of cartographic background correlated with spatial abilities.
Funding
This research received no external funding.
Data Availability Statement
The data that support the findings of this study are openly available in “Harvard Dataverse” at https://0-doi-org.brum.beds.ac.uk/10.7910/DVN/40VX6X (accessed on 2 February 2021).
Acknowledgments
The paper is the result of research on visualization methods carried out within statutory research in the Department of Cartography and Geomatics, Faculty of Geographical and Geological Sciences, Adam Mickiewicz University Poznań, Poland.
Conflicts of Interest
The author declares no conflict of interest.
References
- DiBiase, D.; MacEachern, A.M.; Krygier, J.B.; Reeves, C. Animation and the role of map design in scientific visualization. Cartogr. Geogr. Inf. Syst. 1992, 19, 201–214. [Google Scholar] [CrossRef]
- Andrienko, G.; Andrienko, N.; Demsar, U.; Dransch, D.; Dykes, J.; Fabrikant, S.I.; Jern, M.; Kraak, M.-J.; Schumann, H.; Tominski, C. Space, time and visual analytics. Int. J. Geogr. Inf. Sci. 2010, 24, 1577–1600. [Google Scholar] [CrossRef] [Green Version]
- Maggi, S.; Fabrikant, S.I.; Imbert, J.-P.; Hurter, C. How do display design and user characteristics matter in animations? An empirical study with air traffic control displays. Cartogr. Int. J. Geogr. Inf. Geovis. 2016, 51, 25–37. [Google Scholar] [CrossRef]
- See, L.-C.; Chang, Y.-H.; Chuang, K.-L.; Lai, H.-R.; Peng, P.-I.; Jean, W.-C.; Wang, C.-H. Animation program used to encourage patients or family members to take an active role for eliminating wrong-site, wrong-person, wrong-procedure surgeries: Preliminary evaluation. Int. J. Surg. 2011, 9, 241–247. [Google Scholar] [CrossRef] [PubMed] [Green Version]
- Edler, D.; Dickmann, F. The Impact of 1980s and 1990s Video Games on Multimedia Cartography. Cartogr. Int. J. Geogr. Inf. Geovis. 2017, 52, 168–177. [Google Scholar] [CrossRef]
- Medyńska-Gulij, B.; Zagata, K. Expert and Gamers on Immersion into Reconstructed Strongholds. ISPRS Int. J. Geoinf. 2020, 9, 655. [Google Scholar] [CrossRef]
- Spallone, R. In the Space and in the Time. Representing Architectural Ideas by Digital Animation. In Proceedings of the International and Interdisciplinary Conference IMMAGINI, Brixen, Italy, 27–28 November 2017; Volume 1, pp. 27–28, 962. [Google Scholar] [CrossRef] [Green Version]
- Harrower, M. The Cognitive Limits of Animated Maps. Cartogr. Int. J. Geogr. Inf. Geovis. 2007, 42, 349–357. [Google Scholar] [CrossRef]
- Vozenilek, V.; Kralik, T. Anaglyph videoanimations from oblique stereoimages. In Proceedings of the Sixth International Conference on Graphic and Image Processing 2015, China, Beijing, 24–26 October 2014. [Google Scholar] [CrossRef]
- Garlandini, S.; Fabrikant, S.I. Evaluating the effectiveness and efficiency of visual variables for geographic information visualization. In Spatial Information Theory. COSIT 2009, Aber Wrac’h, France, 21–25 September 2009; Horsby, K.S., Clarmunt, C., Denis, M., Ligozat, G., Eds.; Springer: Berlin/Heidelberg, Germany, 2009; pp. 195–211. [Google Scholar]
- Miller, G The Magical Number Seven, Plus or Minus Two: Some Limits on Our Capacity for Processing Information. Psychol. Rev. 1956, 63, 81–97. [CrossRef] [Green Version]
- Farrell, M.J.; Arnold, P.; Pettifer, S.; Adams, J.; Graham, T.; MacManamon, M. Transfer of route learning from virtual to real environments. J. Exp. Psychol. Appl. 2003, 9, 219–227. [Google Scholar] [CrossRef]
- Klippel, A.; Tappe, H.; Habel, C. Pictorial representations of routes: Chunking route segments during comprehension. In Spatial Cognition; Freksa, C., Brauer, W., Habel, C., Wender, K., Eds.; Springer: Berlin/Heidelberg, Germany, 2002; pp. 11–33. [Google Scholar] [CrossRef]
- Midtbø, T.; Larsen, E. Map animation versus static maps—When is one of them better. In Proceedings of the Joint ICA Commissions Seminar on Internet-Based Cartographic Teaching and Learning, Madrid, Spain, 6–8 July 2005; pp. 155–160. [Google Scholar]
- Nossum, A.S. Semistatic Animation—Integrating Past, Present and Future in Map Animations. Cartogr. J. 2012, 49, 43–54. [Google Scholar] [CrossRef]
- Kraak, M.-J. Mapping Time: Illustrated by Minard’s Map of Napoleon’s Russian Campaign of 1812; Esri Press: Redlands, CA, USA, 2014. [Google Scholar]
- Çöltekin, A.; Francelet, R.; Richter, K.-F.; Thoresen, J.; Fabrikant, S.I. The effects of visual realism, spatial abilities, and competition on performance in map-based route learning in men. Cartogr. Geogr. Inf. Sci. 2018, 45, 339–353. [Google Scholar] [CrossRef]
- Mitchell, C.M.; Miller, R.A. Design strategies for computer-based information displays in real-time control systems. Hum. Factors J. Hum. Factors Ergon. Soc. 1983, 25, 359–369. [Google Scholar] [CrossRef]
- Medyńska-Gulij, B. The effect of cartographic content on tourist map users. Cartography 2003, 32, 49–54. [Google Scholar] [CrossRef]
- Hátlová, K.; Hanus, M. A Systematic Review into Factors Influencing Sketch Map Quality. ISPRS Int. J. Geoinf. 2020, 9, 217. [Google Scholar] [CrossRef]
- Del Fatto, V.; Paolino, L.; Sebillo, M.; Vitiello, G. Spatial factors affecting user’s perception in map simplification: An empirical analysis. In Web and Wireless Geographical Information Systems; Bertolotto, M., Ray, C., Li, X., Eds.; Springer: Berlin/Heidelberg, Germany, 2008; pp. 152–163. [Google Scholar] [CrossRef]
- Cybulski, P.; Horbiński, T. User Experience in Using Graphical User Interfaces of Web Maps. ISPRS Int. J. Geoinf. 2020, 9, 412. [Google Scholar] [CrossRef]
- Zanola, S.; Fabrikant, S.I.; Çöltekin, A. The effect of realism on the confidence in spatial data quality. In Proceedings of the International Cartographic Conference ICC, Chile, Santiago, 15–21 November 2009. [Google Scholar]
- Wielebski, Ł.; Medyńska-Gulij, B. Graphically supported evaluation of mapping techniques used in presenting spatial accessibility. Cartogr. Geogr. Inf. Sci. 2019, 46, 311–333. [Google Scholar] [CrossRef]
- Keil, J.; Mocnik, F.-B.; Edler, D.; Dickmann, F.; Kuchinke, L. Reduction of Map Information Regulates Visual Attention without Affecting Route Recognition Performance. ISPRS Int. J. Geoinf. 2018, 7, 469. [Google Scholar] [CrossRef] [Green Version]
- Çöltekin, A.; Fabrikant, S.I.; Lacayo, M. Exploring the efficiency of users’ visual analytics strategies based on sequence analysis of eye movement recordings. Int. J. Geogr. Inf. Sci. 2010, 24, 1559–1575. [Google Scholar] [CrossRef]
- Korycka-Skorupa, J.; Gołębiowska, I. Numbers on Thematic Maps: Helpful Simplicity or Too Raw to Be Useful for Map Reading? ISPRS Int. J. Geoinf. 2020, 9, 415. [Google Scholar] [CrossRef]
- Kiefer, P.; Giannopoulos, I.; Raubal, M.; Duchowski, A. Eye tracking for spatial research: Cognition, computation, challenges. Spat. Cogn. Comput. 2017, 17, 1–19. [Google Scholar] [CrossRef]
- Fisher, B.; Ramsperger, E. Human express saccades: Extremely short reaction times of goal directed eye movements. Exp. Brain Res. 1984, 51, 191–195. [Google Scholar] [CrossRef]
- Lisberger, S.G. Visual guidance of smooth pursuit eye movements: Sensation, action, and what happens in between. Neuron 2010, 66, 477–491. [Google Scholar] [CrossRef] [Green Version]
- Pola, J. Models of the saccadic and smooth pursuit systems. In Models of the Visual System; Topics in Biomedical Engineering International Book Series; Hung, G.K., Ciuffreda, K.J., Eds.; Springer: Boston, MA, USA, 2002; pp. 385–429. [Google Scholar] [CrossRef]
- Wilkniss, S.M.; Jones, M.G.; Korol, D.L.; Gold, P.E.; Manning, C.A. Age-related differences in an ecologically based study of route learning. Psychol. Aging 1997, 12, 372–375. [Google Scholar] [CrossRef]
- Fish, C. Cartographic challenges in animated mapping. In Proceedings of the International Cartographic Conference Pre-Conference Workshop on Envisioning the Future of Cartographic Research, Brazil, Curitiba, 21 August 2015. [Google Scholar]
- Opach, T.; Gołębiowska, I.; Fabrikant, S.I. How Do People View Multi-Component Animated Maps? Cartogr. J. 2014, 51, 330–342. [Google Scholar] [CrossRef]
- Burian, J.; Popelka, S.; Beitlova, M. Evaluation of the Cartographic Quality of Urban Plans by Eye-Tracking. ISPRS Int. J. Geoinf. 2018, 7, 192. [Google Scholar] [CrossRef] [Green Version]
- Thorndyke, P.W.; Hayes-Roth, B. Differences in spatial knowledge acquired form maps and navigation. Cognit. Psychol. 1982, 14, 560–589. [Google Scholar] [CrossRef]
- Tom, A.; Denis, M. Language and spatial cognition: Comparing the roles of landmarks and street names in route instructions. Appl. Cognit. Psychol. 2004, 18, 1213–1230. [Google Scholar] [CrossRef]
- Tom, A.; Tversky, B. Remembering Routes: Streets and Landmarks. Appl. Cognit. Psychol. 2012, 26, 182–193. [Google Scholar] [CrossRef]
- Cybulski, P.; Medyńska-Gulij, B. Cartographic Redundancy in Reducing Change Blindness in Detecting Extreme Values in Spatio-Temporal Maps. ISPRS Int. J. Geoinf. 2018, 7, 8. [Google Scholar] [CrossRef] [Green Version]
- Brucker, B.; Scheiter, K.; Gerjets, P. Learning with dynamic and static visualizations: Realistic details only benefit learners with high visuospatial abilities. Comput. Hum. Behav. 2014, 36, 330–339. [Google Scholar] [CrossRef]
- Lokka, I.E.; Çöltekin, A. Toward optimizing the design of virtual environments for route learning: Empirically assessing the effects of changing levels of realism on memory. Int. J. Digit. Earth 2019, 12, 137–155. [Google Scholar] [CrossRef]
- Höffler, T.N.; Leutner, D. Instructional animation versus static pictures: A meta-analysis. Learn. Instr. 2007, 17, 722–738. [Google Scholar] [CrossRef]
- Lai, P.; Yeh, A. Assessing the Effectiveness of Dynamic Symbols in Cartographic Communication. Cartogr. J. 2004, 41, 229–244. [Google Scholar] [CrossRef]
- Dong, W.; Ran, J.; Wang, J. Effectiveness and Efficiency of Map Symbols for Dynamic Geographic Information Visualization. Cartogr. Geogr. Inf. Sci. 2012, 39, 98–106. [Google Scholar] [CrossRef]
- Cybulski, P.; Wielebski, Ł. Effectiveness of dynamic point symbols in quantitative mapping. Cartogr. J. 2019, 56, 146–160. [Google Scholar] [CrossRef]
- Campbell, C.S.; Egbert, S.L. Animated Cartography: Thirty Years of Scratching the Surface. Cartogr. Int. J. Geogr. Inf. Geovis. 1990, 27, 24–46. [Google Scholar] [CrossRef]
- MacEachren, A.; Kraak, M.-J. Research Challenges in Geovisualization. Cartogr. Geogr. Inf. Sci. 2001, 28, 3–12. [Google Scholar] [CrossRef]
- Brychtova, A.; Popelka, S.; Dobesova, Z. Eye-Tracking methods for investigation of cartographic principles. In Proceedings of the 12th International Multidisciplinary Scientific GeoConference and EXPO, Varna, Bulgaria, 17–23 June 2012; pp. 1041–1048. [Google Scholar] [CrossRef]
- Dong, W.; Liao, H.; Xu, F.; Liu, Z.; Zhang, S. Using eye tracking to evaluate the usability of animated maps. Sci. Chin. Earth Sci. 2014, 57, 512–522. [Google Scholar] [CrossRef]
- Krassanakis, V.; Filippakopoulou, V.; Nakos, B. Detection of moving point symbols on cartographic backgrounds. J. Eye Mov. Res. 2016, 9, 1–16. [Google Scholar] [CrossRef]
- Çöltekin, A.; Brychtová, A.; Griffin, A.L.; Robinson, A.C.; Imhof, M.; Pettit, C. Perceptual complexity of soil-landscape maps: A user evaluation of color organization in legend designs using eye tracking. Int. J. Digit. Earth 2016, 10, 560–581. [Google Scholar] [CrossRef]
- Dong, W.; Jian, Y.; Zheng, L.; Liu, B.; Meng, L. Assessing Map-Reading Skills Using Eye Tracking and Bayesian Structural Equation Modelling. Sustainability 2018, 10, 3050. [Google Scholar] [CrossRef] [Green Version]
- Ooms, K.; Krassanakis, V. Measuring the spatial noise of a low cost eye tracker to enhance fixation detection. J. Imaging 2018, 4, 96. [Google Scholar] [CrossRef] [Green Version]
- Krassanakis, V.; Cybulski, P. A review on eye movement analysis in map reading process: The status of the last decade. Geod. Cartogr. 2019, 68, 191–209. [Google Scholar] [CrossRef]
- Peterson, M.P. Active legends for interactive cartographic animation. Int. J. Geogr. Inf. Sci. 2010, 13, 375–383. [Google Scholar] [CrossRef]
- Fish, C.; Goldsberry, K.P.; Battersby, S. Change Blindness in Animated Choropleth Maps: An Empirical Study. Cartogr. Geogr. Inf. Sci. 2011, 38, 350–362. [Google Scholar] [CrossRef]
- Wang, J.; Li, Z. Effectiveness of visual, screen and dynamic variables in animated mapping. In Proceedings of the 25th International Cartographic Conference, Paris, France, 3–8 July 2011. [Google Scholar]
- Stachoň, Z.; Šašinka, Č.; Čeněk, J.; Štěrba, Z.; Angsuesser, S.; Fabrikant, S.I.; Štampach, R.; Morong, K. Cross-cultural differences in figure–ground perception of cartographic stimuli. Cartogr. Geogr. Inf. Sci. 2018, 46, 82–94. [Google Scholar] [CrossRef]
- Bestgen, A.-K.; Edler, D.; Müller, C.; Schulze, P.; Dickmann, F.; Kuchinke, L. Where Is It (in the Map)? Recall and Recognition of Spatial Information. Cartogr. Int. J. Geogr. Inf. Geovis. 2017, 52, 80–97. [Google Scholar] [CrossRef]
- Edler, D.; Keil, J.; Bestgen, A.-K.; Kuchinke, L.; Dickmann, F. Hexagonal map grids—An experimental study on the performance in memory of object location. Cartogr. Geogr. Inf. Sci. 2019, 46, 401–411. [Google Scholar] [CrossRef]
- Olsen, A. Identifying parameter values for an I-VT fixation filter suitable for handling data sampled with various sampling frequencies. In Proceedings of the ETRA ′12: Proceedings of the Symposium on Eye Tracking Research and Applications, Santa Barbara, CA, USA, 28–30 March 2012; pp. 317–320. [Google Scholar] [CrossRef]
- Kiefer, P.; Giannopoulos, I. Gaze map matching: Mapping eye tracking data to geographic vector features. In Proceedings of the 20th International Conference on Advances in Geographic Information Systems, New York, NY, USA, 6–9 November 2012; pp. 359–368. [Google Scholar] [CrossRef]
- Dong, W.; Wang, S.; Chen, Y.; Meng, L. Using Eye Tracking to Evaluate the Usability of Flow Maps. ISPRS Int. J. Geoinf. 2018, 7, 281. [Google Scholar] [CrossRef] [Green Version]
- Just, M.A.; Carpenter, P. Eye fixations and cognitive processes. Cognit. Psychol. 1976, 8, 441–480. [Google Scholar] [CrossRef]
- Duchowski, A.T. Eye Tracking Methodology: Theory and Practice, 3rd ed.; Springer: Berlin/Heidelberg, Germany, 2007. [Google Scholar]
- Mann, H.B.; Whitney, D.R. On a Test of Whether on of Two Random Variables is Stochastically Larger than the Other. Ann. Math. Stat. 1947, 18, 50–60. [Google Scholar] [CrossRef]
- Kruskal, W.H.; Wallis, A. Use of Ranks in One-Criterion Variance Analysis. J. Am. Stat. Assoc. 1952, 47, 583–621. [Google Scholar] [CrossRef]
- Erkelens, J.C. Coordination of smooth pursuit and saccades. Vis. Res. 2006, 46, 163–170. [Google Scholar] [CrossRef] [PubMed] [Green Version]
- Wilkening, J.; Fabrikant, S.I. How users interact with a 3D geo-browser under time pressure. Cartogr. Geogr. Inf. Sci. 2013, 40, 40–52. [Google Scholar] [CrossRef] [Green Version]
- Rensink, R.; O’Regan, J.K.; Clark, J.J. To see or not to see: The need for attention to perceive changes in scenes. Psychol. Sci. 1997, 8, 368–373. [Google Scholar] [CrossRef]
- Ooms, K.; De Maeyer, F.; Fack, V.; Van Assche, E.; Witlox, F. Interpreting maps through the eyes of expert and novice users. Int. J. Geogr. Inf. Sci. 2012, 26, 1773–1788. [Google Scholar] [CrossRef]
- Murayama, K.; Elliot, A.J. The competition–performance relation: A meta-analytic review and test of the opposing processes model of competition and performance. Psychol. Bull. 2012, 138, 1035–1070. [Google Scholar] [CrossRef] [PubMed] [Green Version]
- Thoresen, J.C.; Francelet, R.; Çöltekin, A.; Richterm, K.-F.; Fabrikant, S.I.; Sandi, C. Not all anxious individuals get lost: Trait anxiety and mental rotation ability interact to explain performance in map-based route learning in men. Neurobiol. Learn. Mem. 2016, 132, 1–8. [Google Scholar] [CrossRef] [PubMed] [Green Version]
- Barvir, R.; Vozenilek, V. Developing Versatile Graphic Map Load Metrics. ISPRS Int. J. Geoinf. 2020, 9, 705. [Google Scholar] [CrossRef]
- Gołębiowska, I.; Opach, T.; Rød, J.K. For your eyes only? Evaluating a coordinated and multiple views tool with a map, a parallel coordinated plot and a table using an eye-tracking approach. Int. J. Geogr. Inf. Sci. 2016, 31, 237–252. [Google Scholar] [CrossRef] [Green Version]
- Medyńska-Gulij, B.; Wielebski, Ł.; Halik, Ł.; Smaczyński, M. Complexity Level of People Gathering Presentation on an Animated Map—Objective Effectiveness Versus Expert Opinion. ISPRS Int. J. Geoinf. 2020, 9, 117. [Google Scholar] [CrossRef] [Green Version]
- Jiang, B. The Fractal Nature of Maps and Mapping. Int. J. Geogr. Inf. Sci. 2015, 29, 159–174. [Google Scholar] [CrossRef] [Green Version]
- Ma, L.; Zhang, H.; Lu, M. Building’s fractal dimension trend and its application in visual complexity map. Build. Environ. 2020, 178. [Google Scholar] [CrossRef]
- Zagata, K.; Gulij, J.; Halik, Ł.; Medyńska-Gulij, B. Mini-Map for Gamers Who Walk and Teleport in a Virtual Stronghold. ISPRS Int. J. Geoinf. 2021, 10, 96. [Google Scholar] [CrossRef]
Figure 1.
Six examples of maps used in the study. On the left, there are maps (A–C) with road background, and on the right are maps (D–F) with satellite background. The actual track is highlighted with black and white lines (not visible by participants), with a pink dot directing the starting position of the animated route.

Figure 2.
Statistically significant differences between effectiveness of route memorization in terms of satellite background with 3 turns in spatial abilities groups.
Figure 2.
Statistically significant differences between effectiveness of route memorization in terms of satellite background with 3 turns in spatial abilities groups.

Figure 3.
Statistically significant differences between efficiency of route memorization in terms of road background with three turns in spatial abilities groups.
Figure 3.
Statistically significant differences between efficiency of route memorization in terms of road background with three turns in spatial abilities groups.
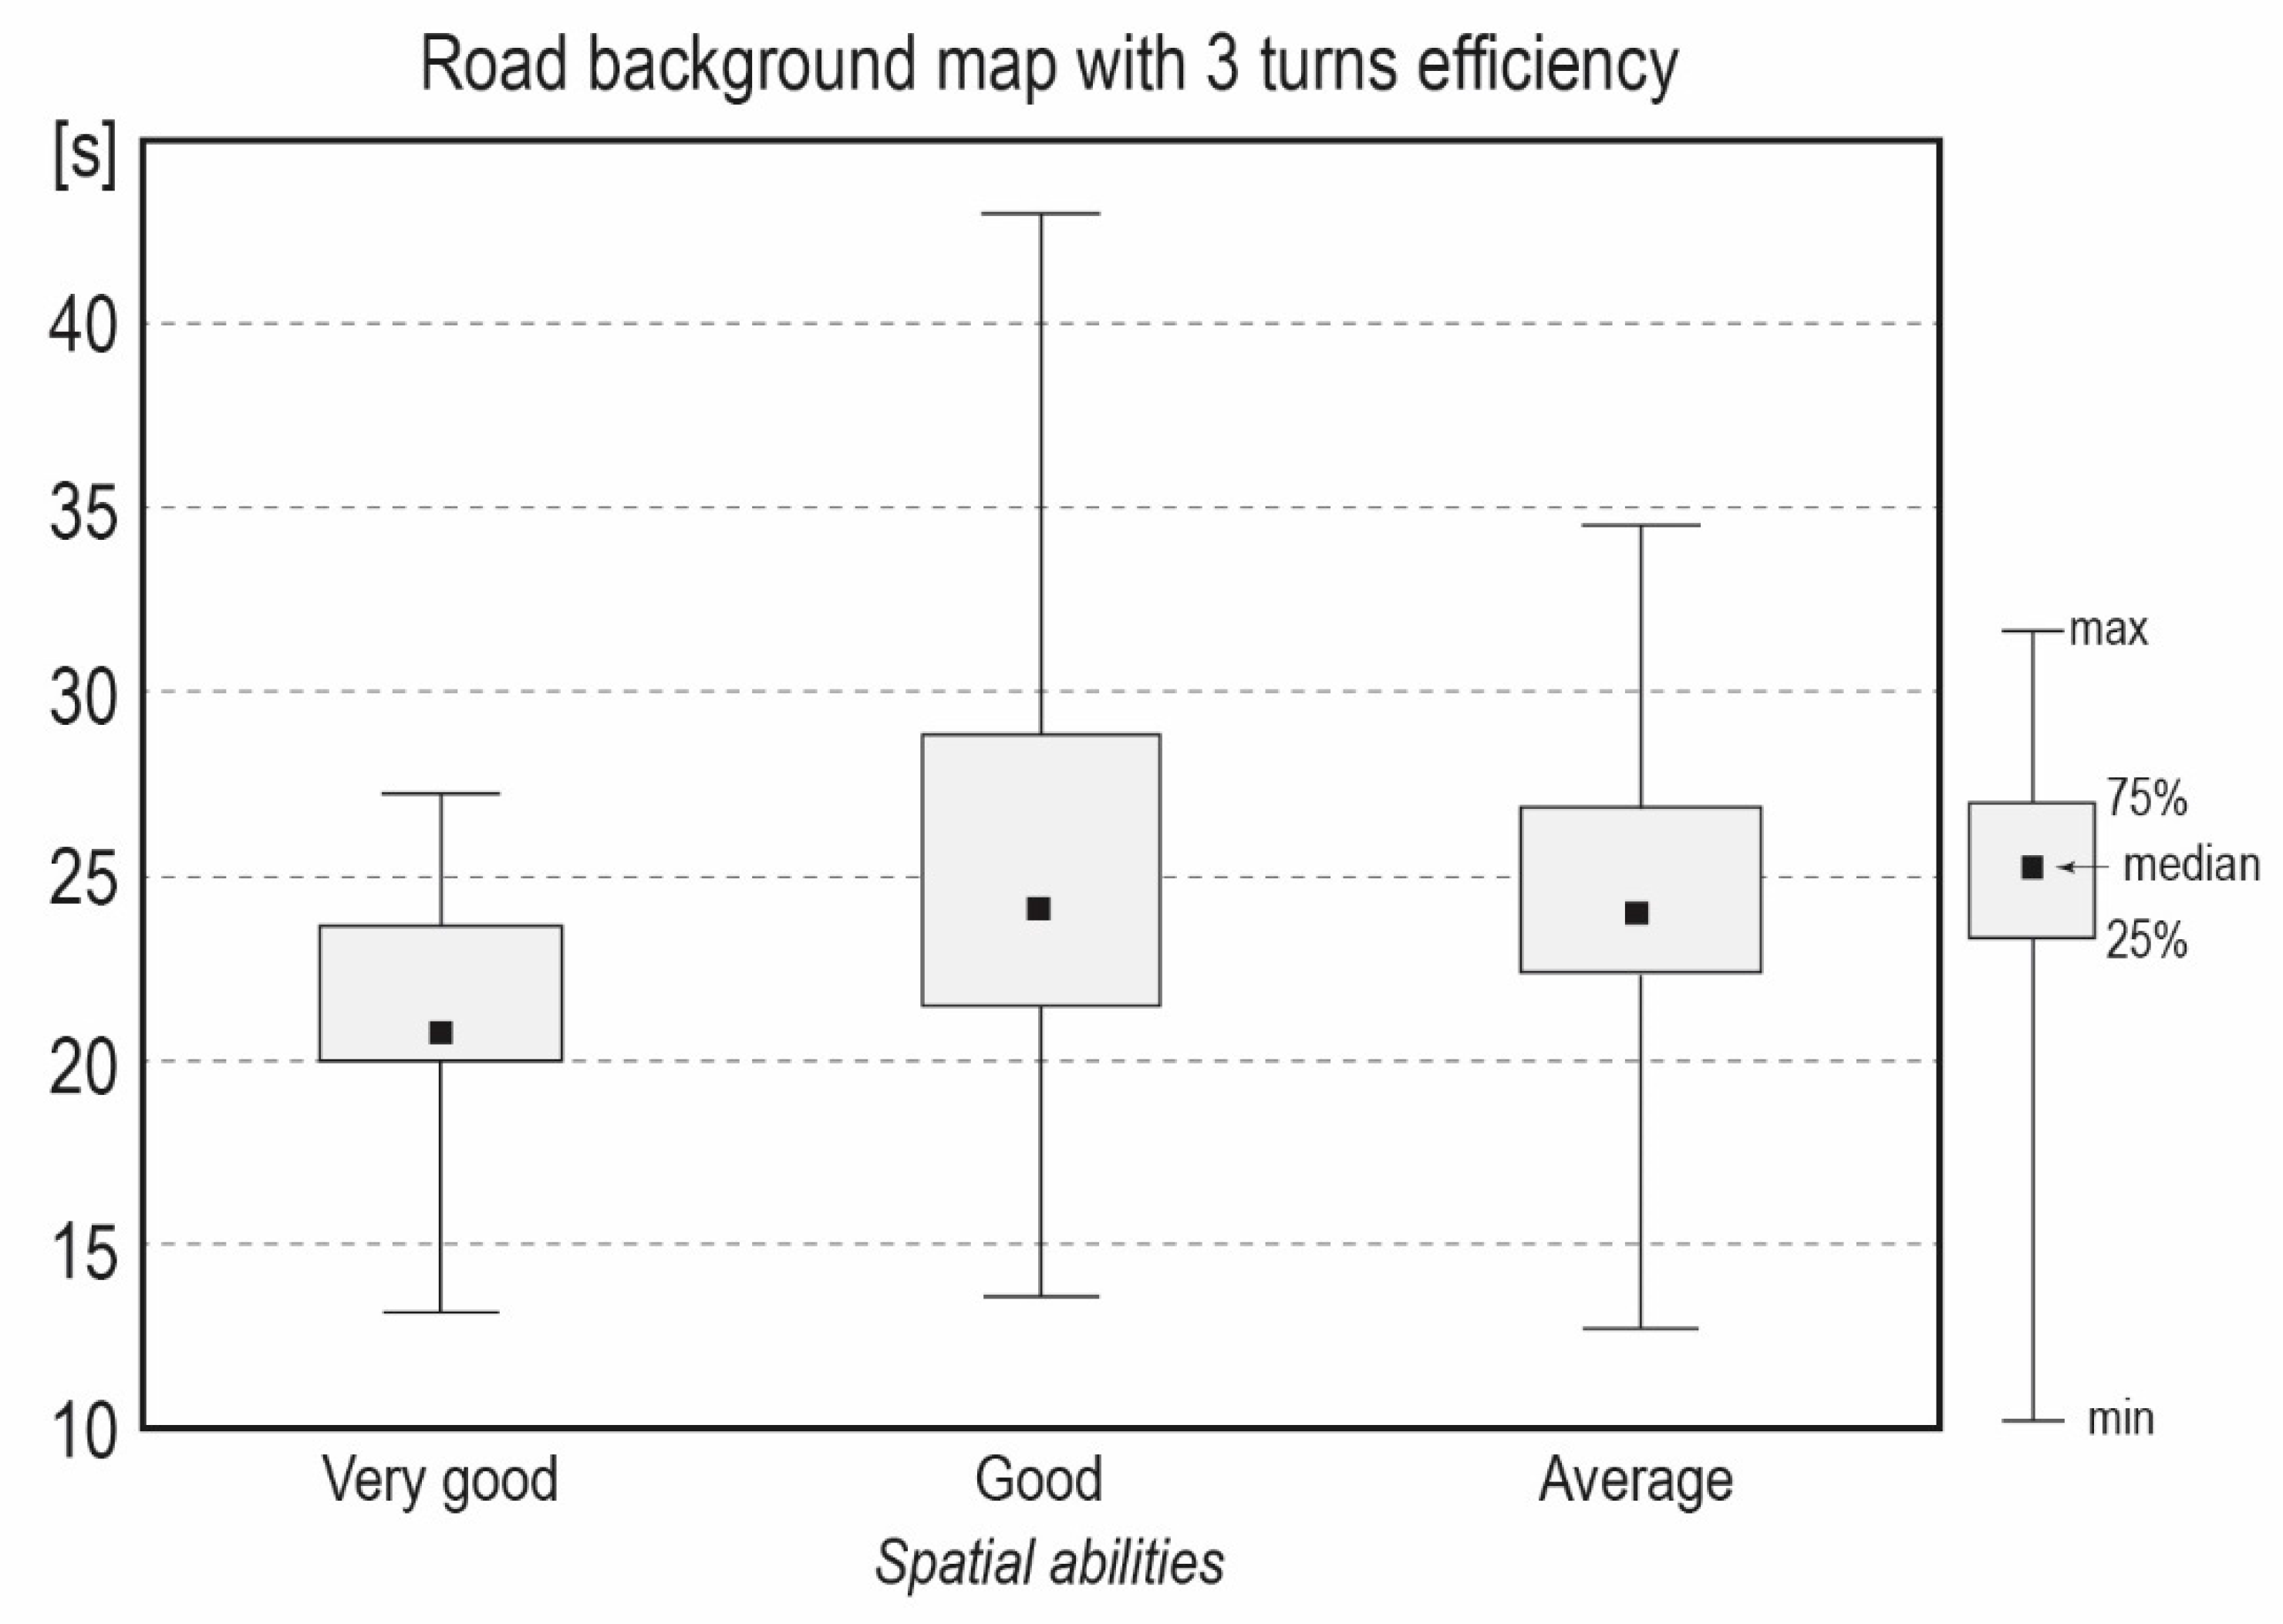
Figure 4.
Differences in saccadic amplitude between males and females in different background conditions and various numbers of turns.
Figure 4.
Differences in saccadic amplitude between males and females in different background conditions and various numbers of turns.
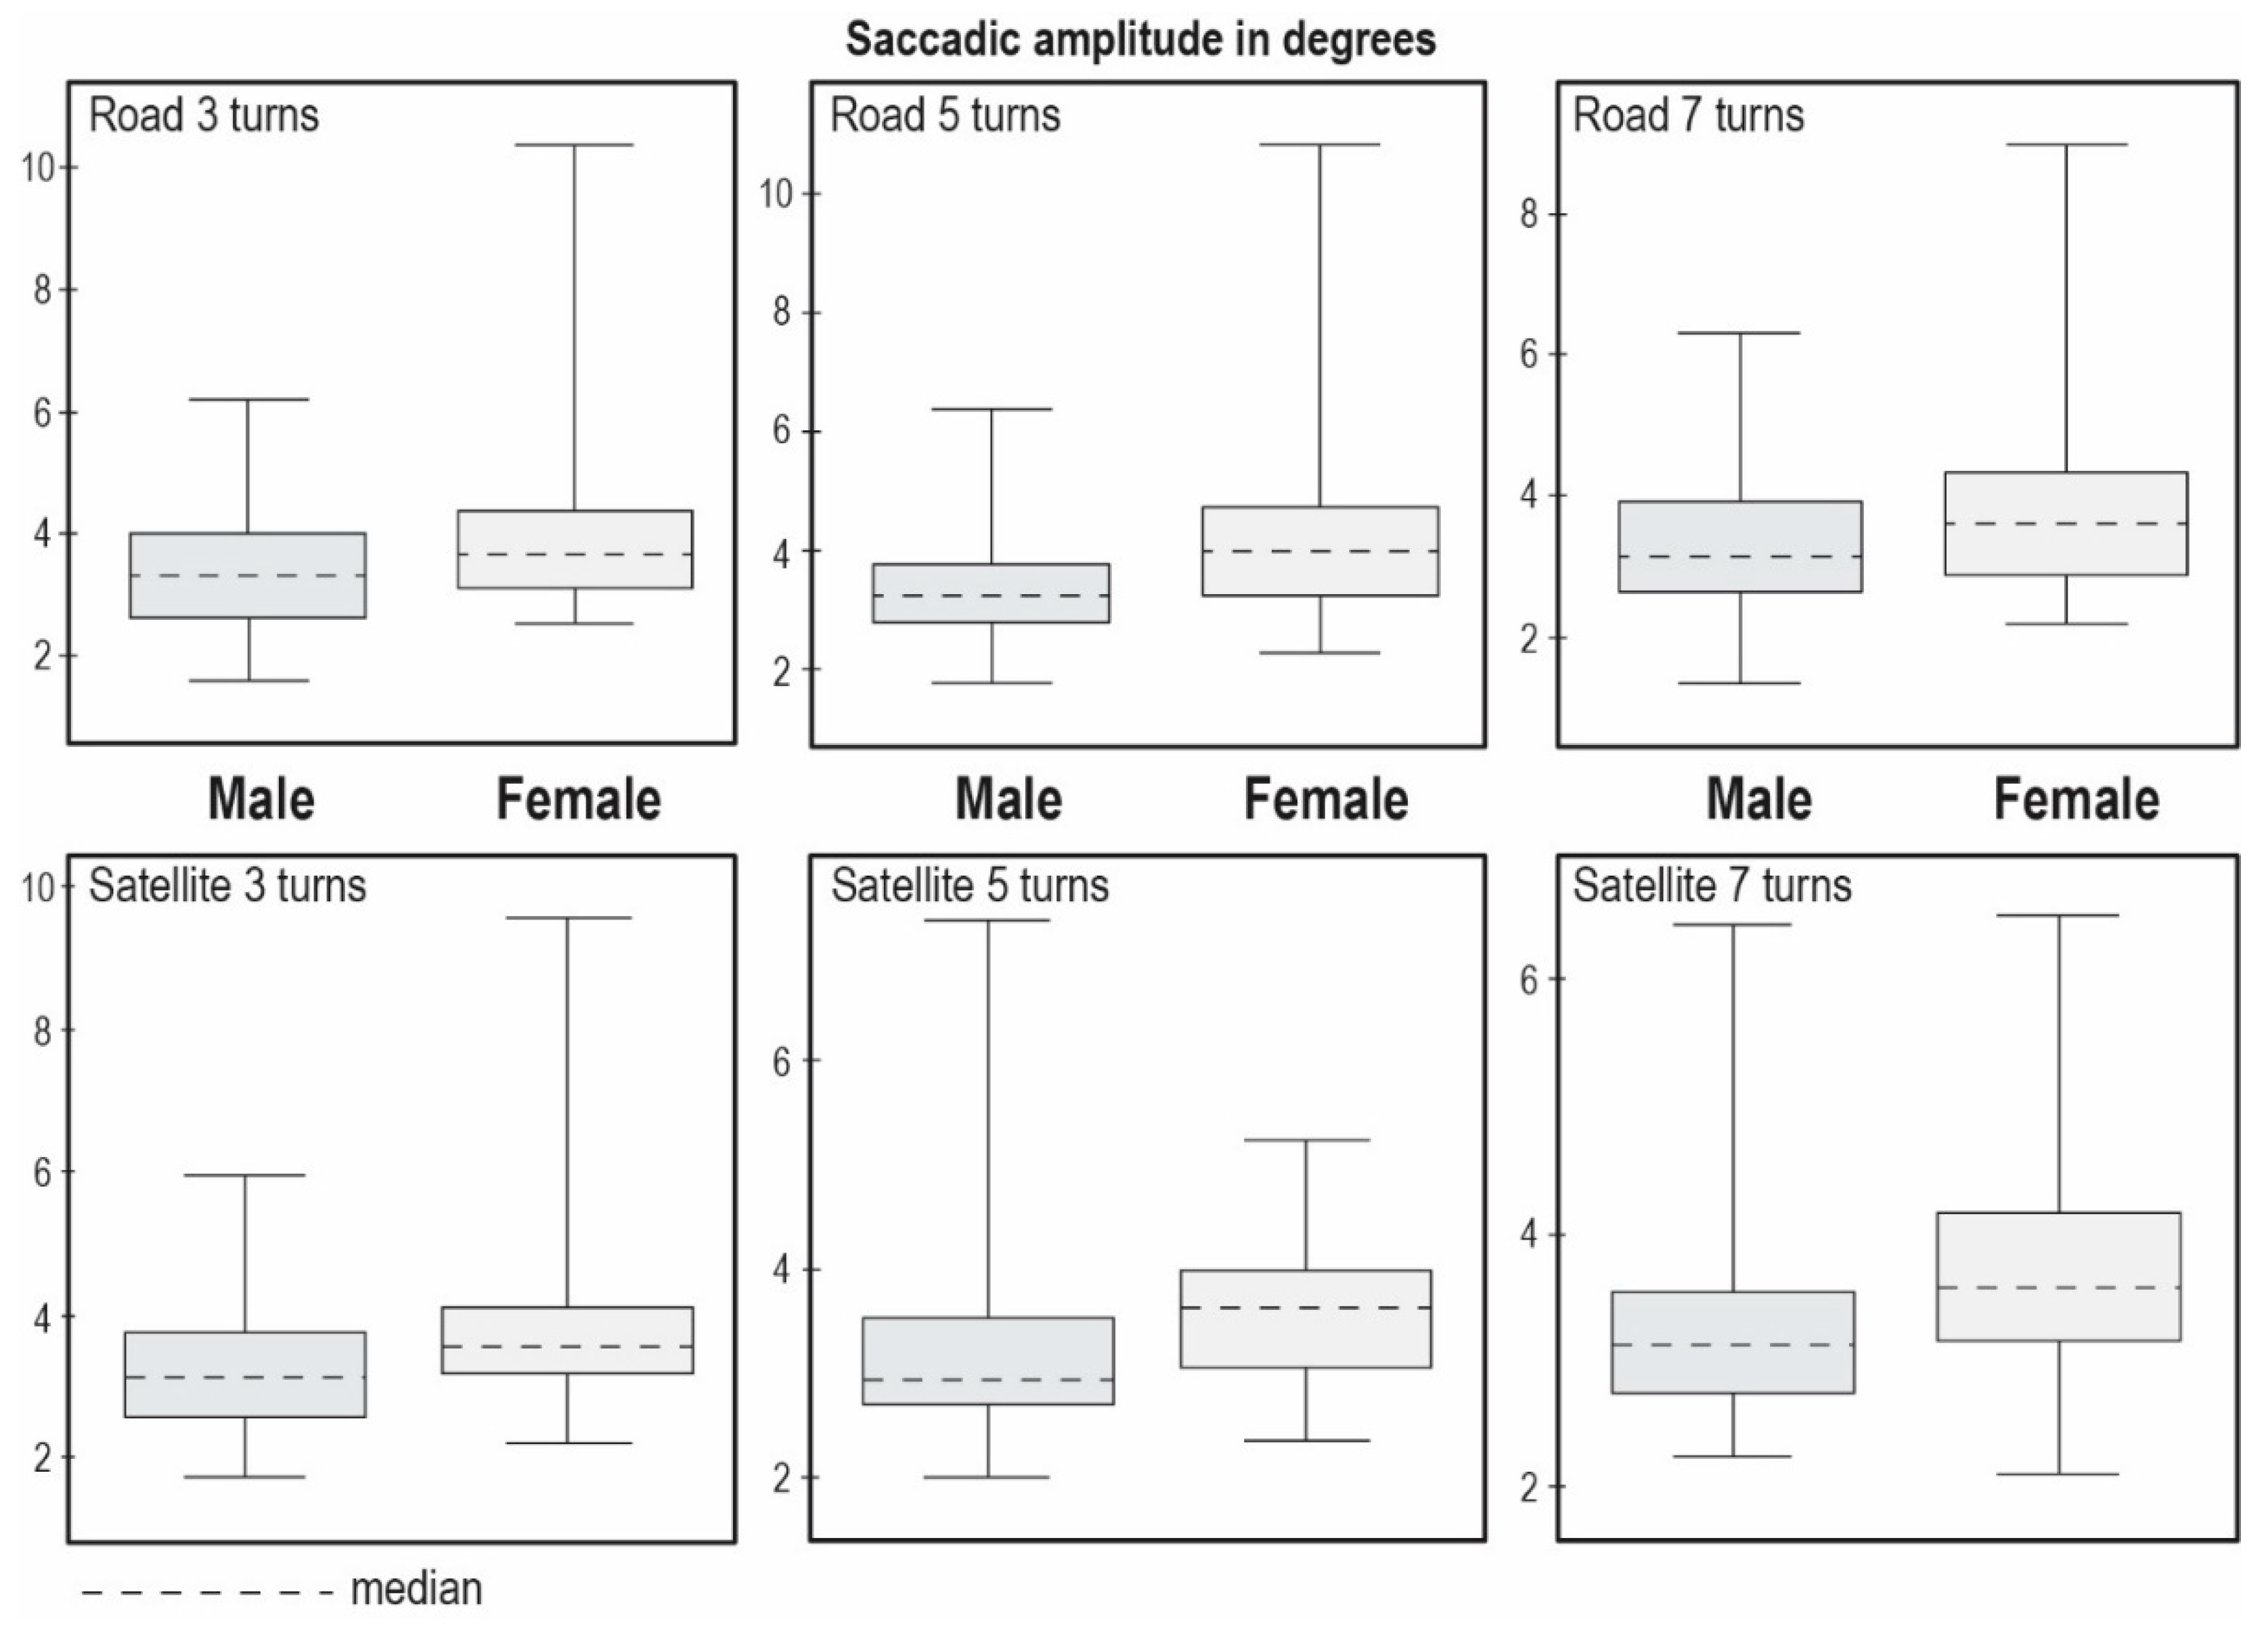
Figure 5.
Spatial distribution of random 15 participants’ fixations on selected route animations. The more red the color, the more fixations occurred during the watching of the animation. Subfigures on the left (A–C) presents example maps with road background. Subfigures on the right (D–F) presents example maps with satellite background.

Table 1.
The median effectiveness results for both cartographic backgrounds (road and satellite) with different number of turns.
Table 1.
The median effectiveness results for both cartographic backgrounds (road and satellite) with different number of turns.
| Animated Route Map Effectiveness—Median | ||
|---|---|---|
| Road map three turns | Road map five turns | Road map seven turns |
| 97.0% | 94.0% | 84.5% |
| Satellite map three turns | Satellite map five turns | Satellite map seven turns |
| 96.0% | 94.0% | 83.0% |
Table 2.
The median efficiency results for both cartographic backgrounds (road and satellite) with different number of turns.
Table 2.
The median efficiency results for both cartographic backgrounds (road and satellite) with different number of turns.
| Animated Route Map Efficiency—Median ± SD | ||
|---|---|---|
| Road map three turns | Road map five turns | Road map seven turns |
| 23.6 s ± 5.6 s | 23.6 s ± 5.4 s | 24.0 s ± 7.3 s |
| Satellite map three turns | Satellite map five turns | Satellite map seven turns |
| 24.9 s ± 5.4 s | 25.0 s ± 6.1 s | 25.5 s ± 7.1 s |
Table 3.
The median saccadic amplitude results for both cartographic backgrounds (road and satellite) with different number of turns.
Table 3.
The median saccadic amplitude results for both cartographic backgrounds (road and satellite) with different number of turns.
| Saccadic Amplitude—Median ± SD | ||
|---|---|---|
| Road map three turns | Road map five turns | Road map seven turns |
| 3.5° ± 1.3° | 3.5° ± 1.2° | 3.3° ± 1.1° |
| Satellite map three turns | Satellite map five turns | Satellite map seven turns |
| 3.4° ± 1.1° | 3.2° ± 0.8° | 3.4° ± 0.9° |
Table 4.
The median number of fixation results for both cartographic backgrounds (road and satellite) with different number of turns.
Table 4.
The median number of fixation results for both cartographic backgrounds (road and satellite) with different number of turns.
| Number of Fixations—Median ± SD | ||
|---|---|---|
| Road map three turns | Road map five turns | Road map seven turns |
| 60.5 ± 22.9 | 65 ± 21.4 | 67 ± 28.1 |
| Satellite map three turns | Satellite map five turns | Satellite map seven turns |
| 68 ± 22.3 | 67 ± 23.7 | 71 ± 29.7 |
Publisher’s Note: MDPI stays neutral with regard to jurisdictional claims in published maps and institutional affiliations. |
© 2021 by the author. Licensee MDPI, Basel, Switzerland. This article is an open access article distributed under the terms and conditions of the Creative Commons Attribution (CC BY) license (http://creativecommons.org/licenses/by/4.0/).
Share and Cite
MDPI and ACS Style
Cybulski, P. Effectiveness of Memorizing an Animated Route—Comparing Satellite and Road Map Differences in the Eye-Tracking Study. ISPRS Int. J. Geo-Inf. 2021, 10, 159. https://0-doi-org.brum.beds.ac.uk/10.3390/ijgi10030159
AMA Style
Cybulski P. Effectiveness of Memorizing an Animated Route—Comparing Satellite and Road Map Differences in the Eye-Tracking Study. ISPRS International Journal of Geo-Information. 2021; 10(3):159. https://0-doi-org.brum.beds.ac.uk/10.3390/ijgi10030159
Chicago/Turabian StyleCybulski, Paweł. 2021. "Effectiveness of Memorizing an Animated Route—Comparing Satellite and Road Map Differences in the Eye-Tracking Study" ISPRS International Journal of Geo-Information 10, no. 3: 159. https://0-doi-org.brum.beds.ac.uk/10.3390/ijgi10030159
Note that from the first issue of 2016, this journal uses article numbers instead of page numbers. See further details here.