
The Role of Spatio-Temporal Information to Govern the COVID-19 Pandemic: A European Perspective


1
School of Technology—Geoinformatics and Surveying, Mainz University of Applied Sciences, D-55118 Mainz, Germany
2
Cadastre, Land Registry and Mapping Agency, 7300 GH Apeldoorn, The Netherlands
*
Author to whom correspondence should be addressed.
ISPRS Int. J. Geo-Inf. 2021, 10(3), 166; https://0-doi-org.brum.beds.ac.uk/10.3390/ijgi10030166
Submission received: 1 March 2021
/
Revised: 10 March 2021
/
Accepted: 11 March 2021
/
Published: 14 March 2021
(This article belongs to the Special Issue Spatio-Temporal Models and Geo-Technologies)
Abstract
:The Covid-19 pandemic put a heavy burden on member states in the European Union. To govern the pandemic, having access to reliable geo-information is key for monitoring the spatial distribution of the outbreak over time. This study aims to analyze the role of spatio-temporal information in governing the pandemic in the European Union and its member states. The European Nomenclature of Territorial Units for Statistics (NUTS) system and selected national dashboards from member states were assessed to analyze which spatio-temporal information was used, how the information was visualized and whether this changed over the course of the pandemic. Initially, member states focused on their own jurisdiction by creating national dashboards to monitor the pandemic. Information between member states was not aligned. Producing reliable data and timeliness reporting was problematic, just like selecting indictors to monitor the spatial distribution and intensity of the outbreak. Over the course of the pandemic, with more knowledge about the virus and its characteristics, interventions of member states to govern the outbreak were better aligned at the European level. However, further integration and alignment of public health data, statistical data and spatio-temporal data could provide even better information for governments and actors involved in managing the outbreak, both at national and supra-national level. The Infrastructure for Spatial Information in Europe (INSPIRE) initiative and the NUTS system provide a framework to guide future integration and extension of existing systems.
1. Introduction
1.1. COVID-19 Pandemic
In March 2020 WHO declared the COVID-19 outbreak a pandemic [1]. Soon after, Europe had become the epicenter of the pandemic. The pandemic put an unprecedented burden on society and almost void of information, governments initially struggled to respond effectively to minimize the impact of the outbreak. Early detection, laboratory testing, isolation, contact tracing and referral of patients had to be managed, as well as taking measures to prevent further spreading of the virus.
Measures taken by national governments in Europe ranged from school, shop and workplace closures, travel bans, curfew to closing borders [2]. It is key for governments and their agencies to have the appropriate and reliable information at hand to make informed decisions—to the extent possible and amidst all uncertainty. A transparent information system has a dual function; on the one hand it can be used for governing the outbreak, on the other hand it can be used for communication purposes to inform and guide the public and to justify taken measures. The need for information is apparent at all governance levels, even though nations hold the authority to decide on interventions and measures taken for their own territory. The many connections between countries, for example the international traffic of people, goods and knowledge, nations within Europe and beyond inevitably lead to interdependencies. Uncoordinated measures from nations may lead to a ‘waterbed’ effect. When a national government successfully manages to bring down the number of infections due to a series of measures, it might be undermined by the lack of measures in adjacent countries. For example, closing shops in a country will lead to an influx of cross-border movements by people going to the neighboring country for shopping. The virus does not recognize borders and will travel along with people. Thus, apart from the need for spatio-temporal information at all governance levels, there is also a need to align information and interventions at the supra-national level.
From a geospatial perspective, the COVID-19 pandemic once again underpins the need for reliable data, geospatial information, enabling technologies, and insights for governments and citizens, to support decision-makers and to minimize the risk to people [3]. What can geospatial information and technologies do to assist stakeholders in a global pandemic? How can insights be communicated? How can geospatial technologies help in understanding the COVID-19 situation? How is adequate collaboration, coordination, engagement, and communication possible? What patterns are emerging? The availability of suitable geospatial information, and of aggregated and geographically disaggregated public health and related data is key for all countries to address the pandemic, across all population stakeholders.
This article aims to assess the role of geo-information in governing the COVID-19 pandemic in Europe and its Member States. The connectivity between Member States requires a supranational approach in addition to the national jurisdictions and approaches of individual Member States. Coordinated action at a European level can boost the availability of COVID-19 data and align responses from its Member States to reduce further distribution of the disease while minimizing the impact on the socio-economic domain. Europe is defined in this article as the 27 Member States, excluding overseas territories, of the European Union on 1 February 2020 [4]. The focus lies on how information is spatially visualized, which indicators are used, and how the role of geo-information evolved since the beginning of the outbreak. Due to the spatio-temporal nature of the distribution of the virus, the need arises to incorporate various governance levels rather than a monolithic national approach.
1.2. Spatiotemporal Nature of Infectious Diseases
Infectious diseases spread from person to person and thus by their very nature in space and time. Depending on the characteristics of the disease, different spatial distribution patterns can be observed [5]. Since COVID-19 was not known before, little information was available about the circumstances that influence contamination and consequently the spatial distribution by infected people. From a global perspective, the influence of long-range airline traffic which shapes the spatiotemporal pattern of a global epidemic by forcing infections due to multiscale processes in the disease dynamics [6] is also of particular interest [7]. The outbreak in China [8] suggests that in many cases the disease spreads under particular circumstances related to specific local environments, leading to spatially uneven distribution patterns in larger geographical areas. In Europe, a similar uneven distribution pattern of cases was observed in Italy, with three northern regions becoming major epicenters of the outbreak in the country [9].
Spatiotemporal heterogeneous distributions of diseases demand analyses considering the spatiality of the underlying phenomena. The aggregated national figures might not be representative or detailed enough to provide information needed at the local and regional level, due to uneven distribution patterns of the disease. The spatial distribution can be visualized on maps in different ways. Scale, number of classes, class limits, color scheme or circle size applied all influence how the statistical information is perceived by the reader [10]. A thematic map showing the number of cases at country level will erase any local or regional hotspots. To compare spatial units, the number of COVID-19 cases must be normalized against the total population in the spatial unit to exclude the effect of population density [11]. Similarly, decisions on how to map developments over time, especially chosen time interval, may affect how the information will be interpreted.
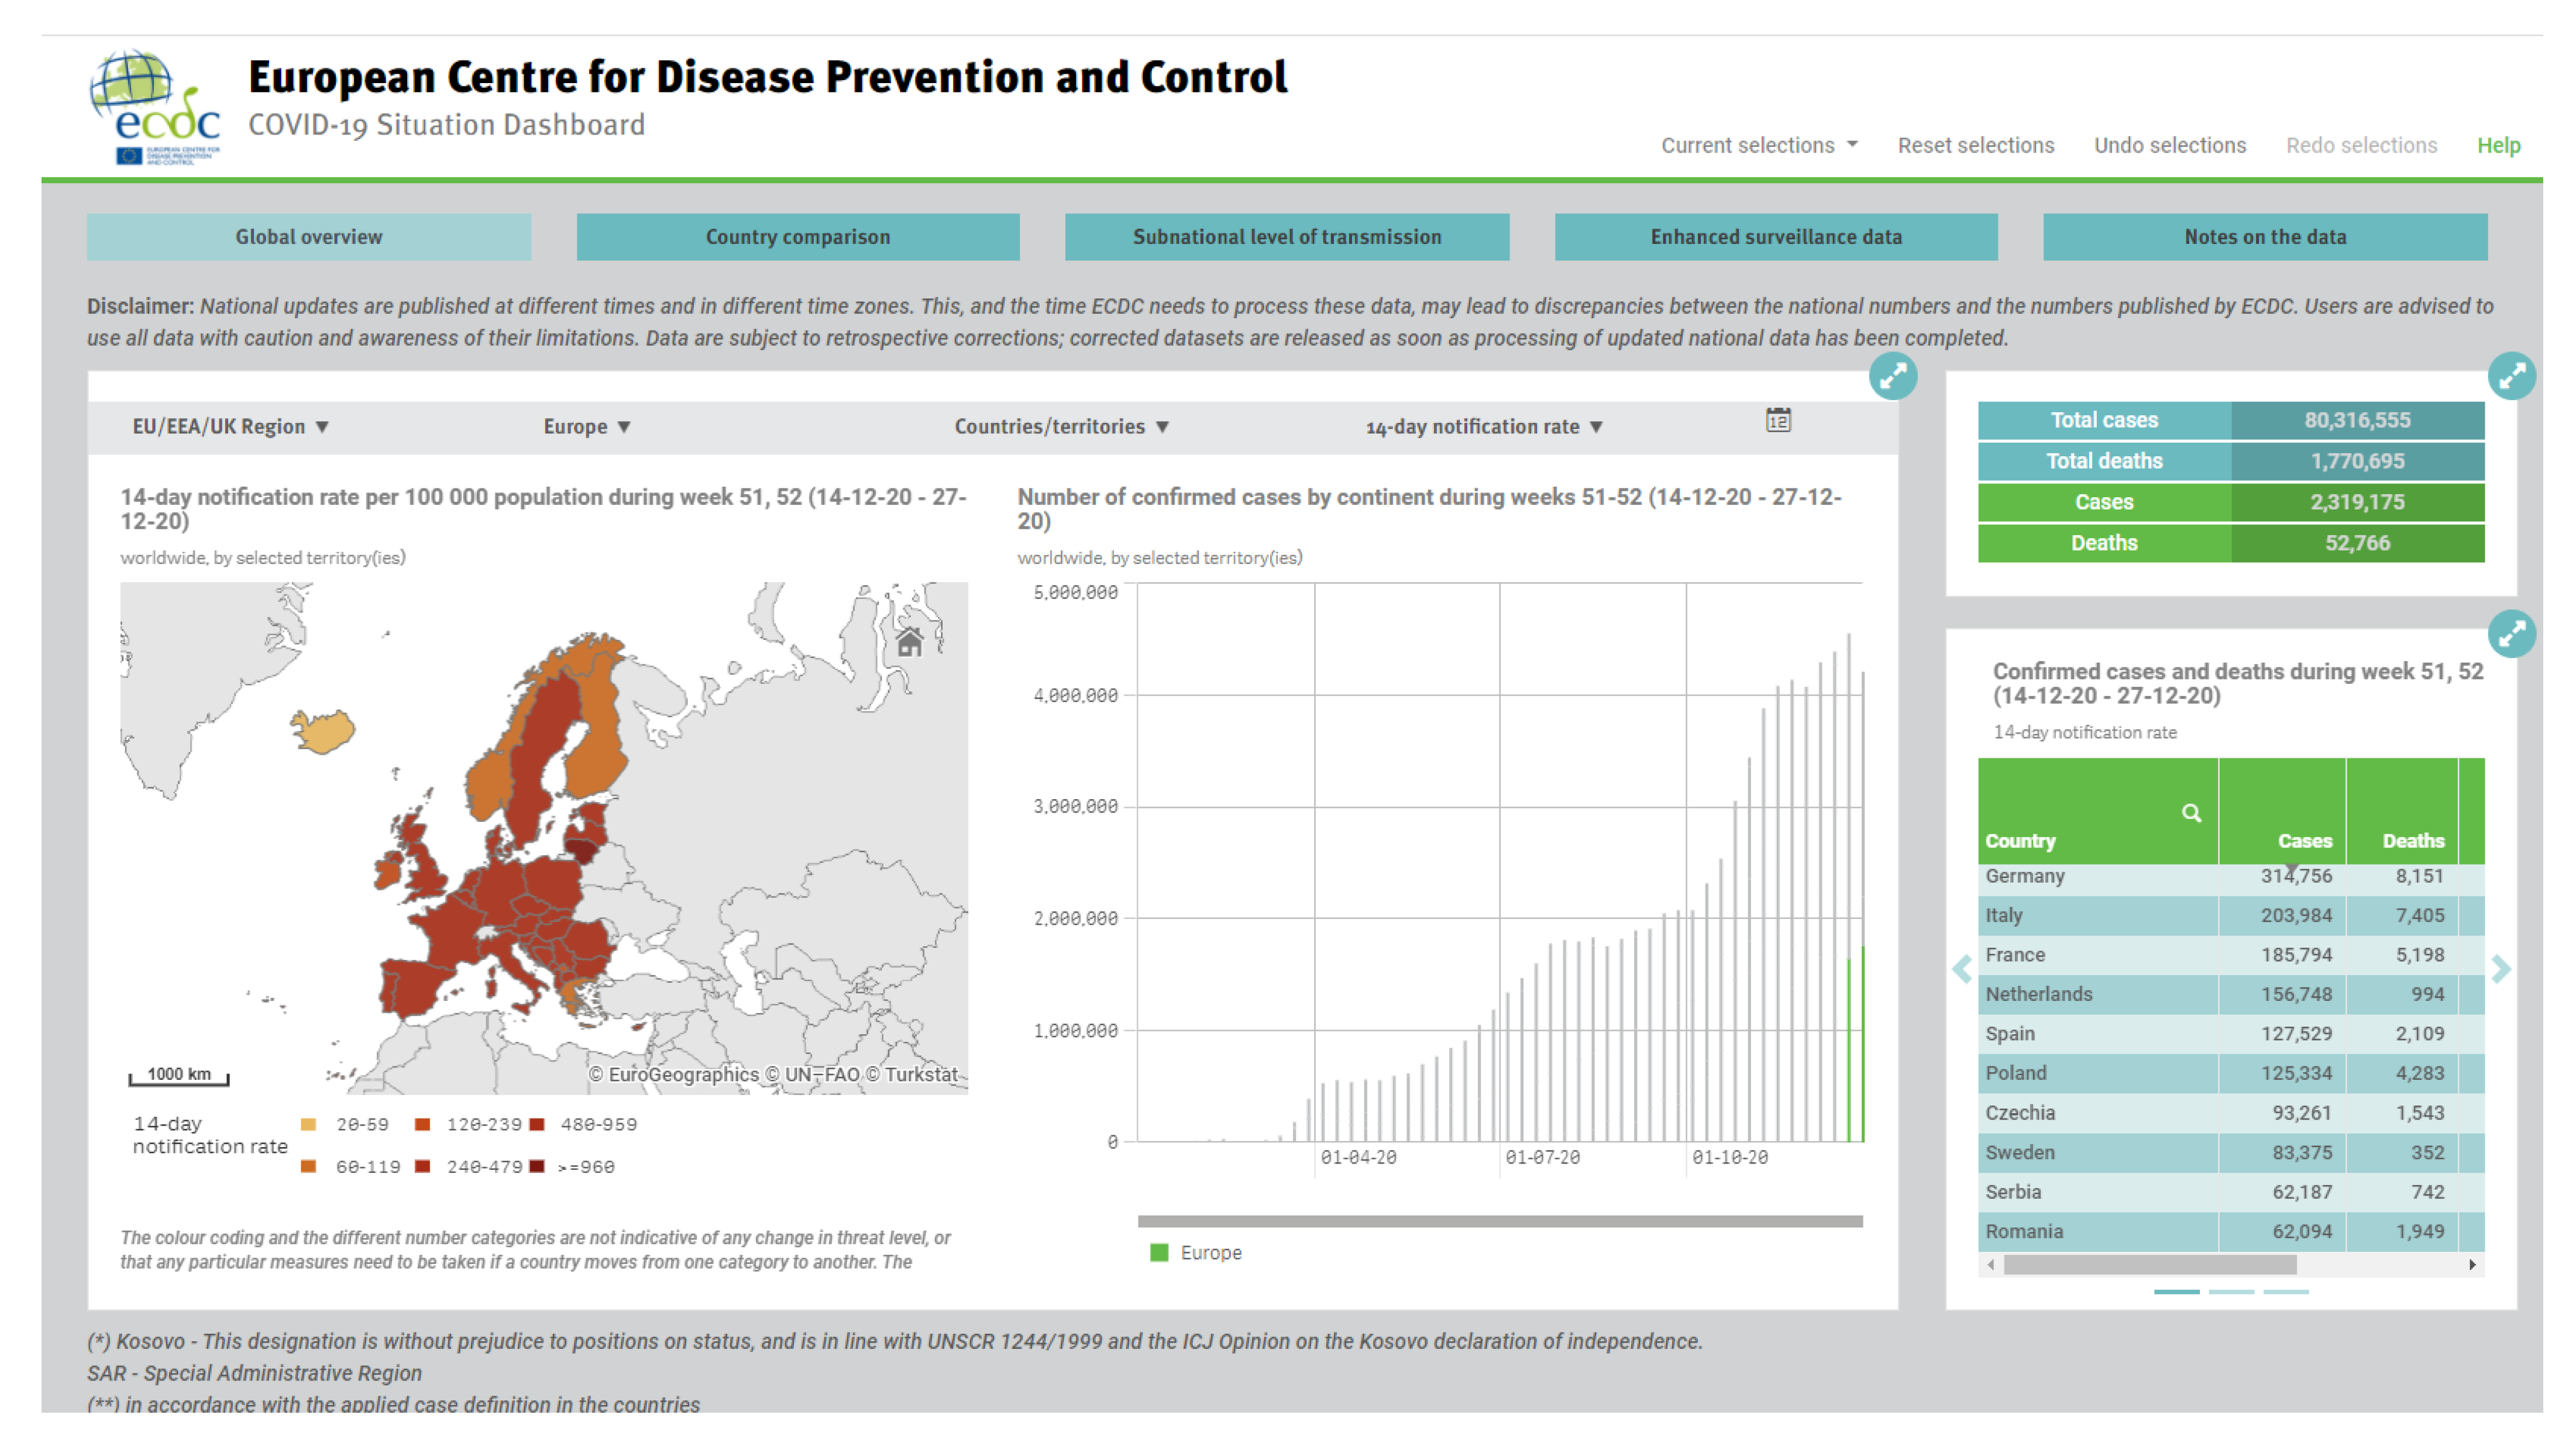
Data visualization of territories, mostly at country level, through mapping, dashboards and other techniques, is a valuable tool to present the characteristics of spatiotemporal phenomena (Figure 1 shows the European dashboard). Geospatial analysis of the underlying geospatial data can do much more. Trends in outbreaks over time and space, hotspots of infection, applicable rules and regulations, and available resources for medical treatment can be identified and disseminated to a wider public. In times of a pandemic such as COVID-19 a supranational view is needed, next to the national governance level, to take appropriate and coordinated action at all governance levels; supranational, national, regional, and local.
From a governance perspective, it is essential to have detailed enough information about the spatio-temporal distribution of the disease. The most elementary level from the health sector context are individual persons representing the basic unit of spatial analysis. Due to standards and regulations, publicly available data must be aggregated to a sufficient extent to adhere to protect individuals in their right for privacy [13]. An integrated statistical and geospatial framework [14] can be used as an excellent basis for managing such aggregated health data. A harmonized framework of spatially referenced territorial units can aggregate health data to the predefined territorial units to visualize and analyze spatiotemporal developments at various governance levels. Such a framework is very similar to the objectives of the European Infrastructure for Spatial Information in Europe (INSPIRE) initiative that is based on a number of principles [15]: (1) collect data only once and keep where it can be maintained most effectively, (2) combine seamlessly spatial information from different sources across Europe and share it with many users and applications, (3) information collected at one level/scale can be shared with all levels/scales; detailed for thorough investigations, general for strategic purposes, (4) geographic information needed for good governance at all levels should be readily and transparently available, and (5) ease of finding the geographic information that is available, how it can be used to meet a particular need, and under which conditions it can be acquired and used.
The next section describes a suitable spatial reference system for mapping and analyzing variables and time series, the available national dashboards of the Member States, and finalizes with three, in more detail described country cases. The successive sections discuss the challenges of providing and visualizing COVID-19 data needed to manage the outbreak.
2. Materials and Methods
2.1. The Nomenclature of Territorial Units for Statistics (NUTS) in Europe
The goal of this paper is to emphasize the spatiotemporal character of the COVID-19 spread. Integrated visualization and analysis of spatial phenomena requires a consistent underlying spatiotemporal reference system. Established in 1988, the Nomenclature of Territorial Units for Statistics (NUTS) provides a classification of the economic territory of the European Union into territorial units [16]. The three-level hierarchical classification scheme enables spatial aggregation and disaggregation according to the governance level. The system facilitates combining national statistical data from Member States in a standardized, consistent, and interoperable format at the European level. Therefore, we use this well-established reference system as the spatiotemporal reference of our work, irrespective of its original purpose to collect, develop and harmonize community regional statistics for socio-economic analyses of the regions, and for the framing of community regional politics.
The hierarchical NUTS classification consists of three levels. Each Member State is divided into NUTS 1 regions, each NUTS 1 region is subdivided into NUTS 2 regions, which in turn are subdivided into NUTS 3 regions.
The current NUTS 2016 classification is used for this study. It subdivides the territory of the European Union into 104 regions at NUTS 1 level, 281 regions at NUTS 2 level and 1348 regions at NUTS 3 level (Table 1). The NUTS Regulation defines the population size in minimum and maximum thresholds for the population rather than size as a key indicator to enhance comparability between units at the same level. Due to the three distinguished hierarchical levels, it also allows for scaling up or down.
Following the heterogeneous population density across the EU territory this definition results in a wide span of both area size and population number: the largest NUTS 1 region covers 336,859 km², the smallest region only 161 km². At NUTS 2 level, the largest region covers 227,150 km², the smallest 13 km². At NUTS 3 level the figures are 105,205 km² for the largest region and again 13 km² for the smallest. The population varies between 17.9 million and 29,200 inhabitants at the NUTS 1 level, between 12.2 million and 29,200 at the NUTS 2 level, and between 6.5 million and 10,900 inhabitants at the NUTS 3 level. Similarly, population density varies across the various NUTS units. These variations among statistical units in terms of area, population and population density are suboptimal for reporting about COVID-19. However, the NUTS system is the only standardized system currently known to be applied in Europe.
2.2. Member States Dashboards
Providing up to date information about the distribution of the virus and prevailing measures is key to make informed decisions on the one hand and on the other hand to inform citizens and organizations to comply with applicable measures (awareness raising or sensitization). Member State’s dashboards have been compared to analyze what COVID-19 data is disseminated and how it is visualized. A dashboard is broadly understood here as “a visual display of data used to monitor conditions and/or facilitate understanding” [17] and refers to both visual and functional dashboards that respectively display visual data representations and interactive representations enabling real-time monitoring [18]. The evaluation is based on a set of selected criteria to compare the dashboards of individual Member States in a standardized way. A multicriteria evaluation has been used to standardize the criterion scores to enable meaningful comparisons of the various types of criteria and to weight the criteria according to their level of importance [19].
The following criteria were selected for the evaluation of the dashboards: (1) COVID-19 parameters, (2) map type, (3) graph type, (4) available metadata, and (5) access to the data. The evaluation matrix (Table 2) shows selected evaluation criteria, their respective classification, the standardization of scores and criteria’s weight. The COVID-19 parameters focus on what information about the pandemic is included in the dashboard. To structure the analysis, a set of pre-defined parameters—considered being relevant information about the pandemic—was used, although other parameters included on the dashboards were considered as well in the evaluation. The map types and graph types focus on how the COVID-19 parameters were visualized. The last two criteria focus respectively on the available metadata, and to what extent access to the data sets is possible from the dashboard. The criteria COVID-19 parameters, available metadata and access to data weigh twice as much as the map type and the graph type, due to their respective importance for measuring and interpreting the severity of the pandemic and for disseminating and integrating the information for further processing. The latter is especially important at the European level, and aligns with the drivers for the INSPIRE initiative. Each dashboard was rated (Table 3) according to the outcome of the multicriteria evaluation: the total weighted score. The evaluation of dashboards represents the status of the dashboards at the moment of study (February 2021).
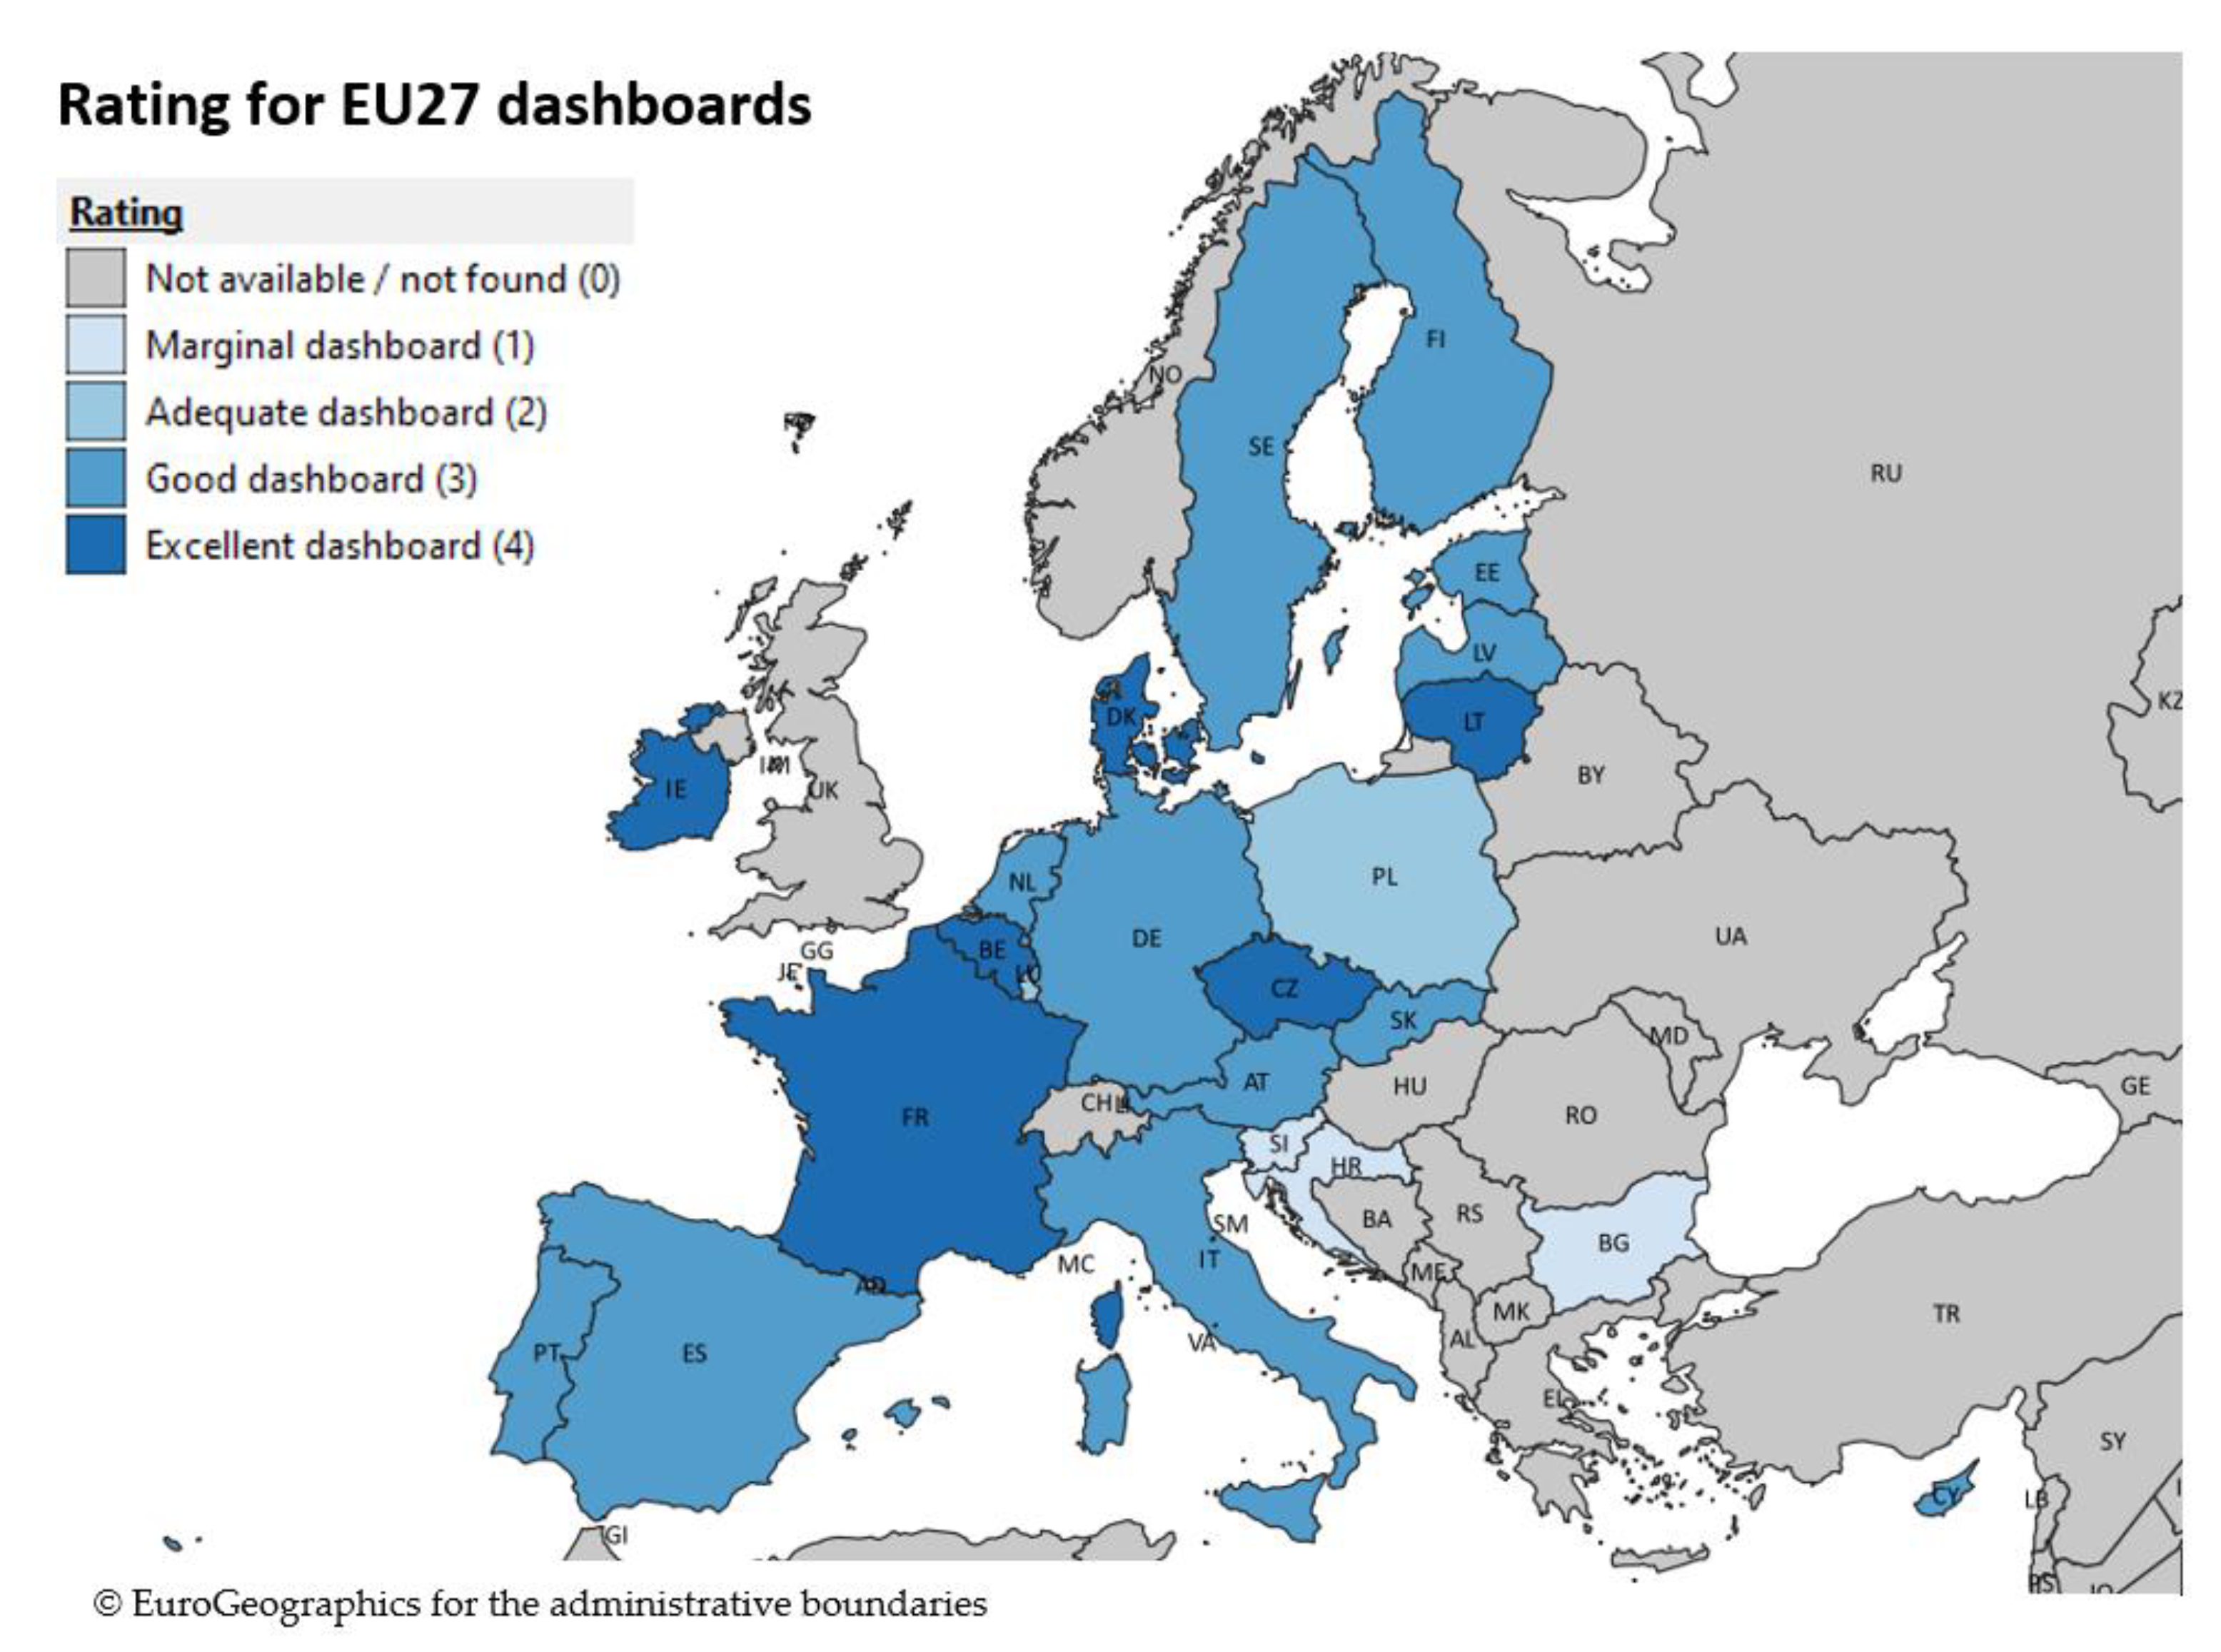
The results of the evaluation and comparison of COVID-19 dashboards (Table 4) shows a huge variety among the individual dashboards, both in parameters used describing the status of COVID-19 pandemic and their visualization. Most present key information, like the number of COVID-19 cases, hospitalized people, recovered people and deaths in absolute numbers. In addition to this, a choropleth maps is the de-facto standard to show the spatial distribution of these data or a selection of it. Some line and bar diagrams often complement the map and absolute numbers presented. Some dashboards provide additional COVID-19 information such as reproduction number, number and type of tests performed, ratio of positive tests, the virus level in sewage water, comorbidity, or the number of vaccinations. The variety in measurement units for the COVID-19 parameters is huge. Absolute and relative numbers are most common, although within and between dashboards not consistently used for all parameters. Apart from that, some parameters are described in time intervals, such as data for the previous day, 7-day interval and 14-day interval. Others present the data on different geographical scales, such as regions, districts, municipalities, either in maps, tables, or graphs. Due to the many combinations possible between parameters, measurement units, and visualization in graphs, maps, and tables, the variation in the dashboards among Member States is considerable. Based on the results of the multicriteria evaluation, Figure 2 maps the rating of dashboards per Member State.
The following sections describe the dashboards and use of spatiotemporal data in three Member States: France, Germany, and the Netherlands. France and Germany together have 150 million inhabitants, one third of the total EU population of 450 million. Both countries differ in terms of the political system, unitary (France) vs. federal (Germany), which could potentially affect the way public health information is provided. With more than 500 inhabitants per km², the Netherlands are one the most densely populated of all Member States. Due to their location and central position on the transportation network, connectivity with other Member States—including the transportation of people, goods and potentially the COVID-19 virus—is high. The diversity of the three selected countries aim to exemplify the potential diverse role of spatiotemporal data in governing the pandemic.
2.2.1. France
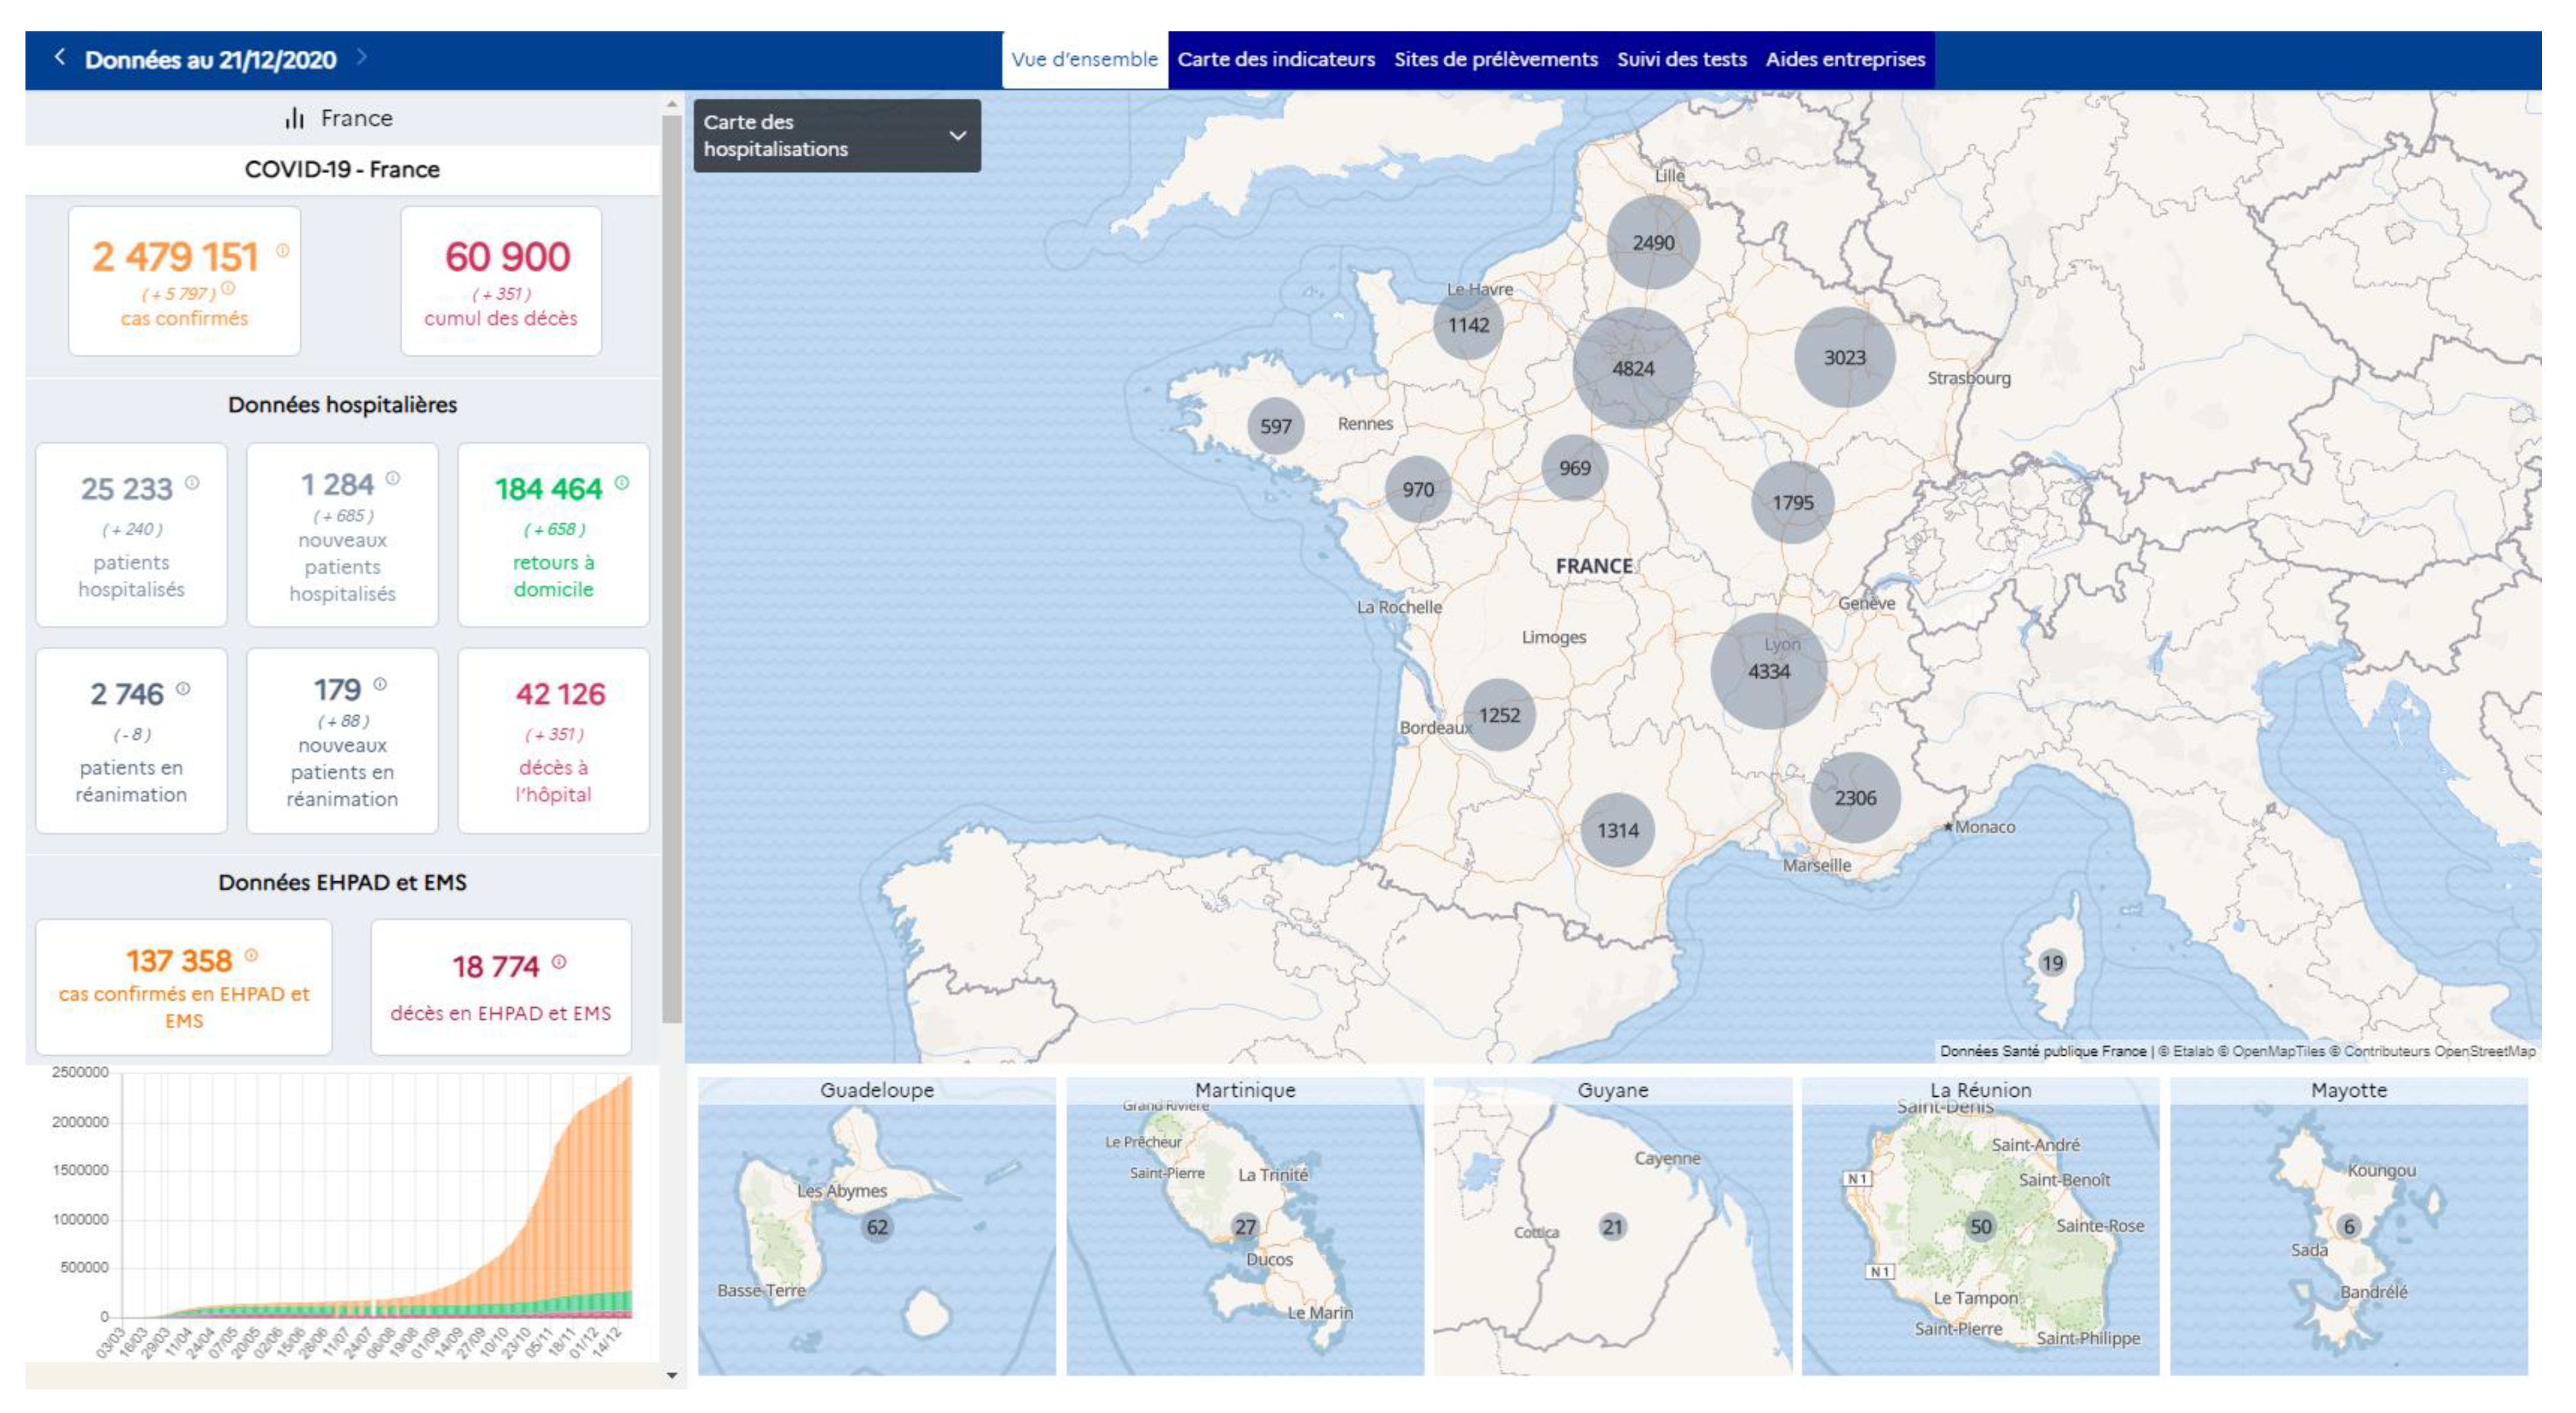
The French government has published a dashboard on the internet that presents COVID-19 related information geographically for the regions and departments (Table 4). The initial map is based on NUTS 1 but switches to lower NUTS levels and beyond when zooming in to a larger scale on the map. The homepage provides basic statistical information in figures and maps the distribution of hospitalized COVID-19 patients geographically (Figure 3). The figures show the current number of cases, hospitalized patients and their increase in the last 24 h, as well as a bar graph showing the cumulative cases over time. Other tabs on the dashboard show the number of cases per administrative unit at local level, test sampling locations and the test results. It is possible to retrieve the information on a particular date. Hence it is possible to consult the course of the disease geographically, albeit manually. The dashboard was developed relatively early in the pandemic and did not change much over time.
At the start of the outbreak in France, all measures taken to reduce further distribution of the virus were imposed on all regions. Over the course of time, spatiotemporal data showed that some regions were affected more than others. This paved the way for spatial diversification of regulatory measures. Measures were imposed in specific regions, but not for the whole country.
2.2.2. Netherlands
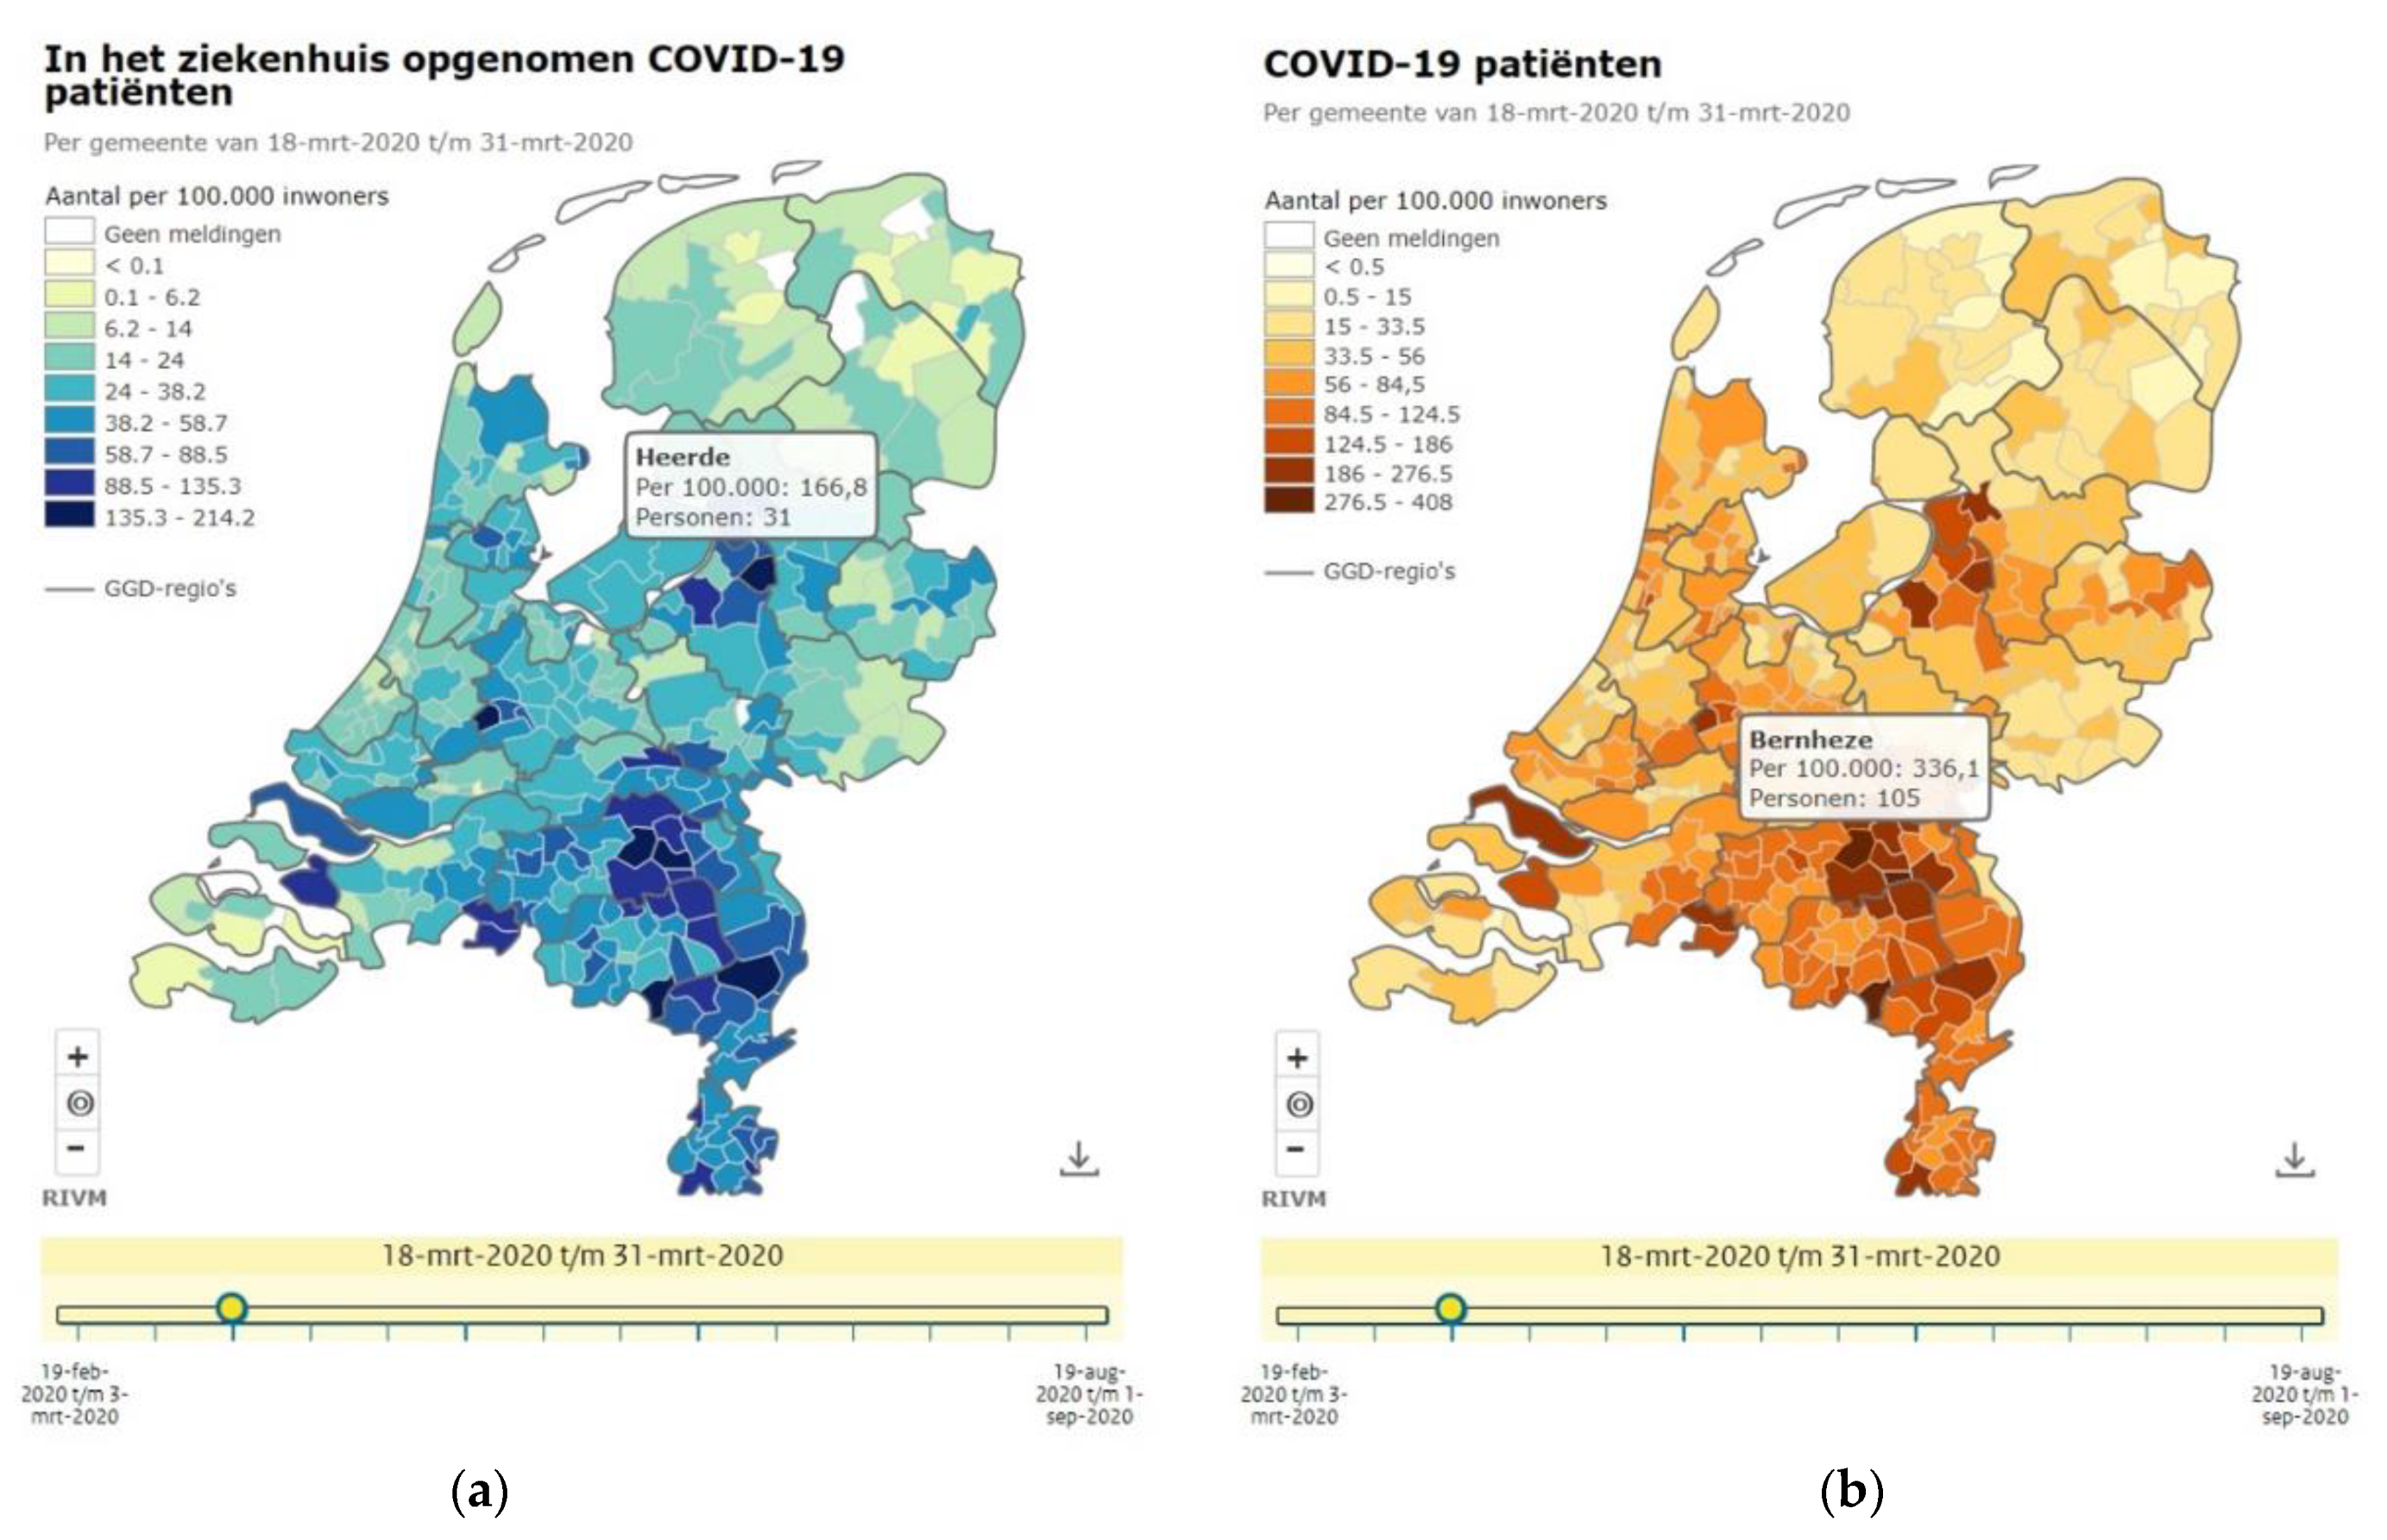
After the crisis team became operable, the national institute for public health and the environment, operating under the Ministry of Health, Welfare and Sport, became responsible for dissemination of Covid-19 related data and figures. The government in the Netherlands chose to publish most Covid-19 related information initially in traditional graphs instead of mapping it. Only the relative number of Covid-19 cases and hospitalized people per 100,000 inhabitants per municipality were visualized geographically (Figure 4a,b). Compared to absolute numbers, this relative number allows to compare between municipalities with varying population densities. The media mapped the confirmed hospitalized patients over time by stacking daily choropleth maps at municipality level to show the spreading of the disease of the country over time [21]. Here, one can see that the disease was spread across the country from the south to the west and north due to various events, e.g., spring holiday and carnival, and movements of people between the regions. The three most norther provinces were hardly affected, most likely due to their remote character relative to the location of the big cities in the west and south.
Over the course of the pandemic the national government developed a dashboard (Table 4) to inform the public. The NUTS 2 level (provinces) is used as a basis, but geographically larger NUTS 2 units have been further subdivided according to administratively defined safety regions. The initial version of the dashboard was expanded and elaborated gradually to the current version [22]. It provides information at the national level, at safety region level (slightly smaller areas than the regional government) and at municipal level. Each is presented on a different dashboard Tab. Apart from absolute and relative numbers of cases, hospitalized patients and their progress over time, the dashboard also provides information about measures taken and rules applying in the region.
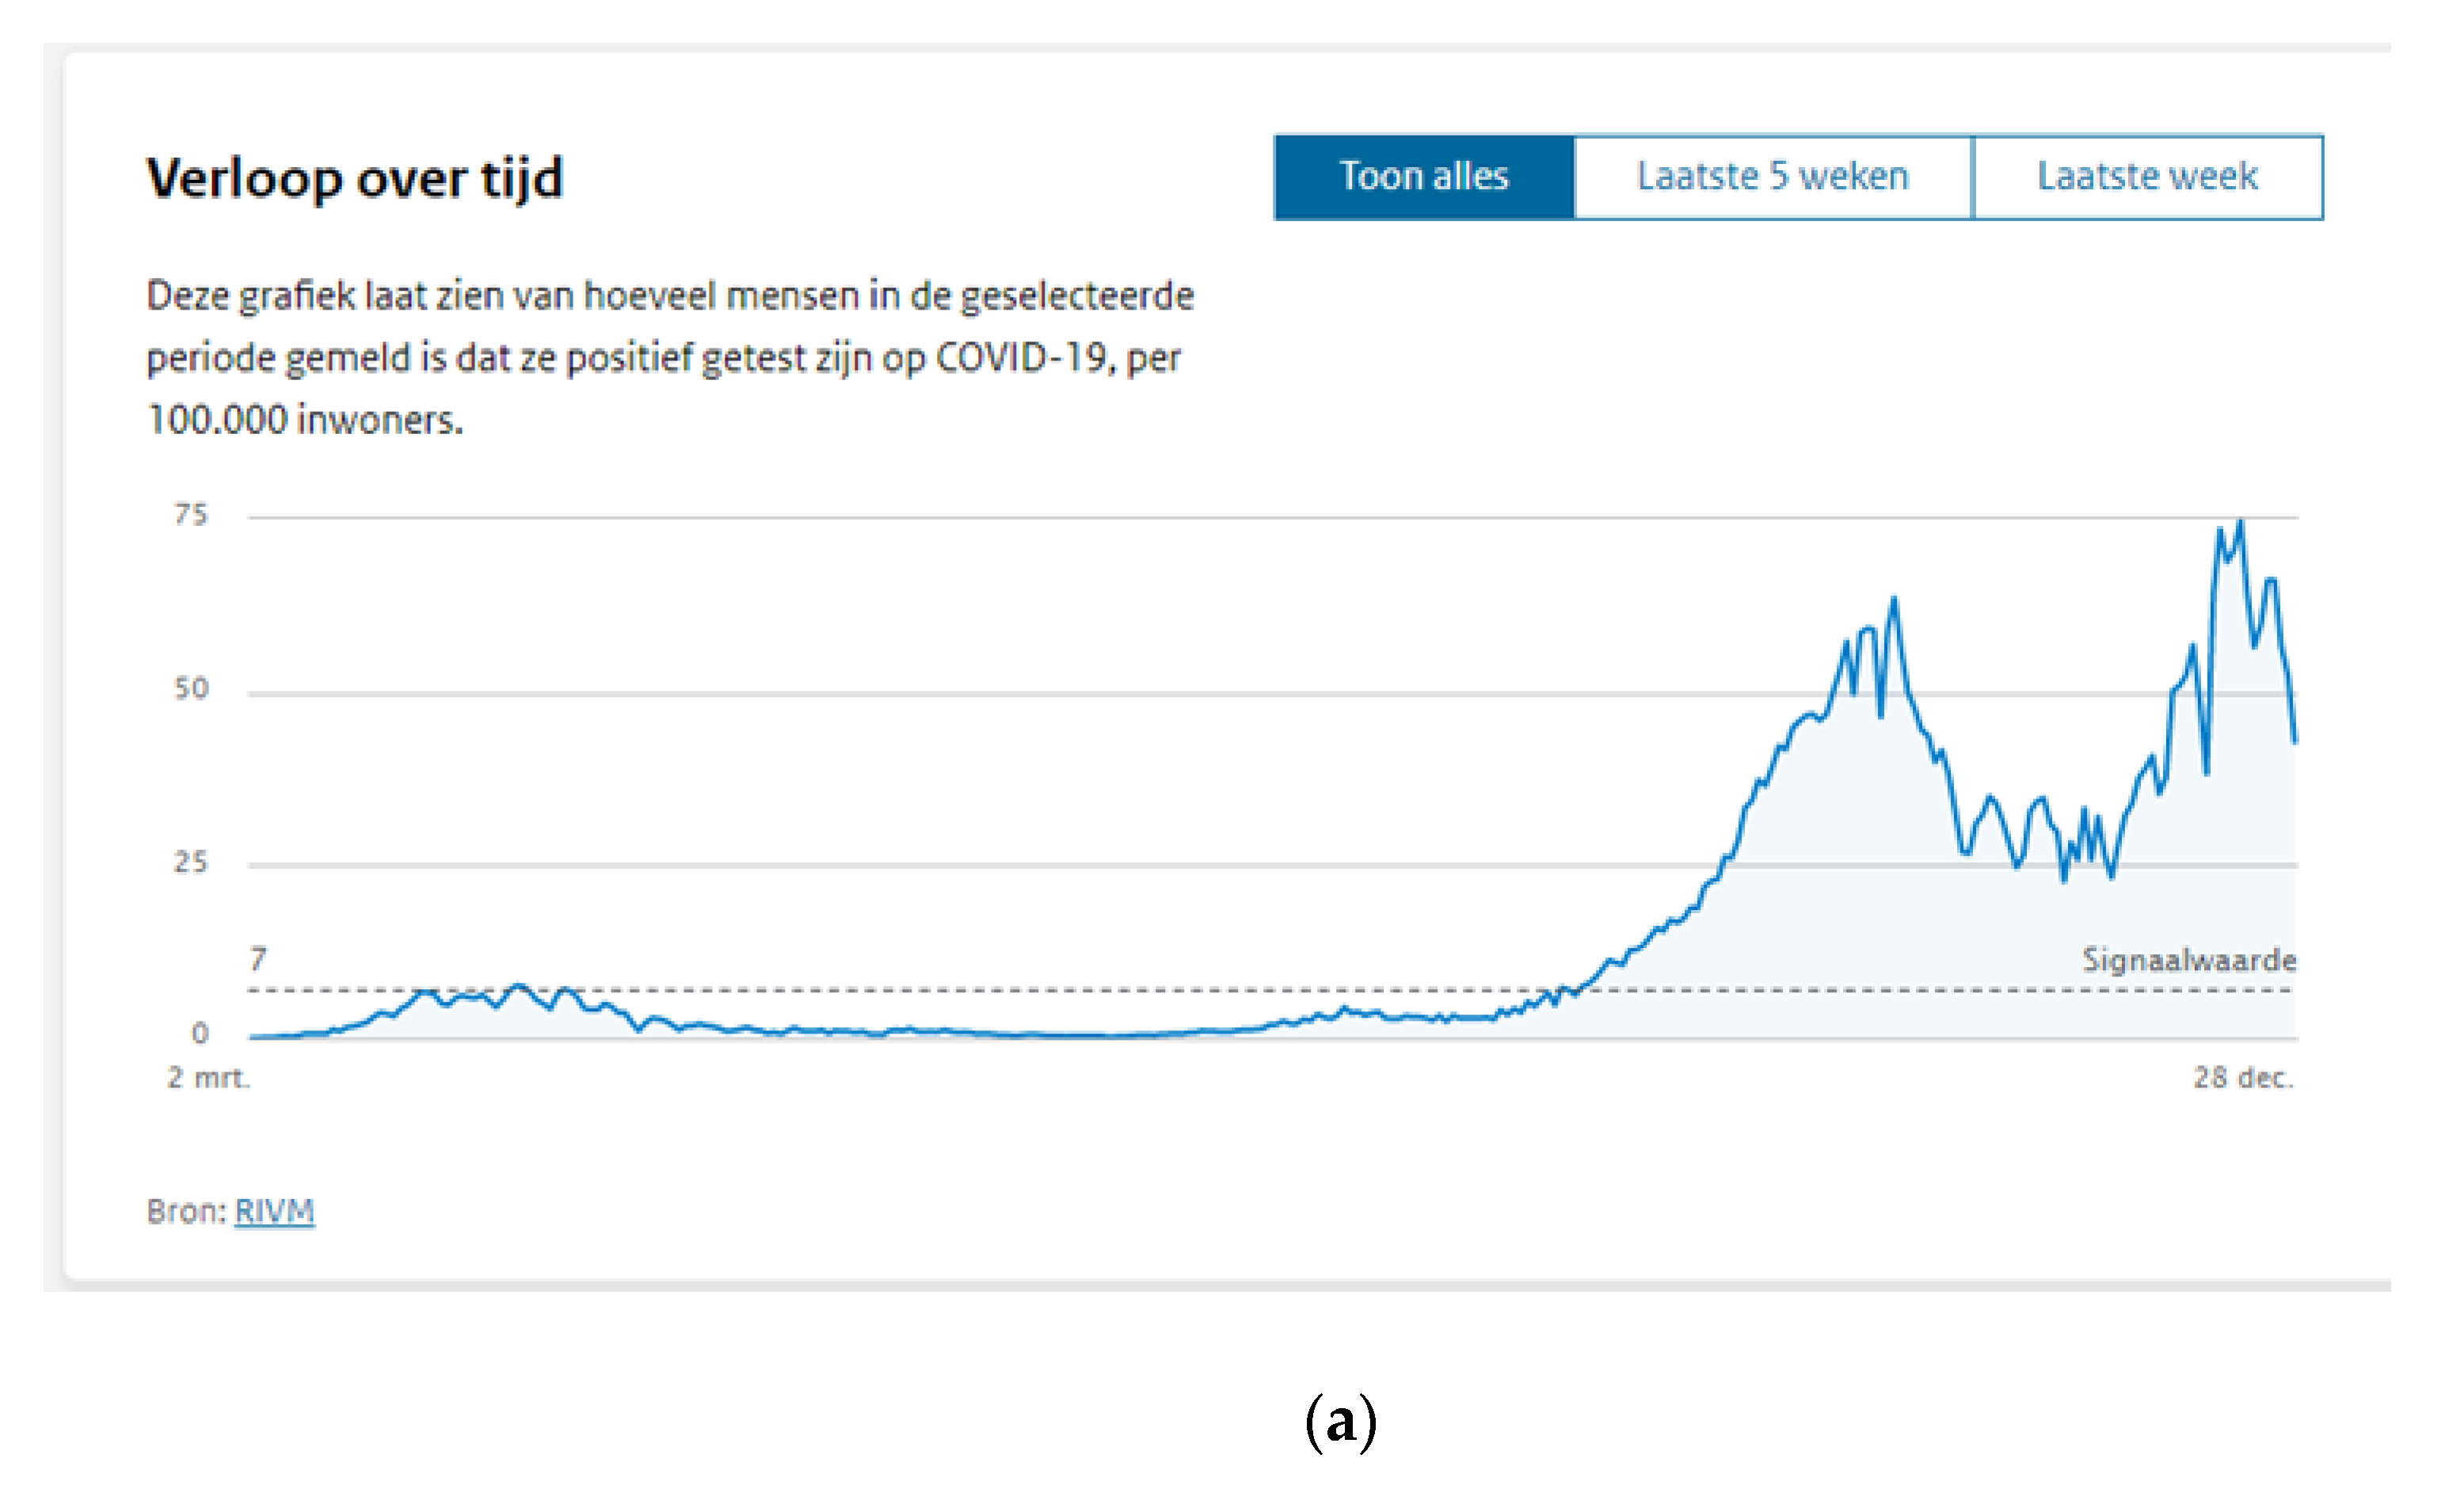
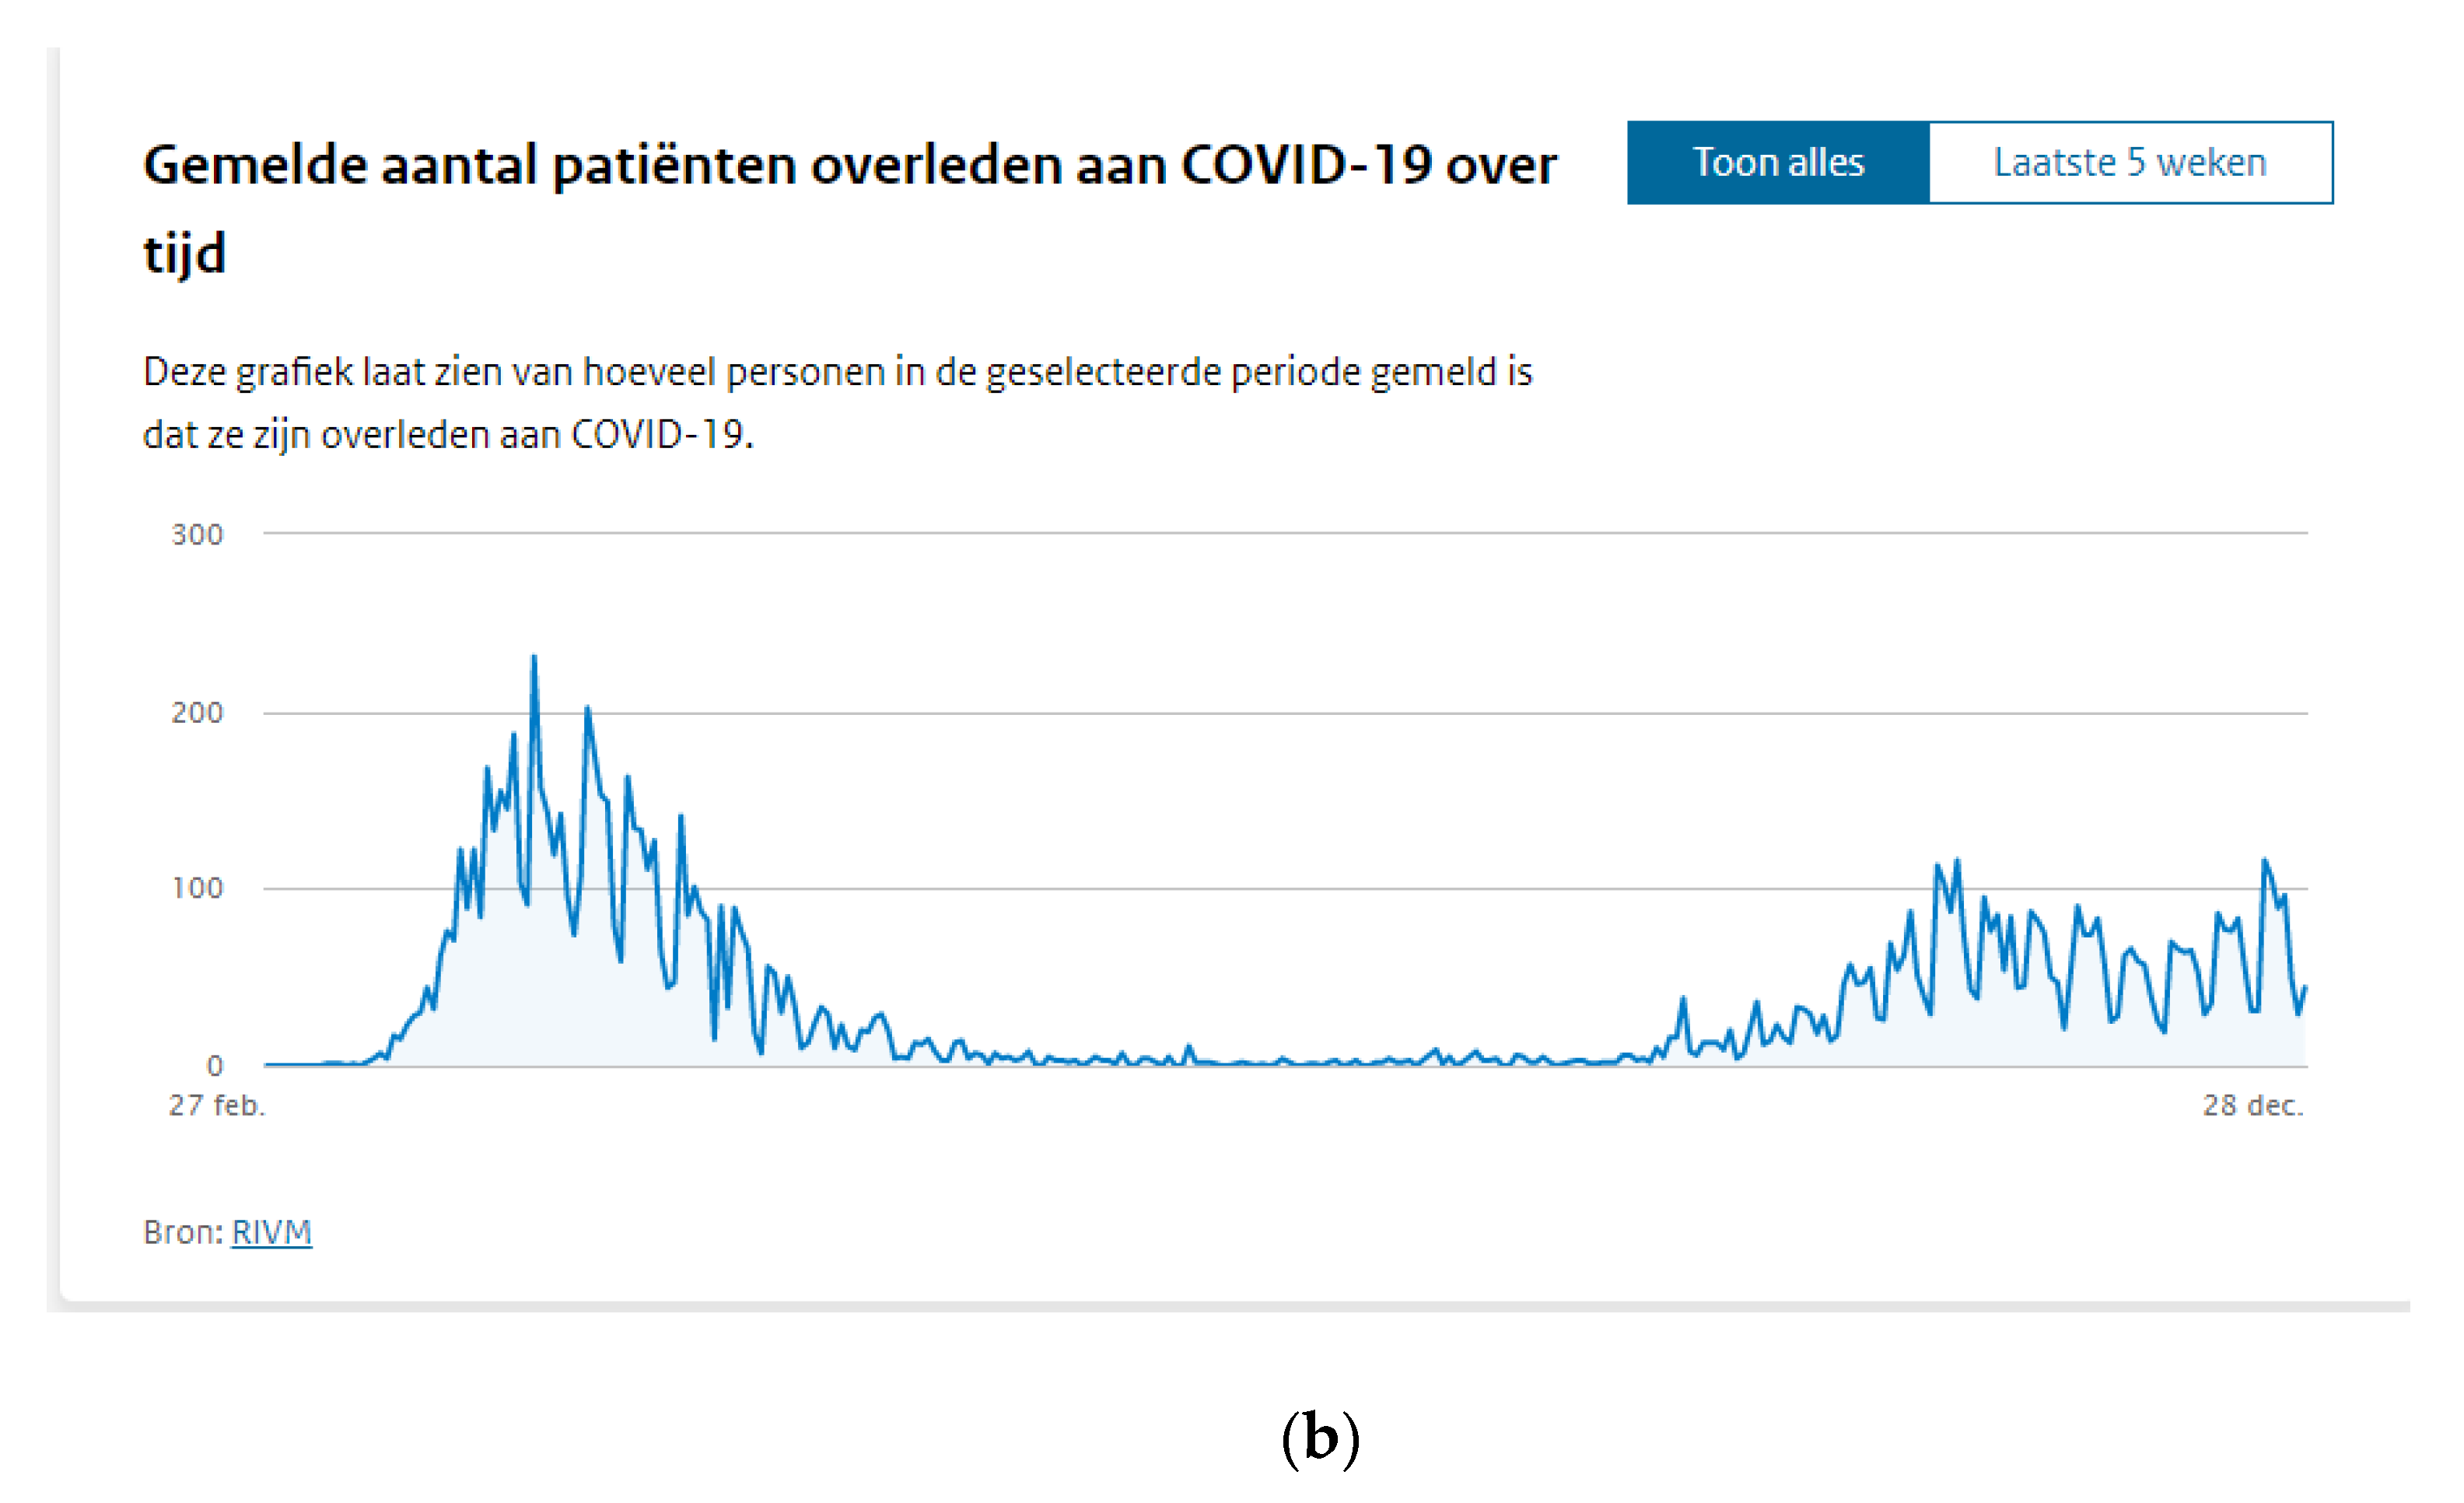
Figure 5a,b clearly shows the discrepancy between respectively the relative number of positive cases and the number of deaths in the beginning of the outbreak. Due to a lack of test material, the government could not clearly capture the outbreak in statistics, like later over the course of the outbreak.
2.2.3. Germany
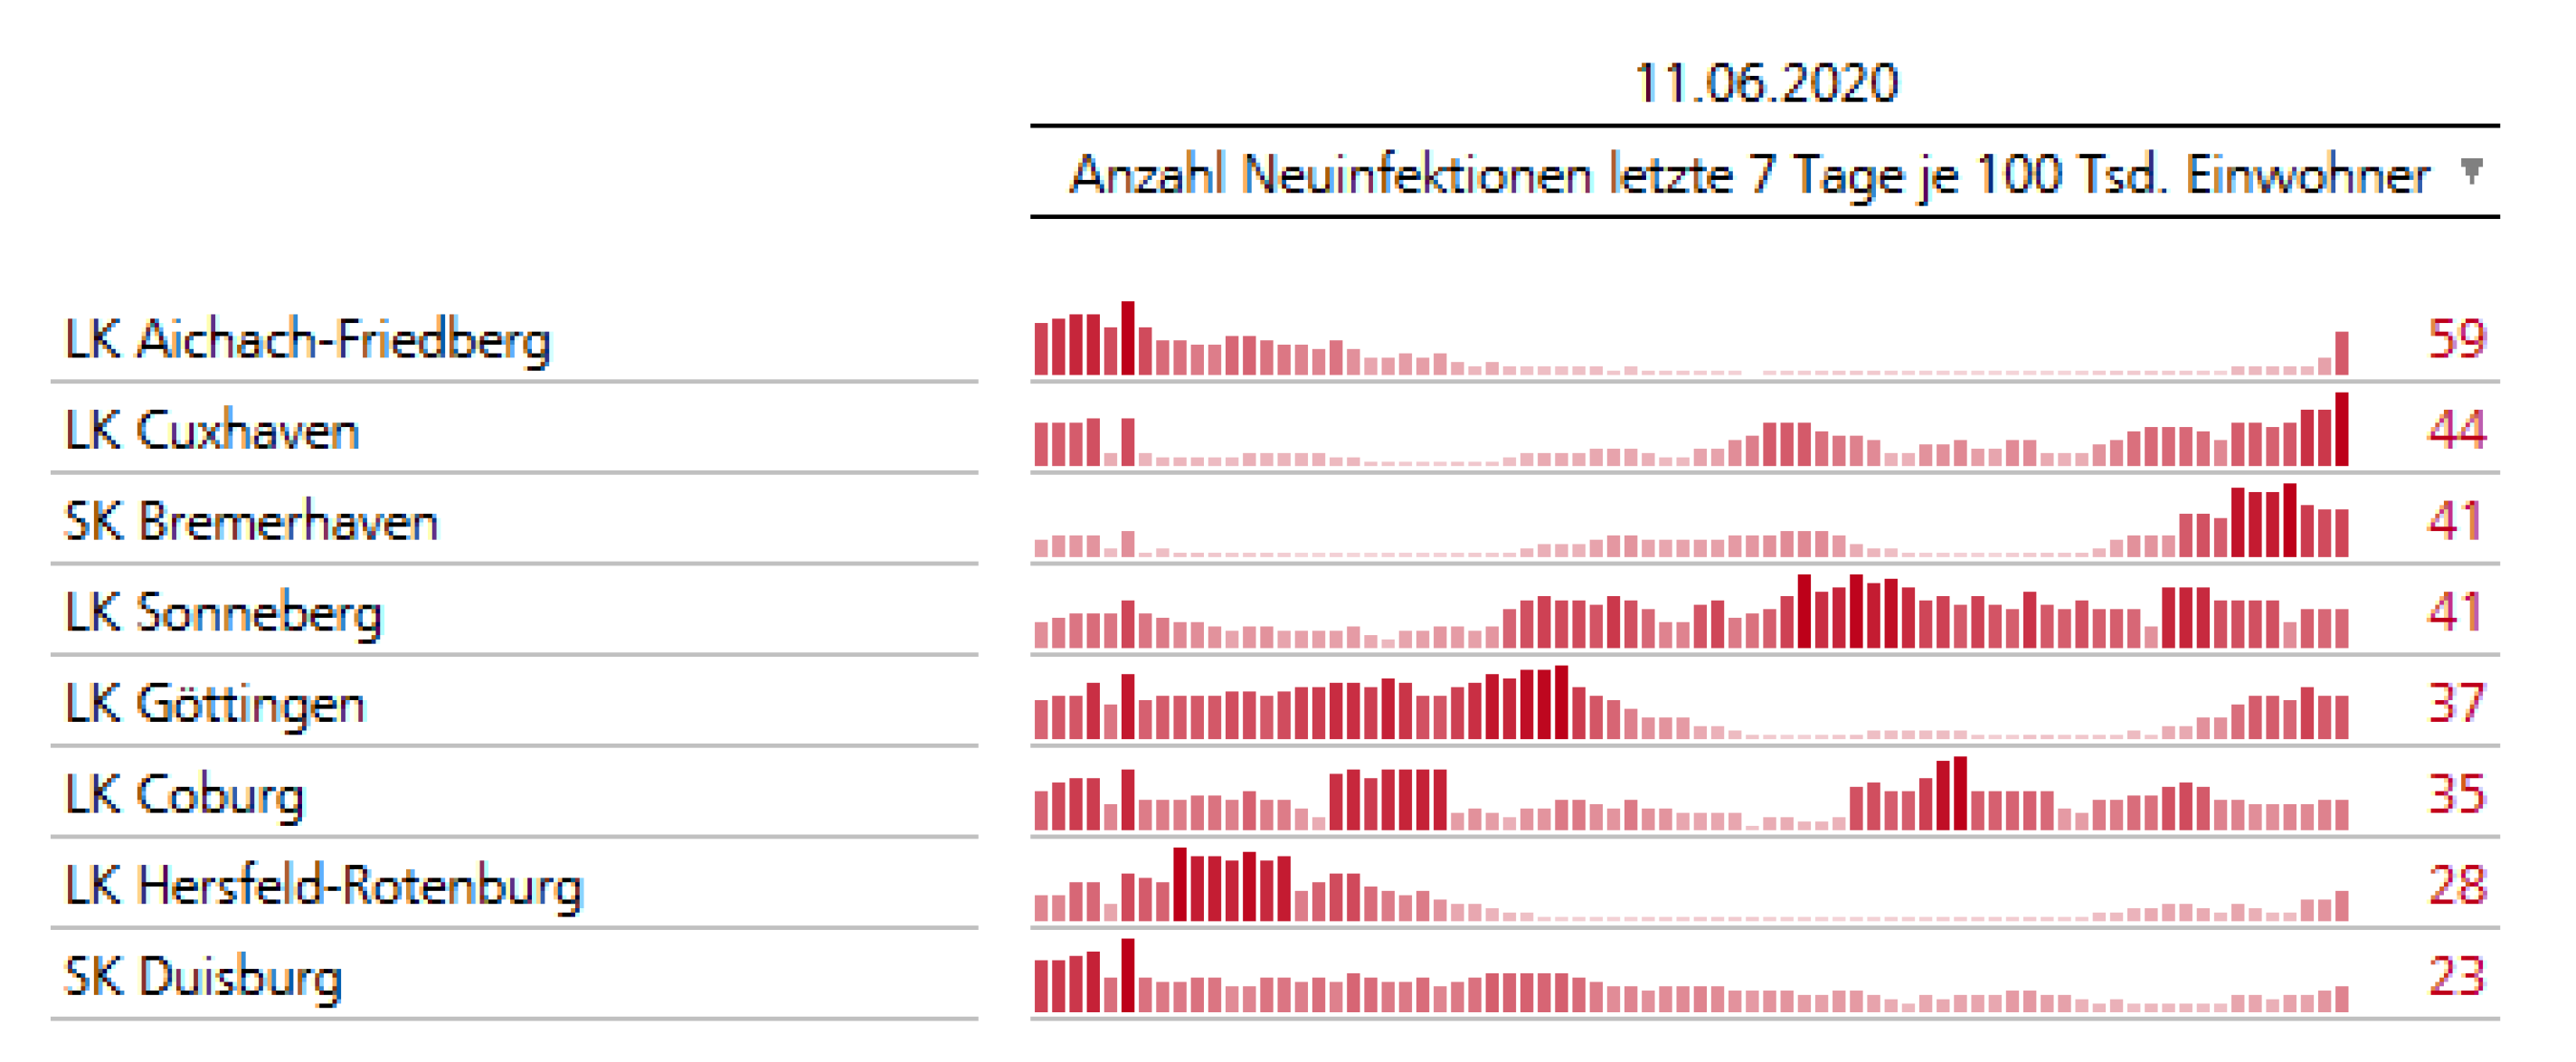
In March 2020, Germany had introduced consistent measures to combat COVID-19 that were implemented nationwide. Over time, it became clear that the spread of infection is mainly concentrated in local hotspots, without it being possible to predict such locations precisely. Therefore, on 6 May 2020 policy makers agreed to respond to regional dynamics of new infections on a local basis, using the NUTS 3 level administrative units as the spatial reference. It was decided that in districts or urban municipalities, the German NUTS 3 level units (Kreise), with a cumulative rate of more than 50 new cases of infection per 100,000 inhabitants within the previous seven days, restrictions adapted to the local situation will immediately be implemented [26].
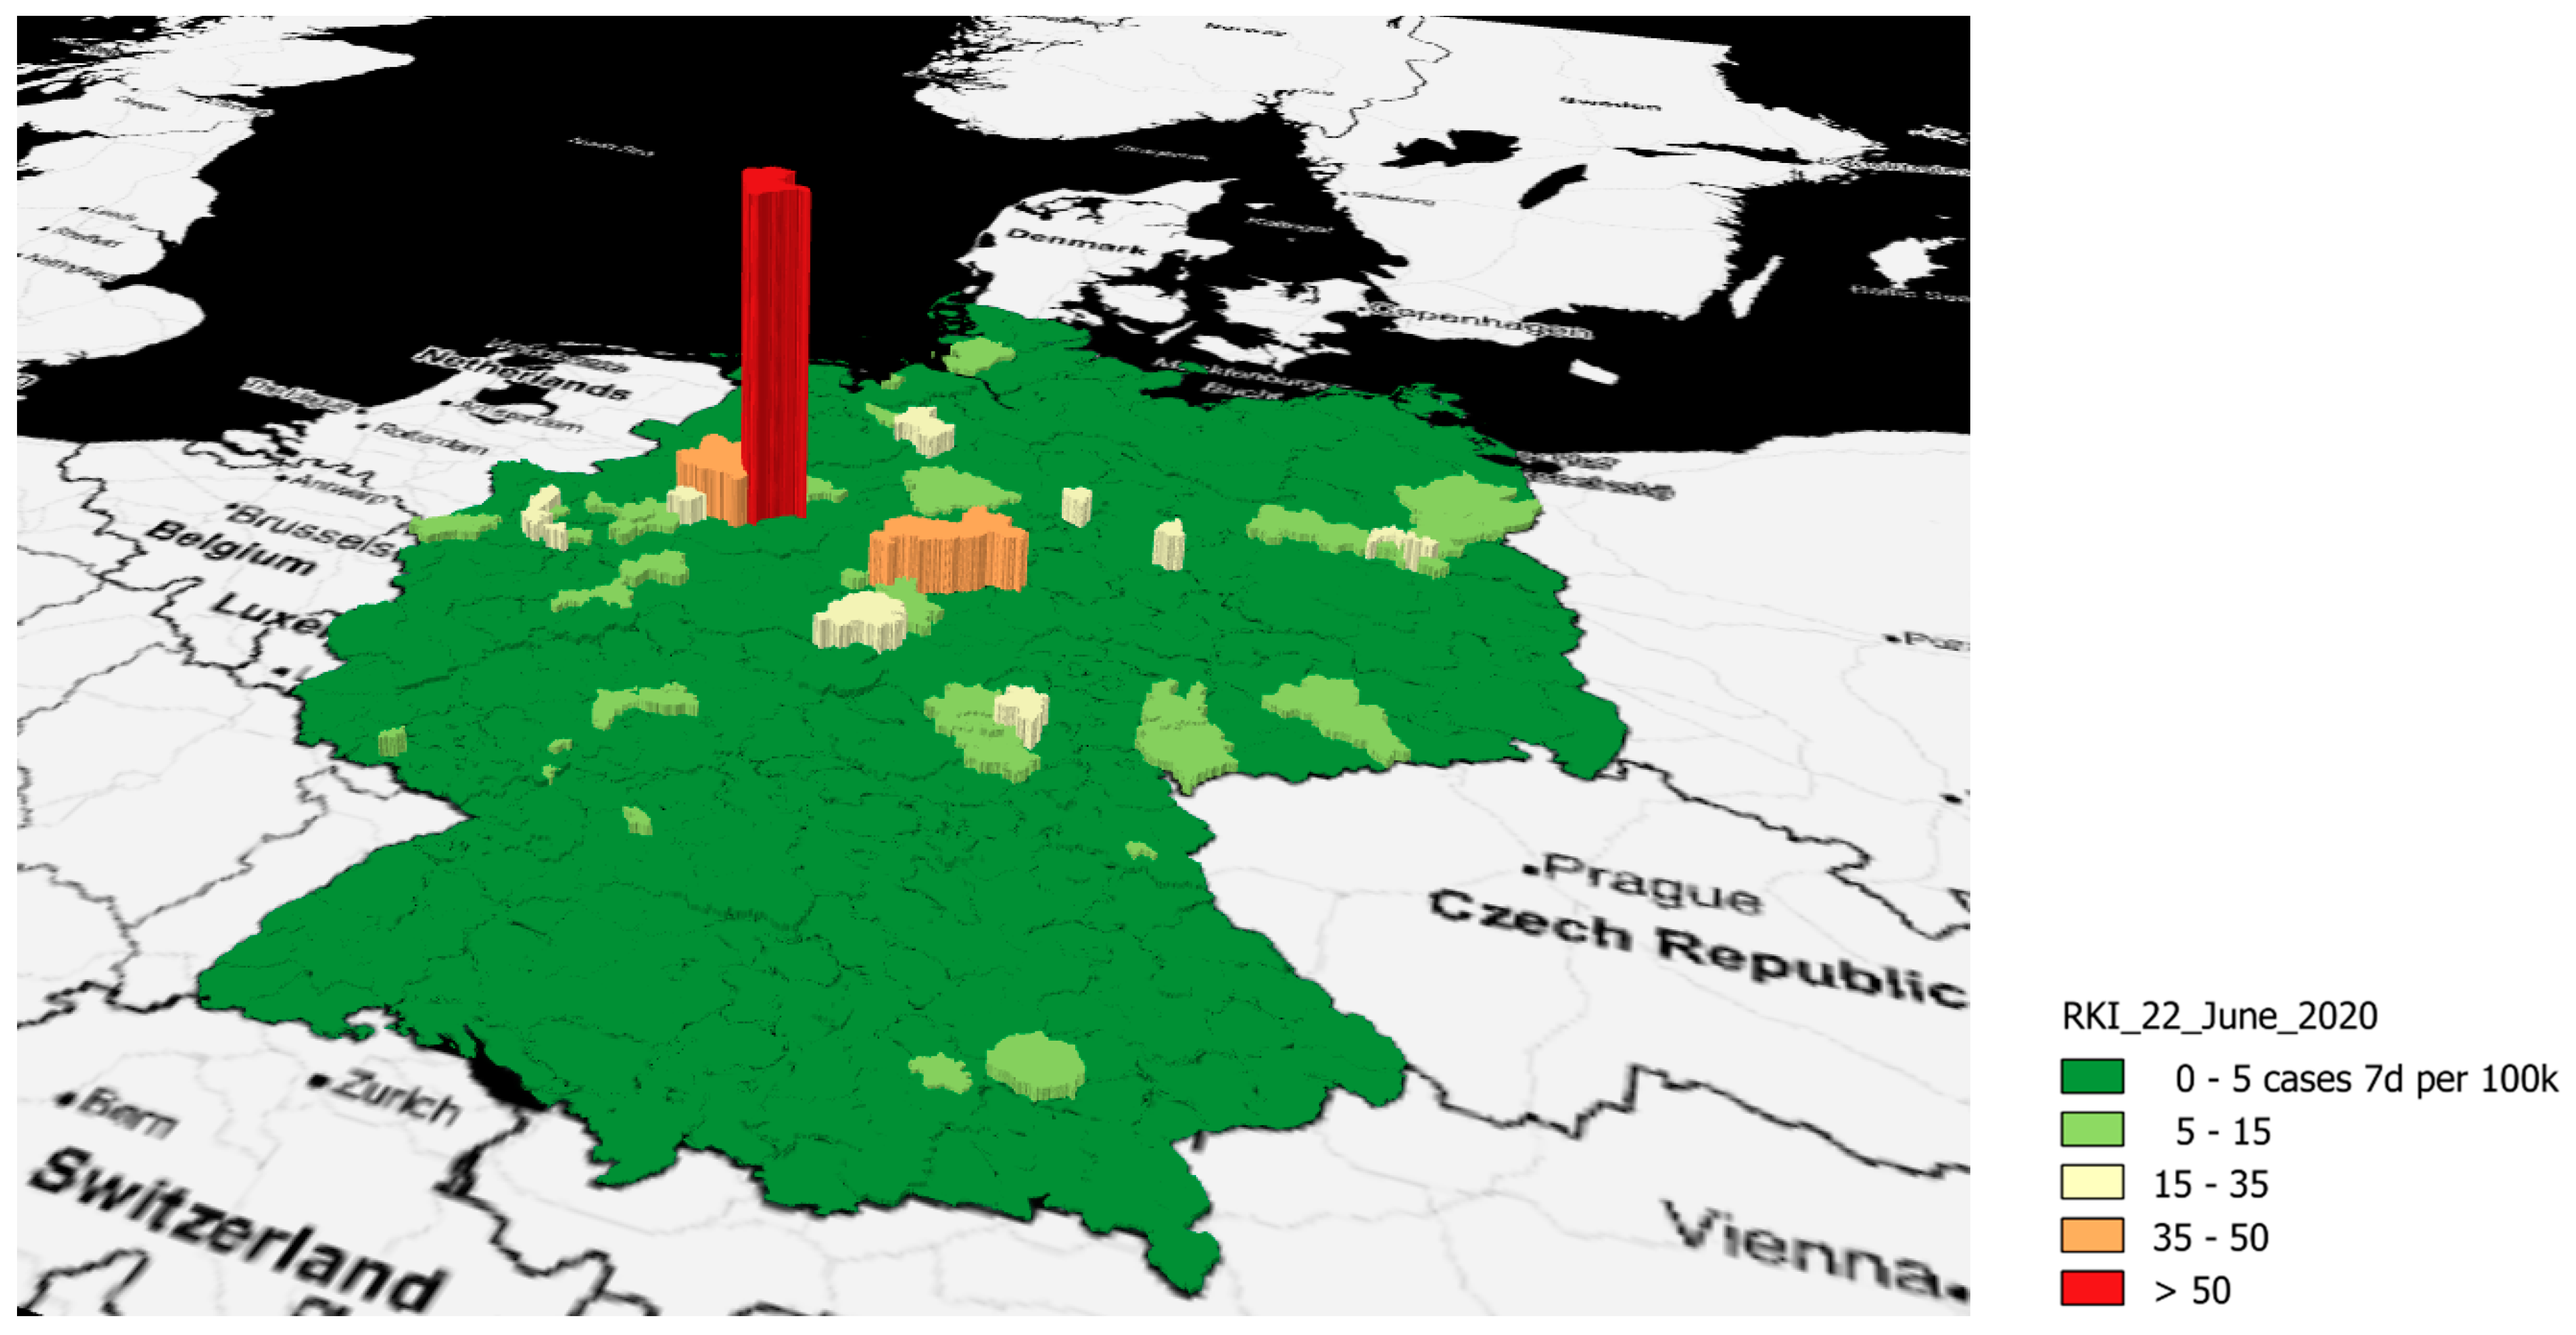
Figure 6 shows the temporal dynamics of infections over time including the numbers as of 12 June 2020, with one NUTS 3 unit surpassing the intervention threshold of 50 infections per 100,000 inhabitants within the previous seven days (LK Aichach-Friedberg, 59 cases).
The Robert Koch Institute, Germany’s public health institute, collects data on, among others, infectious diseases; it communicates information by a COVID-109 specific dashboard and offers the underlying data to the public on a daily updated basis. The data can be downloaded in different formats. Retrieving the data via an ESRI ArcGIS Feature Service is a very versatile way to get direct access to the attributes and geometries of the layers. Geospatial data retrieved via a Web Feature Server make it possible to use the complete set of GIS tools for comprehensive spatiotemporal analyses. For example, the period of time and further spread of local outbreaks can be tracked. At the same time, using such spatially aggregated data preserves data protection and data privacy.
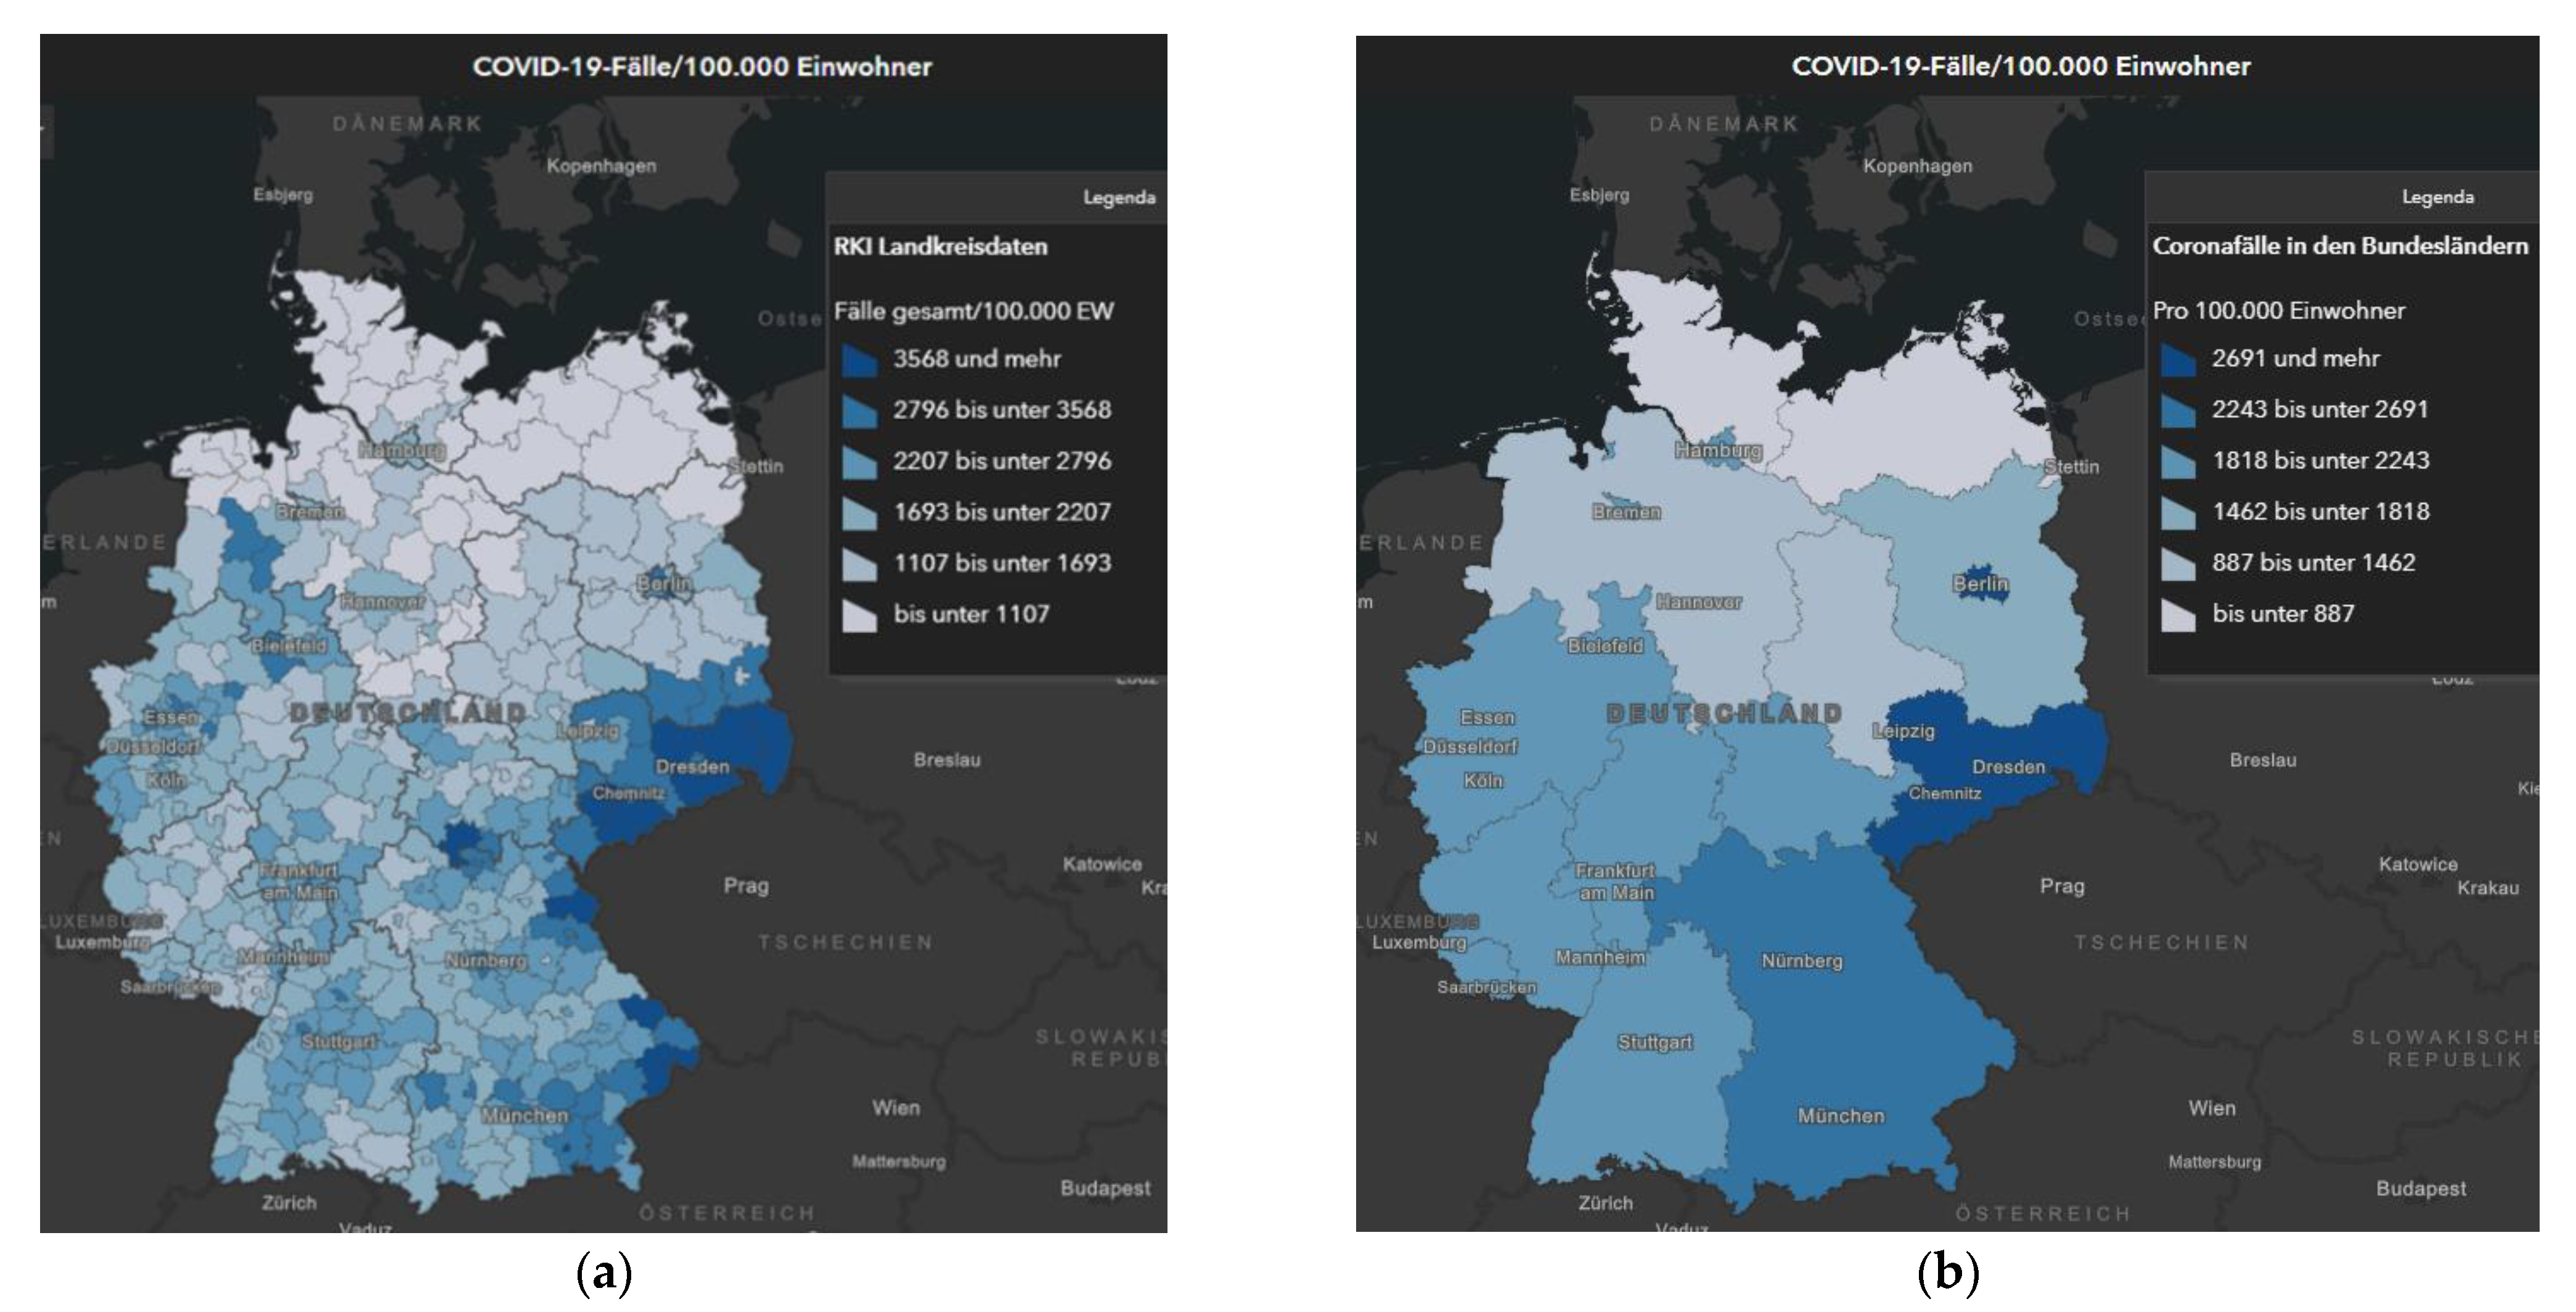
Figure 7a,b shows the effect of using different NUTS levels for visualizing the spatial distribution of the number of cases. The more detailed NUTS 3 level (left map) clearly shows local hotspots, whereas these largely disappear at more aggregated level (right map). Figure 8 visualizes a local outbreak in 3D way.
3. Challenges of COVID-19 Data Provision
3.1. European Level
Challenges regarding the collection of reliable data about COVID-19 cases are manifold. The Washington Post expresses the facts in this perfect, concise statement: “Case counts are consistently inconsistent. Reporting practices differ from country to country, state to state, even county to county.” [30].
ECDC, the European Centre for Disease Prevention and Control, is an EU agency aiming to strengthen Europe’s response to infectious diseases [31]. The scope of its activities covers, but is not limited to, surveillance, epidemic intelligence, response, preparedness, public health training, and health communication. ECDC operates its own dashboard on COVID-19 cases [12]. The main indicators presented are the 14-day reported rate of new COVID-19 cases and the 14-day death rate for Europe at the aggregation level of NUTS 1 and NUTS 2 geographical units.
The presented data are collected from different sources, are used as they are, and depend on local testing strategy, laboratory capacity, and effectiveness of surveillance systems. ECDC therefore recommends that the information be interpreted with caution, and preferably used only in combination with other factors, such as testing policy (number of tests performed, test positivity rate), excess mortality rates, rates of hospital and Intensive Care Unit ICU admissions.
3.2. Data Shortcuts and Challenges
A comprehensive review of the existing data problems is beyond the scope of this article. For illustration purposes, however, some relevant exemplary problems are listed:
- The quest for reliable data
The number of confirmed cases depends largely on the number of conducted diagnostic tests: the more laboratory tests are conducted; the more positive cases are discovered. A lack of test material or testing capacity hampered some countries to produce reliable data regarding the number of positive tested persons. As an alternative other data were used to monitor the progress of the disease, such as the number of hospitalized people.
- 2.
- The timeliness of reporting
There is no obvious reason why both the number of confirmed cases of disease and the number of disease-induced deaths should be lower on weekends than on working days. However, this is exactly what most country statistics display. It seems to be much more likely that a smaller number of cases are registered at weekends because fewer diagnostic tests are conducted at weekends, or because there are delays in reporting due to staff at health offices not being on the job, or for other reasons. The timeliness of the data therefore fluctuates without this being precisely documented in many cases.
- 3.
- The need for unambiguous definitions
Differences in the definition of diagnosed and reported cases, even changes in the definition occur. Two examples shall be given to illustrate this statement.
In Russia, official national COVID-19 mortality figures throughout 2020 were generated by reporting only deaths in which novel coronavirus infection was detected at autopsy. On 28 December 2020 Rosstat, Russia‘s statistics agency, reported that “the number of deaths from all causes recorded between January and November was 229,700 higher than in 2019”. After further investigation, the country’s deputy minister concluded that the number of deaths in Russia from the novel coronavirus is not 57,000, as the official figures claim, but more than 180,000 [32].
Additionally, in France the methodology of counting changed. In early April, France reported 17,827 additional cases and 532 plus 884 additional deaths from nursing homes, that had not previously been included in the official counts. Similarly, the daily figures for COVID-19 deaths in one country might, for example, only include those dying in hospitals, while other countries include deaths in nursing homes in their figures [33].
4. Discussion
4.1. The Role of Spatio-Temporal Data
Due to the epidemic and novice nature of the disease, no standardized approach and methodology to collect data existed, which hampered the provision of reliable information for decision-makers and the public. Rooted in established institutions, each Member States drafted their own procedures and policy regarding the testing strategy, and these might have been altered over the course of the epidemic. Many variables influenced the strategy, for example the availability or lack of testing material, the capacity of health care to treat patients, and political viewpoints. Due to a lack of reliable information, some countries initially ignored or underestimated the impact of the infectious disease, which led to a more severe outbreak. When the number of hospitalized patients spiked, the magnitude of the outbreak became clear. Data about successive outbreaks in autumn were more reliable.
Apart from variations in the type of data collected, also the purpose of geospatial data differed. On the one hand, geospatial information played an important role to inform the public about the severity of the outbreak, the spatial distribution and applicable measures. Most Member States have developed dashboards for this purpose, although it can be argued whether these are detailed enough to inform the public about local hotspots. On the other hand, geospatial information serves analytical purposes. Governments need reliable information to decide how to respond to the crises. Of course, with a new disease, much is unknown, and politicians have few resources to rely on, except for expert knowledge. However, over the course of the pandemic, Member States collected data to monitor progress and effectiveness of imposed measures, such as the closure of facilities and travel restrictions.
The purpose for which geospatial information is used, should relate to how the geospatial information is presented and which means are used. The spatio-temporal development of a disease can be visualized by using choropleth and diagram maps, line charts and temporal strips [34]. The dashboards studied use one or more of these techniques to present and visualize COVID-19 data. The level of detail provided should also be considered and related to the purpose. A comparison between countries or between continents requires a different data visualization than a detailed location-specific analysis for decision-makers.
4.2. Public Health Data and Spatial Data Infrastructures
The intertwined economies of Member States, due to the exchange of goods and people, require coordinated actions to limit further spreading of the disease. However, each country has its own authority and powers to take decisions. Consequently, countries developed their own strategy to counteract the outbreak despite a shared understanding of the potential impact on society and the need for coordination at the European level.
This study showed that each country made their own decisions regarding which data to collect, how to measure and monitor the progress of the outbreak, and how to display and disseminate the information to the public. Similarly, studies to analyze the spatial distribution can take a different perspective based on need and availability of data. In Italy for example, a study was conducted about the COVID-19 outbreak at the local level, in which health, geographical and environmental aspects were equally considered and integrated [35]. The spatial distribution of the COVID-19 outbreak was related to various variables such as land use, air quality, climate and weather, population, health and life expectancy. Needed high-resolution data for the analyses were collected from many different sources, each having its own standard and format. Finding, assessing, integrating, and aligning these data for the analyses proved to be difficult.
To overcome the unsatisfactory situation of lack of interoperability between data sets from different sources, standardization is needed to allow for seamless scaling of data along hierarchical governance levels. As discussed in Section 3, internationally harmonized standards for data collection and data provision of COVID-19 data are lacking. This limitation makes it difficult to compare data from different countries, and consequently, hampers the dissemination of reliable information needed for informed and joint political action at the at the European level.
Although long-established standards for a European Spatial Data Infrastructure are available, it does not seem to have benefitted the provision of a high-quality European dashboard capable of disseminating COVID-19 data from individual Member States in a standardized form. The European dashboard has been developed, but the data delivered by the individual Member States is not harmonized by using standards for data collection, definitions, semantics, and indicators used. An explanatory factor could be the novice nature of the disease in combination with the diverse institutional settings in each country. Most of the health institutions are not oriented towards using geospatial information. Nevertheless, the underpinning principles of the INSPIRE directive [36] do also apply to the management of spatio-temporal data in pandemics. The availability of a set of standards to enable sharing, re-using, and integrating data from multiple sources will benefit the spatio-temporal monitoring of an outbreak, both within countries and across borders.
5. Towards an Integrated System Building on INSPIRE
5.1. Integration of Public Health Data, Statistical Data and Basic Geospatial Data
To take full advantage of the wealth of information available in the various institutions it is necessary to develop and implement solutions for the integrated management of public health data, general statistical data and basic geospatial data. Since 2016, the global ‘integration of spatial, statistical and other related information’ has been explicitly on the agenda of the UN Committee of Experts on Global Spatial Data Management [37]. The COVID-19 epidemic demonstrates—in a perhaps unparalleled way—the need to provide globally integrated spatial, statistical and health-related information, adapted to the needs of very diverse users. A globally well-defined integrated statistical and geospatial framework could serve as an excellent basis for managing not only relatively low-dynamic statistical data, but also highly dynamic health data, such as those generated in the event of a global epidemic. In this way spatiality of statistical information [38] and dynamic health data could go hand in hand.
5.2. Conceptual Considerations for an Integrated Public Health Information System in the European Union
This section considers the way forward to provide health-related information for the European Union in an integrated statistical and geospatial framework. Existing frameworks for the European Union, the NUTS system for statistical information and the INSPIRE initiative for geospatial information, are taken as starting point. Interoperability between data sets from different sources is a precondition for seamless dissemination. It requires the harmonization or standardization of data sets, both technically and semantically.
The COVID-19 outbreak demonstrates once again that each EU Member State has its own authority and powers to take decisions, countries develop and follow their own strategy to counteract the outbreak. Successful implementation of an integrated and joint EU public health information system requires all public health and other stakeholders to participate in its development and adopt the specifications. In the INSPIRE development process Spatial Data Interest Communities (SDIC) and Legally Mandated Organizations (LMO) provide reference materials, participate in the user requirement and technical surveys, send experts to the Data Specification Drafting Team and Thematic Working Groups, comment on the drafts of the technical documents of the data specification development framework and so forth. To establish an integrated effective public health information system, similar efforts involving all responsible authorities, such as national public health organizations across the European Union, would be needed.
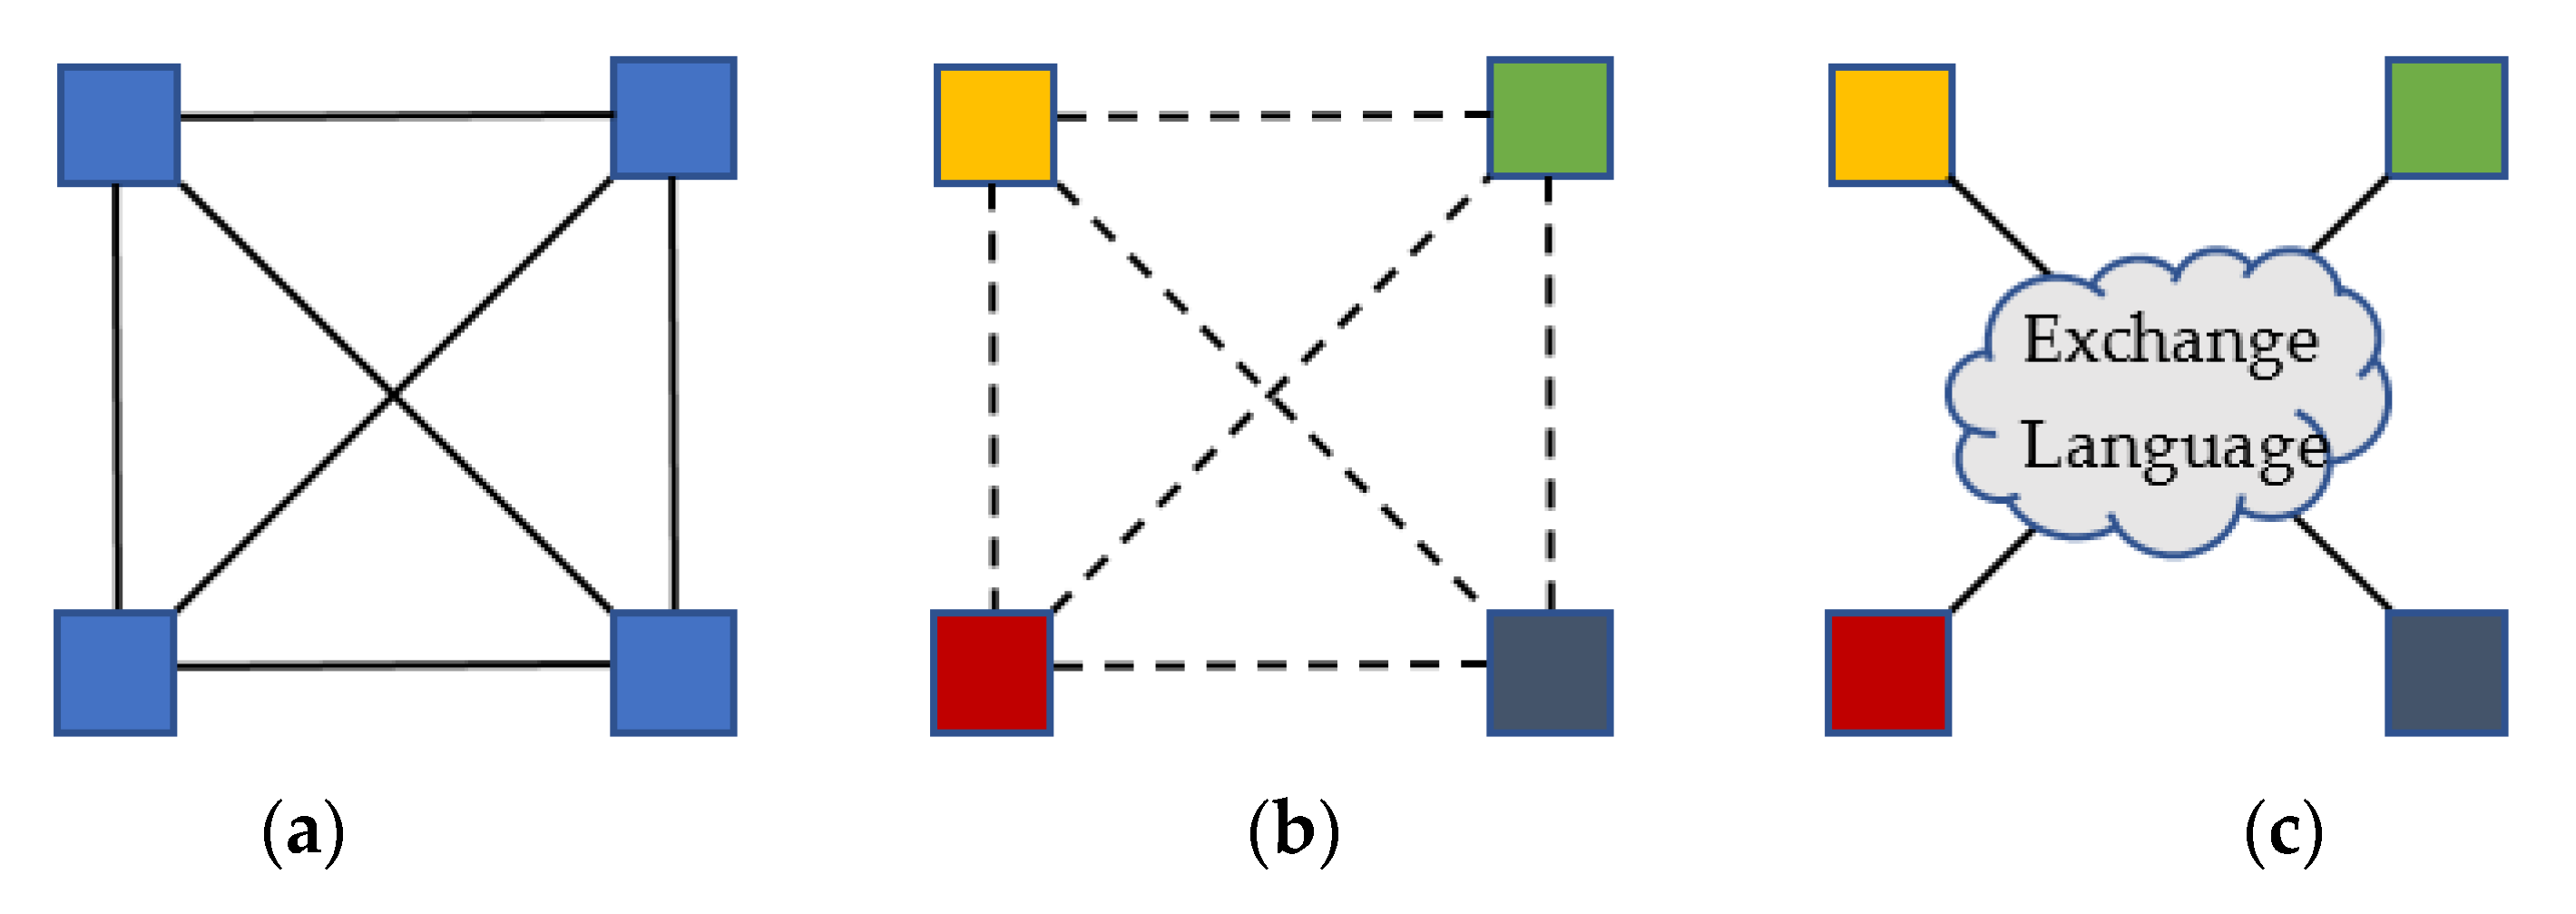
Apart from harmonizing the datasets it is also necessary to achieve interoperability between the systems. For interoperable computer systems, three basic architectures are available [39], see Figure 9a–c.
1. Standardization of systems (Figure 9a). All involved systems have the same internal architecture, sharing an equal information structure, information exchange is straight ahead, no interfaces are needed. This situation may occur occasionally in a highly standardized organization, but is, as outlined before, by no means given for the different systems of the EU Member States.
2. Bilateral exchange (Figure 9b). In a system environment with no information standardization, interfaces between each pair of systems need to transform information from one system to the other. In a network of 27 individual Member States with an equal number of different national systems, this type of architecture is highly undesirable, if not virtually impossible to implement and maintain. Upon the evaluation of dashboards, we found similarities of information structures. However, the national systems operate separate from each other, which is clearly visible from the metadata of the ECDC dashboard [12].
3. Standardization of the exchange language (Figure 9c). Once a common exchange standard is defined, systems can exchange information when the interface complies with this standard. This type architecture is commonly seen as the most applicable solution for integral information interoperability, and is also adopted for the INSPIRE initiative. New systems meeting the standard can be added without having to adapt the other systems. Likewise, systems can be removed.
As described earlier, the European Union’s INSPIRE initiative can significantly contribute to the development of an integrated information system for public health data dissemination for the European Union.
Some potential key contributions of INSPIRE for a potential EU public health data information system are:
1. INSPIRE specifications consistently build on international standards, particularly those of the World Wide Web Consortium (WWW) and the International Standardization Organization (ISO). Standardization is imperative to achieve interoperability of disparate datasets. Interoperability, in turn, is mandatory to ensure that data can be accessed consistently at different governance levels, allowing for seamless vertical and horizontal data integration, and by different users.
2. INSPIRE provides ready to use spatial components that offer key advantages for building a public health information system, most importantly the common spatial reference system (ETRS89) and the data theme Statistical Units (Annex III). Given that NUTS units in EU member states can, and in fact do change over time, INSPIRE can ensure that the spatial reference base for public health data will be kept up to date. This is vital for the evaluation of time series that span time periods in which the underlying spatial units have changed.
3. INSPIRE provides the tools needed to specify new application schemas. With these tools, INSPIRE supports its own extension while preserving the conformance of the framework. New themes, such as for public health data, can be specified in an IT-consistent manner. New data can then benefit from the entire wealth of information already contained in INSPIRE, by integrated and meaningful visualization and analysis.
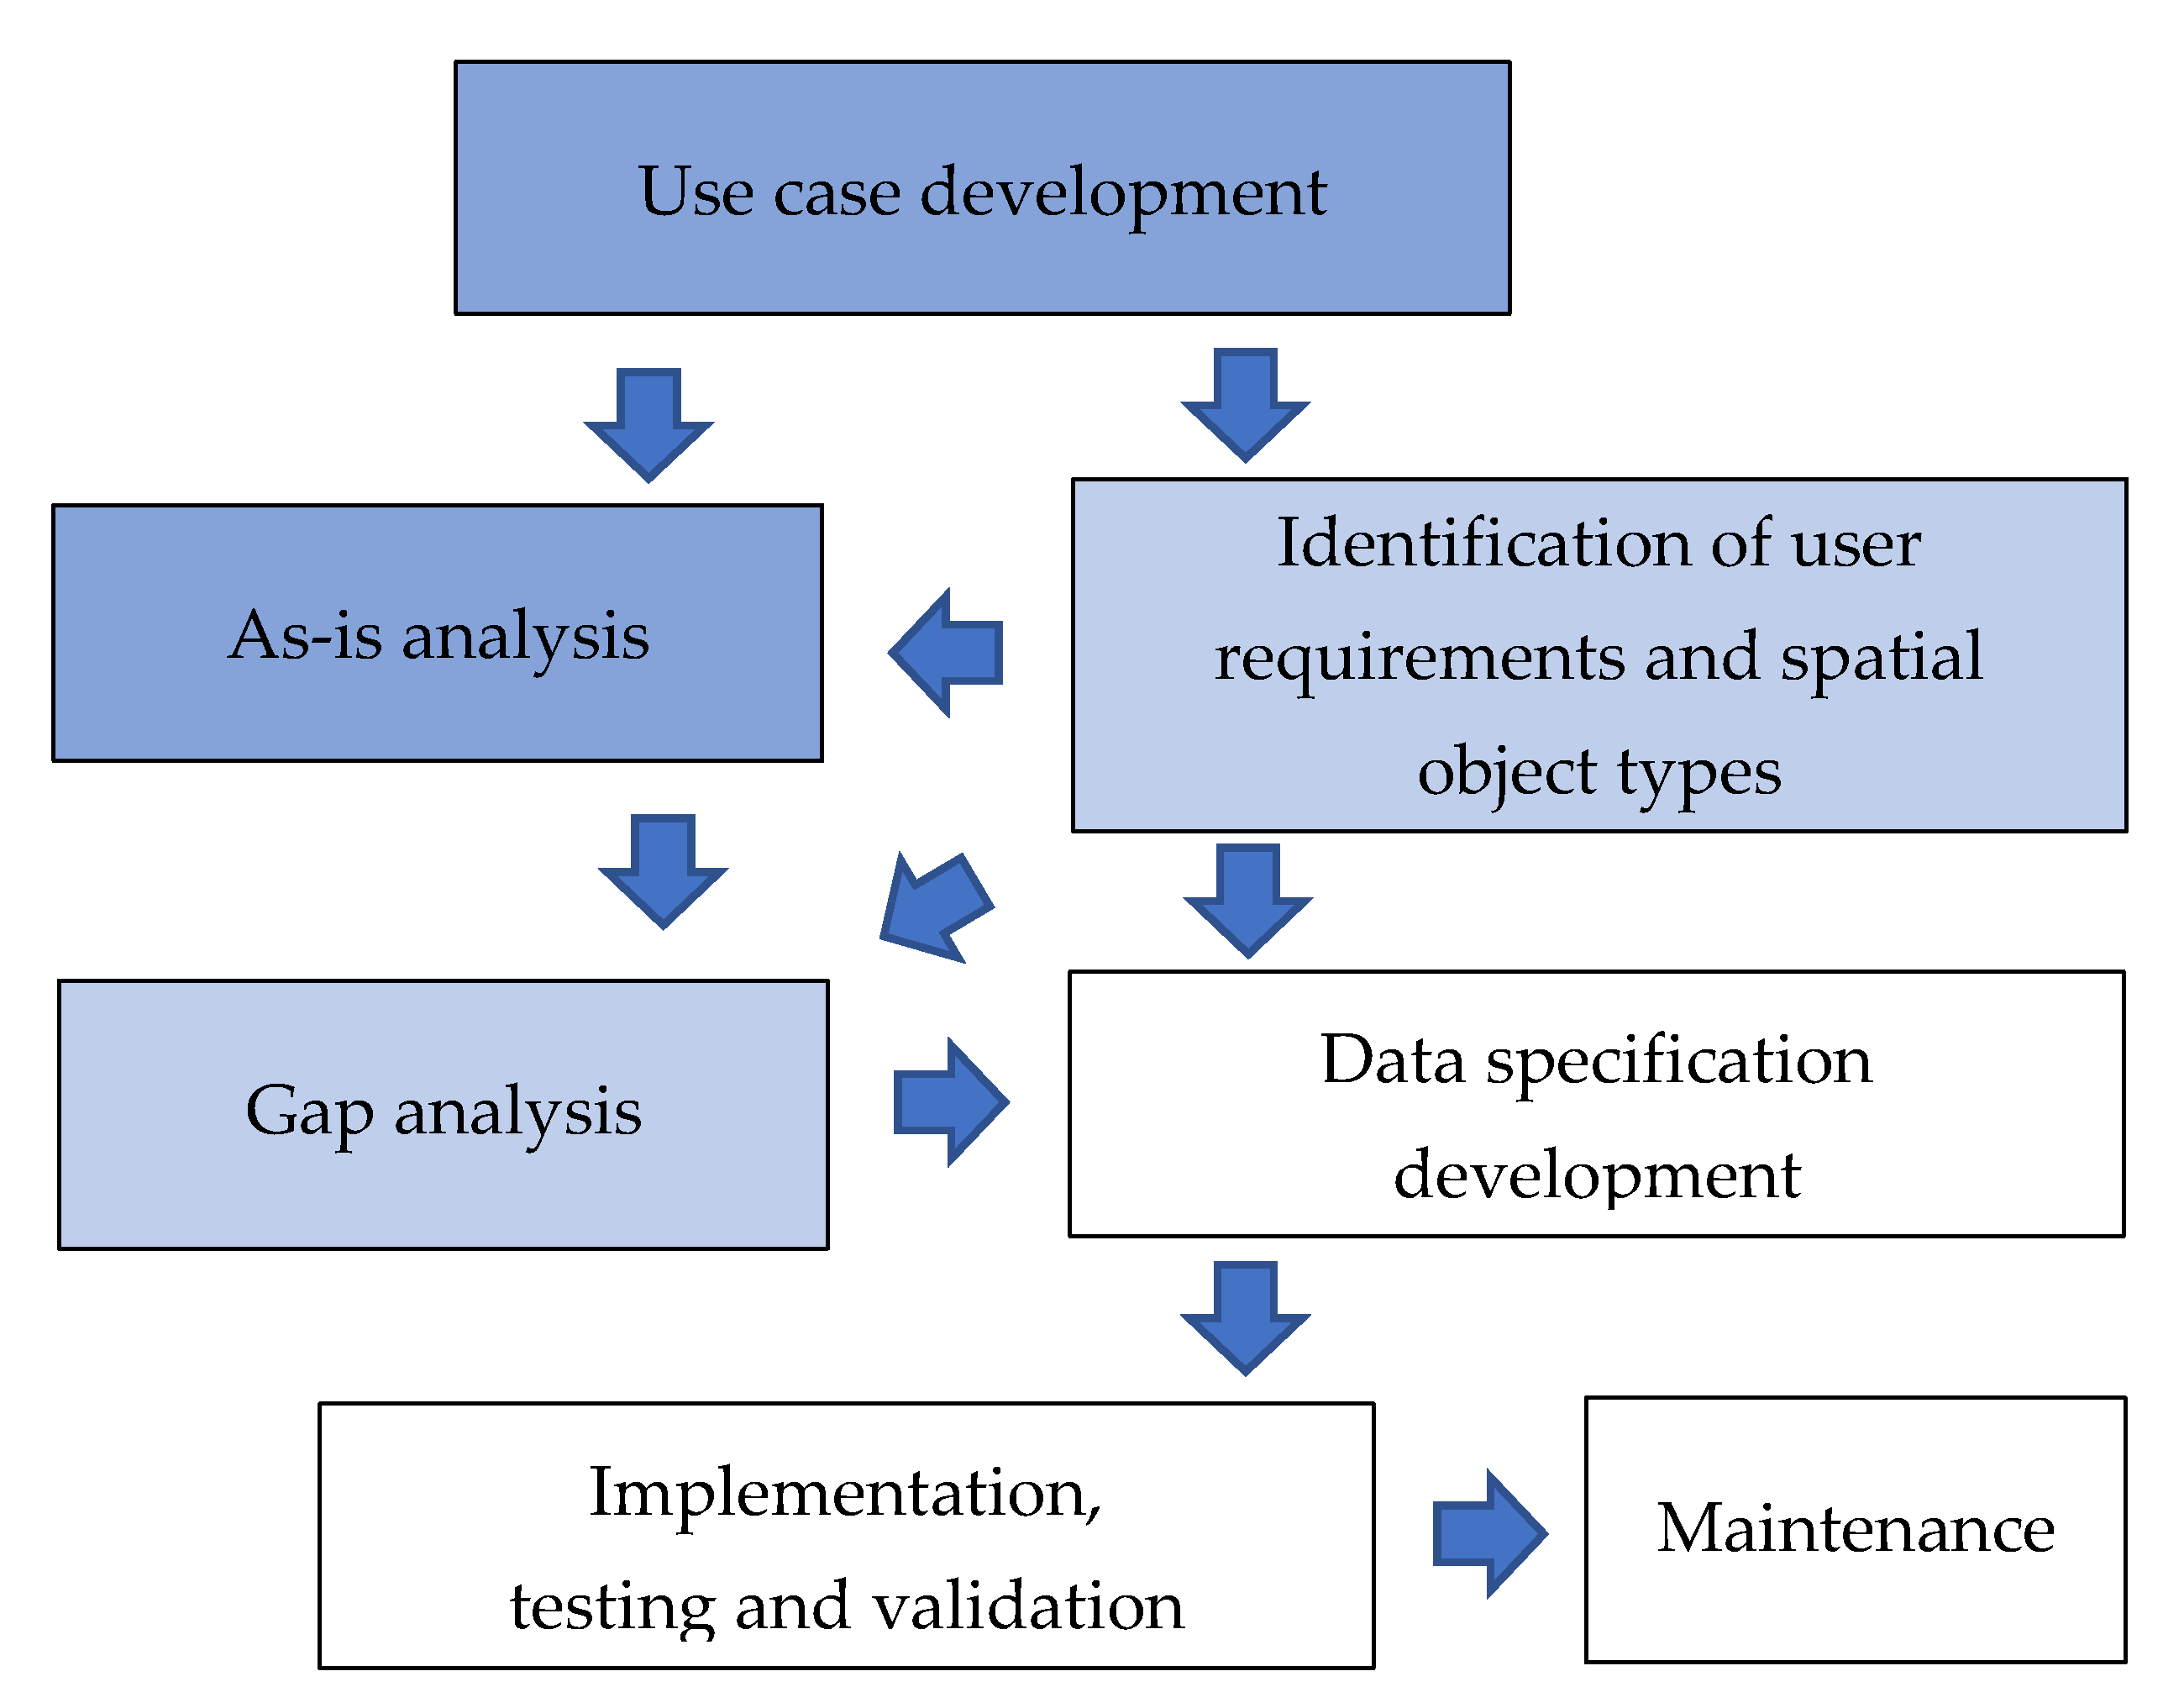
INSPIRE provides many tools for the conceptual work of consistent data specification, including the INSPIRE Generic Conceptual Model, within which new application schemas can be developed [40]. The following sections describe the required process steps in more detail (see Figure 10).
Use-case development. The existing COVID-19 dashboards of the 27 EU Member States can be regarded as use cases.
As-is analysis. As a starting point for further as-is analysis, the multicriteria evaluation of the existing dashboards presented in this paper can be used.
Identification of user requirements and spatial object types. Our analysis shows that the national dashboards are similar in terms of spatial object types and the presented information. These findings can be interpreted as an indicator for an already existing identification of user requirements. However, this would have to be verified by a more extended analysis before further steps can be taken.
Gap analysis. In our discussion, we address several identified gaps. Our findings could be used as a starting point for further in-depth gap analysis.
Data specification development. INSPIRE uses a model-driven architecture approach to achieve interoperability between the involved computer systems (see Figure 9, Exchange language). The new conceptual model would have to be described in Unified Modeling Language UML, typically in a UML class diagram, in this case by extending existing classes and adding new classes from the public health sector.
Implementation, testing and validation. The conceptual model shall be transformed into an application schema definition XSD, written in Extensible Markup Language XML or, to be more INSPIRE specific, in Geography Markup Language GML. The application schema must be validated against the generic requirements for a standard-compliant GML Application Schema. Further testing and validation steps are required, representative data sets must be matched and integrated with the new INSPIRE extension model, and the implementation must be tested against the data specification.
Maintenance. As with any computer system, maintenance is critical to preserve its interoperability and usability. Updates of various kinds must be observed and implemented, and new requirements must be integrated.
6. Conclusions
A pandemic requires a coordinated response at all governance levels. An infectious disease spreads over space and time at different speeds and can cause local outbreaks. A new disease calls for new insights, which must be gained through synoptic observations from different perspectives, medical, social, and economic. Spatio-temporal analysis can help to gain such new insights by relating disease-related data, such as case numbers, hospital occupations, fatality rates, etc. which evolve over time, to statistical indicators and to the locations to which they refer.
To utilize the full potential of spatio-temporal information systems, both the characteristics of the data they contain, and the underlying spatial reference units must be clearly and consistently defined. Such high-quality and authoritative information can help decision-makers to intervene at the right time and at the right place, rather than relying on general figures. More than that, a quality controlled spatiotemporal database can support post-pandemic analysis in many different areas of interest.
Much groundwork has already been done in the domain of spatial data infrastructures, both at national and supranational level. At this stage, committees and working groups are concentrating on the development of solutions for the integration of statistical information into such infrastructures, which will then be implemented by the individual countries.
The pandemic demonstrates the urgent need for an integrated spatial and statistical information system at the global level, but also at the country level and beyond. This paper showed how various countries implemented a system at the national level, which led to a range of diverse solutions, interfaces, and management information. This pluralism in national solutions was integrated at the European level into a data platform based on the input from individual member states and their systems. After some initial hick-ups, the information was used to discuss interventions at the European level and feed these back into national actions, for example regarding cross-border travel regulations between countries. However, the potential of an integrated system at the country level and the European level is not fully taken advantage of yet due to mentioned barriers. Once the systems at the country level have matured and aligned, it will leverage the benefits for both government and societal resilience at the country level and at European level.
An integrated system providing basic geospatial data, statistical data, and public health data in one and the same framework would make it possible to retrieve georeferenced information in near real time at all levels—global, supranational, national and local—in a timely and user-oriented manner. However, it remains to be investigated to what extent and how the organizational, technical, and legal challenges of such an initiative can be overcome.
Author Contributions
Conceptualization, Hartmut Müller and Marije Louwsma; methodology, Hartmut Müller and Marije Louwsma; formal analysis, Hartmut Müller and Marije Louwsma; investigation, Hartmut Müller and Marije Louwsma; resources, Hartmut Müller and Marije Louwsma; writing—original draft preparation, Hartmut Müller and Marije Louwsma; writing—review and editing, Hartmut Müller and Marije Louwsma Both authors have read and agreed to the published version of the manuscript.
Funding
This research received no external funding.
Informed Consent Statement
Not applicable.
Data Availability Statement
Data sharing not applicable. No new data were created or analyzed in this study. Data sharing is not applicable to this article.
Acknowledgments
The authors thank the editor of the International Journal of Geo-Information and the anonymous reviewers for their valuable comments.
Conflicts of Interest
The authors declare no conflict of interest.
References
- WHO World Health Organization. Coronavirus Disease (COVID-2019) Situation Reports. 2020. Available online: https://www.who.int (accessed on 15 June 2020).
- Hale, T.; Angrist, N.; Cameron-Blake, E.; Hallas, L.; Kira, B.; Majumdar, S.; Petherick, A.; Phillips, T.; Tatlow, H.; Webster, S. Oxford COVID-19 Government Response Tracker; Blavatnik School of Government: Oxford, UK, 2020. [Google Scholar]
- UN-GGIM: COVID-19: Ready to Respond. The Role of the Geospatial Community in Responding to COVID-19. White Paper. 2020. Available online: https://ggim.un.org/meetings/GGIM-committee/10th-Session/documents/Covid-19_Ready-to-Respond.pdf (accessed on 7 January 2021).
- European Union. Member States of the European Union. 2020. Available online: https://europa.eu/european-union/about-eu/countries_en (accessed on 29 December 2020).
- Verhagen, M.D.; Brazel, D.M.; Dowd, J.B.; Kashnitzky, I.; Mills, M.C. Forecasting spatial, socioeconomic and demographic variation in COVID-19 health care demand in England and Wales. BMC Med. 2020, 18, 203. [Google Scholar] [CrossRef] [PubMed]
- Balcan, D.; Colizza, V.; Goncalves, B.; Hu, H.; Ramasco, J.J.; Vespignani, A. Multiscale Mobility Networks and the Spatial spreading of infectious diseases. Proc. Natl. Acad. Sci. USA 2009, 106, 21484–21489. [Google Scholar] [CrossRef] [PubMed] [Green Version]
- Backer, J.A.; Klinkenberg, D.; Wallinga, J. Incubation period of 2019 novel coronavirus (2019-nCoV) infections among travellers from Wuhan, China, 20–28 January 2020. Eurosurveillance 2020, 25, 2000062. Available online: https://www.eurosurveillance.org/content/10.2807/1560-7917.ES.2020.25.5.2000062#html_fulltext (accessed on 7 January 2021). [CrossRef] [PubMed] [Green Version]
- Yang, W.; Deng, M.; Li, C.; Huang, J. Spatio-Temporal Patterns of the 2019-nCoV Epidemic at the County Level in Hubei Province, China. Int. J. Environ. Res. Public Health 2020, 17, 2563. [Google Scholar] [CrossRef] [PubMed] [Green Version]
- Giuliani, D.; Dickson, M.M.; Espa, G.; Santi, F. Modelling and Predicting the Spatio-Temporal Spread of Coronavirus Disease 2019 (COVID-19) in Italy (3/20/2020). 2020. Available online: https://ssrn.com/abstract=3559569 (accessed on 7 January 2021). [CrossRef] [Green Version]
- Kraak, M.J.; Ormeling, F. Cartography: Visualization of Geospatial Data; CRC Press: Boca Raton, FL, USA, 2020. [Google Scholar]
- Juergens, C. Trustworthy COVID-19 Mapping: Geo-spatial Data Literacy Aspects of Choropleth Maps. KN-J. Cartogr. Geogr. Inf. 2020, 70, 155–161. [Google Scholar] [CrossRef] [PubMed]
- European Centre for Disease Prevention and Control. 2020. Available online: https://qap.ecdc.europa.eu/public/extensions/COVID-19/COVID-19.html (accessed on 29 December 2020).
- Goovaerts, P. Geostatistical Analysis of Health Data: State-of-the-Art and Perspectives. In Geoenv VI–Geostatistics for Environmental Applications; Soares, A., Pereira, M.J., Dimitrakopoulos, R., Eds.; Springer Science+Business Media B.V.: Luxembourg, 2008; pp. 3–22. [Google Scholar] [CrossRef]
- UN Economic and Social Council: Strengthening of Geospatial Information Management, E/C.20/2020/23/Add.1. 2020. Available online: https://ggim.un.org/meetings/GGIM-committee/10th-Session/documents/E-C.20-2020-23-Add_1-Strengthening-Geospatial-Information-3Aug2020.pdf (accessed on 9 January 2021).
- European Commission. 2021. Available online: https://inspire.ec.europa.eu/inspire-principles/9 (accessed on 5 January 2021).
- EUROSTAT. Regions in the European Union, 2018 ed.; Nomenclature of Territorial Units for Statistics—NUTS 2016/EU-28; Publications Office of the European Union: Luxembourg, 2018. [Google Scholar] [CrossRef]
- Wexler, S.; Shaffer, J.; Cotgreave, A. The big book of dashboards: Visualizing your data using real-world business scenarios; John Wiley & Sons: Hoboken, NJ, USA, 2017. [Google Scholar]
- Sarikaya, A.; Correll, M.; Bartram, L.; Tory, M.; Fisher, D. What do we talk about when we talk about dashboards? IEEE Trans. Vis. Comput. Graph. 2018, 25, 682–692. [Google Scholar] [CrossRef] [PubMed]
- Carver, S.J. Integrating multi-criteria evaluation with geographical information systems. Int. J. Geogr. Inf. Syst. 1991, 5, 321–339. [Google Scholar] [CrossRef] [Green Version]
- French Government. Vigilance Map for France on 9 June 2020. 2020. Available online: https://www.gouvernement.fr/info-coronavirus/carte-et-donnees#activite-epidemique (accessed on 8 September 2020).
- RTL Nieuws. 2020. Available online: https://www.rtlnieuws.nl/nieuws/nederland/artikel/5128431/corona-gemeente-nederland-verspreiding-wanneer-haard-besmettingen (accessed on 15 June 2020).
- Ministry of Health, Welfare and Sport. 2020. Available online: https://coronadashboard.government.nl/over (accessed on 7 January 2021).
- Rijksinstituut voor Volksgezondheid en Milieu. Number of Hospitalized People and COVID-19 Cases for the Period 18–31 March 2020 per 100.000 Inhabitants per Municipality. 2020. Available online: https://www.rivm.nl/coronavirus-covid-19/actueel (accessed on 8 September 2020).
- Ministry of Health, Welfare and Sport. COVID-19 dashboard Netherlands. 2020. Available online: https://coronadashboard.rijksoverheid.nl/landelijk/ziekenhuis-opnames (accessed on 29 December 2020).
- Ministry of Health, Welfare and Sport. COVID-19 dashboard Netherlands. 2020. Available online: https://coronadashboard.rijksoverheid.nl/landelijk/sterfte (accessed on 29 December 2020).
- German Federal Government. Press Release Number151/20 of 6 May 2020. 2020. Available online: https://www.bundesregierung.de/resource/blob/973812/1751456/c197062365f7e60780e9039dc4e336ee/2020-05-06-beschluss-bund-laender-eng-data.pdf?download=1 (accessed on 15 June 2020).
- Bissantz Business Intelligence. Dynamics of Infections per 100,000 Inhabitants in Germany at the NUTS 3 Level. 2020. Available online: https://data.bissantz.de/Session.aspx?application=2000#s-237 (accessed on 13 June 2020).
- Robert Koch-Institut (RKI). COVID-19 Dashboard Germany. 2021. Available online: https://experience.arcgis.com/experience/478220a4c454480e823b17327b2bf1d4/page/page_1/ (accessed on 4 January 2021).
- Robert Koch-Institut (RKI), dl-de/by-2-0, Map tiles by Stamen Design, under CC BY 3.0. Data by OpenStreetMap, under CC BY SA. Available online: https://www.rki.de (accessed on 13 March 2021).
- The Washington Post: Millions Track the Pandemic on Johns Hopkins’s Dashboard. Those Who Built It Say Some Miss the Real Story, by Kyle Swenson, 29 June 2020 at 9:50 p.m. GMT+2. 2020. Available online: https://www.washingtonpost.com/local/johns-hopkins-tracker/2020/06/29/daea7eea-a03f-11ea-9590-1858a893bd59_story.html (accessed on 15 June 2020).
- European Centre for Disease Prevention and Control. 2021. Available online: https://www.ecdc.europa.eu/en/interpretation-covid-19-data (accessed on 6 January 2021).
- Rosstat. Covid-19: Russia admits to understating deaths by more than two thirds. BMJ 2020, 371. [Google Scholar] [CrossRef]
- Worldometer. COVID-19 Coronavirus Pandemic. 2020. Available online: https://www.worldometers.info/coronavirus/ (accessed on 6 January 2021).
- Mocnik, F.B.; Raposo, P.; Feringa, W.; Kraak, M.J.; Köbben, B. Epidemics and pandemics in maps–the case of COVID-19. J. Maps 2020, 16, 144–152. [Google Scholar] [CrossRef]
- Murgante, B.; Borruso, G.; Balletto, G.; Castiglia, P.; Dettori, M. Why Italy First? Health, Geographical and Planning Aspects of the COVID-19 Outbreak. Sustainability 2020, 12, 5064. [Google Scholar] [CrossRef]
- European Union (EU). Directive 2007/2/EC of the European Parliament and of the Council of 14 March 2007 establishing an Infrastructure for Spatial Information in the European Community (INSPIRE). OJ L 108, 25.4.2007, p. 1–14 (BG, ES, CS, DA, DE, ET, EL, EN, FR, IT, LV, LT, HU, MT, NL, PL, PT, RO, SK, SL, FI, SV) Special edition in Croatian: Chapter 13. Volume 30, pp. 270–283. Available online: https://eur-lex.europa.eu/legal-content/EN/ALL/?uri=CELEX:32007L0002 (accessed on 7 January 2021).
- UN-GGIM. UN Committee of Experts on Global Spatial Data Management, Sixth session New York. 2016. Available online: http://ggim.un.org/knowledgebase/Attachment1651.aspx?AttachmentType=1 (accessed on 16 June 2020).
- UN (United Nations) Economic Commission for Europe, Conference of European Statisticians. In-Depth Review of Developing Geospatial Information Services Based on Official Statistics. Meeting of the 2015/2016 Bureau, Luxembourg, 9–10 February 2016, ECE/CES/BUR/2016/FEB/2. Available online: https://www.unece.org/fileadmin/DAM/stats/documents/ece/ces/bur/2016/February/02-In-depth_review_on_developing_geospatial_information_final.pdf (accessed on 16 June 2020).
- Lasschuyt, E.; van Hekken, M. Information Interoperability and Information Standardisation for NATO C2—A Practical Approach. In RTO Meeting Proceedings 64, Information Management Challenges in Achieving Coalition Interoperability; North Atlantic Treaty Organization, Science and Technology Organization: Quebec, QC, Canada, 2001; ISBN 92-837-1078-9. [Google Scholar] [CrossRef]
- Tóth, K. Data Consistency and Multiple-Representation in the European Spatial Data Infrastructure. In Proceedings of the 10th ICA Workshop on Generalisation and Multiple Representation, Moscow, Russia, 2–3 August 2007; International Cartographic Association, Commission on Multiple-Representation and Generalisation; Joint Research Centre Publications Repository; pp. 1–8. Available online: http://publications.jrc.ec.europa.eu/repository/handle/JRC37760 (accessed on 19 February 2021).
- Tóth, K.; Portele, C.; Illert, M.; Lutz, M.; Nunes de Lima, V. A Conceptual Model for Developing Interoperability Specifications in Spatial Data Infrastructures; Publications Office of the European Union: Luxembourg, 2012; ISBN 978-92-79-22552-9. [Google Scholar] [CrossRef]
Figure 1.
European distribution of COVID-19 cases, 14-day notification rate per 100,000 population in week 5–051 (Source: European Centre for Disease Prevention and Control [12]), https://qap.ecdc.europa.eu/public/extensions/COVID-19/COVID-19.html (accessed on December 2020).
Figure 1.
European distribution of COVID-19 cases, 14-day notification rate per 100,000 population in week 5–051 (Source: European Centre for Disease Prevention and Control [12]), https://qap.ecdc.europa.eu/public/extensions/COVID-19/COVID-19.html (accessed on December 2020).

Figure 2.
Rating of the evaluated dashboards from EU Member States.

Figure 3.
Dashboard France—situation on 21 December 2020 [20], https://dashboard.covid19.data.gouv.fr/vue-d-ensemble?location=FRA.
Figure 3.
Dashboard France—situation on 21 December 2020 [20], https://dashboard.covid19.data.gouv.fr/vue-d-ensemble?location=FRA.

Figure 4.
Number of hospitalized people (a) and COVID-19 cases (b) for the period 18–31 March 2020 per 100,000 inhabitants per municipality [23].
Figure 4.
Number of hospitalized people (a) and COVID-19 cases (b) for the period 18–31 March 2020 per 100,000 inhabitants per municipality [23].

Figure 5.
(a) Dashboard Netherlands—number of positive cases per 100,000 inhabitants between 2 March–28 December 2020 [24]. (b) Dashboard Netherlands—number of deaths between 2 March–28 December 2020 [25].


Figure 6.
Dynamics of infections per 100,000 inhabitants in Germany at the Nomenclature of Territorial Units for Statistics (NUTS) 3 level [27].
Figure 6.
Dynamics of infections per 100,000 inhabitants in Germany at the Nomenclature of Territorial Units for Statistics (NUTS) 3 level [27].

Figure 7.
Numbers of detected COVID-19 cases per 100,000 inhabitants on 3 January 2021 at NUTS 3 level (a), and NUTS 2 level (b) [28].
Figure 7.
Numbers of detected COVID-19 cases per 100,000 inhabitants on 3 January 2021 at NUTS 3 level (a), and NUTS 2 level (b) [28].

Figure 8.
Visualization at NUTS 3 level of a major local COVID-19 outbreak in Germany, June 2020. (Source: own representation, data based on [29]).
Figure 8.
Visualization at NUTS 3 level of a major local COVID-19 outbreak in Germany, June 2020. (Source: own representation, data based on [29]).

Figure 9.
Basic architectures for information interoperability (adapted from [39]): systems of the same type (a), systems of different type, no information standardization (b), systems of different type, one common information standard (c).
Figure 9.
Basic architectures for information interoperability (adapted from [39]): systems of the same type (a), systems of different type, no information standardization (b), systems of different type, one common information standard (c).

Figure 10.
Process steps in the data specification cycle (adapted from [41]), text boxes in dark blue color highlight steps addressed in this paper, text boxes in light blue color highlight steps partly addressed in this paper, text boxes in white color highlight future steps.
Figure 10.
Process steps in the data specification cycle (adapted from [41]), text boxes in dark blue color highlight steps addressed in this paper, text boxes in light blue color highlight steps partly addressed in this paper, text boxes in white color highlight future steps.


Table 1.
Population size of the European Union’s administrative units [14].
Table 1.
Population size of the European Union’s administrative units [14].
| Level | Minimum Number of Inhabitants | Maximum Number of Inhabitants |
|---|---|---|
| NUTS 1 | 3 million | 7 million |
| NUTS 2 | 800.000 | 3 million |
| NUTS 3 | 150.000 | 800.000 |
Table 2.
Evaluation matrix for evaluation of dashboards.
| Criterion | Classification | Score | Weight |
|---|---|---|---|
| COVID-19 parameters | Number of cases (absolute/relative) Number of deaths (absolute/relative) Number of hospitalized people (absolute/relative) Number of positive test results compared to all conducted tests (relative) Reproduction number Other parameters | 1 = basic parameters available with limited variation in units 2 = some parameters available in various units 3 = fair number of parameters in various units 4 = extensive parameters in multiple units, going beyond the direct need | 2 |
| Map type | No map Choropleth map Size map Heat map Dot map Multivariate map | 1 = no map 2 = size map 3 = choropleth map 4 = multiple maps | 1 |
| Graph type | No graphs Bar graph Line chart Pie chart Histogram | 1 = no graphs 2 = few graphs 3 = some variety of graphs 4 = extensive variety of graphs | 1 |
| Metadata | No metadata/unknown Frequency updates Data source Data collection method Definition indicators | 1 = no metadata 2 = frequency update 3 = some metadata 4 = extensive metadata | 2 |
| Access to data | No access to raw data Pre-defined tables Downloadable data sets Feature and mapping services | 1 = no access 2 = table 3 = download service 4 = feature/mapping services | 2 |
Table 3.
Rating matrix for evaluation of dashboards.
| Rating | Description | Total Weighted Score |
|---|---|---|
| 0 | Not available/not found | NA |
| 1 | Marginal dashboard | 8–14 |
| 2 | Adequate dashboard | 15–20 |
| 3 | Good dashboard | 21–26 |
| 4 | Excellent dashboard | 27–32 |
Table 4.
Results multicriteria evaluation COVID-19 dashboards from EU Member States in February 2021.
Table 4.
Results multicriteria evaluation COVID-19 dashboards from EU Member States in February 2021.
Publisher’s Note: MDPI stays neutral with regard to jurisdictional claims in published maps and institutional affiliations. |
© 2021 by the authors. Licensee MDPI, Basel, Switzerland. This article is an open access article distributed under the terms and conditions of the Creative Commons Attribution (CC BY) license (http://creativecommons.org/licenses/by/4.0/).
Share and Cite
MDPI and ACS Style
Müller, H.; Louwsma, M. The Role of Spatio-Temporal Information to Govern the COVID-19 Pandemic: A European Perspective. ISPRS Int. J. Geo-Inf. 2021, 10, 166. https://0-doi-org.brum.beds.ac.uk/10.3390/ijgi10030166
AMA Style
Müller H, Louwsma M. The Role of Spatio-Temporal Information to Govern the COVID-19 Pandemic: A European Perspective. ISPRS International Journal of Geo-Information. 2021; 10(3):166. https://0-doi-org.brum.beds.ac.uk/10.3390/ijgi10030166
Chicago/Turabian StyleMüller, Hartmut, and Marije Louwsma. 2021. "The Role of Spatio-Temporal Information to Govern the COVID-19 Pandemic: A European Perspective" ISPRS International Journal of Geo-Information 10, no. 3: 166. https://0-doi-org.brum.beds.ac.uk/10.3390/ijgi10030166
Note that from the first issue of 2016, this journal uses article numbers instead of page numbers. See further details here.