Article

A Research on Landslides Automatic Extraction Model Based on the Improved Mask R-CNN

1
Aerospace Information Research Institute, Chinese Academy of Sciences (CAS), Beijing 100094, China
2
College of Resources and Environment, University of Chinese Academy of Sciences, Beijing, 100049, China
3
Sanya Institute of Remote Sensing, Sanya 572029, China
4
Research Institute of Petroleum Exploration & Development, PetroChina, Beijing 100094, China
*
Author to whom correspondence should be addressed.
ISPRS Int. J. Geo-Inf. 2021, 10(3), 168; https://0-doi-org.brum.beds.ac.uk/10.3390/ijgi10030168
Submission received: 12 January 2021 / Revised: 4 March 2021 / Accepted: 11 March 2021 / Published: 15 March 2021

Abstract

:
Landslides are the most common and destructive secondary geological hazards caused by earthquakes. It is difficult to extract landslides automatically based on remote sensing data, which is import for the scenario of disaster emergency rescue. The literature review showed that the current landslides extraction methods mostly depend on expert interpretation which was low automation and thus was unable to provide sufficient information for earthquake rescue in time. To solve the above problem, an end-to-end improved Mask R-CNN model was proposed. The main innovations of this paper were (1) replacing the feature extraction layer with an effective ResNeXt module to extract the landslides. (2) Increasing the bottom-up channel in the feature pyramid network to make full use of low-level positioning and high-level semantic information. (3) Adding edge losses to the loss function to improve the accuracy of the landslide boundary detection accuracy. At the end of this paper, Jiuzhaigou County, Sichuan Province, was used as the study area to evaluate the new model. Results showed that the new method had a precision of 95.8%, a recall of 93.1%, and an overall accuracy (OA) of 94.7%. Compared with the traditional Mask R-CNN model, they have been significantly improved by 13.9%, 13.4%, and 9.9%, respectively. It was proved that the new method was effective in the landslides automatic extraction.

1. Introduction

In China’s mainland, about 70% of the area is mountainous areas with complex topography and geological hazards. The losses caused by various geological hazards total hundreds of millions yuan every year [1,2]. For example, the 2008 Wenchuan earthquake, the 2010 Qinghai Yushu earthquake, the 2013 Sichuan Ya’an earthquake, and the 2017 Sichuan Jiuzhaigou earthquake have caused huge losses to the country. In these earthquakes, the losse of life and property caused by landslides were very serious.
Therefore, rapid acquisition of hazard information, such as the regional distributions, numbers, and scales of landslides immediately, is the key to hazard reduction and relief. However, the traditional landslide extraction methods are mostly based on field investigations. They are limited in survey scope, time-consuming, have a heavy workload, and low efficiency, and thus struggle to meet rescue departments’ needs in efficiency [3,4].
With the rapid development of remote sensing technology, it is widely used in hazard emergency and rescue due to its advantages of rapid, macro, all-time, and all-weather monitoring [5].Therefore, it is of great significance for initially grasping the hazard situation, formulating a reasonable rescue plan, and rationally settling the affected residents, to avoid the secondary disaster damages using remote sensing [6].
There are currently three main methods for landslides extraction based on remote sensing:
(1) Landslide identification methods based on visual interpretation.
Visual interpretation is the basic method to obtain landslide information using remote sensing imageries [7,8]. It is extremely widely used in high-precision remote sensing imagery information recognition. However, the time and results of interpretation are mostly dependent on the interpreter experience, and there are problems in this method, such as strong subjectivity, long time consumption, and low efficiency. It is difficult to meet the needs of emergency responses [9,10].
(2) Pixel-based landslide identification methods.
The pixel-based landslide identification methods have overcome the shortcomings of visual interpretation. These methods process the remote sensing imagery to obtain relevant information based on the pixel spectral characteristics, such as the maximum likelihood, support vector machine, and K-means clustering [11,12]. However, these methods do not sufficiently use the remote sensing information, which cause pixels to lose their correlation from each other to result in “salt and pepper” noises [13,14].
(3) Object-oriented landslides identification methods.
The essence of object-oriented remote sensing imagery classification methods is to use the primitives to classify remote sensing imageries. In the process of classification, features such as texture, spectrum, shape, and neighborhood are integrated to make the classification more reasonable [15,16]. The usual methods are mainly based on multi-scale imagery segmentation [17,18].
The object-oriented methods’ segmentation results depend on the choice of segmentation scales. It is difficult to find a suitable segmentation scale simultaneously, and it needs to be determined by trial and error [19]. Currently, segmentation algorithms cannot quickly process complex and large-scale remote sensing data, especially for high-resolution remote sensing data, leading to their low segmentation efficiency [20].
Landslide identification methods based on deep learning methods.
Deep learning methods have achieved advanced performance in computer vision, such as imagery segmentation [21,22,23], target detection [24], and imagery classification [25,26], and have provided effective frameworks for automatically extracting landslides.
Compared with traditional methods, deep learning methods can automatically learn features through convolution operations with the help of deep learning frameworks and replace manual features recognition with hierarchical feature extractions [27,28,29]. However, the methods based on Convolutional Neural Networks (CNN) designed for landslides extraction have only just begun. Yu Hong et al. [30] trained a simple convolutional neural network from the data sets and used a region-growing algorithm to extract the landslides. Ding Anzi et al. [31] used a CNN to extract imagery features after the disaster, and used change detection methods to extract the Shenzhen landslides in 2015. Omid Ghorbanzadeh et al. [32] analyzed the influence of the number and size of different convolution kernels on landslide extraction accuracy. In the above studies, a relatively basic network structure is adopted, which is composed of a series of convolutional layers, pooling layers, and fully connected layers. The network structure is relatively simple, and there are certain restrictions on landslide extraction. Zhang Qianying et al. [33] applied the Faster R-CNN [34], YOLO [35] (You Only Look Once), and SSD [36] (Single Shot MultiBox Detector) to landslides extraction and achieved good results in the bounding, but they could not get landslide shape.
Therefore, although efforts have been made to develop a useful landslide extraction model, there are still some unresolved problems in the application of deep learning models to landslides extraction [37]. It is important to develop a more effective model for landslide extraction.
This article aims to propose an end-to-end improved Mask R-CNN [38] model to extract landslides. Mask R-CNN is an imagery segmentation model with perfect structure, strong ability to extract target features, and it can effectively detect the irregular targets boundary. To make it suitable for landslide extraction, we improve the Mask R-CNN according to the landslide’s characteristics in the following aspects: (1) Replacing the feature extraction layer with the ResNeXt network to fully extract the landslides features to effectively distinguish the landslides from other features. (2) Adding bottom-up channels in the construction of the feature pyramid network to reduce the number of missed smaller landslides. (3) Adding edge losses function to accurately extract the landslides boundary and improve the overall extraction accuracy of the landslides.

2. Model

2.1. The Developed Model

Mask R-CNN belongs to the R-CNN [39,40] series. It is a new type of target detection model developed by He Kaiming et al. based on Faster R-CNN. As shown in Figure 1, combining the Feature Pyramid Network (FPN) [41] and the Residual Network (ResNet) [42] for feature extraction, it can make better use of multi-scale information. The main steps of Mask R-CNN are as follows. First, inputting the imagery into ResNet to extract features to generate multi-scale feature maps. Performing side connection, double up-sampling the feature maps of each stage, and merging them with the adjacent feature layers. Then, we sent it to the Region Proposal Network (RPN) to generate proposal boxes on feature maps in different sizes and to generate the proposal boxes and feature maps into RoI Align. The proposal box will intercept its corresponding feature layers and pool the intercepted results to perform classification and regression to obtain the adjustment parameters of the proposal box. Finally, adjust the proposal box to obtain the prediction box, and generate the segmentation mask of the detected objects.
As shown in Figure 1, C and P, respectively, represent different feature layers. FC represents the Fully Convolutional Networks. Because the size of the C1 layer is too large, the extraction of subsequent information will cause the number of parameters to increase quickly. Comprehensive considerations have discarded C1 for it does not participate in the construction of FPN. Therefore, it is not drawn in Figure 1. The outputs of “Classes Softmax”, “Boundary Box Regressor”, and “Mask” correspond to Classification, Positioning, and Segmentation, respectively.

RoI Align

After obtaining the proposal box, RoI Align pools the corresponding areas into a fixed-size feature map according to the proposal box’s position coordinates on the feature map and carries out subsequent classification, regression, and mask generation. RoI Align is a new type of regional feature aggregation method proposed in the Mask R-CNN. It directly cuts out the feature corresponding to the proposal box’s location from the feature map and carries out bilinear interpolation and pooling to transform the feature into a uniform size. In which, 7 × 7 is the input convolution kernel for classification and regression and 14 × 14 is the mask segmentation convolution kernel. As shown in Figure 2, the steps of the RoI Align process are as follows. First, traverse each candidate area and keep the floating-point number boundary without quantization, Then, divide the candidate area into k × k units. Finally, calculate and fix four coordinate positions in each unit by bilinear interpolation and max pooling. For RoI, Align introduces bilinear interpolation into the pooling process to turn the previously discrete pooling into a continuous one, it solves the problem of regional mismatch caused by two quantifications in RoI Pooling.

2.2. Improvement of the Mask R-CNN Network Structure

Although the Mask R-CNN is one of the most advanced target detection models at present, there are three problems when directly using it to detect landslides: (1) Landslide distribution, shape, size, and texture are so different from each other that the shallow ResNet cannot extract landslides effectively, while the deep ResNet has a complex network structure with so many parameters that make it computationally intensive. (2) For small-sized landslides, it is easy to lose information in the feature layer, which decreases the detection accuracy. (3) The geometric outline of the landslide is complex and the posture is different. There is a certain gap between the predicted mask edge and the real target edge, and even some parts of the target are lost.
Based on the above reasons, this paper developed a model based on Mask R-CNN. It combined ResNeXt to extract feature information, and improved FPN to rise the targets extraction accuracy in various sizes. It also added the edge loss functions to improve the landslide extraction accuracy.

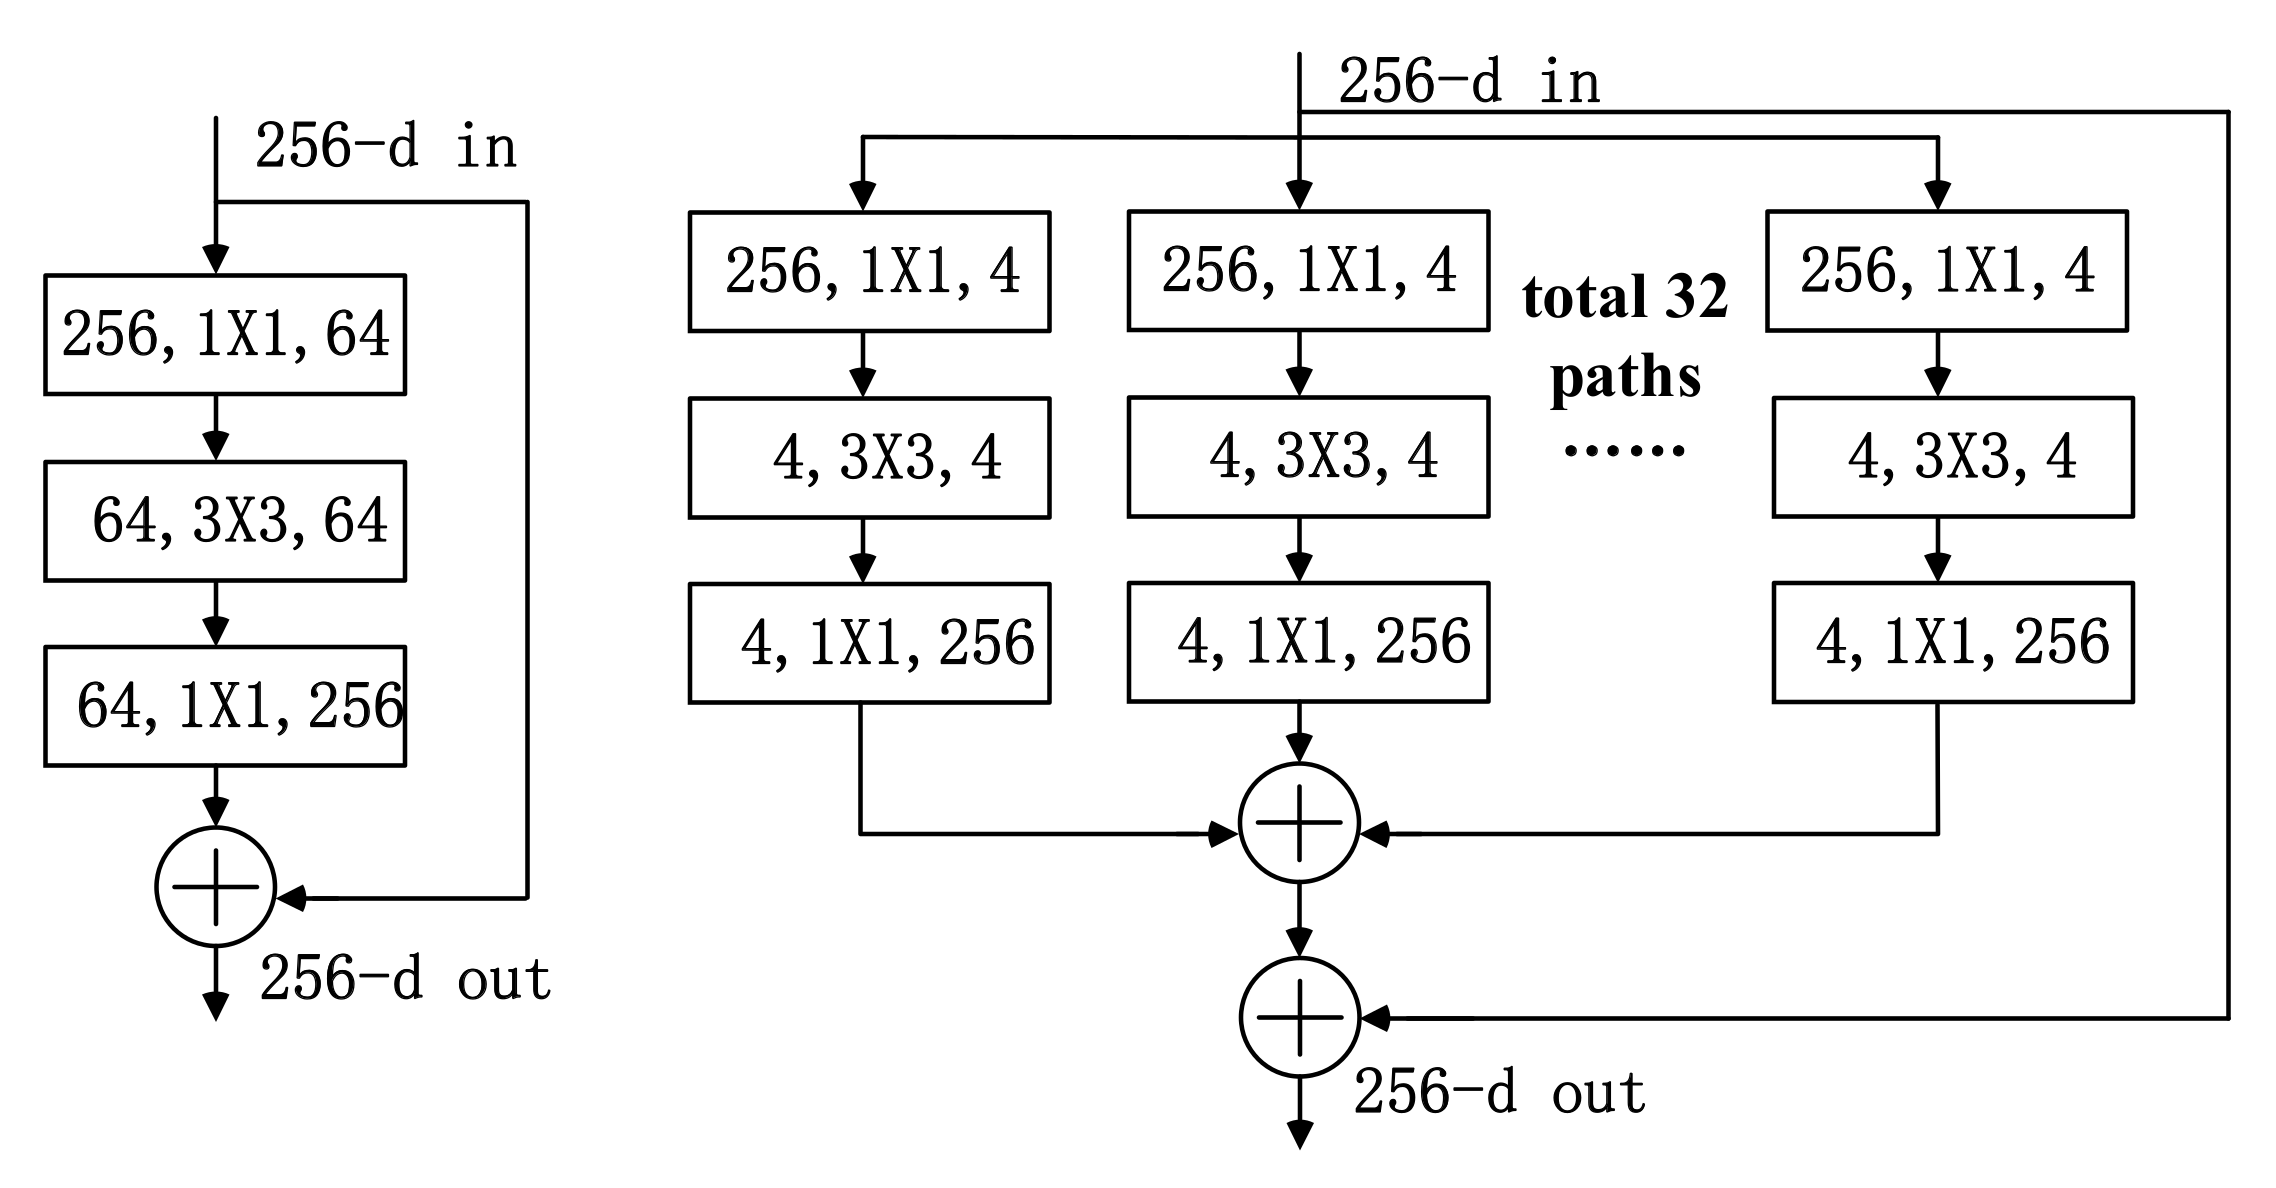
2.2.1. Improvement of the Feature Extraction Network Structure

The traditional network structure usually increases the accuracy by widening the network thus leading to an increase of hyperparameters, making the network difficult to train. However, ResNeXt module [43] was proposed to improve the accuracy without in-creasing parameters.
By comparing the network structure and performance of ResNet101 and ResNeXt50 feature detectors, we use the ResNeXt50 network structure as the feature detector for landslide extraction, which has the following advantages.
(1) The network structure is modular, straightforward, and few parameters are needed.
Figure 3 shows the comparison structure diagram of ResNet and ResNeXt network blocks. The ResNeXt network combines the stacking ideas of the VGG network and the split-transform-merge ideas of inception to make the network scalable, improve generalization, and increase the accuracy without reducing the complexity of the model. 256-d means the dimension is 256, 1 × 1 means the convolution kernel size is 1 × 1 for operation, and plus sign (+) means the corresponding numbers are added.
(2) Perfomance of ResNeXt is better than ResNet.
A 50-layer ResNeXt has the same accuracy as a 101-layer ResNet, but the calculation amount is only half of the latter. Table 1 lists the internal structure of ResNet-50 and ResNeXt-50, and the last two lines indicate that there is little difference in parameters and Floating Point Operations (FLOPs) between these two models. It can be found from the following table that the total number of channels in ResNeXt in each Conv is more than that that in ResNet, but their parameters are the same.

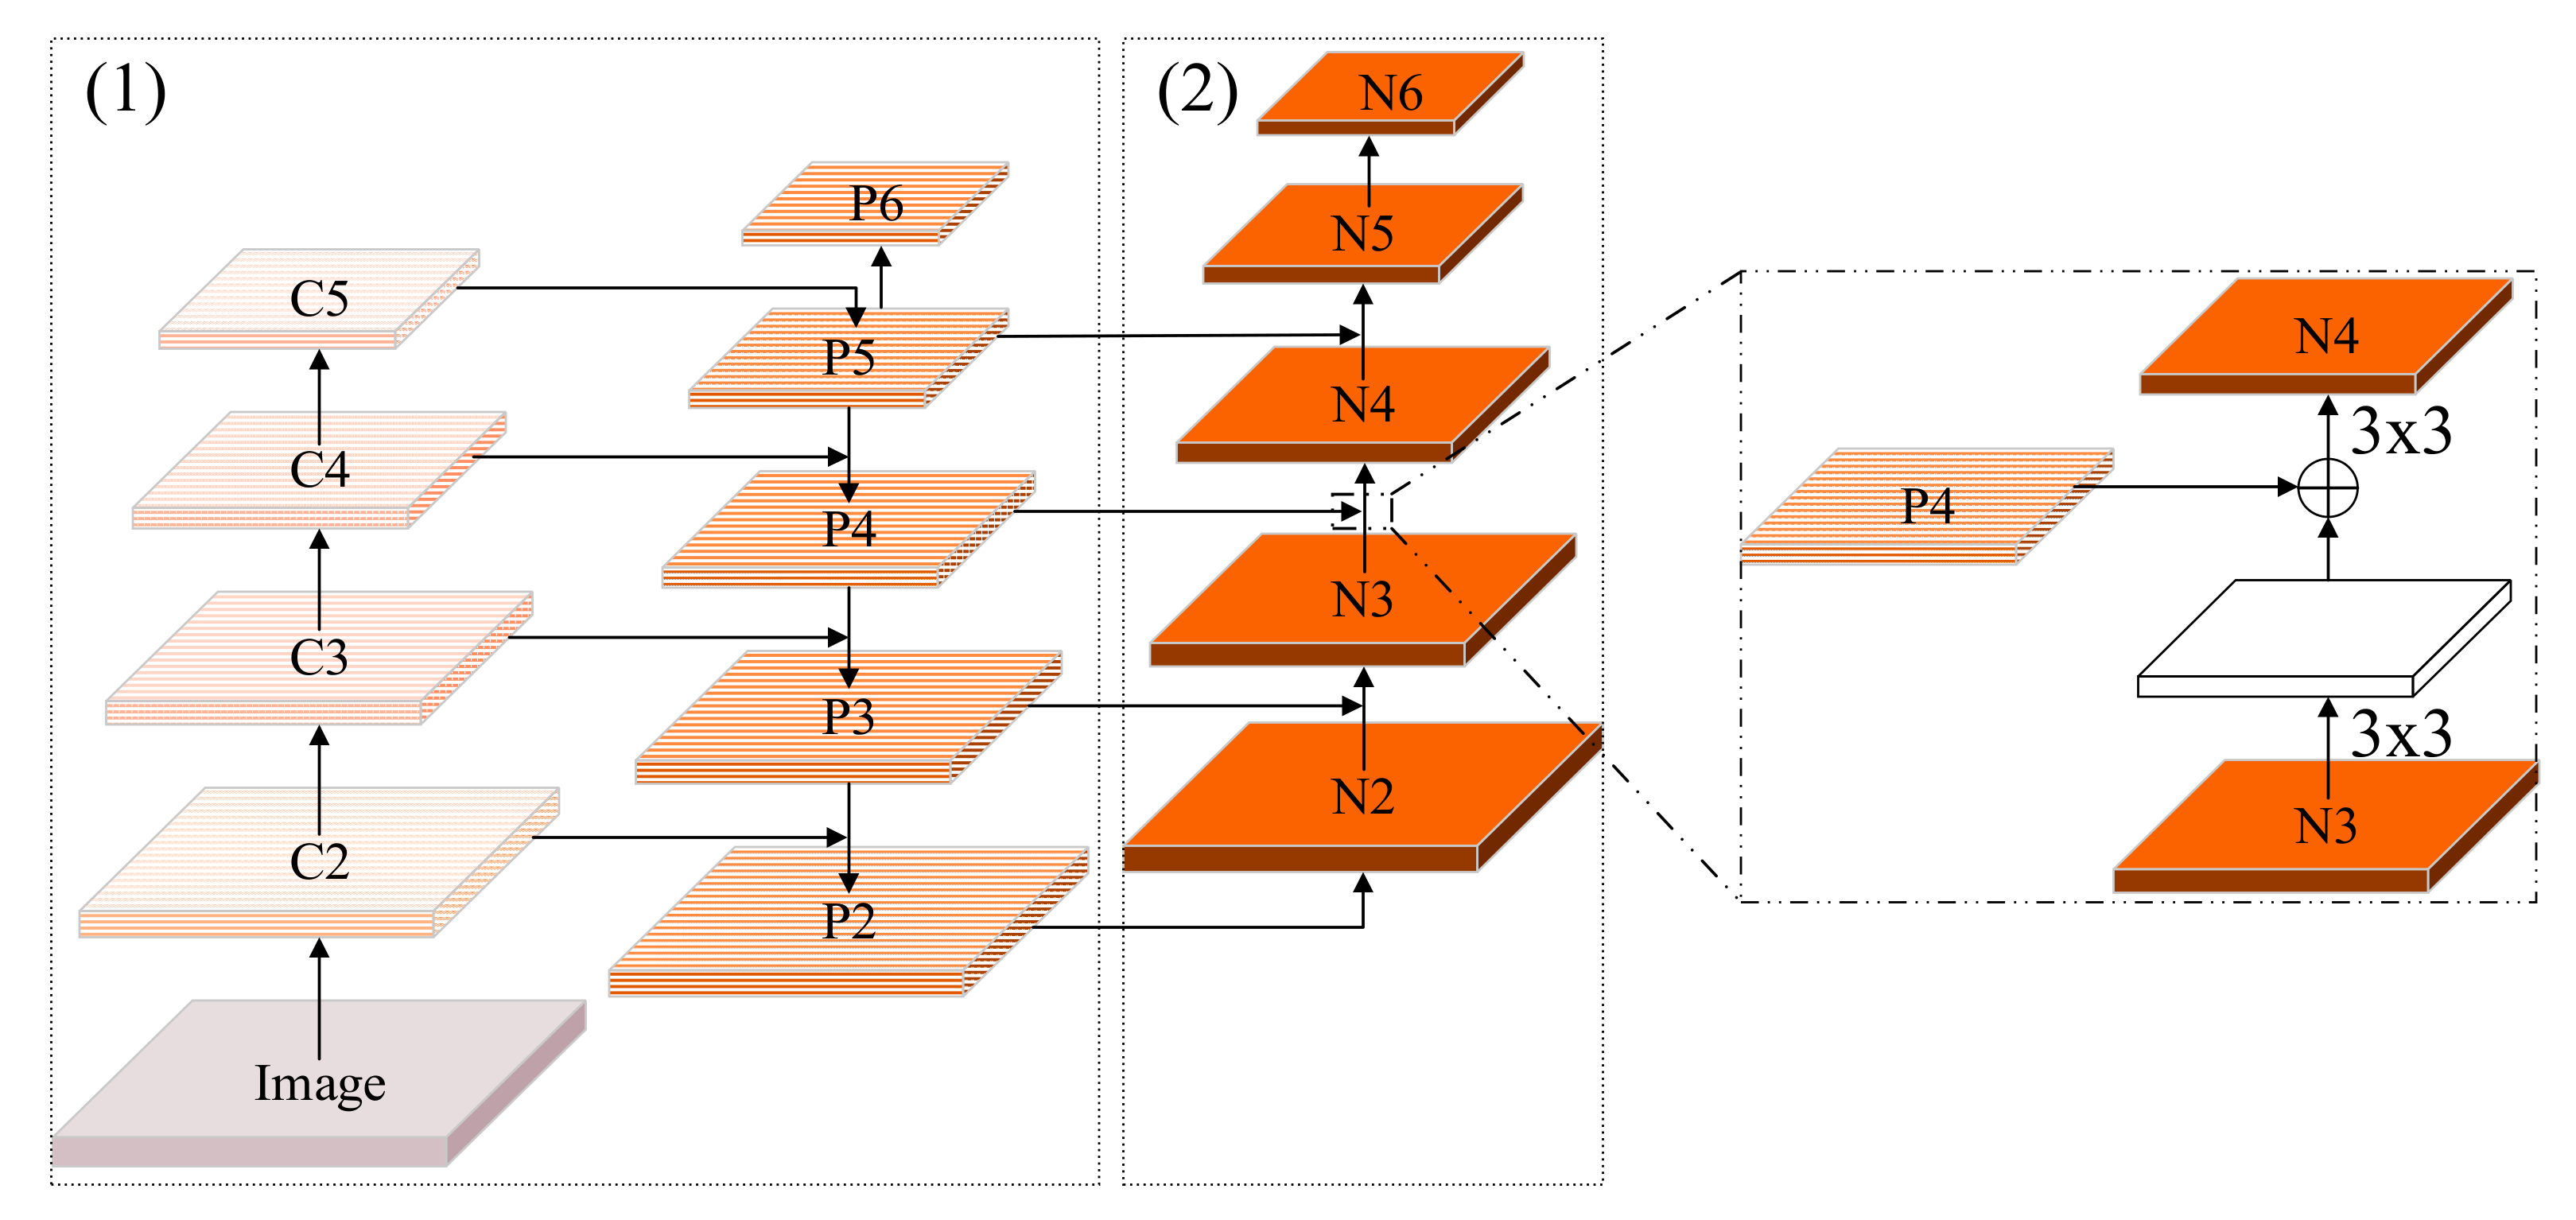
2.2.2. Improvement of FPN

FPN in the Mask R-CNN model uses a side connection method for multi-scale feature maps by fusing high-level semantic information into low-level accurate positioning information and performs well in the experiment. Although it uses multi-scale information, the side connection method only exists in a top-down path. The feature map inputting into the RPN layer is a single size selected from the path. A major problem with such structure is that low-level features contain precise location information, and high-level features contain strong semantic information. Analyzing the top-down path of the FPN, the final feature map inputting into the RPN only contains the feature information of the current layer and the higher layer, but not the lower layer. Such a design fails to make full use of each level’s feature information so that the position information cannot be integrated into the high-level semantic information, and the useful information on the remaining layers may be lost, which results in non-optimal target detection accuracy.
According to the problems mentioned above, in order to make full use of the accurate position information of the low-level features in the FPN, this paper developed an improved FPN by adding branches with reverse side connections from bottom to top, which is shown in the Figure 4(2). Among them, P2, P3, P4, P5, and P6 are the feature layers of the FPN. The newly added bottom-up path merges the low-level feature map N i and the higher-level feature map P i + 1 to generate a new feature map N i + 1 . The specific operation is as follows: N i is firstly downsampled by a 3 × 3 convolution kernel with a stride of 2 to obtain a feature map of the same size as P i + 1 . Then, each element in the feature map P i + 1 is added to the downsampled feature map. The new feature map is processed by a 3 × 3 convolution kernel with a stride of 1 and the feature map N i + 1 . This operation is shown in the following formula and Figure 4.
N i + 1   =   N i × Conv stride = 2 ,   size = 3   +   P i + 1   ×   Conv stride = 1 ,   size = 3
In which, the newly generated feature maps N2, N3, N4, N5, and N6 have merged the high-level and low-level features, while their main features are still on their own hierarchy. Therefore, the improved FPN makes full use of low-level positioning and high-level semantic information.

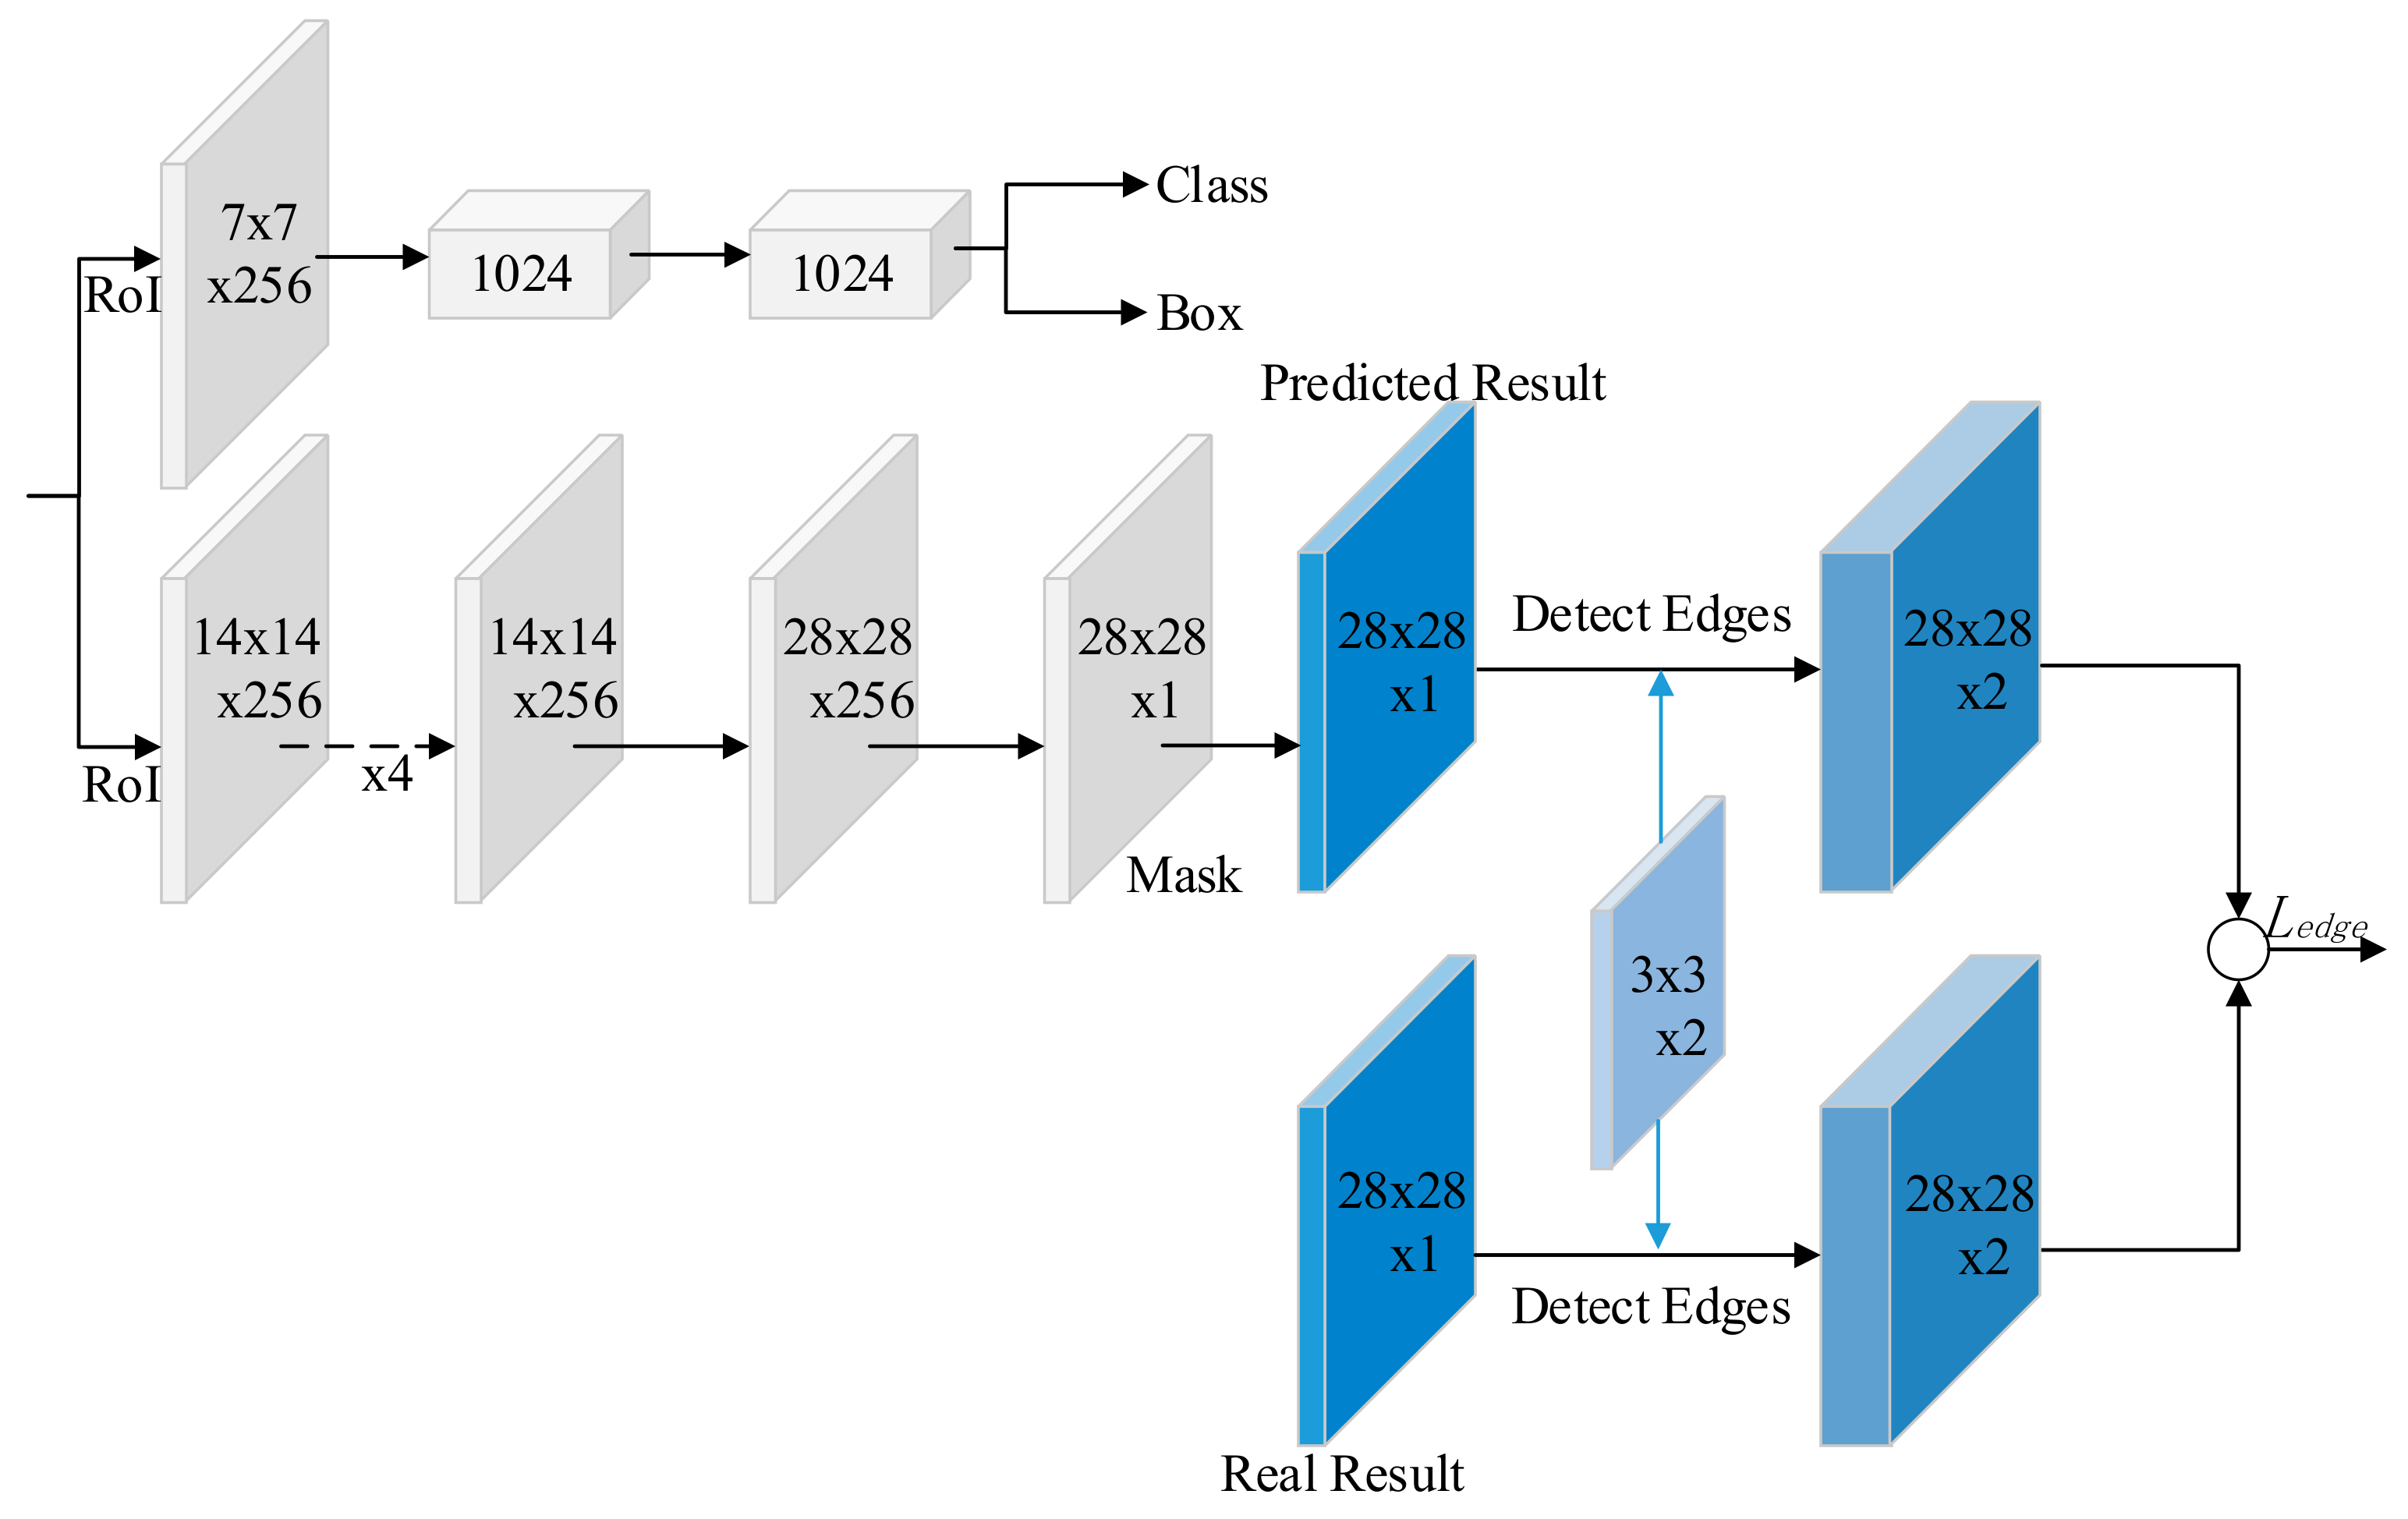
2.3. Improvement of the Mask R-CNN Loss Functions

By observing the segmentation results of Mask R-CNN, it is found that there are certain gaps between the edges of most masks and the real edges of the target, and even some parts of the target are lost. In the process of segmentation, the model does not directly classify the pixels in the imagery but first recognizes the target edge and then fills the closed area. In order to improve the accuracy of the algorithm for target edge detection, this paper integrates the edge information in the imagery into the network framework, and at the same time uses the edge information to point out a path for gradient descent during the training process, which accelerates the network training speed.
The Mask R-CNN outputs have three branches, whose functions include classification, positioning, and segmentation. Therefore, the loss function of the Mask R-CNN is L = L c l s + L b o x + L m a s k . The edge detection can also be integrated into the network as a branch [44,45], and at the same time, adding an auxiliary part L e d g e on the edge loss to the function L. The edge error L e d g e is generated between the detection edge and the real target edge. The new loss function is
L ` = L c l s + L b o x + L m a s k + L e d g e
In this paper, the edge detection filter is regarded as a convolution with a 3 × 3 kernel, such as Sobel filter [46]. The Sobel filter is a two-dimensional filter used to detect edges. It contains two filters:
S x = 1 0 1 2 0 2 1 0 1 ,   S y = 1 2 1 0 0 0 1 2 1
In which S x is a transverse filter for describing the horizontal gradient and S y is a longitudinal filter for describing the vertical gradient. Generally, the edges in the imagery will produce a higher response along the filter direction. The Sobel filter S ( S x or S y ) is a filter with a dimension of 3 × 3 × 2 .
To detect the edge consistency error L e d g e , a small network is constructed behind the output mask branch. The network’s input is the result of the predicted and real masks, which convolve with the Sobel filter S to determine the edge difference between the predicted and the real masks. Figure 5 shows the auxiliary network structure for the calculation of the edge consistency error. The predicted mask segmentation results and that of the actual masks are firstly obtained from Mask R-CNN network. Their errors are then calculated by the loss functions:
L e d g e y , y ^   =   1 N i = 1 N y i y ^ i 2
In which, for the ith sample, y i is the real value, y ^ i is the predicted value, N is the number of samples, and L e d g e y , y ^ is the mean square error between the real and the predicted values.

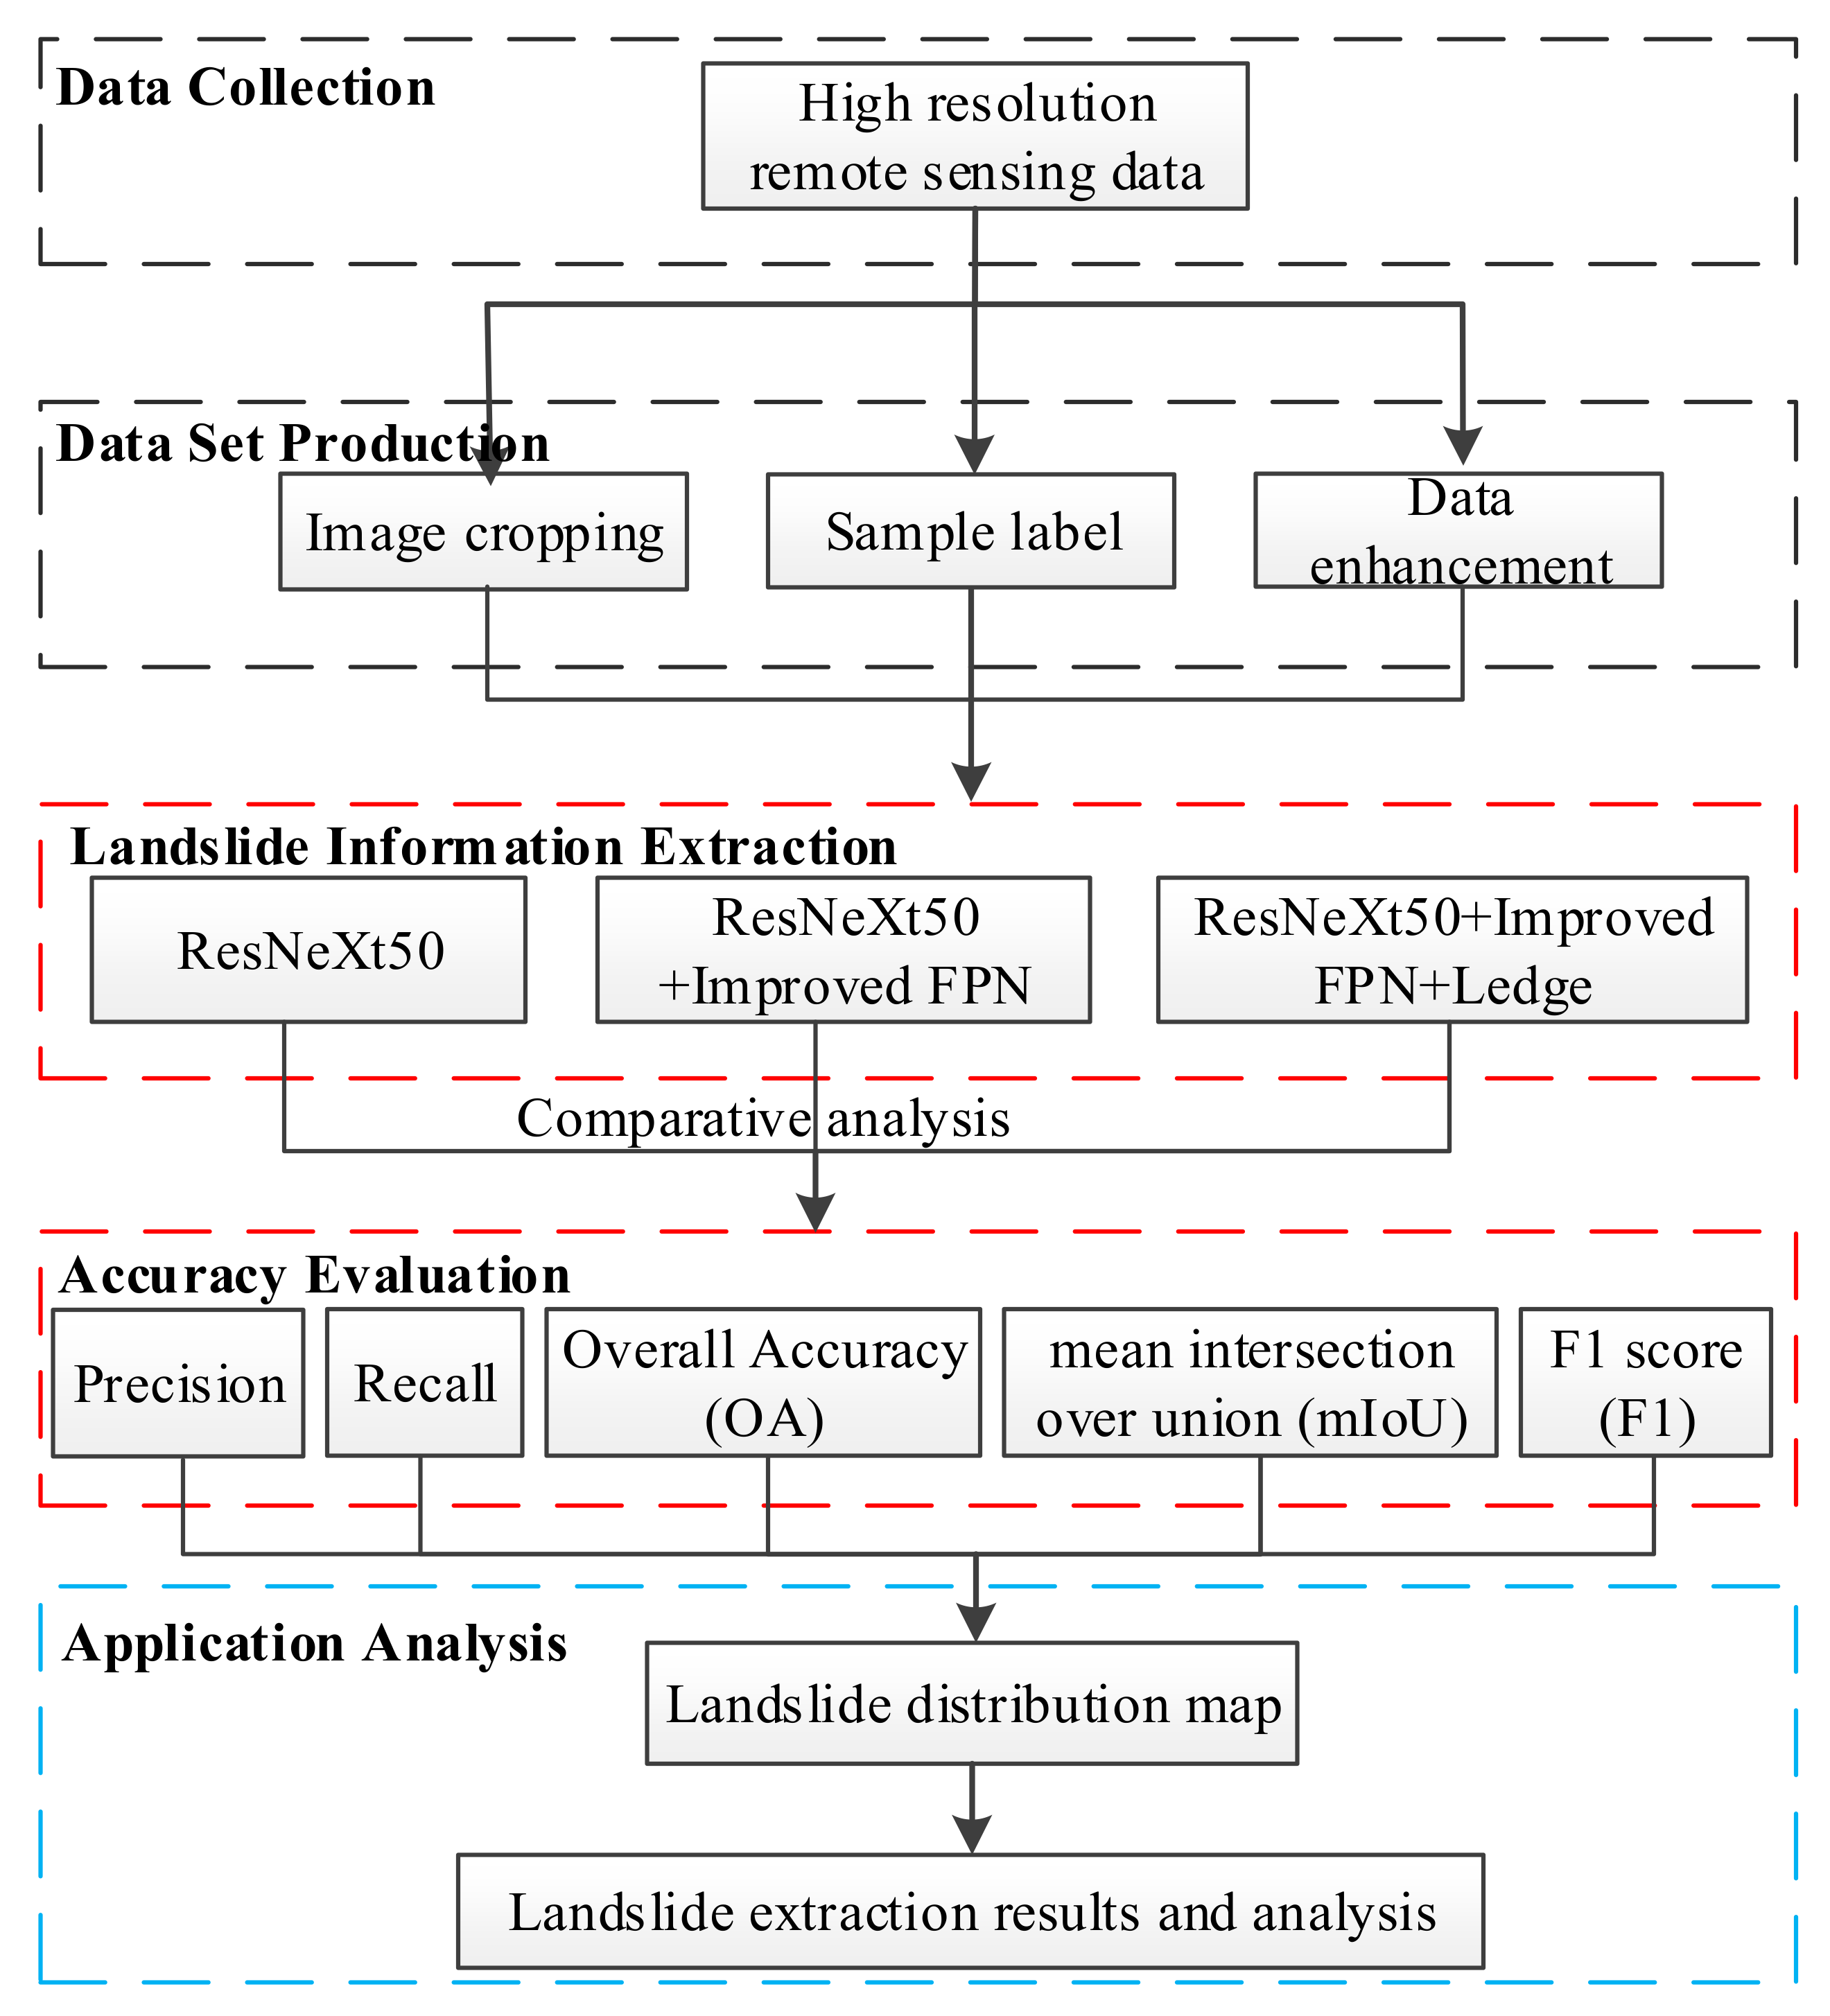
2.4. Technical Flowchart

The technical flowchart is shown in Figure 6, which includes five steps. The first step is data collection to obtain high-resolution remote sensing data. The second step is the data set production, which is divided into image cropping, sample label, and data enhancement. The third step is the usage of different methods to extract landslide information. The fourth step is the accuracy calculation, which evaluates the accuracy of the extraction results of different methods. The final step is the analysis of the extraction results.

2.5. Accuracy Evaluation

Indicators such as Precision, Recall, Overall Accuracy (OA), F1 score (F1), and Mean Intersection over Union [47] (mIoU) are used to evaluate the extraction results of the model quantitatively.

2.5.1. Precision, Recall, and OA

Precision is the number of correctly extracted landslides in the total number of extracted landslides. Recall is the proportion of all landslides that are correctly extracted. OA is the proportion of correctly classified samples to all samples. Formulas for Precision, Recall, and OA are as follows:
Precision = T P F P + T P
Recall = T P F N + T P
OA = T P + T N T P + F N + F P + T N
Among them, TP, FP, FN, and TN are shown in Table 2. TP is the number of landslides that are correctly extracted, FP is the number of landslides that are incorrectly extracted, FN is the number of landslides that are not correctly extracted, and TN is the number of non-landslides that are not correctly extracted.

2.5.2. Mean Intersection over Union

MIoU calculates the ratio of the intersection and union of two sets. In the image segmentation, these two sets represent ground truth and predicted segmentation. In this article, these two sets are the landslides interpretation map and landslides predicted map. The larger the ratio is, the higher the correct rate is. Its formula is
mIoU = 1 k + 1 j = 0 k P i j P i i j = 0 k P i j + j = 0 k P j i P i i
mIoU = T P F P + T P + F N
In which k + 1 is the number of categories. i is the label of the ground truth value, and j is the label of the predicted value. P i i is the number of pixels marked i and predicted to be i , P i j is the number of pixels marked i but predicted to be j , and P j i is the number of pixels marked j but predicted to be i .

2.5.3. F1 Score

F1 score is used to evaluate the model’s overall performance and is defined as the harmonic average of precision and recall. The higher the value F1 is, the better the performance of the model is. Its formula is
F 1   =   1 + β 2 Precision × Recall Precision + Recall , β = 1

3. Experiment

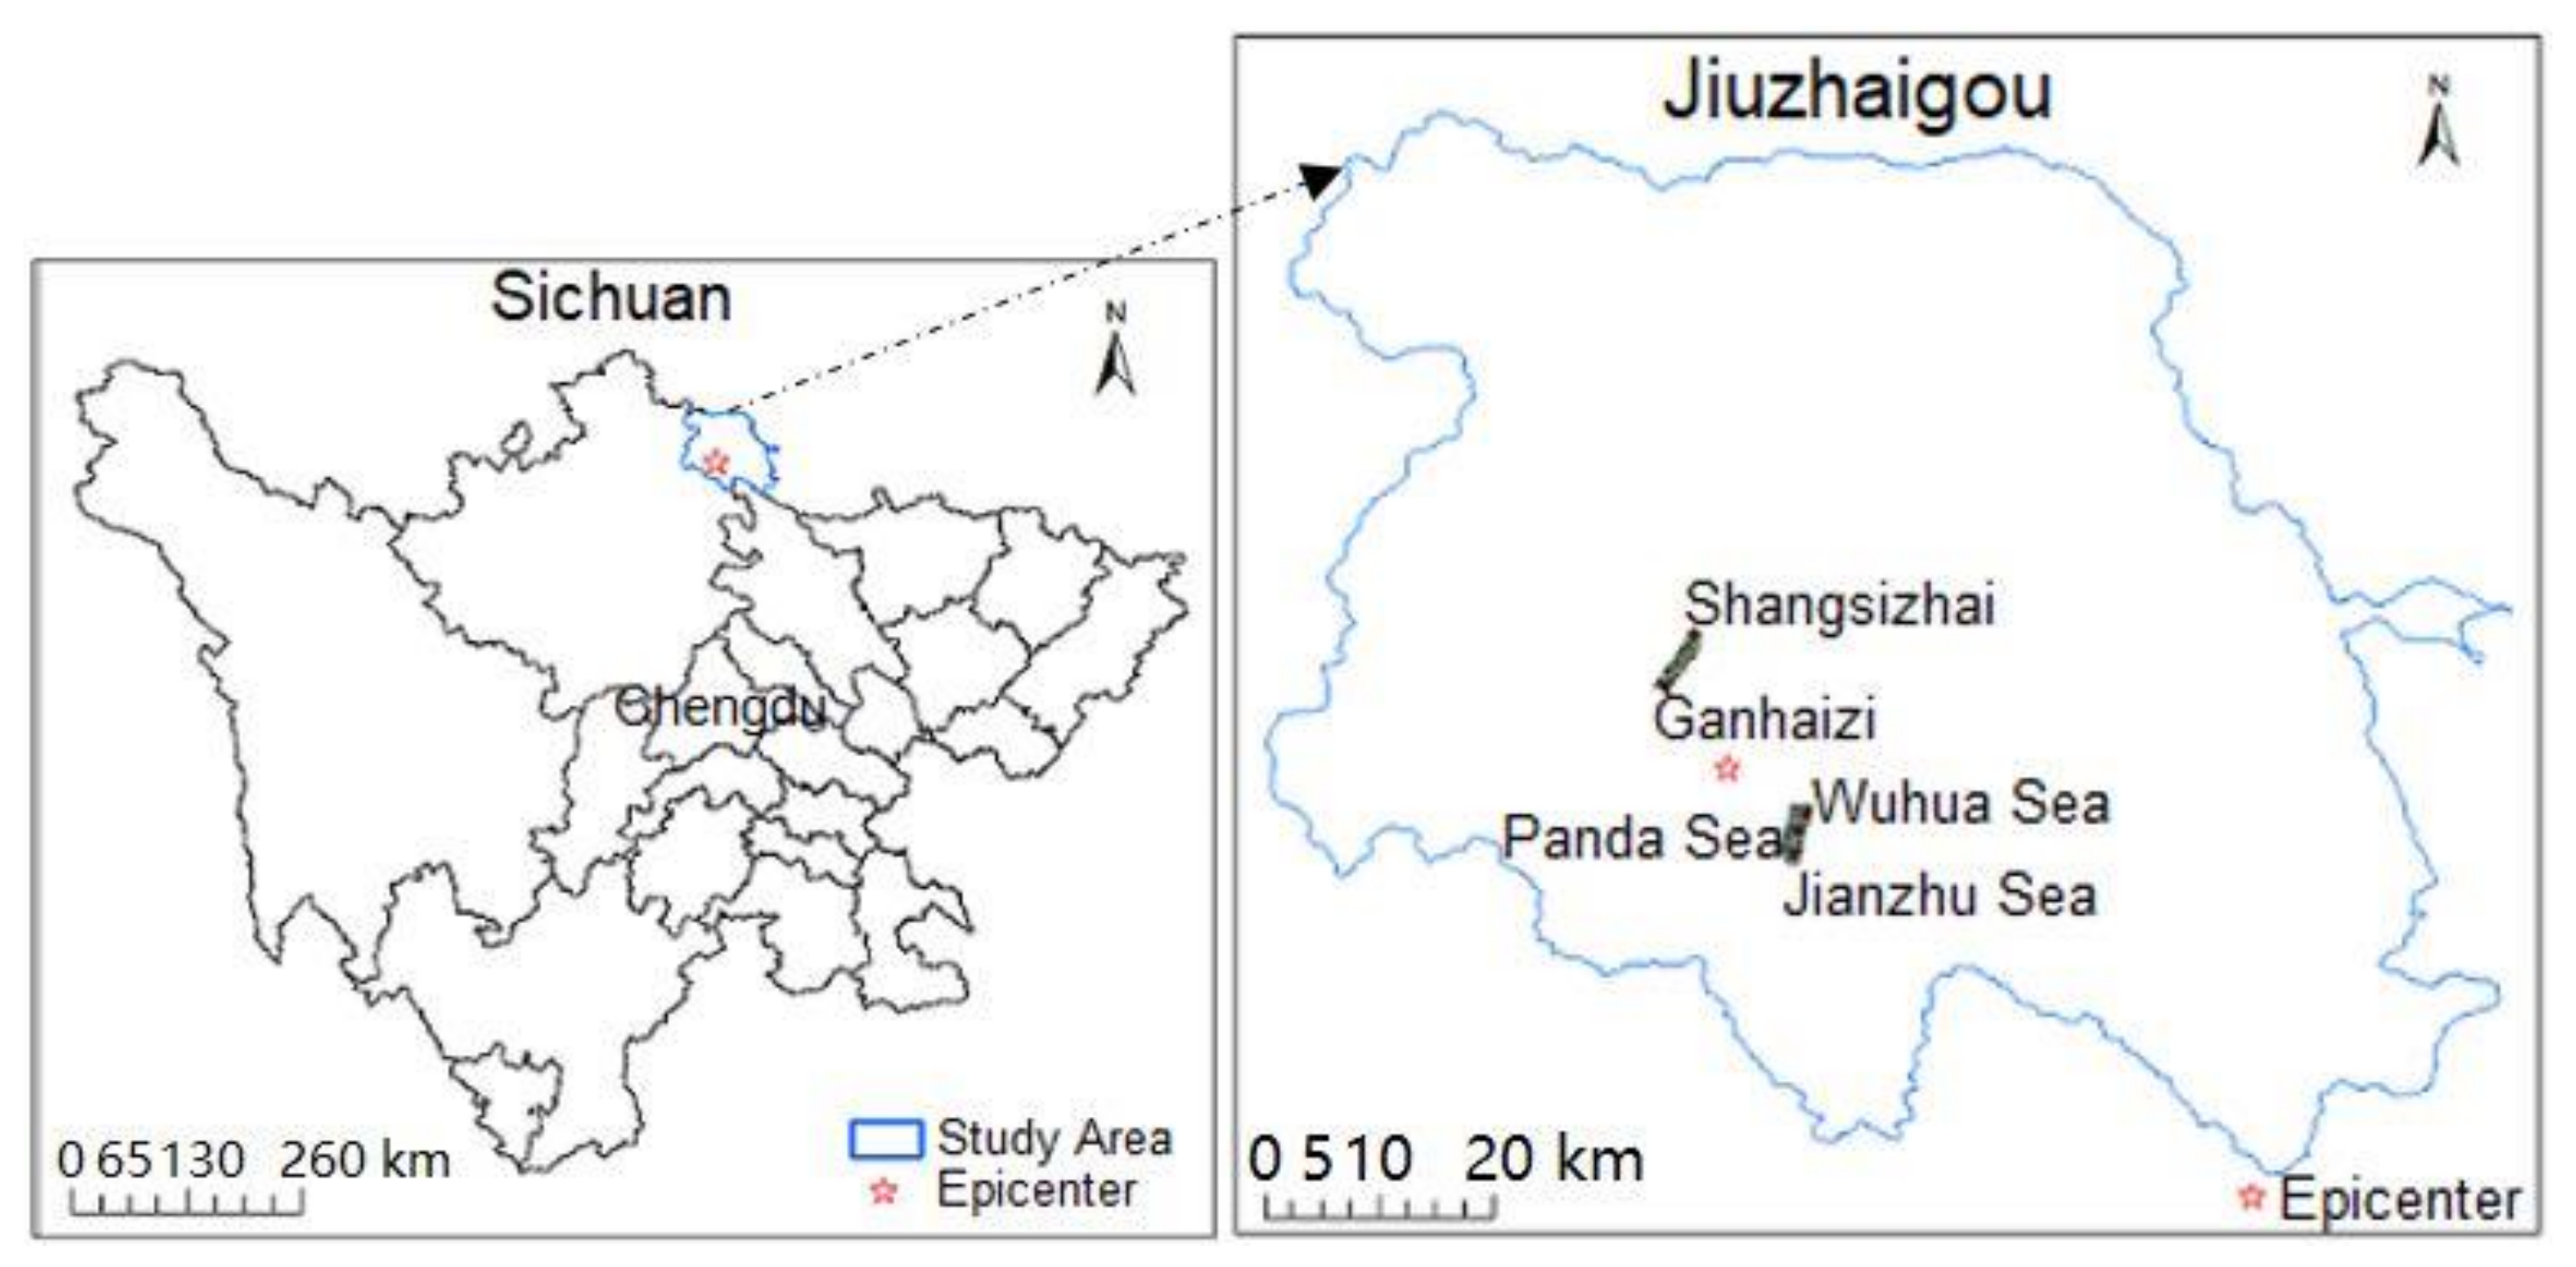
3.1. Application of the Model to the Jiuzhaigou County

On 8 August 2017, a 7.0 magnitude earthquake occurred in Jiuzhaigou County, northern Sichuan Province, China, with a focal depth of 20 km. As shown in Figure 7, the epicenter was located in Bimang Village, Zhangzha Town, Jiuzhaigou County. The earthquake occurred during the peak tourist season of Jiuzhaigou Scenic Area. A large number of earthquake-triggered landslides occurred, causing at least 29 roads to be blocked. Investigating spatial locations of these landslides is critical for hazard reduction and the reconstruction of the scenic spots.

3.2. Data Set

3.2.1. Remote Sensing Data Acquisition

Unmanned Aerial Vehicle (UAV) remote sensing technology is widely used to obtain landslides data due to its convenience, high efficiency, and ability to fly under low-altitude clouds. This article uses UAV data in the Jiuzhaigou area to carry out training and testing operations for the model. We took 366 landslides, with an area of 34.6 km 2 , near Panda Sea, Wuhua Sea, and Jianzhu Sea as the training sets, and 233 landslides, with an area of 12.6   km 2 , from Shangsizhai to Ganhaizi in Jiuzhaigou County as the test sets. Their geographical locations are shown in Figure 8.
The landslide interpretation map mentioned in this paper has been verified in the field to make sure that the final interpretation accuracy to be 98%, which can be used as a reference landslides map. Part of the field verification is shown in Figure 9.

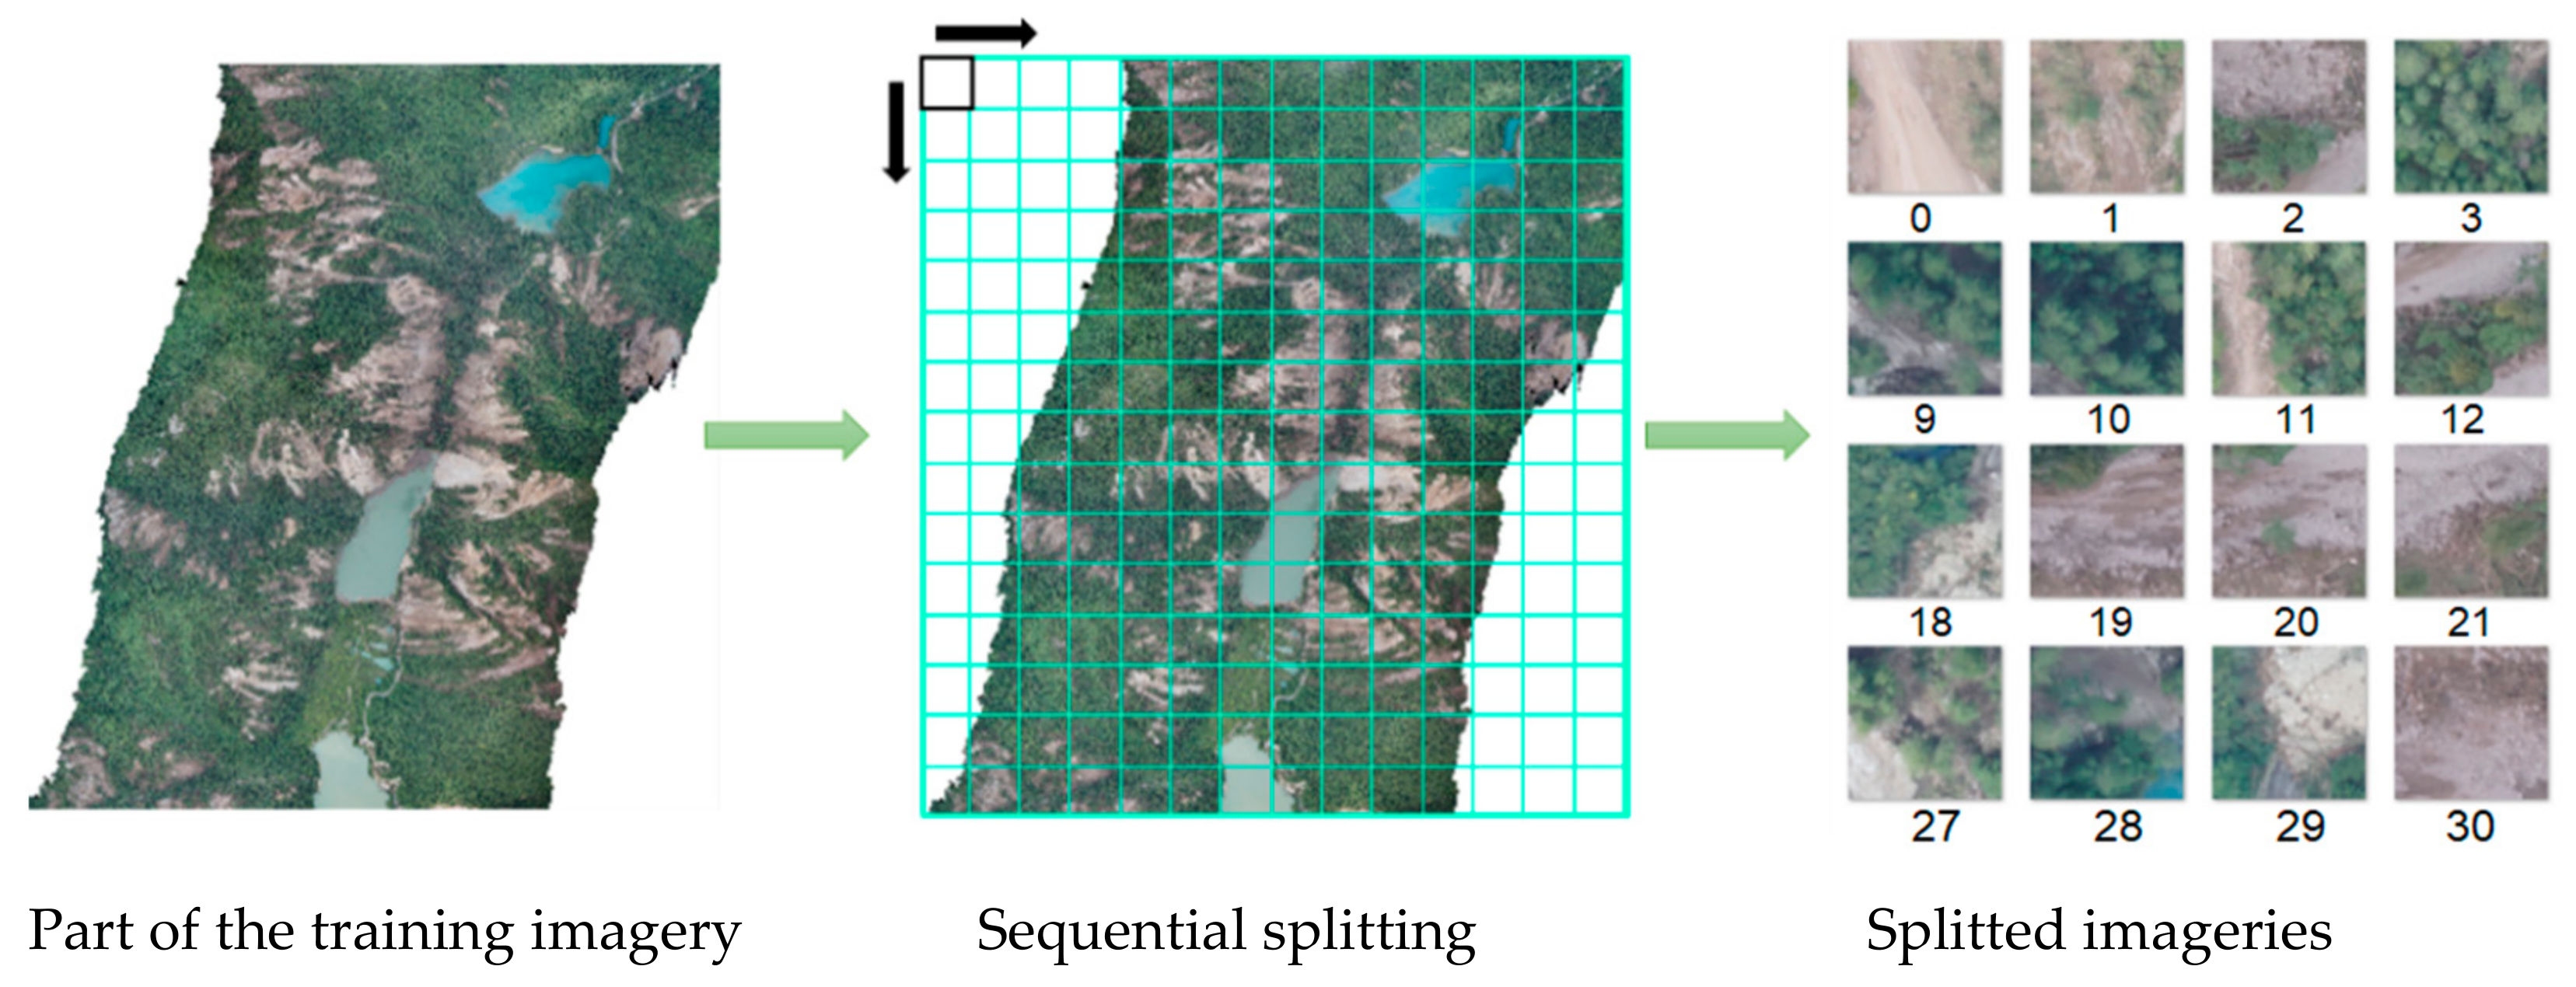
3.2.2. Data Set Production

Due to the computer’s limited operating memory and the model’s limitation on the size of the input data, large-sized imageries cannot be directly input into the network for training, which need to be clipped. By cutting out image blocks with a size of 256 × 256 pixels from a large remote sensing imagery and sending the small-blocked imageries into the network for training in batches, the network’s training speed was accelerated and the landslides on the imagery can be quickly extracted during the application process. This article uses this method to split the original imageries, label imageries, and test imageries. The detailed splitting process of the test imageries is shown in Figure 10.

3.2.3. Data Set Enhancement

For deep learning methods, data enhancement operations, such as rotation and flipping, are applied on the imageries, which include 90°, 180°, and 270° rotations and left-right, up-down flipping. As the landslides can show various directions, structures, and boundary shapes on the imagery, the training sets are rotated and flipped to enhance the training samples. From which, a total of 9762 samples were obtained for model training.

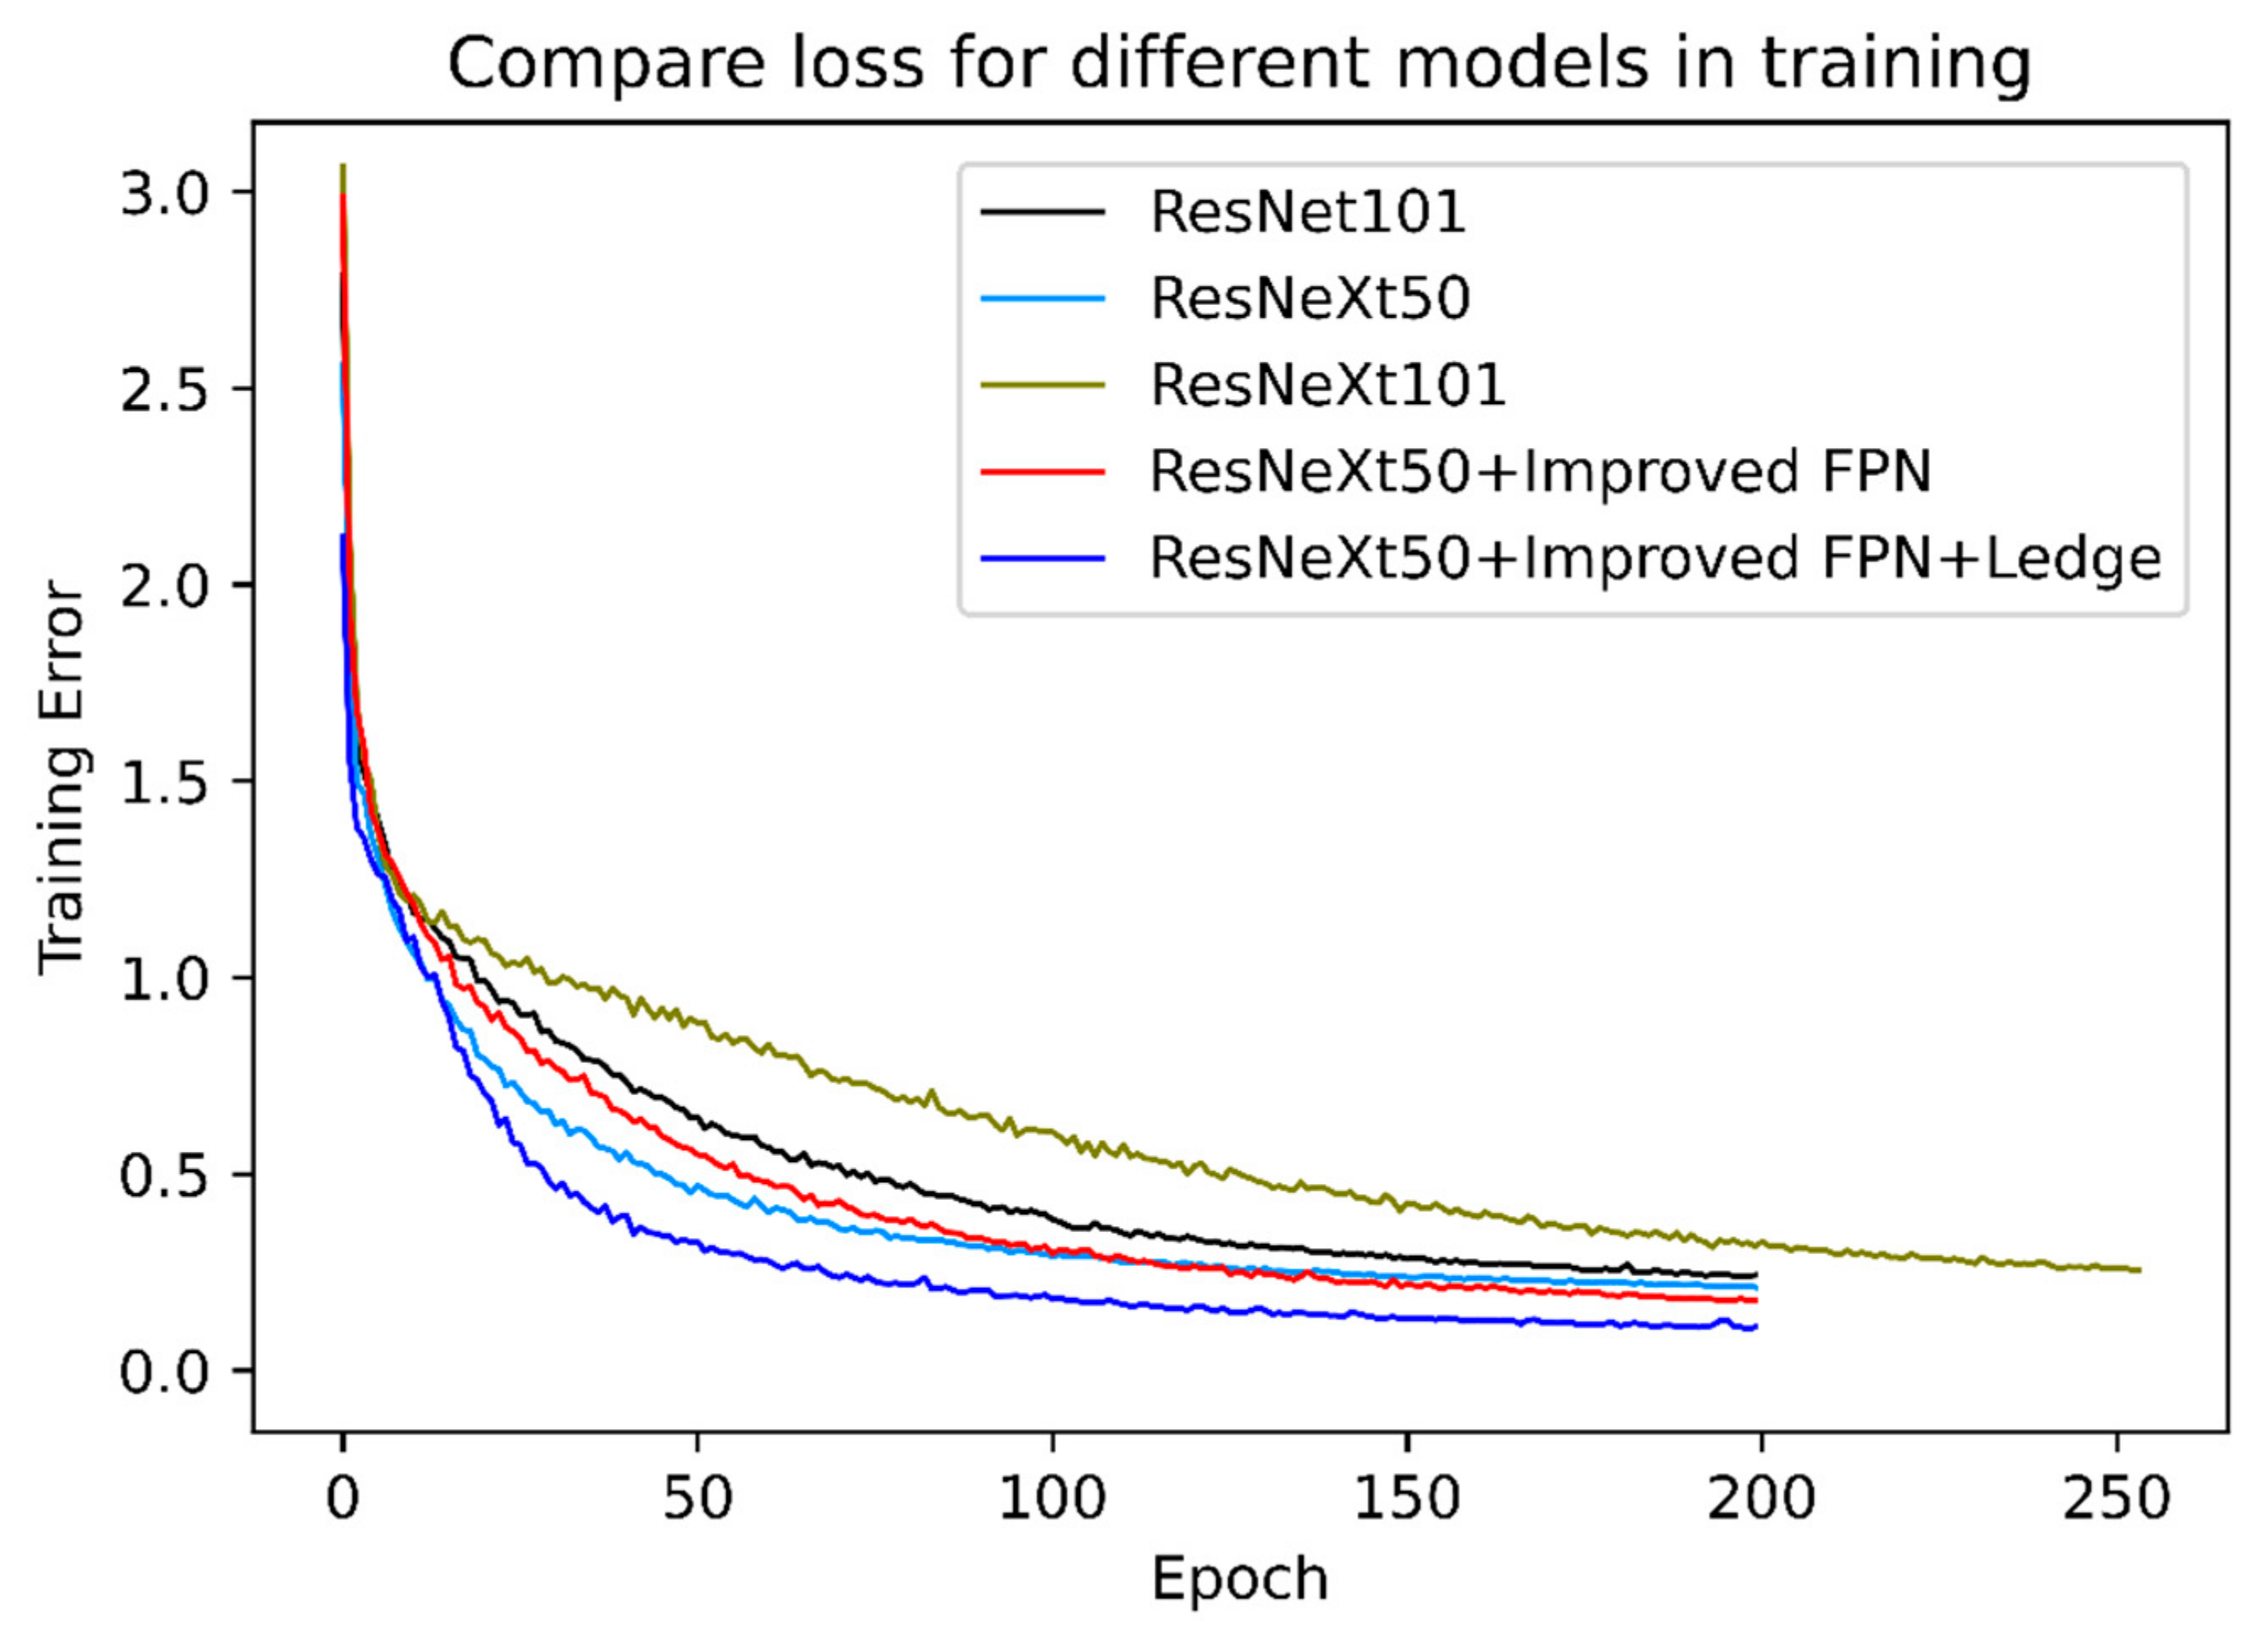
3.3. Experimental Environment and Model Training

The hardware environment of this experiment: the graphics card is RTX2080Ti, the processor is Intel i7-8700K, and the internal memory is 32G.
The software environment of the model: Mask R-CNN model and improved model are implemented by Keras. Keras is a high-level neural network API, written in pure Python, with TensorFlow or Theano as the backend. The training parameters of the model are shown in Table 3 below.
Based on the above environments, five experiments are designed for comparisons: ResNet101, ResNeXt50, ResNeXt101, ResNeXt50 + Improved FPN, and ResNeXt50 + Improved FPN + L e d g e . The first three experiments are carried out to determine the feature extraction layer choices. The transfer learning method is used to train the weights obtained by Mask R-CNN on the official COCO2014 [48] data set as the pre-training weights of the landslides detection algorithm in this paper. Based on this pre-training weights, sample training is carried out on its own set, so that the learning method can not only reduce the training cost, but also effectively improve the model performance and the overall detection accuracy.

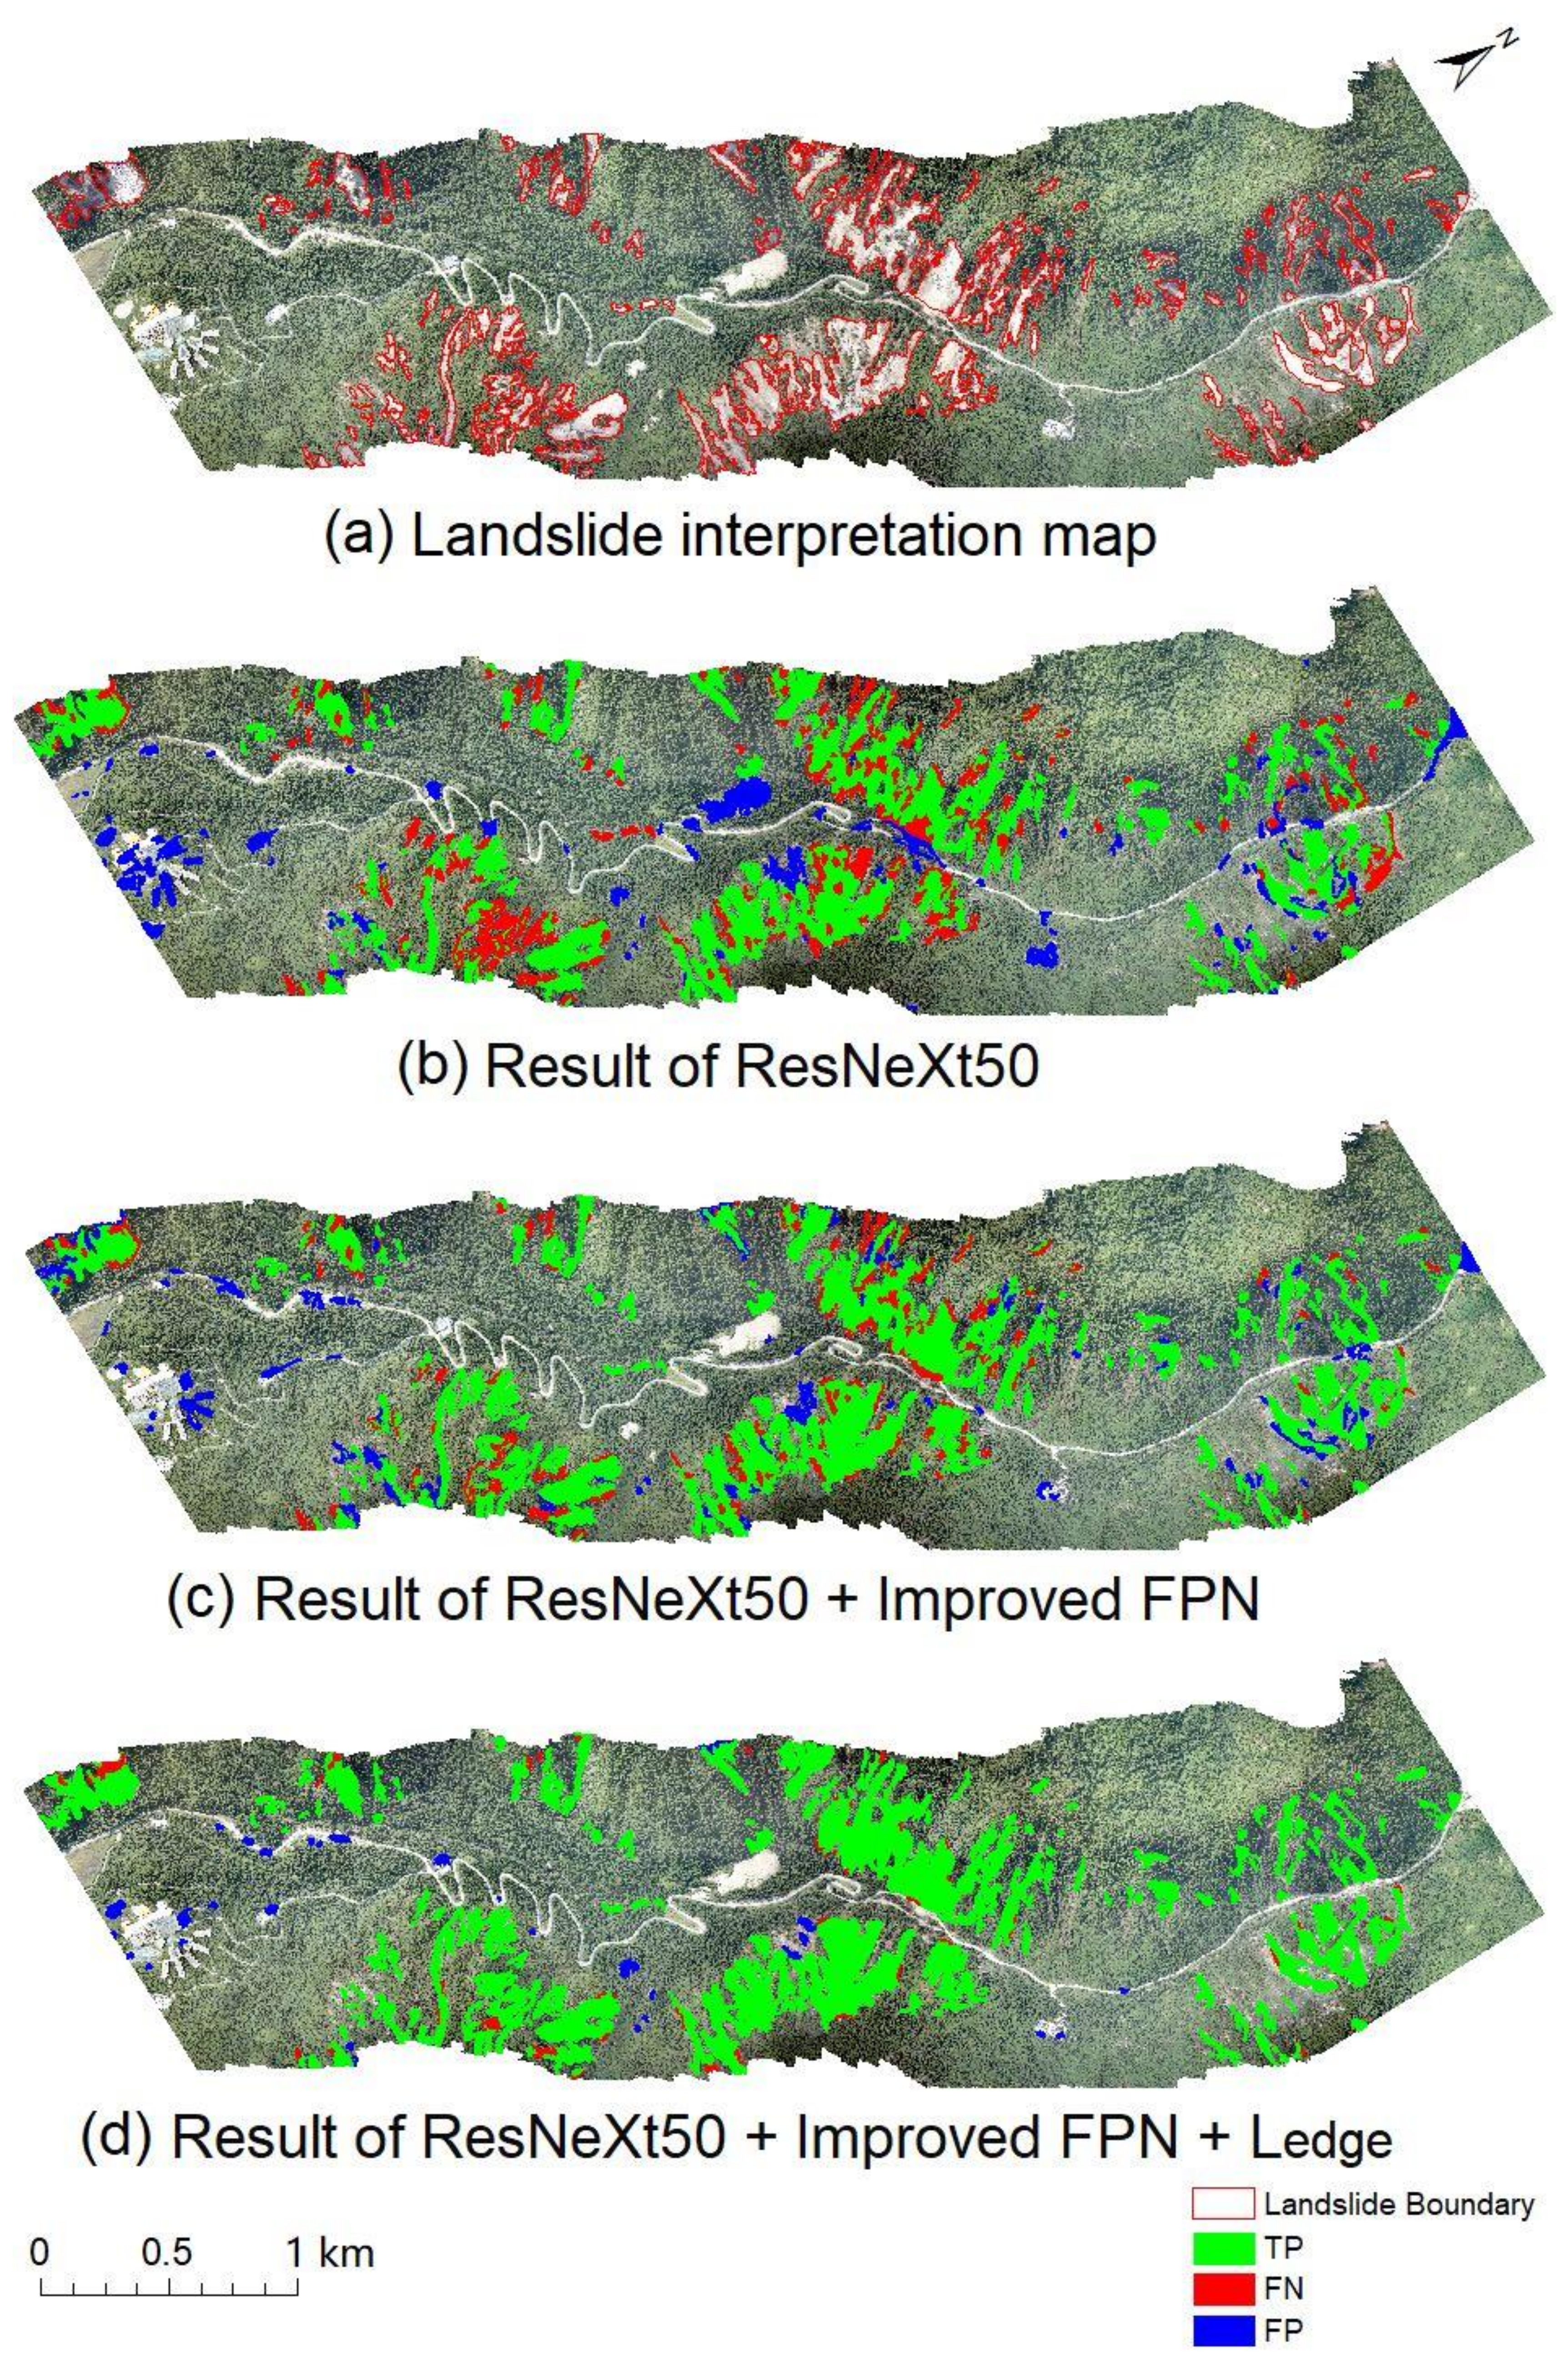
3.4. Experimental Results

ResNet101, ResNeXt50, ResNeXt101, ResNeXt50 + Improved FPN, and ResNeXt50 + Improved FPN + L e d g e were trained on the same data set, respectively. The training loss curves are shown in the Figure 11. In the extraction part of the feature layer, ResNet101, ResNeXt50, and ResNeXt101 are compared each other. It can be seen from the curves that ResNet101 and ResNeXt50 have similar detection effects. However, compared with ResNet101, ResNeXt50 reduces the amount of parameters by half. Therefore, during the change of the loss value, the ResNeXt50 drops faster. In the same training process, it takes less time to complete the same epoch. Therefore, in the feature extraction, the ResNeXt50 network is selected to extract landslides.
The loss curve of ResNeXt50 + Improved FPN has a certain degree of slowing down in the early stage. The main reason is that the increased bottom-up path makes the information contained in the feature layer more complicated, and at the same time increases the amount of parameters that need to be trained. However, the loss value at the plateau stage is lower than the ResNeXt50 model. It can be seen from the loss curve of ResNeXt50 + Improved FPN + L e d g e that it drops faster and lower. The main reason is that the edge loss is increased, which is equivalent to using the edge information to point out a path for gradient to fall down during the training process, which accelerates the network’s training rate and further improves the detection convergence speed.
After the training is completed, ResNeXt50, ResNeXt50 + Improved FPN, and ResNeXt50 + Improved FPN + L e d g e are compared, and the landslides from Shangsizhai to Qianhaizi area are extracted. During the process of landslide extraction, the original imagery is firstly splitted into 256 × 256 clips in training process and the same sized clips are also splitted in predicting process. After splitting, each clip is predicted by the proposed method in this paper. Finnaly, we mosaic the predicted clips into a large imagery to identify the landslides.
Figure 12a is the landslide interpretation map, which provides a reference for the accuracy evaluation on the landslides extraction using different methods.
Figure 12b is the extracted result of ResNeXt50. It can be seen from the figure that the situation of error extraction and missed extraction is more prominent, which leads to unsatisfactory accuracy. The ResNeXt network has a better effect in landslide extraction. Most landslides and roads can be effectively distinguished. However, there are some mountain roads or soil on the roads after the earthquake, which is similar to the landslide and may cause the error extraction (as shown in Figure 13). At the same time, some houses that were similar in tone were mistakenly extracted as landslides. The missed extraction is mainly because the boundary of the landslides cannot be well identified. For some smaller landslides, due to their small areas and fewer pixels, the target information is lost in the feature layer with higher semantic information in the process of extracting features through ResNeXt downsampling.
Figure 13 shows the error landslides extractions, Figure 14 shows the missed landslides extractions, and Figure 15 shows the landslides edge extractions. Subfigures (a–d) in each figure are the partial schematic diagrams taken from the corresponding positions in the Figure 12. In which, the green spots represent the correct extraction, the red spots represent the missed extraction, and the blue spots represent the error extraction.
Figure 12c is the result of ResNeXt50 + Improved FPN landslides extraction. It can be seen from the figure that the missed extraction decreased significantly. When constructing FPN, a channel was added to further integrate the deep features and the shallow features to identify small landslides. Simultaneously, the recognition of other landslides is more accurate (as shown in Figure 14). It can also be seen from Figure 12c that there are a lot less red spots compared to Figure 12b.
Figure 12d is the extracted results of ResNeXt50 + Improved FPN + L e d g e . It can be seen from the figure that the overall extraction effect is satisfactory. When the edge loss is added, the accuracy of edge extraction is improved, the extracted shape is closer to the real boundary (as shown in Figure 15), and the error of false extraction is also reduced for some buildings with regular shapes.
To quantitatively evaluate the model’s performance, each accuracy index is calculated according to the confusion matrix. The results are shown in Table 4. The precision and recall in the table are obtained when the threshold is adjusted to maximize F1. The improved final model ResNeXt50 + Improved FPN + L e d g e on the test set has a Precision of 95.8%, a Recall of 93.1%, an OA of 94.7%, an mIoU of 89.6%, and an F1 of 94.5%. Compared with the original ResNeXt50 model, they have been significantly improved by 13.9%, 13.4%, 9.9%, 16.4%, and 10%, respectively. Therefore, the results showed that the landslides automatic extraction model established in this paper was feasible and effective.

4. Conclusions and Prospects

This paper uses the aerial remote sensing imageries after the earthquake as the landslides data set, and proposes an improved Mask R-CNN landslides extraction model to achieve good effects.
(1) Rebuilding the network structure and loss function of the Mask R-CNN model to improve the accuracy of landslides extraction.
The feature extraction layer is replaced with a simple and effective ResNeXt network to fully extract the unique landslides features and effectively distinguish the landslides from other confusing objects. At the same time, adding bottom-up channels in FPN to make the full use of low-level positioning and high-level semantic information to reduce the number of missed landslides. The edge loss added to the loss function improves the detection accuracy of the landslides boundary, because it uses the edge information to accelerate the network training speed and improves the overall extraction accuracy of the landslides.
(2) The improved Mask R-CNN model is feasible for landslides extraction.
Taking the Jiuzhaigou earthquake landslides as an example to carry out the experiment, the results showed that the improved Mask R-CNN model (ResNeXt50 + Improved FPN + L e d g e ) were feasible and effective for landslides extraction on the high spatial resolution remote sensing imageries. The results showed that the new method has a Precision of 95.8%, a Recall of 93.1%, and an OA of 94.7%. Compared with the traditional Mask R-CNN model, these parameters have been significantly improved by 13.9%, 13.4%, and 9.9%, respectively. Compared with other methods, the new method only needs to obtain UAV remote sensing data of the post-earthquake area, and does not need the pre-earthquake imageries, and thus avoids those conditions that are unable to acquire satellite imageries in time.
The method has served earthquake emergency departments, including Sichuan Earthquake Administration, Xinjiang Earthquake Administration, and Gansu Earthquake Administration of China to respond quickly in geological hazards reduction.
However, due to the limited training set of seismic landslides, there are still some errors in the extracted results. In order to make the model more practical, the following work needs to be further improved: extending the ranges of the training set to include remote sensing images with different types and resolutions, as well as landslide types in different regions.

Author Contributions

All authors contributed in a substantial way to the manuscript. Data curation, Peng Liu, Yongming Wei, and Qinjun Wang; Formal analysis, Peng Liu; Funding acquisition, Yongming Wei and Qinjun Wang; Methodology, Peng Liu; Software, Peng Liu, Jingjing Xie, Yu Chen, Zhichao Li, and Hongying Zhou; Writing—original draft, Peng Liu; Writing—review and editing, Peng Liu and Qinjun Wang. All authors have read and agreed to the published version of the manuscript.

Funding

This research was funded in part by the National Key Research and Development Program of China (Grant No. 2017YFC1500902), in part by the National Natural Science Foundation of China (Grant No. 42071312), in part by the Hainan Hundred Special Project, in part by the Key Science and Technology Program of Hainan province (Grant No. ZDKJ2019006), and in part by the Second Tibetan Plateau Scientific Expedition and Research (STEP) (Grant No. 2019QZKK0806).

Data Availability Statement

The data presented in this study are available on request from the corresponding author.

Acknowledgments

The authors would like to thank the Sichuan Earthquake Administration for offering the unmanned aerial vehicle remote sensing data and the anonymous reviewers and editors for their very competent comments and helpful suggestions.

Conflicts of Interest

The authors declare no conflict of interest.

References

  1. Tien Bui, D.; Shahabi, H.; Shirzadi, A.; Chapi, K.; Alizadeh, M.; Chen, W.; Mohammadi, A.; Ahmad, B.; Panahi, M.; Hong, H. Landslide Detection and Susceptibility Mapping by AIRSAR Data Using Support Vector Machine and Index of Entropy Models in Cameron Highlands, Malaysia. Remote Sens. 2018, 10, 1527. [Google Scholar] [CrossRef] [Green Version]
  2. Yin, Y.; Wang, F.; Sun, P. Landslide hazards triggered by the 2008 Wenchuan earthquake, Sichuan, China. Landslides 2009, 6, 139–152. [Google Scholar] [CrossRef]
  3. Zhao, C.; Lu, Z. Remote Sensing of Landslides-A Review. Remote Sens. 2018, 10, 279. [Google Scholar] [CrossRef] [Green Version]
  4. Chen, X.-L.; Shan, X.-J.; Wang, M.-M.; Liu, C.-G.; Han, N.-N. Distribution Pattern of Coseismic Landslides Triggered by the 2017 Jiuzhaigou Ms 7.0 Earthquake of China: Control of Seismic Landslide Susceptibility. ISPRS Int. J. Geo Inf. 2020, 9, 198. [Google Scholar] [CrossRef] [Green Version]
  5. Zhao, Y. Principles and Methods in Remote Sensing Application and Analysis; Science Press: Beijing, China, 2003; pp. 188–190. [Google Scholar]
  6. Solari, L.; Del Soldato, M.; Raspini, F.; Barra, A.; Bianchini, S.; Confuorto, P.; Casagli, N.; Crosetto, M. Review of Satellite Interferometry for Landslide Detection in Italy. Remote Sens. 2020, 12, 1351. [Google Scholar] [CrossRef]
  7. Lv, Z.Y.; Shi, W.; Zhang, X.; Benediktsson, J.A. Landslide Inventory Mapping From Bitemporal High-Resolution Remote Sensing Images Using Change Detection and Multiscale Segmentation. IEEE J. Sel. Top. Appl. Earth Obs. Remote Sens. 2018, 11, 1520–1532. [Google Scholar] [CrossRef]
  8. Barbarella, M.; Di Benedetto, A.; Fiani, M.; Guida, D.; Lugli, A. Use of DEMs Derived from TLS and HRSI Data for Landslide Feature Recognition. ISPRS Int. J. Geo Inf. 2018, 7, 160. [Google Scholar] [CrossRef] [Green Version]
  9. Ding, C.; Feng, G.; Zhou, Y.; Wang, H.; Du, Y.; Chen, C. Nepal Earthquake Triggered Landslides Recognition and Deformation Analysis of Avalanches’ Region. Geomat. Inf. Sci. Wuhan Univ. 2018, 43, 847–854. [Google Scholar]
  10. Zhao, Y. The Research of Building Earthquake Damage Change Detection Based on Object-Oriented Technology with Remote Sensing Image. Ph.D. Thesis, China University of Geosciences, Beijing, China, 2017. [Google Scholar]
  11. Wang, Q.; Lin, Q.; Li, M.; Wang, L.; Tian, Q. A Target-Highlighting Method in Multispectral Remote Sensing. Spectrosc. Spectr. Anal. 2009, 29, 1018–1022. [Google Scholar]
  12. Nichol, J.; Wong, M.S. Satellite remote sensing for detailed landslide inventories using change detection and image fusion. Int. J. Remote Sens. 2005, 26, 12–21. [Google Scholar] [CrossRef]
  13. Chen, T.; He, H.; Li, D.; An, P.; Hui, Z. Damage Signature Generation of Revetment Surface along Urban Rivers Using UAV-Based Mapping. ISPRS Int. J. Geo-Inf. 2020, 9, 283. [Google Scholar] [CrossRef]
  14. Lu, P.; Qin, Y.; Li, Z.; Mondini, A.C.; Casagli, N. Landslide mapping from multi-sensor data through improved change detection-based Markov random field. Remote Sens. Environ. 2019, 231, 235–248. [Google Scholar] [CrossRef]
  15. Stumpf, A.; Kerle, N. Object-oriented mapping of landslides using Random Forests. Remote Sens. Environ. 2011, 115, 2564–2577. [Google Scholar] [CrossRef]
  16. Lu, P.; Stumpf, A.; Kerle, N.; Casagli, N. Object-Oriented Change Detection for Landslide Rapid Mapping. IEEE Geosci. Remote Sens. Lett. 2011, 8, 701–705. [Google Scholar] [CrossRef]
  17. Lu, H.; Ma, L.; Fu, X.; Liu, C.; Wang, Z.; Tang, M.; Li, N. Landslides Information Extraction Using Object-Oriented Image Analysis Paradigm Based on Deep Learning and Transfer Learning. Remote Sens. 2020, 12, 752. [Google Scholar] [CrossRef] [Green Version]
  18. Mondini, A.C.; Guzzetti, F.; Reichenbach, P.; Rossi, M.; Cardinali, M.; Ardizzone, F. Semi-automatic recognition and mapping of rainfall induced shallow landslides using optical satellite images. Remote Sens. Environ. 2011, 115, 1743–1757. [Google Scholar] [CrossRef]
  19. Liu, P.; Wei, Y.; Wang, Q.; Chen, Y.; Xie, J. Research on Post-Earthquake Landslide Extraction Algorithm Based on Improved U-Net Model. Remote Sens. 2020, 12, 894. [Google Scholar] [CrossRef] [Green Version]
  20. Thouret, J.C.; Kassouk, Z.; Gupta, A.; Liew, S.C.; Solikhin, A. Tracing the evolution of 2010 Merapi volcanic deposits (Indonesia) based on object-oriented classification and analysis of multi-temporal, very high resolution images. Remote Sens. Environ. 2015, 170, 350–371. [Google Scholar] [CrossRef]
  21. Ronneberger, O.; Fischer, P.; Brox, T. U-Net: Convolutional Networks for Biomedical Image Segmentation. In Proceedings of the International Conference on Medical Image Computing and Computer-Assisted Intervention, Munich, Germany, 5–9 October 2015; Springer: Cham, Switzerland, 2015; pp. 234–241. [Google Scholar]
  22. Chen, L.C.; Papandreou, G.; Kokkinos, I.; Murphy, K.; Yuille, A.L. DeepLab: Semantic Image Segmentation with Deep Convolutional Nets, Atrous Convolution, and Fully Connected CRFs. IEEE Trans. Pattern Anal. Mach. Intell. 2018, 40, 834–848. [Google Scholar] [CrossRef]
  23. Badrinarayanan, V.; Kendall, A.; Cipolla, R. Segnet: A deep convolutional encoder-decoder architecture for image seg-mentation. IEEE Trans. Pattern Anal. Mach. Intell. 2017, 26, 11–21. [Google Scholar]
  24. Redmon, J.; Farhadi, A. YOLO9000: Better, faster, stronger. In Proceedings of IEEE Conference on Computer Vision and Pattern Recognition, Honolulu, HI, USA, 26–29 July 2017; pp. 7263–7271. [Google Scholar]
  25. Chan, T.-H.; Jia, K.; Gao, S.; Lu, J.; Zeng, Z.; Ma, Y. PCANet: A Simple Deep Learning Baseline for Image Classification? IEEE Trans. Image Process. 2015, 24, 5017–5032. [Google Scholar] [CrossRef] [Green Version]
  26. Simonyan, K.; Zisserman, A. Very Deep Convolutional Networks for Large-Scale Image Recognition. Comput. Sci. 2014, 59, 62–78. [Google Scholar]
  27. LeCun, Y.; Bengio, Y.; Hinton, G. Deep learning. Nature 2015, 521, 436–444. [Google Scholar] [CrossRef]
  28. Xu, Z.; Chen, Y.; Yang, F.; Chu, T.; Zhou, H. A Postearthquake Multiple Scene Recognition Model Based on Classical SSD Method and Transfer Learning. ISPRS Int. J. Geo-Inf. 2020, 9, 238. [Google Scholar] [CrossRef]
  29. Lei, T.; Zhang, Y.; Lv, Z.; Li, S.; Liu, S.; Nandi, A.K. Landslide Inventory Mapping From Bitemporal Images Using Deep Convolutional Neural Networks. IEEE Geosci. Remote Sens. Lett. 2019, 16, 982–986. [Google Scholar] [CrossRef]
  30. Hong, Y.; Yi, M.; Wang, L.; Zhai, Y.; Wang, X. A landslide intelligent detection method based on CNN and RSG_R. In Proceedings of the IEEE International Conference on Mechatronics and Automation, Takamatsu, Japan, 6–9 August 2017; pp. 444–448. [Google Scholar]
  31. Ding, A.; Zhang, Q.; Zhou, X.; Dai, B. Automatic recognition of landslide based on CNN and texture change detection. In Proceedings of the Chinese Association of Automation, Jinan, China, 22–26 July 2016; pp. 444–448. [Google Scholar]
  32. Ghorbanzadeh, O.; Blaschke, T.; Gholamnia, K.; Meena, S.R.; Tiede, D.; Aryal, J. Evaluation of Different Machine Learning Methods and Deep-Learning Convolutional Neural Networks for Landslide Detection. Remote Sens. 2019, 11, 196. [Google Scholar] [CrossRef] [Green Version]
  33. Zhang, Q.; Wang, J.; Lei, D. Research on Landslide Detection Based on Deep Learning Target Detection Algorithm. Inf. Commun. 2019, 193, 16–18. [Google Scholar]
  34. Ren, S.; He, K.; Girshick, R.; Sun, J. Faster R-CNN: Towards Real-Time Object Detection with Region Proposal Networks. IEEE Trans. Pattern Anal. Mach. Intell. 2017, 39, 1137–1149. [Google Scholar] [CrossRef] [Green Version]
  35. Redmon, J.; Farhadi, A. YOLOv3: An Incremental Improvement. arXiv 2018, arXiv:1804.02767. [Google Scholar]
  36. Liu, W.; Anguelov, D.; Erhan, D.; Szegedy, C.; Reed, S.; Fu, C.Y. SSD: Single Shot MultiBox Detector. In Proceeding of the European Conference on Computer Vision, Amsterdam, The Netherlands, 8–14 October 2016; Springer: Cham, Switzerland; pp. 735–740. [Google Scholar]
  37. Wang, H.; Zhang, L.; Yin, K.; Luo, H.; Li, J. Landslide identification using machine learning. Geosci. Front. 2020, 28, 29–38. [Google Scholar] [CrossRef]
  38. He, K.; Georgia, G.; Piotr, D.; Ross, G. Mask R-CNN. IEEE Trans. Pattern Anal. Mach. Intell. 2017, 42, 386–397. [Google Scholar] [CrossRef] [PubMed]
  39. Girshick, R. Fast R-CNN. In Proceedings of the IEEE International Conference on Computer Vision, Boston, MA, USA, 26–29 July 2015; pp. 1440–1448. [Google Scholar]
  40. Girshick, R.; Donahue, J.; Darrell, T.; Malik, J. Rich Feature Hierarchies for Accurate Object Detection and Semantic Segmentation. In Proceedings of the IEEE Conference on Computer Vision and Pattern Recognition, Columbus, OH, USA, 26–29 July 2014; pp. 580–587. [Google Scholar]
  41. Lin, T.Y.; Dollár, P.; Girshick, R.; He, K.; Hariharan, B.; Belongie, S. Feature Pyramid Networks for Object Detection. In Proceedings of the IEEE International Conference on Computer Vision and Pattern Recognition, Honolulu, HI, USA, 26–29 July 2017; pp. 2117–2125. [Google Scholar]
  42. He, K.; Zhang, X.; Ren, S.; Sun, J. Deep Residual Learning for Image Recognition. In Proceedings of the IEEE Conference on Computer Vision and Pattern Recognition, Las Vegas, NV, USA, 27–29 July 2016; pp. 770–778. [Google Scholar]
  43. Xie, S.; Girshick, R.; Dollár, P.; Tu, Z.; He, K. Aggregated Residual Transformations for Deep Neural Networks. In Proceedings of the IEEE Conference on Computer Vision and Pattern Recognition, Honolulu, HI, USA, 26–29 July 2017; pp. 1492–1500. [Google Scholar]
  44. Zimmermann, R.S.; Siems, J.N. Faster training of Mask R-CNN by focusing on instance boundaries. Comput. Vision Image Underst. 2019, 188, 102–110. [Google Scholar] [CrossRef] [Green Version]
  45. Liu, Y. Study on Instance Segmentation Algorithms Based on Mask R-CNN. Master’s Thesis, Huazhong University of Science and Technology, Hubei, China, 2019. [Google Scholar]
  46. Ying-Dong, Q.; Cheng-Song, C.; San-Ben, C.; Jin-Quan, L. A fast subpixel edge detection method using Sobel-Zernike moments operator. Image Vis Comput. Image Vision Comput. 2005, 23, 11–17. [Google Scholar] [CrossRef]
  47. Garcia-Garcia, A.; Orts-Escolano, S.; Oprea, S.; Villena-Martinez, V.; Garcia-Rodriguez, J. A Review on Deep Learning Techniques Applied to Semantic Segmentation. arXiv 2017, arXiv:1704.06857. [Google Scholar]
  48. Lin, T.Y.; Maire, M.; Belongie, S.; Hays, J.; Zitnick, C.L. Microsoft coco: Common objects in context. In Proceedings of the European Conference on Computer Vision, Cham, Switzerland, 6–12 September 2014; pp. 740–755. [Google Scholar]
Figure 1. Mask R-CNN model structure diagram.
Ijgi 10 00168 g001
Figure 2. RoI Align process.
Ijgi 10 00168 g002
Figure 3. The comparison structure of ResNet (left) and ResNeXt (right) network blocks.
Ijgi 10 00168 g003
Figure 4. (1) Original structure of Mask R-CNN. (2) Path structure improved in this paper.
Ijgi 10 00168 g004
Figure 5. Edge consistency error calculation auxiliary network.
Ijgi 10 00168 g005
Figure 6. Mask R-CNN flowchart.
Ijgi 10 00168 g006
Figure 7. Study area location.
Ijgi 10 00168 g007
Figure 8. Location of training area and test area.
Ijgi 10 00168 g008
Figure 9. Parts of field verification.
Ijgi 10 00168 g009
Figure 10. Data set production.
Ijgi 10 00168 g010
Figure 11. Training loss curve of five models.
Ijgi 10 00168 g011
Figure 12. Extraction results.
Ijgi 10 00168 g012
Figure 13. Error landslides extractions. (a) Originally visual interpretation. (b) Extractions of ResNeXt50. (c) Extractions of ResNeXt50 + Improved FPN. (d) Extractions of ResNeXt50 + Improved FPN + L e d g e .
Ijgi 10 00168 g013
Figure 14. Missed landslide extractions. (a) Originally visual interpretation. (b) Extractions of ResNeXt50. (c) Extractions of ResNeXt50 + Improved FPN. (d) Extractions of ResNeXt50 + Improved FPN + L e d g e .
Ijgi 10 00168 g014
Figure 15. Landslides edge extractions. (a) Originally visual interpretation. (b) Edge extractions of ResNeXt50. (c) Edge extractions of ResNeXt50 + Improved FPN. (d) Edge extractions of ResNeXt50 + Improved FPN + L e d g e .
Ijgi 10 00168 g015
Table 1. Feature extraction network structure comparison table.
StageOutputResNet-50ResNeXt-50
Conv1 112   ×   112 7   ×   7 , 64, stride2 7   ×   7 , 64, stride2
3   ×   3 , max pool, stride2 3   ×   3 , max pool, stride2
Conv2 56   ×   56 1   ×   1   64 3   ×   3   64 1   ×   1   256 ×   3 1   ×   1   128 3   ×   3   128 1   ×   1   256 , C = 32 ×   3
Conv3 28   ×   28 1   ×   1   128 3   ×   3   128 1   ×   1   512 ×   3 1   ×   1   256 3   ×   3   256 1   ×   1   512 , C = 32 ×   3
Conv4 14   ×   14 1   ×   1   256 3   ×   3   256 1   ×   1   1024 ×   3 1   ×   1   512 3   ×   3   512 1   ×   1   1024 , C = 32 ×   3
Conv5 7   ×   7 1   ×   1   512 3   ×   3   512 1   ×   1   2048 ×   3 1   ×   1   1024 3   ×   3   1024 1   ×   1   2048 , C = 32 ×   3
1   ×   1 Global average pool
1000-d fc, softmax
Global average pool
1000-d fc, softmax
#params 25.5   ×   10 6 25.0   ×   10 6
FLOPs 4.1   ×   10 9 4.2   ×   10 9
Table 2. Confusion matrix of predicted and real results.
Real ResultsLandslidesOthers
Predicted Results
LandslidesTrue Positive (TP)False Positive (FP)
OthersFalse Negative (FN)True Negative (TN)
Table 3. Deep learning model training parameters.
NameParameter
Learning Rate0.0001
Batch Size4
Epoch200
Steps-Per-Epoch2440
Table 4. Comparison of Mask R-CNN and two improved models.
Precision/%Recall/%OA/%mIoU/%F1/%
ResNeXt5081.979.784.873.284.5
ResNeXt50 + Improved FPN86.788.887.978.287.7
ResNeXt50 + Improved FPN + L e d g e 95.893.194.789.694.5
Publisher’s Note: MDPI stays neutral with regard to jurisdictional claims in published maps and institutional affiliations.

