Article

The Influence of Spatial Grid Division on the Layout Analysis of Urban Functional Areas

1
School of Geomatics and Urban Spatial Informatics, Beijing University of Civil Engineering and Architecture, Beijing 102616, China
2
Beijing Advanced Innovation Center for Future Urban Design, Beijing University of Civil Engineering and Architecture, Beijing 100044, China
*
Author to whom correspondence should be addressed.
ISPRS Int. J. Geo-Inf. 2021, 10(3), 189; https://0-doi-org.brum.beds.ac.uk/10.3390/ijgi10030189
Submission received: 30 December 2020 / Revised: 21 February 2021 / Accepted: 19 March 2021 / Published: 22 March 2021
(This article belongs to the Special Issue Geospatial Methods in Social and Behavioral Sciences)

Abstract

:
The identification of urban functional areas is essential for urban planning and sustainable development. Spatial grids are the basic units for the implementation of urban plans and management by cities or development zones. The emergence of internet “big data” provides new ideas for the identification of urban functional areas. Based on point of interest (POI) data from Baidu Maps, the Xicheng District of Beijing was divided into grids with side lengths of 200, 500, and 1000 m in this study. The kernel density method was used to analyze the spatial structure of POI data. Two indicators, that is, the frequency density and category ratio, were then used to identify single- and mixed-functional areas. The results show that (1) commercial and financial areas are concentrated in the city center and multiple business centers have not developed; (2) scenic areas account for the largest proportion of single-functional areas in the Xicheng District of Beijing, followed by education and training, residence, and party and government organizations areas; and (3) the 200 × 200 m and 500 × 500 m grids are the most suitable for the identification of single- and mixed-functional areas, respectively.

1. Introduction

With the rapid development of cities, the urban spatial structure is not unchanged. It is also in a dynamic process of constant change, and in order to satisfy the daily needs of residents and the development of various industries, all kinds of types of cities have gradually formed. Urban functional areas refer to the division of areas according to the main functions of the city, forming relatively independent and connected functional areas, for example: recreational areas, commercial areas, residential areas, and other functional areas, etc. The rational layout and formation of urban functional areas can reduce the cost of living expenses, of traffic congestion, and of production logistics. These features effectively reduce the cost of large-scale production in cities, improve the quality of life and work efficiency of urban residents, and attract more other small0town residents to live in the city. At the same time, rapidly and reasonably identifying urban functional areas (1) can promote the development of various industries in the city; (2) can obtain the functions and characteristics of various spatial planning of the city, as the basic information of land planning; and (3) is of great significance for the effective allocation of resources and urban planning [1]. Research on the division and identification of urban functional areas must be conducted to obtain the smallest land unit of a city [2]. Two units can be used to organize the urban spatial morphology: grid and patch. Compared with the block mode, the grid mode focuses on space, showing superior order. Especially in terms of land division and management, a grid city is characterized by efficient and systematic land management and planning as well as land development volume and density [3,4]. The concept of a smart city and refined urban management leads to greater demands on the collection and organization of city information. Based on the division of the spatial grid using grid management, a collaborative work mode is used for the same grid. It is necessary to master various urban resources and information to achieve the purpose of urban resource system management and integration at all spatial levels from streets to plots [5,6]. Currently, urban functional areas are mainly identified by dividing cities into patch areas based on the urban road network [7]. However, there is a lack of studies of the division and identification of urban functional areas using grids. Grids have not been studied in detail with respect to the correlations among the size, number, and division and identification of urban functional areas. In addition, the increase in “big data” has led to new ideas for the identification of urban functional areas. Point of interest (POI) data are emerging point-shaped spatial data, which represent geographic entities such as bus stops, parks, shopping malls, and schools. They contain the name, category, longitude, and latitude of geographic entities. Compared with traditional data, POI data are large, easily accessible data, which reflect the spatial structure and function distribution of urban social and economic development and are widely used for the identification of urban centers, extraction of boundaries, and determination of temporal and spatial population changes [8,9,10].
In this study, POI data were used as follows: (1) kernel density analysis was used to analyze the spatial distribution of POI data, and the development trend of the city was determined from a macroscopic perspective based on the local POI distribution density and characteristics; (2) the city was divided into 200 × 200 m, 500 × 500 m, and 1000 × 1000 m grids using two indicators, that is, the frequency density (FD) and category ratio (CR), to quantitatively divide and identify urban functional areas based on POI data; and (3) urban single- and mixed-functional areas were visualized, and statistics were used to analyze the effect of the size of the segmented grid on the division and identification of urban functional areas. This research is of great significance for the division and identification of urban functional areas. On the one hand, POI data are large and rich in urban spatial information. The analysis of distribution characteristics can be used to determine the urban spatial structure and supplement existing research. On the other hand, the division and identification of urban functional areas based on POI data provides guidance and references for urban planners with respect to identifying the urban spatial structure and development patterns and formulating reasonable urban planning strategies.

2. Related Research

At present, an increasing number of data types is emerging because of the development of various sensors. The division and identification of urban functional areas is mainly based on the urban road network, POI, traffic trajectory, census information, remote-sensing image, and social platform data.
Sun et al. used the residential population and employment densities to compare and analyze the development of urban centers from time series [11]. Wang et al. used urban traffic trajectory data to identify functional areas in Beijing [12]. Zhong et al. used traffic trajectory data to create a directed graph, employed clustering and spatial analysis methods to detect urban centers and spatial structures and quantitatively detect urban activity centers and morphological changes [13,14]. Zhao et al. used location-based service data from 2015 to construct a relationship matrix, which fully describes the population migration in eastern and central China and analyzed the population of 31 provinces and cities in China based on the law of population migration, spatial patterns, and factors affecting migration [15]. Based on travel behavior data from 2010 and 2015 and kernel density analysis, Zhou et al. determined the boundary changes of Nanjing and then used multiple logit models to evaluate the effect of urban economic development on the residents’ choices of transportation modes [16]. Based on the super object theory, Zhou et al. used remote-sensing images as data sources and SO-CNN convolutional neural networks to divide and identify urban functional areas [17]. Liu et al. extracted human activity patterns based on remote-sensing image land-use classification in combination with POI data and a taxi trajectory and superimposed the two data to achieve fine-grained urban functional area identification [18]. Song et al. combined multiple remote-sensing images, location-based service data (LBS), and nighttime light data (NTL) to identify urban functional areas [19]. Yan et al. used the coefficient of variation and Theil index to evaluate the urban economy based on DMSP/OLS NTL and utilized the standard deviation ellipse and spatial Markov chain (spatial Markov chain) to analyze the temporal and spatial characteristics of urban economic development [20]. Zheng et al. used the Google Earth Engine cloud platform in combination with daytime remote-sensing images and NTL remote-sensing data for the Yangtze River Delta Urban Agglomeration (YAR’ADUA) to perform spatiotemporal feature analysis to determine the status of the environment and urbanization intensity [21]. Deng et al. used density contour tree and POI data to analyze the structure and spatiotemporal characteristics of an urban center [22]. Yi et al. employed POI data and proposed a statistical significance test method (Fisher exact test method) for the quantitative identification of urban functional areas [23]. Zhang et al. combined the complex graph theory with OSM and POI data to divide a city into road networks, as the smallest research unit to identify a city’s functional areas [24]. Lu et al. used POI data, the nearest-neighbor index, location entropy, and other methods to analyze the cluster-discrete spatial distribution structure [25]. Xing et al. combined POI data with semantic information and architecture at the object level (building area, edge, and structure) and used the random forest method to identify urban functional areas [26]. Liu et al. combined POI data and NTL data to extract high-density luminous leisure and POI areas and superimposed the data to determine the distribution of nighttime leisure activities in Beijing [27]. Chen et al. proposed a new method of co-location patterns based on POI data is proposed to identify and analyze the commonality and particularity of the spatial structure of 25 urban functional areas [28]. Andrade et al. developed a new program to automatically collect POI data, selected the most suitable POI data type for land-use classification, and used a convolutional neural network ANN to automatically identify urban functional areas [29].
In most previous studies, image and census data were used as data sources. However, census data are generally based on a survey containing population information and are affected by the sample size. They cannot reflect the distribution of the urban population in detail. Social media data have the same shortcomings. Remote-sensing image data used for the top-down design of urban structures cannot present the spatial structure of the city in detail. Therefore, in this study, POI data were used instead of surveys and social media data. Kernel density analysis including two indicators, that is, FD and CR, was employed and the urban grid was used as the smallest land unit to identify urban functional areas and analyze the effects of the number and size of urban grids on the urban spatial distribution. This article is divided into four parts. Section 2 reviews related work. In Section 3, based on POI data and kernel density analysis, the spatial layout of the Xicheng District, Beijing, was analyzed and visualized. In Section 4, the Xicheng District was divided into 200 × 200 m, 500 × 500 m, and 1000 × 1000 m grids using the FD and CR to quantitatively identify single- and mixed-functional areas; and in Section 5, the single- and mixed-functional areas identified in the three different grids were analyzed. In Section 6, the paper is concluded with a brief summary. The overall research framework is shown in Figure 1.

3. Research Area and Data
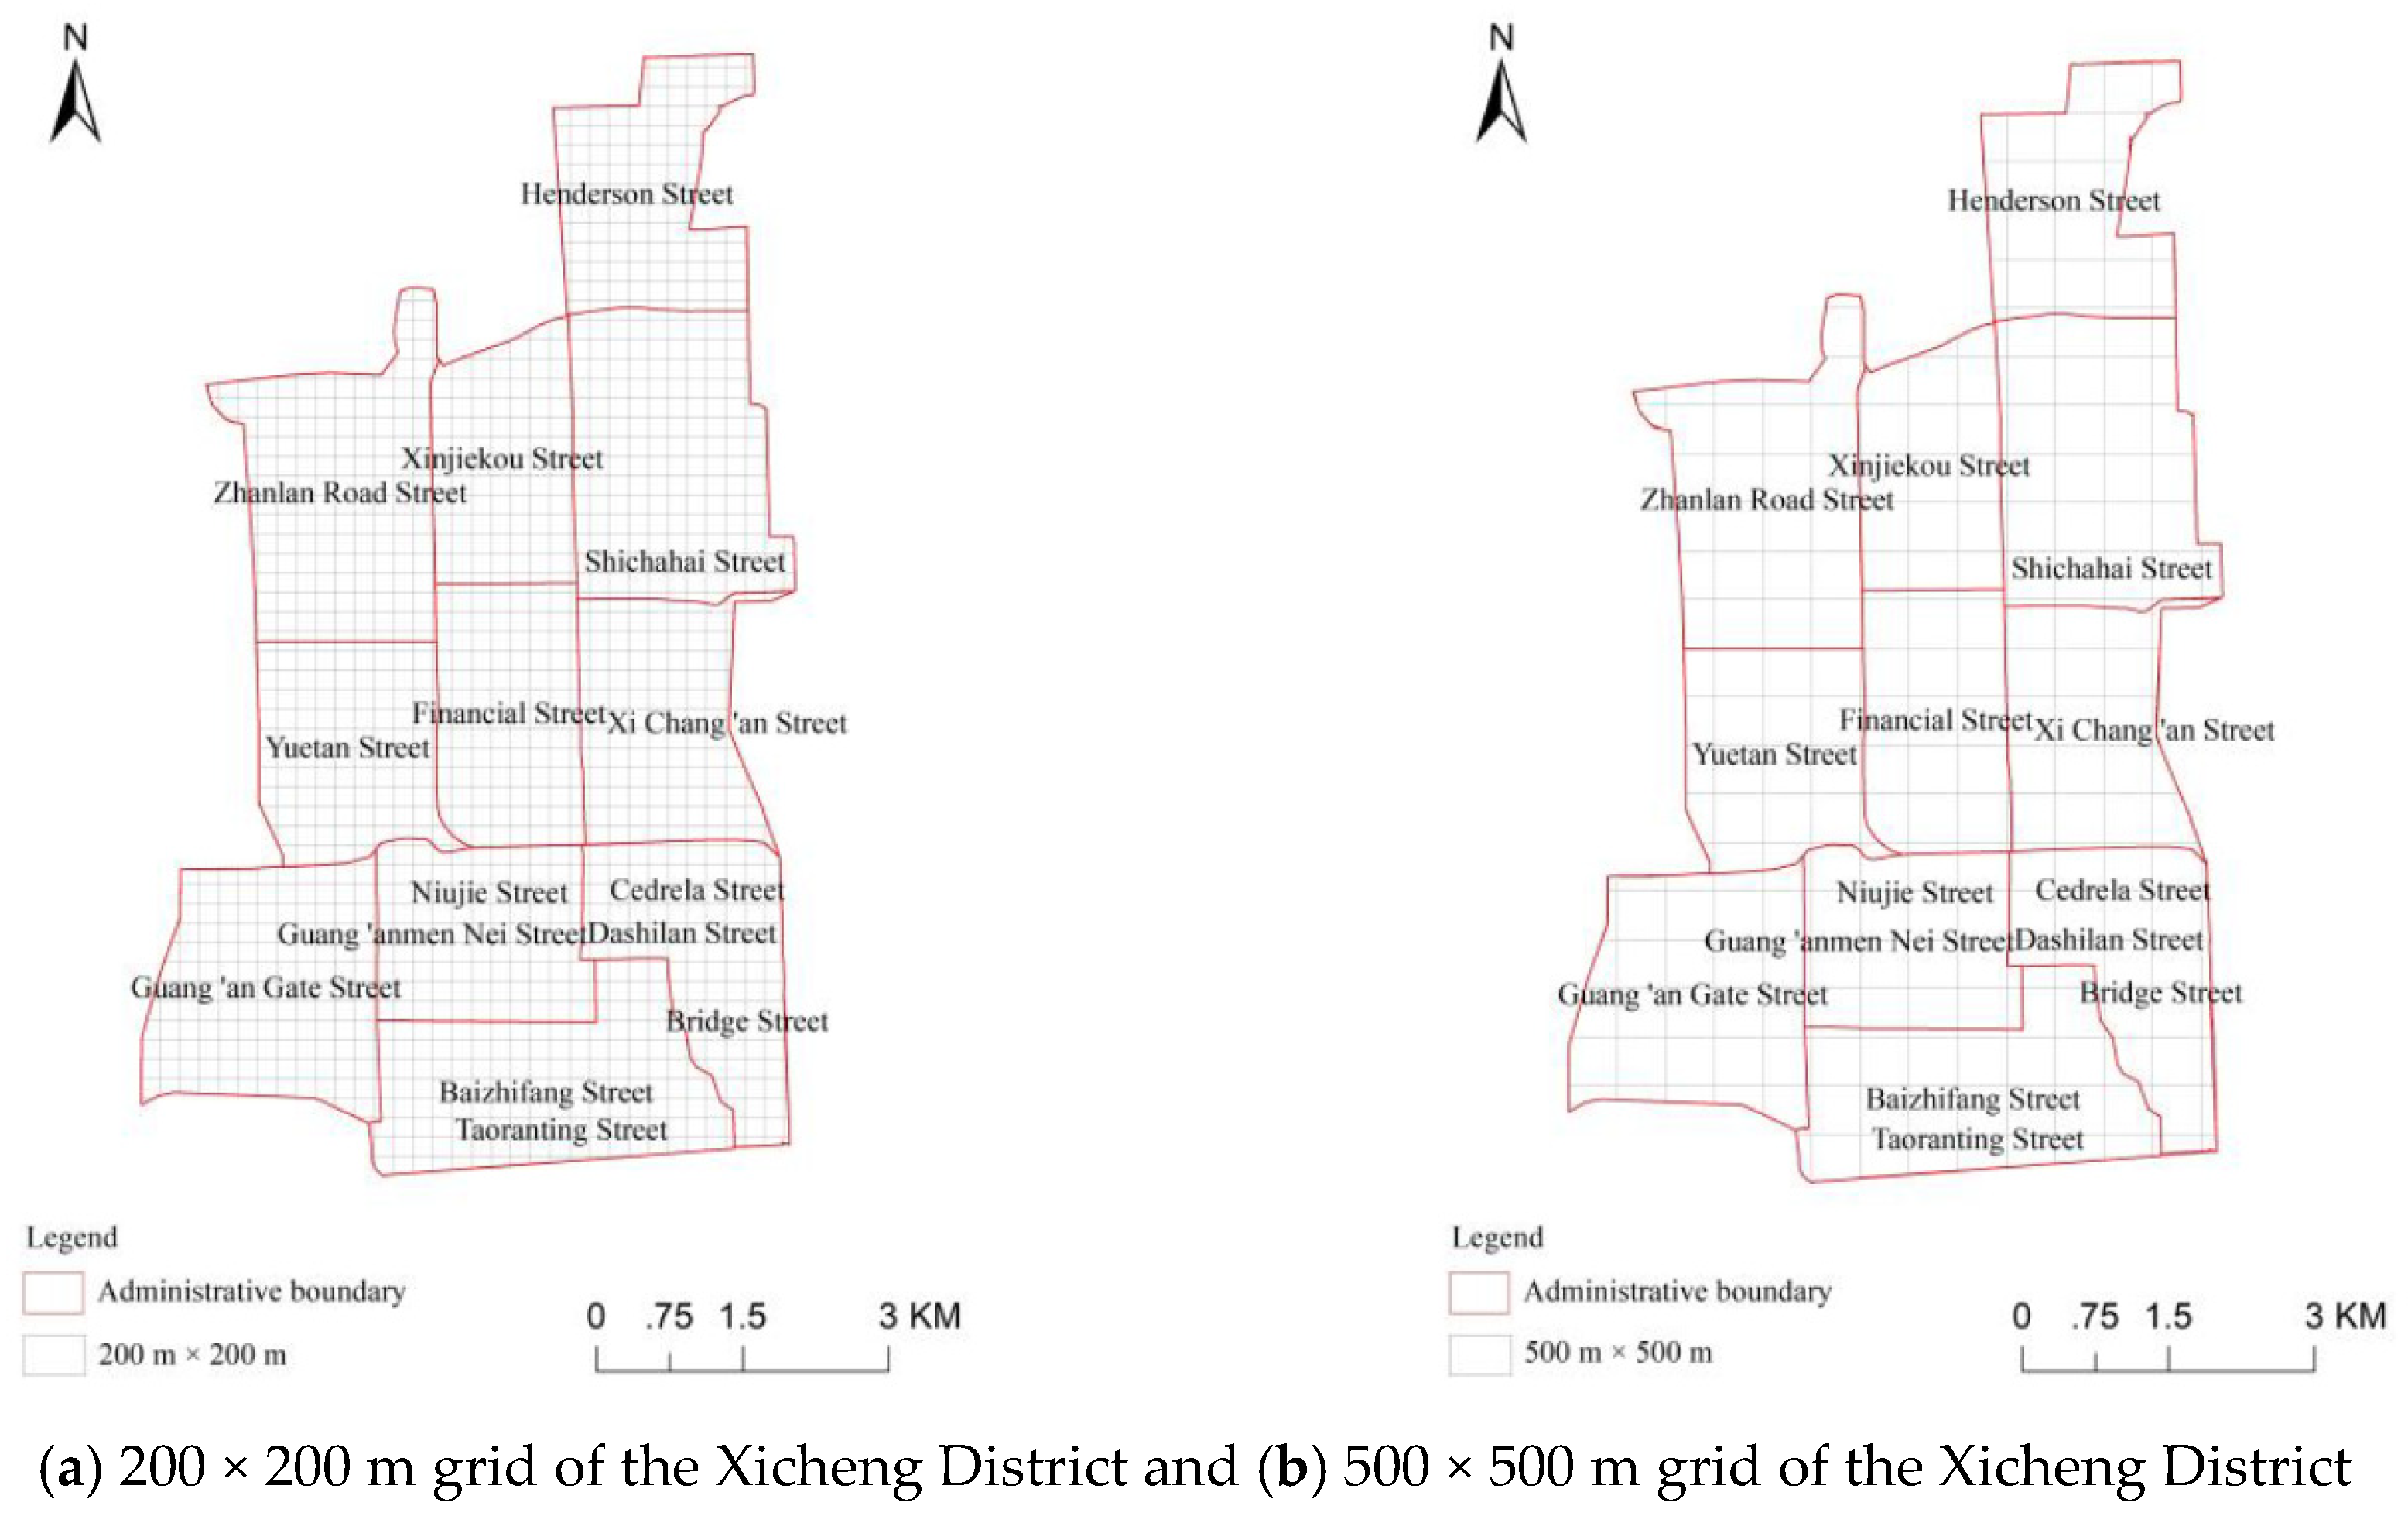
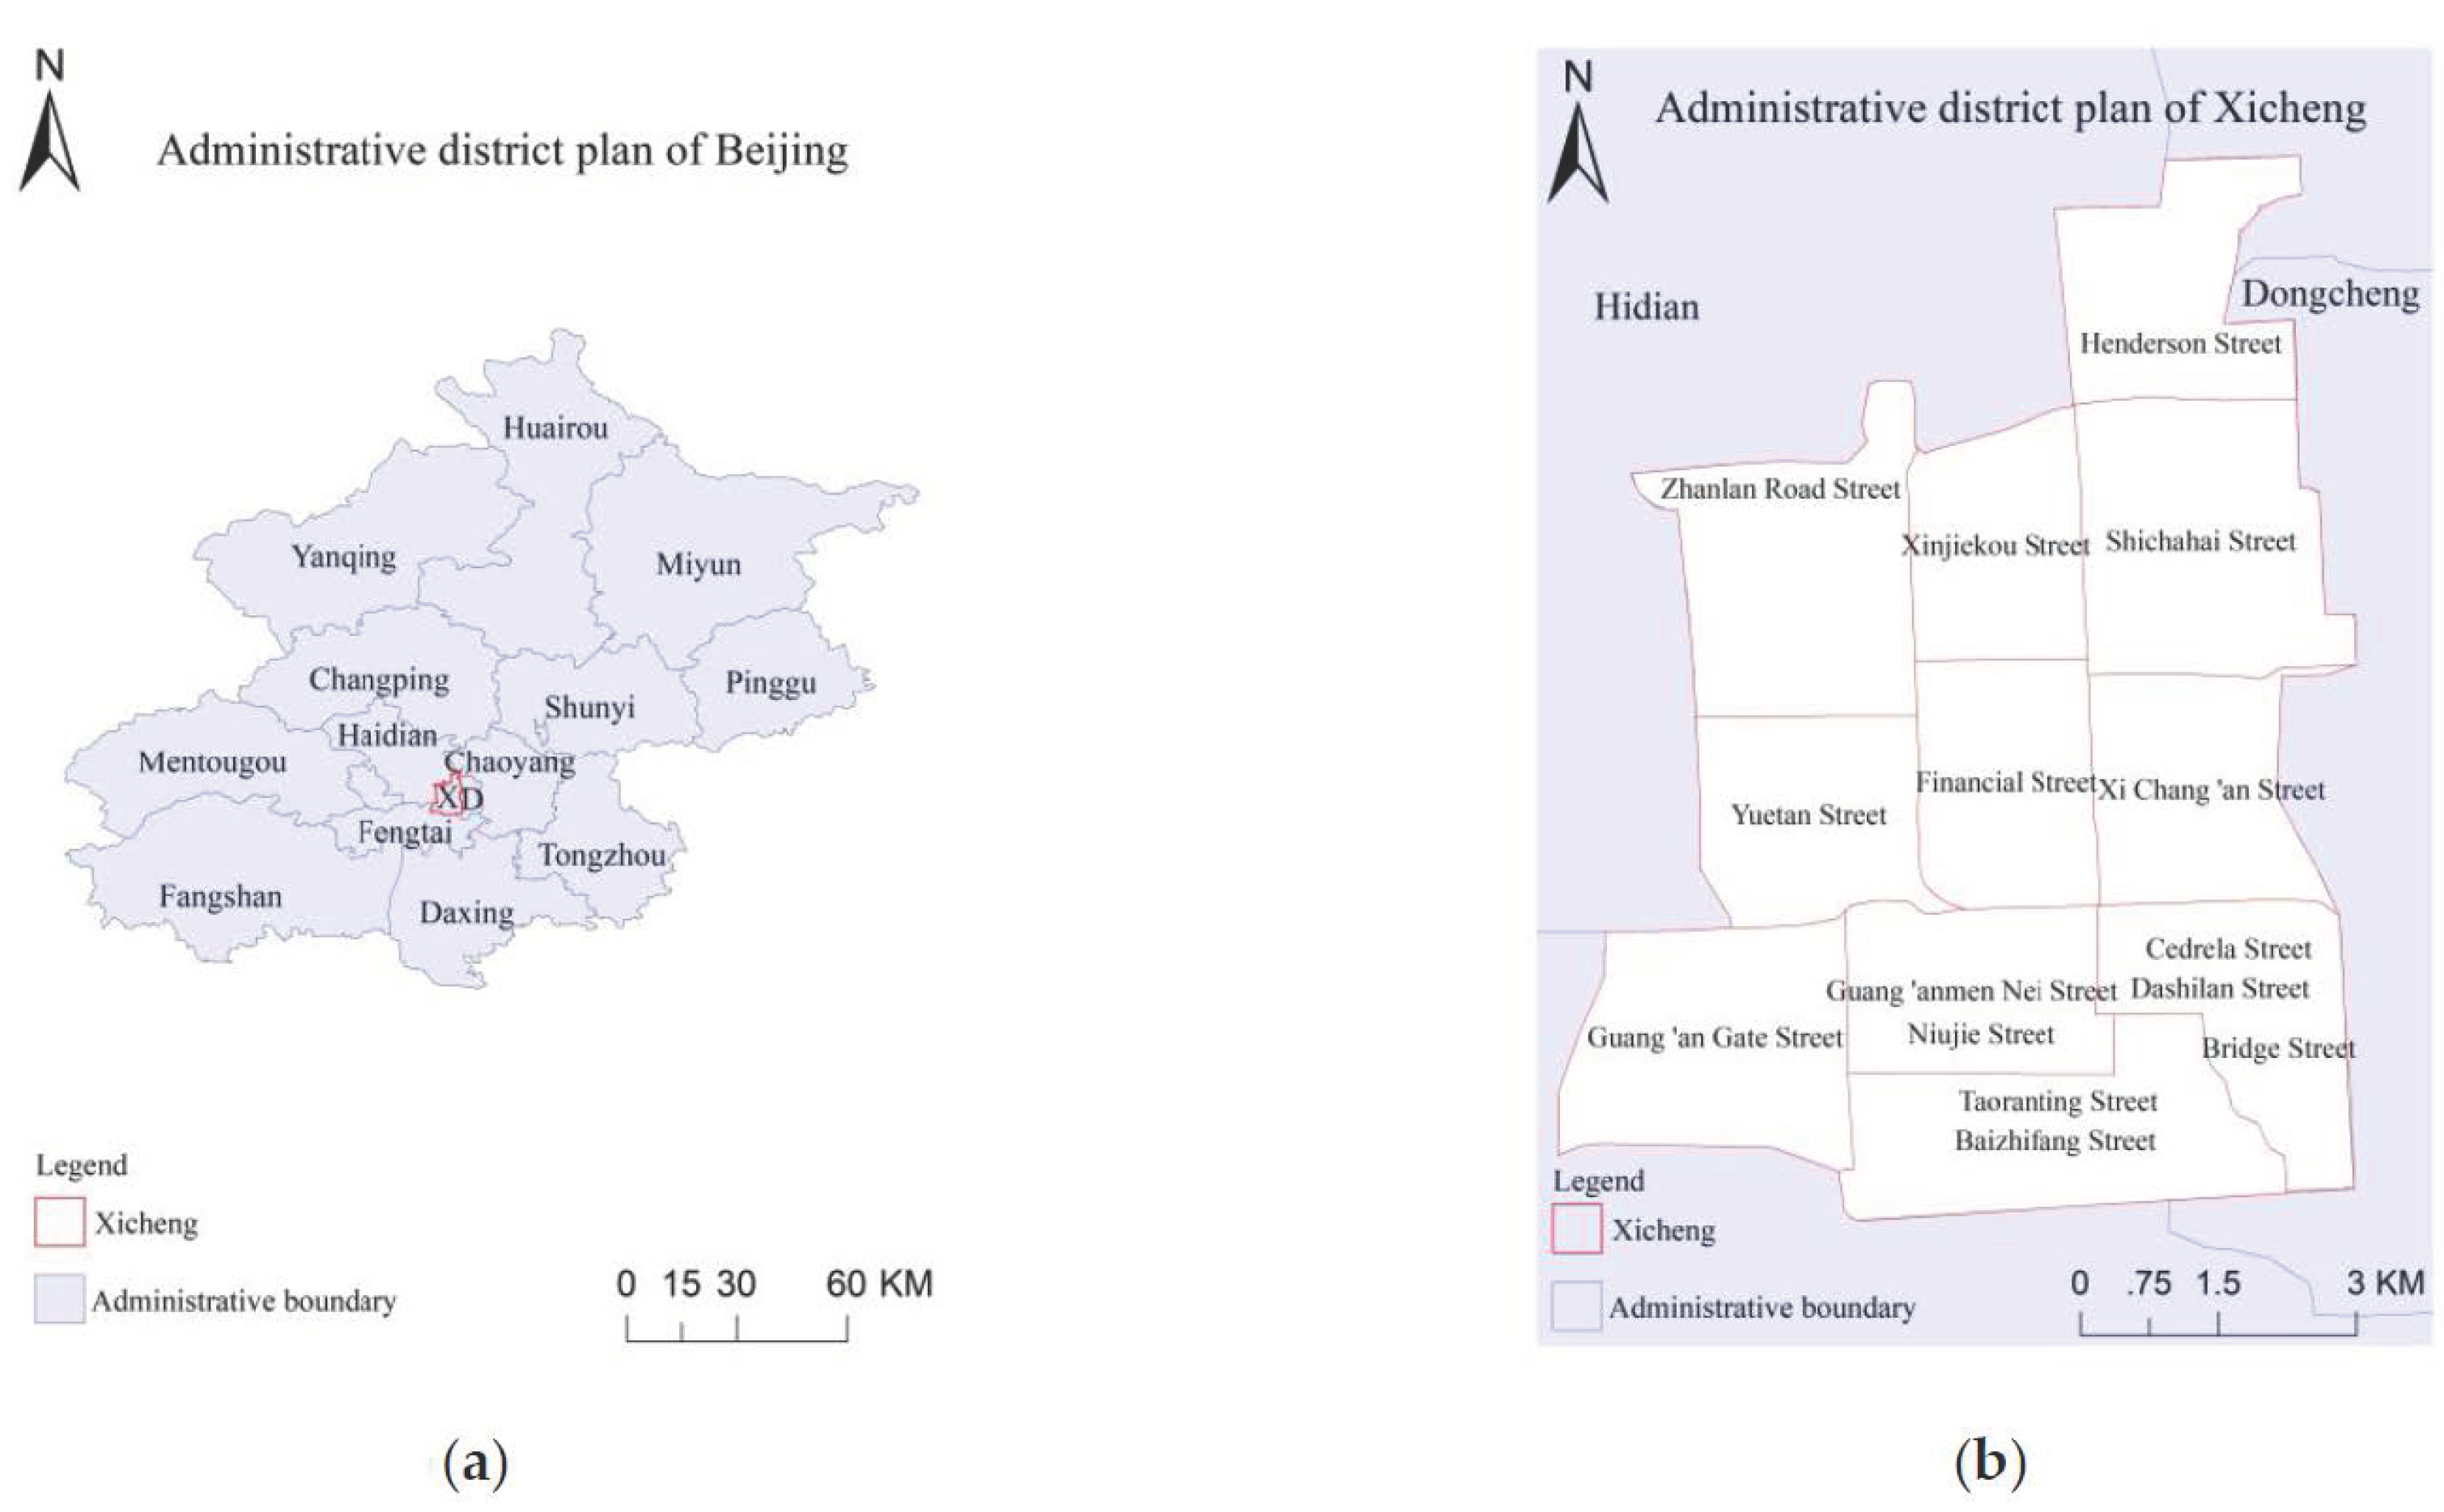
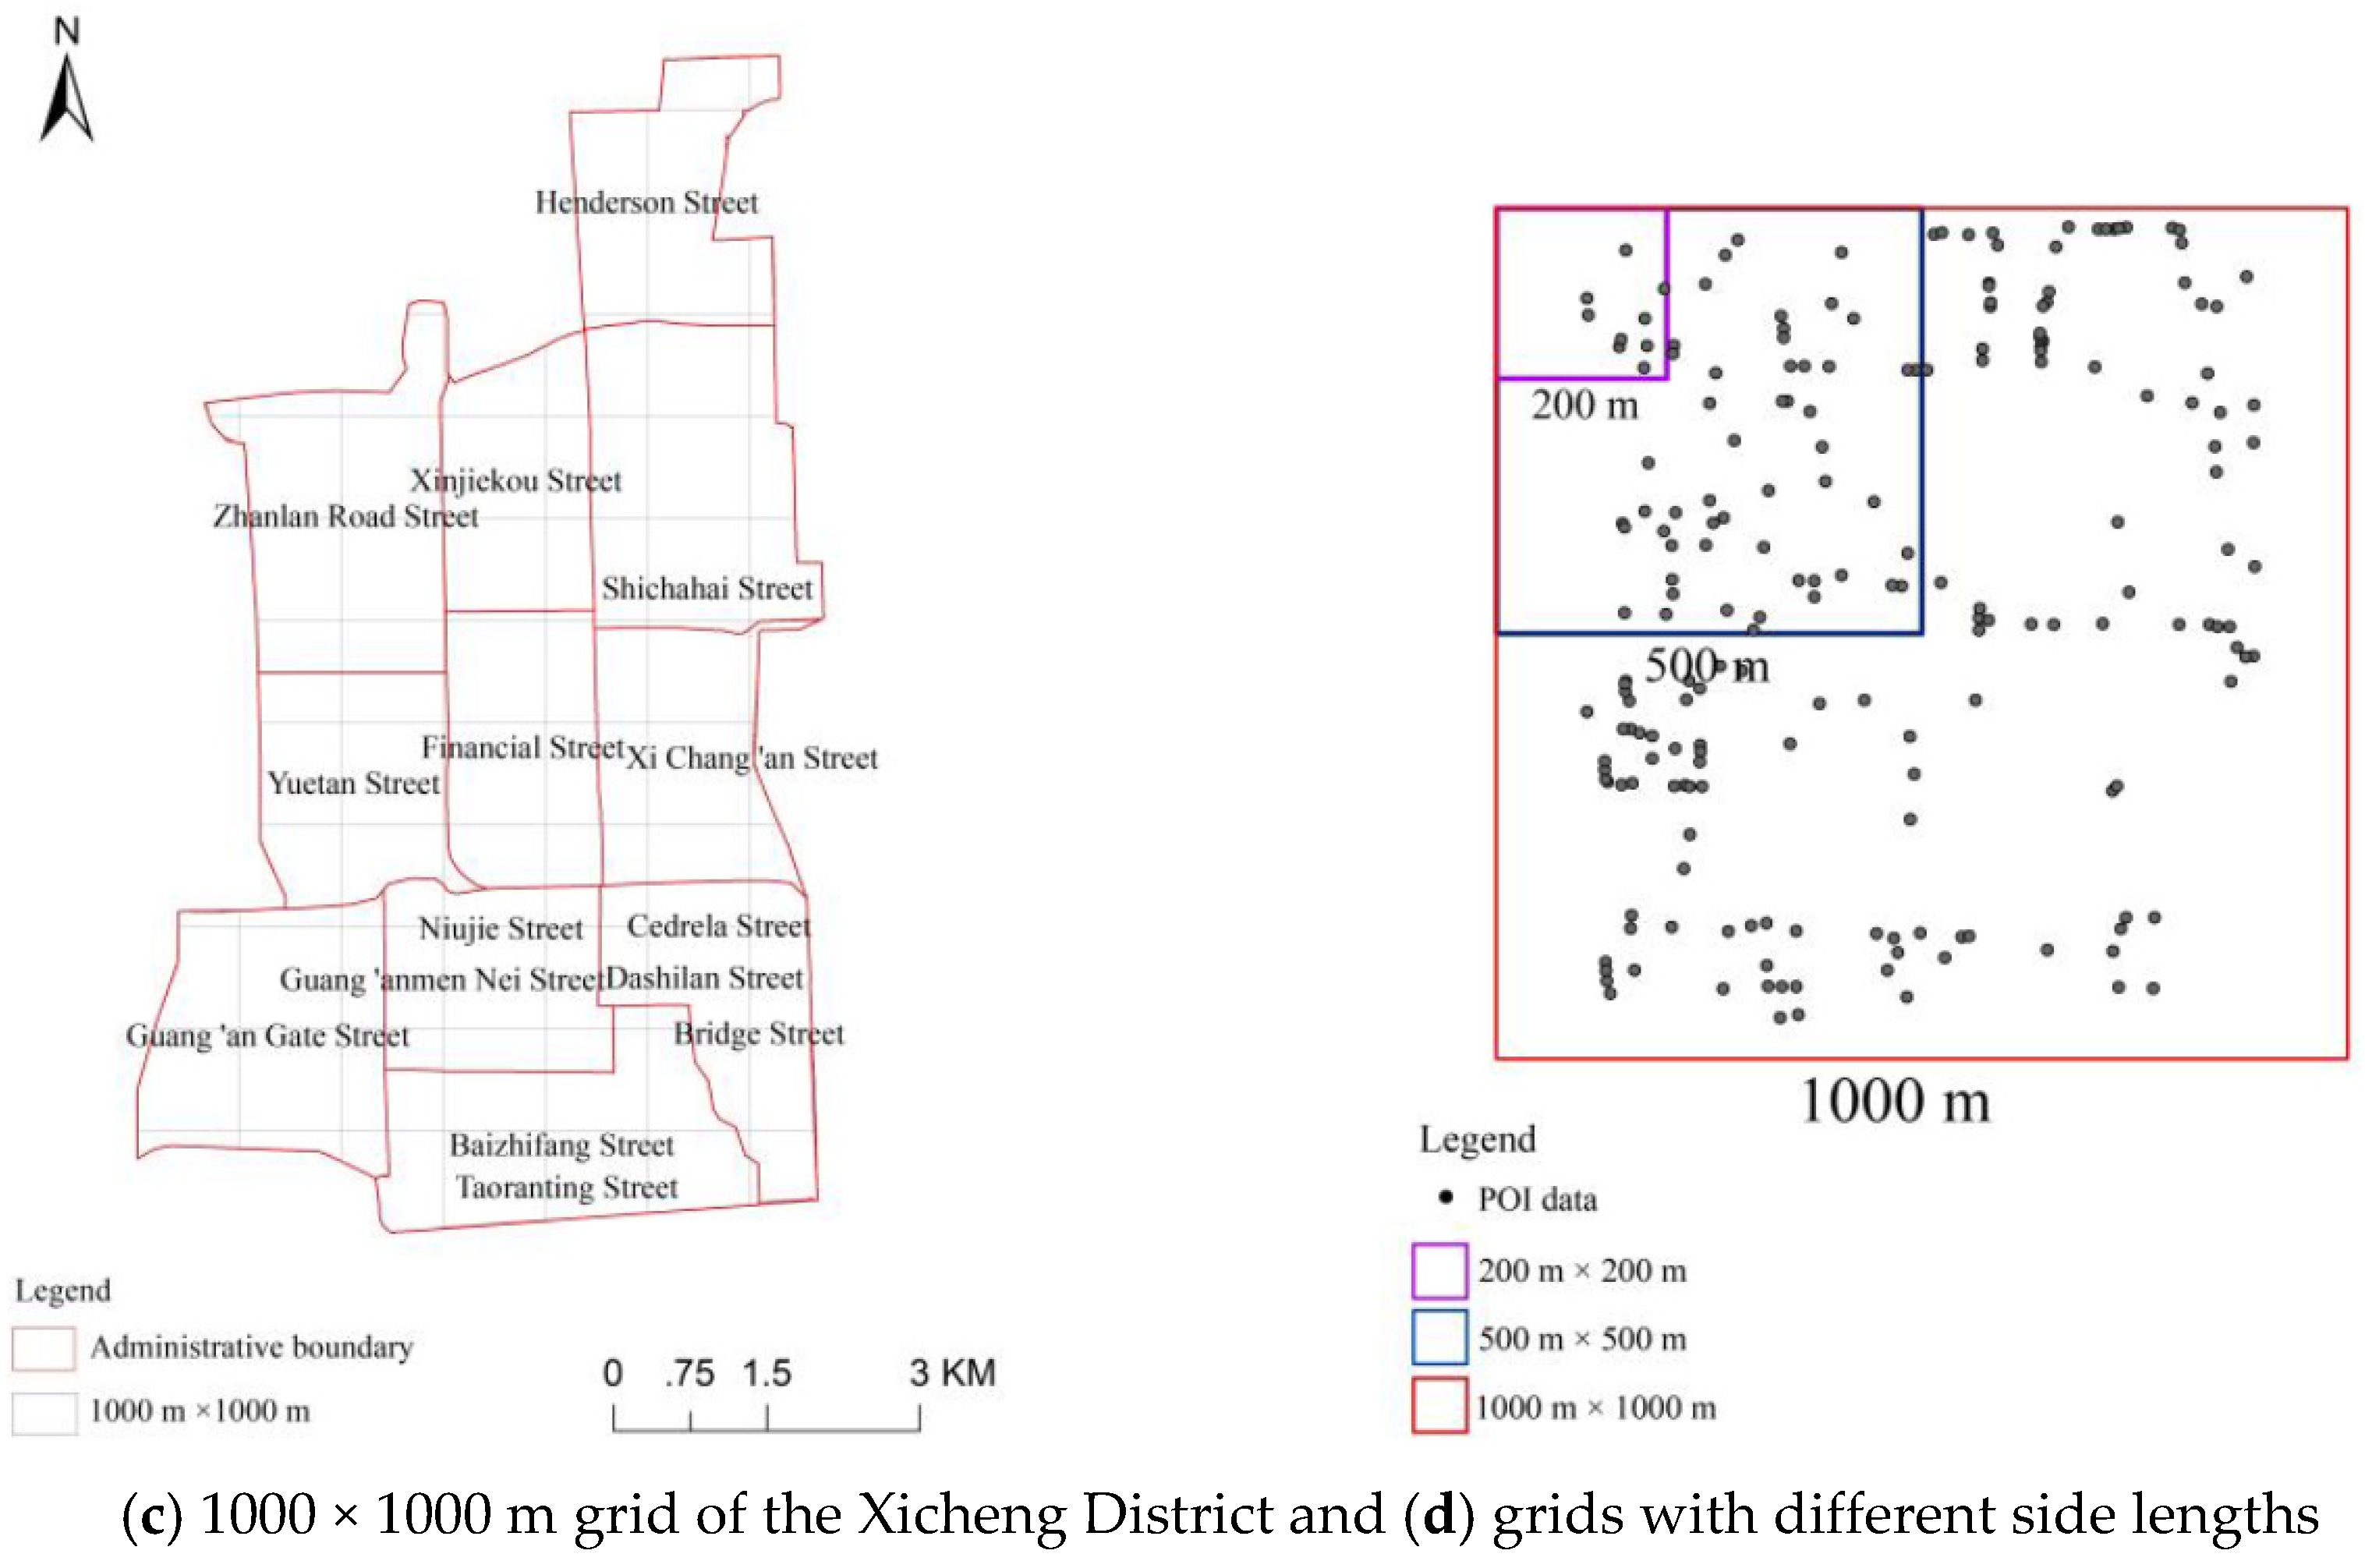
3.1. Study Area

Beijing is the capital of China. The Xicheng District is located west of central Beijing (Figure 2). Various cultures, such as royal and famous cultures, are highly integrated in this area. As of 2019, the district covers an area of 50.7 km2 and has 15 blocks, 261 communities, a permanent population of 1.137 million people, and a gross regional domestic product (GDP) of 500.73 billion RMB. The Xicheng District is the functional core area and political center of the capital. Core areas, including cultural and economic centers, are important for the national image and international exchange. In addition, the Xicheng District is one of Beijing’s old districts, characterized by a mix of old and new buildings, dense population, diverse industries, and numerous municipal facilities and pipelines. Therefore, understanding the urban spatial structure and division of functional areas of the Xicheng District, implementing refined management and development, and stimulating the vitality of the “old city” are important research topics [30,31].

3.2. Data Collection and Processing
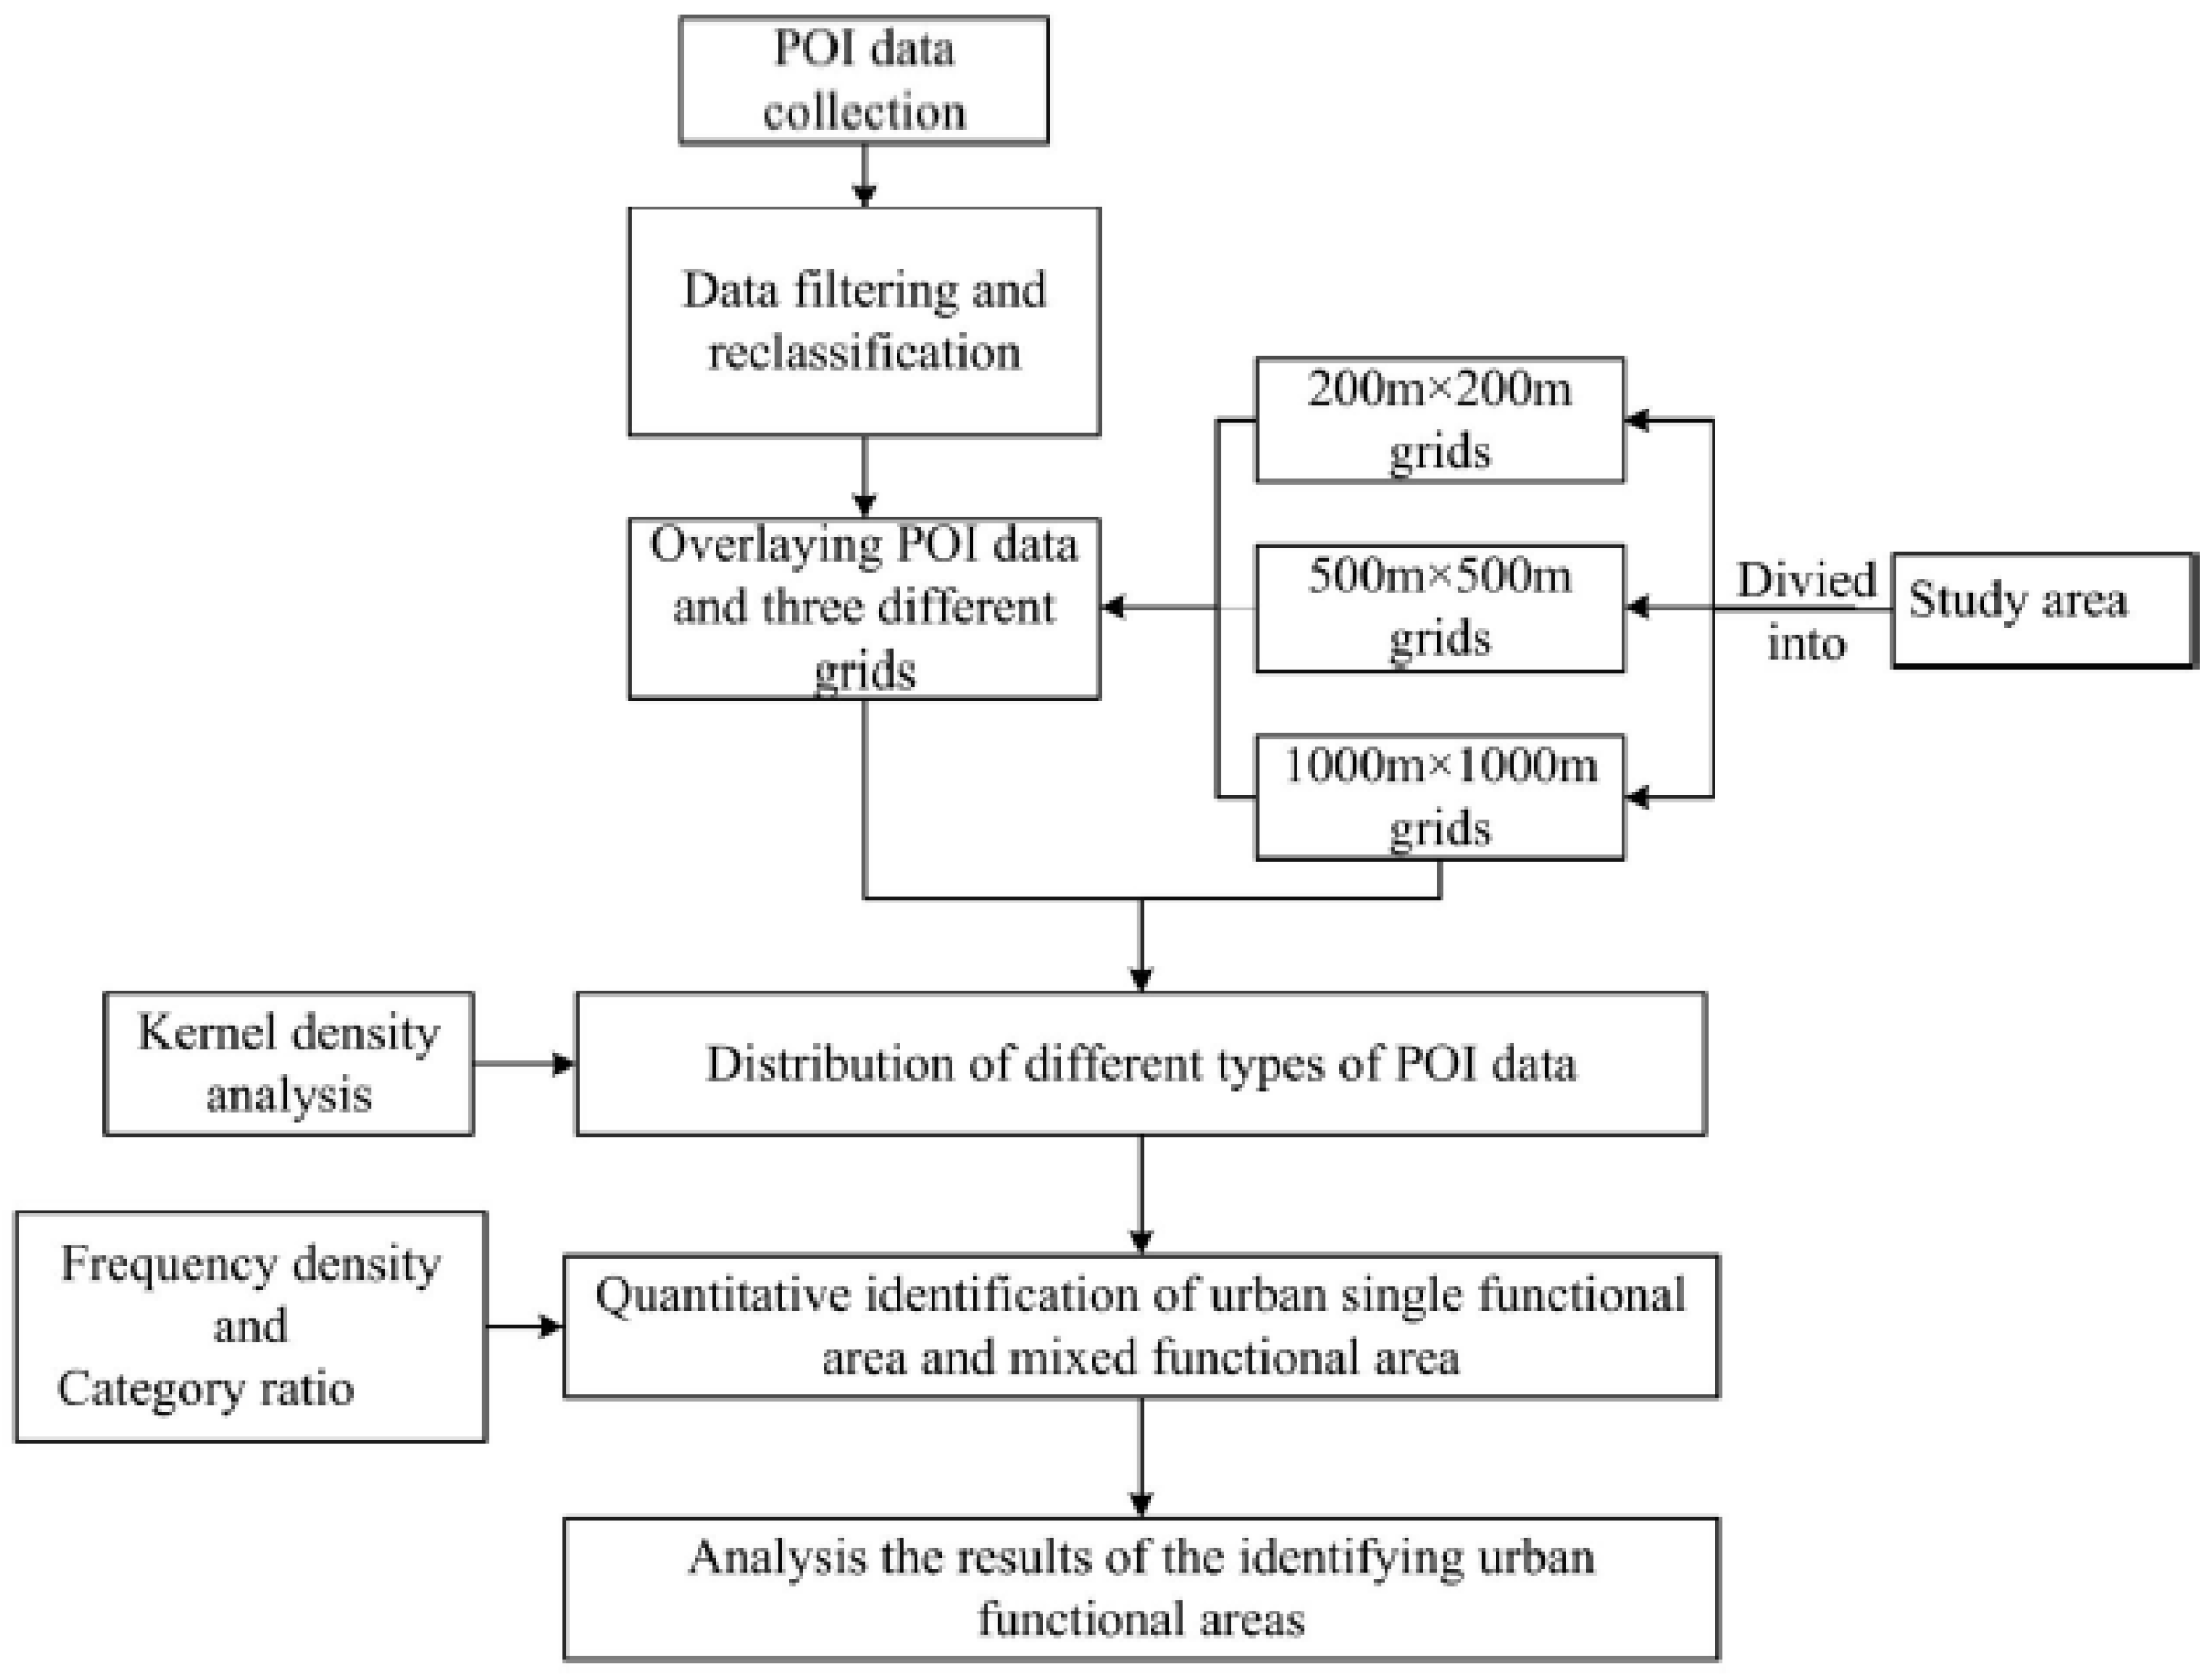
In this study, Baidu Maps was used to obtain POI data and the administrative boundaries of the Xicheng District in Beijing. Based on the POI classification and characteristics of the Xicheng District [32], the POI data were divided into eight first-level categories, which were further divided into second- and third-level categories. The POI data were filtered and reclassified, and data with low public awareness, such as public toilets and newsstands, were removed. Finally, 20,622 POI data points were obtained. The classification is shown in Table 1.

4. Methods

4.1. Kernel Density Analysis

Density analysis can be used to express the spatial distribution structure. It can be used to determine the degree of local aggregation based on the positional relationship between spatial points. It is a statistical analysis process based on spatial smoothing and spatial interpolation technology, which accurately reflects spatial laws. Urban planning, management, and spatial structure characteristics allow for auxiliary decision-making. For example, Sun [33] used remote-sensing images and kernel density analysis to analyze the population density, reflecting the population distribution and social development laws. Zhou [34] and others used kernel density analysis to analyze the correlation between poverty and geographic environment in 124,000 poor villages in China. Common methods used for spatial point density analysis are the square density [35], kernel density, and Voronoi diagram methods [36,37]. (2) Based on both the square density and Voronoi diagram methods, the research area is divided into subareas, and the point density is calculated. Data processing is simple, but the degree of aggregation of spatial points in the subregion and the continuity of spatial phenomena can be easily ignored [38]. The main idea of the kernel density method is to produce a smooth surface above a spatial point A. The surface value is the largest at the position of spatial point A. When the distance between spatial point A and other points increases, the surface value gradually decreases and approaches zero [39]. The density of each point is the sum of all surface values superimposed on that point (Figure 3).
If the spatial points X1, X2, …, Xn are independent and identically distributed random samples with an unknown probability density function f(x), the equation of the probability density function f(x) at any point x in samples based on kernel density estimation is as follows:
f ( x ) = 1 n h i = 1 n K ( x X i h )
where n represents the number of samples; h is the bandwidth, where the optimal bandwidth proposed by Silverman [40] was used in this study; and K(x) is the kernel function. The Gaussian kernel function was used in this study:
K ( x ) = 1 2 π exp ( 1 2 x 2 )   ,   x R ,

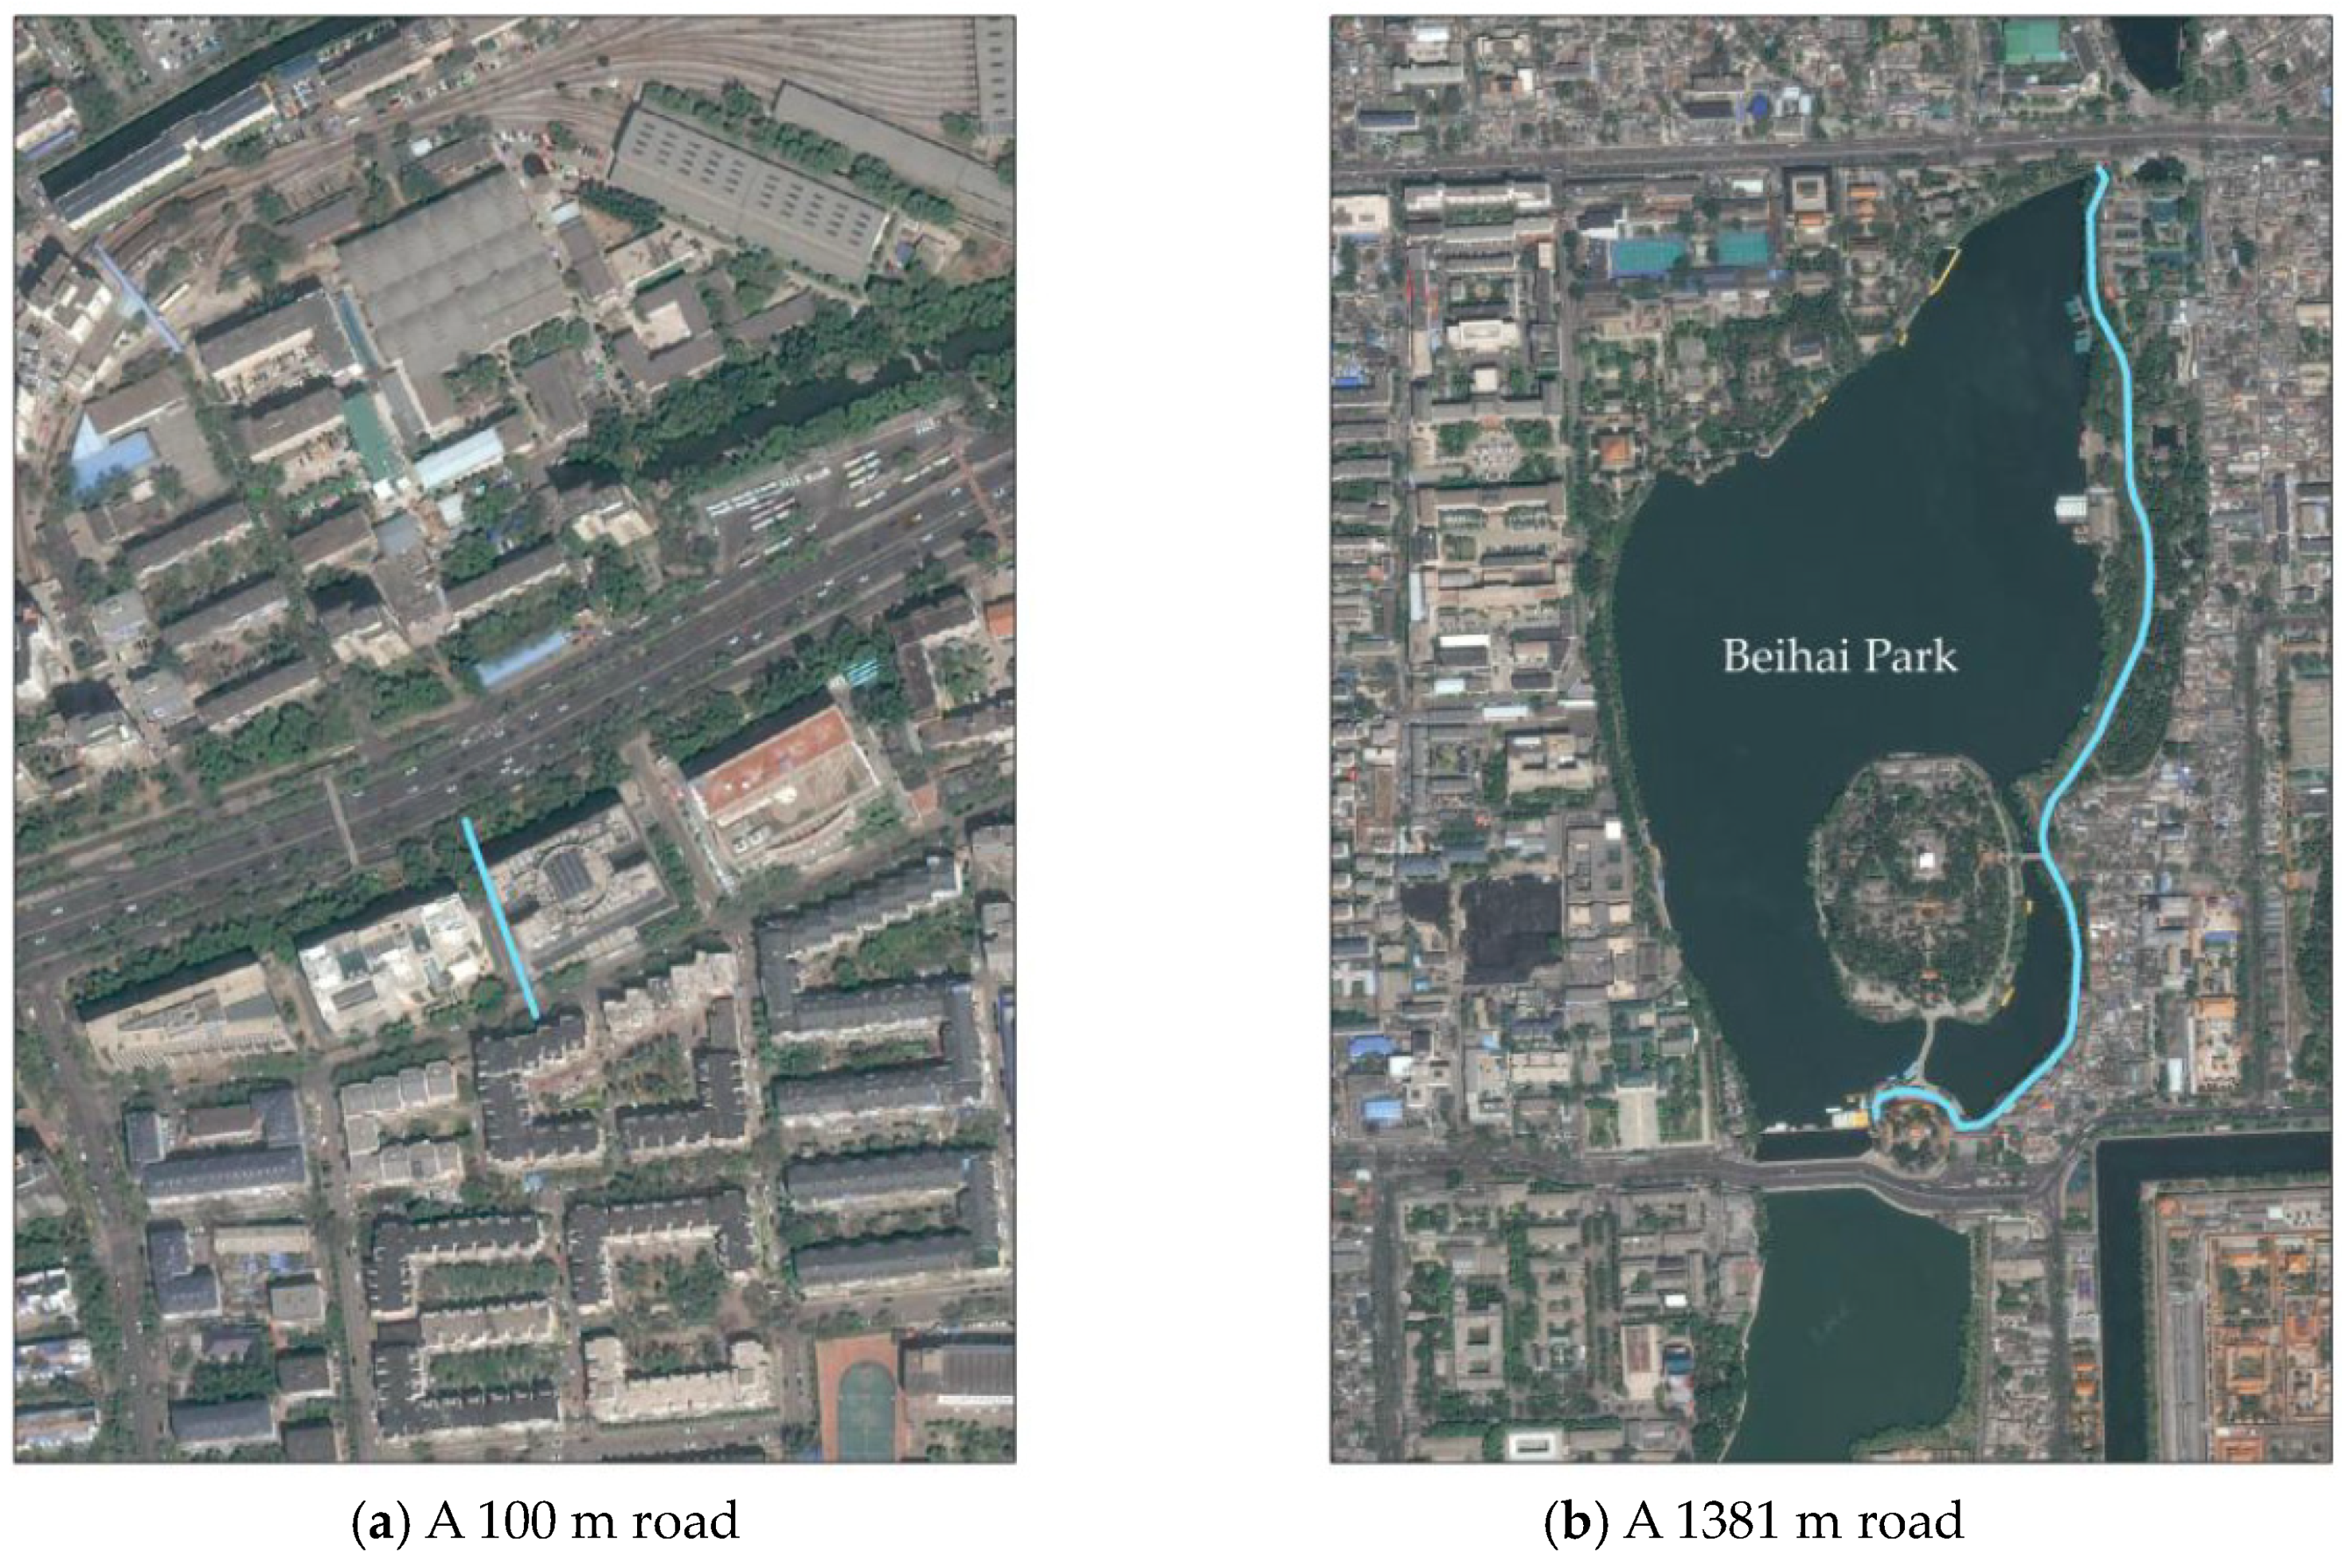
4.2. Grid Size Determination

Since 1929, Graneau, a Finnish geographer, adopted a 1 km grid to analyze social development, geographic analysis based on urban grids of different size has gradually developed into a geological analysis method [41]. With the development of GIS technology, Socioeconomic Data and Applications Center (SEDAC) used the NOAA AVHRR data from 1990 to establish a 1 km grid of population density and land-use relational database; Gallup et al. based on the grids to explore the spatial relationship between land-use status and social economy; Jiang et al., Liao et al., and Tian et al. used various geographic data and socioeconomic development data to establish a 1 km grid data model [42]. What is more, Japan, Finland, the Netherlands and other countries have established grid-based databases, which are widely used in urban development and infrastructure planning [43]. Before identifying urban functional areas, the research area must be divided into several basic research units-grids. According to geometry and division method, the commonly used grid division models are as follows: the model of latitude–longitude grid, adaptive-grid model, regular-polyhedron grid model, and global equal-area quadtree grid model [44]. In previous studies, most grid sizes are divided based on administrative boundary and road network data. Although this method can be divided naturally, calculation results are skipped at the boundary, and the level of detail is not enough. Therefore, in order to reflect the internal spatial structure of the city in detail, the size of the research unit is the key. If the grid size is too large, it cannot reflect the complexity of the city, and if the grid size is too small, the function of the city may also be overanalyzed. The research area in this article is relatively small; therefore, the quadrilateral grids model in the regular-polyhedron grid model was selected as the research unit. We used the density of POI data and the road network data to determine the grid size. A grid must contain a certain number of buildings and sufficient POI data to identify urban functional areas. In other words, when the average density of POI data is large, we think that a grid contains more POI data, and when the standard deviation of the average density of POI data is small, we believe that the amount of POI data contained in each grid is stable. The density of POI data function was used in this study:
f ( x ) = n s ,
where f(x) represents the density of POI data, n represents the number of POI data in a grid, and s represents the area of a grid.

4.3. Quantitative Identification of Functional Areas

After using the kernel density method to analyze the distribution and spatial characteristics of the POI data, two indicators were employed, that is, frequency density (FD) and category ratio (CR), to identify the functional area of each sample square.
F i = n i N i ,
C i = F i i = 0 8 F i ,
where i represents the POI type; ni represents the number of POI data of type i in the sample square; Ni represents the total number of POI data of type i; Fi represents the frequency density of type i POI data in the sample square; and Ci represents the ratio of the frequency density of type i POI data in the sample square to the total frequency density of POI.
When the Ci value of a certain type of POI data in a square is ≥50%, its functional nature is determined by the type of POI data, and it is a single-functional area of that type. When the Ci of all POI types is <50%, its functional nature is determined by the two types of POI data with the largest proportions in the unit sample squares, that is, the mixed-functional area. Sometimes, the sample square does not contain POI data (area without data).

5. Results and Discussion

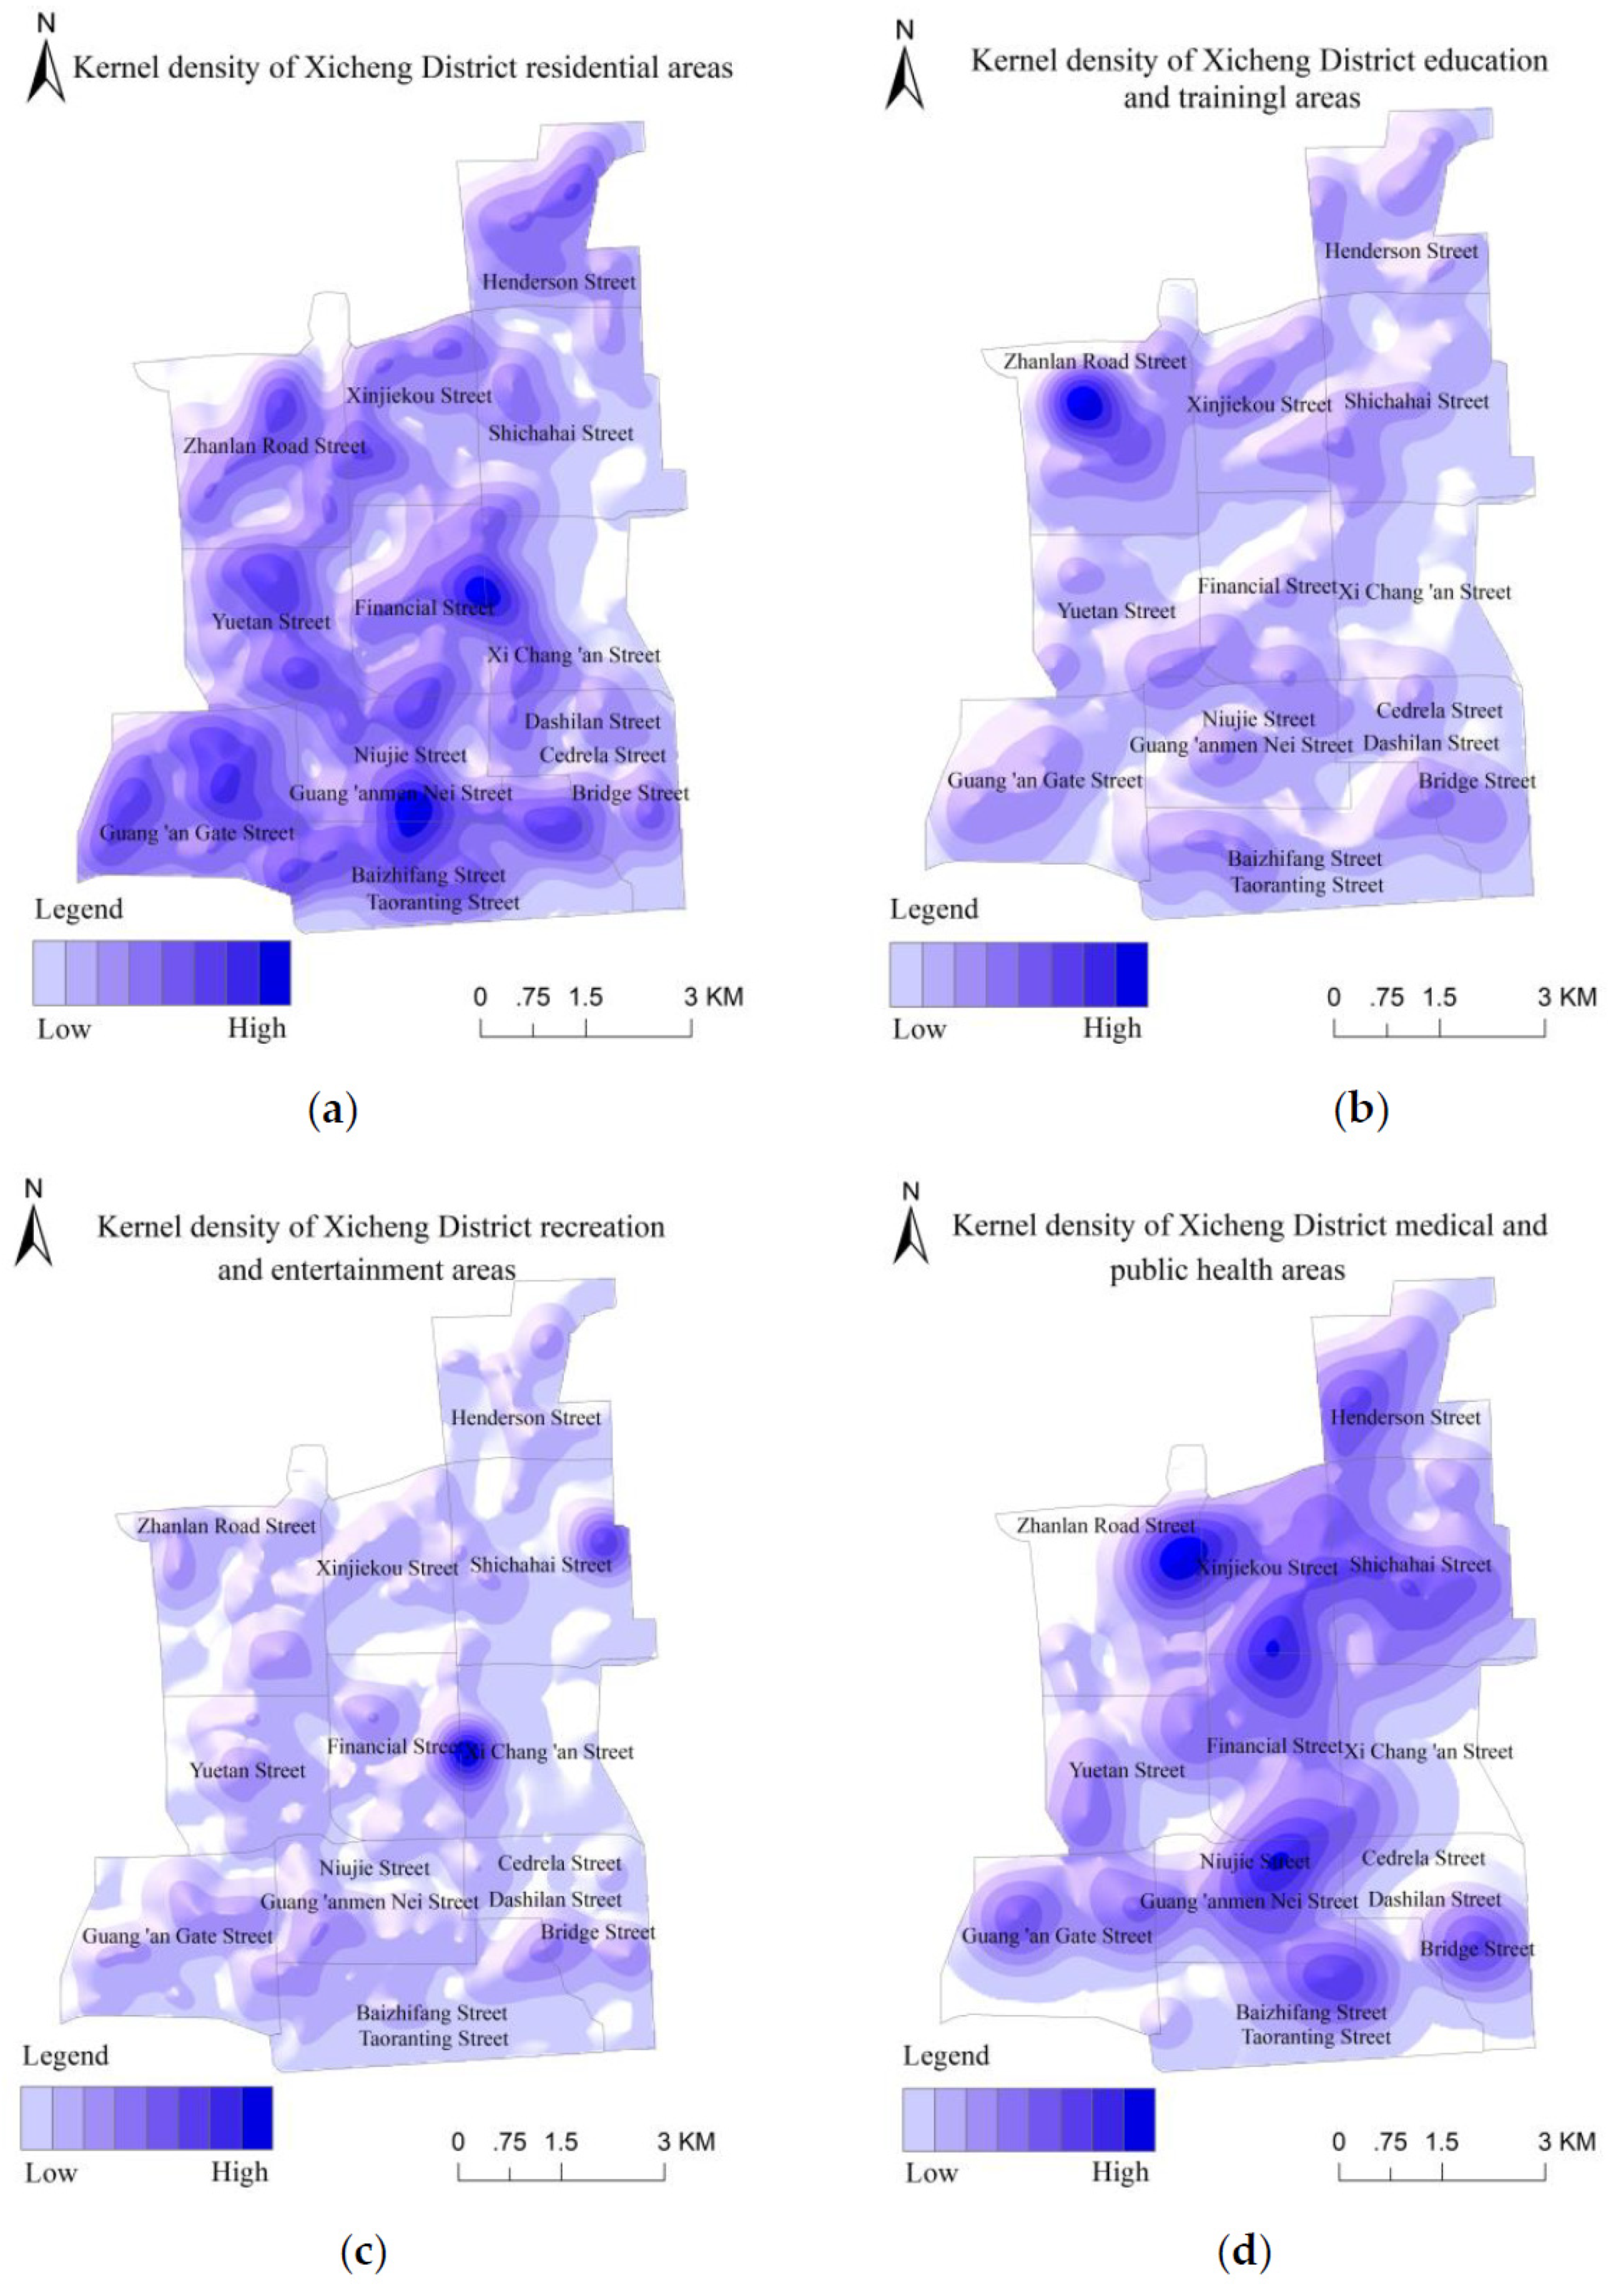
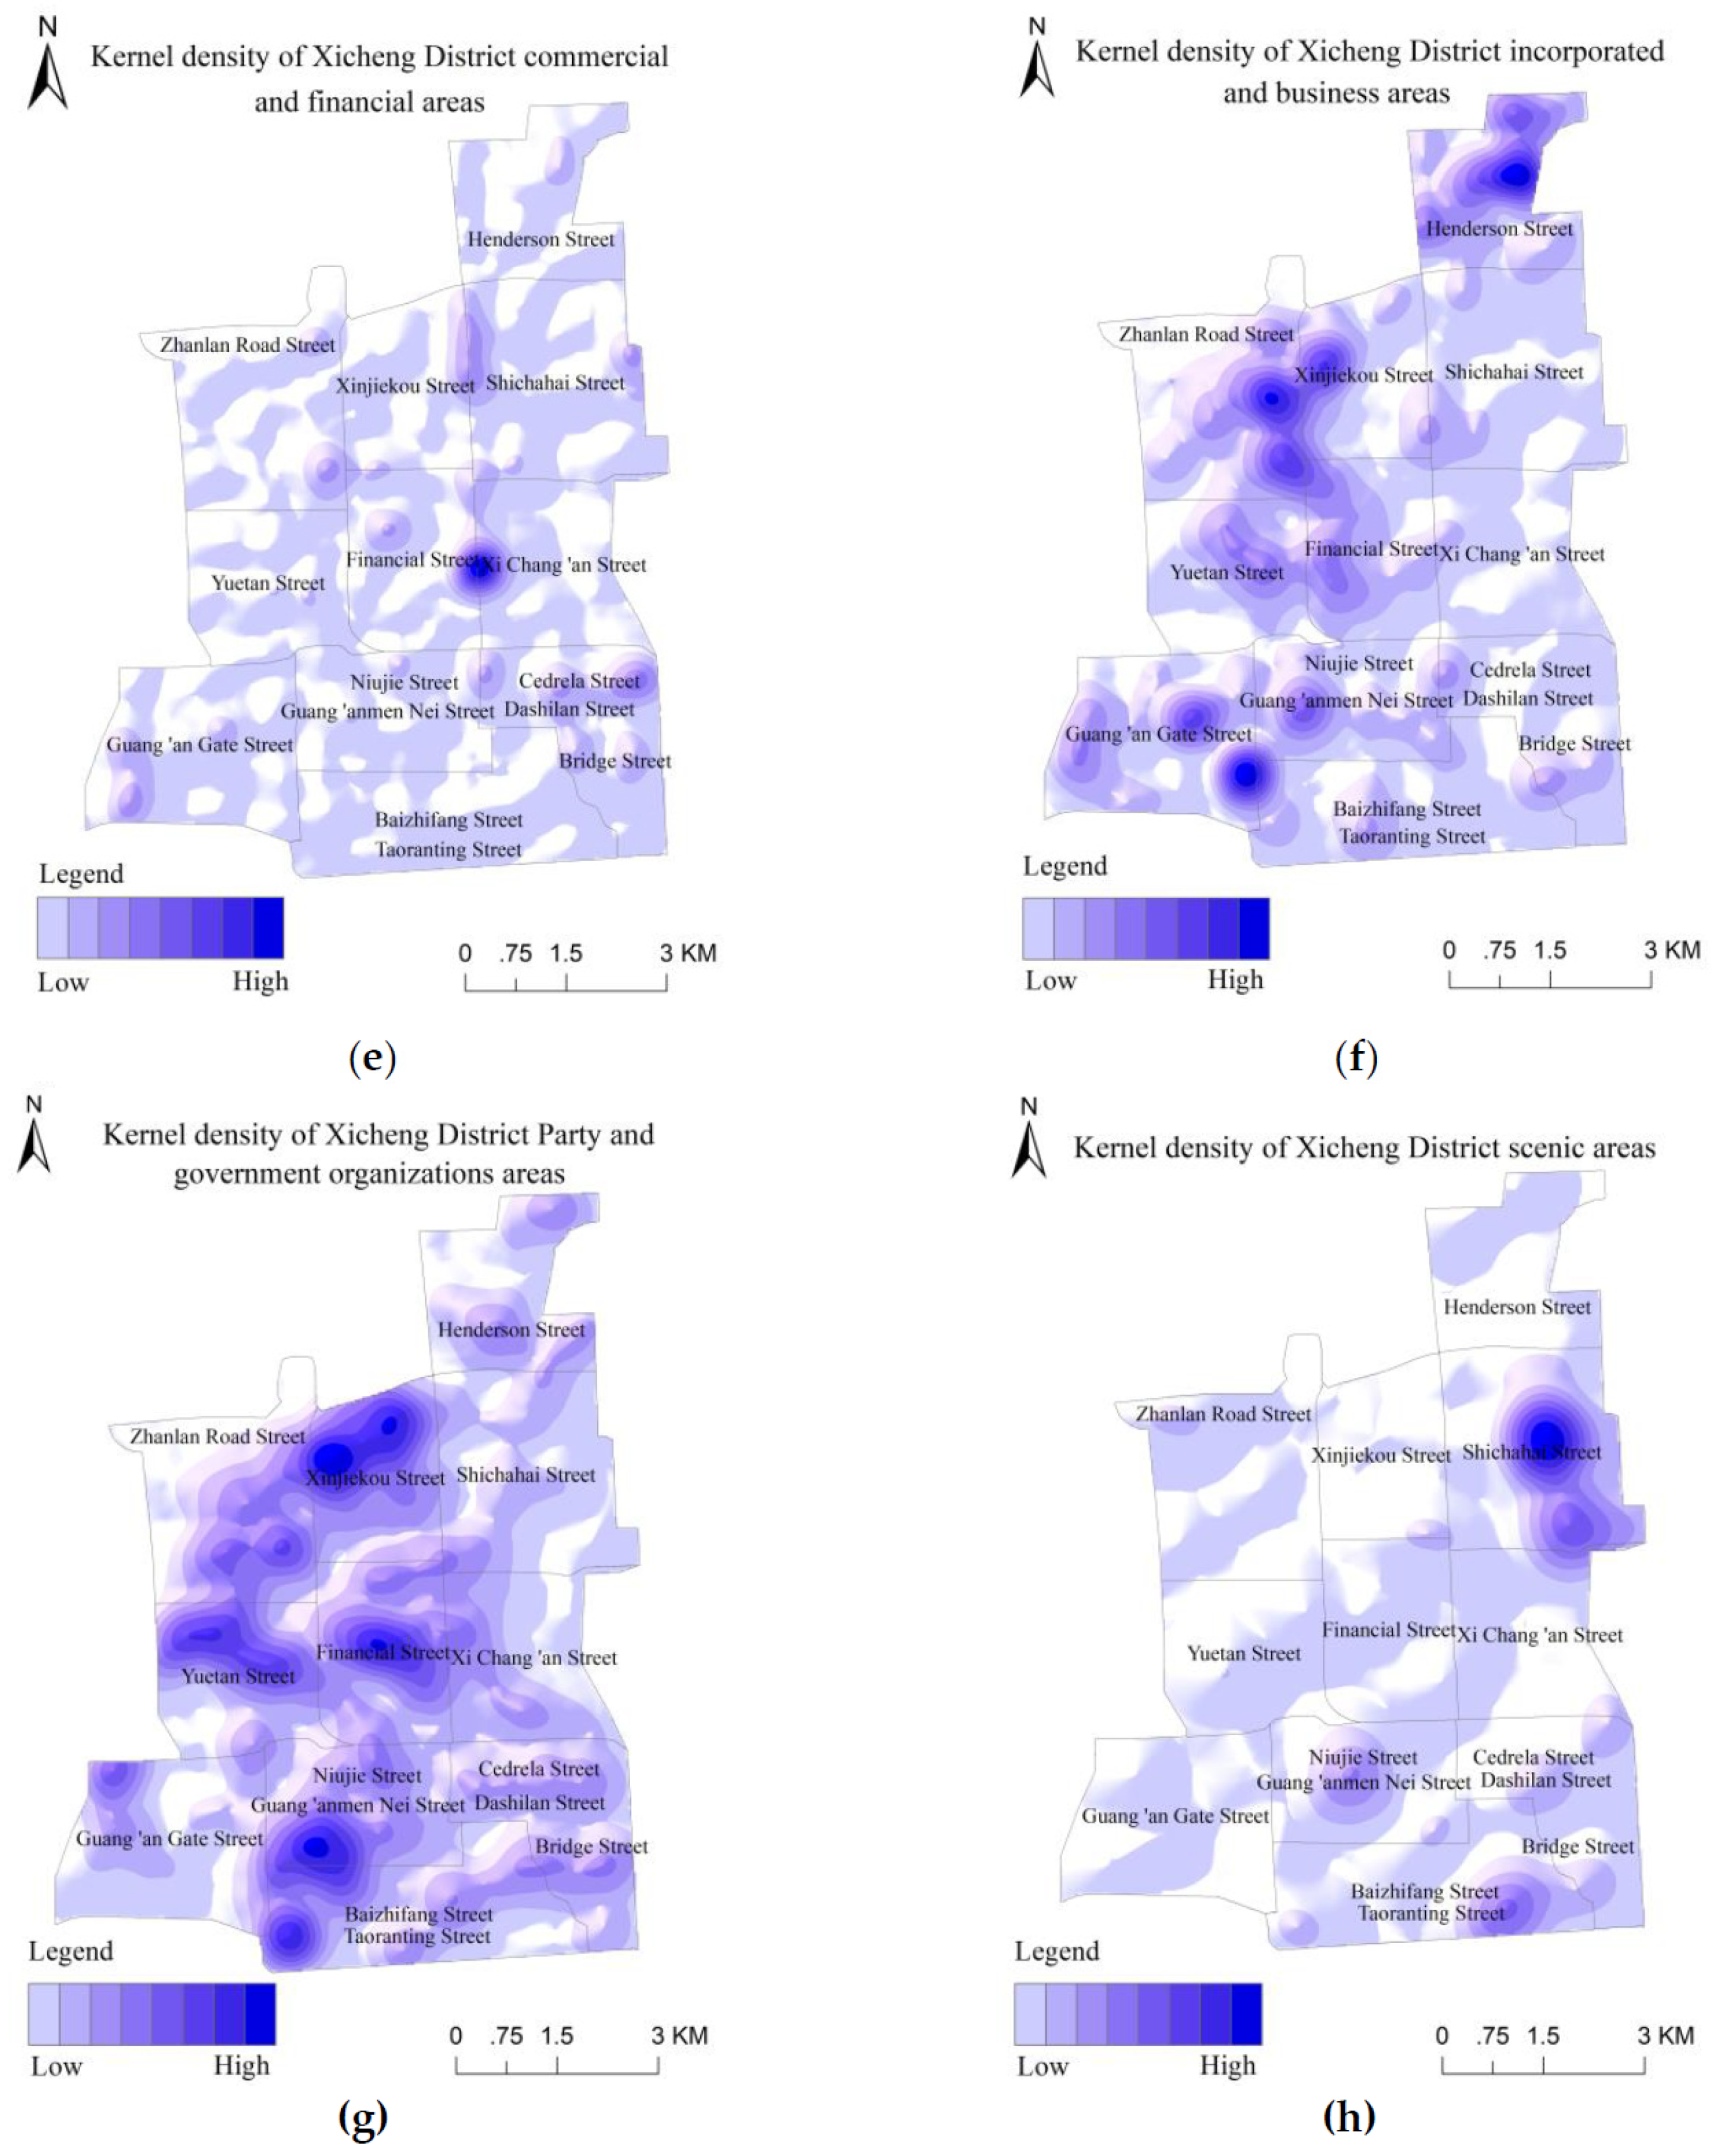
5.1. Kernel Density Analysis of POI Data
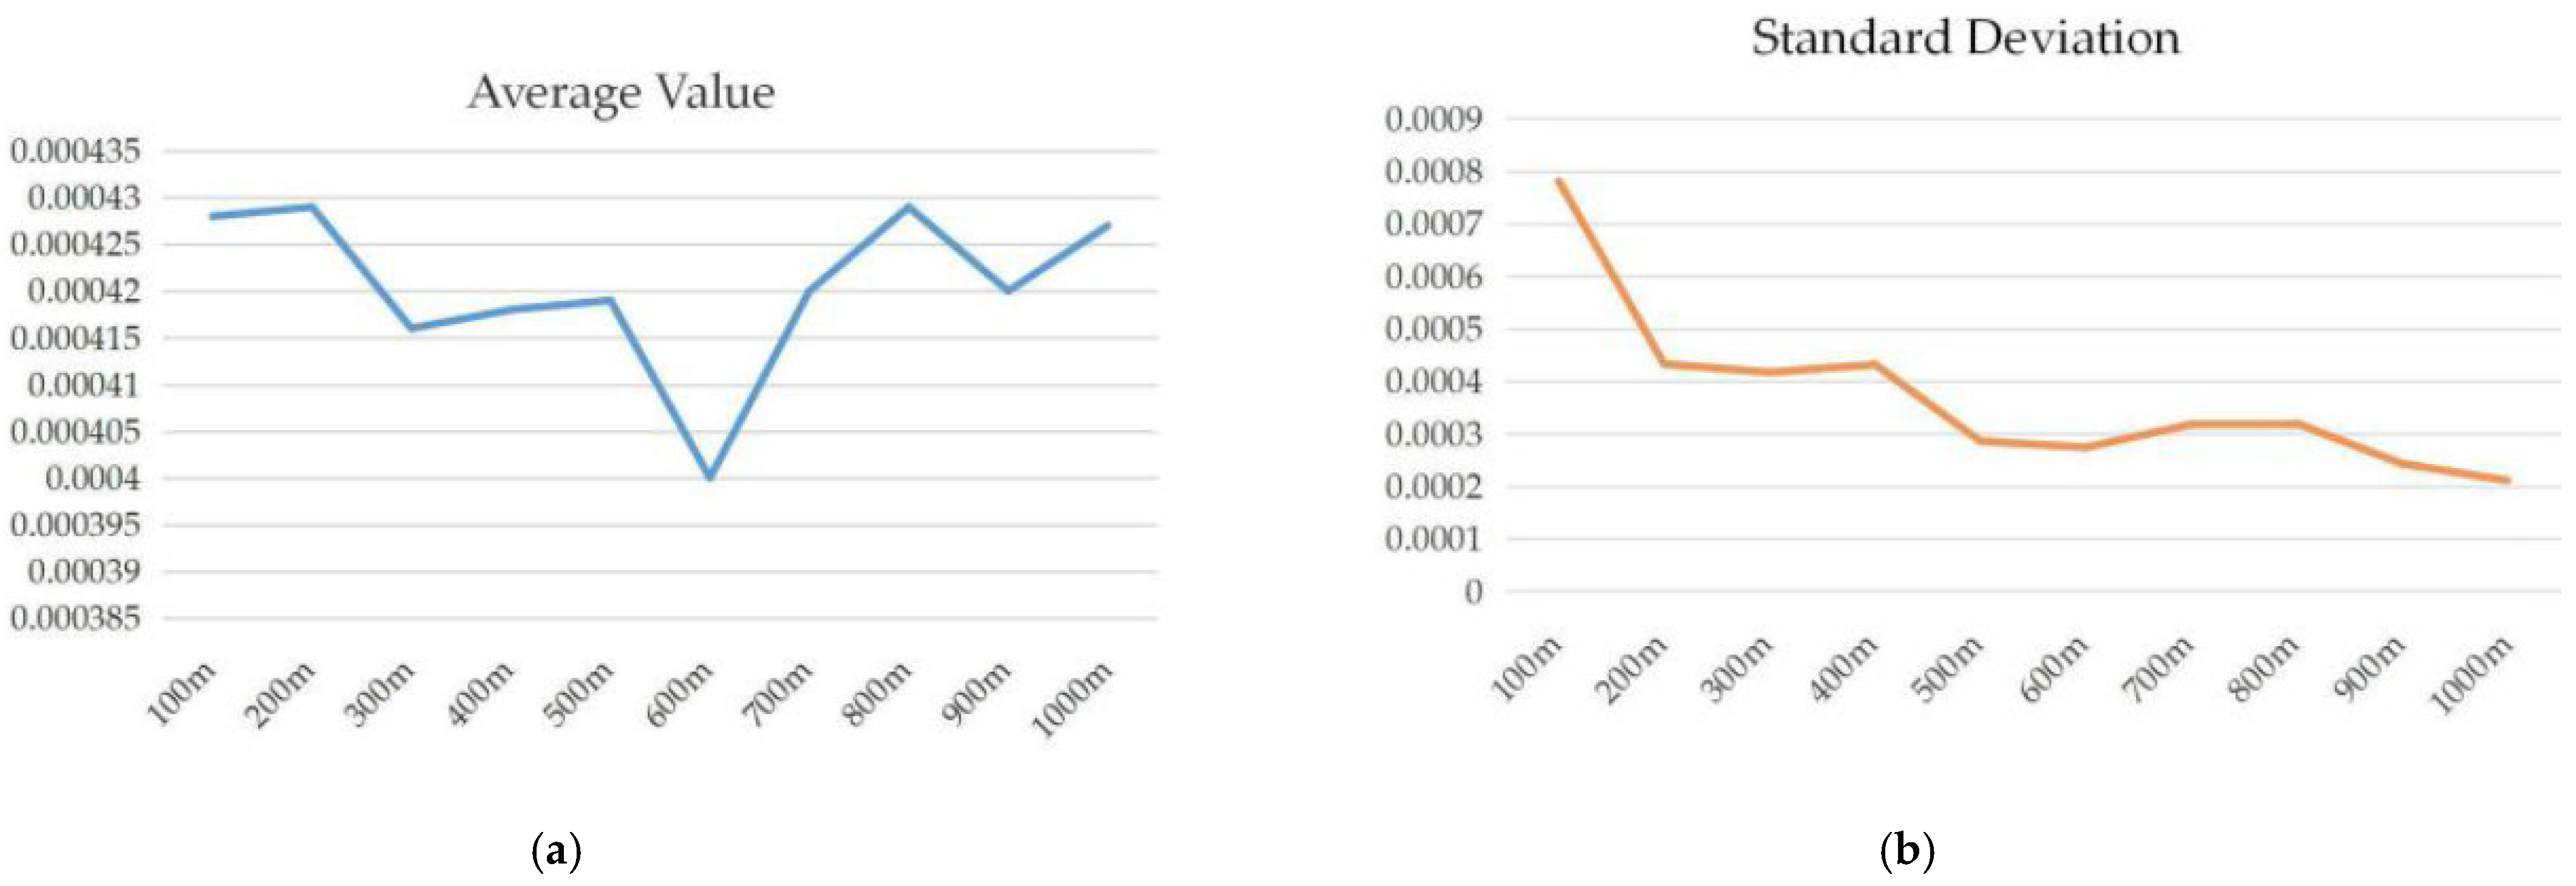
The eight types of POIs in Beijing’s Xicheng District, including residential, education and training, recreation and entertainment, medical and public health, commercial and finance, incorporated and business, party and government organization, and scenic areas, were identified using the kernel density analysis method, and each type of POI space was visualized, and its distribution was determined. The results are shown in Figure 4.
Different types of POI data have different spatial distributions. Residential areas are distributed in the middle and south of the Xicheng District; they are concentrated at the junctions of Financial Street and Shichahai Street, Guang’anmen Nei Street and Taoranting Street, and Guang’an Gate Street. Education and training areas are distributed in the northwest of the Xicheng District; they are concentrated on Zhanlan Road. Recreation and entertainment areas are distributed in the middle and northeast of the Xicheng District; they are concentrated at the junction of Financial Street and Shichahai Street. Medical and public health areas can be found along the central line extending from north–south in the Xicheng District. Commercial and financial areas are distributed in the middle of the Xicheng District; they are concentrated at the junction of Financial Street and Shichahai Street. Incorporated business areas can be found on Henderson Street in the northeast of the Xicheng District, at the junction of Xinjiekou Street and Zhanlan Road Street in the northwest, and at the junction of Guang’an Gate Street, Guang’anmen Nei Street, Niujie Street, Taoranting Street, and Baizhifang Street in the southwest. The distribution of party and government organizations is similar to that of medical and health areas, that is, along the central line extending from north–south. Scenic areas are distributed in the east of the Xicheng District and are concentrated on Shichahai Street.
Overall, Beijing’s Xicheng District mainly consists of residential, medical and health, and party and government organizations areas and their spatial distributions, indicating that the development of these three types of areas is inseparable. The north–south distribution of medical and public health areas as well as party and government organizations is very convenient for all residents in the Xicheng District. In addition, the spatial distribution of recreation and entertainment areas is similar to that of commercial and financial areas. They are both concentrated in the center of the Xicheng District. Multiple business centers have not developed, which is not conducive to the economic development of other areas in the city, reduces the cost of living of the residents, alleviates urban traffic pressure, and stabilizes housing prices [45]. Most of the incorporated business areas are concentrated between two blocks, which is convenient for residents of the respective two blocks with respect to work and travel.

5.2. Grid Size

To obtain the road network data of Xicheng from OpenStreetMap, the primary roas, second road, thired road and highway are screened out. The footway, residential road, cycleway, living street, and outher roads in Xicheng District are left as experimental data. According to statistics, a 100 m road in Xicheng District is about the length of a building, and the longest road in Xicheng District is along Beihai Park, about 1381 m, as shown in (Figure 5).Therefore, the grid side length range is selected as 100~1000 m. The Xicheng District of Beijing is divided into grids of 100 × 100 m, 200 × 200 m, 300 × 300 m, 400 × 400 m, 500 × 500 m, 600 × 600 m, 700 × 700 m, 800 × 800 m, 900 × 900 m, and 1000 × 1000 m. Then, the average density of POI data in the unit grid and the standard deviation of the average density of POI data were calculated, and the results as shown in (Figure 6). Considering the two calculation results comprehensively, we chose the grid size of 200, 500, and 1000 m with larger average density of POI data and smaller standard deviation as three sets of comparative experiments to explore the influence between grid size and the identification of urban functional areas.
Then, the Xicheng District of Beijing was divided into spatial grids with dimensions of 200 × 200 m, 500 × 500 m, and 1000 × 1000 m. The number of sample squares was 1361, 243, and 69, respectively (Figure 7). Based on the kernel density method, FD, and CR, the POI data were used to quantitatively identify and visualize the functional areas of the Xicheng District, Beijing, and reflect the spatial distribution structure of the district, which is of significance for urban planning and management.

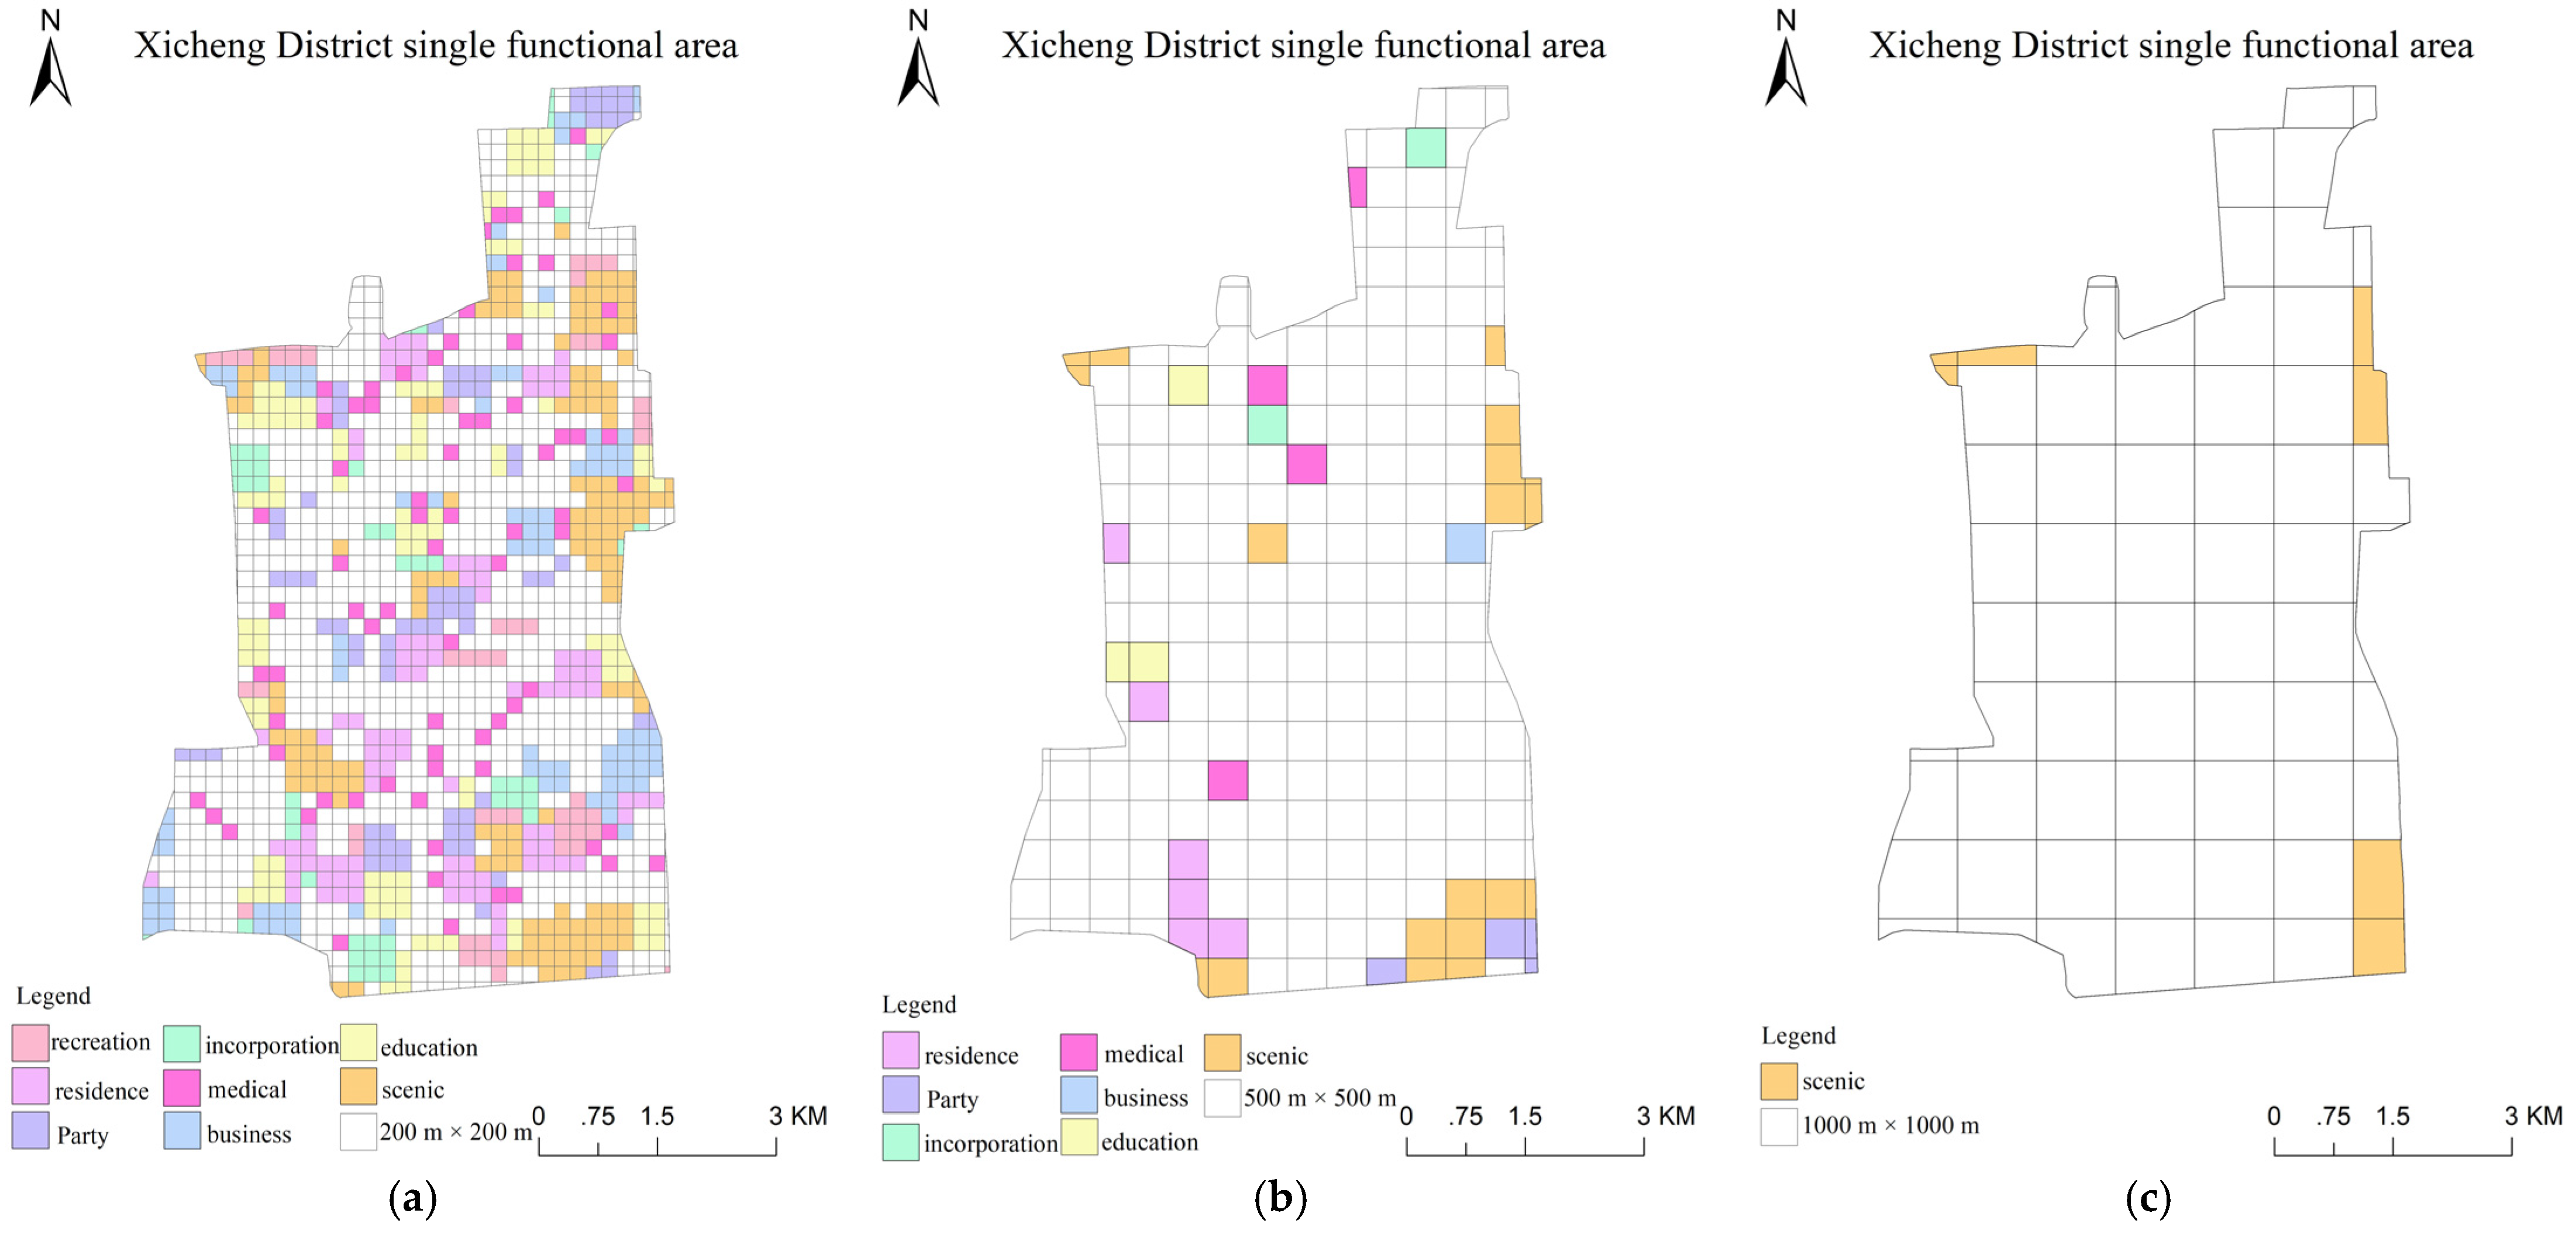
5.3. Identification of Functional Areas

5.3.1. Single-Functional Area

The Xicheng District of Beijing can be divided into eight single-functional areas. Figure 8 shows the distribution of single-functional areas in the Xicheng District based on 200 × 200 m, 500 × 500 m, and 1000 × 1000 m grids. Each single-functional area is represented by a different color.
The 200 × 200 m, 500 × 500 m, and 1000 × 1000 m grids contain 696, 40, and 7 single-functional areas, respectively. In the 200 m × 200 m grid, scenic areas account for the largest proportion (152 sample squares). The proportions of single-functional areas gradually decrease in the following order: education and training, residential, commercial and finance, party and government organization, medical and public health, recreation and entertainment, and incorporated and business areas. In the 500 × 500 m grid, scenic areas account for the largest proportion (20 sample squares). The proportions of single-functional areas gradually decrease in the following order: residential, party and government organizations, medical and public health, education and training, incorporated and business, and commercial and financial areas. The single-functional area for recreation and entertainment is zero, indicating that recreational and entertainment functional areas and other functional areas become mixed-functional areas. The 1000 × 1000 m grid contains only one single-functional area for scenic areas. All other areas are mixed-functional areas. The number of sample squares corresponding to a single-functional area in the Xicheng District differs depending on the grid size. The shorter the side length of the sample square in the same area is, the less POI types the sample square contains and the more the single-functional area is divided. The opposite is true for a longer side length.

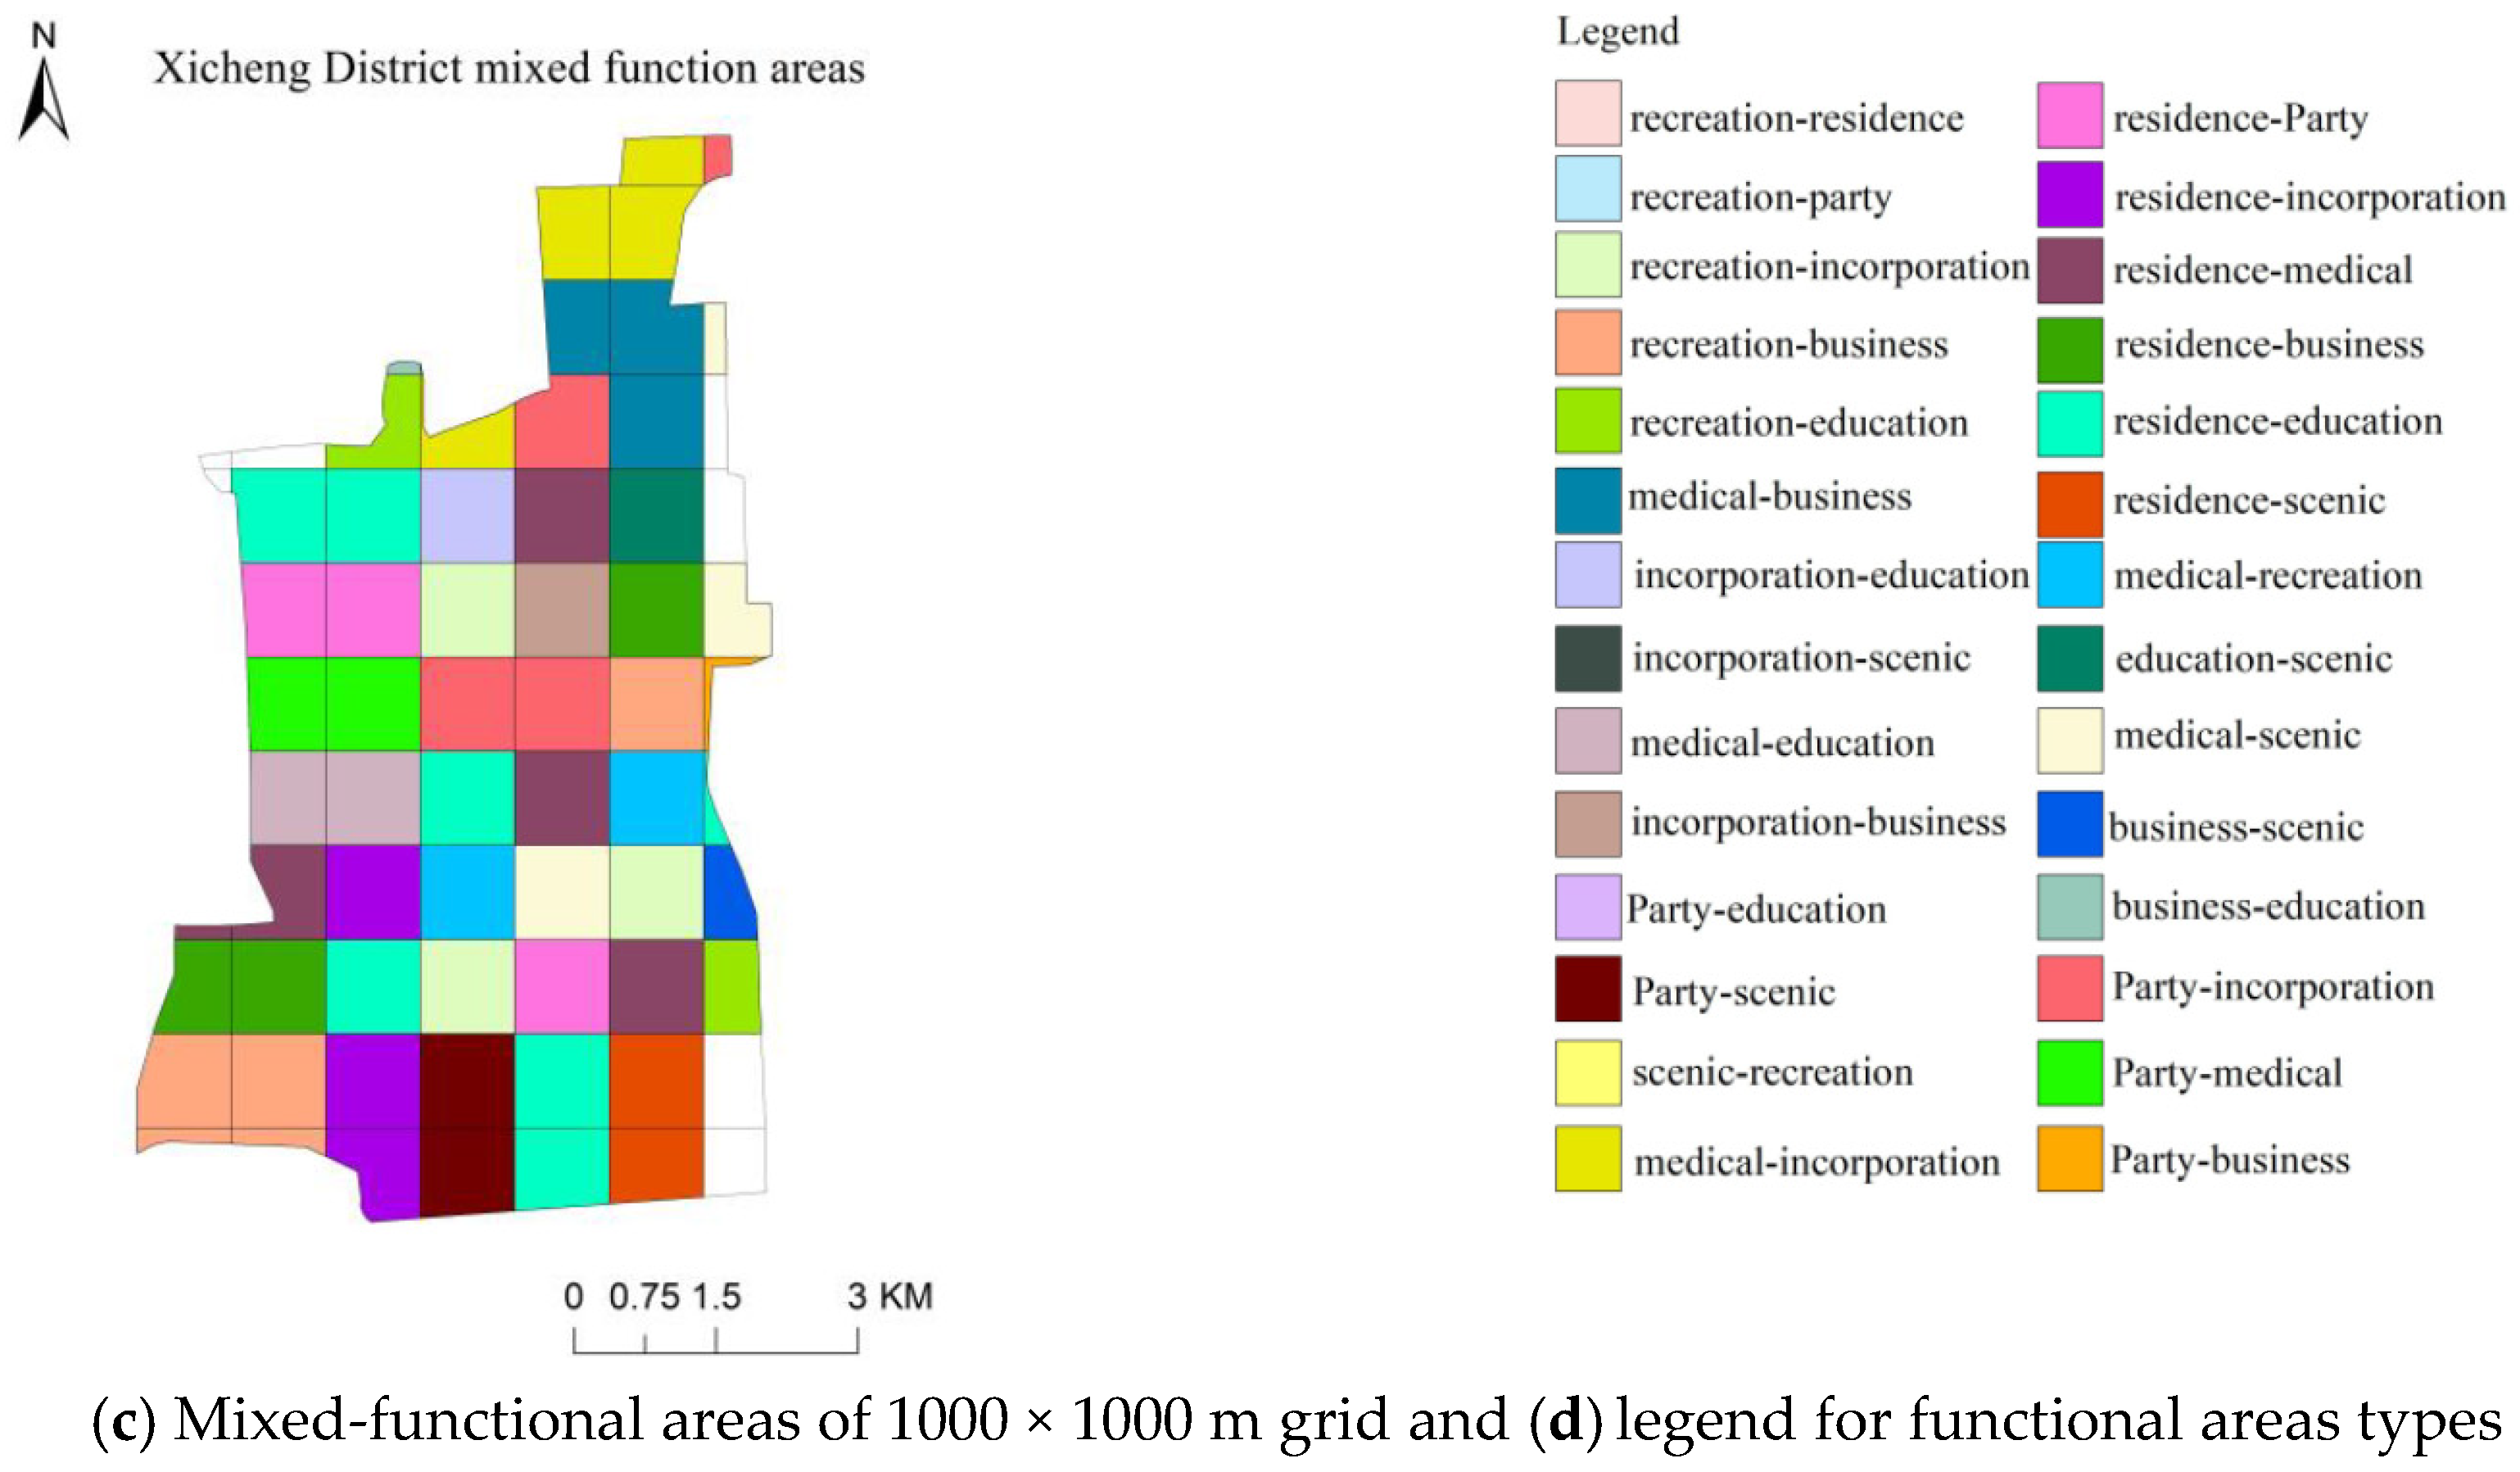
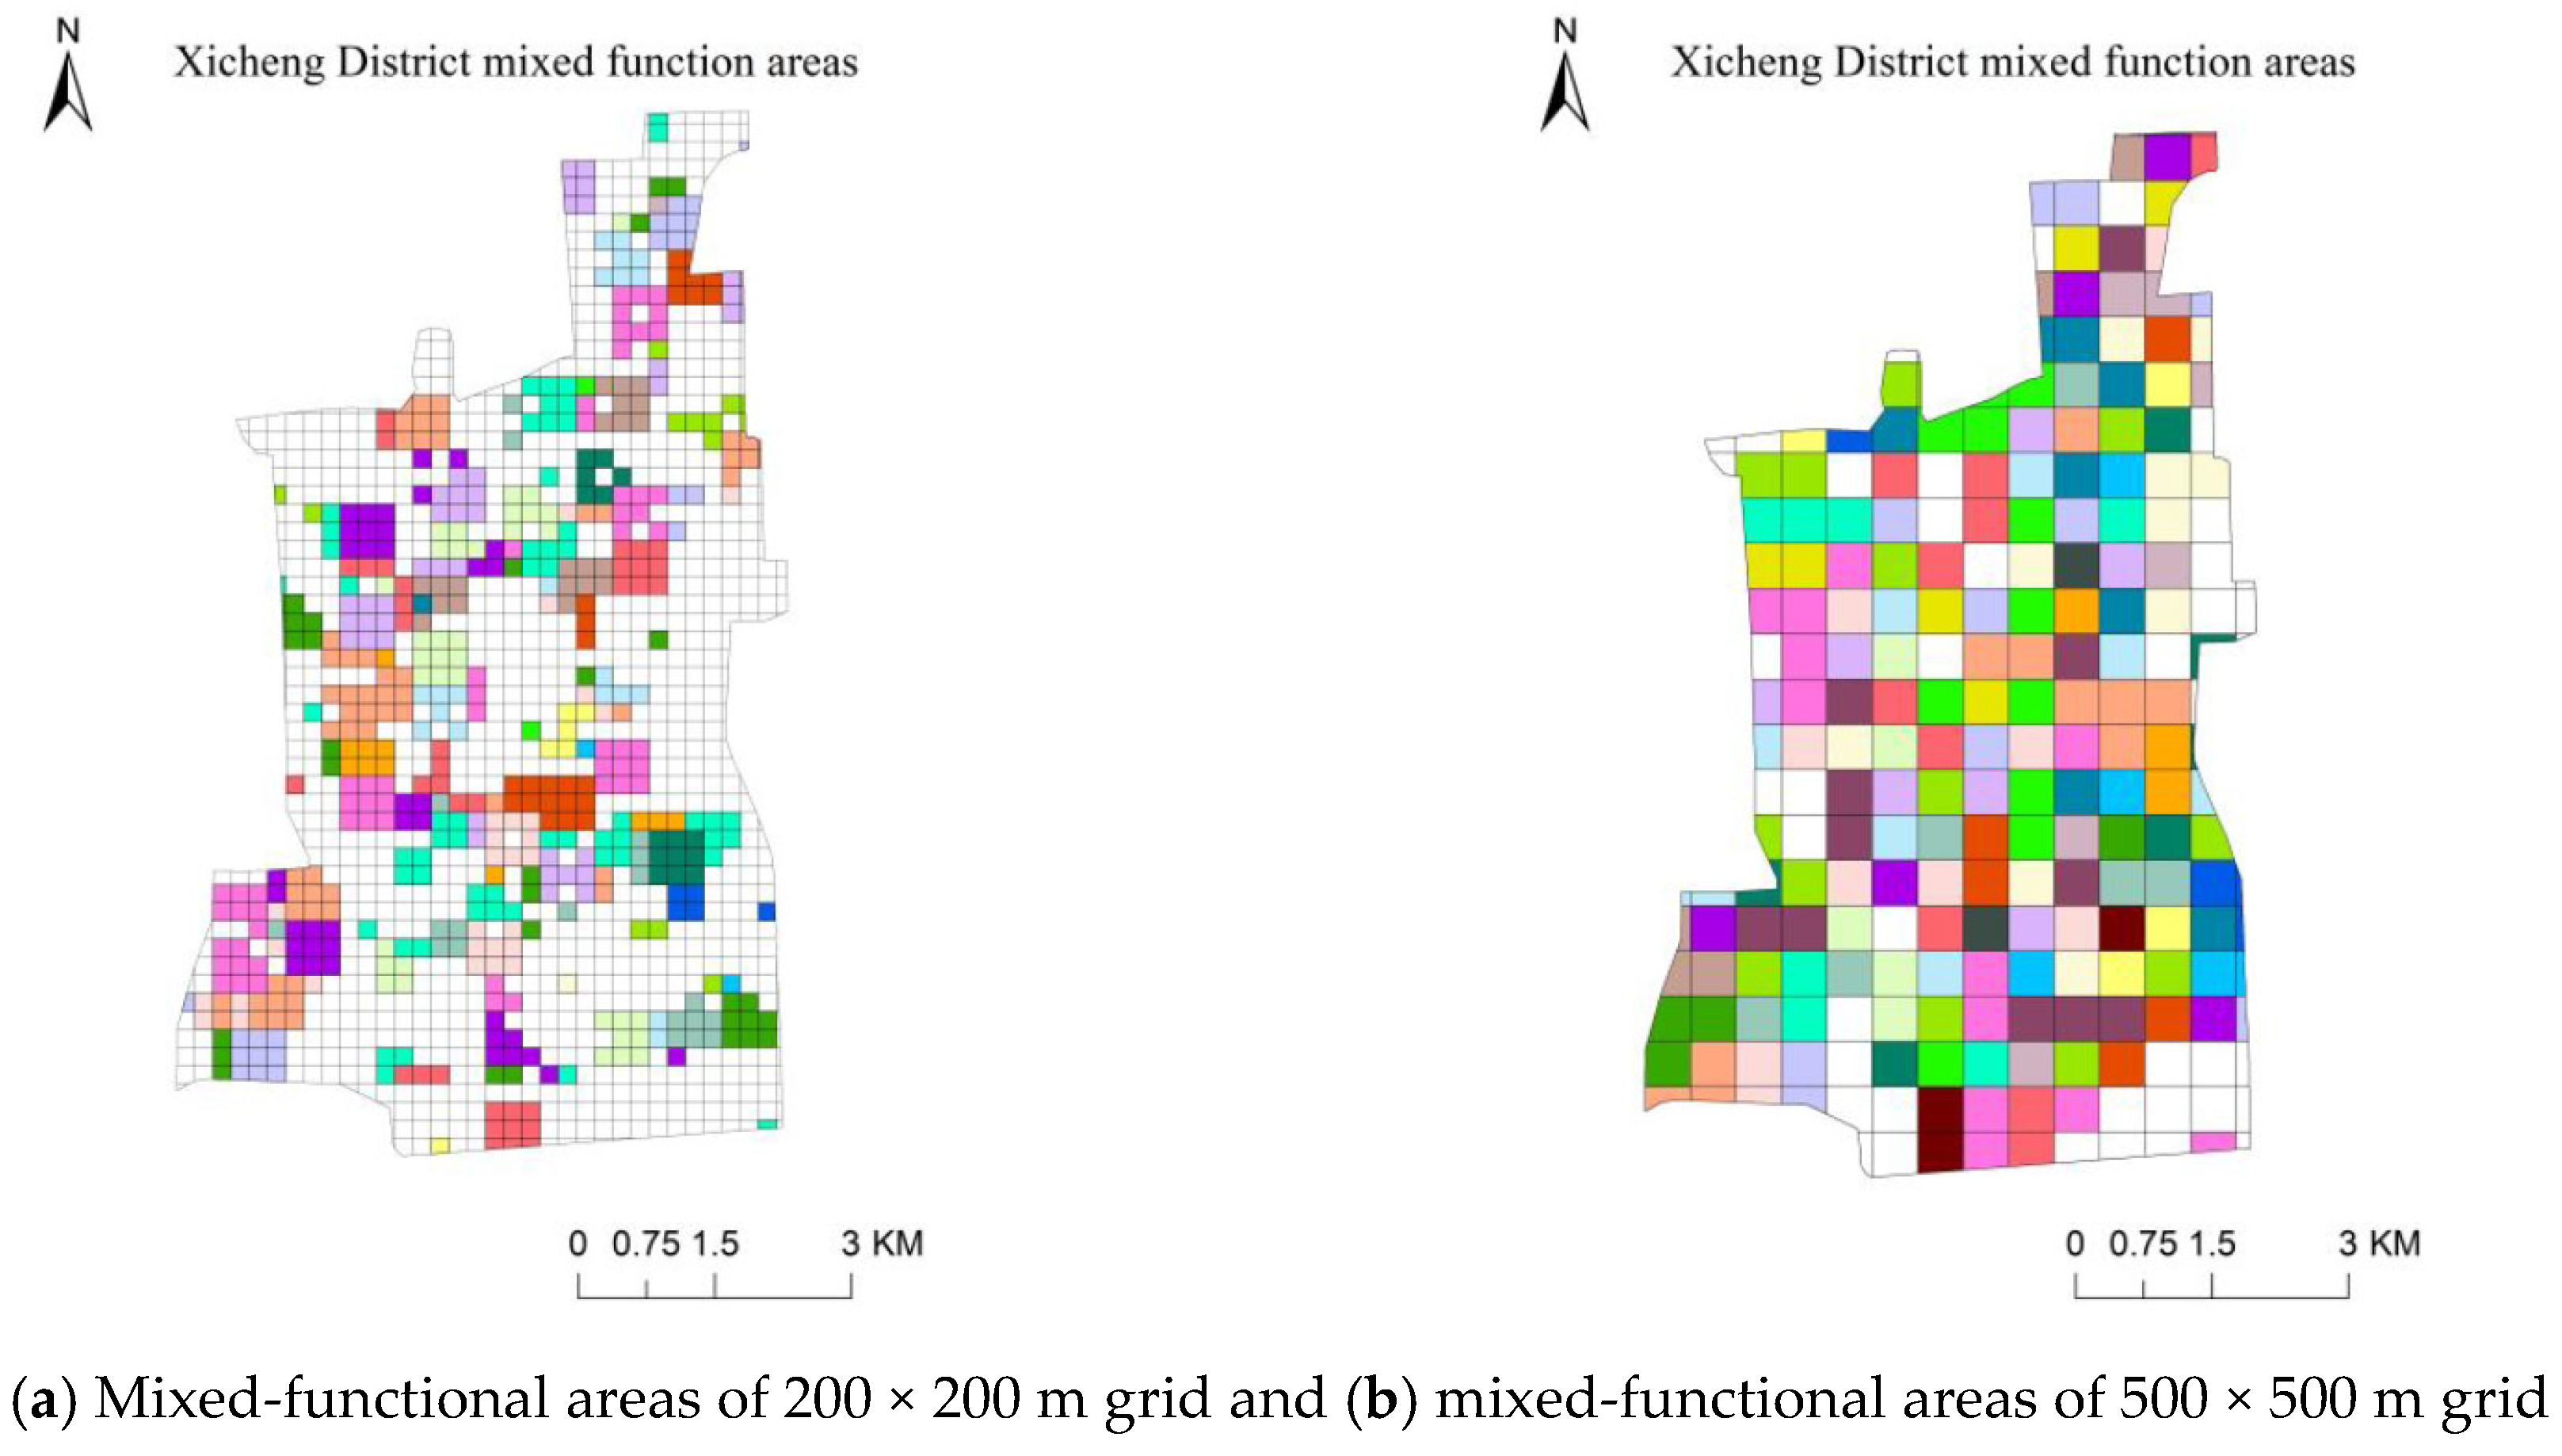
5.3.2. Mixed-Functional Area

In this study, different colors were used to indicate different mixed-functional areas in the Xicheng District. The spatial distribution of the mixed-functional areas of the Xicheng District in the 200 × 200 m, 500 × 500 m, and 1000 × 1000 m grids is shown in Figure 9 (note that residential–residence and residence–residential are considered to be the same type of mixed-functional area in this study, and other types of mixed areas are the same).
The statistics with respect to the number of mixed-functional areas in the Xicheng District of Beijing are shown in Table 2. The 200 × 200 m grid contains 24 types of mixed-functional areas. Among them, the numbers of recreation–business (58 sample squares), residence–party (58 sample squares), and residence–education (57 sample squares) areas are the largest, followed by residence–incorporated (38 sample squares), residence–business (32 samples), and party–incorporation (37 sample squares) areas. The 500 × 500 m grid contains 28 types of mixed-functional areas. Among them, the numbers of recreation–education (14 sample squares), residence–Party (12 sample squares), residence–medical, party–medical, and party–public (11 sample squares) areas are the highest, followed by recreation–business, incorporation–education, and medical–scenic (10 sample squares) areas. The 1000 × 1000 m grid contains 23 types of mixed-functional areas. Among them, the numbers of residence–education (seven sample squares), recreation–business, and recreation–residence (five sample squares) areas are the highest, followed by incorporation–medical and party–scenic (four sample squares) areas.

6. Conclusions

In this study, the Xicheng District of Beijing was divided into 200 × 200 m, 500 × 500 m, and 1000 × 1000 m grids based on POI data. The kernel density analysis method was used to analyze the spatial distribution of eight types of data. Two indicators, that is, the FD and CR, were used to quantitatively identify urban functional areas and analyze the effects of the grid size and number on the division and identification of functional areas. The results provide guidance for decision-making with respect to reasonable urban planning and management. The statistical results are shown in Table 3. The following conclusions can be drawn: (1) with increasing grid size, the proportion of single-functional areas to the total area gradually decreases; (2) with increasing grid size, the proportion of mixed-functional areas to the total area gradually increases, and the 200 × 200 m, 500 × 500 m, and 1000 × 1000 m grids contain 24, 28, and 23 types of mixed-functional areas, respectively; and (3) with increasing grid size, the proportion of the area without data to the total area gradually decreases.
Generally, the Xicheng District of Beijing, which is the political center of the country, contains large proportions of residential, party and government organization, and education and training functional areas, which agrees with the Xicheng District plan. In addition, the grid size affects the division and identification of urban functional areas. With respect to the identification of single-functional areas in the Xicheng District, the 200 × 200 m grid represents the most detailed division. With respect to the identification of mixed-functional areas, more types of mixed-functional areas are identified in the 500 × 500 m grid compared with the 1000 × 1000 m grid, this shows that the division results of urban mixed-functional areas with 500 × 500 m grid are more detailed. Therefore, the 200 × 200 m and 500 × 500 m grids are the most suitable for the division and identification of single- and mixed-functional areas in the Xicheng District (50.7 km2). These results are of significance for the urban management and functional area identification of other cities with different areas.
However, this study has several limitations and improvements can be made in the future. For example, we would like to expand the scope of the research and continue to explore the correlation between the area of the grid and identification of urban functional areas. In addition, the results obtained for urban mixed-functional areas should be further analyzed, and we could also analyze the temporal evolution of the functional areas and even predict the evolution of these areas, which will be based on this article in the future.

Author Contributions

Conceptualization, Shaohua Luo, Yang Liu, and Mingyi Du; methodology, Shaohua Luo and Yang Liu; formal analysis, Shaohua Luo; data curation, Shaohua Luo; supervision, Siyan Gao and Pengfei Wang; writing—review and editing, Shaohua Luo; visualization, Shaohua Luo and Xiaoyu Liu; funding acquisition, Yang Liu and Mingyu Du. All authors have read and agreed to the published version of the manuscript.

Funding

This work was funded by the National Key Research and Development Program of China (2018YFC0706003) and the Pyramid Talent Training Project of Beijing University of Civil Engineering and Architecture (21082717008) and funded by the Beijing Key Laboratory of Urban Spatial Information Engineering (2020216). The Fundamental Research Funds for Beijing University of Civil Engineering and Architecture(X20070).

Data Availability Statement

Data sharing not applicable.

Acknowledgments

We thank all authors for their efforts, and the anonymous reviewers for their valuable comments which significantly improved the paper.

Conflicts of Interest

The authors declare no conflict of interest.

References

  1. Hu, Y.F.; Han, Y.Q. Identification of Urban Functional Areas Based onPOI Data: A Case Study of the Guangzhou Economicand Technological Development Zone. Sustainability 2019, 11, 1385. [Google Scholar] [CrossRef] [Green Version]
  2. Ding, Y.W.; Xu, H.W.; Wang, C.H. Research on Urban Functional Area Recognition Integrating OSM Road Network and POI Data. J. Geo-Inf. Sci. 2020, 36, 57–63. [Google Scholar] [CrossRef]
  3. Li, M. Shanghai Grid in Action: The First Stage Projects towards Digital City and City Grid. Grid and Cooperative Computing; Li, M., Sun, X.H., Deng, Q., Eds.; Springer: Berlin/Heidelberg, Germany, 2004; Volume 3032, pp. 616–623. [Google Scholar]
  4. Wang, Z.; Han, D.Q. GRID-A METHOD OF DESIGN TO THE URBAN SPATIAL FORM. City Plan. Rev. 2003, 3, 67–72. [Google Scholar]
  5. Peng, C. Evaluating Grid City from City Space Forms Performance Guidelines. South Archit. 2006, 12, 5–8. [Google Scholar]
  6. Du, M.Y.; Liu, Y. The application of internet of things in urban fine management. Sci. Surv. Map. 2017, 42, 94–102. [Google Scholar] [CrossRef]
  7. Dang, W.J. Study on the Rational Structure of Urban Road System. Master’s Thesis, Chang’an University, Xi’an, China, 2009. [Google Scholar]
  8. Li, W.D.; Zhang, M.L.; Duan, J.L. The research of Nanjing urban spatial pattern based on POI data. World Reg. Stud. 2020, 29, 317–326. [Google Scholar] [CrossRef]
  9. Xu, Z.N.; Gao, X.L. A novel method for identifying the boundary of urban built-up areas with POI data. Acta Geogr. Sin. 2016, 71, 928–939. [Google Scholar] [CrossRef]
  10. Chen, D.Q.; Lan, Z.Y. Study on Identification of Urban Center System and Boundary Extraction Based on POI Data: A Case Study of Six Center Districts of Changsha. Mod. Urban Res. 2020. [Google Scholar] [CrossRef]
  11. Sun, B.; Shi, W.; Ning, Y. An Empirical Study on the Polycentric Urban Structure of Shanghai and Strategies in Future. Urban Plan. 2010, 23, 58–63. [Google Scholar] [CrossRef]
  12. Wang, Y.D.; Gu, Y.Y.; Dou, M.X.; Qiao, M.L. Using Spatial Semantics and Interactions to Identify Urban Functional Regions. Int. J. Geogr. Inf. Sci. 2018, 7, 130. [Google Scholar] [CrossRef] [Green Version]
  13. Chen, Z.; Arisona, M.; Huang, X.; Batty, M.; Schmitt, G. Detecting the dynamics of urban structure through spatial network analysis. Int. J. Geogr. Inf. Sci. 2014, 28, 2178–2199. [Google Scholar] [CrossRef]
  14. Chen, Z.; Arisona, M.; Huang, X.; Schmitt, G. Identifying spatial structure of urban functional centers using travel survey data: A case study of Singapore. In Proceedings of the First ACM SIGSPATIAL International Workshop on Computational Models of Place, Orlando, FL, USA, 5–8 November 2013; pp. 28–33. [Google Scholar] [CrossRef]
  15. Zhao, Z.Y. Spatial Pattern of China’s Population Migration Based on Big Data and Its Impact on Urbanization. Ph.D. Thesis, Jilin University, Jilin, China, 2018. [Google Scholar]
  16. Zhou, W.; Li, Q.; Li, Z.; Wang, N.; Wang, Q. Dynamic interactions between spatial change and travel behavior variation in old town fringe. J. Transp. Land Use 2020, 13, 559–584. [Google Scholar] [CrossRef]
  17. Zhou, W. SIO-CNN Based Urban Functional Zone Fine Division with VHR Remote Sensing Image. Master’s Thesis, China University of Geosciences, Wuhan, China, 2019. [Google Scholar]
  18. Liu, H.M.; Xu, Y.Y.; Tang, J.B.; Deng, M.; Hang, J.C.; Yang, W.T.; Wu, F. Recognizing urban functional zones by a hierarchical fusion method considering landscape features and human activities. Trans. GIS 2020, 24. [Google Scholar] [CrossRef]
  19. Song, J.C.; Tong, X.Y.; Wang, L.Z.; Zhao, C.; Prishchepov, A.L. Monitoring finer-scale population density in urban functional zones: A remote sensing data fusion approach. Landsc. Urban Plan. 2019, 190. [Google Scholar] [CrossRef]
  20. Han, Y.; Li, H. The Spatial-temporal Characteristics of Urban Economic Inequality in Northeast China Based on DMSP/OLS Night-time Light Data. Northeast Asia Econ. Res. 2020, 4, 66–77. [Google Scholar] [CrossRef]
  21. Zheng, Z.H.; Wu, Z.; Chen, Y.; Yang, Z.; Francesco, M. Analyzing the ecological environment and urbanization characteristics of the Yangtze River Delta Urban Agglomeration based on Google Earth Engine. Acta Ecol. Sin. 2021, 41. [Google Scholar] [CrossRef]
  22. Deng, Y.; Liu, J.; Liu, Y.; Luo, A. Detecting Urban Polycentric Structure from POI Data. ISPRS Int. J. Geo-Inf. 2019, 8, 283. [Google Scholar] [CrossRef] [Green Version]
  23. Yi, D.; Yang, J.; Liu, J.; Liu, Y.; Zhang, J. Quantitative Identification of Urban Functions with Fishers’ Exact Test and POI Data Applied in Classifying Urban Districts: A Case Study within the Sixth Ring Road in Beijing. ISPRS Int. J. Geo-Inf. 2019, 8, 555. [Google Scholar] [CrossRef] [Green Version]
  24. Zhang, X.; Du, S.; Wang, Q. Hierarchical community detection and functional area identification with OSM roads and complex graph theory. Int. J. Geogr. Inf. Sci. 2019, 33. [Google Scholar] [CrossRef]
  25. Lu, C.; Pang, M.; Zhang, Y.; Li, H.; Lu, C.; Tang, X.; Cheng, W. Mapping Urban Spatial Structure Based on POI (Point of Interest) Data: A Case Study of the Central City of Lanzhou, China. ISPRS Int. J. Geo-Inf. 2020, 9, 92. [Google Scholar] [CrossRef] [Green Version]
  26. Xing, H.; Meng, Y. Integrating landscape metrics and socioeconomic features for urban functional region classification. Comput. Environ. Urban Syst. 2018, 72, 134–145. [Google Scholar] [CrossRef]
  27. Liu, J.; Deng, Y.; Wang, Y.; Huang, H.; Du, H.; Ren, F. Urban Nighttime Leisure Space Mapping with Nighttime Light Images and POI Data. Remote Sens. 2020, 12, 541. [Google Scholar] [CrossRef] [Green Version]
  28. Chen, Y.; Chen, X.; Liu, Z.; Li, X. Understanding the spatial organization of urban functions based on co-location patterns mining: A comparative analysis for 25 Chinese cities. Cities 2020, 97. [Google Scholar] [CrossRef]
  29. Andrade, R.; Alves, A.; Bento, C. POI Mining for Land Use Classification: A Case Study. ISPRS Int. J. Geo-Inf. 2020, 9, 493. [Google Scholar] [CrossRef]
  30. Yan, M.M.; Jiang, C. Comprehensive Environmental Management of Historic and Cultural Blocks in Old City—A Case Study of Shichahai Area in Xicheng District, Beijing. In Proceedings of the 2010 International Conference on Management and Service Science, Wuhan, China, 24–26 August 2010; pp. 1–4. [Google Scholar] [CrossRef]
  31. Xue, F.; Zhang, J.; Cui, Y.; He, L.; Zhong, Y. Urban Small Green Space Layer Structure Mapping and Quantitative Research—A Case of Beijing Xihai Waterfront and Qingfeng Park East Area. Chin. Landsc. Archit. 2020, 36, 133–138. [Google Scholar] [CrossRef]
  32. Zhang, L. Research on POI Classification Standard. Bull. Surv. Mapp. 2012, 82–84. [Google Scholar]
  33. Sun, X. Spatialization and Autocorrelation Analysis of Urban Population Kernel Density Supported by Nighttime Light Remote Sensing. J. Geo-Inf. Sci. 2020, 22, 2256–2266. [Google Scholar] [CrossRef]
  34. Zhou, Y.; Li, X.; Tong, Y.; Huang, H. The geographical pattern and differentiational mechanism of rural poverty in China. Acta Geogr. Sin. 2020, 1–19, (accepted). [Google Scholar]
  35. Swift, A.; Liu, L.; Uber, J. Reducing MAUP bias of correlation statistics between water quality and GI illness. Comput. Environ. Urban Syst. 2008, 32, 134–148. [Google Scholar] [CrossRef]
  36. Rao, J.W.; Ma, R.H. Improved Kernel Density Estimator Based Spatial Point Density Algorithm. Comput. Eng. Appl. 2020, 1–8. [Google Scholar] [CrossRef]
  37. Xing, R.; Ai, T.; Yang, W.; Feng, T.A. New Network Voronoi Diagram Considering the OD Point Density of Taxi and Visual Analysis of OD Flow. J. Geo-Inf. Sci. 2015, 17, 1187–1195. [Google Scholar] [CrossRef]
  38. Yu, W.H.; Ai, T.H.; Yang, W.; Feng, T. The Visualization and Analysis of POI Features under Network Space Supported by Kernel Density Estimation. Acta Geod. Cartogr. Sin. 2015, 44, 82–90. [Google Scholar] [CrossRef]
  39. Li, S.Q.; Sheng, C.Y.; Wang, J.C. Algorithm of Cartographical Generalization for Point Cluster Features Based on Point Density Analysis and Adaptive Difference Detection. J. Geo-Inf. Sci. 2019, 35, 1–5+151. [Google Scholar] [CrossRef]
  40. Wu, W.; Deng, G.Q.; Wu, X.L. Geographic Grids and Their Application in Statistical Analysis. Stand. Surv. Mapp. 2015, 31, 22–26. [Google Scholar]
  41. Fu, H.Y.; Li, M.C.; Zhao, J.; Liu, Y.X. SUMMARY OF GRID TRANSFORMATION MODELS OF POPULATION DATA. Hum. Geogr. 2006, 115–119+114. [Google Scholar] [CrossRef]
  42. Zhao, J. Study on the Changes of National Population and Economy Based on the Grid under the Shared Socioeconomic Pathways by IPCC. Master’s Thesis, Nanjing University of Information Science and Technology, Nanjing, China, 2018. [Google Scholar]
  43. Lian, W.J. Reaearch on Geographic Object Model and Key Technologies Based on Discrete Global Grid System. Master’s Thesis, Nanjing Normal University, Nanjing, China, 2019. [Google Scholar]
  44. Silverman, B.W. Density Estimation for Statistics and Data Analysis; Chapman and Hall: London, UK, 1986; pp. 34–48. [Google Scholar]
  45. Lin, X. Research on Evolution Characteristics and Optimization of Shopping Center Spatial Layout in Central Chongqing. Master’s Thesis, Southwest University, Chongqing, China, 2020. [Google Scholar] [CrossRef]
Figure 1. Research framework showing the steps employed in this study.
Ijgi 10 00189 g001
Figure 2. Maps of the study area (a) Xicheng District, Beijing; (b) division of the Xicheng District into 15 blocks: Baizhifang Street, Guang’an Gate Street, Guang’anmen Nei Street, Dashilan Street, Financial Street, Yuetan Street, Xi Chang’an Street, Xinjiekou Street, Shichahai Street, Zhanlan Road Street, Henderson Street, Cedrela Street, Bridge Street, Niujie Street, and Taoranting Street.
Ijgi 10 00189 g002
Figure 3. Diagram of the kernel density calculation.
Ijgi 10 00189 g003
Figure 4. Kernel density analysis of point of interest (POI) data.
Ijgi 10 00189 g004aIjgi 10 00189 g004b
Figure 5. Schematic diagram of the road network in Xicheng District, Beijing.
Ijgi 10 00189 g005
Figure 6. The average density of the POI data and the standard deviation of the average density.
Ijgi 10 00189 g006
Figure 7. Division of the Xicheng District into grids with dimensions of 200 × 200 m, 500 × 500 m, and 1000 × 1000 m.
Ijgi 10 00189 g007aIjgi 10 00189 g007b
Figure 8. Single-functional areas in the Xicheng District: recreation stands for recreation and entertainment areas; residence stands for residence areas; party stands for party and government organization areas; incorporated stands for incorporated business areas; medical stands for medical and public health areas; business stands for commercial and financial areas; education stands for education and training areas; and scenic stands for scenic areas.
Ijgi 10 00189 g008
Figure 9. Mixed-functional areas in the Xicheng District.
Ijgi 10 00189 g009aIjgi 10 00189 g009b
Table 1. Results of the reclassification of POI data.
Current Categories
(Level One)
Current Categories
(Level Two)
Current Categories
(Level Three)
ResidenceWater, electricity, gas service,
life services,
ticket office
Electricity repair, household management service,
community service
Education and trainingLow and middle education,
continuing education,
higher education
Primary school, high school,
skill-training institution,
university
Recreation and entertainmentCulture,
recreation,
sports and fitness
Museum, library
cinema, amusement park
swimming pool, gym
Medical and public healthMedical institutions,
rehabilitation care,
animal hospital
Hospital, clinic,
convalescent hospital,
animal hospital
Commercial and financialFinance,
shopping center,
hotel
Bank, security,
supermarket, catering,
hotel, lodging
Incorporated businessCompany, enterpriseCompany, enterprise
Party and government organizationGovernment, administrationPublic security,
the People’s courts
ScenicScenic areaTourist attractions
Table 2. Mixed-functional areas in the Xicheng District, Beijing.
RecreationResidencePartyIncorporatedMedicalBusinessEducationScenic
(a) Functional areas in the 200 m × 200 m grid
Recreation5321131414661
Residence79836250263610
Party72275180770
Incorporated22131946015110
Medical101074111
Business12640088145
Education7211211051100
Scenic514000015152
(b) Functional areas in the 500 × 500 m grid
Recreation04430250
Residence56631321
Party56413132
Incorporated221022522
Medical510844858
Business81200142
Education94481231
Scenic447222520
(c) Functional areas in the 1000 × 1000 m grid
Recreation01000410
Residence00020140
Party03030002
Incorporated11101110
Medical25230320
Business12100001
Education13000201
Scenic02003007
Table 3. Impact of the different grid sizes on the identification of urban functional areas.
Grids200 × 200 m500 × 500 m1000 × 1000 m
Total number of quadrats136124369
Number of single-functional areas696407
Number of mixed-functional areas55020062
Number of no-data areas11530
Number of single functional areas Total number of quadrats 51.14%16.46%10.14%
Number of mixed functional areas Total number of quadrats 40.41%82.30%89.86%
Number of no data areas Total number of quadrats 8.45%1.65%0%
Publisher’s Note: MDPI stays neutral with regard to jurisdictional claims in published maps and institutional affiliations.

