Article

Multitemporal Analysis of Land Use and Land Cover within an Oil Block in the Ecuadorian Amazon

by
Sergio Llerena-Montoya
1,
Andrés Velastegui-Montoya
1,*,
Bryan Zhirzhan-Azanza
1,
Viviana Herrera-Matamoros
1,2,
Marcos Adami
3,
Aline de Lima
4,
Francisco Moscoso-Silva
5 and
Luis Encalada
6,7
1
Facultad de Ingeniería en Ciencias de la Tierra (FICT), ESPOL Polytechnic University, Guayaquil P.O. Box 09-01-5863, Ecuador
2
Department of Geoinformatics—Z_GIS, University of Salzburg, 5020 Salzburg, Austria
3
Amazon Regional Center, National Institute for Space Research (INPE), Belém 66077-830, Brazil
4
Geoscience Institute, Federal University of Pará, Belém 66075-110, Brazil
5
United Nations Development Programme (UNDP), Integrated Amazon Program for Forest Conservation and Sustainable Production, PROAmazonía, Quito 170517, Ecuador
6
Centre of Geographical Studies, Institute of Geography and Spatial Planning, Universidade de Lisboa, 1600-276 Lisbon, Portugal
7
Universidad Espíritu Santo, Samborondón 092301, Ecuador
*
Author to whom correspondence should be addressed.
ISPRS Int. J. Geo-Inf. 2021, 10(3), 191; https://0-doi-org.brum.beds.ac.uk/10.3390/ijgi10030191
Submission received: 30 January 2021 / Revised: 8 March 2021 / Accepted: 19 March 2021 / Published: 23 March 2021
(This article belongs to the Special Issue Spatio-Temporal Models and Geo-Technologies)

Abstract

:
The Ecuadorian Amazon is considered a biodiverse region, and at the same time contains the largest number of oil blocks and oilfields in the country. Oil exploitation requires the implementation of oil facilities and related infrastructure, such as roads, water, and energy supply, for operation. These large engineering works can alter the dynamics of the Amazonian natural ecosystems. This paper analyzes the land use and land cover (LULC) change and relates spatial patterns within an oil block located in the province of Orellana, Ecuador. The study was processed in two phases, the first corresponding to the collection and classification of LULC classes within the oil block. The second phase concerned the calculation of landscape metrics, with the purpose of quantitatively characterizing each class. This analysis was carried out for the pre-concession, post-concession scenarios of the oil block and the current scenario of the region. The results revealed that the low predominance of forest cover within the study region is not directly associated with the beginning of the Block 47 concession. On the other hand, a significant reduction of the Coca River was evidenced for the 2018 scenario.

1. Introduction

In Ecuador, oil exploration and exploitation began in the 1920s, when the first oil well was discovered in the parish of Ancon in the province of Santa Elena. It was operated by the English company Anglo-Ecuadorian Oilfields Limited [1,2]. Later, the oil crisis of the 1970s and the discovery of oilfields under the Ecuadorian Amazon motivated the implementation of the Trans-Ecuadorian Oil Pipeline System (SOTE), which transports oil from the Amazon to the vicinity of the Pacific Ocean [3,4,5]. For this reason, the Ecuadorian Amazon has been experiencing an expansion of hydrocarbon projects in order to satisfy international demand for hydrocarbons and to consolidate Ecuador’s insertion into the global economic market [3].
Ecuador’s crude oil reserves are estimated to be exploitable for the next 20 years. Most of them are located in the Ecuadorian Amazon, with 8.27 billion barrels [6]. The oil reservoirs contain volumes of 1632 MMBls (Million barrels) of proven reserves, 314 MMBls of probable reserves, and 749 MMBls of possible reserves, representing a total volume of 2695 MMBls [7]. Approximately 79% of daily oil production is operated by the state-owned company Petroamazonas EP [8], which qualifies the oil sector as one of Ecuador’s main sources of foreign exchange, with a 10.1% share in the Gross Domestic Product (GDP) [9].
The Ecuadorian Amazon is considered one of the most biodiverse regions in the world, with a large number of flora and fauna species [10,11,12]. It is a space of coexistence of different indigenous communities, whose population dynamics are directly related to the tropical forest and its ecosystem services [13]. It is also the territory inhabited by the country’s only indigenous peoples in voluntary isolation, the Tagaeri and Taromenane [14,15]. The Amazon region, however, is not adequately supervised by the state, which exposes it to potential environmental and social impacts, mainly linked to natural resource extraction activities [13,16].
Between the 1960s and 1990s, about 59 billion liters of toxic waste were dumped in Lago Agrio, in the province of Sucumbíos. Forests and rivers were contaminated during 30 years of exploitation and exploration of oil wells by a private company [17,18,19,20]. This evidenced a deficiency in the monitoring and conservation of the Ecuadorian Amazon. In order to have better control and management of operations and exploration in areas with oil reserves in Ecuador, the Hydrocarbons Secretary of Ecuador (SHE) along with the Petroleum Information Bank of Ecuador (BIPE) classified these reserves into 60 oil blocks [21,22]. Around 25 of these blocks are located in the province of Orellana, one of which corresponds to the Paraíso Biguno Huachito and Intracampos Block (PBHI). This block is also known as Block 47. This block was granted since 2003 to the subsidiary Sipetrol, of the Chilean company Empresa Nacional del Petróleo (ENAP), with an investment of $90 million for its oil exploration and exploitation [23,24]. By 2019, Block 47 registered an annual production of 7,688,858 barrels and estimated reserves of 4.4 MMBls [25,26].
The implementation of large engineering projects in tropical rainforest areas can alter the spatiotemporal dynamics of the surrounding forest cover. Labor mobility, demand for housing and basic services, implementation of complementary works to the project such as access to roads, water, and energy available for the operation of these infrastructures, etc. can contribute to these alterations [27,28]. This can lead to tropical forest deforestation, changes in land use, fragmentation, and loss of primary forests [29,30,31,32].
The importance of land use and land cover (LULC) pattern analysis is therefore highlighted as a mechanism to identify and spatialize possible alterations in LULC within oil blocks. In this study, the landscape was analyzed to evaluate the LULC patterns within Block 47 during an 18-year period. This period was divided into three phases consisting of pre-operation, oil exploitation, and a current scenario corresponding to the years 2000, 2008, and 2018, respectively.

2. Materials and Methods
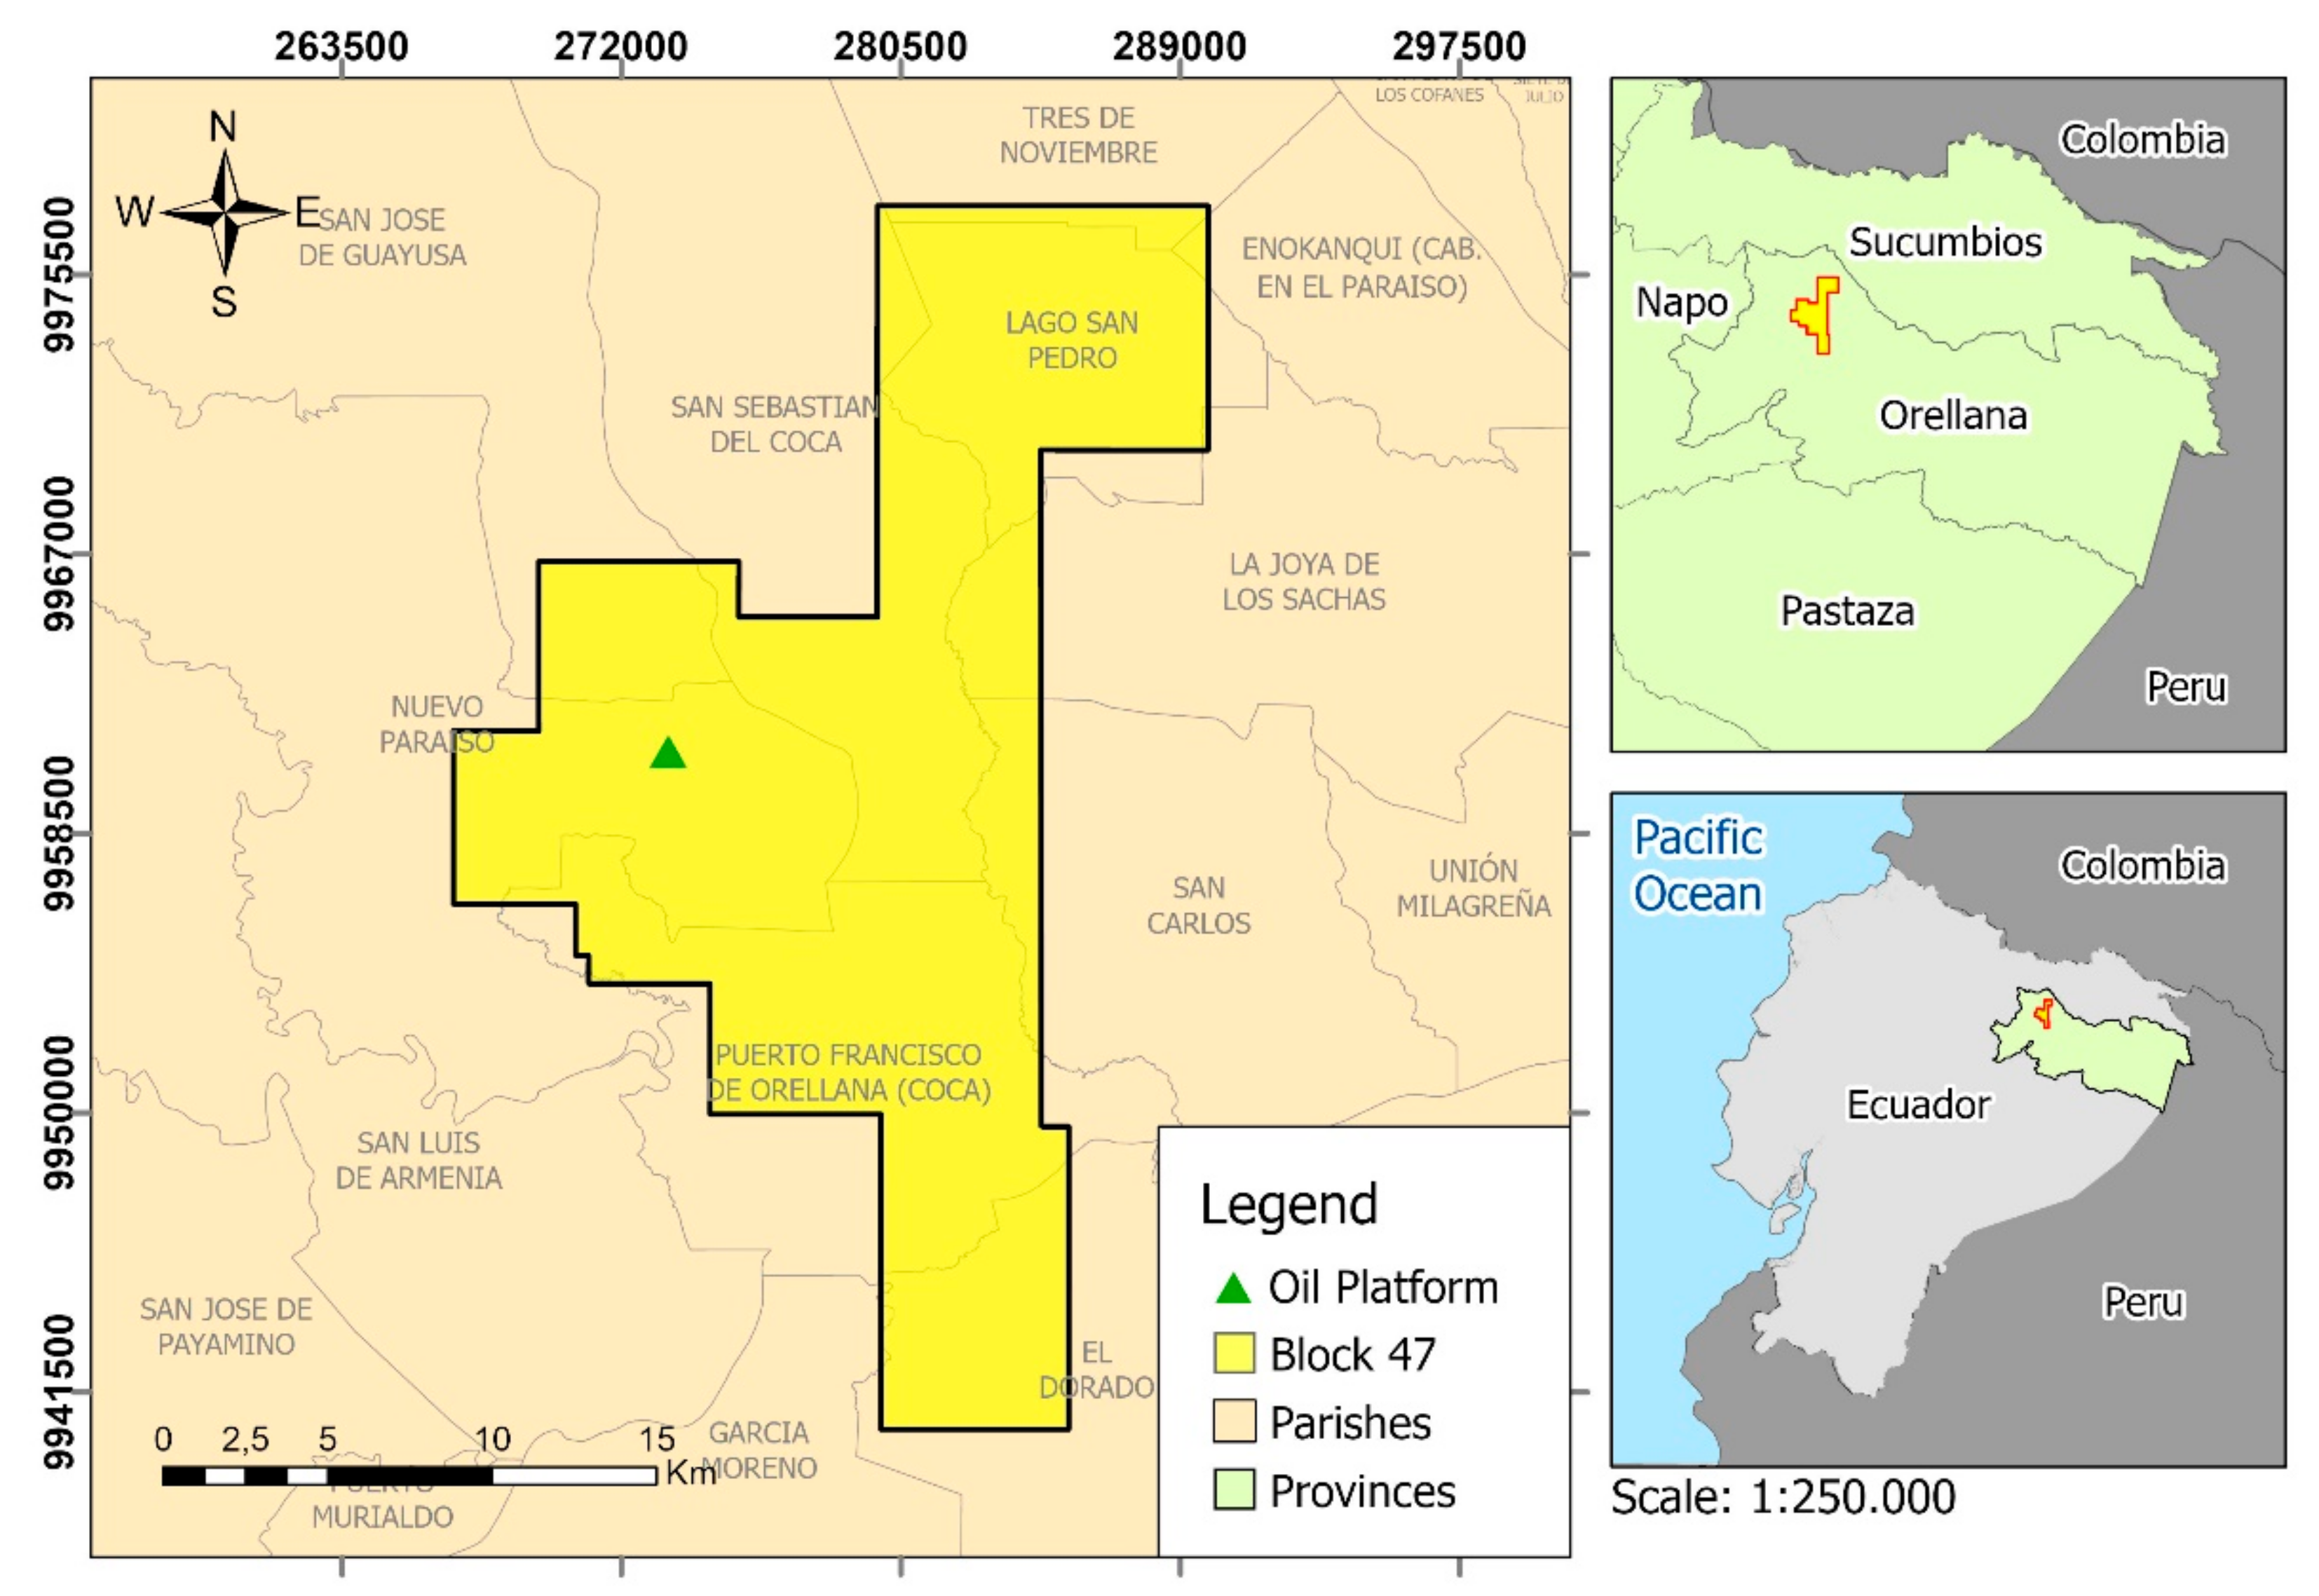
2.1. Study Area

The study area corresponds to the Paraíso Biguno Huachito and Intracampos Block (PBHI), better known as Block 47 (0°12′27″ and 0°29′40″ S, 76°53′14″ and 77°5′28″ W), northwest of the province of Orellana. It covers part of the parishes of Lago San Pedro, Joya de los Sachas, San Carlos, El Dorado, Nuevo Paraíso, San José de Guayusa, San Sebastián del Coca, and the cantonal capital of Puerto Francisco de Orellana, known as El Coca (Figure 1). The study area is > 38,000 ha, and it is located within a tropical rainforest region with a humid tropical climate (according to the Köeppen classification), with consistent rainfall throughout the year, and annual precipitation of 3319 mm [33,34]. This region is mostly covered by forest and agricultural land. It has high influence of activities related to oil extraction, and as a result, human activities linked to the oil industry and agricultural activities represent almost half of the employment sources in the region [35].

2.2. Acquisition and Processing of Data

For data acquisition, a map of oil blocks was used. The map was acquired from the web page of the Secretary of Hydrocarbons of Ecuador [36]. Next, a project was created in ArcGIS Pro (version 2.6). The UTM projection datum/spheroid WGS 1984 Zone 18S was defined, and the oil block map was georeferenced with 26 control points. After that, the vector corresponding to Block 47, shown in Figure 1, was delineated. The LULC maps were obtained from the geoportal of the Ministry of Environment and Water of Ecuador (MAE), corresponding to the years 2000, 2008, and 2018. They are classified by a level 1 categorization defined by the MAE [37]. These maps were overlaid to determine LULC within the area defined by Block 47.
Next, the classes of LULC were grouped as follows: (1) Forest, corresponding to primary forests, forest plantations and arboreal ecosystems regenerated by natural succession and characterized by the presence of trees of different species; (2) agricultural land, formed by areas related to human activities such as agriculture, livestock, and occupation mosaics; (3) urban area, consisting of the spots of populated areas and infrastructure; (4) water bodies, comprising natural and artificial surface water such as rivers and lakes; (5) exposed soil, encompassing areas without vegetation cover related to alluvial plains and sandbanks.

2.3. Landscape Structure Metrics

The landscape structure within Block 47 was quantified using FRAGSTATS software [38], in which class and landscape metrics were determined. In order to analyze the spatiotemporal patterns of landscape change, some of the metrics used in similar studies were considered to identify and spatialize deforestation patterns, influenced by infrastructure and urban areas [39,40]. The metrics of class fragment area (CA), the number of class fragments (NP), the class fragment density (PD), and the class fragment mean size (MPS) have been calculated by tabulating the data obtained in Table 1. After getting the index values, a comparative analysis was done with respect to landscape fragmentation between the years 2000, 2008, and 2018.

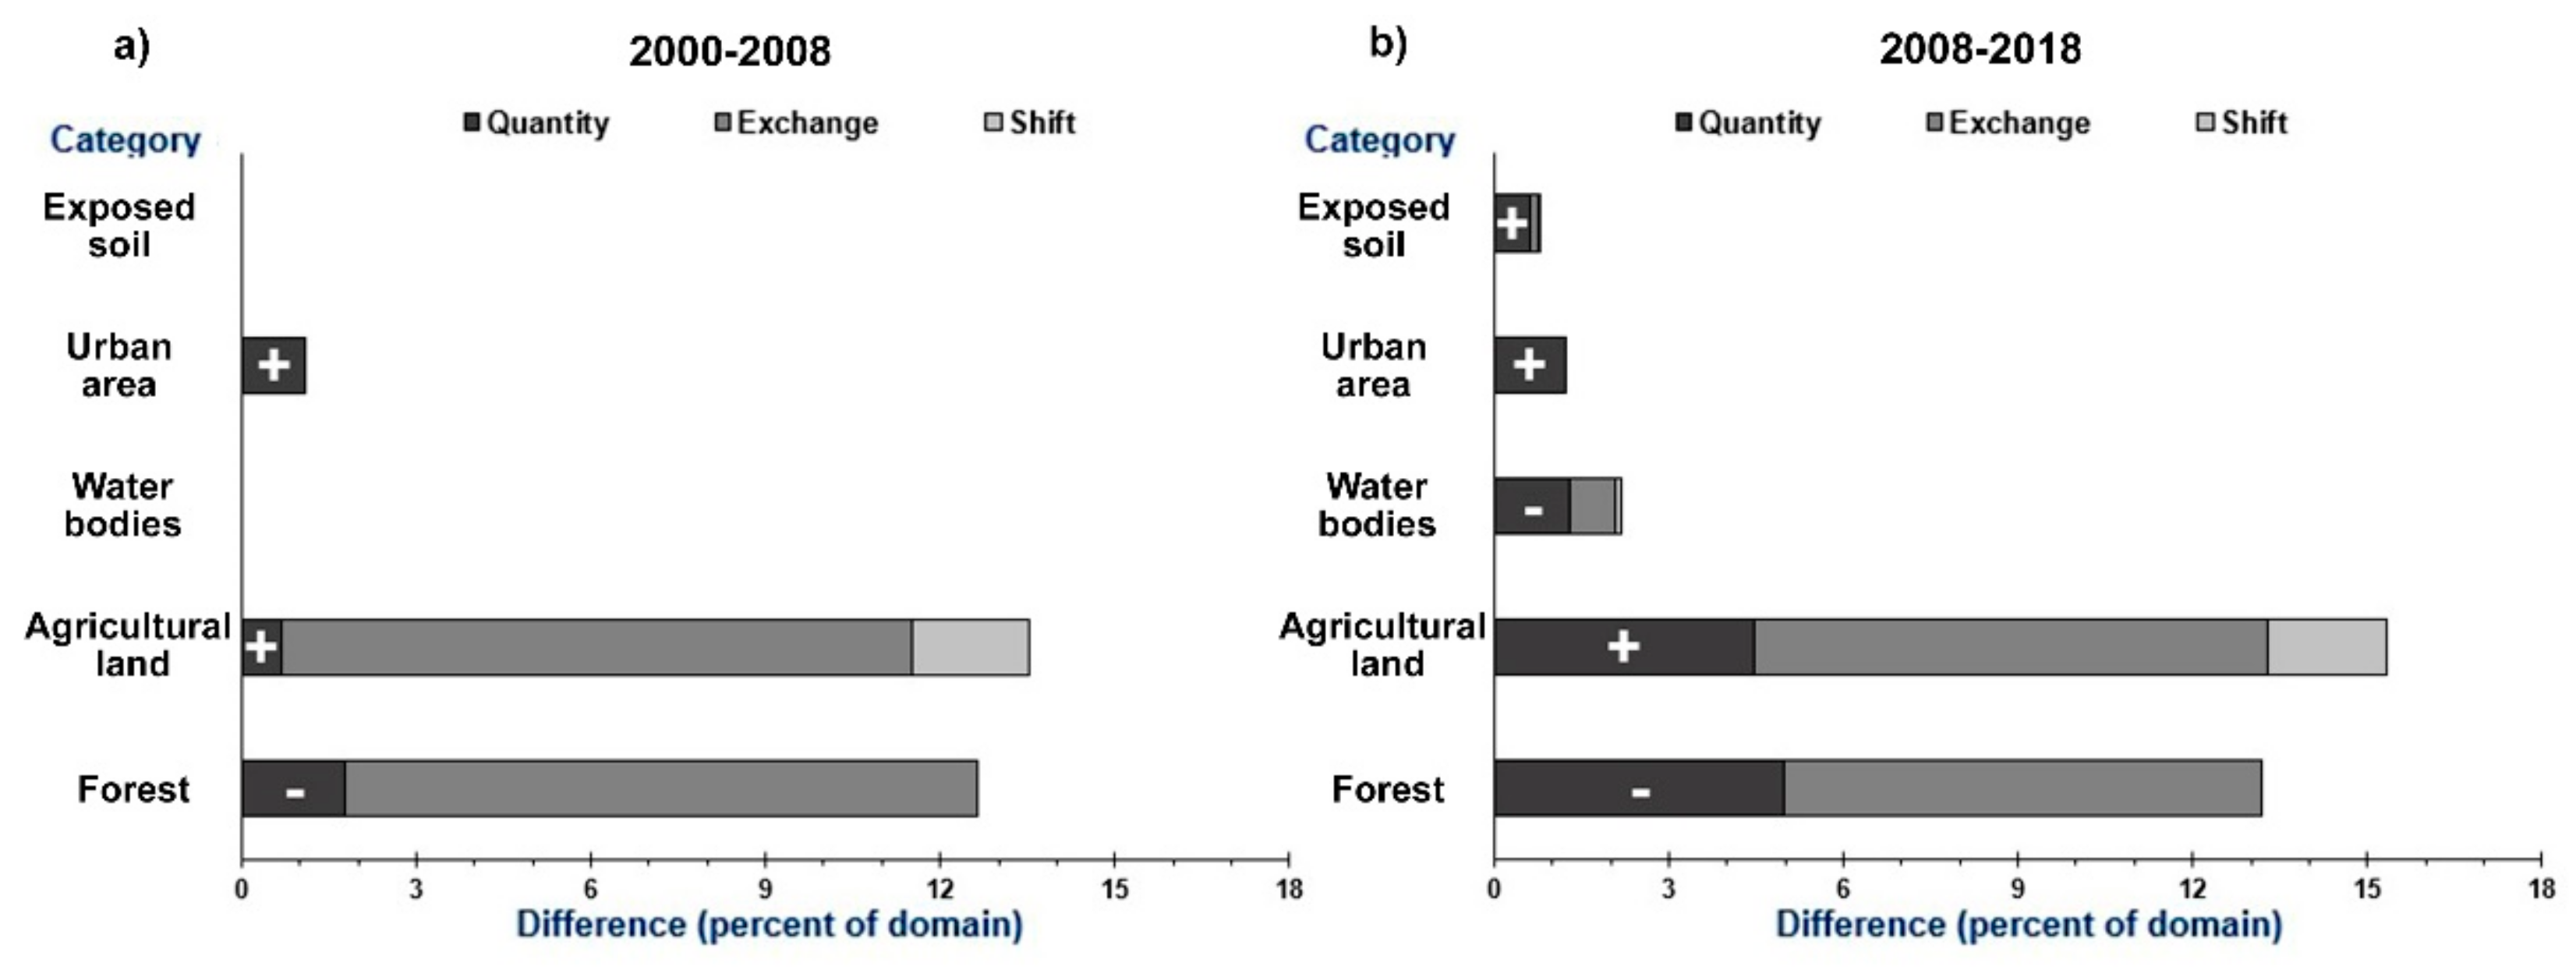
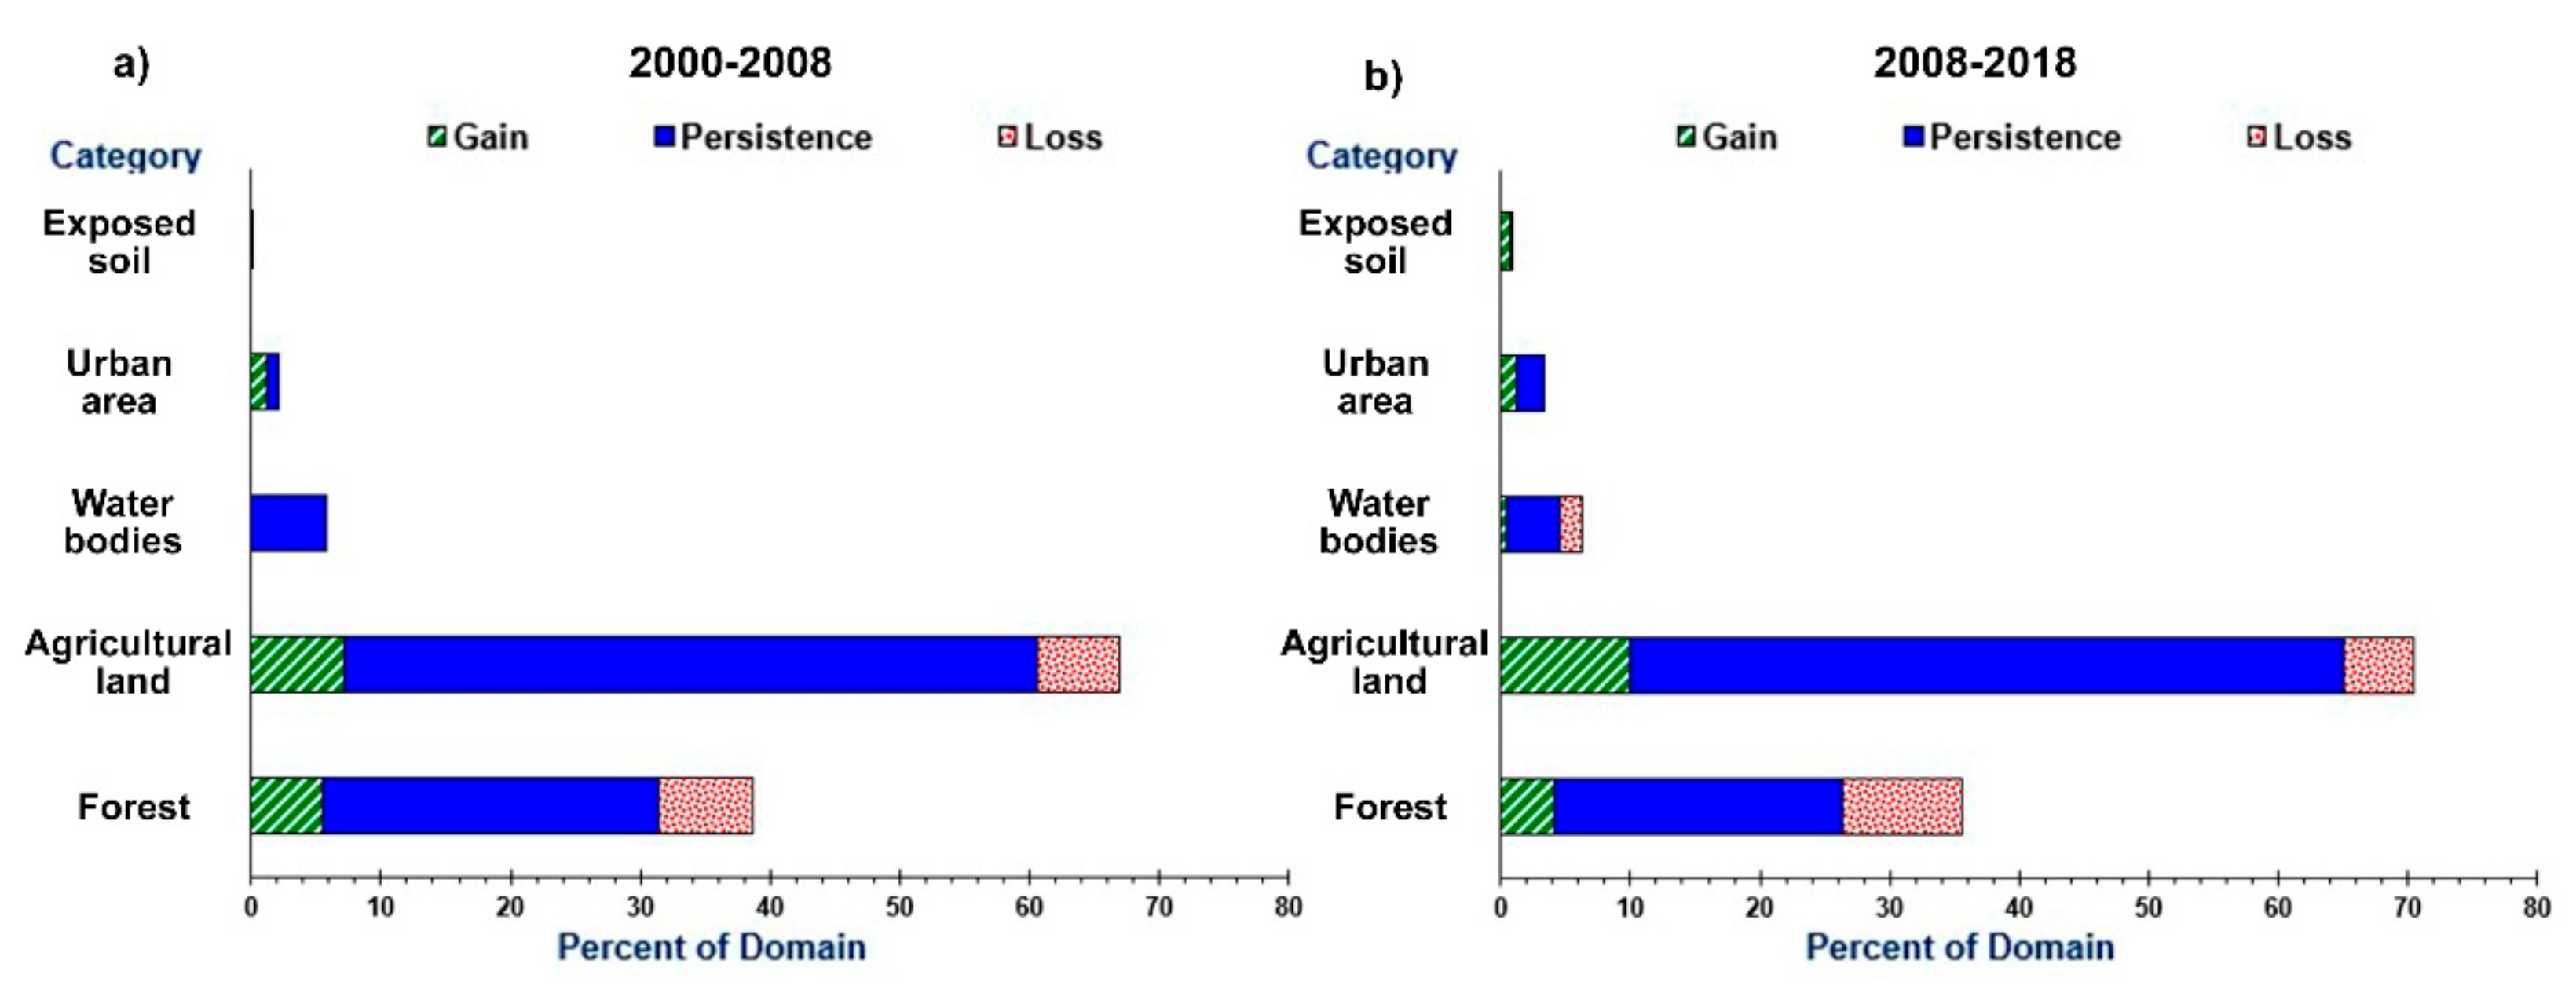
2.4. Detection of Transitions

In order to identify and analyze the systematic changes, as well as the differences in quantity and location of LULC dynamics within Block 47, a transition matrix was made between the study periods. With the data obtained, the methodology proposed by Pontius [41,42] was adapted to determine the persistence, losses, and total gains in relation to the areas occupied by each class within the landscape for the periods 2000–2008 and 2008–2018.

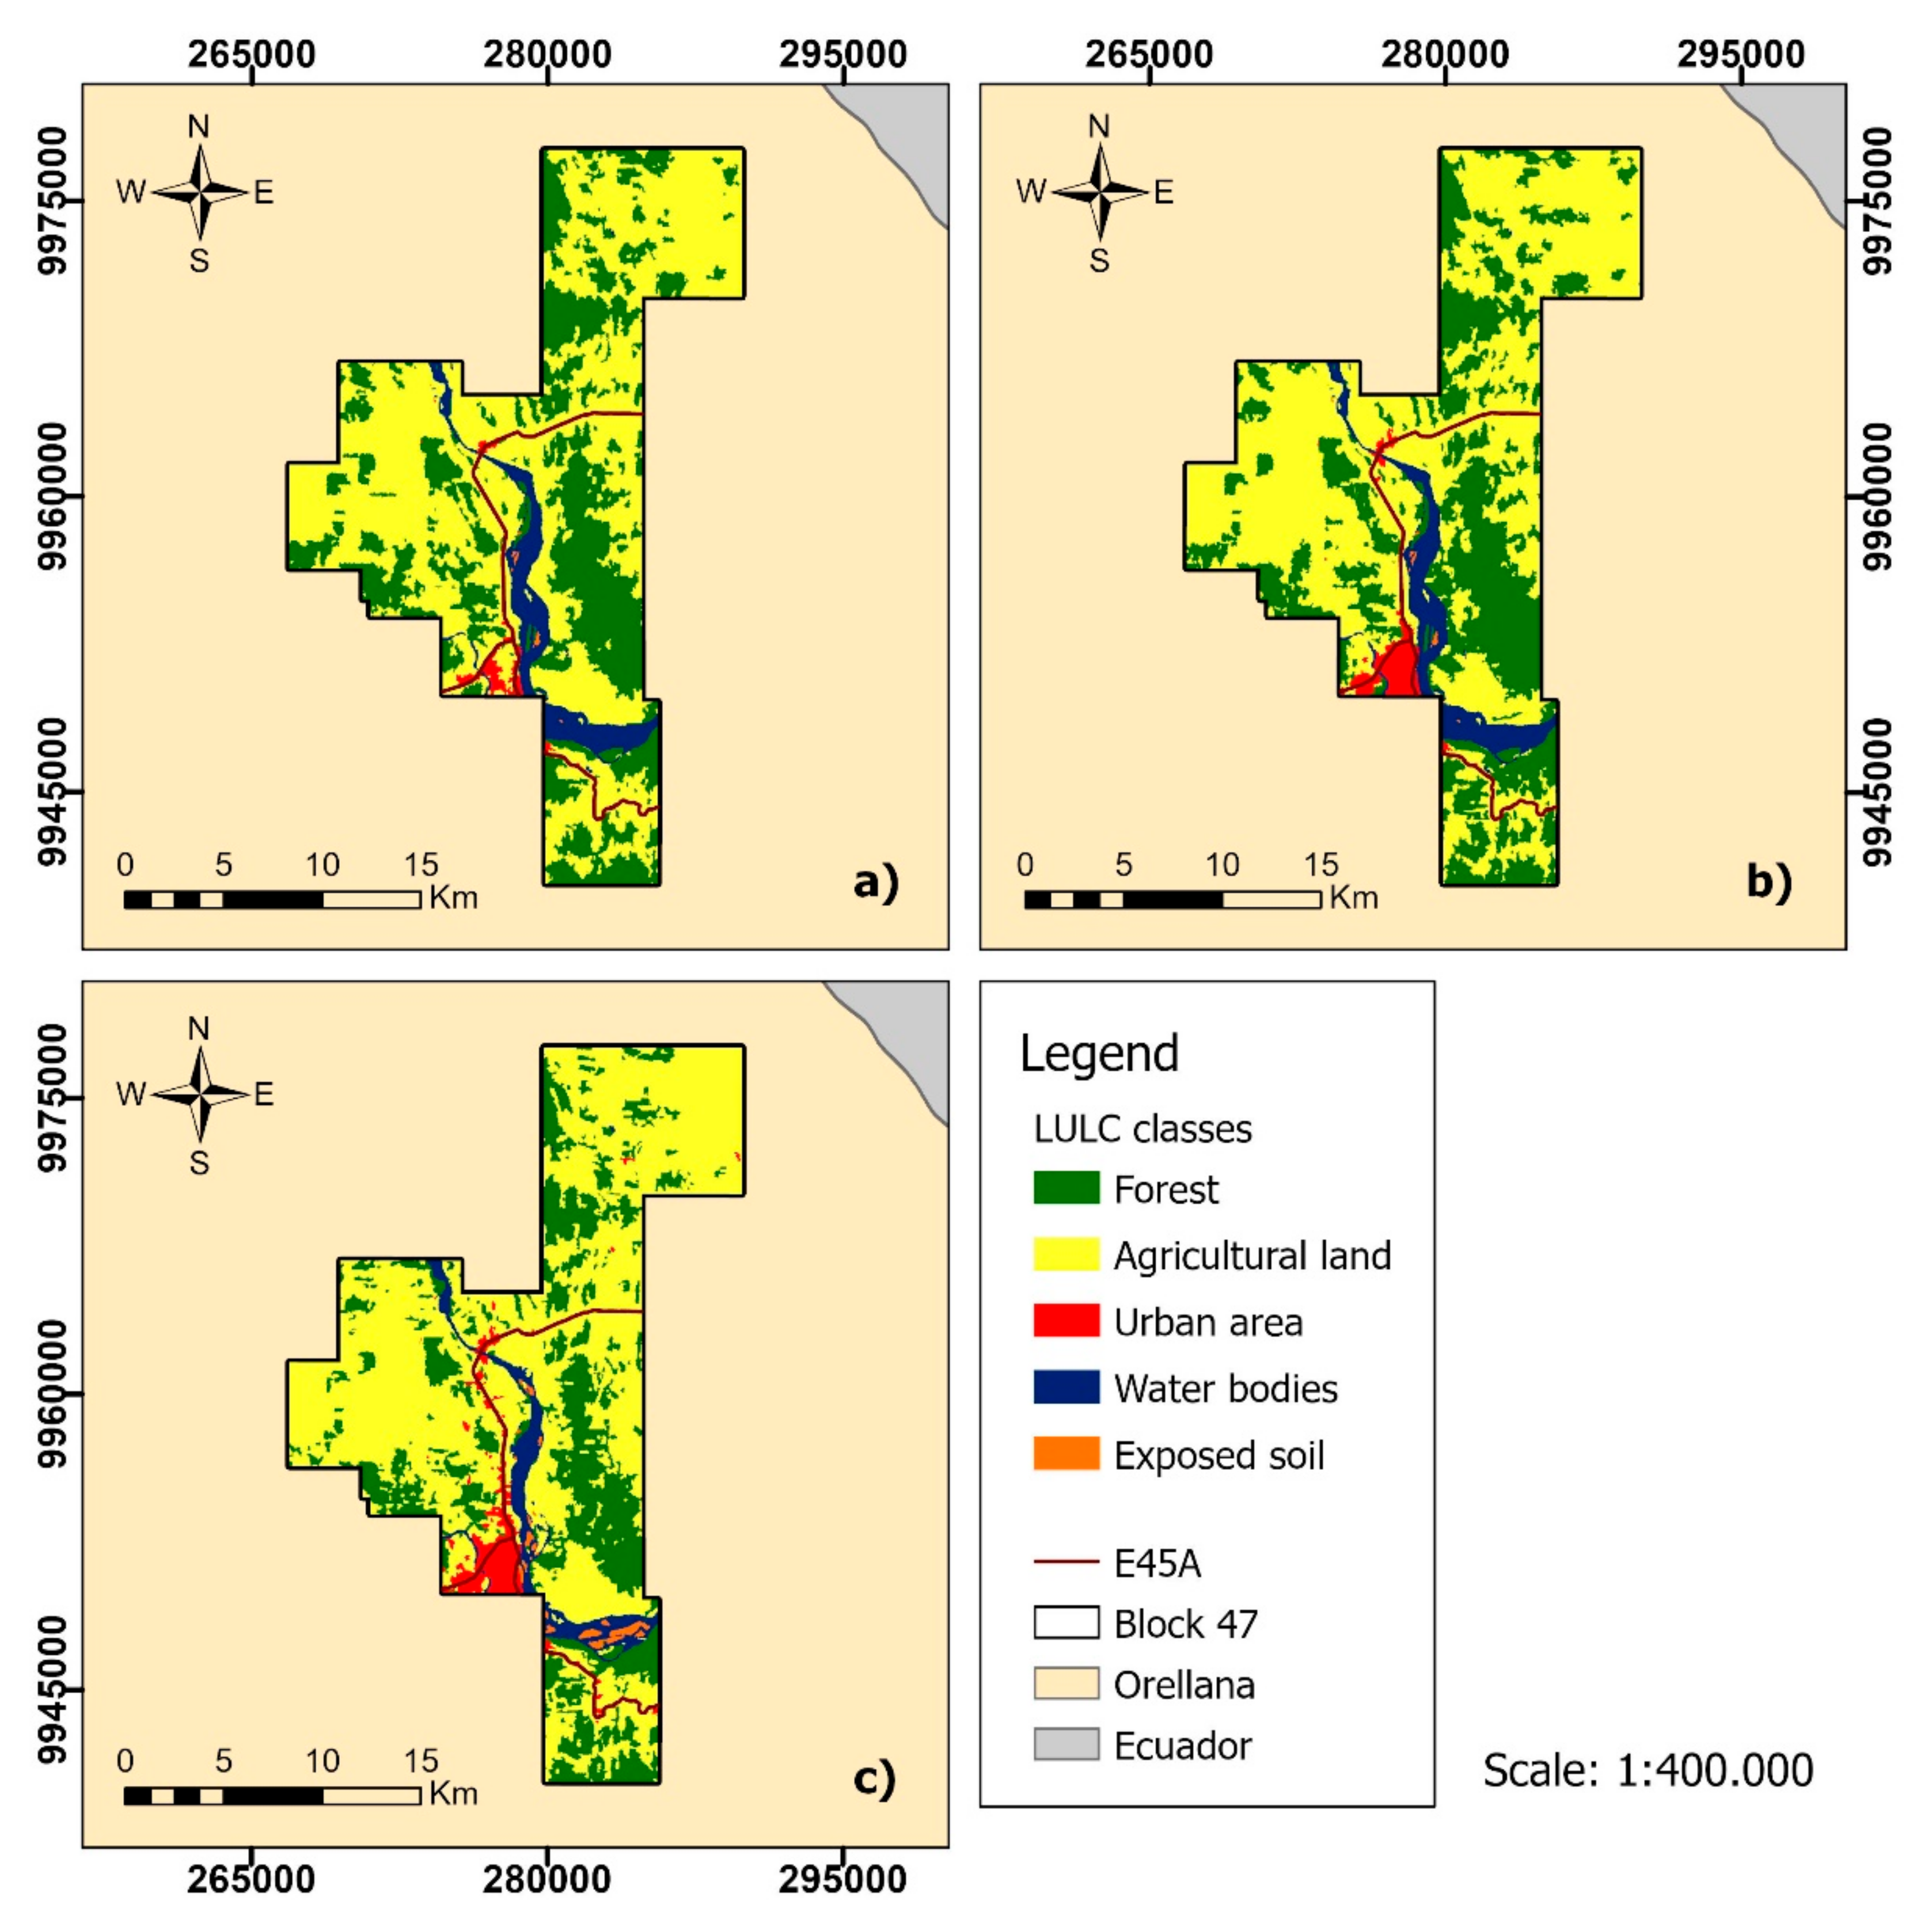
3. Results and Discussion

Thematic maps of LULC within the PBHI Block were generated for the years 2000, 2008, and 2018 (Figure 2). The maps facilitate the identification of the geographic distribution of LULC classes and related the spatial patterns of LULC change within the oil block, over the 18 years of study. From the analysis of the LULC maps, slight alterations in the landscape are observed. Table 1 presents the LULC transition matrix between the years analyzed. The data demonstrates that since the 2000 scenario, the forest is fragmented, with a prevalence of exposed soil classes and water bodies for the period 2000–2008 within Block 47, while this prevalence is not maintained during the period 2008–2018.
For the 2000 scenario, two urban spots of 49 ha and 290 ha were identified, referring to the cities of San Sebastián del Coca and part of Puerto Francisco de Orellana, respectively, which are the main population centers of the province of Orellana. By 2008, these urban spots had expanded approximately twice as much as in 2000, with the section corresponding to Puerto Francisco de Orellana increasing to 679 ha and the one of San Sebastián del Coca expanding to 92 ha. In the 2018 scenario, the expansion of these spots was 1.57 times greater than in 2008, with 919 ha and 177 ha of area occupied by each city, respectively. These cities are interconnected by the Troncal Amazónica Alterna highway (E45A), where small population centers are also identified around the highway. This configuration consolidates the two cities as a space for commercial exchange and the provision of services in the region. These services are largely linked to oil activity [43].
According to the National Institute of Statistics and Census (INEC), in 2001 the province of Orellana had a population of 86,493 inhabitants, by 2010 it had 136,396 inhabitants [44], and the projection for 2018 was 157,520 inhabitants [45]. In the first period of analysis, land cover classes in Block 47 did not undergo major variation (Table 1), with the exception of urban spots that were duplicated. During the last period, transitions were evident for all classes, especially a continuous expansion of urban areas, a sudden extension of exposed soils, and an increase in agricultural land (Table 1). These changes, in particular the continuous expansion of populated zones, are related to the consolidation of settlement as a manifestation of the mobility of people working in the region, linked directly and indirectly to the oil industry.
It should be noted that the northern region of the Ecuadorian Amazon is the area with the greatest presence of oil activity, which means it represents the main source of economic income for the country’s GDP [46]. In this regard, the development of this activity in places with fragile ecosystems and settlements of indigenous peoples means that the human and environmental cost is high [46]. The human impact attributed to oil activity includes the spread of several cases of cancer in the indigenous population [47].
In 2000, only 33.22% (12,814 ha) of Block 47 was covered by tropical forest, while in 2008 and 2018 the region experienced the loss of 690 ha and 1929 ha of forest, respectively (Table 1). During the study period, 22% of the landscape remained as forest. The effect of lesser loss of forest areas during the first period (2000–2008), in relation to the second period (2008–2018), may be associated with fluctuations in labor concentration by the oil industry. A phenomenon of natural restoration is evident in areas abandoned by the resignation of local agricultural practices [48]. In the middle of the last decade, the price of a Brent oil barrel experienced a sharp fall [49], which caused the return of labor to the fields, as a temporary solution to unemployment in the region. This effect may have influenced the loss of forest cover in the second period of analysis.
The study area is also involved in agricultural activities, with significant production of cocoa, coffee, oil palm, corn, and bananas [50]. There are also more than 600 fishponds, making aquaculture the third most important economic activity in the province. These activities, together with hunting and forestry, represent 1.5% of the provincial GDP [50]. In this context, agricultural land over time experienced little variation in its extension, with 23,086 ha (59.85%) in 2000 and an increase to 23,346 ha (60.52%) and 25,067 ha (64.98%) of surface in 2008 and 2018, respectively (Table 1). It is important to mention that during the last period of analysis the local government invested in the improvement of road networks for the conversion of forests into areas of agribusiness in the region [35]. It is possible that this type of investment has motivated a greater growth of agricultural areas during the last period analyzed.
The Coca River crosses Block 47. Its flow feeds the Coca Codo Sinclair hydroelectric plant, located upstream of the study area [51]. In Figure 2, the Coca River is represented by the class of water bodies, which remained constant during the 2000 and 2008 scenarios. However, by 2018, the water bodies presented a significant reduction of 22.5% (506 ha) (Table 1). This reduction may be linked to the operation of the Coca Codo Sinclair hydroelectric plant, built since July 2010 and inaugurated in November 2016. It has an installed capacity of 1500 MW, making it the main source of energy and the largest hydroelectric plant in Ecuador [51,52]. The effect of the reduction of the water surface for the year 2018 caused the appearance of sandbanks in the Coca riverbed (Figure 2). The total area of exposed soil in the 2018 scenario confirms the 8.56-fold increase in this class, directly linked to the new sandbanks (Table 1). In contrast, in the first two scenarios, the area occupied by the exposed soil class remained constant at 32 ha.
The continuous expansion reduces tropical forests in the region, which is supported by the number of fragments and relative participation of the forest class presented in Table 2. According to the data in Table 2, 12.58% of the landscape was covered by 2 large forest fragments (>1000 ha) in 2000. Similarly, by 2008, the same forest fragments were identified with a slight decrease in land cover (12.35% of the landscape). In the last scenario, however, only one large forest fragment was preserved, covering 7.27% of the landscape (Table 2). This last result provided evidence for the reduction of tropical forest within Block 47, producing fragmentation of large forest areas and an increase in smaller fragments (<10 ha), presenting more fragments in fewer forest areas. This is supported by the number of smaller fragments (< 5 ha and 5- < 10 ha) present between 2008 and 2018, which increased from 53 to 116 forest segments, with landscape coverages of 0.83% and 1.85%, respectively.
The landscape metrics reveal the 2018 scenario as the most fragmented (Table 3), because it presents the smallest mean forest patch size (MPS = 111.20 ha), which relates the number of patches and occupied area of the entire forest. It can be inferred that numerous fragments of deforested areas replaced the large patches of tropical forest. On the contrary, the year 2008 exhibits the lowest density of forest patches (PD = 0.63 frag./100 ha) and the highest mean forest fragment size (MPS = 158.39 ha), which presents a lower number of fragments (NP = 271) of large size within the landscape, providing evidence for the greater consolidation of the forest. The previous results support that the greatest fragmentation of the landscape occurred during the last period of analysis, which implies the loss of large forest patches, thus making room for the predominance and greater connectivity of deforested areas.
From the data in Table 1, the graphs in Figure 3 and Figure 4 were obtained. These graphs show the differences in quantity, exchange, displacement, location, and percentage of dominance of the different classes throughout the analysis period [41].
During the period 2000–2008, the greatest variation in the percentage of class dominance was evident (Figure 3a). The forest class was the only one that experienced a negative difference in quantity, with about a 2% decrease in landscape cover. Meanwhile, the urban areas and agricultural land classes experienced a positive variation, increasing by less than 1% of their area within Block 47. These exchange differences highlight the relationship between the classes of agricultural land and forest, in which both classes exchange their spaces within the landscape with a slight displacement of the agricultural land to the forest.
The period 2008–2018 shows a greater interaction between the existing classes within Block 47 (Figure 3b). The forest and agricultural land classes present this interaction, with high area gains for agricultural areas and area losses for forests. Likewise, the pattern of exchange difference between forests and agricultural land is again evident, but to a lesser extent compared to the 2000–2008 period. On the other hand, the classes of exposed soil and urban areas experienced slight differences in quantity, increasing their area by less than 2%.
The negative variation experienced by water bodies indicates the loss of dominance of this class within the study area. During the entire period of analysis, the classes that suffered the greatest negative variation were forests and agricultural land, with a greater loss of dominance of the forest.
Figure 4a shows the dominance and the persistence disposition of the agricultural land class compared to the other classes within Block 47. At the same time, the gains and losses of the areas corresponding to agriculture are linked to the exchange transitions with the forest (Figure 3a). In relation to the other classes, urban areas show a slight gain in the percentage of dominance within the landscape, accounting for population growth in the region. In contrast, the class of water bodies persisted throughout the 2000–2008 period.
During the 2008–2018 period, the growth of agricultural land continued, with more than 10% gain in dominance within the landscape (Figure 4b). The forests land cover suffered a 4% reduction and urban areas only showed gains in the percentage of dominance, compared to the 2000–2008 period. Finally, the class of water bodies experienced a loss in the percentage of dominance within the landscape, as a result of the modification of the Coca River flow, linked to the beginning of the operation of the Coca Codo Sinclair hydroelectric plant. As a consequence, this effect gave way to a gain in the percentage of dominance of the exposed soil class that is directly linked to the appearance of sandbanks in the Coca riverbed.
From the persistence and gain of agricultural land in both periods, it is possible to infer its dominance trend for the coming years. This behavior, linked to the increased fragmentation of tropical forests, produces a reduction in the abundance of plant and animal species. These effects are more noticeable in the last scenario of analysis, with about twice the number of smaller forest fragments (< 10 ha), compared to the 2000 scenario (Table 2). Other studies addressing deforestation in Ecuador found that 99.4% of the areas deforested between 2000–2008 were transformed into agricultural areas. Likewise, 0.23% of these deforested areas were converted into urban areas and rural settlements [28]. The increase in forest fragmentation has adverse effects on Amazonian ecosystems, such as changes in population size and dynamics, and alteration of ecosystem processes due to the degradation of smaller forest fragments [53,54]. There are also physical changes, such as the loss of primary trees replaced by new species of flora of lower height, which causes a greater penetration of sunlight through the fragmented spaces [53].

4. Conclusions

The results obtained made it possible to evaluate the changes in forest cover within Block 47 in a period prior to the beginning of the oil operations and two subsequent periods. It was identified that over time, the areas of forest cover were displaced mainly by agricultural land and urban areas, which fragmented the few segments of tropical forest present in the region. However, these impacts are not directly associated with the beginning of the operations of the oil company Sipetrol, since in the first period analyzed, only 33% of the landscape was covered by forest fragments. This represents a low predominance of forest cover within Block 47 in the pre-operation and oil exploitation period.
Deforestation rates within Block 47 were found to be 86.25 ha/year and 192.9 ha/year, for the periods 2000 to 2008 and 2008 to 2018, respectively. The metrics’ results revealed that the greatest landscape fragmentation occurred in the 2018 scenario, with approximately twice as many forest fragments smaller than 10 ha, compared to the 2000 scenario. This implies the loss of large forest patches, resulting in the dominance and greater connectivity of deforested areas.
It is important to highlight the significant reduction of the Coca River water surface in the 2018 period, linked to the loss of the river flow caused by the operation of the Coca Codo Sinclair hydroelectric power plant, inaugurated in November 2016. It is known that hydroelectric energy is clean, efficient, and renewable, however, it is necessary to know the adverse effects in the region that may be caused by the hydrological alteration of the Coca River, detected in this study.

Author Contributions

Conceptualization, Sergio Llerena-Montoya, Andrés Velastegui-Montoya, and Bryan Zhirzhan-Azanza; formal analysis, Sergio Llerena-Montoya, Andrés Velastegui-Montoya, Bryan Zhirzhan-Azanza, and Viviana Herrera-Matamoros; investigation, Sergio Llerena-Montoya, Andrés Velastegui-Montoya, and Bryan Zhirzhan-Azanza; methodology, Sergio Llerena-Montoya, Andrés Velastegui-Montoya, Bryan Zhirzhan-Azanza, and Marcos Adami; project administration, Andrés Velastegui-Montoya; supervision, Andrés Velastegui-Montoya and Viviana Herrera-Matamoros; writing—original draft, Sergio Llerena-Montoya, Andrés Velastegui-Montoya, Bryan Zhirzhan-Azanza, and Viviana Herrera-Matamoros; writing—review and editing, Sergio Llerena-Montoya, Andrés Velastegui-Montoya, Viviana Herrera-Matamoros, Marcos Adami, Aline de Lima, Francisco Moscoso-Silva, and Luis Encalada. All authors have read and agreed to the published version of the manuscript.

Funding

The APC was funded by ESPOL Polytechnic University.

Data Availability Statement

The data presented in this study are available on request from the corresponding author.

Acknowledgments

This study was supported by the research project of the ESPOL University (Escuela Superior Politécnica del Litoral): “Estudios de impacto ambiental de grandes obras de ingeniería en la Amazonía ecuatoriana” (Studies of environmental impact of major engineering works in the Ecuadorian Amazon) with code no. FICT-53-2020.FICT-53-2020.

Conflicts of Interest

The authors declare no conflict of interest. The funders had no role in the design of the study; in the collection, analyses, or interpretation of data; in the writing of the manuscript, or in the decision to publish the results.

References

  1. Carrión, A. Economic nationalism and the public dominion of mineral resources in Ecuador, 1929–1941. Extr. Ind. Soc. 2015, 2, 104–111. [Google Scholar] [CrossRef]
  2. Lessmann, J.; Fajardo, J.; Muñoz, J.; Bonaccorso, E. Large expansion of oil industry in the Ecuadorian Amazon: Biodiversity vulnerability and conservation alternatives. Ecol. Evol. 2016, 6, 4997–5012. [Google Scholar] [CrossRef] [PubMed] [Green Version]
  3. Empresa Pública de Hidrocarburos del Ecuador. La historia del petróleo en Ecuador. In El Petróleo en el Ecuador la Nueva Era Petrolera; Monard, N., Ed.; Coordinación General de Imagen Empresarial EP Petroecuador: Quito, Ecuador, 2013; pp. 16–23. [Google Scholar]
  4. The Center for Economical and Social Rights. Rights Violations in the Ecuadorian Amazon: The Human Consequences of Oil Development; Health and Human Rights: New York, NY, USA, 1994. [Google Scholar]
  5. Welford, M.R.; Yarbrough, R.A. Serendipitous conservation: Impacts of oil pipeline construction in rural northwestern Ecuador. Extr. Ind. Soc. 2015, 2, 766–774. [Google Scholar] [CrossRef]
  6. Asociación de la Industria Hidrocarburifera del Ecuador. El Petróleo en Cifras 2019; AIHE: Quito, Ecuador, 2020; Available online: https://www.aihe.org.ec/2020/05/09/aihe-publica-el-folleto-petroleo-en-cifras-2019/ (accessed on 14 December 2020).
  7. Ministerio de Energía y Recursos Naturales No Renovables. Informe Anual del Potencial Hidrocarburífero del Ecuador 2018; Ministerio de Mineria: Quito, Ecuador, 2018. Available online: https://www.recursosyenergia.gob.ec/wp-content/uploads/2019/11/Informe-Anual-del-Potencial-Hidrocarburiífero-del-Ecuador-2018.pdf (accessed on 12 December 2020).
  8. Subgerencia de Programación y Regulación. Reporte del Sector Petrolero: IV Trimestre de 2019; Banco Central del Ecuador: Quito, Ecuador, 2019; Available online: https://contenido.bce.fin.ec/documentos/Estadisticas/Hidrocarburos/ASP201906.pdf (accessed on 20 November 2020).
  9. Asociacion De Bancos Del Ecuador. Boletín Macroeconómico: Junio 2019; ASOBANCA: Quito, Ecuador, 2019; Available online: http://www.asobanca.org.ec/publicaciones/bolet%C3%ADn-macroecon%C3%B3mico/bolet%C3%ADn-macroecon%C3%B3mico-junio-2019 (accessed on 20 November 2020).
  10. Myers, N.; Mittermeier, R.A.; Mittermeier, C.G.; da Fonseca, G.A.B.; Kent, J. Biodiversity hotspots for conservation priorities. Nature 2000, 403, 853–858. [Google Scholar] [CrossRef] [PubMed]
  11. Bass, M.S.; Finer, M.; Jenkins, C.N.; Kreft, H.; Cisneros-Heredia, D.F.; McCracken, S.F.; Pitman, N.C.A.; English, P.H.; Swing, K.; Villa, G.; et al. Global Conservation Significance of Ecuador’s Yasuní National Park. PLoS ONE 2010, 5, e8767. [Google Scholar] [CrossRef] [PubMed]
  12. Van Teijlingen, K. Minería a gran escala, pluralismo territorial y contención: Un mapeo de encuentros y desencuentros en la Amazonia ecuatoriana. Estud. Atacameños 2019, 275–299. [Google Scholar] [CrossRef]
  13. López, V.; Espíndola, F.; Calles, J.; Ulloa, J. Atlas “Amazonía Ecuatoriana Bajo Presión”; EcoCiencia: Quito, Ecuador, 2013; ISBN 9789942946027. [Google Scholar]
  14. Confederación de Nacionalidades Indígenas del Ecuador Categoría: Nacionalidades-Amazonía. Available online: https://conaie.org/category/nacionalidades-amazonia/ (accessed on 26 September 2019).
  15. Altmann, P. Una breve historia de las organizaciones del Movimiento Indígena del Ecuador. Antropol. Cuad. Investig. 2013, 12, 105–121. [Google Scholar] [CrossRef]
  16. Potes, V. Análisis de la Aplicación del Derecho Ambiental en la Amazonía Ecuatoriana y el Rol de las Fiscalías Ambientales; CEDA (Centro Ecuatoriano de Derecho Ambiental): Quito, Ecuador, 2010; ISBN 978-9978-9946-8-9. [Google Scholar]
  17. Feichtner, M.F. Toxic Ghost Acres, o la dinámica de la eliminación de desechos de producción de petróleo en la Amazonía ecuatoriana, de los años setenta a noventa. HALAC Hist. Ambient. Latinoam. Caribeña 2020, 10, 23–51. [Google Scholar] [CrossRef]
  18. Ministerio de Ralaciones Exteriores y Movilidad Humana. El caso Chevron/Texaco en Ecuador: Una lucha por la justicia ambiental y social; Cancillería Ecuador: Quito, Ecuador, 2015; p. 26. Available online: https://www.cancilleria.gob.ec/wp-content/uploads/2015/06/Expediente-Caso-Chevron-abril-2015.pdf (accessed on 23 December 2020).
  19. Ministerio de Relaciones Exteriores y Movilidad Humana. La Cruda Realidad del Caso Chevron-Texaco; Cancillería Ecuador: Quito, Ecuador, 2014; p. 12. Available online: https://www.cancilleria.gob.ec/wp-content/uploads/2013/04/la-cruda-realidad-del-caso-chevron-texaco-esp.pdf (accessed on 13 November 2020).
  20. Buccina, S.; Chene, D.; Gramlich, J. Accounting for the environmental impacts of Texaco’s operations in Ecuador: Chevron’s contingent environmental liability disclosures. Account. Forum 2013, 37, 110–123. [Google Scholar] [CrossRef]
  21. Miren, G.-B.C. XII Ronda Petrolera Intracampos Ecuador 2020; Oficina Económica y Comercial de España en Quito: Quito, Ecuador, 2020; p. 30. [Google Scholar]
  22. Becerra, R. Las Rondas Petroleras y los Bloques Petroleros en el Ecuador. Petróleo Al Día 2015, 1, 21–29. [Google Scholar]
  23. Price Waterhouse Coopers. ENAP SIPETROL S.A. y FILIALES—Estado de Situación Financiera Consolidados; PWC: Santiago, Chile, 2015; Available online: https://www.senado.cl/site/presupuesto/2015/cumplimiento/Articulado2015/Art.14N°7EmpresasdelEstado/ORD.561ArticuladoyTesoroPúblico1°Trim2016/II.ayb/EnapSipetrolS.A.Diciembre2015.pdf (accessed on 5 December 2020).
  24. Deloitte Touche Tohmatsu Limited. Estados de Situación Financiera Consolidados Intermedios Correspondientes al Periodo Terminado al 30 de Junio de 2018; ENAP SIPETROL S.A.: Santiago, Chile, 2018; Available online: https://www.enap.cl/descarga/forzada/6334 (accessed on 25 November 2020).
  25. Producción Mensual Nacional de Petróleo Fiscalizado—Periodo: Enero–Diciembre 2019; Agencia de Regulación y Control Hidrocarburífero: Quito, Ecuador, 2019.
  26. ENAP. La Empresa Enap Sipetrol. Available online: https://www.enap.cl/pag/15/1333/enap_sipetrol (accessed on 15 October 2020).
  27. Southgate, D.; Sierra, R.; Brown, L. The causes of tropical deforestation in Ecuador: A statistical analysis. World Dev. 1991, 19, 1145–1151. [Google Scholar] [CrossRef]
  28. Sierra, R. Patrones y Factores de Deforestación en el Ecuador Continental, 1990–2010. Y un Acercamiento a los Próximos 10 Años; Conservación Internacional Ecuador, Forest Trends: Quito, Ecuador, 2013. [Google Scholar]
  29. Sierra, R. Dynamics and patterns of deforestation in the western Amazon: The Napo deforestation front, 1986–1996. Appl. Geogr. 2000, 20, 1–16. [Google Scholar] [CrossRef]
  30. Drohan, P.J.; Finley, J.C.; Roth, P.; Schuler, T.M.; Stout, S.L.; Brittingham, M.C.; Johnson, N.C. Perspectives from the field: Oil and Gas Impacts on Forest Ecosystems: Findings Gleaned from the 2012 Goddard Forum at Penn State University. Environ. Pract. 2012, 14, 394–399. [Google Scholar] [CrossRef]
  31. Yanai, A.M.; de Alencastro Graça, P.M.L.; Escada, M.I.S.; Ziccardi, L.G.; Fearnside, P.M. Deforestation dynamics in Brazil’s Amazonian settlements: Effects of land-tenure concentration. J. Environ. Manag. 2020, 268, 110555. [Google Scholar] [CrossRef]
  32. Velastegui-Montoya, A.; de Lima, A.; Adami, M. Multitemporal Analysis of Deforestation in Response to the Construction of the Tucuruí Dam. ISPRS Int. J. Geo-Inf. 2020, 9, 583. [Google Scholar] [CrossRef]
  33. Peel, M.C.; Finlayson, B.L.; McMahon, T.A. Updated world map of the Köppen-Geiger climate classification. Hydrol. Earth Syst. Sci. 2007, 11, 1633–1644. [Google Scholar] [CrossRef] [Green Version]
  34. Merkel, A. Provincia de Orellana Clima. Available online: https://es.climate-data.org/america-del-sur/ecuador/provincia-de-orellana-63/ (accessed on 5 October 2020).
  35. Gobierno Autónomo Descentralizado de la Provincia de Orellana. Plan de Desarrollo y Ordenamiento Territorial de la Provincia de Orellana 2015-2019; GADPO: Orellana, Ecuador, 2015. Available online: https://www.gporellana.gob.ec/wp-content/uploads/2015/11/PDYOT-2015-2019_ORELLANA_ACTUALIZADO.pdf (accessed on 30 October 2020).
  36. Secretaría de Hidrocarburos. Mapa de Bloques. Available online: http://www.geoyasuni.org/wp-content/uploads/2013/07/MAPA_CATASTRAL_ECUADOR_2012.jpg (accessed on 25 January 2020).
  37. Ministerio del Ambiente del Ecuador Geoportal Ministerio del Ambiente y Agua. Available online: http://ide.ambiente.gob.ec/mapainteractivo/ (accessed on 24 October 2020).
  38. McGarigal, K.; Marks, B.J. FRAGSTATS: Spatial Pattern Analysis Program for Quantifying Landscape Structure; U.S. Department of Agriculture, Forest Service, Pacific Northwest Research Station: Portland, OR, USA, 1995. [Google Scholar]
  39. Xu, X.; Xie, Y.; Qi, K.; Luo, Z.; Wang, X. Detecting the response of bird communities and biodiversity to habitat loss and fragmentation due to urbanization. Sci. Total Environ. 2018, 624, 1561–1576. [Google Scholar] [CrossRef] [PubMed]
  40. Velástegui, A.D.M.; de Lima, A.M.M.; Adami, M. Analysis of the Land Cover Around a Hydroelectric Power Plant in the Brazilian Amazon. Anuário Do Instituto Geociencias 2019, 42, 74–86. [Google Scholar] [CrossRef]
  41. Pontius Jr, R.G.; Millones, M. Death to Kappa: Birth of quantity disagreement and allocation disagreement for accuracy assessment. Int. J. Remote Sens. 2011, 32, 4407–4429. [Google Scholar] [CrossRef]
  42. Pontius Jr, R.G.; Shusas, E.; McEachern, M. Detecting important categorical land changes while accounting for persistence. Agric. Ecosyst. Environ. 2004, 101, 251–268. [Google Scholar] [CrossRef]
  43. Mateo, J.P.; García, S. El sector petrolero en Ecuador. 2000–2010. Probl. Desarro 2014, 45, 113–139. [Google Scholar] [CrossRef] [Green Version]
  44. Instituto Nacional de Estadística y Censos Población y Demografía. Available online: https://www.ecuadorencifras.gob.ec/censo-de-poblacion-y-vivienda/ (accessed on 8 April 2020).
  45. Instituto Nacional de Estadística y Censos Proyecciones Poblacionales. Available online: https://www.ecuadorencifras.gob.ec/proyecciones-poblacionales/ (accessed on 8 April 2020).
  46. Leguia, D.; Moscoso, F. Análisis de Costos de Oportunidad y Potenciales Flujos de Ingresos por REDD+: Una Aproximación Económica—Espacial Aplicada al Caso del Ecuador; Programa Nacional Conjunto ONU REDD Ecuador, Ministerio de Ambiente del Ecuador: Quito, Ecuador, 2014. [Google Scholar]
  47. Buitrón Andrade, R.; Romero Proaño, P. Relación entre tipos de cáncer y zonas de explotación petrolera en la Amazonía ecuatoriana. TSAFIQUI Rev. Científica En Cienc. Soc. 2011, 2, 109–127. [Google Scholar] [CrossRef] [Green Version]
  48. Ministerio del Ambiente y Agua; Ministerio de Agricultura y Ganadería; Programa de las Naciones Unidas para el Desarrollo. La Deforestación en el Ecuador, 1990–2018: Factores, Promotores y Tendencias Recientes; PROAmazonía: Quito, Ecuador, 2020. [Google Scholar]
  49. Baumeister, C.; Kilian, L. Understanding the decline in the price of oil since June 2014. J. Assoc. Environ. Resour. Econ. 2016, 3, 131–158. [Google Scholar] [CrossRef] [Green Version]
  50. Gobierno Autónomo Descentralizado de la Provincia de Orellana. Plan Estratégico de Desarrollo Económico Local de la Provincia de Orellana; GADPO: Orellana, Ecuador, 2018. Available online: https://www.gporellana.gob.ec/wp-content/uploads/2019/04/GAPO-PRODEL_DOCUMENTO-FINAL0818-1.pdf (accessed on 30 October 2020).
  51. Ministerio de Energía y Recursos Naturales no Renovables. Coca Codo Sinclair. Available online: https://www.recursosyenergia.gob.ec/coca-codo-sinclair/ (accessed on 28 March 2020).
  52. CELEC EP Costo y Beneficios—Central Hidroeléctrica Coca Codo Sinclair. Available online: https://www.celec.gob.ec/cocacodosinclair/index.php/2015-09-07-17-45-09/footers/coca-codo-sinclair2/beneficios (accessed on 24 January 2021).
  53. Laurance, W.F.; Camargo, J.L.C.; Luizão, R.C.C.; Laurance, S.G.; Pimm, S.L.; Bruna, E.M.; Stouffer, P.C.; Bruce Williamson, G.; Benítez-Malvido, J.; Vasconcelos, H.L.; et al. The fate of Amazonian forest fragments: A 32-year investigation. Biol. Conserv. 2011, 144, 56–67. [Google Scholar] [CrossRef]
  54. Haddad, N.M.; Brudvig, L.A.; Clobert, J.; Davies, K.F.; Gonzalez, A.; Holt, R.D.; Lovejoy, T.E.; Sexton, J.O.; Austin, M.P.; Collins, C.D.; et al. Habitat fragmentation and its lasting impact on Earth’s ecosystems. Sci. Adv. 2015, 1, e1500052. [Google Scholar] [CrossRef] [PubMed] [Green Version]
Figure 1. Location of the study area: Block 47.
Ijgi 10 00191 g001
Figure 2. Thematic maps of LULC within Block 47, referring to the years 2000 (a), 2008 (b), and 2018 (c).
Ijgi 10 00191 g002
Figure 3. Quantity, exchange, and displacement components in relation to the percentage of predominance by class, referring to the periods 2000–2008 (a) and 2008–2018 (b).
Ijgi 10 00191 g003
Figure 4. Gain, persistence, and loss in relation to the percentage of dominance for each class, referring to the periods 2000–2008 (a) and 2008–2018 (b).
Ijgi 10 00191 g004
Table 1. LULC (land use and land cover) transition matrix from 2000–2008 and 2008–2018 within Block 47, with areas in hectares (ha).
2008
2000ForestAgricultural LandWater BodiesUrban AreaExposed SoilTotal (b)Permanence
Forest10,0322739043012,81478%
Agricultural land209220,6080386023,08689%
Water bodies002245102246100%
Urban area0003990399100%
Exposed soil00003232100%
Total (a)12,12423,34722458293238,577
Variation (a–b)−690261−14300
2018
2008ForestAgricultural LandWater BodiesUrban AreaExposed SoilTotal (b)Permanence
Forest8616339621702112,12471%
Agricultural land157121,247130395323,34691%
Water bodies541415738245224570%
Urban area0008290829100%
Exposed soil31015053315%
Total (a)10,19525,0671739130227438,577
Variation (a–b)−19291721−506473241
Table 2. Number of fragments and relative land cover share of forest fragments within Block 47 for the years 2000, 2008, and 2018.
Size of Fragments. [ha]Number of FragmentsRelative Land Cover
200020082018200020082018
<54538910.300.170.71
5–<101715250.310.661.14
10–<50069617412.812.0211.3
500–<10003447.186.246.03
>100022112.5812.357.27
Total13612019533.2231.4326.43
Table 3. Number (NP), density (PD), and mean size (MPS) of forest fragments in 2000, 2008, and 2018.
YearNP [unit.]PD [frag./100 ha]MPS [ha]
20003120.73137.58
20082710.63158.39
20183860.90111.20
Publisher’s Note: MDPI stays neutral with regard to jurisdictional claims in published maps and institutional affiliations.

