1. Introduction
Sustainable mobility is one of the main concerns of policy-makers. A good strategy to reach this goal it is to reduce the imbalance between private vehicle use and transit ridership [
1,
2]. In this respect, transport companies and policy-makers should pay attention to guarantee a good level of Public Transport (PT) Quality of Service (QoS). QoS depends on several parameters, differently perceived by users and operators: on one hand, users want to be satisfied by the service offered (e.g., in terms of frequency, travel time, cost); on the other, operators aim at increasing the ridership with the lowest possible cost. Both issues should be satisfied to achieve a good quality of the system and affect PT use and effectiveness.
In order to evaluate such parameters, a continuous monitoring of data on both demand and supply sides should be performed. While the company itself often monitors supply data, demand data and the customer point of view are sometimes neglected [
3]. This is also because traditional methods of acquiring information related to the demand and the user’s point of view (e.g., surveys, questionnaires) can be expensive and time-consuming. Finding correlations between demand and supply data might reduce the need for surveys (and their related cost and time) and facilitate the adoption of corrective measures to improve the QoS and ridership as well. Some attempts head in that direction, by linking PT QoS and accessibility [
4,
5]. However, they rely on data on perceived accessibility acquired with the involvement of users, and they are not spatially based, making it difficult to derive detailed spatially-located policy implications.
This paper aims at filling this gap by proposing a spatial and statistical approach for the analysis of data of different sources to explore the correlation among PT use, user satisfaction and service accessibility. The aim is to find useful and simple indicators for sustainable mobility planning.
Accessibility can be considered a good supply indicator, being a widespread concept in transport planning, particularly suitable to represent the potential of opportunities provided by PT [
6,
7,
8]. In more detail, in this paper, the research question is linked to the potential use of the Public Transport Accessibility Level (PTAL) [
6] as a proxy of the QoS.
The methodology will be applied to the case study of university students’ mobility in the city of Catania (Italy), although it can be considered scalable to other contexts.
Correlations between PTAL, user satisfaction and other relevant data have been investigated by a spatial data processing, a simple linear correlation analysis and a Multiple Correspondence Analysis (MCA) [
9].
To the best of the authors’ knowledge, no attempt has been made so far to link data about user satisfaction with supply provision and accessibility indicators in a Geographic Information System (GIS) framework. Due to the intrinsic spatial nature of mobility and of the aforementioned parameters, a GIS-based framework is considered adequate to support a correct planning of PT services oriented towards accessibility and quality [
10].
The remainder of the paper is organized as follows.
Section 2 introduces an overview on the main literature related to university students’ mobility, PT QoS and PT accessibility.
Section 3 presents the materials and methods used for the study, based on a combination of data from different sources and spatial and statistical analyses.
Section 4 introduces the case study, while
Section 5 describes the results obtained and
Section 6 discusses them.
Section 7 concludes the paper by underlying the main limitations and future research endeavors.
2. Literature Review and Research Framework
This section aims at positioning the paper with respect to the three main issues that are investigated, i.e., university students’ mobility, PT QoS and accessibility, as detailed in the following subsections.
2.1. University Students’ Mobility
University campuses can be considered as small cities, reached by students with different transport modes and with analogue mobility issues (e.g., modal imbalance in favor of private cars, accessibility, congestions, and so on). In this respect, the analysis of students’ mobility, and, in particular, of their travel habits, is fundamental for policy-makers to identify priority interventions towards the promotion of sustainable mobility [
11,
12].
Several studies in literature have dealt with this topic by analyzing student mobility pattern through surveys [
12,
13,
14], or trough spatial analysis [
15,
16] and suggesting intervention plans to promote sustainable mobility. University students can also be considered a suitable community to experiment innovative mobility concepts, e.g., demand responsive transport services [
17] or crowdshipping [
18]. Investigating the characteristics of student mobility can be useful both for transport planning at the University level and for extending the results obtained to wider communities (e.g., entire city). In order to implement ad hoc strategies aimed at reducing private transport and encourage the use of sustainable modes it is important to investigate user satisfaction and accessibility to university venues [
16]. In this respect, appropriate and simple indicators still need to be defined, evaluated and monitored. This paper addresses this gap by linking PT user satisfaction with service accessibility to have simple indicators useful for sustainable mobility planning within University communities.
2.2. Quality of Service in Public Transport
PT QoS can be assessed by the user point of view, in terms of gap between the expected and perceived quality, and by the service providers, in terms of gap between the targeted service and delivered one. While the former can give a measurement of the satisfaction of service beneficiaries (i.e., customers and the community), the latter refers to the performance of the service, which is important for service partners (i.e., operators, authorities, police, road operators). Quality for users is directly linked to their level of expectations: the more the gap between the sought and perceived quality, the less users will be satisfied about the service. However, quality can depend on many factors, and it is important to understand which of them mostly affects their satisfaction. The European reference standard for PT QoS is the UNI EN 13816: 2002 [
19]. Eight indicators are defined, i.e., availability of transport mode, accessibility, information, time, customer care, comfort, security, environmental impact. Surveys are typically used to assess QoS, like the “Customer Satisfaction Surveys” (CSS), asking to evaluate the perceived/expected quality according to the various indicators, the “Mystery Shopping Surveys” (MSS), based on objective observations of travel experiences by qualified personnel, and the “Direct Performance Measures” (DPM), to monitor the real performance of the service.
There is a wide literature regarding methods and tools to elicit and investigate user satisfaction [
20]. Among them, revealed/stated preferences surveys and discrete choice models 22 [
21,
22,
23], structural equation modelling [
24,
25,
26], Classification and Regression Tree analysis [
20,
27], multicriteria analysis [
28] are widely used.
Eboli and Mazzulla [
29] provide an overview of performance indicators for an objective evaluation of PT QoS by analyzing the relevant literature. They come up with nine indicators showing their heterogeneity and the difficulty in some cases to objectively assess some more qualitative aspects. The authors conclude that objective and subjective indicators should be combined to provide a more useful and reliable tool of transit performance. Objective data refer to the performance of the service and nowadays could be gathered thanks to new information and communication technologies. In turns, CSS could also benefit from them, via smartphones enabling low-cost surveys [
30].
User perception of QoS in the transport sector can be heterogeneous and related to different factors, e.g., the aim of the trip and type of service [
31]. It is not an easy task to evaluate the gap between the perceived and the expected quality of service, because of its intrinsic subjectivity, though its great importance for PT operators to understand how to improve the service quality by increasing user satisfaction [
32].
Since it can be burdensome to constantly and accurately monitor user perception of service quality, it becomes important to find correlations with data and simple indicators referred to PT supply, e.g., accessibility.
2.3. Service Accessibility
Accessibility is a widespread concept in transport planning and it can be considered a good indicator to uncover PT gaps [
33]. It has been traditionally defined as “the potential of opportunities for interaction” ([
34], p. 73) and it can be seen as “the extent to which land-use and transport systems enable (groups of) individuals to reach activities or destinations by means of a (combination of) transport mode(s)” ([
35], p. 128).
Planning for accessibility requires adequate indicators that can include the quantity and quality of opportunities that can be achieved within a fixed threshold time or distance or cost, available for a given social group. GIS are fundamental to visualize the impact of transport solutions in terms of accessibility, and there is a growing literature on transport studies related to this topic [
7,
8,
35,
36,
37,
38]. Recent studies propose an evaluation of accessibility with the use of real-time data (e.g., travel time, speed) and large-scale GPS data [
39,
40], showing the potential to assess the relation between supply and users experience also during the trip. There are several types of accessibility indexes and studies developed by scholars [
35,
41,
42,
43].
The literature distinguishes two forms of accessibility [
44,
45,
46,
47]:
- -
Active accessibility (or person-based accessibility), which refers to the need to carry out the activities located throughout the area by a user that is in a particular place (generally the resident) and it evaluates the ease with which he can reach various destinations from an origin. It is useful in locating settlement decisions;
- -
Passive accessibility (or place-based accessibility), which refers to the ability for the various opportunities of a given area to be reached by the various users scattered throughout the study area. In other words, it assesses the ease with which business and services of a target area can be reached by the users. It is useful in the location decisions of public services and economic activities.
Lei and Church [
48] distinguish accessibility in:
System accessibility that deals with physical access to a transport system, based on the distance, time or effort to reach a system network,
System-facilitated accessibility, which assesses a user’s ability to get to their destination and include the travel time or cost spent in the transport network
Integral accessibility, which is associated with calculating the access to a number of possible destinations.
PT accessibility has been linked to social inclusion, quality and safety by Lättman et al. [
4] and Friman et al. [
5]. They use the concept of perceived accessibility and, in particular, the so-called Perceived Accessibility Scale (PAC), which is based on personal feelings to measure the ease of travel, the ability to live the life one wants, and accessibility to activities.
In this work, the so called “Public Transport Access Level” (PTAL) developed by Transport for London [
6] has been chosen as a suitable indicator to be correlated with user satisfaction of PT quality and ridership. PTAL is a recent indicator conceived as a government tool to evaluate PT connectivity. However, its scientific value has been widely recognized by scholars, in particular in recent studies [
49,
50,
51,
52,
53,
54]. According with the aforementioned classifications, PTAL is an intermediate indicator between a system and a system-facilitated accessibility and it can be considered an indicator of active accessibility in its current formulation. Starting from PTAL, we performed some statistical correlation via MCA to explore the possible relationship between access to service and users’ satisfaction.
The next section enters into the details the materials and methods used to perform the analysis, starting from PTAL.
3. Materials and Method
The service accessibility index chosen for the purpose of this study, i.e., the PTAL, represents the degree of connectivity by PT, with values ranging from 0 to 6, easily mapped by a chromatic scale.
PTAL is a good indicator of PT efficiency and service coverage and it can give a clear idea of the differences in a city giving easily understandable information on where to improve the service. However, it does not take into account the destinations or the effort users need to reach them from a specific node of the network, nor their satisfaction for some quality attributes, such as information, comfort or safety.
It should be noted that PTAL can be associated to at least three of the attributes that the European standards UNI EN 13,816 identify as relevant for PT quality of the service, i.e., availability, accessibility and time, and to other quality factors that can be investigated via ad hoc surveys, such as frequency and reliability.
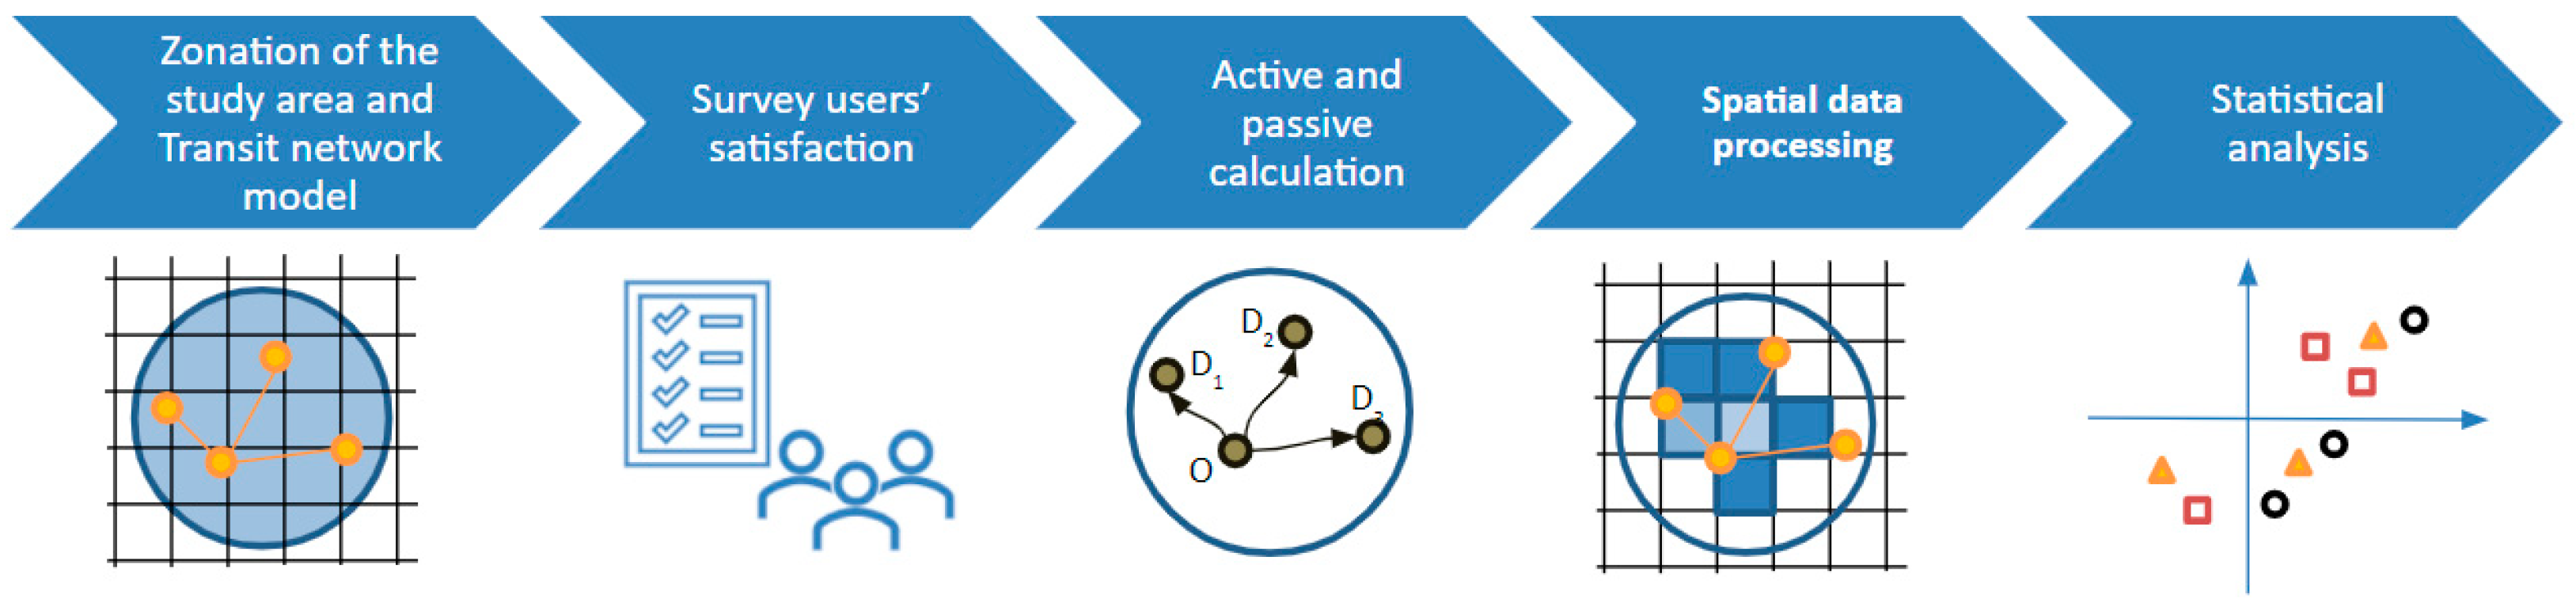
In this paper, the potential of the PTAL as an indicator to be correlated with user satisfaction of PT quality and ridership is investigated using spatial data. This is done by using its active original formulation and a new passive formulation proposed by the Authors, to understand if it can represent a good proxy of service quality.
The methodology proposed is based on multiple datasets and steps here summarized and described in
Figure 1 and in the following subsections:
Zonation of the study area and construction of a network model of the transit system
Survey on users’ satisfaction
Active and passive PTAL calculation
Spatial data processing of PTAL and quality indicators of user satisfaction
Statistical analysis to correlate user satisfaction, transit ridership, and accessibility.
3.1. Zonation and Transit Network Model
The first two steps set the preliminary phases needed to build the territorial and transport context where to perform the analysis. The calculation of the PTAL relied on a grid zonation with a squared-cell of size 400 m, performed through the use of QGIS processing procedures. This size was selected since it allows a good level of detail for the analysis and it is also considered in the literature one of the lowest walking distance thresholds for users to choose a particular public transport stop [
55]. The transit network has been constructed starting from the data of the Urban General Transport Plan of the city (dated 2013) and updated according to recent changes in routes and schedules; the final network is referred to the transit scheme in 2019.
Data on the transit network are used to calculate active and passive PTAL indicators and survey results are georeferenced to estimate main students’ trips origins and destinations, resulting in the construction of a georeferenced database of information on both service demand and supply.
3.2. Survey on Users’ Satisfaction
Surveys are useful tools to explore the service quality perceived by users. In particular, in this study we used the results of a survey to university students, and its structure is detailed in
Section 4.2.
For the purposes of the study, the survey included three main sections:
Data on origin, final destination and eventual further destination within the typical day, to build the student Origin-Destination (OD) matrix, as stated in the previous section;
Trip characteristics (time, mode, frequency in PT use)
General judgement on PT services in terms of: availability of direct PT lines, frequency, reliability and punctuality, travel time shortness (in comparison to private car trip), information provided to users, and comfort. All these data are useful as parameters to evaluate users’ satisfaction.
3.3. Active and Passive PTAL Calculation
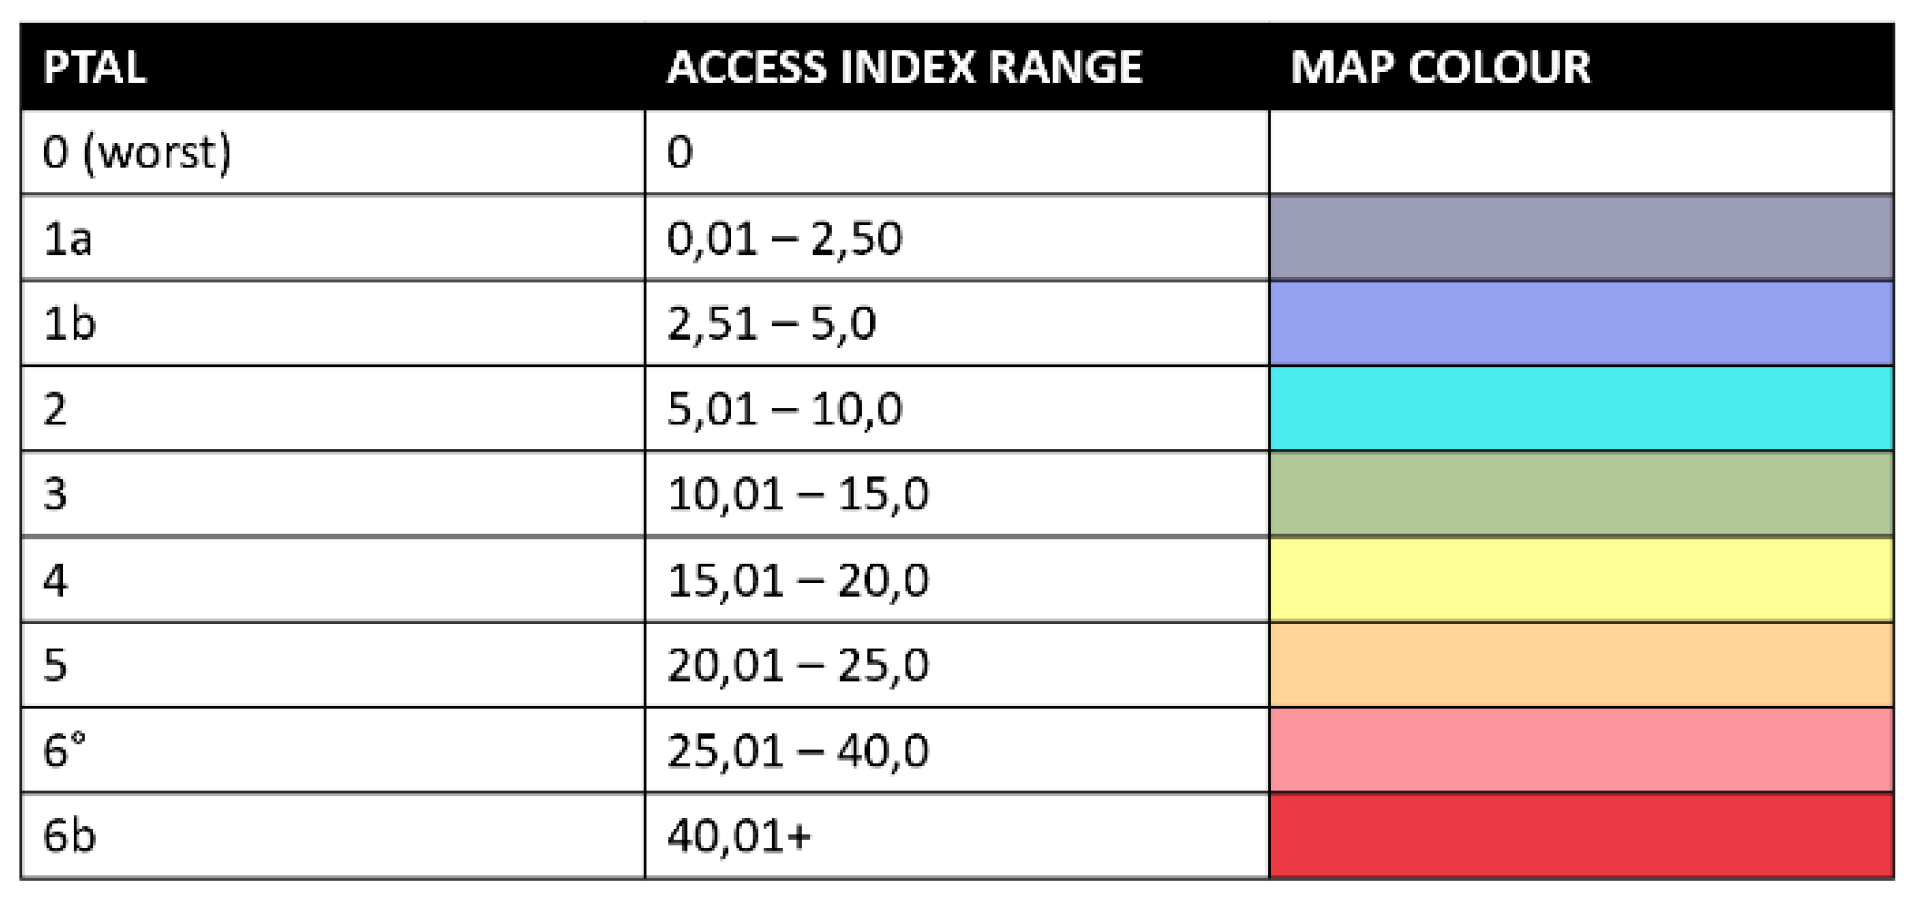
The PTAL is an effective service accessibility indicator, easy to calculate and to understand through visual maps. PTAL value is dimensionless, and it ranges from 0 to 6, where 0 is the worst value and 6 the highest one, representing the best PT connectivity. The factors that contribute to higher values of PTAL are: (i) a short walking distance to the nearest stations or stops; (ii) high frequencies of PT during the morning weekday peak; (iii) presence of major rail stations nearby. PTAL is calculated starting from the evaluation of an Access Index (AI) according to the steps in
Table 1 [
6]. The AI is then converted into the PTAL through a chromatic scale according with color bands specified in
Figure 2. More information on PTAL method steps and color scale can be found in [
6].
Based on the PTAL evaluation procedure, the authors introduced, for the scope of this study, an active and a passive accessibility indicator for each university venue:
- -
The “active” PTAL is calculated using the conventional PTAL procedure for each origin of the zoning grid;
- -
The “Passive” PTAL (that we called PPTAL) is referred only to the university venues identified as main destinations from the students’ survey and it is calculated as the average value of active PTALs of the origin zones where students indicated that venue as destination, as in Equation (1):
being
i the generic origin among the
Nj zones paired with the destination
j.
3.4. Spatial Data Processing
Spatial data based on the PTAL analysis and user’s surveys are included in a GIS environment with the aim to build a multilayer planning-support tool, useful for decision-makers to evaluate performance and quality of PT policies and interventions. Thematic maps are used to analyze accessibility levels and present data on users’ satisfaction level with reference to the quality of the service. They will be presented in the case study section.
3.5. Statistical Analysis
Finally, a statistical analysis is performed to gain more insight into the possible correlations between users’ satisfaction, transit ridership and accessibility. Linear correlation and MCA were used to find relationships between demand and supply data. MCA has been chosen as the statistical method to analyze data, given the nature of the datasets and the easiness to interpret the results in a graphical way. In the transport sector, MCA is widely used in road safety analysis, to evaluate the main contributing factors causing accidents [
56,
57,
58] and investigating safety perception [
59,
60]. MCA has also been used to obtain insight into the quality aspects of PT systems: Lombardo et al. [
61] computed a composite indicator of customer satisfaction based on the key characteristics for assessing transport service quality found in literature; Grison et al. [
62] analyzed users’ experience of PT route choice on the basis of context and users profiles; citizens’ satisfaction for PT through a survey has been investigated in a study conducted for the city of Bologna in Italy [
63]: MCA showed that punctuality, frequency of service and efficiency of buses were among the main factors that affected the overall satisfaction.
MCA is typically used to analyze the pattern of relationship of more than two categorical variables, both qualitative and quantitative. The outputs are displayed in a map where the correlations between the variables are expressed in terms of proximity of points. The MCA is also applied with the aim of visualizing possible correlations between users’ travel habits and their stated opinions on the quality of PT service. The results of this analysis allow to provide useful suggestions to identify the strengths and weaknesses of each university venue taken into account, in terms of transit accessibility.
4. Case Study
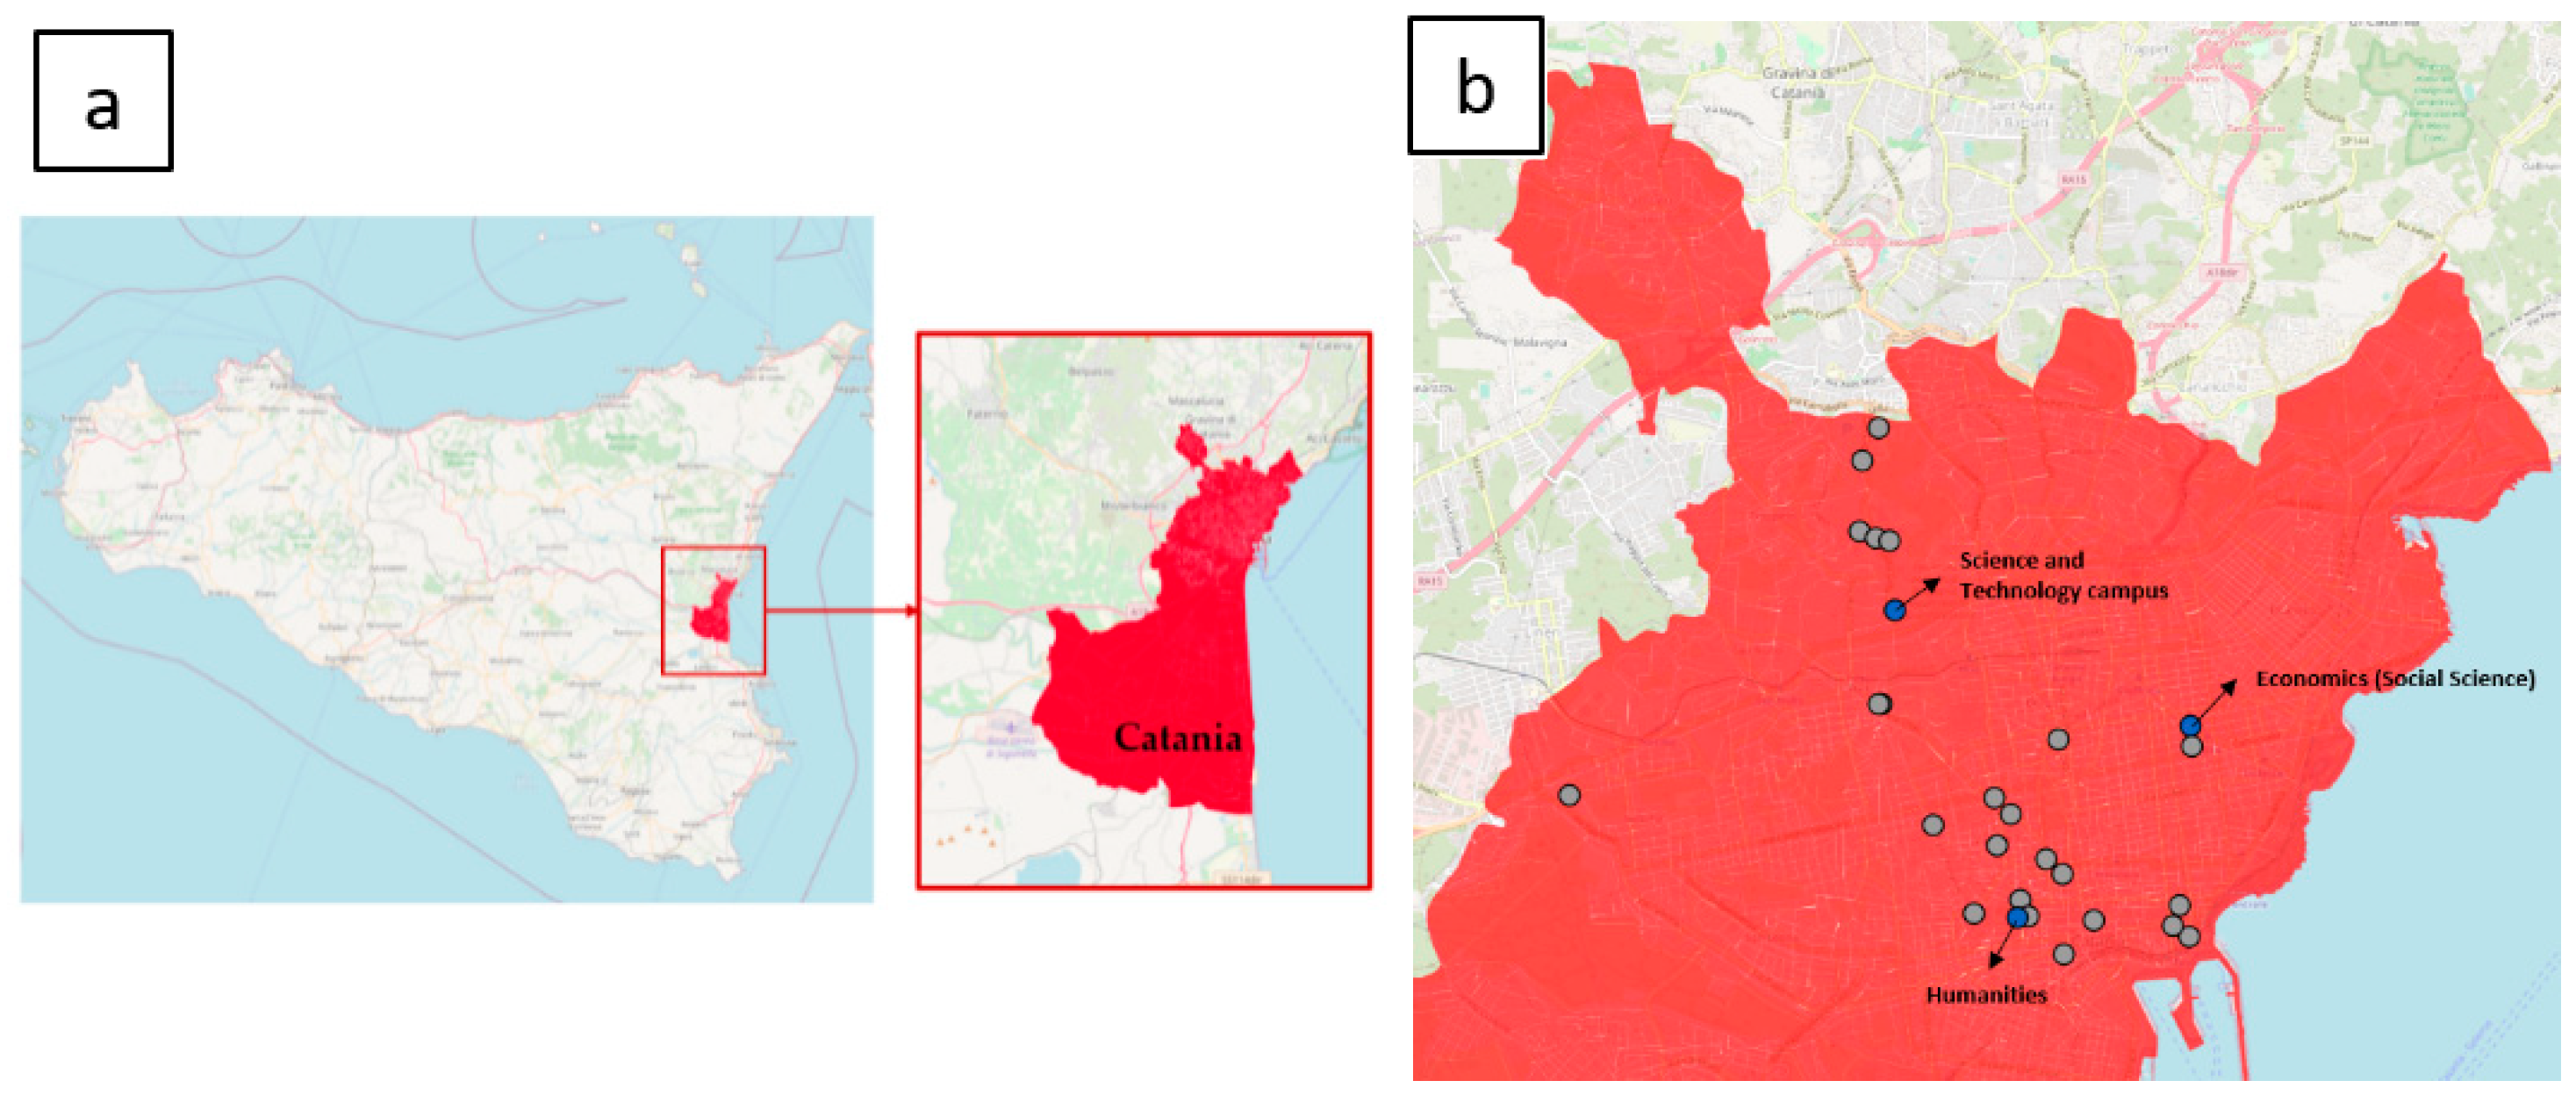
Catania is a medium-sized city of about 300,000 inhabitants located in Sicily, in the south of Italy (
Figure 3a). It suffers from many transport problems, mainly related to the high usage of private cars for systematic trips. This can be ascribed to lack and poor quality of infrastructures for active mobility and low provision of PT dedicated infrastructures, resulting in a low usage of surface PT, except for some specific lines. A 9 km metro line is also present and its extension is under construction to connect the airport and some big residential sites in the next years [
64]. Catania can be considered a student city because of the presence of the University of Catania (UNICT), which counts about 40,000 students, 1200 professors and researchers and 1200 employees. In total, there are 22 different university venues sprawled around the urban area of the city and 15 of them include facilities attended regularly by the students (
Figure 3b). For the statistical analysis, only three main university venues (i.e., the most attended by students) will be considered, which are those indicated with the blue circle in
Figure 3b. One of UNICT’s missions is to increase the accessibility of University sites by PT [
65]. Several collaboration initiatives with the Municipality and the two PT operators have been put in place in the last years. The last one, launched in October 2018, granted unlimited access to all regularly enrolled students to urban PT, both weekdays and weekends (the initiative has been operating between 2018 and 2020. Changes are being currently undertaken also due to COVID-19 pandemic and related mobility restrictions with consequences on student mobility). The initiative went well beyond the mobility context, with many social, environmental and economic implications. In this respect, it had a social transformative potential for a transition to a sustainable society since students were encouraged to leave their private vehicles and find opportunities to socialize while travelling to and from universities [
65]. However, the effectiveness of the initiative requires ad hoc strategies to monitor transit ridership, and the quality of service from both the supply and demand side. Simple and easy to evaluate indicators would be effective in understanding where and how to improve the service. This motivates the choice of correlating PTAL, which is mainly based on supply indicators, with demand data. In this respect, student satisfaction and relevant data regarding their mobility behavior are constantly monitored via a web survey. The analysis is based on a database of about 4000 interviews collected between 2018 and 2019, hence the results are not influenced by restrictions due to the pandemic situation.
4.1. Characterization of the Study Area and Construction of the Network Model
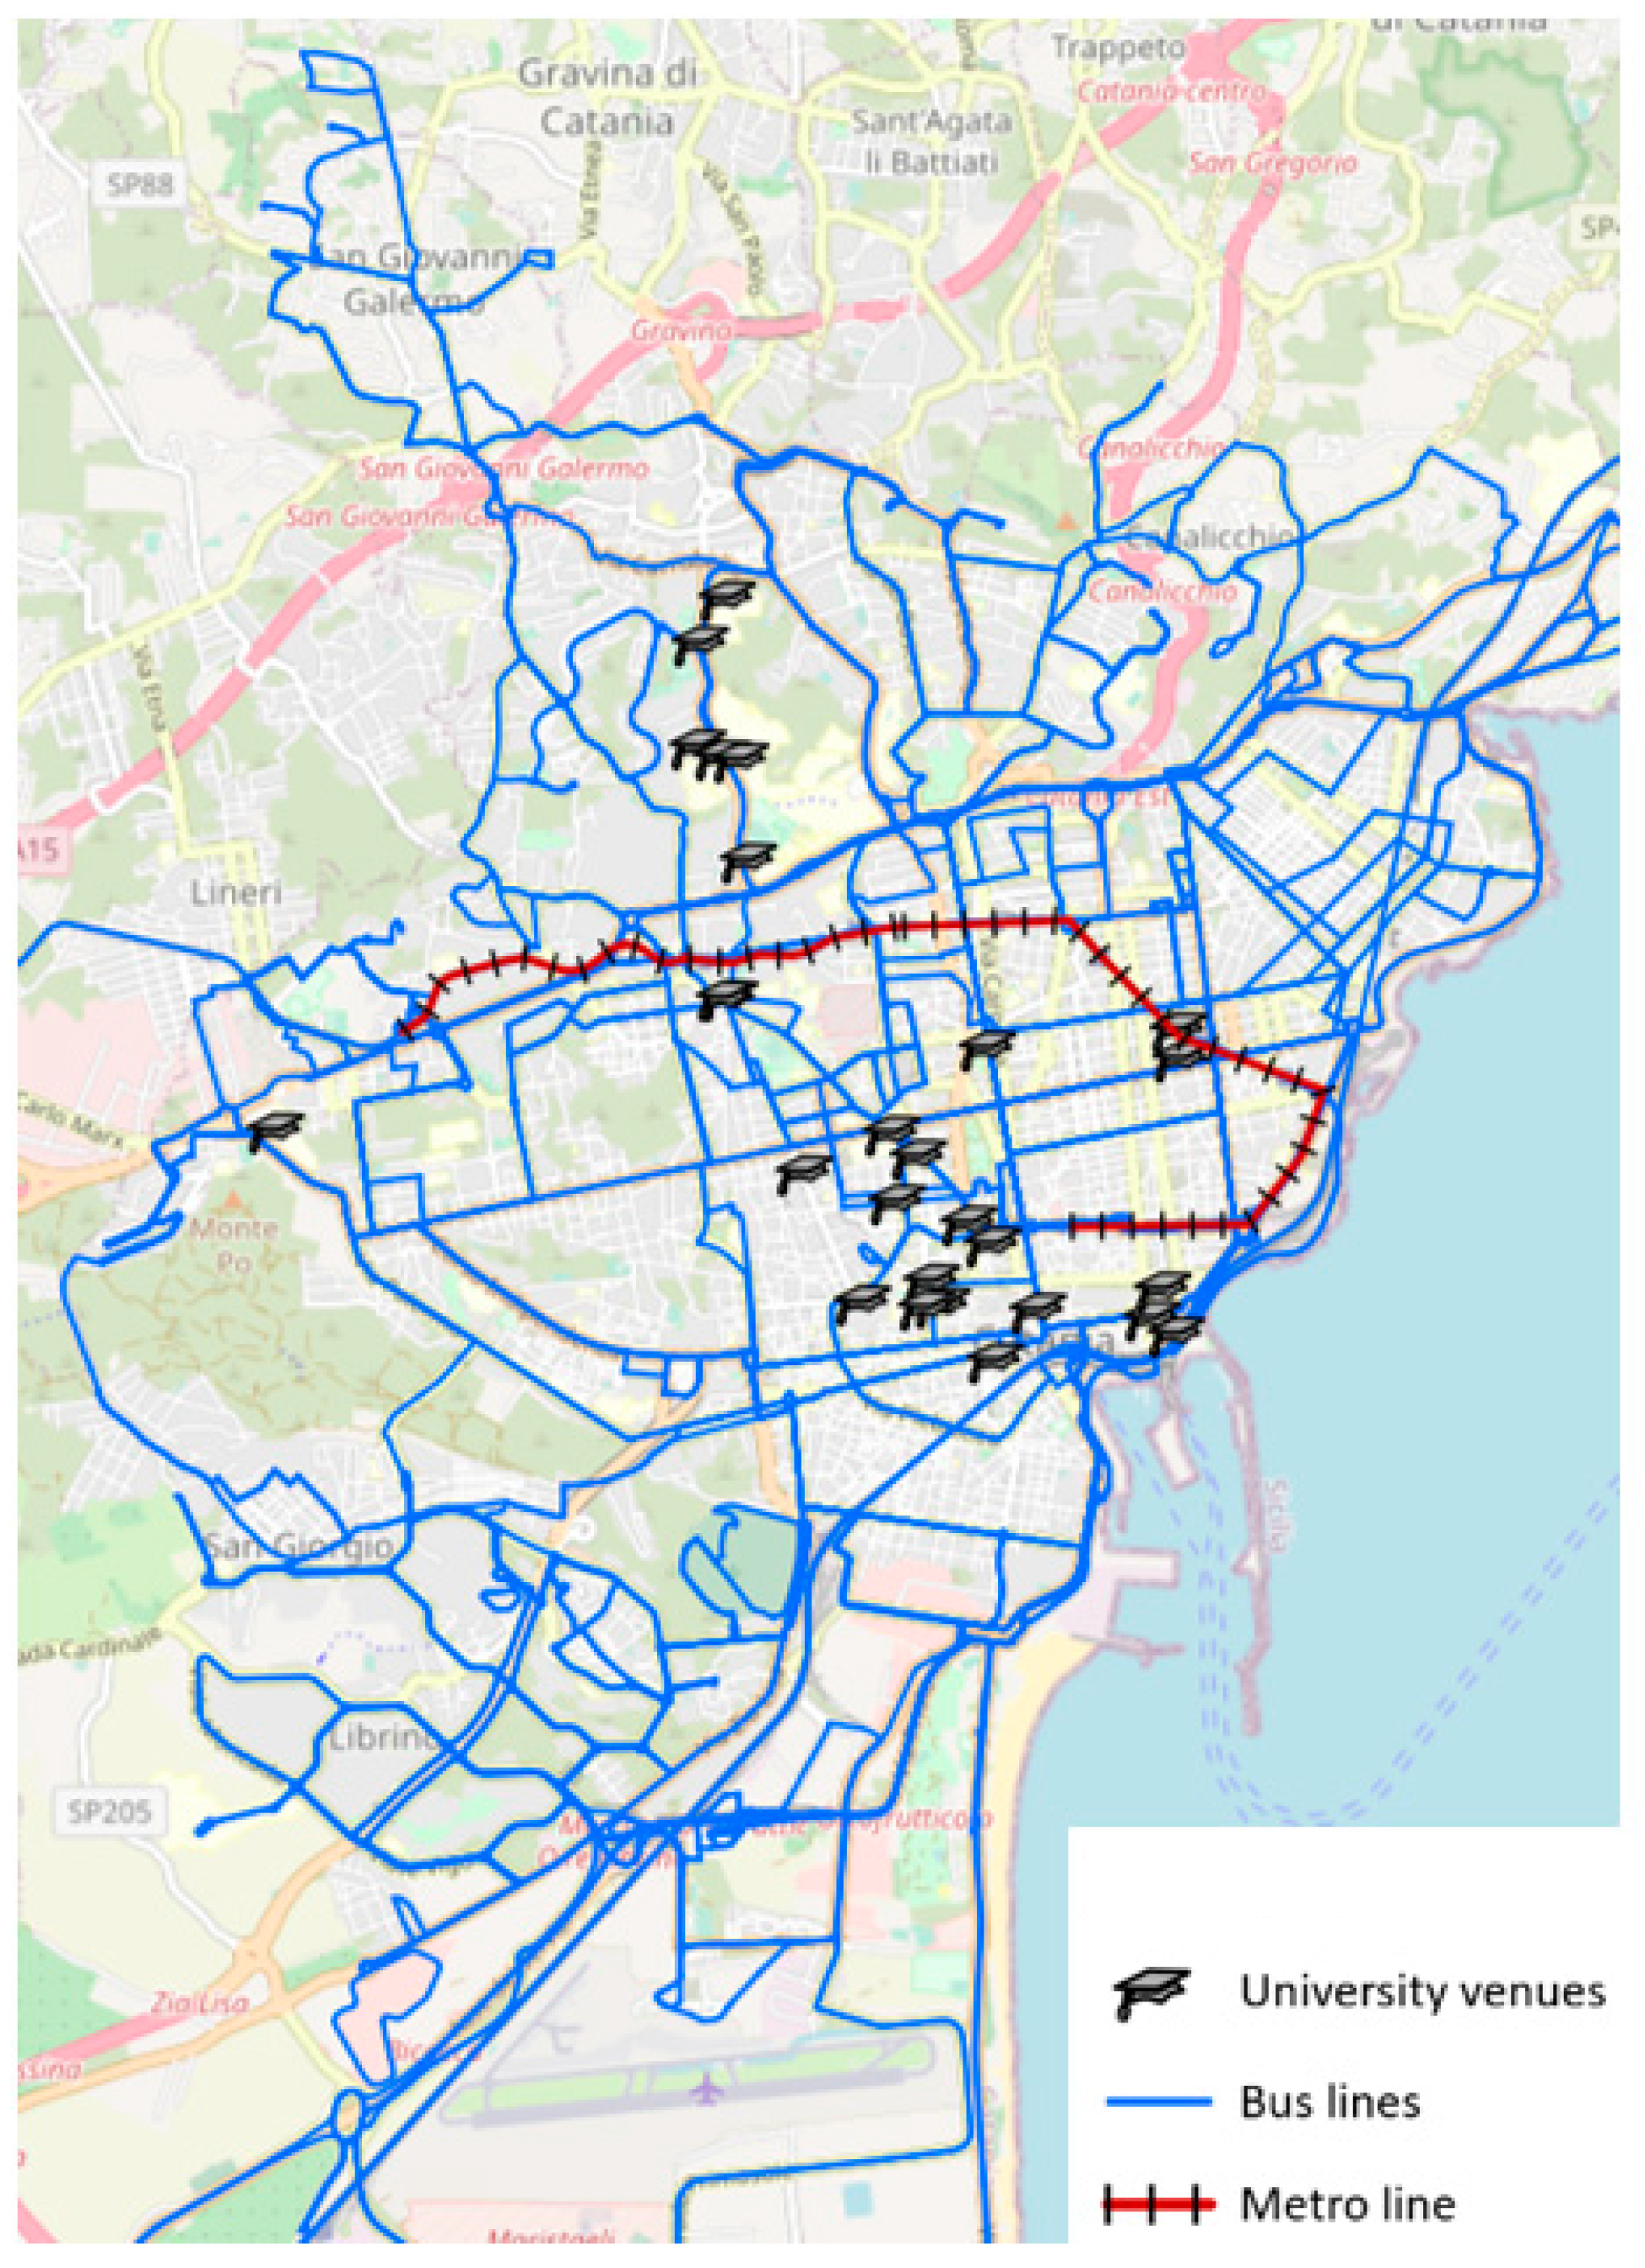
PT stations and stops in Catania were mapped, according to the information provided by the transport operators in their websites. We refer to such facilities as Service Access Points (SAPs) of the model. A transport network model has been built that includes: all PT routes in Catania (both bus and metro, updated at 2017,
Figure 4) and related frequencies, the pedestrian network (updated on the General Urban Traffic Plan of 2013) and the SAPs that each one of them serves. In particular, the pedestrian network was used to calculate the walking time from the origin of students’ trips to the PT network’s SAPs.
4.2. The Survey: Public Transport Quality of Service
In order to evaluate both accessibility and user satisfaction, information were extracted from the survey administered since May 2018 to all students. This study used results based on data until July 2019, counting with a database of almost 4000 respondents (3910 at 7 February 2019). The survey was administered via the student portal and students had to be logged in with their personal account in order to access it.
The survey was structured according the following three sections, already introduced in
Section 3.2:
Data on origin (residential area), final destination (e.g., one of the university venues located all around the city) and potential further destination within the typical day (some departments are located in multiple venues): these georeferenced data were used to build the student Origin–Destination (OD) matrix, as stated in
Section 3.1;
Trip characteristics: time spent for OD trip; mode of transport used; frequency of use of PT; most used PT lines; use of park-and-ride facilities. Among these, time spent per OD trip, mode of transport and frequency of use of PT were correlated with accessibility.
General judgement on PT services in terms of: availability of direct PT lines, frequency, reliability and punctuality, directness, information provided to users, comfort.
The first three sections were structured with closed-format questions, while the last one was an open question regarding general suggestion on how to improve students’ mobility.
OD matrix estimation refers to the peak-period considered in the time range between 7:00 and 9:00 AM for home-based trips to the University venues, taking into account also intermediate trips between different destinations within the day. Matrices both for private transport and PT were created based on survey’s results and were projected on the entire student population by multiplying the values obtained by the survey by corrective factors.
4.3. Active and Passive PTAL Calculation
In order to carry out the PPTAL analysis, since active PTAL was analyzed only in the urban area, PTAL values for each survey respondent were assigned as follows:
- -
Respondents that indicated an address in the province of Catania were assigned with the PTAL of the related zone;
- -
Respondents that indicated an address outside the province of Catania were assigned to the value of PTAL of the main city station (because it is considered that the stated address is the home and not the actual place where a student lives and also because the station is considered a necessary passage point for all those who come from outside the city).
4.4. Statistical Analysis
While PTAL and PPTAL have been evaluated for all the different venues, detailed statistical analysis have been performed on the three main university venues. They differ in terms of city location (
Figure 3b) and PT supply.
The Science and Technology Campus is in a peripheral part of the city. It is a nerve center of the university community of Catania as it attracts many students. The Campus is well served by the bus and metro services and there are also many parking lots to foster the car–PT intermodality. Thanks to a feeder service (called “metro shuttle”), it is well connected to the closest metro station (1.6 km);
The Humanities venue is located in a central area within the historical center. However, the PT supply in this case is more lacking than the Campus one and the distance from/to the nearest metro stop is about 1 km;
The department of Economics can be considered as the main venue of the Social Science pole, also located in the city center, but better served by PT supply. The closest metro stop is 200 m away.
The first step of the MCA is to categorize the variables that are taken into consideration (
Table 2).
In more detail, we decided to take into account the A category since it resulted from the survey that students use to change venue during the day; in particular, the survey revealed that the distance of 1.5 km is the average travelled distance for these trips. The time classes have been chosen by considering the average time required to reach a destination according to the origin localization (urban, extra-urban). Regarding the frequency of use of the PT, “rarely” refers to a low use of the PT (some days in a month). For PTAL values we used the same classes range suggested by Transport for London [
6]. The ratings from 1 to 5 assigned by respondents were maintained for the judgements related to PT service quality. The PPTAL is not included in the analysis since it only changes with the venue, and it is the same for all the people attending the same venue.
5. Results
5.1. Quality of Service in Public Transport
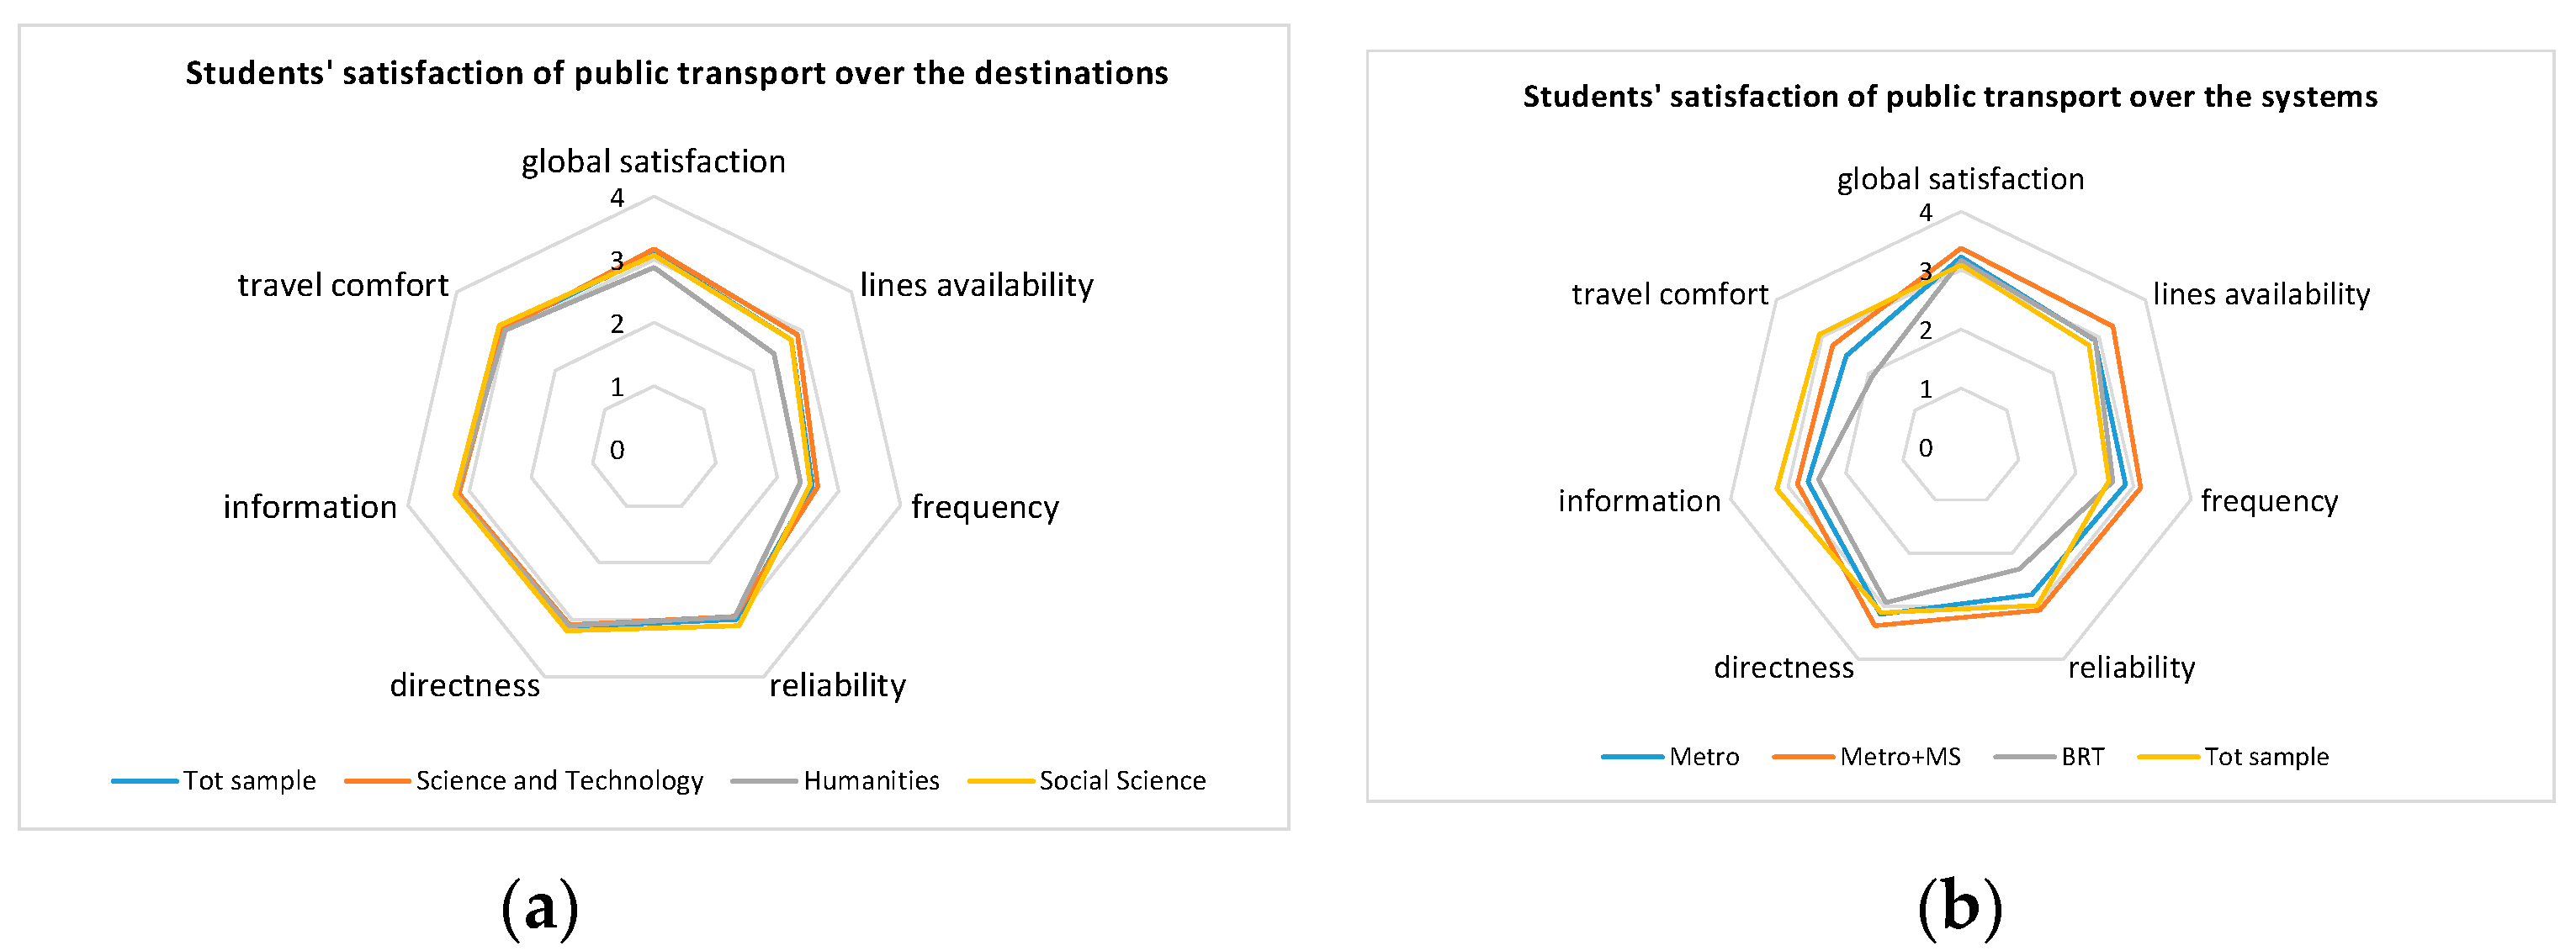
As far as demand is concerned, perceived quality was derived from the analysis of the survey results with 3910 answers. Students of the sample provided an estimate of their level of satisfaction on a 1–5 scale (from low to high) for the overall service, and for specific quality criteria: (1) lines availability, (2) frequency, (3) reliability, (4) directness, (5) customer information, and (6) travel comfort. Some of the results are summarized with respect to the main destinations (
Figure 5a) and the PT used (
Figure 5b) (only considering the most used lines):
The most satisfied students use the metro line in combination with the metro-shuttle feeder service (metro + Metro Shuttle -MS) to access the science and technology campus, being frequency, directness and line availability the most satisfactory attributes. Directness, information and travel comfort get a good evaluation by students going to the destinations in the city center (humanities and social science). This is due to the availability of the metro line with direct access to the social science pole and of the extensive bus network, even if characterized by a low frequency of the service. It is worth noticing that comfort has the lowest score for the Bus Rapid Transit (BRT) line. This is a relevant issue that needs specific attention considering that this is one of the most used lines by students. A specific investigation of this factor is done in Fazio [
3].
5.2. Active and Passive PTAL and Spatial Data Processing
Figure 6 shows the Active and Passive accessibility for different university sites: departments located in the city center (sites 2,8–9,15–18) record good values of both accessibility indicators, because of the high density and coverage of the transit network, that is typical of a transit grid network serving a many-to-many mobility demand pattern. On the contrary, the scientific department locations (all other sites), mainly sited beyond the northern ring road of the city, are easy to reach from everywhere in the city centre, while the reverse is not always guaranteed (
Figure 6); this is consistent with the ring-radial form that the transit network assumes as the distance from the city center increases and the development of some lines dedicated to the scientific campus (BRT, metro and metro-shuttle).
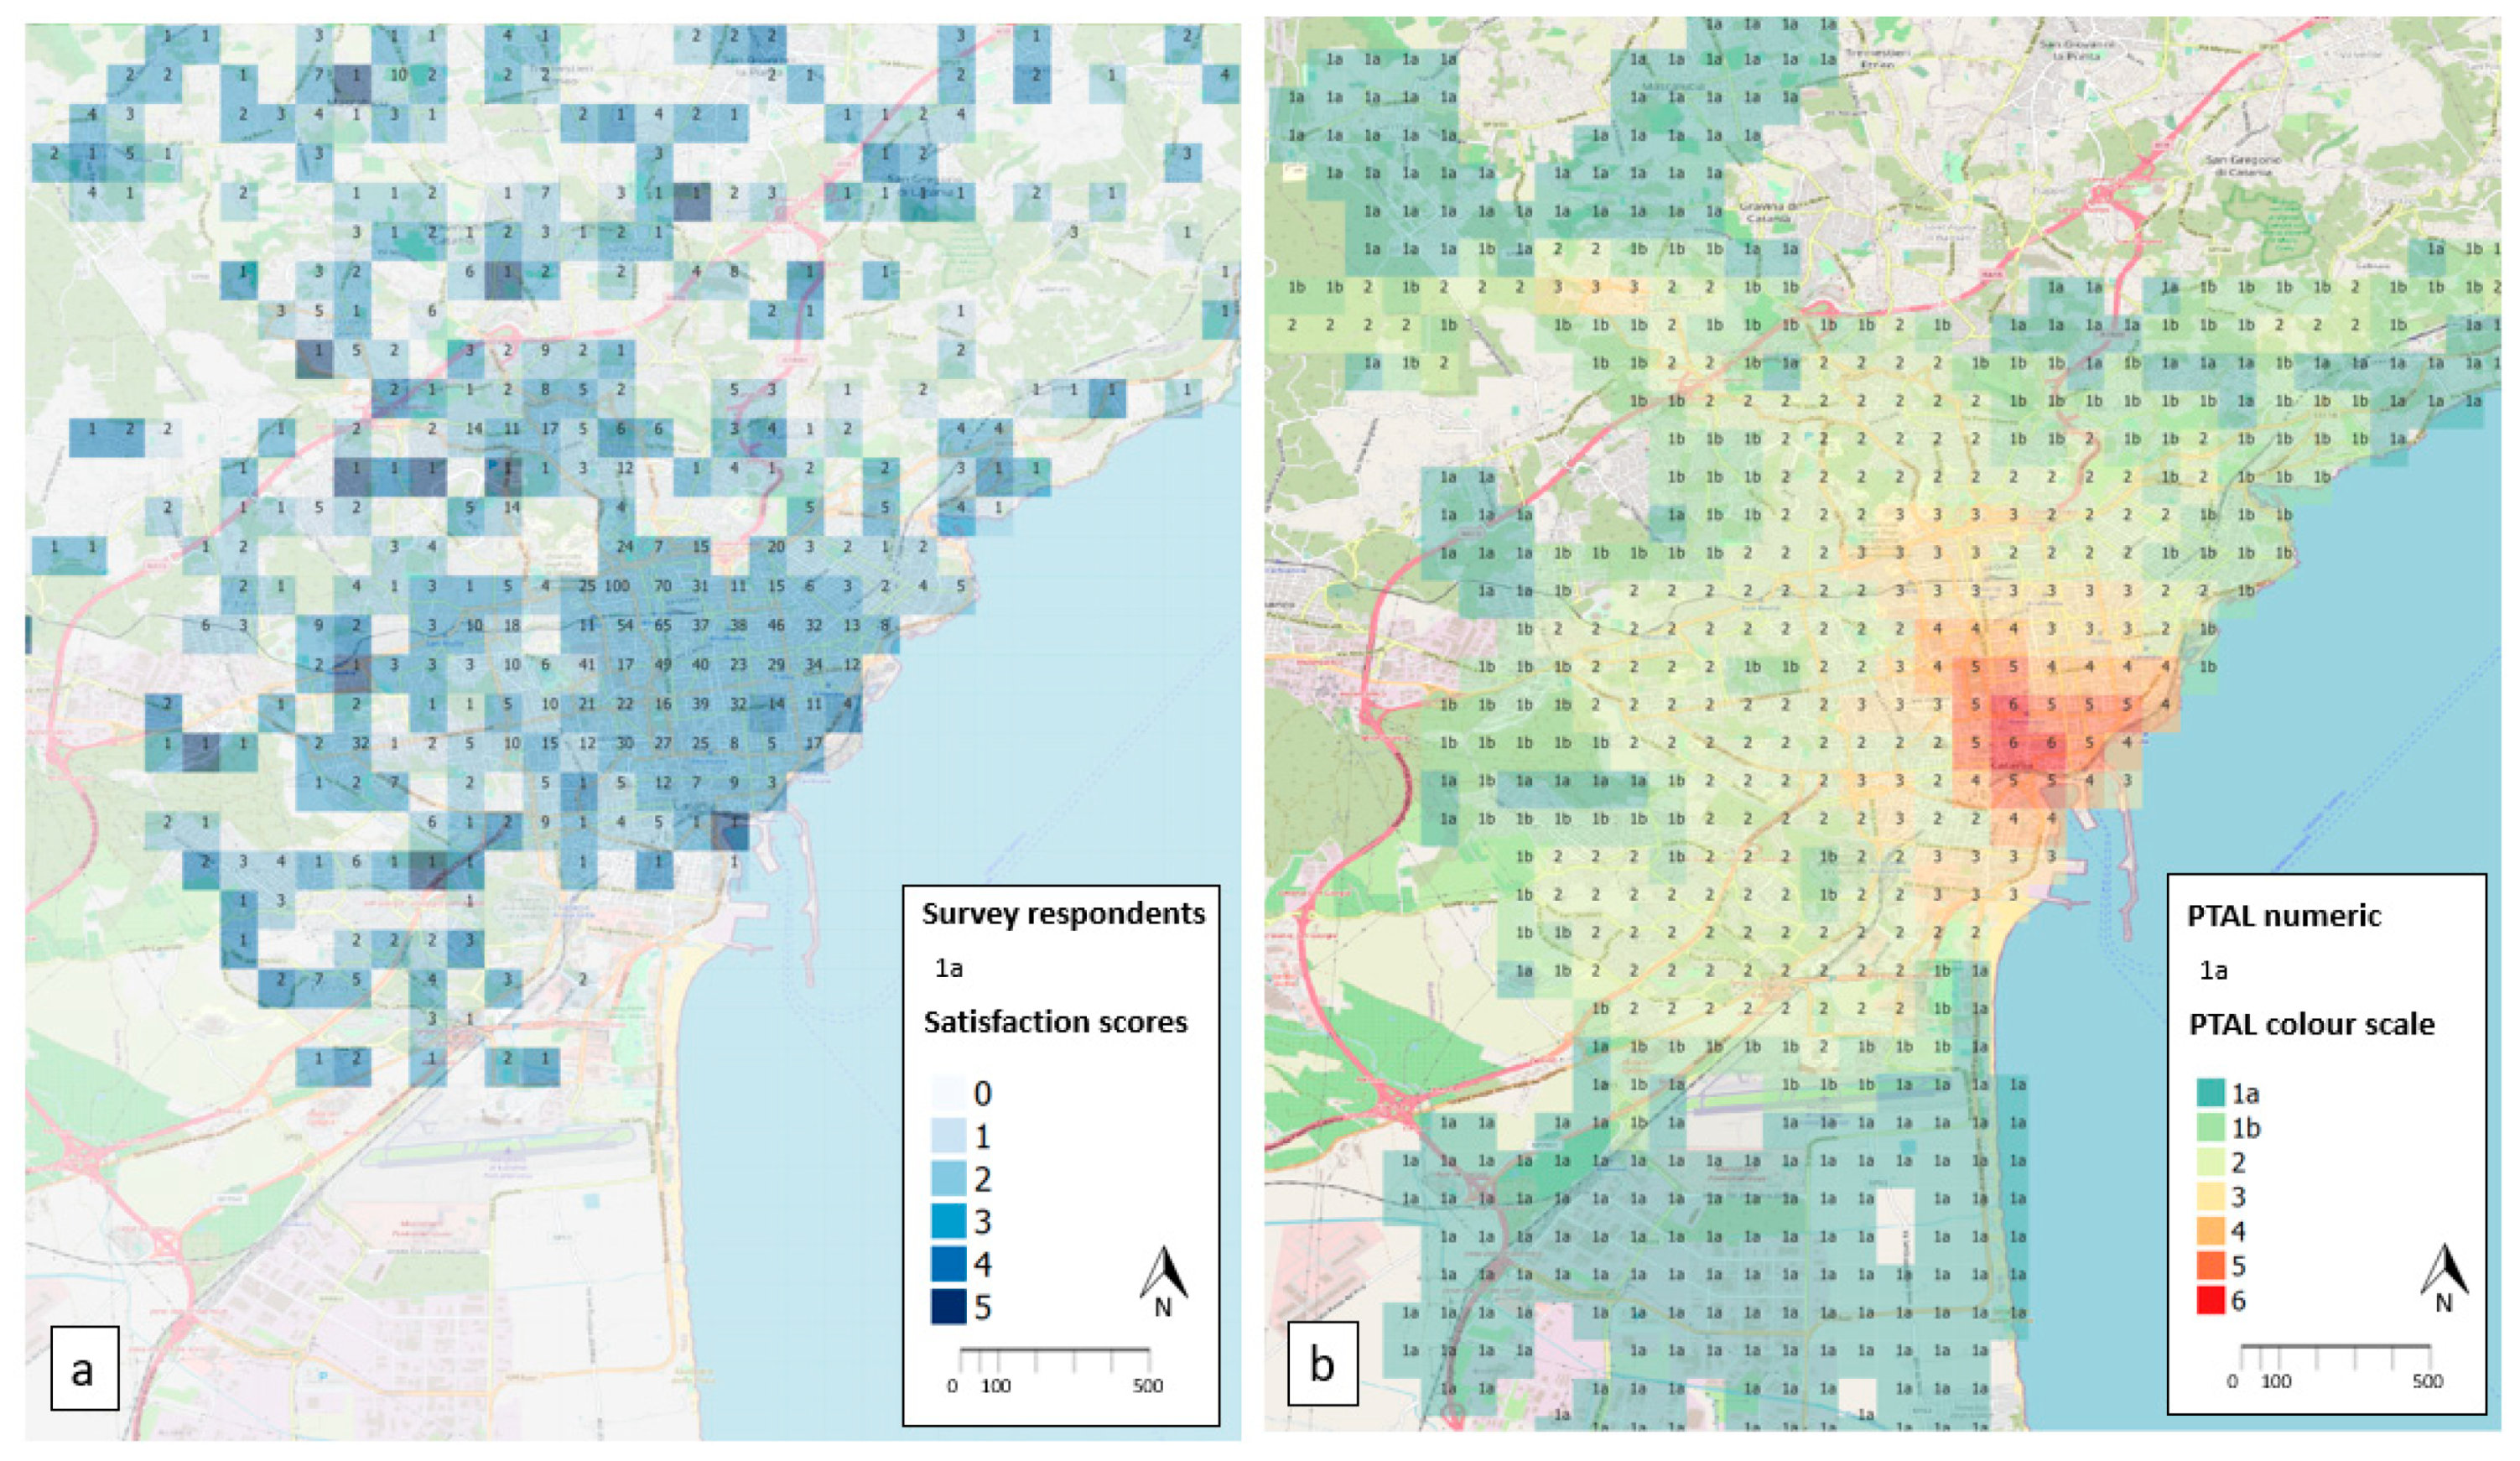
The following thematic layers have been added to the GIS: (i) Active PTAL (
Figure 7a) for each zone; (ii) average score of students’ service quality satisfaction for each zone (
Figure 7b); as indicated in the legenda, for each zone a small number indicates the number of respondents, while the color scale indicates the indicator values; nothing is mapped in case of no respondents.
A first spatial data processing shows that in the south of the city low PTAL values correspond to low satisfaction scores. This is in fact one of the most peripheral areas of the city where there are mostly industrial activities. In the city center, where instead the highest PTAL values are recorded, a homogeneous distribution of average satisfaction scores is observed. There are peaks of satisfaction scores in the suburbs: in any case, the number of respondents to the survey located in these areas is certainly lower, so individual judgments have a great influence on the mapping of the results. This result confirms the need for a more detailed analysis of the answers.
5.3. Linear Correlations between Users’ Satisfaction and Accessibility
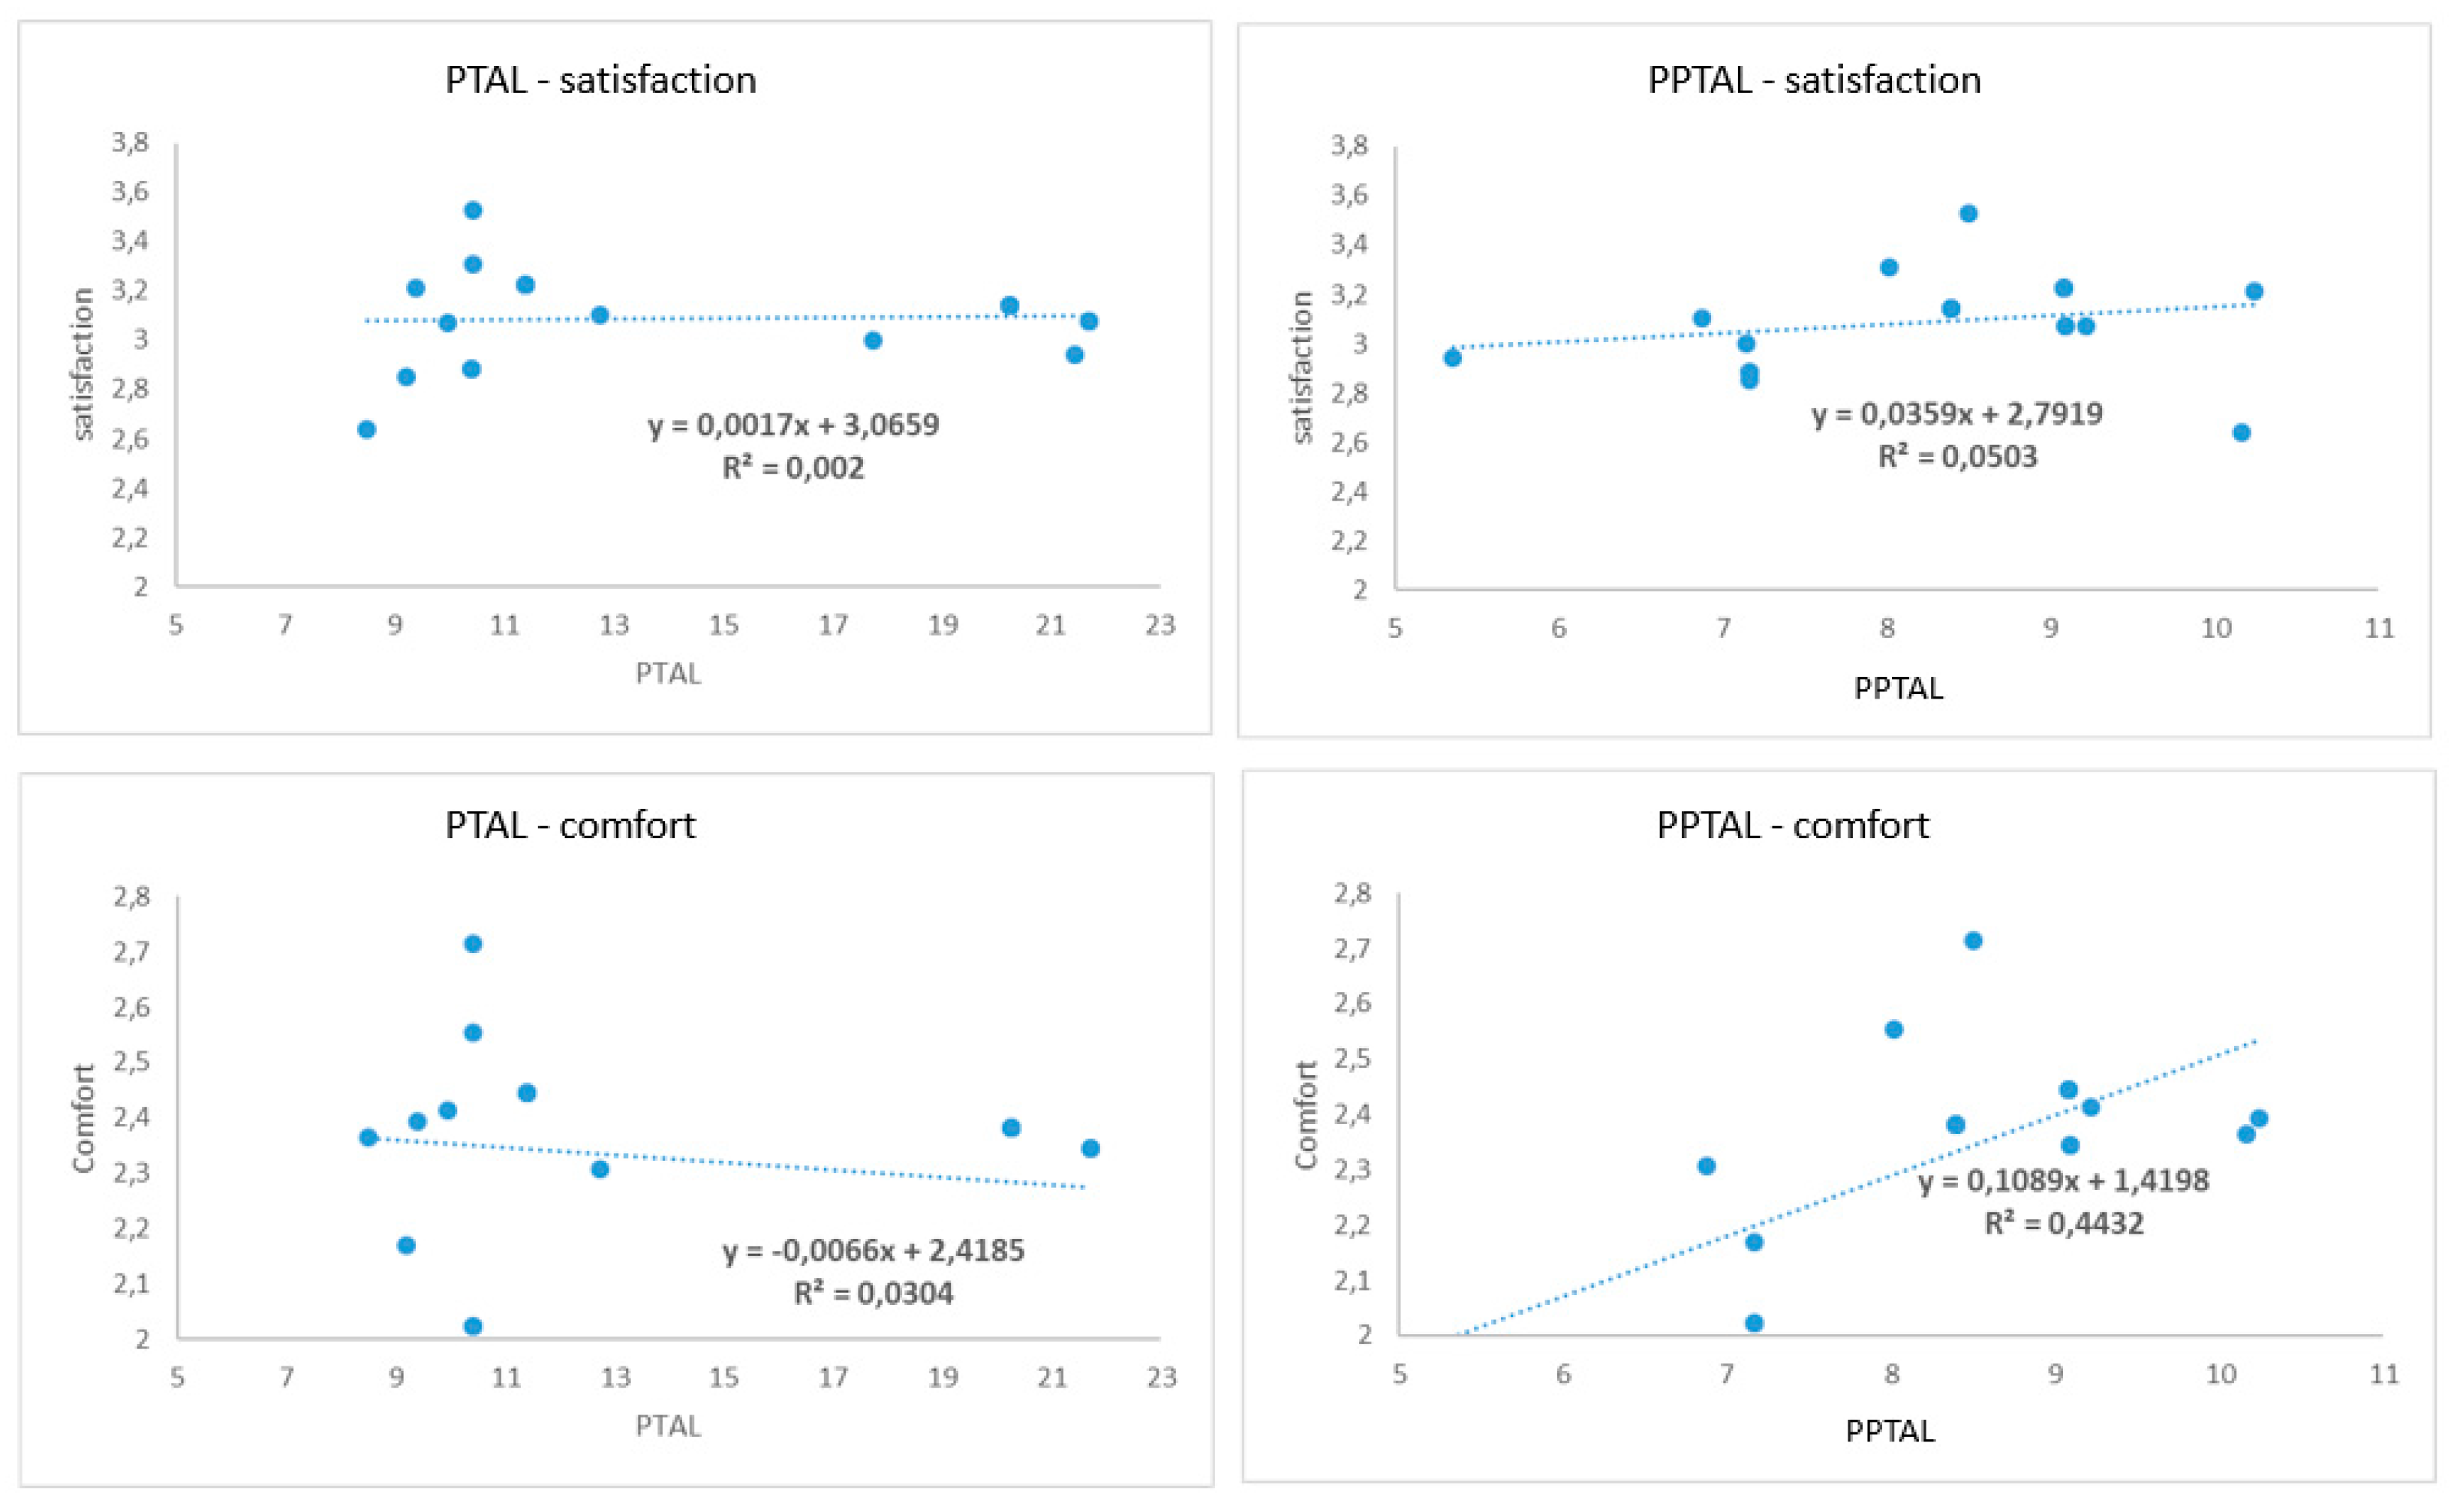
In this study, data related to user satisfaction and accessibility have been used. However, the analysis shows that there is no direct correlation using the average values. Specifically, the only indicator of accessibility that seems to be correlated with specific characteristics of PT service quality (especially comfort) is the PPTAL, even if it has a very low correlation with the overall satisfaction of service (
Figure 8). This can be explained by the level of aggregation used for this analysis, since satisfaction values are averaged and, thus, tend to hidden the heterogeneity of answers and preferences. These points to the need to do more detailed statistical analysis.
5.4. Analysis of Correlations between Users’ Satisfaction, Accessibility and Travel Behavior via MCA
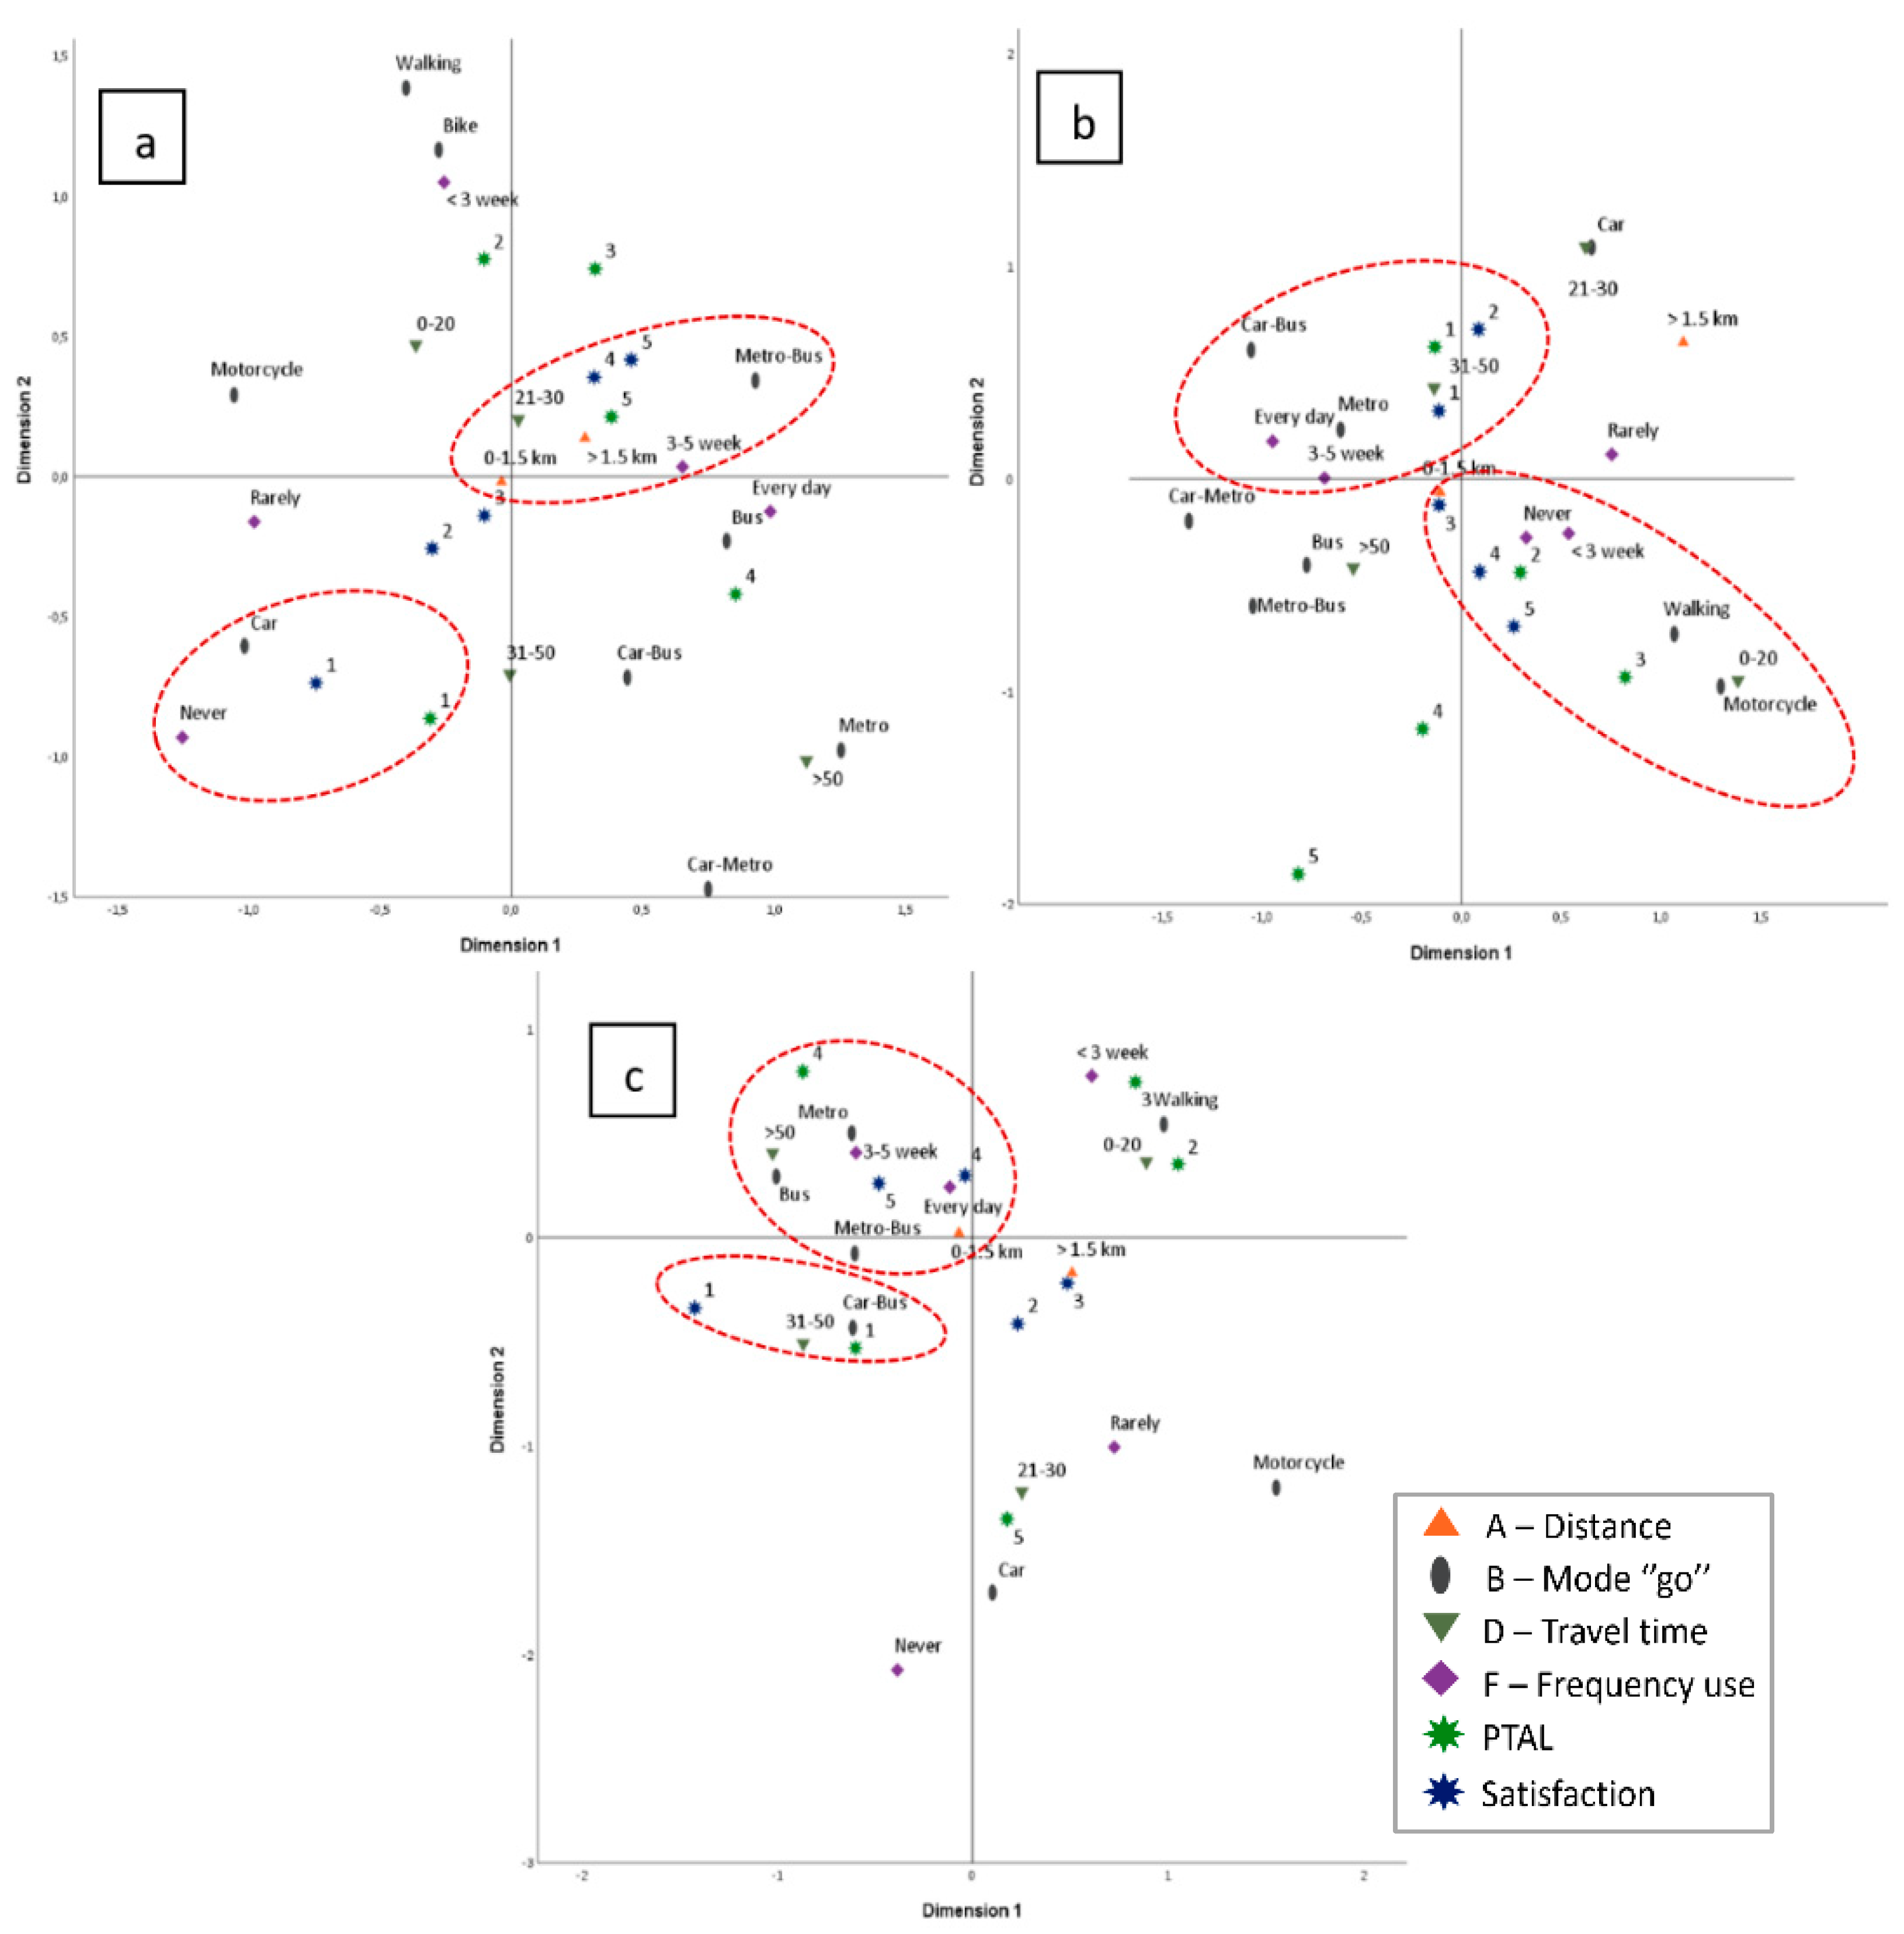
The potential correlation between PTAL, users’ satisfaction and travel habits was investigated performing a MCA considering the three main sites. The first analysis carried out correlates PTAL with user’s satisfaction and travel habits (see
Figure 9). In the figure, the symbols indicate the variable taken into account (as explained in the legend), while the numbers are associated to the categorization of variables, as presented in
Section 4.4.
There are several conclusions that can be derived from the analysis.
For the science and technology campus there is a very good correlation between high value of PTAL and users’ satisfaction. This finding is also linked with people who use frequently metro and bus and spend a medium-short time to reach their destination. On the contrary, low values of PTAL and satisfaction are correlated with users who travel by car. These results suggests that PT for this venue offers an efficient and suitable service. Furthermore, users move easily from one location to another during the day, and this can be interpreted by a good level of connection.
The analysis for humanities follows a different trend. Low satisfaction and PTAL values are correlated with people who regularly use PT or a combined car-bus trip to get to the destination. Medium-low PTAL values are correlated with users who do not use PT but, at the same time, expressed a positive opinion on satisfaction. This can be interpreted as a judgment given to their overall experience of the PT service and not that specifically offered to access this venue. Hence, this result points to the need to define intervention strategies to improve the humanities’ PT supply and service quality.
Results for the economics venue are quite different: the satisfaction and PTAL values have a high level for those who use PT for long distances (corresponding to longer time in the survey). This result is certainly related to off-site users who make long-term trips. On the other hand, people who go to university with an intermodal car-bus trip are not very satisfied, due to a low PTAL. This makes it clear that even in this case the PT supply should be improved and better linked with other modes of transport so as to discourage users from using private cars.
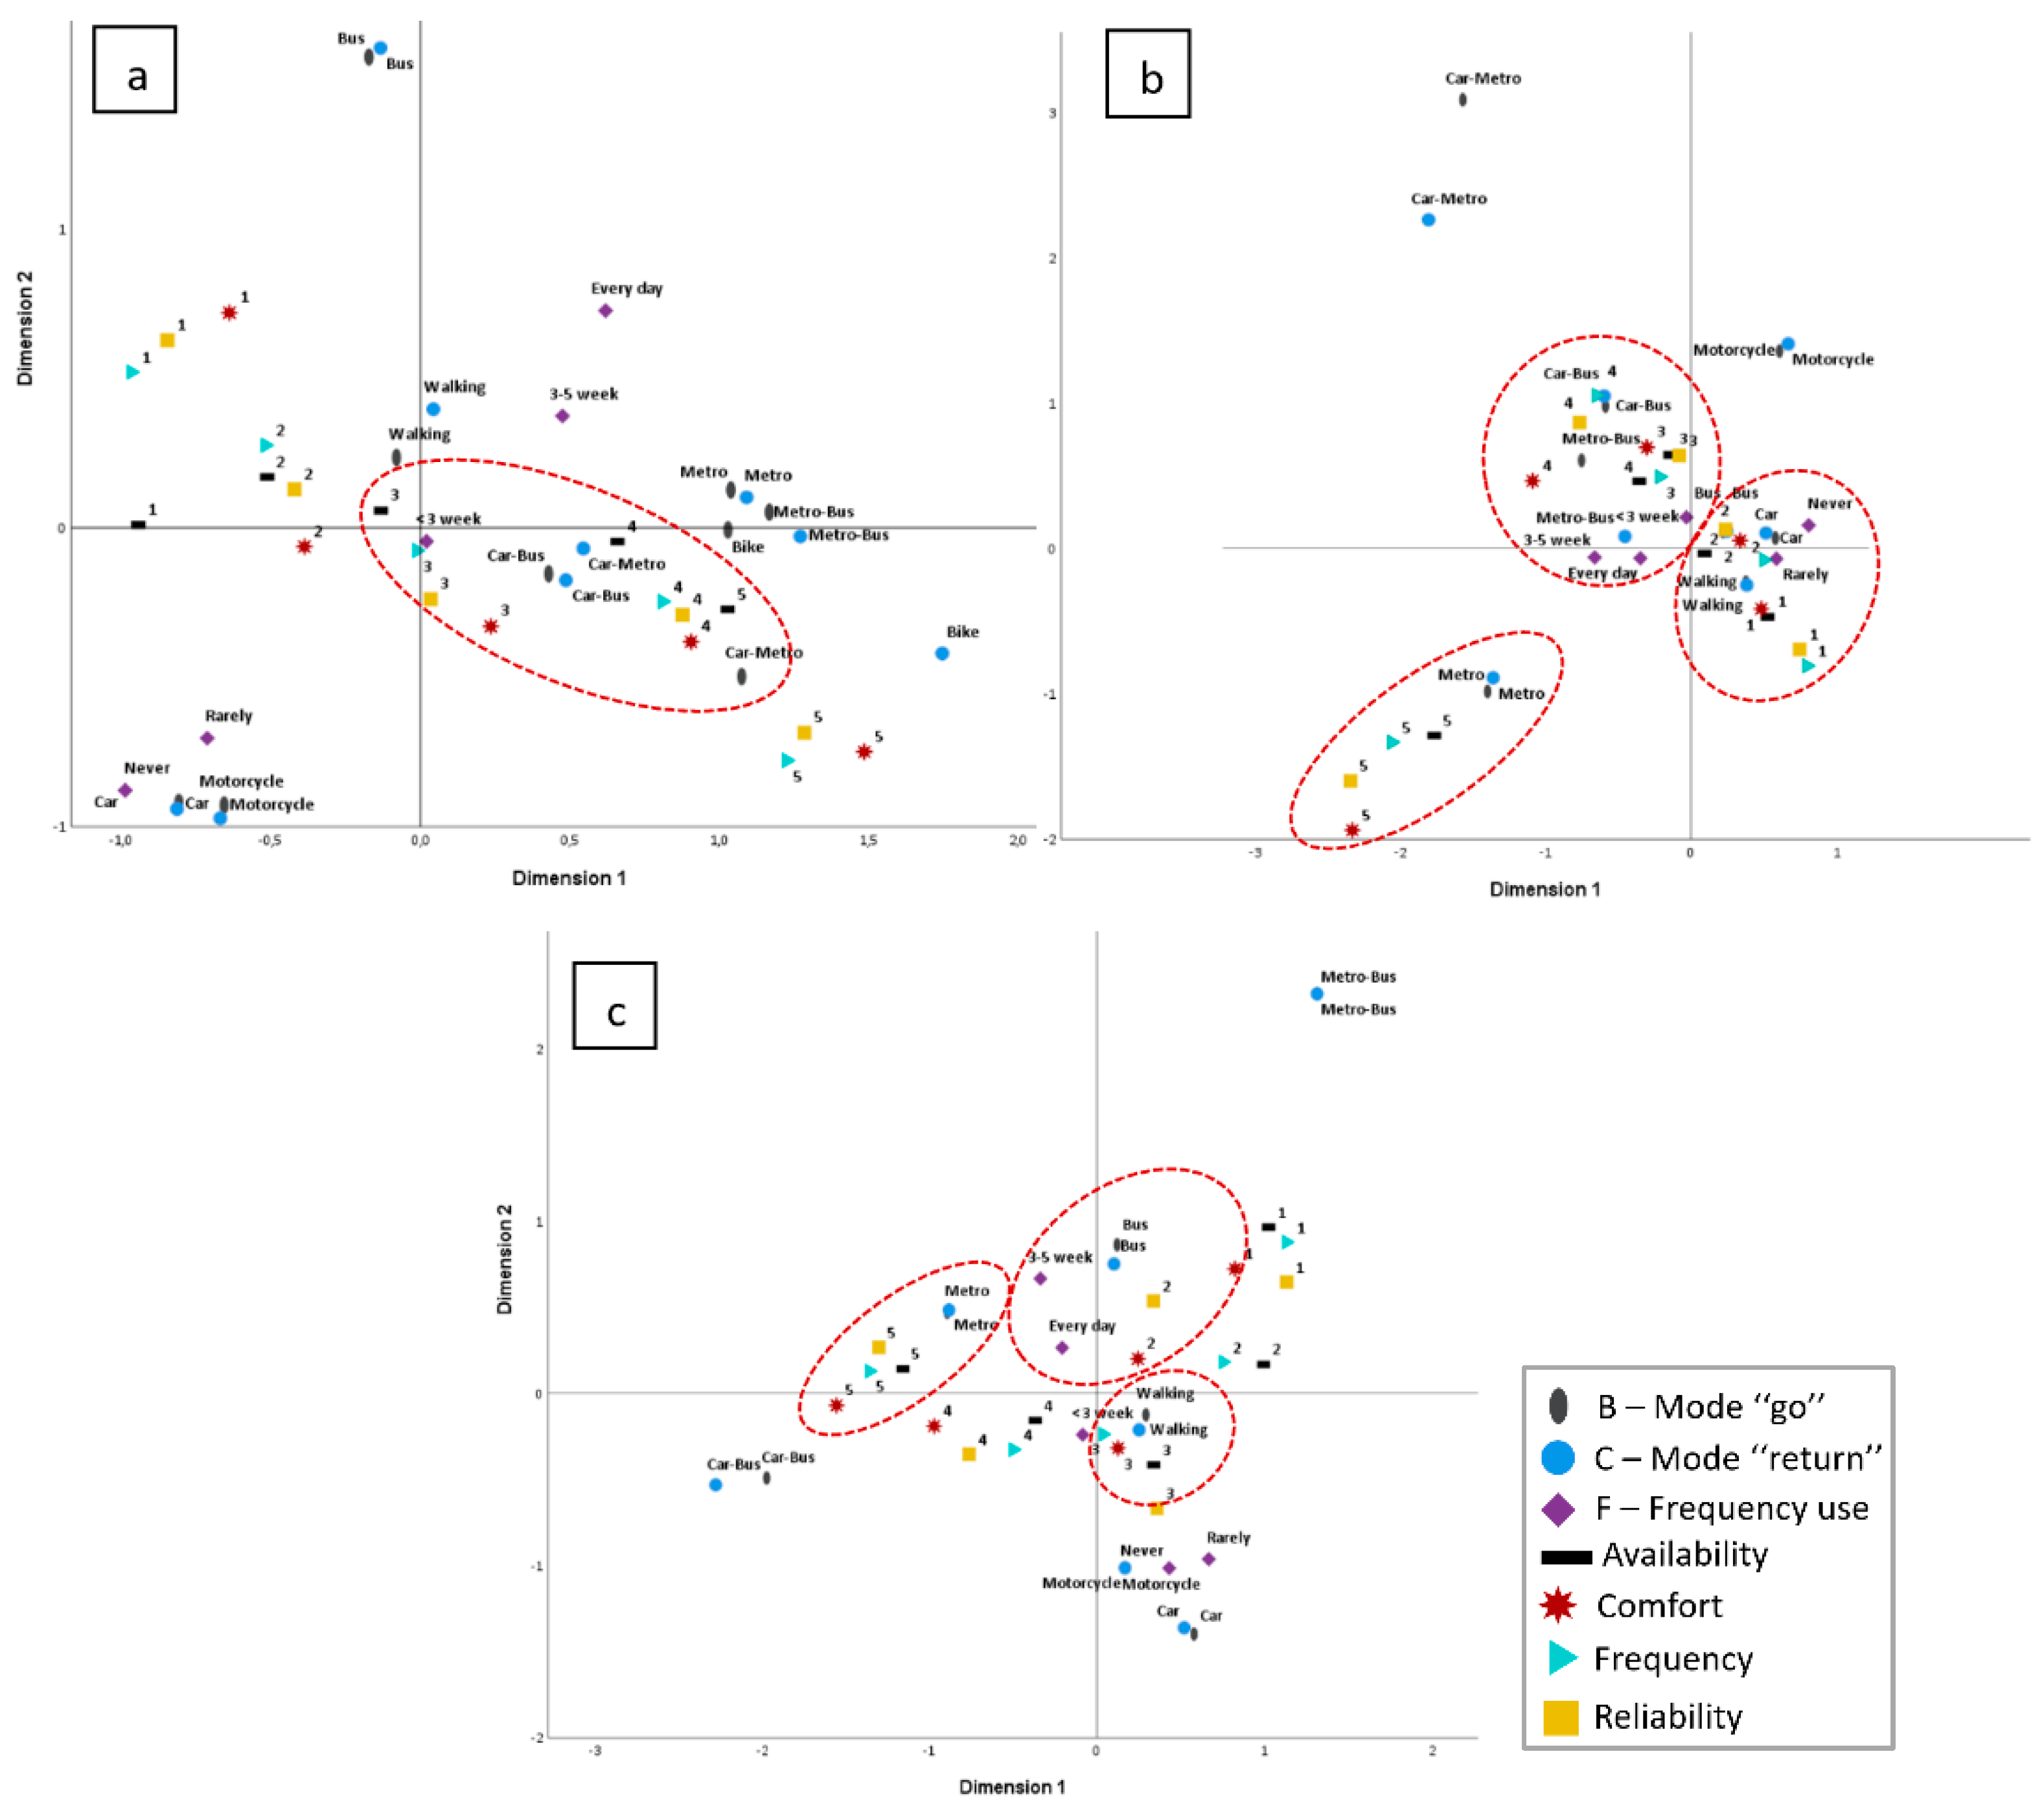
A more detailed analysis on service satisfaction and its use was conducted using the judgments assigned to the characteristics related to the PT quality and users’ travel habits (
Figure 10). This type of analysis is useful to identify the specific problems in a particular site. This must be done both with a view to improving users’ current satisfaction, but also trying to attract future users, students in this case, and encouraging them to use PT.
The results of this analysis show a common trend for the three venues, i.e., users are highly satisfied (in terms of comfort, reliability, availability and frequency of the line) by the service offered by the metro while the opposite occurs for the bus service. This finding demonstrates the need to pay more attention to the bus transport service, by improving those characteristics that have been taken into consideration in this second MCA.
6. Discussion
From the results obtained it is possible to draw some conclusions both related to the research question, and with respect to practical implications for the case study.
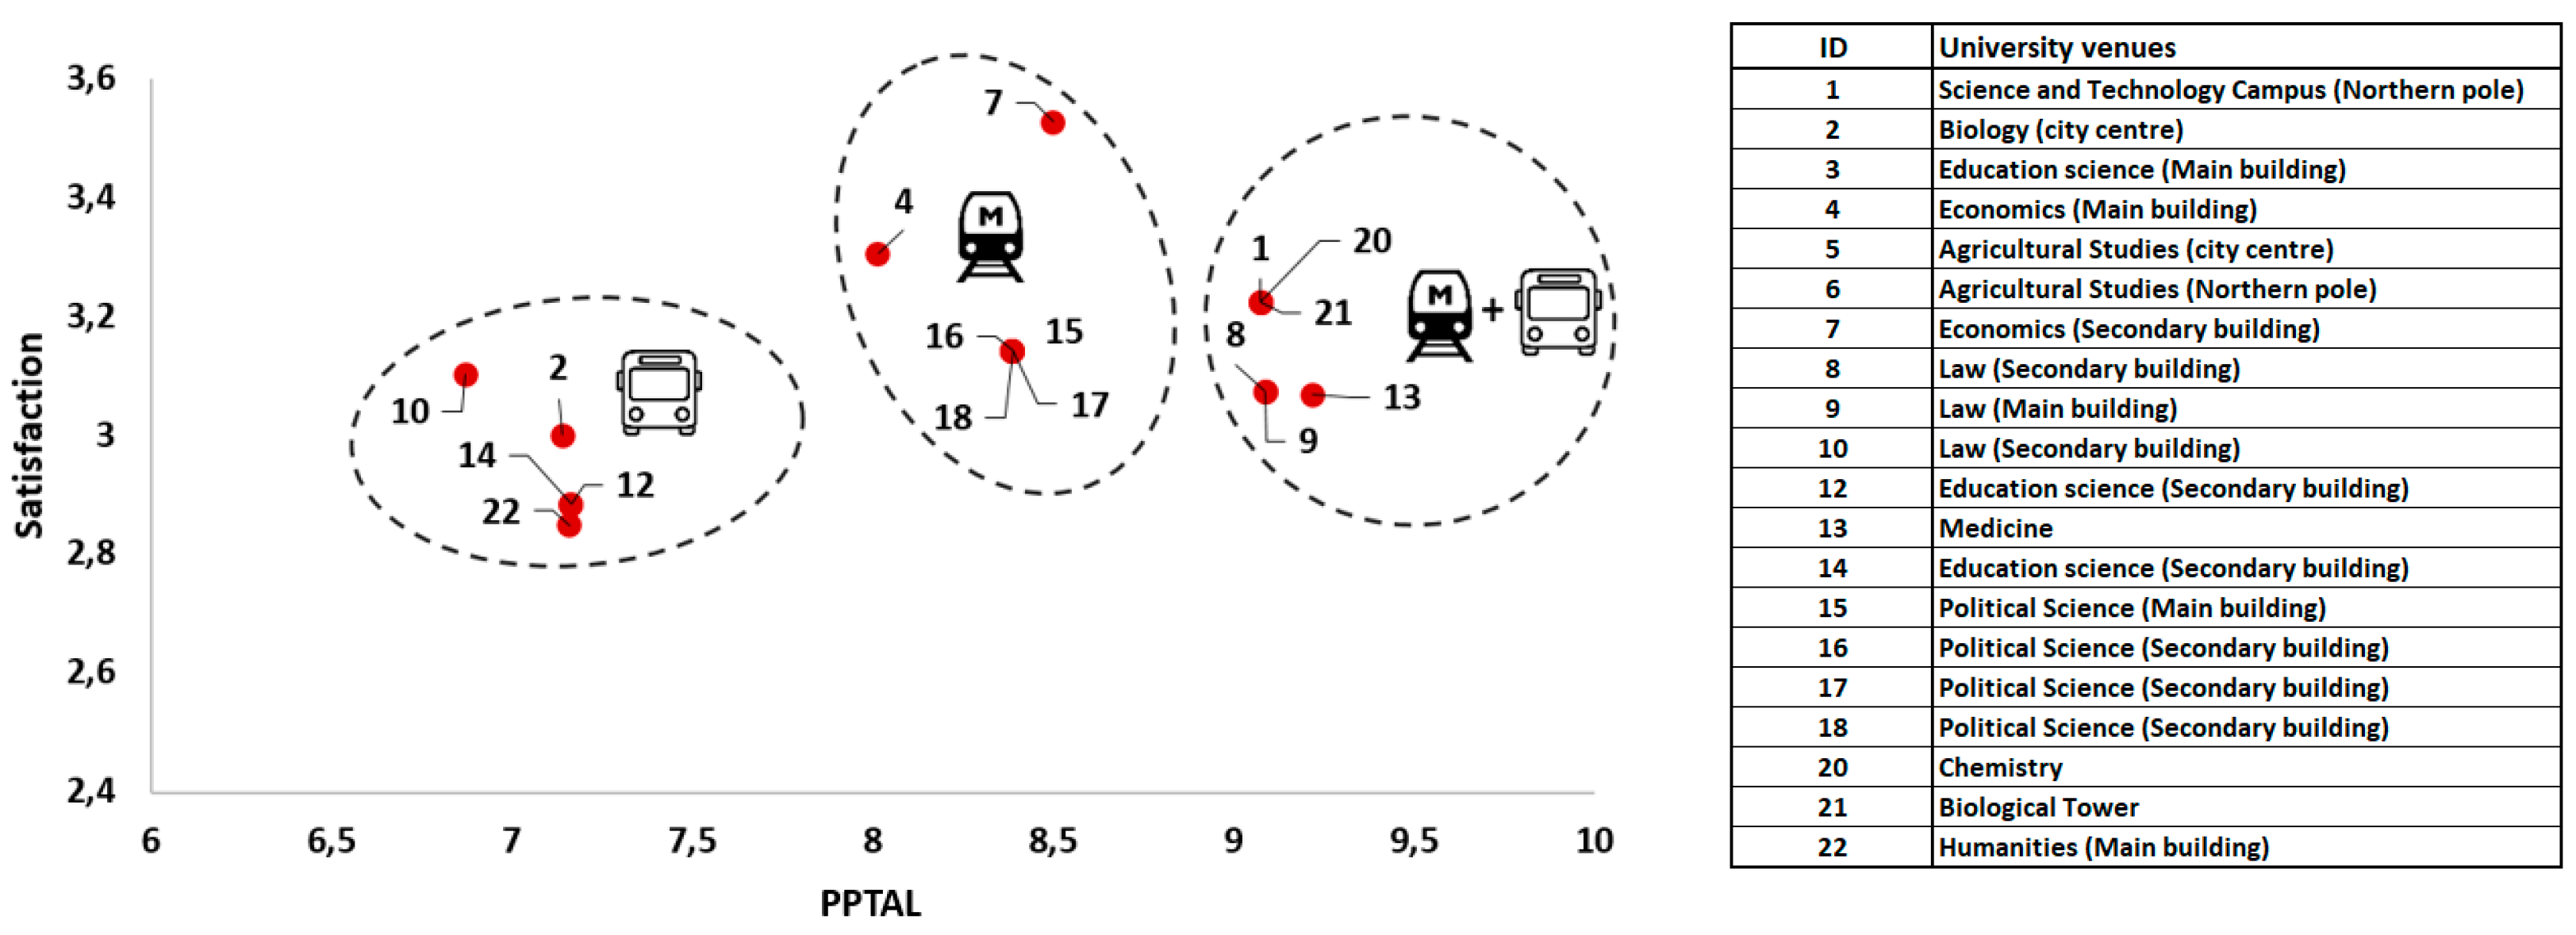
First, we found some interesting correlations between accessibility and user satisfaction, also in relation to travel habits and site location as shown in
Figure 11. As already said at the beginning of this work, the authors are not aware of any study that links these variables with respect to University students’ mobility. Therefore, it is not easy to compare the results obtained with other similar studies.
In more detail, we identify three clusters:
On the left, the sites located in the historical city centre record low values of PPTAL and low to medium satisfaction, mainly because they are served by a bus network with good coverage but low service frequency.
In the middle, the sites mainly located in the eastern part of city centre record a higher PPTAL and an extended range of satisfaction, because of the different locations of the metro stations, at 2 min of walking in the case of sites 4 and 7 and 9 min walking for sites 15–18.
On the right, all sites of the scientific campus outside the ring road benefit from the combination of the metro line and integrated shuttle services, and show the highest scores of accessibility, even if with slightly lower level of satisfaction, probably due to the need of line transfer.
For what concerns the link between accessibility and satisfaction, we observed that they tend to be more correlated for frequent PT users, even if there are some differences that can be ascribed to the judgments given to PT service quality, which in some cases may be considered representative of the overall PT experience and not of the level of service of PT lines to access the venues. This confirms the idea that accessibility can be considered as a good proxy of PT level of service, both from the supply and demand point of view. This result was not clear using a simple linear correlation, while became clearer using a MCA, allowing to infer about correlation between multiple and individual heterogeneous attributes.
From the point of view of the specific results of the case study and related implications for policy-making, there are some differences among the three analyzed venues and the different transit modes available. In particular, while for the science and technology campus the level of service is quite good, recording high levels of PTAL and satisfaction for PT users, the opposite can be said for humanities. Different results can be found for economics (social science) where PTAL values have a high level only for those who use PT for long distances. As for the different PT services, a much higher satisfaction is recorded for the metro service, which is however limited to only one line, with respect to the much wider bus service network.
Policy implications can be drawn from these results. In particular, specific improvements can be planned, starting from the two venues in the city center, where PT should be combined with other modes of transport to increase its coverage. The same applies to the science and technology campus, which is actually the best in terms of PTAL and satisfaction, but which has a lower PPTAL, meaning that it is not easily accessible from everywhere. More effort should be put in making the mostly used bus lines more efficient, e.g., by introducing more reserved lanes or increasing service frequency. Some efforts go in this direction, i.e., with a BRT line from the city center to the campus that is highly used by students. However, results of the survey show that comfort is not satisfactory and specific analyses need to be done to further investigate this issue [
3]. It is under discussion a wider project of renewal of all the PT lines, with a reduction of the number of lines aimed at improving the headways of the new ones, the introduction of 4 new BRT lines and the concentration of bus terminals.
7. Conclusions
This paper explored the potential of accessibility indicators to reflect the satisfaction of public transport users and how this is affected by the spatial characteristics of the site location and transit connectivity.
The work posed the question of considering PT service accessibility as a good proxy of PT QoS, considering both the demand and supply perspective. To test it, we presented a procedure based on a spatial and statistical analysis applied to the case of university student mobility in Catania (Italy). The case study is particularly interesting since the University of Catania has provided unlimited access to PT to all the students and continuously monitored student satisfaction and PT use via a survey. The methodology consists of multiple steps, from the evaluation of both active and passive accessibility indicators based on the PTAL indicator, to the analysis of survey data related to user satisfaction and PT use, with the creation of a multi-layer GIS that allowed a visual representation of all the data, and a statistical analysis based on linear correlation and a MCA. The analysis performed via the MCA allowed to unveil correlations between the different attributes, especially between satisfaction and PTAL, while this result was not clear using a simple linear correlation. Some differences were found among the three analyzed main venues and the different transit modes available, which allow to elaborate on specific implications on how to improve the services for students.
The main policy implication of the results we found is that when university sites are located in the city center (where active and passive accessibility are highly correlated) and especially if they are served by a direct metro line, a high level of global satisfaction is quite likely and the need for frequent customer satisfaction survey can be reduced.
The main limitation of the work relies on the data used for the analysis, which are case-specific. It is worth noticing that the results relating to the trips with origins located in more peripheral areas of the city are influenced by a limitation in the calculation of the PTAL, which assumes the same reliability factor for all areas, while in these areas a lower reliability of PT service could occur: this issue might be investigated in the future with a dynamic index, based on real-time data on delays of the service. It would be also interesting to compare data on the demand as extracted from survey results and ex post demand data resulting from the PT operators. The comparison of the results with a survey conducted before the introduction of the free PT would have been interesting, since it would show if the satisfaction of users improved: however, these data were not available in this case study, but this analysis could be useful for other applications. Other types of advanced analyses could be performed to further explore the correlations among the relevant variables. It would be interesting to understand user perception about accessibility, as done by Lättman et al. [
4]. From the analysis performed, it can be concluded that accessibility can be used as a proxy of service quality for the specific case study.
Author Contributions
Conceptualization, Giuseppe Inturri, Nadia Giuffrida, Michela Le Pira, Martina Fazio and Matteo Ignaccolo; methodology, Giuseppe Inturri, Nadia Giuffrida and Michela Le Pira; software, Nadia Giuffrida, Michela Le Pira and Martina Fazio; writing—original draft preparation, Giuseppe Inturri, Nadia Giuffrida, Michela Le Pira and Martina Fazio; writing—review and editing, Giuseppe Inturri, Nadia Giuffrida, Michela Le Pira and Martina Fazio; supervision, Giuseppe Inturri and Matteo Ignaccolo. All authors have read and agreed to the published version of the manuscript.
Funding
This research received no external funding.
Data Availability Statement
Data are available from the corresponding author, upon reasonable request.
Acknowledgments
The work has been partially supported by the project “WEAKI-TRANSIT: WEAK-demand areas Innovative TRANsport Shared services for Italian Towns” (unique project code: E44I17000050001) under the programme “PRIN 2017” and by the project of M. Le Pira “AIM Linea di Attività 3—Mobilità sostenibile: Trasporti” (unique project code CUP E66C18001390007) under the programme “PON Ricerca e Innovazione 2014–2020—Fondo Sociale Europeo, Azione 1.2 “Attrazione e mobilità internazionale dei ricercatori”” and the project “ADDRESS” under the University of Catania programme “PIACERI Linea 2”.
Conflicts of Interest
The authors declare no conflict of interest.
References
- Beirão, G.; Cabral, J.S. Understanding attitudes towards public transport and private car: A qualitative study. Transp. Policy 2007, 14, 478–489. [Google Scholar] [CrossRef]
- Banister, D. The sustainable mobility paradigm. Transp. Policy 2008, 15, 73–80. [Google Scholar] [CrossRef]
- Fazio, M.; Le Pira, M.; Inturri, G.; Ignaccolo, M. Bus Rapid Transit vs. Metro. Monitoring on-board comfort of competing transit services via sensors. In Proceedings of the 2020 Forum on Integrated and Sustainable Transportation Systems (FISTS), Delft, The Netherlands, 3–5 November 2020; IEEE: Piscataway, NJ, USA, 2020; pp. 292–297. [Google Scholar]
- Lättman, K.; Olsson, L.E.; Friman, M. Development and test of the perceived accessibility scale (PAC) in public transport. J. Transp. Geogr. 2016, 54, 257–263. [Google Scholar] [CrossRef]
- Friman, M.; Lättman, K.; Olsson, L.E. Public transport quality, safety, and perceived accessibility. Sustainability 2020, 12, 3563. [Google Scholar] [CrossRef]
- TfL, 2015. Connectivity Assessment Guide. Transport for London. Available online: http://content.tfl.gov.uk/connectivity-assessment-guide.pdf (accessed on 10 April 2019).
- Giuffrida, N.; Ignaccolo, M.; Inturri, G.; Rofè, Y.; Calabrò, G. Investigating the Correlation between Transportation Social Need and Accessibility: The Case of Catania. Transp. Res. Procedia 2017, 27, 816–823. [Google Scholar] [CrossRef]
- Giuffrida, N.; Inturri, G.; Caprì, S.; Spica, S.; Ignaccolo, M. The impact of a bus rapid transit line on spatial accessibility and transport equity: The case of Catania. Transport Infrastructure and Systems. In Proceedings of the AIIT International Congress on Transport Infrastructure and Systems, TIS 2017, Rome, Italy, 10–12 April 2017; pp. 753–758. [Google Scholar]
- Benzécri, J.P. Sur le calcul des taux d’inertie dans l’analyse d’un questionnaire, addendum et erratum à [BIN. MULT.]. Cah. L’analyse Données 1979, 4, 377–378. [Google Scholar]
- Butzhammer, A. Modelling Intermodal Accessibility Considering Quality Aspects of Transport—A GIS-based Approach for the State of Salzburg. GI Forum 2017, 5, 152–163. [Google Scholar] [CrossRef] [Green Version]
- Papantoniou, P.; Yannis, G.; Vlahogianni, E.; Attard, M.; Regattieri, A.; Piana, F.; Pilati, F. Developing a Sustainable Mobility Action Plan for University Campuses. Transp. Res. Procedia 2020, 48, 1908–1917. [Google Scholar] [CrossRef]
- Ribeiro, P.; Fonseca, F.; Meireles, T. Sustainable mobility patterns to university campuses: Evaluation and constraints. Case Stud. Transp. Policy 2020, 8, 639–647. [Google Scholar] [CrossRef]
- Stein, P.P.; da Silva, A.N.R. Barriers, motivators and strategies for sustainable mobility at the USP campus in São Carlos, Brazil. Case Stud. Transp. Policy 2018, 6, 329–335. [Google Scholar] [CrossRef]
- Azzali, S.; Sabour, E.A. A framework for improving sustainable mobility in higher education campuses: The case study of Qatar University. Case Stud. Transp. Policy 2018, 6, 603–612. [Google Scholar] [CrossRef]
- Delmelle, E.M.; Delmelle, E.C. Exploring spatio-temporal commuting patterns in a university environment. Transp. Policy 2012, 21, 1–9. [Google Scholar] [CrossRef]
- Fernandes, P.; Sousa, C.; Macedo, J.; Coelho, M.C. How to evaluate the extent of mobility strategies in a university campus: An integrated analysis of impacts. Int. J. Sustain. Transp. 2019, 14, 120–136. [Google Scholar] [CrossRef]
- Attard, M.; Camilleri, M.P.; Muscat, A. The technology behind a shared demand responsive transport system for a university campus. Res. Transp. Bus. Manag. 2020, 36, 100463. [Google Scholar] [CrossRef]
- Giuffrida, N.; Le Pira, M.; Fazio, M.; Inturri, G.; Ignaccolo, M. On the spatial feasibility of crowdshipping services in university communities. Transp. Res. Procedia 2021, 52, 19–26. [Google Scholar] [CrossRef]
- CEN. UNI EN 13816, Transportation—Logistics and Services—Public Passenger Transport—Service Quality Definition, Targeting and Measurement; CEN: Brussels, Belgium, 2002. [Google Scholar]
- De Oña, J.; de Oña, R. Quality of service in public transport based on customer satisfaction surveys: A review and assessment of methodological approaches. Transp. Sci. 2015, 49, 605–622. [Google Scholar] [CrossRef] [Green Version]
- Hensher, D.A.; Stopher, P.; Bullock, P. Service quality-developing a service quality index in the provision of commercial bus contracts. Transp. Res. Part A Policy Pract. 2003, 37, 499–517. [Google Scholar] [CrossRef]
- Eboli, L.; Mazzulla, G. A stated preference experiment for measuring service quality in public transport. Transp. Plan. Technol. 2008, 31, 509–523. [Google Scholar] [CrossRef] [Green Version]
- Cirillo, C.; Eboli, L.; Mazzulla, G. On the asymmetric user perception of transit service quality. Int. J. Sustain. Transp. 2011, 5, 216–232. [Google Scholar] [CrossRef]
- Andreassen, T.W. (Dis)satisfaction with public services: The case of public transportation. J. Serv. Mark. 1995, 9, 30–41. [Google Scholar] [CrossRef]
- Eboli, L.; Mazzulla, G. Service quality attributes affecting customer satisfaction for bus transit. J. Public Transp. 2007, 10, 2. [Google Scholar] [CrossRef] [Green Version]
- Lai, W.T.; Chen, C.F. Behavioral intentions of public transit passengers-The roles of service quality, perceived value, satisfaction and involvement. Transp. Policy 2011, 18, 318–325. [Google Scholar] [CrossRef]
- De Oña, J.; de Oña, R.; Calvo, F.J. A classification tree approach to identify key factors of transit service quality. Expert Syst. Appl. 2012, 39, 11164–11171. [Google Scholar] [CrossRef]
- Nathanail, E. Measuring the quality of service for passengers on the Hellenic railways. Transp. Res. Part A Policy Pract. 2008, 42, 48–66. [Google Scholar] [CrossRef]
- Eboli, L.; Mazzulla, G. Performance indicators for an objective measure of public transport service quality. Eur. Transp. 2012, 51, 4. [Google Scholar]
- Guirao, B.; García, A.; López, M.E.; Acha, C.; Comendador, J. New QR survey methodologies to analyze user perception of service quality in public transport: The experience of Madrid. J. Public Transp. 2015, 18, 5. [Google Scholar] [CrossRef] [Green Version]
- Bordagaray, M.; dell’Olio, L.; Ibeas, A.; Cecín, P. Modelling user perception of bus transit quality considering user and service heterogeneity. Transp. A Transp. Sci. 2014, 10, 705–721. [Google Scholar] [CrossRef]
- Le Pira, M.; Inturri, G.; Ignaccolo, M. Public transport and proactive real-time information: A survey on users’ preferences and attitudes toward multimodal traveler information services. In Proceedings of the International Conference on Traffic and Transport Engineering (ICTTE 2018), Belgrade, Serbia, 27–28 September 2018; ISBN 978-86-916153-4-5. [Google Scholar]
- Fransen, K.; Neutens, T.; Farber, S.; De Maeyer, P.; Deruyter, G.; Witlox, F. Identifying public transport gaps using time-dependent accessibility levels. J. Transp. Geogr. 2015, 48, 176–187. [Google Scholar] [CrossRef] [Green Version]
- Hansen, W.G. How Accessibility Shapes Land Use. J. Am. Plan. Inst. 1959, 25, 73–76. [Google Scholar] [CrossRef]
- Geurs, K.T.; Van Wee, B. Accessibility evaluation of land-use and transport strategies: Review and research directions. J. Transp. Geogr. 2004, 12, 127–140. [Google Scholar] [CrossRef]
- Giuffrida, N.; Le Pira, M.; Inturri, G.; Ignaccolo, M. Mapping with Stakeholders: An Overview of Public Participatory GIS and VGI in Transport Decision-Making. ISPRS Int. J. Geo Inf. 2019, 8, 198. [Google Scholar] [CrossRef] [Green Version]
- Ignaccolo, M.; Inturri, G.; Giuffrida, N.; Torrisi, V. Public transport accessibility and social exclusion: Making the connections. In Proceedings of the International Conference on Traffic and Transport Engineering (ICTTE), Lucerne, Switzerland, 6–8 July 2016. [Google Scholar]
- Inturri, G.; Ignaccolo, M.; Le Pira, M.; Caprì, S.; Giuffrida, N. Influence of Accessibility, Land Use and Transport Policies on the Transport Energy Dependence of a City. Transp. Res. Procedia 2017, 25, 3273–3285. [Google Scholar] [CrossRef]
- Szymański, P.; Żołnieruk, M.; Oleszczyk, P.; Gisterek, I.; Kajdanowicz, T. Spatio-temporal profiling of public transport delays based on large-scale vehicle positioning data from GPS in Wrocław. IEEE Trans. Intell. Transp. Syst. 2018, 19, 3652–3661. [Google Scholar] [CrossRef] [Green Version]
- Mościcka, A.; Pokonieczny, K.; Wilbik, A.; Wabiński, J. Transport accessibility of Warsaw: A case study. Sustainability 2019, 11, 5536. [Google Scholar] [CrossRef] [Green Version]
- Bhat, C.; Handy, S.; Kockelman, K.; Mahmassani, H.; Chen, Q.; Weston, L. Development of an Urban Accessibility Index: Literature Review; Research Project Conducted for the Texas Department of Transportation; Center for Transportation Research the University of Texas: Austin, TX, USA, 2000. [Google Scholar]
- Saif, M.A.; Zefreh, M.M.; Torok, A. Public transport accessibility: A literature review. Period. Polytech. Transp. Eng. 2019, 47, 36–43. [Google Scholar] [CrossRef] [Green Version]
- Malekzadeh, A.; Chung, E. A review of transit accessibility models: Challenges in developing transit accessibility models. Int. J. Sustain. Transp. 2020, 14, 733–748. [Google Scholar] [CrossRef]
- Pirie, G.H. Measuring accessibility: A review and proposal. Environ. Plan. A 1979, 11, 299–312. [Google Scholar] [CrossRef]
- Kwan, M.P. Gender and individual access to urban opportunities: A study using space-time measures. Prof. Geogr. 1999, 51, 210–227. [Google Scholar] [CrossRef]
- Miller, H. Measuring space-time accessibility benefits within transportation networks: Basic theory and computational procedures. Geogr. Anal. 1999, 31, 187–212. [Google Scholar] [CrossRef]
- Cascetta, E. Transportation Systems Analysis: Models and Applications; Springer Science & Business Media: Berlin/Heidelberg, Germany, 2009; Volume 29. [Google Scholar]
- Lei, T.L.; Church, R.L. Mapping transit-based access: Integrating GIS, routes and schedules. Int. J. Geogr. Inf. Sci. 2010, 24, 283–304. [Google Scholar] [CrossRef]
- Adhvaryu, B.; Chopde, A.; Dashora, L. Mapping public transport accessibility levels (PTAL) in India and its applications: A case study of Surat. Case Stud. Transp. Policy 2019, 7, 293–300. [Google Scholar] [CrossRef]
- Sun, C.; Chen, X.; Zhang, H.M.; Huang, Z. An evaluation method of urban public transport facilities resource supply based on accessibility. J. Adv. Transp. 2018, 2018, 3754205. [Google Scholar] [CrossRef]
- Cuthill, N.; Cao, M.; Liu, Y.; Gao, X.; Zhang, Y. The association between urban public transport infrastructure and social equity and spatial accessibility within the urban environment: An investigation of Tramlink in London. Sustainability 2019, 11, 1229. [Google Scholar] [CrossRef] [Green Version]
- Cao, M.; Hickman, R. Urban transport and social inequities in neighbourhoods near underground stations in Greater London. Transp. Plan. Technol. 2019, 42, 419–441. [Google Scholar] [CrossRef]
- Bantis, T.; Haworth, J. Assessing transport related social exclusion using a capabilities approach to accessibility framework: A dynamic Bayesian network approach. J. Transp. Geogr. 2020, 84, 102673. [Google Scholar] [CrossRef]
- Boisjoly, G.; El-Geneidy, A. Public transport equity outcomes through the lens of urban form. In Urban Form and Accessibility; Elsevier: Amsterdam, The Netherlands, 2020; pp. 223–241. [Google Scholar]
- Hsiao, S.; Lu, J.; Sterling, J.; Weatherford, M. Use of Geographic Information System for Analysis of Transit Pedestrian Access. Transp. Res. Rec. 1997, 1604, 50–59. [Google Scholar] [CrossRef]
- Jalayer, M.; Zhou, H. A multiple correspondence analysis of at-fault motorcycle-involved crashes in Alabama. J. Adv. Transp. 2016, 50, 2089–2099. [Google Scholar] [CrossRef]
- Giuffrida, N.; Ignaccolo, M.; Inturri, G. Using multiple correspondence analysis to improve safety in interaction between road transit and public spaces. In Town and Infrastructure Planning for Safety and Urban Quality, Proceedings of the XXIII International Conference on Living and Walking in Cities (LWC 2017), Brescia, Italy, 15–16 June 2017; CRC Press: Boca Raton, FL, USA, 2018; p. 129. [Google Scholar]
- Sivasankaran, S.K.; Balasubramanian, V. Investigation of pedestrian crashes using multiple correspondence analysis in India. Int. J. Inj. Control Saf. Promot. 2020, 27, 144–155. [Google Scholar] [CrossRef] [PubMed]
- Leonardi, S.; Di Stefano, N.; Pulvirenti, G. Multiple Correspondence Analysis (MCA) for the evaluation of risk perception of roundabouts for young people. Eur. Transp. Int. J. Transp. Econ. Eng. Law 2019, 72, e4. [Google Scholar]
- Leonardi, S.; Distefano, N.; Pulvirenti, G. Italians’ public opinion on road roundabouts: A web based survey. Transp. Res. Procedia 2020, 45, 293–300. [Google Scholar] [CrossRef]
- Lombardo, R.; Camminatiello, I.; Beh, E.J. Assessing Satisfaction with Public Transport Service by Ordered Multiple Correspondence Analysis. Soc. Indic. Res. 2019, 143, 355–369. [Google Scholar] [CrossRef]
- Grison, E.; Gyselinck, V.; Burkhardt, J.M. Exploring factors related to users’ experience of public transport route choice: Influence of context and users profiles. Cogn. Technol. Work 2016, 18, 287–301. [Google Scholar] [CrossRef]
- Cusatelli, C.; Giacalone, M.; Troisi, A. A survey on the local public transport in Bologna. Electron. J. Appl. Stat. Anal. 2016, 9, 623–636. [Google Scholar]
- Ignaccolo, M.; Inturri, G.; Le Pira, M.; Caprì, S.; Mancuso, V. Evaluating the role of land use and transport policies in reducing the transport energy dependence of a city. Res. Transp. Econ. 2016, 55, 60–66. [Google Scholar] [CrossRef]
- Inturri, G.; Fiore, S.; Ignaccolo, M.; Caprì, S.; Le Pira, M. “You study, you travel free”: When mobility management strategies meet social objectives. Transp. Res. Procedia 2020, 45, 193–200. [Google Scholar] [CrossRef]
| Publisher’s Note: MDPI stays neutral with regard to jurisdictional claims in published maps and institutional affiliations. |
© 2021 by the authors. Licensee MDPI, Basel, Switzerland. This article is an open access article distributed under the terms and conditions of the Creative Commons Attribution (CC BY) license (https://creativecommons.org/licenses/by/4.0/).


 ,
, 


