
A Framework for Cloud-Based Spatially-Explicit Uncertainty and Sensitivity Analysis in Spatial Multi-Criteria Models

 , , , and
Abstract
:1. Introduction
2. Methodology—Parallel and Distributed SEUSA Approach
2.1. SEUSA: Python–Dask
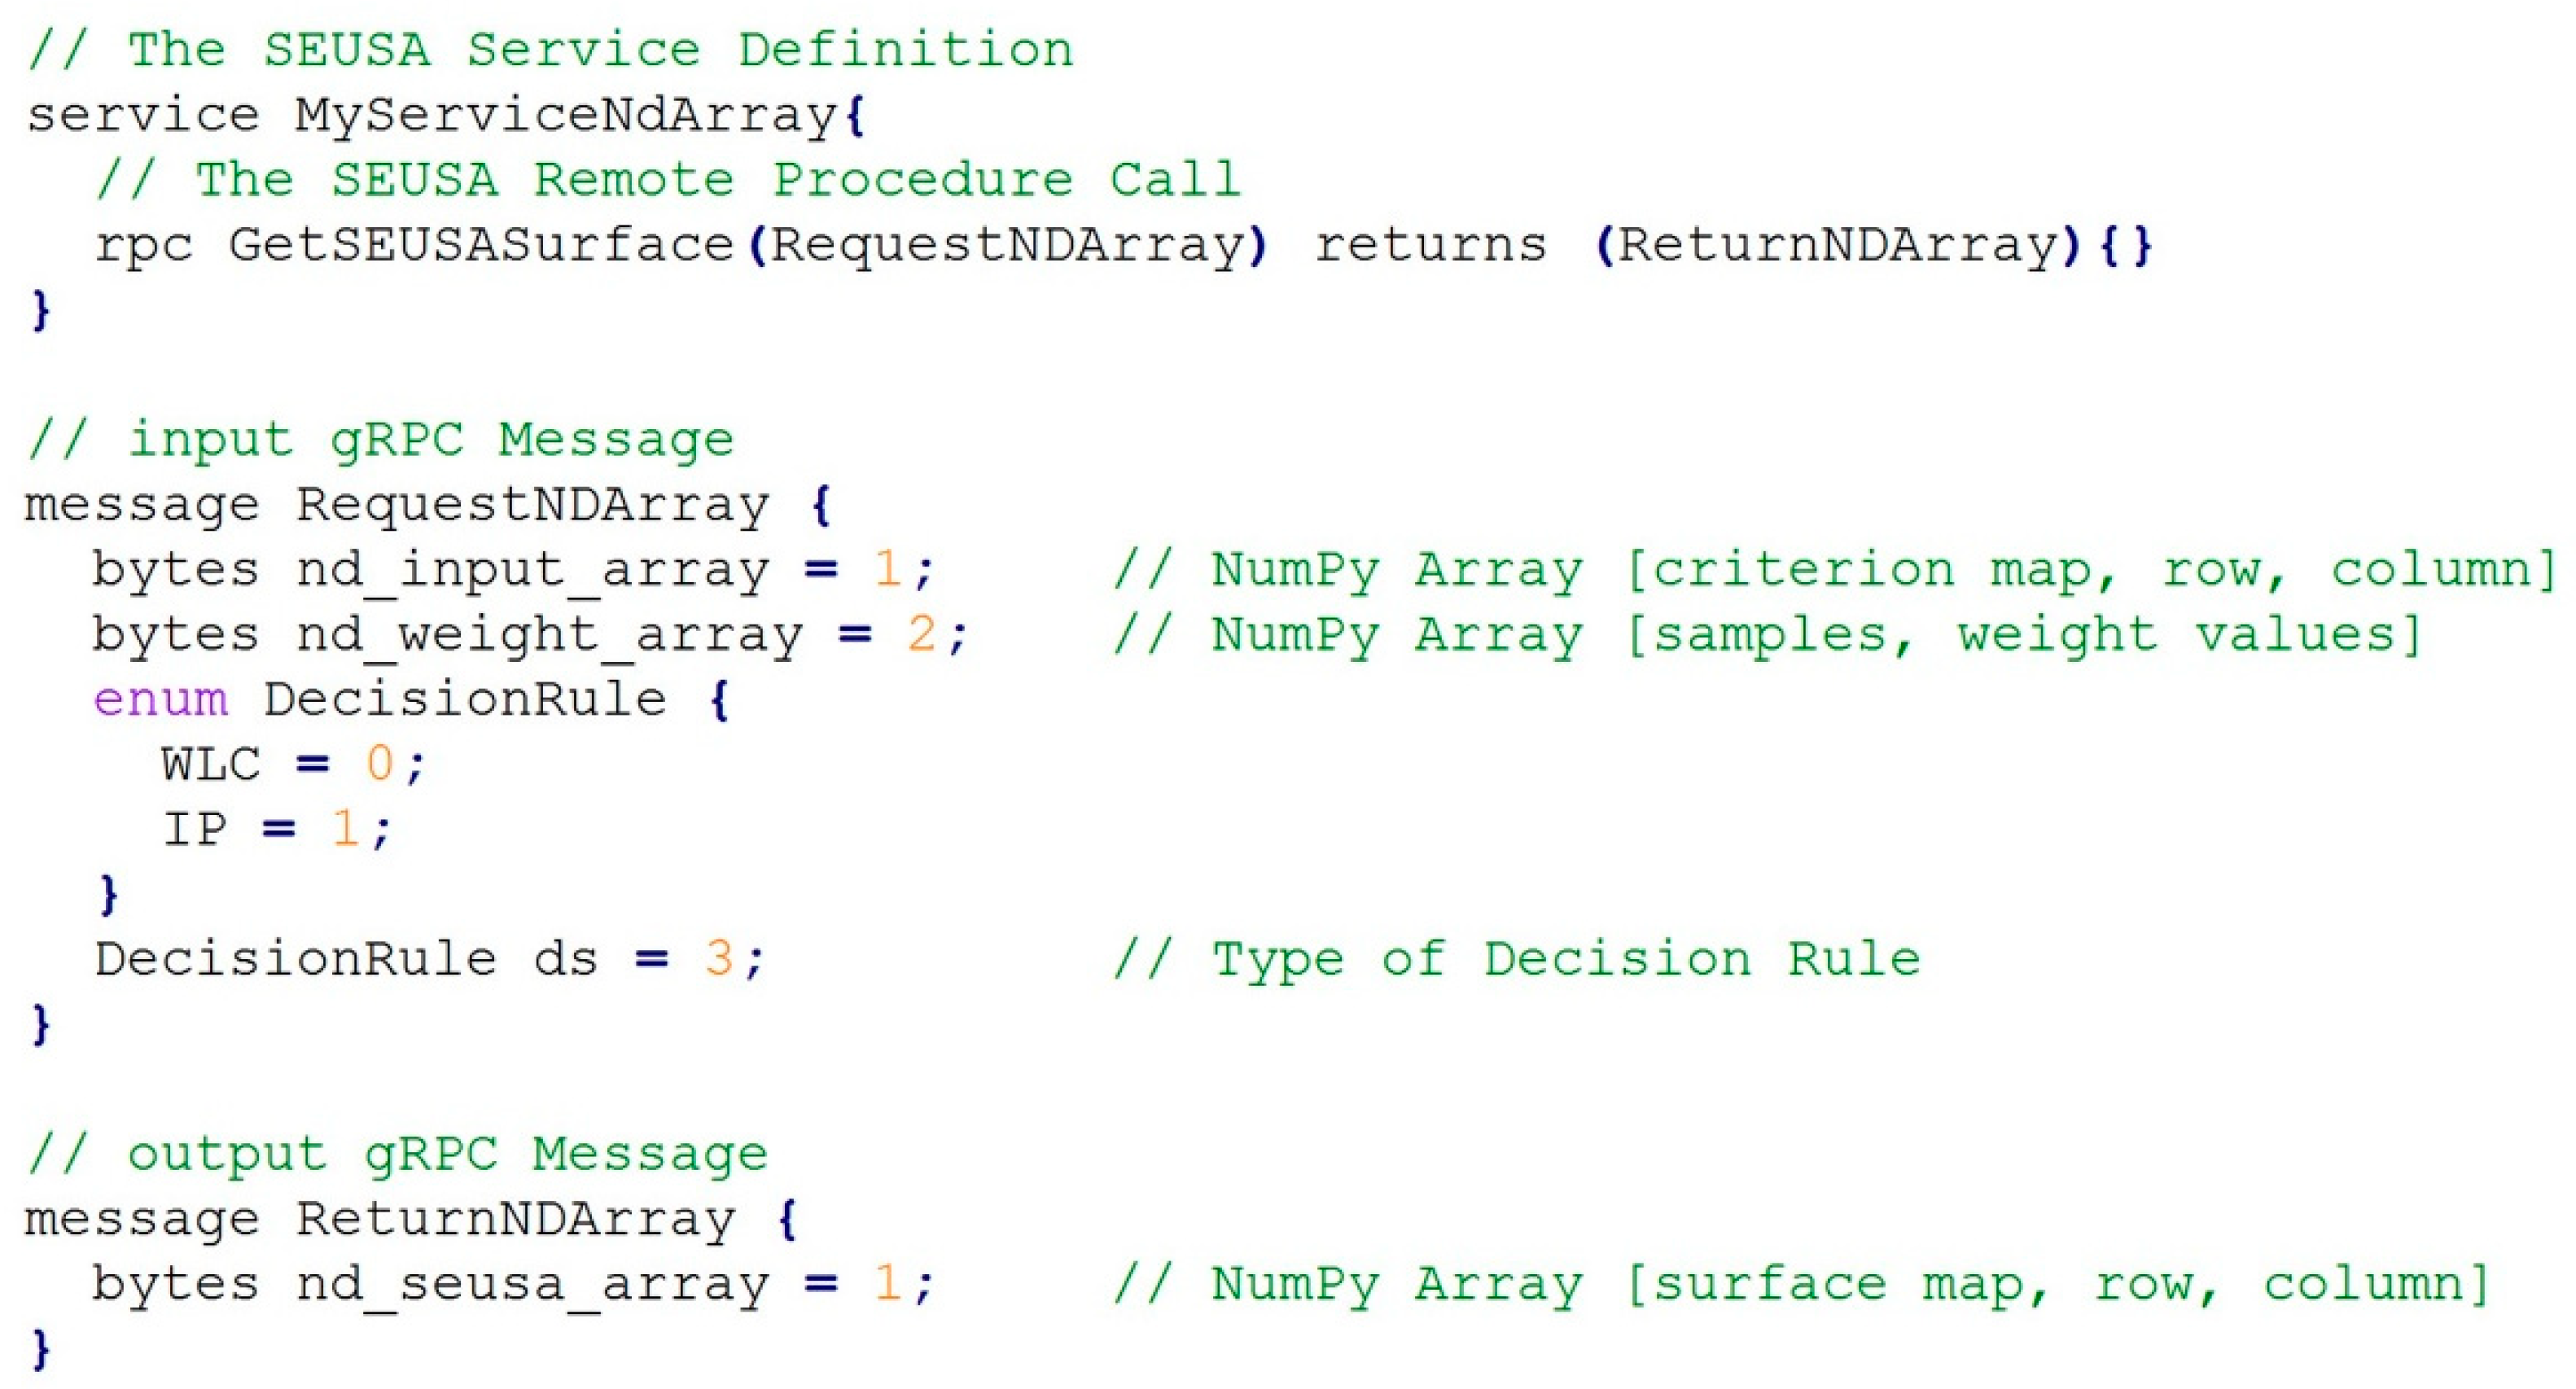
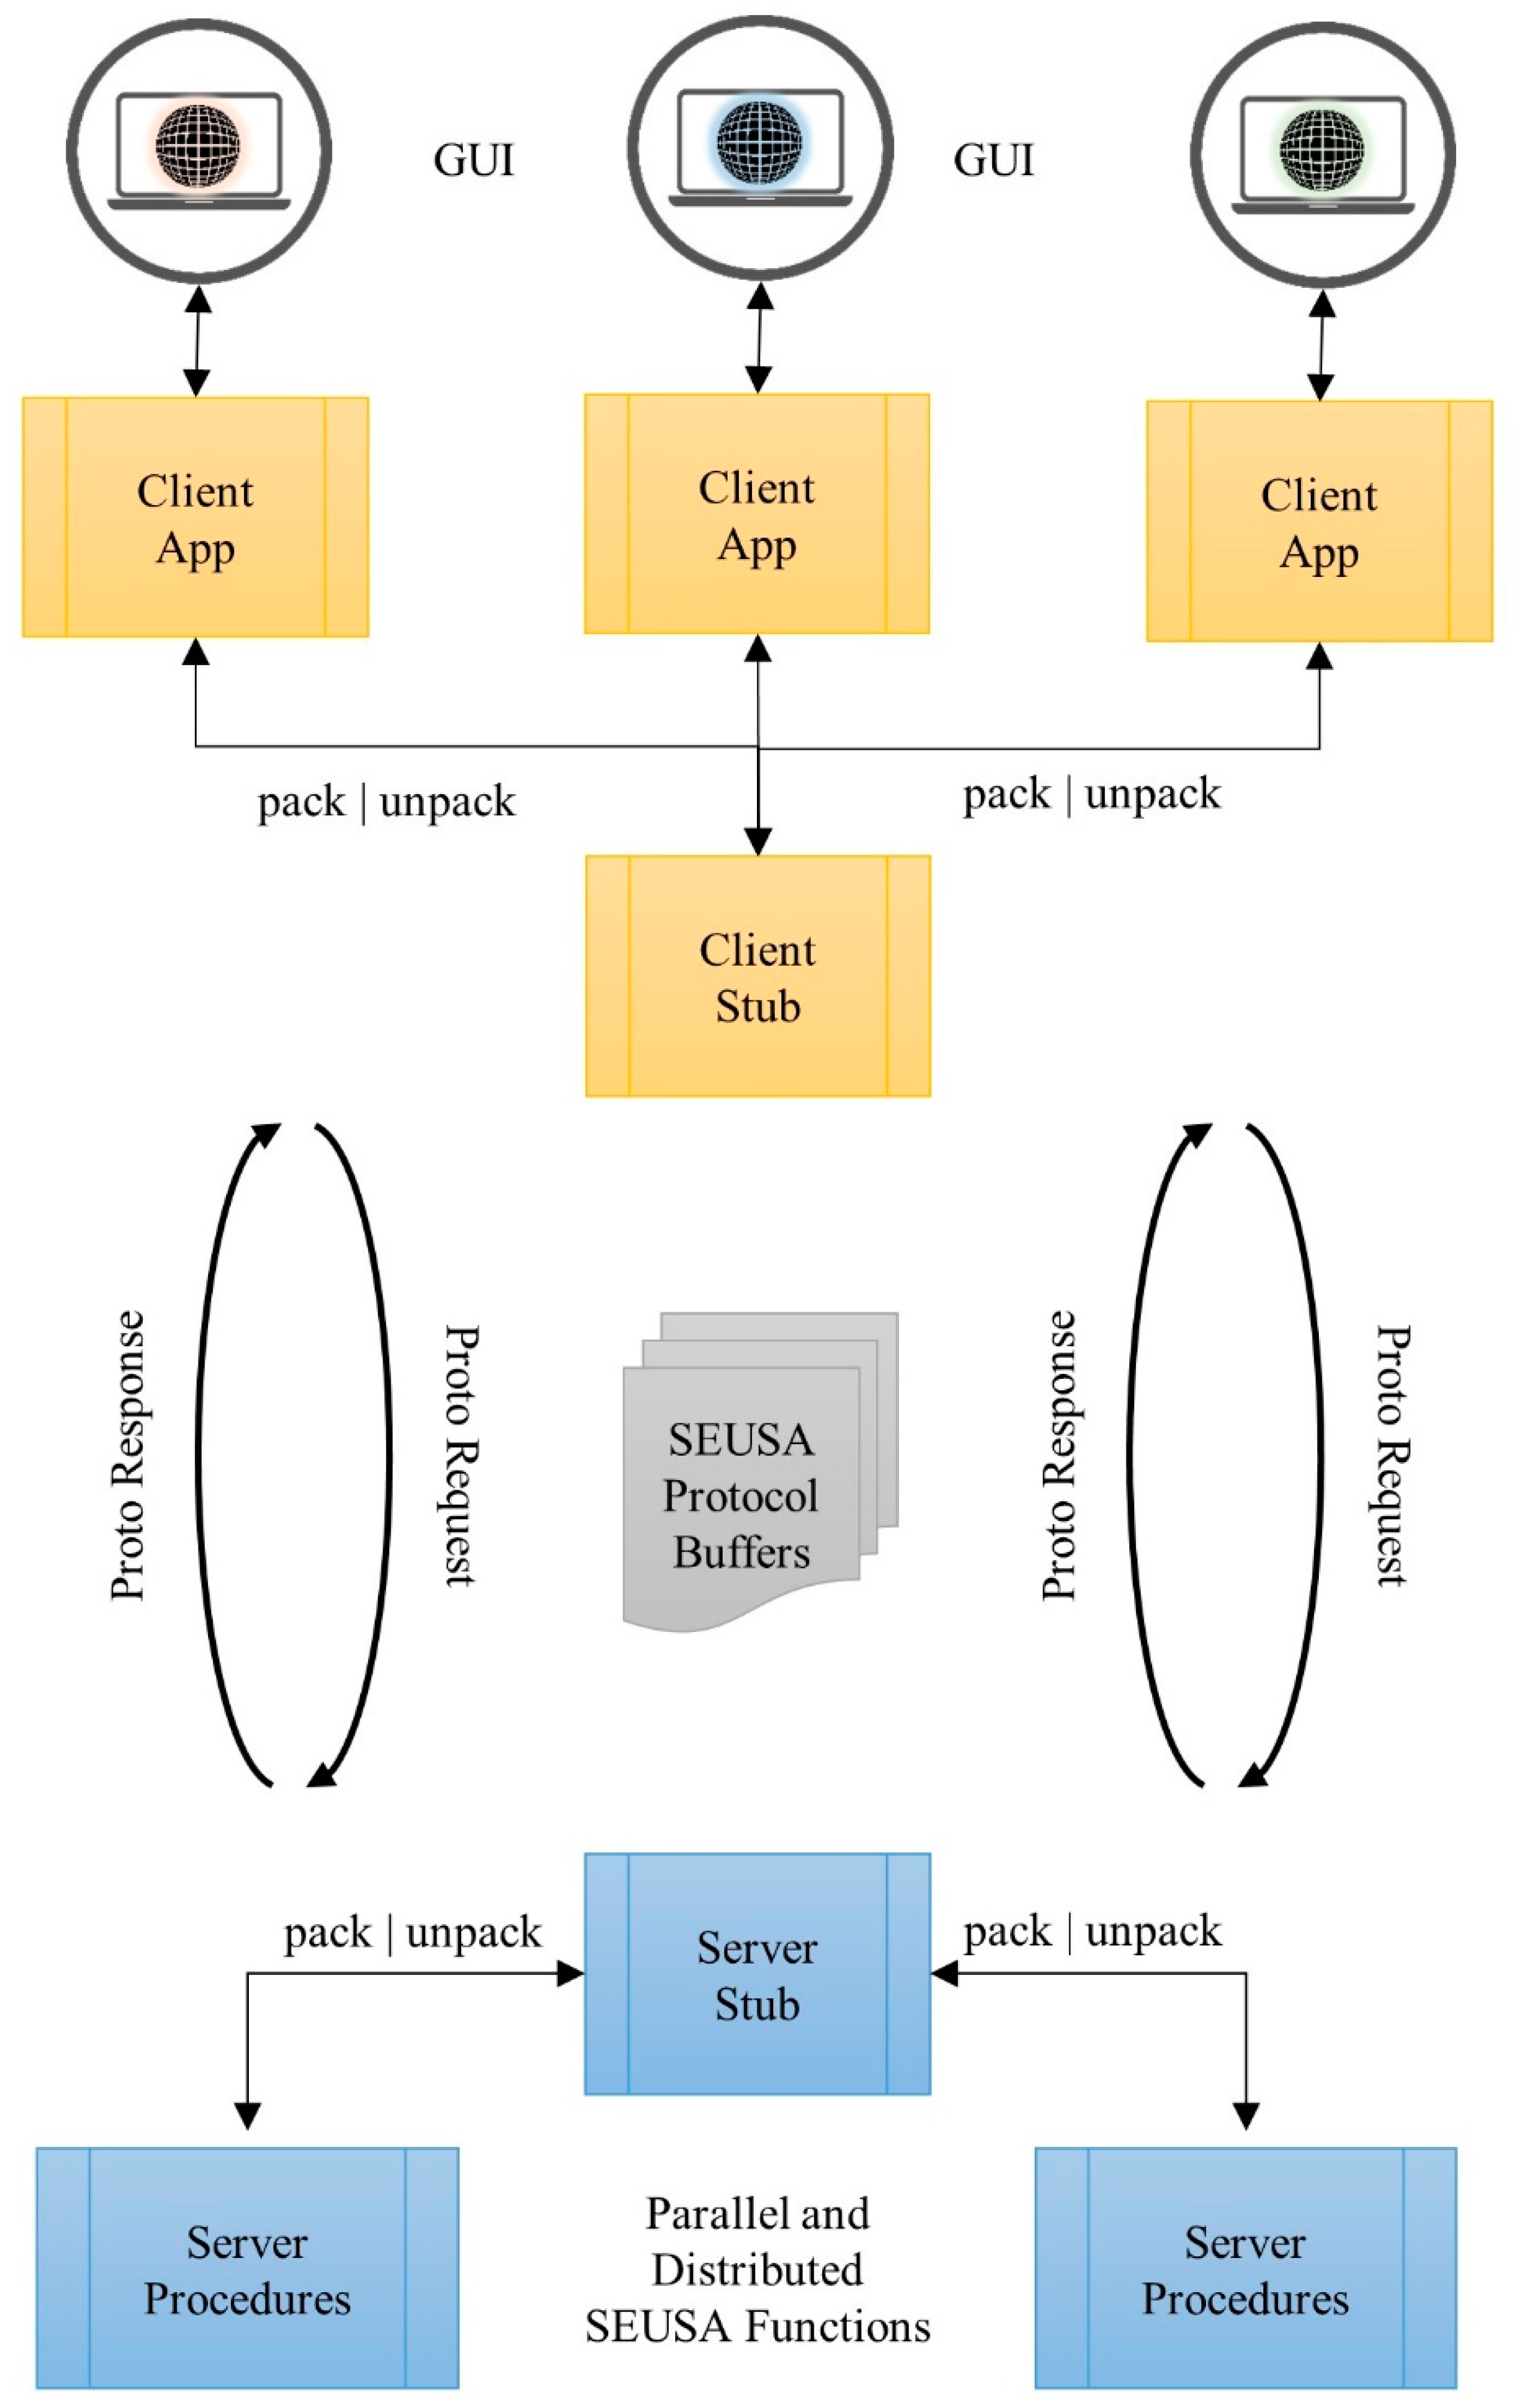
2.2. SEUSA: Middleware
- (1)
- the Stub, which can be used by the client application to invoke remote procedure call;
- (2)
- the Servicer, which defines the interface for the implemented services; and
- (3)
- the Servicer _to_server function, which adds the Servicer to the grpc.Server.
3. SEUSA to Cloud—Design of the Framework
- General needs for the cloud migration;
- SEUSA as a Service to facilitate access for user communities;
- parallel and distributed computing issues;
- tiling services relevant to perform computations and facilitate map representation; and
- requirements concerning cloud storage to provide high data availability and reliability for exchanging information between applications.
3.1. Theoretical Background
3.2. Requirements
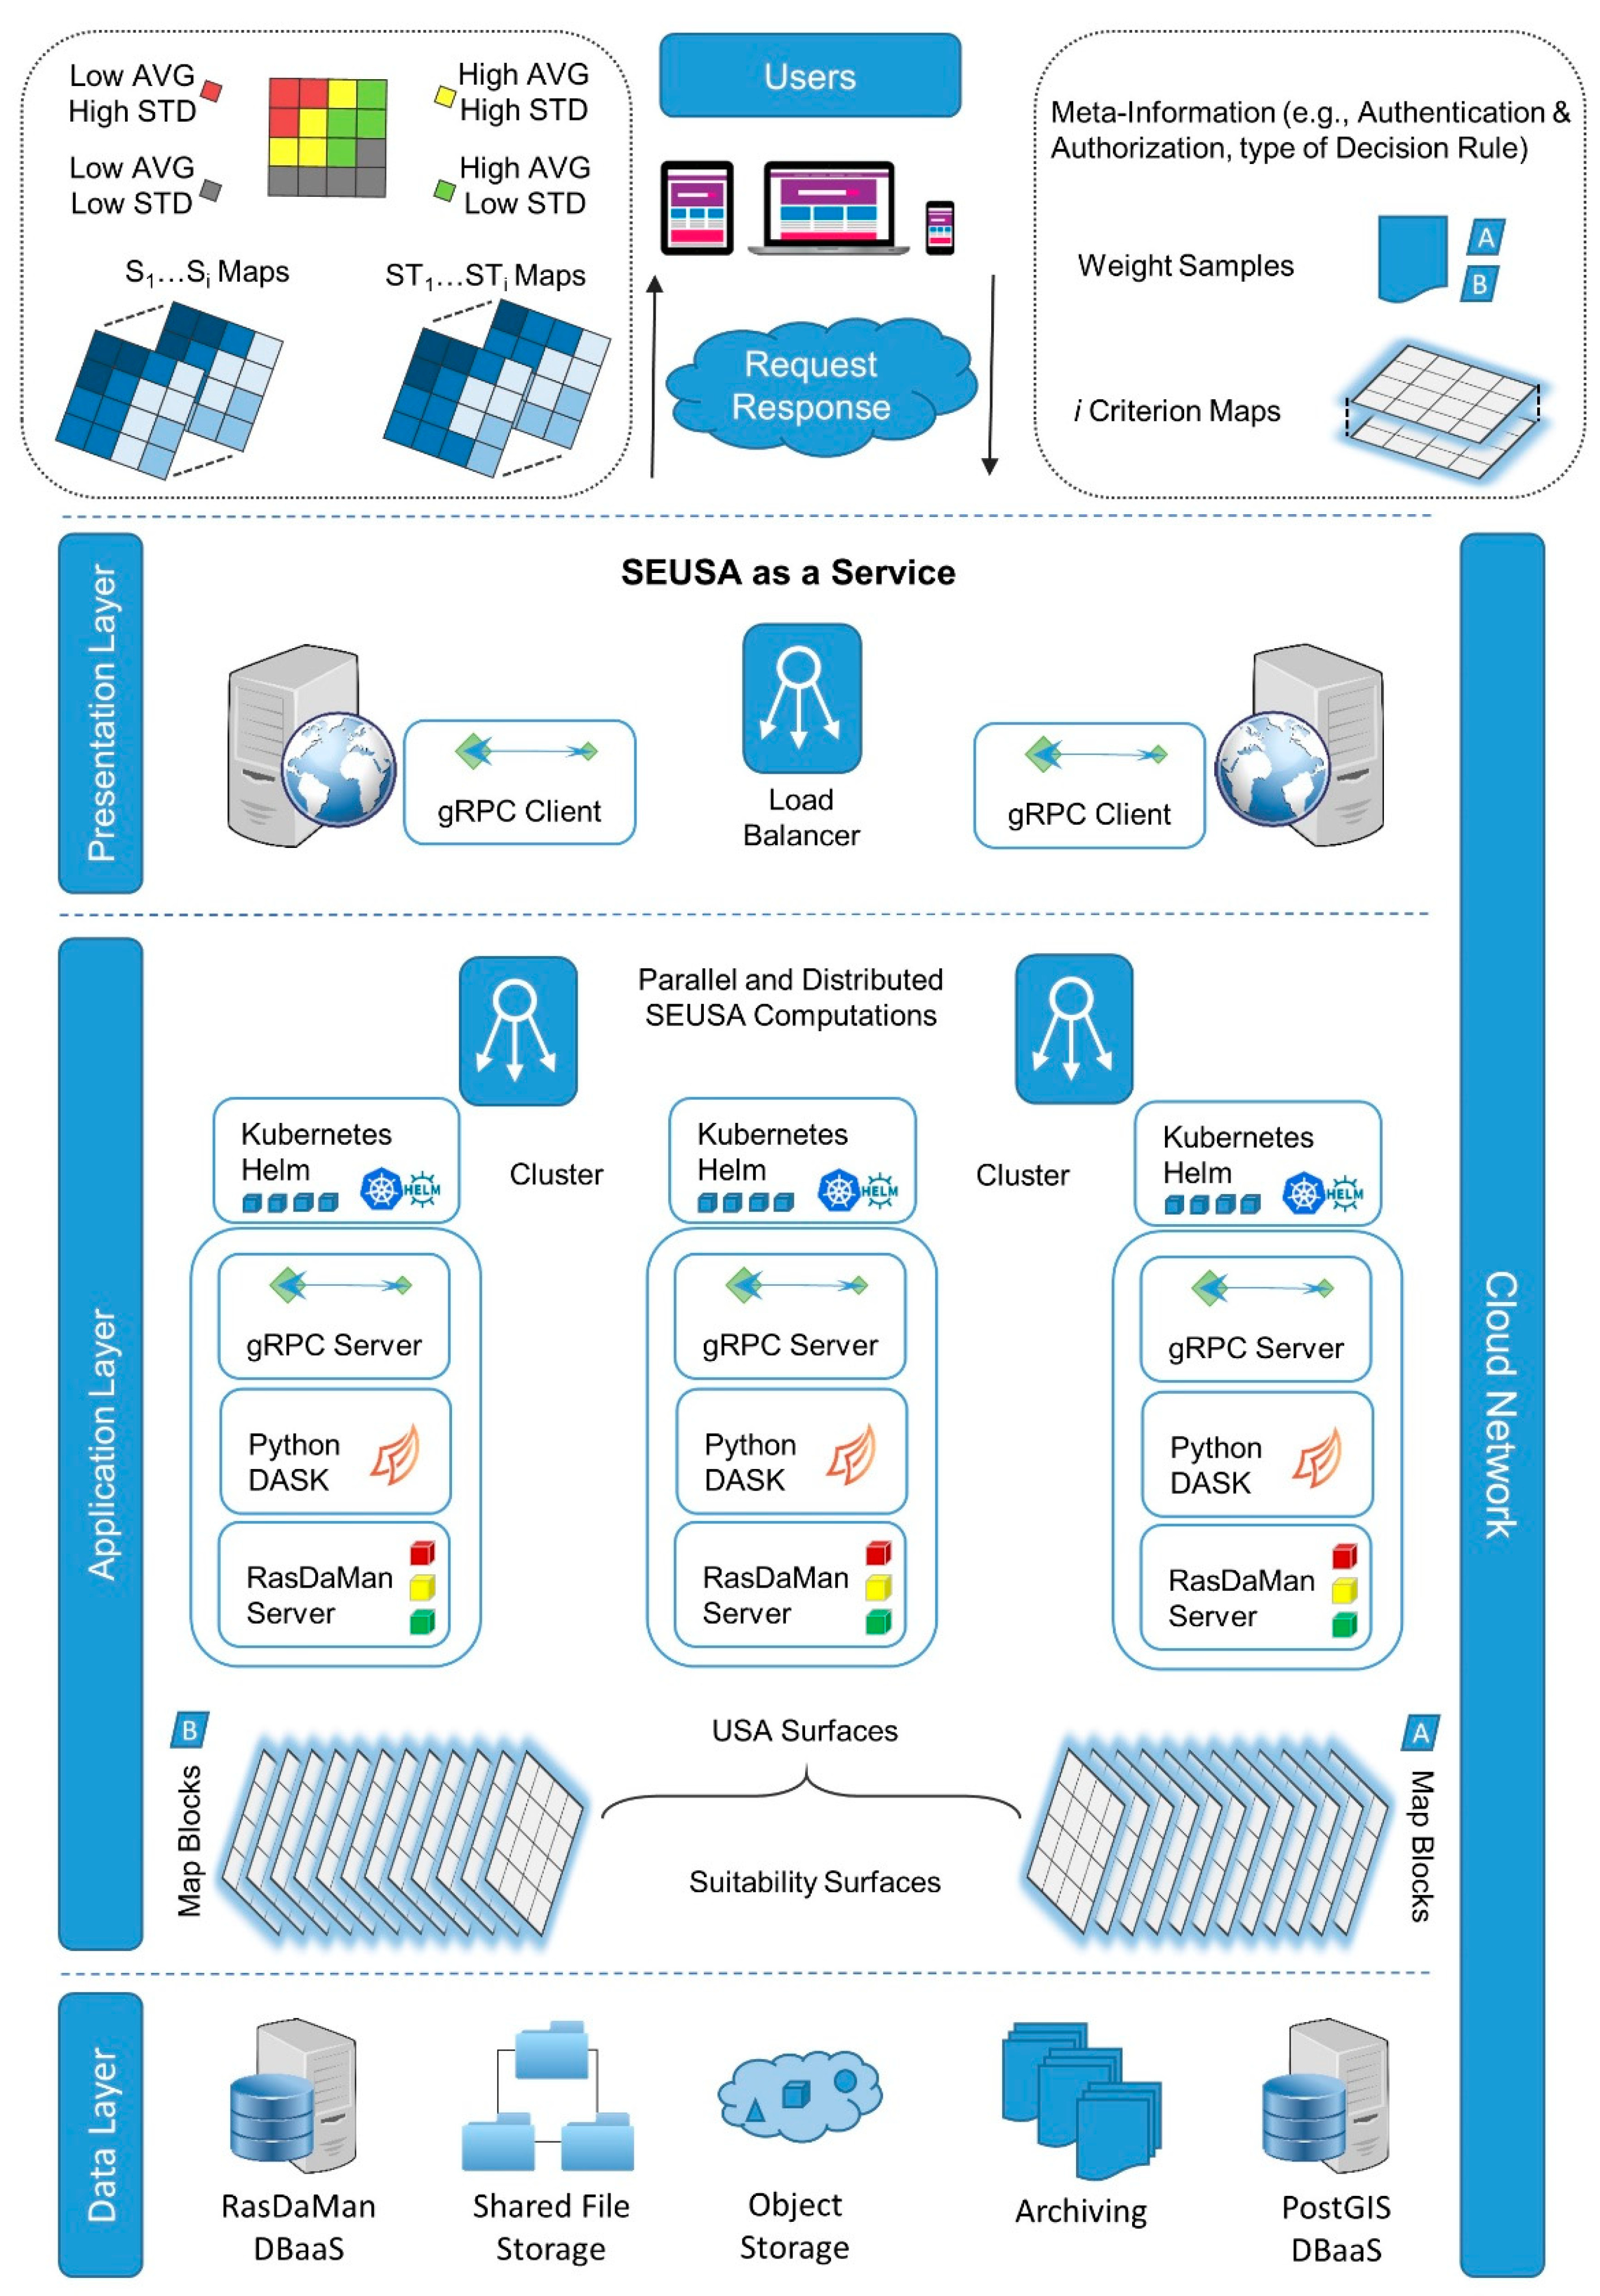
3.3. Architectural Design
4. Discussion
5. Conclusions
Author Contributions
Funding
Conflicts of Interest
References
- Keenan, P.B.; Jankowski, P. Spatial Decision Support Systems: Three decades on. Decis. Support Syst. 2019, 116, 64–76. [Google Scholar] [CrossRef]
- Simon, H.A. The New Science of Management Decision; Prentice Hall PTR: Upper Saddle River, NJ, USA, 1977. [Google Scholar]
- Malczewski, J.; Jankowski, P. Emerging trends and research frontiers in spatial multicriteria analysis. Int. J. Geogr. Inf. Sci. 2020, 1–26. [Google Scholar] [CrossRef]
- Malczewski, J.; Rinner, C. Multicriteria Decision Analysis in Geographic Information Science; Springer: New York, NY, USA, 2015. [Google Scholar]
- Thill, J.-C. Spatial Multicriteria Decision Making and Analysis, 1st ed.; Routledge: London, UK, 1999. [Google Scholar] [CrossRef]
- Saltelli, A.; Annoni, P. How to avoid a perfunctory sensitivity analysis. Environ. Model. Softw. 2010, 25, 1508–1517. [Google Scholar] [CrossRef]
- Ganji, A.; Maier, H.R.; Dandy, G.C. A modified Sobol′ sensitivity analysis method for decision-making in environmental problems. Environ. Model. Softw. 2016, 75, 15–27. [Google Scholar] [CrossRef]
- Ligmann-Zielinska, A.; Jankowski, P. Spatially-explicit integrated uncertainty and sensitivity analysis of criteria weights in multicriteria land suitability evaluation. Environ. Model. Softw. 2014, 57, 235–247. [Google Scholar] [CrossRef]
- Ligmann-Zielinska, A.; Jankowski, P. A Framework for Sensitivity Analysis in Spatial Multiple Criteria Evaluation. In GIScience 2008; Cova, T.J., Miller, H.J., Beard, K., Frank, A.U., Goodchild, M.F., Eds.; Springer: Berlin/Heidelberg, Germany, 2008; Volume LNCS 5266, pp. 217–233. [Google Scholar]
- Ferretti, F.; Saltelli, A.; Tarantola, S. Trends in sensitivity analysis practice in the last decade. Sci. Total Environ. 2016, 568, 666–670. [Google Scholar] [CrossRef] [PubMed]
- Şalap-Ayça, S.; Jankowski, P. Analysis of the influence of parameter and scale uncertainties on a local multi-criteria land use evaluation model. Stoch. Environ. Res. Risk Assess. 2018, 32, 2699–2719. [Google Scholar] [CrossRef]
- Lilburne, L.; Tarantola, S. Sensitivity analysis of spatial models. Int. J. Geogr. Inf. Sci. 2009, 23, 151–168. [Google Scholar] [CrossRef] [Green Version]
- Saltelli, A.; Ratto, M.; Tarantola, S.; Campolongo, F. Sensitivity analysis practices: Strategies for model-based inference. Reliab. Eng. Syst. Saf. 2006, 91, 1109–1125. [Google Scholar] [CrossRef]
- Homma, T.; Saltelli, A. Importance measures in global sensitivity analysis of nonlinear models. Reliab. Eng. Syst. Saf. 1996, 52, 1–17. [Google Scholar] [CrossRef]
- Şalap-Ayça, S.; Jankowski, P. Integrating local multi-criteria evaluation with spatially explicit uncertainty-sensitivity analysis. Spat. Cogn. Comput. 2016, 16, 106–132. [Google Scholar] [CrossRef]
- Feizizadeh, B.; Jankowski, P.; Blaschke, T. A GIS based spatially-explicit sensitivity and uncertainty analysis approach for multi-criteria decision analysis. Comput. Geosci. 2014, 64, 81–95. [Google Scholar] [CrossRef] [Green Version]
- Erlacher, C.; Şalap-Ayça, S.; Jankowski, P.; Anders, K.-H.; Paulus, G. A GPU-based Solution for Accelerating Spatially-Explicit Uncertainty- and Sensitivity Analysis in Multi-Criteria Decision Making. In Proceedings of the Spatial Accuracy, Montpellier, France, 5–8 July 2016; pp. 305–312. [Google Scholar]
- Erlacher, C.; Jankowski, P.; Blaschke, T.; Paulus, G.; Anders, K.-H. A GPU-based Parallelization Approach to conduct Spatially-Explicit Uncertainty and Sensitivity Analysis in the Application Domain of Landscape Assessment. Gi_Forum J. 2017, 2017, 44–58. [Google Scholar] [CrossRef] [Green Version]
- Erlacher, C.; Desch, A.; Anders, K.-H.; Jankowski, P.; Paulus, G. Parallel and Distributed Computing for large raster-based Spatial Multicriteria Decision Analysis Problems: A Computational Performance Comparison. GI_Forum J. 2019, 2019, 69–86. [Google Scholar] [CrossRef]
- Krämer, M. GeoRocket: A scalable and cloud-based data store for big geospatial files. SoftwareX 2020, 11, 100409. [Google Scholar] [CrossRef]
- Soille, P.; Burger, A.; De Marchi, D.; Kempeneers, P.; Rodriguez, D.; Syrris, V.; Vasilev, V. A versatile data-intensive computing platform for information retrieval from big geospatial data. Future Gener. Comput. Syst. 2018, 81, 30–40. [Google Scholar] [CrossRef]
- Yang, C.; Yu, M.; Hu, F.; Jiang, Y.; Li, Y. Utilizing Cloud Computing to address big geospatial data challenges. Comput. Environ. Urban Syst. 2017, 61, 120–128. [Google Scholar] [CrossRef] [Green Version]
- Yang, C.; Huang, Q.; Li, Z.; Liu, K.; Hu, F. Big Data and cloud computing: Innovation opportunities and challenges. Int. J. Digit. Earth 2017, 10, 13–53. [Google Scholar] [CrossRef] [Green Version]
- Hadjidoukas, P.E.; Bartezzaghi, A.; Scheidegger, F.; Istrate, R.; Bekas, C.; Malossi, A.C.I. torcpy: Supporting task parallelism in Python. SoftwareX 2020, 12, 100517. [Google Scholar] [CrossRef]
- Matthew, R. Dask: Parallel Computation with Blocked algorithms and Task Scheduling. In Proceedings of the 14th Python in Science Conference (SciPy 2015), Austin, TX, USA, 6–12 July 2015; pp. 126–132. [Google Scholar]
- Daniel, J.C. Data Science with Python and Dask; Manning Publications Co.: Shelter Island, NY, USA, 2019. [Google Scholar]
- Sobol, I.M. Sensitivity Estimates for Nonlinear Mathematical Models. Math. Model. Comput. Exp. 1993, 1, 407–414. [Google Scholar]
- Schmidt, D.C.; Buschmann, F. Patterns, frameworks, and middleware: Their synergistic relationships. In Proceedings of the 25th International Conference on Software Engineering, Portland, OR, USA, 3–10 May 2003; pp. 694–704. [Google Scholar]
- Schantz, R.E.; Schmidt, D.C. Research Advances in Middleware for Distributed Systems: State of the Art. In Proceedings of the Communication Systems: The State of the Art IFIP 17th World Computer Congress—TC6 Stream on Communication Systems, Montréal, QC, Canada, 25–30 August 2002; Chapin, L., Ed.; Springer: Boston, MA, USA, 2002; pp. 1–36. [Google Scholar]
- Blyth, D.; Alcaraz, J.; Binet, S.; Chekanov, S.V. ProIO: An event-based I/O stream format for protobuf messages. Comput. Phys. Commun. 2019, 241, 98–112. [Google Scholar] [CrossRef] [Green Version]
- Fürhoff, L. Rethinking the Usage and Experience of Clustering in Web Mapping; Springer: Cham, Switzerland, 2020; pp. 3–22. [Google Scholar]
- Hang, L.; Ullah, I.; Kim, D.-H. A secure fish farm platform based on blockchain for agriculture data integrity. Comput. Electron. Agric. 2020, 170, 105251. [Google Scholar] [CrossRef]
- Wang, L.; von Laszewski, G.; Younge, A.; He, X.; Kunze, M.; Tao, J.; Fu, C. Cloud Computing: A Perspective Study. New Gener. Comput. 2010, 28, 137–146. [Google Scholar] [CrossRef] [Green Version]
- Mell, P.; Grance, T. The NIST definition of cloud computing. Recomm. Natl. Inst. Stand. Technol. 2011. [Google Scholar] [CrossRef]
- Vaquero, L.M.; Rodero-Merino, L.; Caceres, J.; Lindner, M. A break in the clouds: Towards a cloud definition. SIGCOMM Comput. Commun. Rev. 2009, 39, 50–55. [Google Scholar] [CrossRef]
- Odun-Ayo, I.; Ananya, M.; Agono, F.; Goddy-Worlu, R. Cloud Computing Architecture: A Critical Analysis. In Proceedings of the 2018 18th International Conference on Computational Science and Applications (ICCSA), Melbourne, VIC, Australia, 2–5 July 2018; pp. 1–7. [Google Scholar]
- Bokhari, M.U.; Shallal, Q.M.; Tamandani, Y.K. Cloud computing service models: A comparative study. In Proceedings of the 2016 3rd International Conference on Computing for Sustainable Global Development (INDIACom), New Delhi, India, 16–18 March 2016; pp. 890–895. [Google Scholar]
- Yang, C.; Goodchild, M.; Huang, Q.; Nebert, D.; Raskin, R.; Xu, Y.; Bambacus, M.; Fay, D. Spatial cloud computing: How can the geospatial sciences use and help shape cloud computing? Int. J. Digit. Earth 2011, 4, 305–329. [Google Scholar] [CrossRef]
- Ujjwal, K.C.; Garg, S.; Hilton, J.; Aryal, J.; Forbes-Smith, N. Cloud Computing in natural hazard modeling systems: Current research trends and future directions. Int. J. Disaster Risk Reduct. 2019, 38, 101188. [Google Scholar] [CrossRef]
- Song, W.W.; Jin, B.X.; Li, S.H.; Wei, X.Y.; Li, D.; Hu, F. Building Spatiotemporal Cloud Platform for Supporting GIS Application. ISPRS Ann. Photogramm. Remote Sens. Spat. Inf. Sci. 2015, II-4/W2, 55–62. [Google Scholar] [CrossRef] [Green Version]
- Agrawal, S.; Gupta, R.D. Web GIS and its architecture: A review. Arab. J. Geosci. 2017, 10, 518–530. [Google Scholar] [CrossRef]
- Yao, X.; Li, G.; Xia, J.; Ben, J.; Cao, Q.; Zhao, L.; Ma, Y.; Zhang, L.; Zhu, D. Enabling the Big Earth Observation Data via Cloud Computing and DGGS: Opportunities and Challenges. Remote Sens. 2020, 12, 62. [Google Scholar] [CrossRef] [Green Version]
- Liu, Y.; Dai, H.-N.; Wang, Q.; Shukla, M.K.; Imran, M. Unmanned aerial vehicle for internet of everything: Opportunities and challenges. Comput. Commun. 2020, 155, 66–83. [Google Scholar] [CrossRef] [Green Version]
- Cahalane, C.; McCarthy, T.; McElhinney, C.P. MIMIC: Mobile mapping point density calculator. In Proceedings of the 3rd International Conference on Computing for Geospatial Research and Applications, Washington, DC, USA, 1–3 July 2012; pp. 15:11–15:19. [Google Scholar]
- Shang, S.; Shen, J.; Wen, J.-R.; Kalnis, P. Deep understanding of big geospatial data for self-driving cars. Neurocomputing 2020, 308–309. [Google Scholar] [CrossRef]
- Yi, J.; Du, Y.; Liang, F.; Tu, W.; Qi, W.; Ge, Y. Mapping human’s digital footprints on the Tibetan Plateau from multi-source geospatial big data. Sci. Total Environ. 2020, 711, 134540. [Google Scholar] [CrossRef] [PubMed]
- Hu, F.; Li, Z.; Yang, C.; Jiang, Y. A graph-based approach to detecting tourist movement patterns using social media data. Cartogr. Geogr. Inf. Sci. 2019, 46, 368–382. [Google Scholar] [CrossRef]
- Gonzalez, H.; Halevy, A.; Jensen, C.S.; Langen, A.; Madhavan, J.; Shapley, R.; Shen, W. Google fusion tables: Data management, integration and collaboration in the cloud. In Proceedings of the 1st ACM symposium on Cloud computing, Indianapolis, IN, USA, 10–11 June 2010; pp. 175–180. [Google Scholar]
- Yang, C.; Xu, Y.; Nebert, D. Redefining the possibility of digital Earth and geosciences with spatial cloud computing. Int. J. Digit. Earth 2013, 6, 297–312. [Google Scholar] [CrossRef]
- Yang, Y.; Long, X.; Jiang, B. K-Means Method for Grouping in Hybrid MapReduce Cluster. J. Comput. 2013, 8, 2648–2655. [Google Scholar] [CrossRef]
- Li, W.; Song, M.; Zhou, B.; Cao, K.; Gao, S. Performance improvement techniques for geospatial web services in a cyberinfrastructure environment—A case study with a disaster management portal. Comput. Environ. Urban Syst. 2015, 54, 314–325. [Google Scholar] [CrossRef] [Green Version]
- Li, Z.; Gui, Z.; Hofer, B.; Li, Y.; Scheider, S.; Shekhar, S. Geospatial Information Processing Technologies. In Manual of Digital Earth; Guo, H., Goodchild, M.F., Annoni, A., Eds.; Springer: Singapore, 2020; pp. 191–227. [Google Scholar] [CrossRef] [Green Version]
- Krämer, M.; Senner, I. A modular software architecture for processing of big geospatial data in the cloud. Comput. Graph. 2015, 49, 69–81. [Google Scholar] [CrossRef]
- Tan, X.; Di, L.; Deng, M.; Huang, F.; Ye, X.; Sha, Z.; Sun, Z.; Gong, W.; Shao, Y.; Huang, C. Agent-as-a-service-based geospatial service aggregation in the cloud: A case study of flood response. Environ. Model. Softw. 2016, 84, 210–225. [Google Scholar] [CrossRef] [Green Version]
- Li, Z.; Yang, C.; Huang, Q.; Liu, K.; Sun, M.; Xia, J. Building Model as a Service to support geosciences. Comput. Environ. Urban Syst. 2017, 61, 141–152. [Google Scholar] [CrossRef]
- Bordel, B.; Alcarria, R.; Hernández, M.; Robles, T. People-as-a-Service Dilemma: Humanizing Computing Solutions in High-Efficiency Applications. Proceedings 2019, 31, 39. [Google Scholar] [CrossRef] [Green Version]
- Li, Y.; Yu, M.; Xu, M.; Yang, J.; Sha, D.; Liu, Q.; Yang, C. Big Data and Cloud Computing. In Manual of Digital Earth; Guo, H., Goodchild, M.F., Annoni, A., Eds.; Springer: Singapore, 2020; pp. 325–355. [Google Scholar] [CrossRef] [Green Version]
- Merkert, R.; Bushell, J.; Beck, M.J. Collaboration as a service (CaaS) to fully integrate public transportation—Lessons from long distance travel to reimagine mobility as a service. Transp. Res. Part A Policy Pract. 2020, 131, 267–282. [Google Scholar] [CrossRef]
- Malczewski, J. Local Weighted Linear Combination. Trans. GIS 2011, 15, 439–455. [Google Scholar] [CrossRef]
- Hollaway, M.J.; Dean, G.; Blair, G.S.; Brown, M.; Henrys, P.A.; Watkins, J. Tackling the Challenges of 21st-Century Open Science and Beyond: A Data Science Lab Approach. Patterns 2020, 1, 100103. [Google Scholar] [CrossRef]
- Huang, W.; Zhang, W.; Zhang, D.; Meng, L. Elastic Spatial Query Processing in OpenStack Cloud Computing Environment for Time-Constraint Data Analysis. ISPRS Int. J. Geo-Inf. 2017, 6, 84. [Google Scholar] [CrossRef] [Green Version]
- Iosifescu-Enescu, I.; Matthys, C.; Gkonos, C.; Iosifescu-Enescu, C.M.; Hurni, L. Cloud-Based Architectures for Auto-Scalable Web Geoportals towards the Cloudification of the GeoVITe Swiss Academic Geoportal. Isprs Int. J. Geo-Inf. 2017, 6, 192. [Google Scholar] [CrossRef] [Green Version]
- Gomes, V.C.F.; Queiroz, G.R.; Ferreira, K.R. An Overview of Platforms for Big Earth Observation Data Management and Analysis. Remote Sens. 2020, 12, 1253. [Google Scholar] [CrossRef] [Green Version]
- Baumann, P. Array Databases. In Encyclopedia of Database Systems; Liu, L., Özsu, M.T., Eds.; Springer: New York, NY, USA, 2018; pp. 165–177. [Google Scholar]
- Baumann, P.; Rossi, A.P.; Bell, B.; Clements, O.; Evans, B.; Hoenig, H.; Hogan, P.; Kakaletris, G.; Koltsida, P.; Mantovani, S.; et al. Fostering Cross-Disciplinary Earth Science Through Datacube Analytics. In Earth Observation Open Science and Innovation; Mathieu, P.-P., Aubrecht, C., Eds.; Springer International Publishing: Cham, Switzerland, 2018; pp. 91–119. [Google Scholar]
- Reiner, B.; Hahn, K.; Höfling, G.; Baumann, P. Hierarchical Storage Support and Management for Large-Scale Multidimensional Array Database Management Systems; Springer: Berlin/Heidelberg, Germany, 2002; pp. 689–700. [Google Scholar]
- Hein, N.; Blankenbach, J. Vergleich von PostGIS und Rasdaman als Geodatenbanken für großvolumige Bilddatenbestände eines mobilen Mappingsystems. AGIT J. Angew. Geoinform. 2017, 3, 2–12. [Google Scholar] [CrossRef]
- Abily, M.; Bertrand, N.; Delestre, O.; Gourbesville, P.; Duluc, C.-M. Spatial Global Sensitivity Analysis of High Resolution classified topographic data use in 2D urban flood modelling. Environ. Model. Softw. 2016, 77, 183–195. [Google Scholar] [CrossRef] [Green Version]
- Perrin, T.V.E.; Roustant, O.; Rohmer, J.; Alata, O.; Naulin, J.P.; Idier, D.; Pedreros, R.; Moncoulon, D.; Tinard, P. Functional principal component analysis for global sensitivity analysis of model with spatial output. Reliab. Eng. Syst. Saf. 2021, 211, 107522. [Google Scholar] [CrossRef]
- Hu, X.; Ma, C.; Huang, P.; Guo, X. Ecological vulnerability assessment based on AHP-PSR method and analysis of its single parameter sensitivity and spatial autocorrelation for ecological protection—A case of Weifang City, China. Ecol. Indic. 2021, 125, 107464. [Google Scholar] [CrossRef]
- Koo, H.; Iwanaga, T.; Croke, B.F.W.; Jakeman, A.J.; Yang, J.; Wang, H.-H.; Sun, X.; Lü, G.; Li, X.; Yue, T.; et al. Position paper: Sensitivity analysis of spatially distributed environmental models- a pragmatic framework for the exploration of uncertainty sources. Environ. Model. Softw. 2020, 134, 104857. [Google Scholar] [CrossRef]
- Ligmann-Zielinska, A. ‘Can You Fix It?’ Using Variance-Based Sensitivity Analysis to Reduce the Input Space of an Agent-Based Model of Land Use Change. In GeoComputational Analysis and Modeling of Regional Systems; Thill, J.-C., Dragicevic, S., Eds.; Springer International Publishing: Cham, Switzerland, 2018; pp. 77–99. [Google Scholar] [CrossRef]
- Kang, J.-Y.; Aldstadt, J. Using multiple scale space-time patterns in variance-based global sensitivity analysis for spatially explicit agent-based models. Comput. Environ. Urban Syst. 2019, 75, 170–183. [Google Scholar] [CrossRef] [PubMed]
- Tarantola, S.; Becker, W. SIMLAB Software for Uncertainty and Sensitivity Analysis. In Handbook of Uncertainty Quantification; Ghanem, R., Higdon, D., Owhadi, H., Eds.; Springer International Publishing: Cham, Switzerland, 2017; pp. 1979–1999. [Google Scholar] [CrossRef]
- Herman, J.; Usher, W. SALib: An open-source Python library for Sensitivity Analysis. J. Open Source Softw. 2017, 2, 97. [Google Scholar] [CrossRef]
- Iooss, B.; Veiga, S.D.; Janon, A.; Pujol, G. Sensitivity: Global Sensitivity Analysis of Model Outputs, R (≥3.0.0) Package Version 1.25.0. Available online: https://cran.r-project.org/web/packages/sensitivity/index.html (accessed on 30 March 2021).
- Kc, U.; Garg, S.; Hilton, J.; Aryal, J. A cloud-based framework for sensitivity analysis of natural hazard models. Environ. Model. Softw. 2020, 134, 104800. [Google Scholar] [CrossRef]
- Erlacher, C.; Jankowski, P.; Şalap-Ayça, S.; Anders, K.-H.; Paulus, G. Development of a High Performance Capabilities for Supporting Spatially-Explicit Uncertainty- and Sensitivity Analysis in Multi-Criteria Decision Making. In Proceedings of the Eighth International Conference on Sensitivity Analysis of Model Output, Le Tampon (Réunion), France, 30 November–3 December 2016. [Google Scholar]
- Jankowski, P.; Najwer, A.; Zwoliński, Z.; Niesterowicz, J. Geodiversity Assessment with Crowdsourced Data and Spatial Multicriteria Analysis. ISPRS Int. J. Geo-Inf. 2020, 9, 716. [Google Scholar] [CrossRef]
- Şalap-Ayça, S.; Jankowski, P.; Clarke, K.C.; Kyriakidis, P.C.; Nara, A. A meta-modeling approach for spatio-temporal uncertainty and sensitivity analysis: An application for a cellular automata-based Urban growth and land-use change model. Int. J. Geogr. Inf. Sci. 2018, 32, 637–662. [Google Scholar] [CrossRef]


| Priority | SEUSA to Cloud Requirements |
|---|---|
| (1) General Aspects | |
| High | All provided services should automatically scale up or scale down according to the given workloads. |
| High | Interfaces between the presentation, application, and data layer for
|
| Moderate | Different aspects concerning the deployment of the cloud service models, such as private, public community, or hybrid cloud, should be incorporated to cover various user communities’ needs. |
| Low | A virtual cloud network that provides a secure managed network for cloud services, where managed firewalls are deployed, and security assessment is conducted in advance, should be integrated. |
| (2) SEUSA as a Service | |
| High | The parallel and distributed SEUSA methods should be accessible utilizing a Web-GIS application to allow the user communities to store, query, analyze, and visualize the spatial datasets. |
| High | User communities of the SEUSA framework should have the opportunity to upload their use cases that incorporate spatial- and non-spatial datasets (raster or vector data, weight samples, the type of the decision rule) and retrieve results of SEUSA computations. |
| Low | The development of a decision wizard for the SEUSA framework should be designed as Workflow as a Service that facilitates the application’s usability. |
| (3) Parallel and Distributed Computing | |
| High | The parallel version of the SEUSA approach represents the most time- and memory-intensive part of the proposed implementation. This approach is based on Python–Dask, and therefore suitable cloud architectures have to be identified for the development. |
| Moderate | The integration of different standardization methods, such as S- and J-shaped functions, should be implemented for preparing the criterion maps, which allows for covering a large number of use cases and offers flexible expert specifications. |
| Moderate | Additional decision rules like Ordered Weighted Averaging (OWA) and Analytical Hierarchy Process (AHP) that can generate a suitability surface for each model run, extend the applicability for various application domains. |
| Low | The SAM files are currently used to create weight samples. Hence, the creation of the weight samples should be integrated directly into the application. Furthermore, the integration of additional weighting and sampling methods should be considered. |
| (4) Tiling Service | |
| High | Map caching for presenting the spatial information and tiling services for the parallel and distributed computing of SEUSA has to be investigated to increase the Web-GIS applications’ speed. |
| High | For the raster datasets, aligned tiling (chunking), where all chunks have the same size, and arbitrary tiling, or where tiles consist of sub-areas of different sizes, have to be supported. Significantly, local multi-criteria evaluation approaches require arbitrary tiling services to calculate criterion weights for local neighborhoods [11,15,59]. |
| (5) Cloud Storage | |
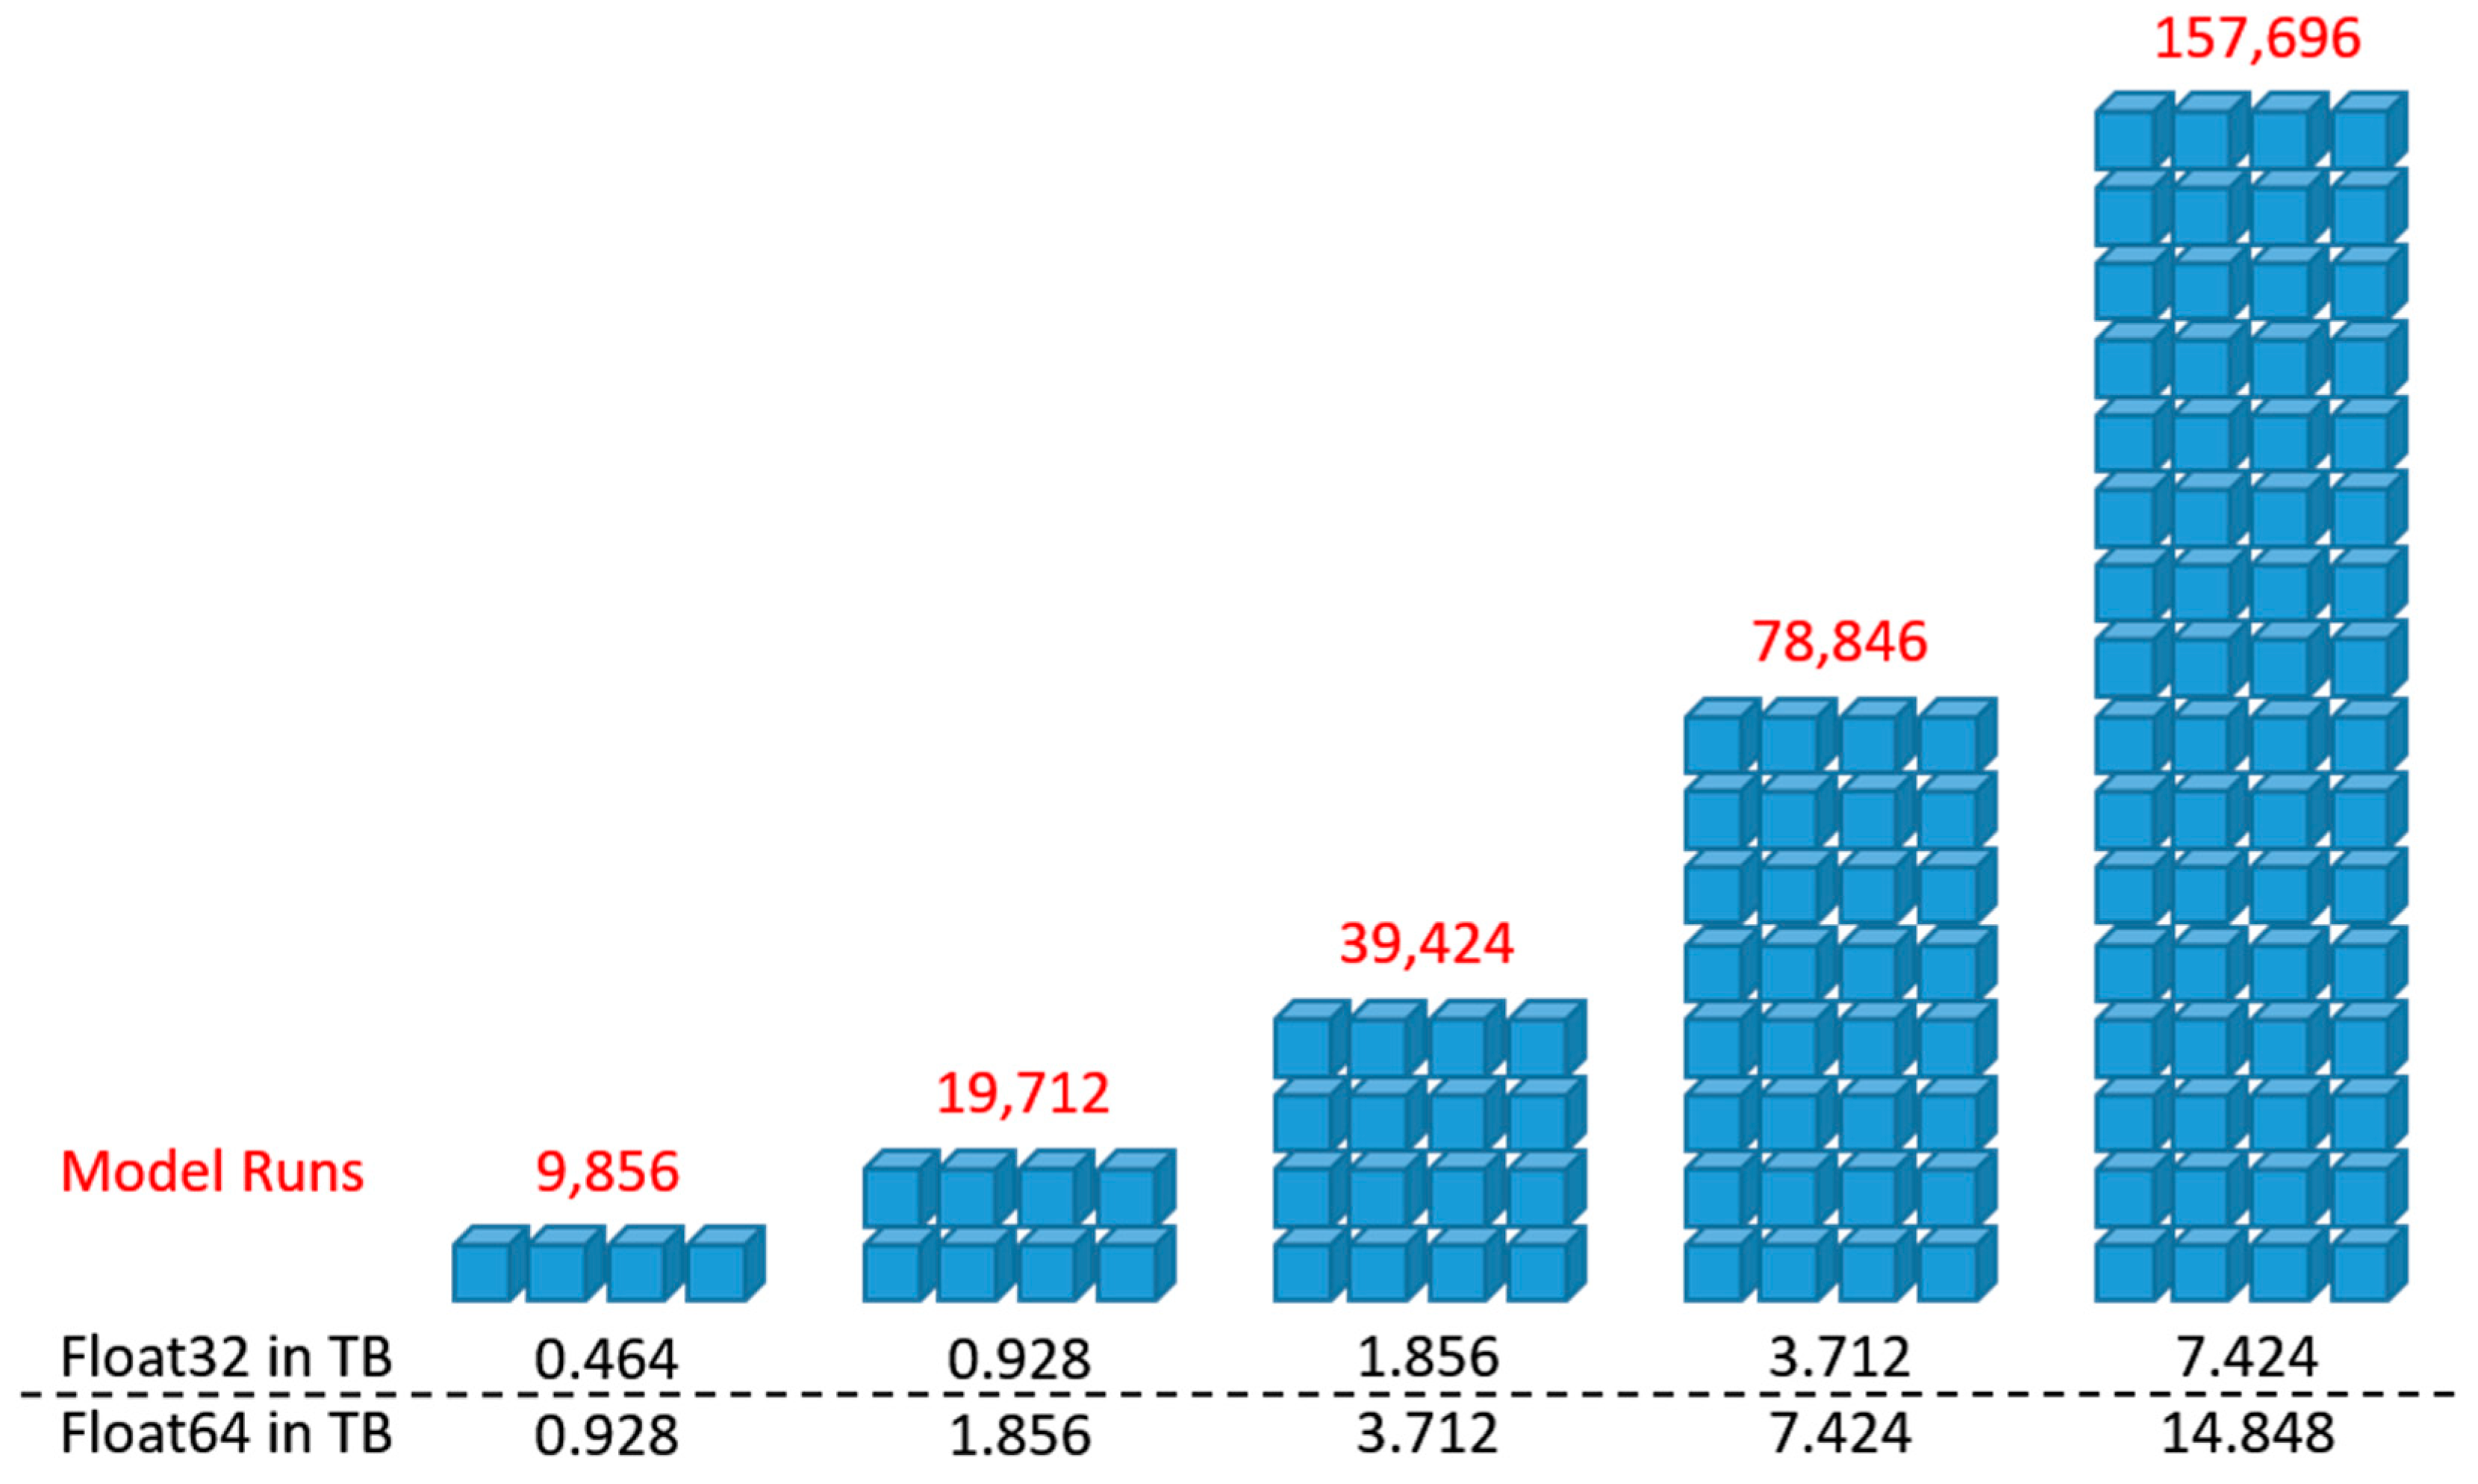
| High | Geospatial information storage requirements can range from a few gigabytes of data up to terabytes or petabytes of data, particularly for high-resolution multispectral or hyperspectral images. Therefore, scalable cloud-based storage services to host and share a large volume of spatial data have to be considered. |
| Moderate | Cloud archive storage should be incorporated for data that is not frequently accessed and can be used for data recovery. |
Publisher’s Note: MDPI stays neutral with regard to jurisdictional claims in published maps and institutional affiliations. |
© 2021 by the authors. Licensee MDPI, Basel, Switzerland. This article is an open access article distributed under the terms and conditions of the Creative Commons Attribution (CC BY) license (https://creativecommons.org/licenses/by/4.0/).
Share and Cite
Erlacher, C.; Anders, K.-H.; Jankowski, P.; Paulus, G.; Blaschke, T. A Framework for Cloud-Based Spatially-Explicit Uncertainty and Sensitivity Analysis in Spatial Multi-Criteria Models. ISPRS Int. J. Geo-Inf. 2021, 10, 244. https://0-doi-org.brum.beds.ac.uk/10.3390/ijgi10040244
Erlacher C, Anders K-H, Jankowski P, Paulus G, Blaschke T. A Framework for Cloud-Based Spatially-Explicit Uncertainty and Sensitivity Analysis in Spatial Multi-Criteria Models. ISPRS International Journal of Geo-Information. 2021; 10(4):244. https://0-doi-org.brum.beds.ac.uk/10.3390/ijgi10040244
Chicago/Turabian StyleErlacher, Christoph, Karl-Heinrich Anders, Piotr Jankowski, Gernot Paulus, and Thomas Blaschke. 2021. "A Framework for Cloud-Based Spatially-Explicit Uncertainty and Sensitivity Analysis in Spatial Multi-Criteria Models" ISPRS International Journal of Geo-Information 10, no. 4: 244. https://0-doi-org.brum.beds.ac.uk/10.3390/ijgi10040244