Article

Spatial Optimization of Mega-City Fire Stations Based on Multi-Source Geospatial Data: A Case Study in Beijing

1
Faculty of Geomatics, Lanzhou Jiaotong University, Lanzhou 730070, China
2
School of Resource and Environment Science, Wuhan University, Wuhan 430079, China
3
Institute of Geographic Sciences and Natural Resources Research, Chinese Academy of Sciences, Beijing 100101, China
4
Institute of Urban Environment, Chinese Academy of Sciences, Xiamen 361021, China
*
Author to whom correspondence should be addressed.
ISPRS Int. J. Geo-Inf. 2021, 10(5), 282; https://0-doi-org.brum.beds.ac.uk/10.3390/ijgi10050282
Submission received: 1 April 2021 / Revised: 19 April 2021 / Accepted: 26 April 2021 / Published: 29 April 2021
(This article belongs to the Special Issue Geovisualization and Social Media)

Abstract

:
The spatial distribution of fire stations is an important component of both urban development and urban safety. For expanding mega-cities, land-use and building function are subject to frequent changes, hence a complete picture of risk profiles is likely to be lacking. Challenges for prevention can be overwhelming for city managers and emergency responders. In this context, we use points of interest (POI) data and multi-time traffic situation (MTS) data to investigate the actual coverage of fire stations in central Beijing under different traffic situations. A method for identifying fire risks of mega cities and optimizing the spatial distribution of fire stations was proposed. First, fire risks associated with distinctive building and land-use functions and their spatial distribution were evaluated using POI data and kernel density analysis. Furthermore, based on the MTS data, a multi-scenario road network was constructed. The “location-allocation” (L-A) model and network analysis were used to map the spatial coverage of the fire stations in the study area, optimized by combining different targets (e.g., coverage of high fire risk areas, important fire risk types). Results show that the top 10% of Beijing’s fire risk areas are concentrated in “Sanlitun-Guomao”, “Ditan-Nanluogu-Wangfujing”, and “Shuangjing-Panjiayuan”, as well as at Beijing Railway Station. Under a quarterly average traffic situation, existing fire stations within the study area exhibit good overall POI coverage (96.51%) within a five-minute response time. However, the coverage in the northwest and southwest, etc. (e.g., Shijicheng and Minzhuang) remain insufficient. On weekdays and weekends, the coverage of fire stations in the morning and evening rush hours fluctuates. Considering the factors of high fire risk areas, major fire risk types, etc. the results of optimization show that 15 additional fire stations are needed to provide sufficient coverage. The methods and results of this research have positive significance for future urban safety planning of mega-cities.

1. Introduction

The rapid expansion of cities within China has led to a number of new challenges in terms of the supply and layout of urban public service facilities. In recent years, urbanization rates in many Chinese developed regions have started to decrease after several decades of rapid expansion, therefore more resources are now being directed to improve the quality of public services within cities [1]. Urban public safety, especially fire safety, is directly related to the quality of life and property security of all urban residents, and is thus one key consideration of quality urban development. City fires have occurred frequently in China over recent years, and notable examples include events in Binhai within Tianjin in 2015, and in Yubei within Chongqing in 2020. The tragic loss of people and property as a result of these events highlights the long-term, complex, and arduous task of urban firefighting. To mitigate such occurrences, research on the spatial layout of urban fire stations is crucial. Fire risks are more complicated and difficult to assess and prevent in mega cities, because of the rapid urban expansion and frequent changes of building functions or land-use. The complexities exhibited by mega cities also include in the excessive residential density (i.e., the dwelling narrowness phenomenon) that often lead to the emergence of places with “all-in-one” functions, such as production, operation, accommodation, and warehousing. These kinds of situations are especially prone to fire hazards. The high-rise and underground buildings that characterize mega cities [2] also make fire prevention and control more arduous. The complex distributional patterns seen in urban functional areas within mega cities also create differentiated fire risk situations; this means that industrial, commercial and residential areas, as well as hospitals and schools, often have different firefighting requirements, while the risks caused by the intertwined blending of different functional zones also need to be quantitatively analyzed. Besides, due to the larger scale of the city and the greater number of vehicles, the traffic situation in mega cities is more complicated, and traffic congestion will greatly affect the accessibility of fire stations. In these situations, traditional methods for determining station locations by simulating fire occurrences within blocks or on the basis of administrative divisional areas are unable to meet requirements. Therefore, there is an urgent need to broaden innovative research approaches to solve the problem of fire station site selection and planning within mega cities.
Research on fire station site selection and spatial optimization has a long history. In early work, Hogg [3] noted that the key to fire system analysis is to first determine the optimal number of stations and their most effective locations in order to reduce losses, while Helly [4] argued that the most important attribute of fire station location should be the minimum emergency response time. This factor was used as the foundation of a fire station site selection model [4] that was subsequently developed by Plane and Hendrick [5], who utilized response time as the coverage criterion to apply the location set covering problem (LSCP) theory to the issue of site selection. In later work, Reilly and Mirchandani [6] considered the dual criteria of maximum and fastest response to potential demand points as key to fire station site selection, building the use of the p-median problem into their analysis, while Habibi et al. [7], Erden et al. [8], and Pandav et al. [9] conducted site selection and optimization analyses in different regions and cities via the successive use of the analytic hierarchy process (AHP) and geographic information system (GIS). The maximal coverage location problem (MCLP) model has also been applied to fire station site selection by Murray [10,11] and Chevalier et al. [12]. Badri et al. [13] established a multi-objective mathematical programming approach that considers driving time and distance, as well as cost, policies, and other factors. Yang et al. [14] combined the use of fuzzy multi-objective programming with a genetic algorithm to determine fire station locations, while Schreuder [15], Kanoun [16], and Liu [17] evaluated sites across different areas. In a Chinese context, Chen et al. [18] achieved an overall layout optimization of multiple fire stations by incorporating the principle of minimum average firefighting distance and by abstracting administrative divisional areas into multiple “nodes”, while Yu et al. [19] utilized Voronoi diagrams and network analysis to progressively optimize the positions of urban fire stations. Zhang [20] presented an assessment study from the dual perspectives of city fire risk and urban firefighting power (fire station personnel and equipment configuration, fire station coverage).
Our review of previous research suggests that “location-allocation” (L-A) models (e.g., LSCP, MCLP, and p-median) and GIS technology have been widely applied to both fire station site selection and spatial optimization. However, existing methods remain problematic. First, due to the lack of detailed building information, existing methods often simulate fire incidents as incident occurring within simplified parcels or blocks, without differentiating heterogeneity of function among various buildings, nor inside building. Second, fire risks in mega cities vary according to their functional uses (e.g., residential, commercial, and industrial) and it is essential to consider the varying degrees of risk in fire station site selection. In addition, traffic congestion has rarely been considered in site selection and spatial optimization analysis, primarily due to the challenges of incorporating the spatial-temporal heterogeneity of road traffic situations in site selection and optimization and the non-availability of such datasets.
Recent advances in computer science and the development of the Internet have led to large volumes of emerging geospatial data [21,22,23,24,25,26], allowing new solutions to the aforementioned challenges to be addressed. Strategic sites and vulnerable locations are increasingly becoming available in the form of points of interest (POI) dataset, which contains geographical entities such as schools, factories, supermarkets, etc. in the form of spatial points with attributes. Such data are of great importance to city managers and emergency responders for their strategic and operational decision making, including, e.g., city planning and emergency rescue analyses [22,27]. POI data can also be used as a quantitative risk proxy for different functional spaces. Moreover, real-time traffic data accurate to road segments at different times of the day are generated continuously by Internet map service providers such as Google and AutoNavi, using Global Positioning System (GPS) coordinates of floating cars [28], mobile phone app and user volunteered geographic information (VGI) [29]. Such data also contain driving speed information that can be utilized in spatial analysis, including path planning and reachability calculation.
This study aims to address the limitations of the existing L-A model by incorporating two sets of information derived from emerging geospatial datasets, including: (i) fire risk levels derived from the POI data; and (ii) multi-time traffic situation (MTS) information accurate to road segments derived from AutoNavi. Section 2 details the case study and data availability, followed by methods, results, the discussion and conclusions.

2. Case Study and Data
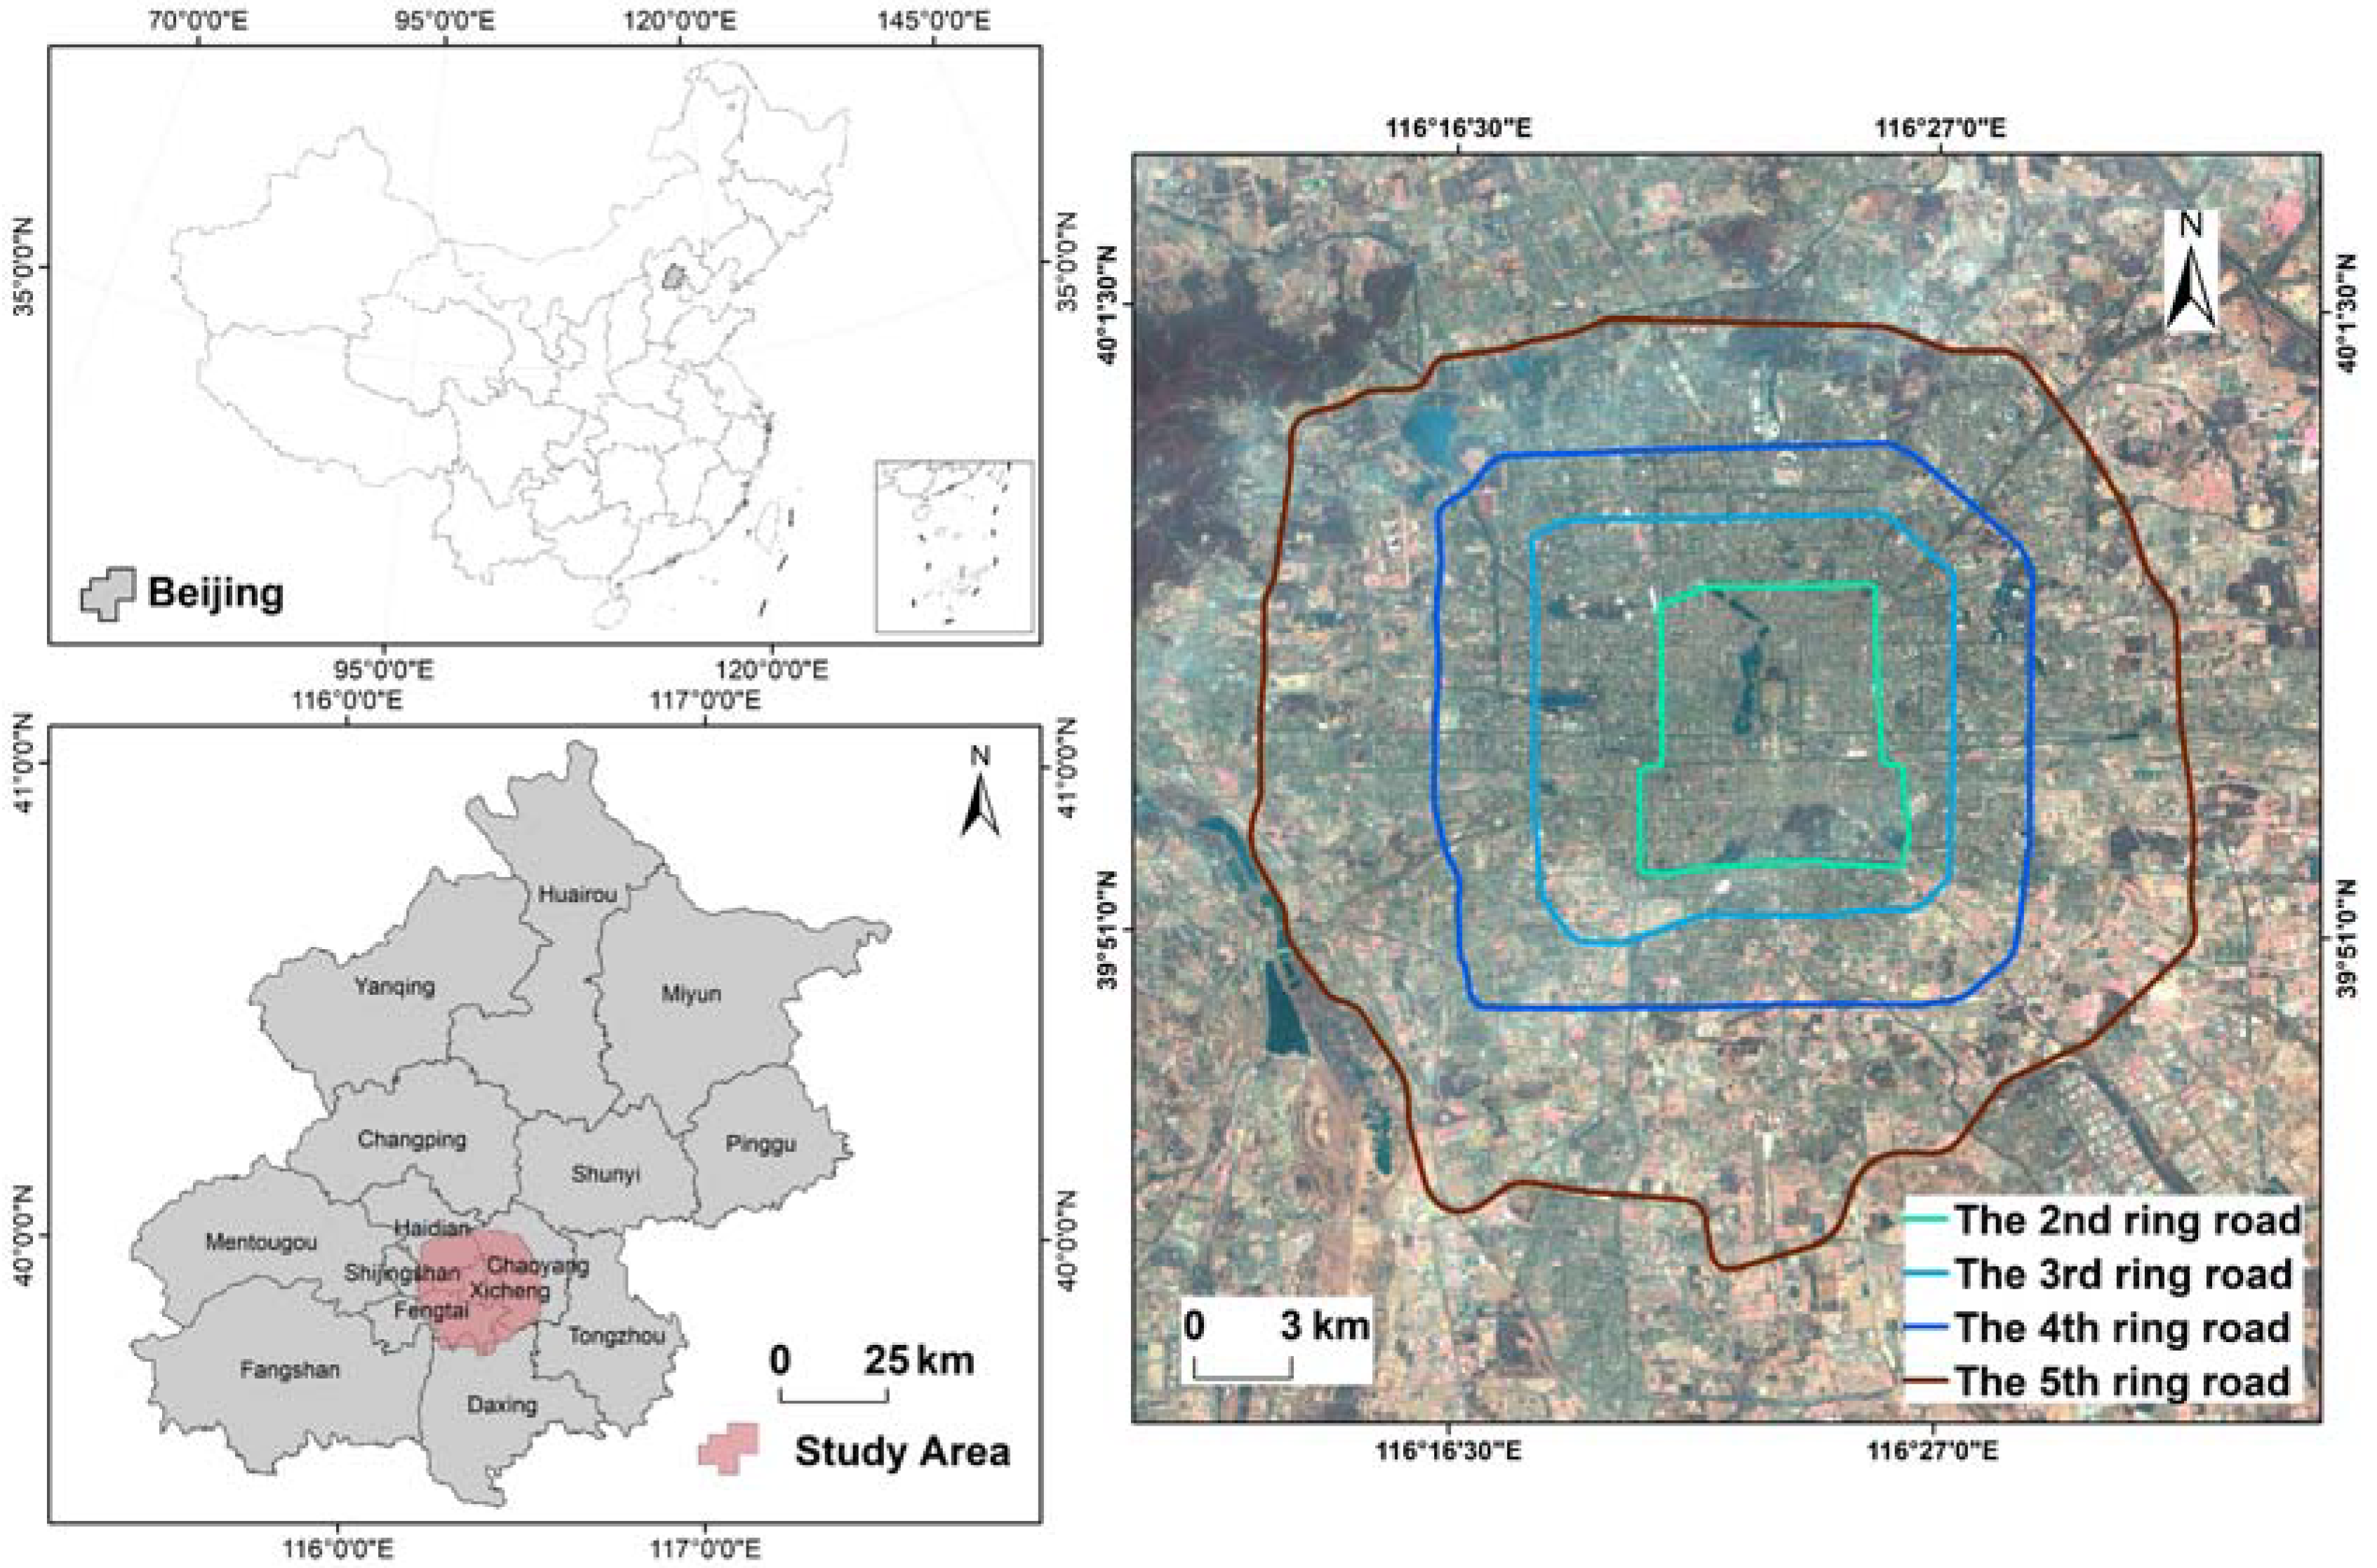
2.1. Area

The city of Beijing is the political and cultural center of China, with a total residential population of 21.5 million, of which 13.8 million are permanent residents (2018). As a typical global mega city which has undergone rapid development in recent decades, Beijing faces numerous urban problems, including large-scale traffic congestion, and lack of sufficient public services for a large proportion of the population. Beijing has a temperate monsoon climate, hot and rainy in summer and cold and dry in winter. The number of urban fire incidents has shown an increasing trend in the past five years. There were 4296 fires in Beijing during 2016, for example, leading to direct economic losses of 59 million yuan, according to the Beijing Regional Statistical Yearbook, 2017. Beijing has a large population and is the national capital, and it is therefore of great social significance to investigate the spatial optimization of fire stations within the city. Consider the availability of data, central Beijing (areas within the fifth ring road of Beijing, as shown in Figure 1) was selected as the study area for this research, as it includes all the functional core areas of the capital as well as most of the urban functional expansion areas, and encompasses an area of about 668.4 km2. The projected coordinate system selected for the study area is “WGS 1984 UTM Zone 50N”.

2.2. Data

The main dataset used in this research comprises information on MTS data, POI, fire station locations, population grids, road networks, and administrative divisions. POI and MTS data were downloaded from the AutoNavi open map platform [30] using python scripts. AutoNavi open map (AMAP) is one of the largest Internet LBS (location-based service) platforms in China, controlled by the Alibaba Group. POI were vector data of points, and included 14 major categories encompassing catering, shopping, life services, sports leisure, health care, accommodation, scenic spots, business and houses, government agencies and social organizations, science and education, culture, transportation facilities, finance and insurance, and company and public facilities. Subsequent to data cleaning, coordinate transformation, and sorting, the POI dataset contained 443,410 points. MTS data were line segments of vectors, including speed information of different road sections, and were generated from real-time traffic situation information collected at different times. The collection time points were 0, 6, 7, 9, 10, 12, 15, 17, 18, 19, 20, and 21 o’clock during 15–21 August (a continuous week) 2017. The final MTS data after data cleaning contained 634,157 road sections. It should be pointed out that the MTS data obtained on the Internet cannot cover low-level local roads. The further treatment process of this problem is described in Section 3.3. The fire station location data used in this study were obtained from multiple Chinese Internet map platforms for mutual verification to improve accuracy. Their original source included AMAP, Baidu Maps [31] and Tencent maps [32]. After quality control (e.g., removing duplicates and community fire room), 56 station locations were used in the analysis. The gridded population data utilized in this analysis were derived from Worldpop at a spatial resolution of 100 m [33]. Road network data, administrative boundary and statistical records (e.g., economic losses of fire) were derived from the Chinese national basic geographic information database, and Beijing statistical yearbook and statistical information website [34].

3. Methodology

3.1. Data Preprocessing

The large volume of multi-source data used in this study required preprocessing, performed in stages. Data were unified to encompass the same spatial reference frame; this enabled a spatial database to be built and multi-source data to be imported. We transformed all our data to the GCJ (Chinese Pinyin abbreviation of the National Bureau of Surveying and Mapping) coordinate system specified by the China National Surveying and Mapping Bureau; this system is based on the WGS84 coordinate arrangement, and so requires the incorporation of a certain offset. We then created a series of geographic file databases in the software ArcGIS, and sequentially imported multi-time traffic congestion, POI, fire station location, population grid, and road network data before using the boundary data of the study area to cookie-cut these datasets to the necessary sizes.

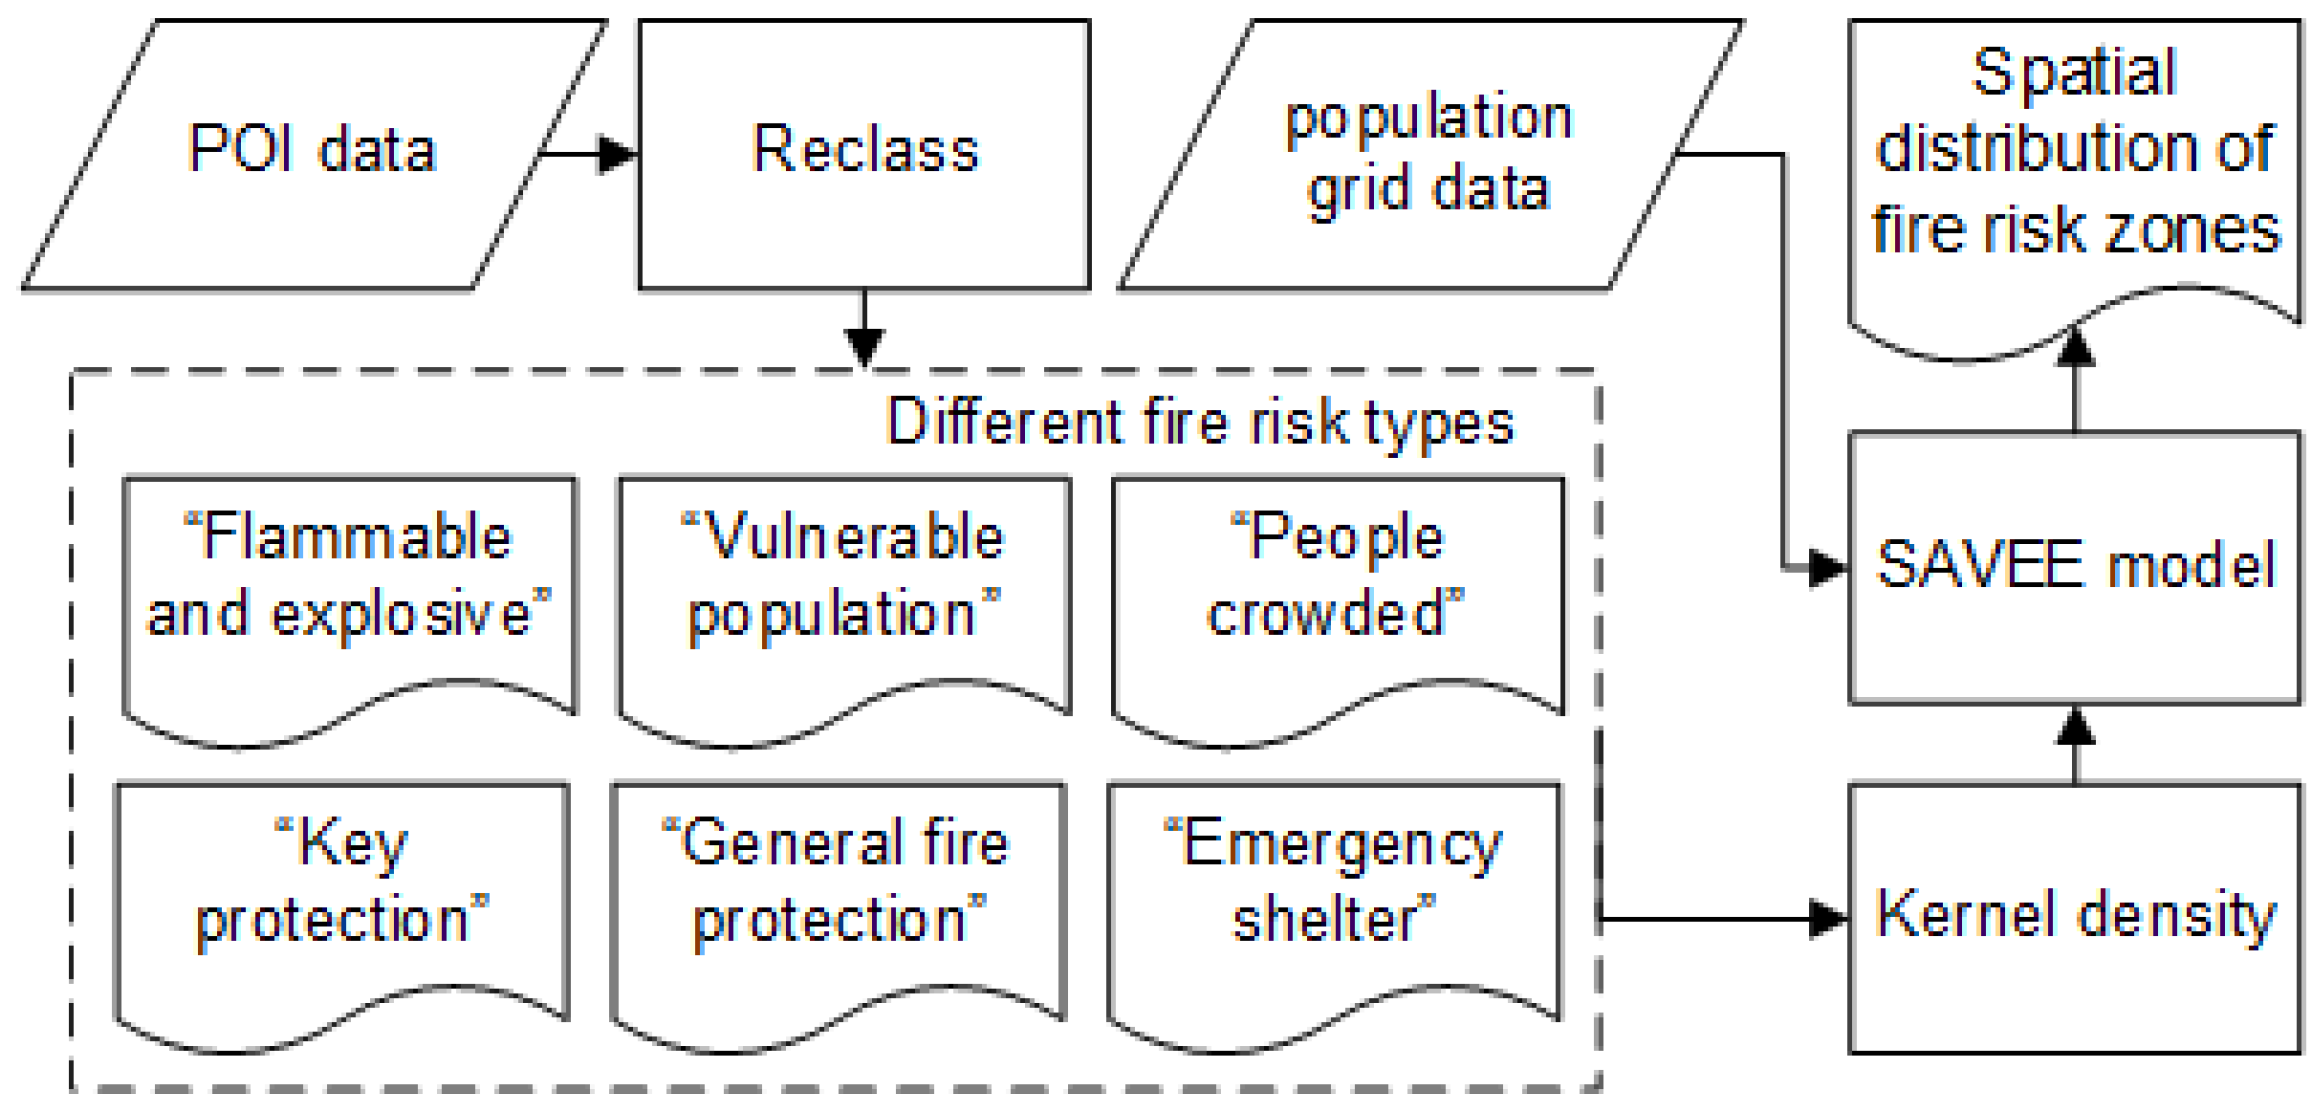
3.2. Identifying Fire Risk Zones

First, the potential fire risks of different places were classified based on their functional attributes. We used kernel density analysis to quantify the spatial distribution of different types of fire risks, and used the SAVEE (spatial appraisal and valuation of environment and ecosystems) model to integrate the overall fire risk. The flowchart is shown in Figure 2.
(1) Classify POIs by fire risks. The fire risk assessment method used for cities across China currently remains in the exploratory stage, as the basic data required are incomplete. Existing research to date has mainly considered the fire risks faced by target objects, as well as the vulnerability of protected objects, the severity of consequences, and the economic and social value of these entities [20,35]. Thus, according to the “Code of city fire protection planning” (2015), the “Beijing city key unit of fire safety standards”, and existing research, this article considers the functions of different types of places, as well as the characteristics of regular occupants. POIs were therefore divided into six categories (Table 1) on the basis of fire risk, hazard, and disaster resistance. In this context, our use of “flammable and explosive” refers to places such as gas stations and filling stations; fires at these locations often also cause secondary accidents, resulting in more dangerous consequences. Similarly, our use of “vulnerable population” refers to schools, hospitals, and other places where large numbers of vulnerable people are located. It is also the case that the physical characteristics of a crowd (as well as other features) can lead to greater personal injuries; thus, the term “people crowded” is used in reference to the large number of business centers and transportation hubs where people gather to form so-called “floating populations”; this characteristic means that once a fire occurs, stampedes and other casualties often ensue. Our use of the term “key protection” refers to sites that have high protection value and will lead to high property losses, such as government and historic buildings, while “general fire protection” refers to all areas that do not fall into these four specific categories, including residential buildings, office buildings, and all other sites. Our use of the term “emergency shelter” refers to refuges that can facilitate the evacuation of a crowd when a fire occurs and that, therefore, lead to greater resistance for fire.
(2) Quantify each fire risks by kernel density analysis. After classification, we then applied the software ArcGIS to perform a kernel density analysis for all kinds of fire risk and to illustrate the spatial distribution of fire risks across the city. Kernel density analysis is mainly utilized to calculate a magnitude per unit area based on point or polyline features and uses a function to fit a smoothly tapered surface to each. Thus, just points or polylines that fall within the neighborhood of analysis are considered when calculating kernel density; a zero value is assigned in cases where no points or polylines fall within the neighborhood of a particular cell. The kernel density default search radius (i.e., bandwidth) can, therefore, be calculated based on space configuration and the number of input points, which can themselves be used to correct potential spatial anomalies caused by a large search radius. The kernel density analysis in ArcGIS is mainly based on the quadratic kernel described by Silverman [36].
(3) Integrate the overall fire risk zone by the SAVEE model. After quantifying the fire risk in different places, the spatial distribution characteristics of people also need to be considered. Subsequently, the SAVEE model can be used to integrate and identify the overall urban fire risk distribution, and obtain a zoning map based on the level of fire risk. It is necessary to point out that the results of kernel density analysis and the population grid data should be transform to the same spatial resolution (cell size) before integration.
The SAVEE model is a method that was developed by the STARR Lab (Laboratory for Systems Technology Applications in Renewable Resources) at Texas A&M University-College Station to evaluate the value of environmental space. This model encapsulates the influence of various different natural factors and has been applied in the comprehensive evaluation of multi-angle variables in resource planning, forest management, and other fields [37,38]. The SAVEE model method algorithm includes normalization equations that express the nature and impact of a range of factors, including Equation (1) for positive elements where 0 ≤ V ≤ 1 and equation (2) for negative elements where −1 ≤ V ≤ 0. In both these expressions, V denotes the normalized value, x is an independent variable, A is the boundary value of x, and x ≤ |A|. Thus, VX indicates the presence of a positive correlation between independent variables and a given value, while V1/X denotes a negative correlation. Subsequent to the use of these normalized equations to calculate values for different factors, any two (or more) iterations are then added together via the means of additive Equation (3) until all factors are incorporated within the calculation. In Equation (3), Ia and Ib denotes the normalized value of factor a and factor b respectively, Iab denotes to the normalized value after superposition (factor a and b). The equations used for this analytical step are as follows:
V = { 1 [ e ( x + 1 ) | A | ] 5 , V X [ e ( x + 1 ) | A | ] 5 , V 1 X
V = { [ e ( x + 1 ) | A | ] 5 , V X [ e ( x + 1 ) | A | ] 5 1 , V 1 X
{ I ab = I a + I b I a I b ,   I a > 0 , I b > 0 I a b = I a + I b + I a I b ,   I a < 0 , I b < 0 I a b = ( I a + I b ) / ( 1 m i n [ | I a | , | I b | ] ) , r e s t
There are some details that need to be further explained when conduct the integration by SAVEE. First, it is necessary to consider the positive and negative correlations between the density of each fire risk type and the overall fire risk level to select different standardized equations from the SAVEE model. Specifically, the density of “flammable and explosive”, “vulnerable population”, “people crowded”, “key protection” and “General fire protection” are positively correlated with the overall fire risk, which means that the higher the density of these places, the higher the total fire risk; by contrast, the “Emergency shelter” places is negatively correlated with the overall fire risk. The higher the density of the place, the lower the total fire risk. Second, in practice, the weight of each fire risk type on the total fire risk is different. Therefore, we modified the normalization equation employed in this study by adding a weighting coefficient, K (0 < K < 1).

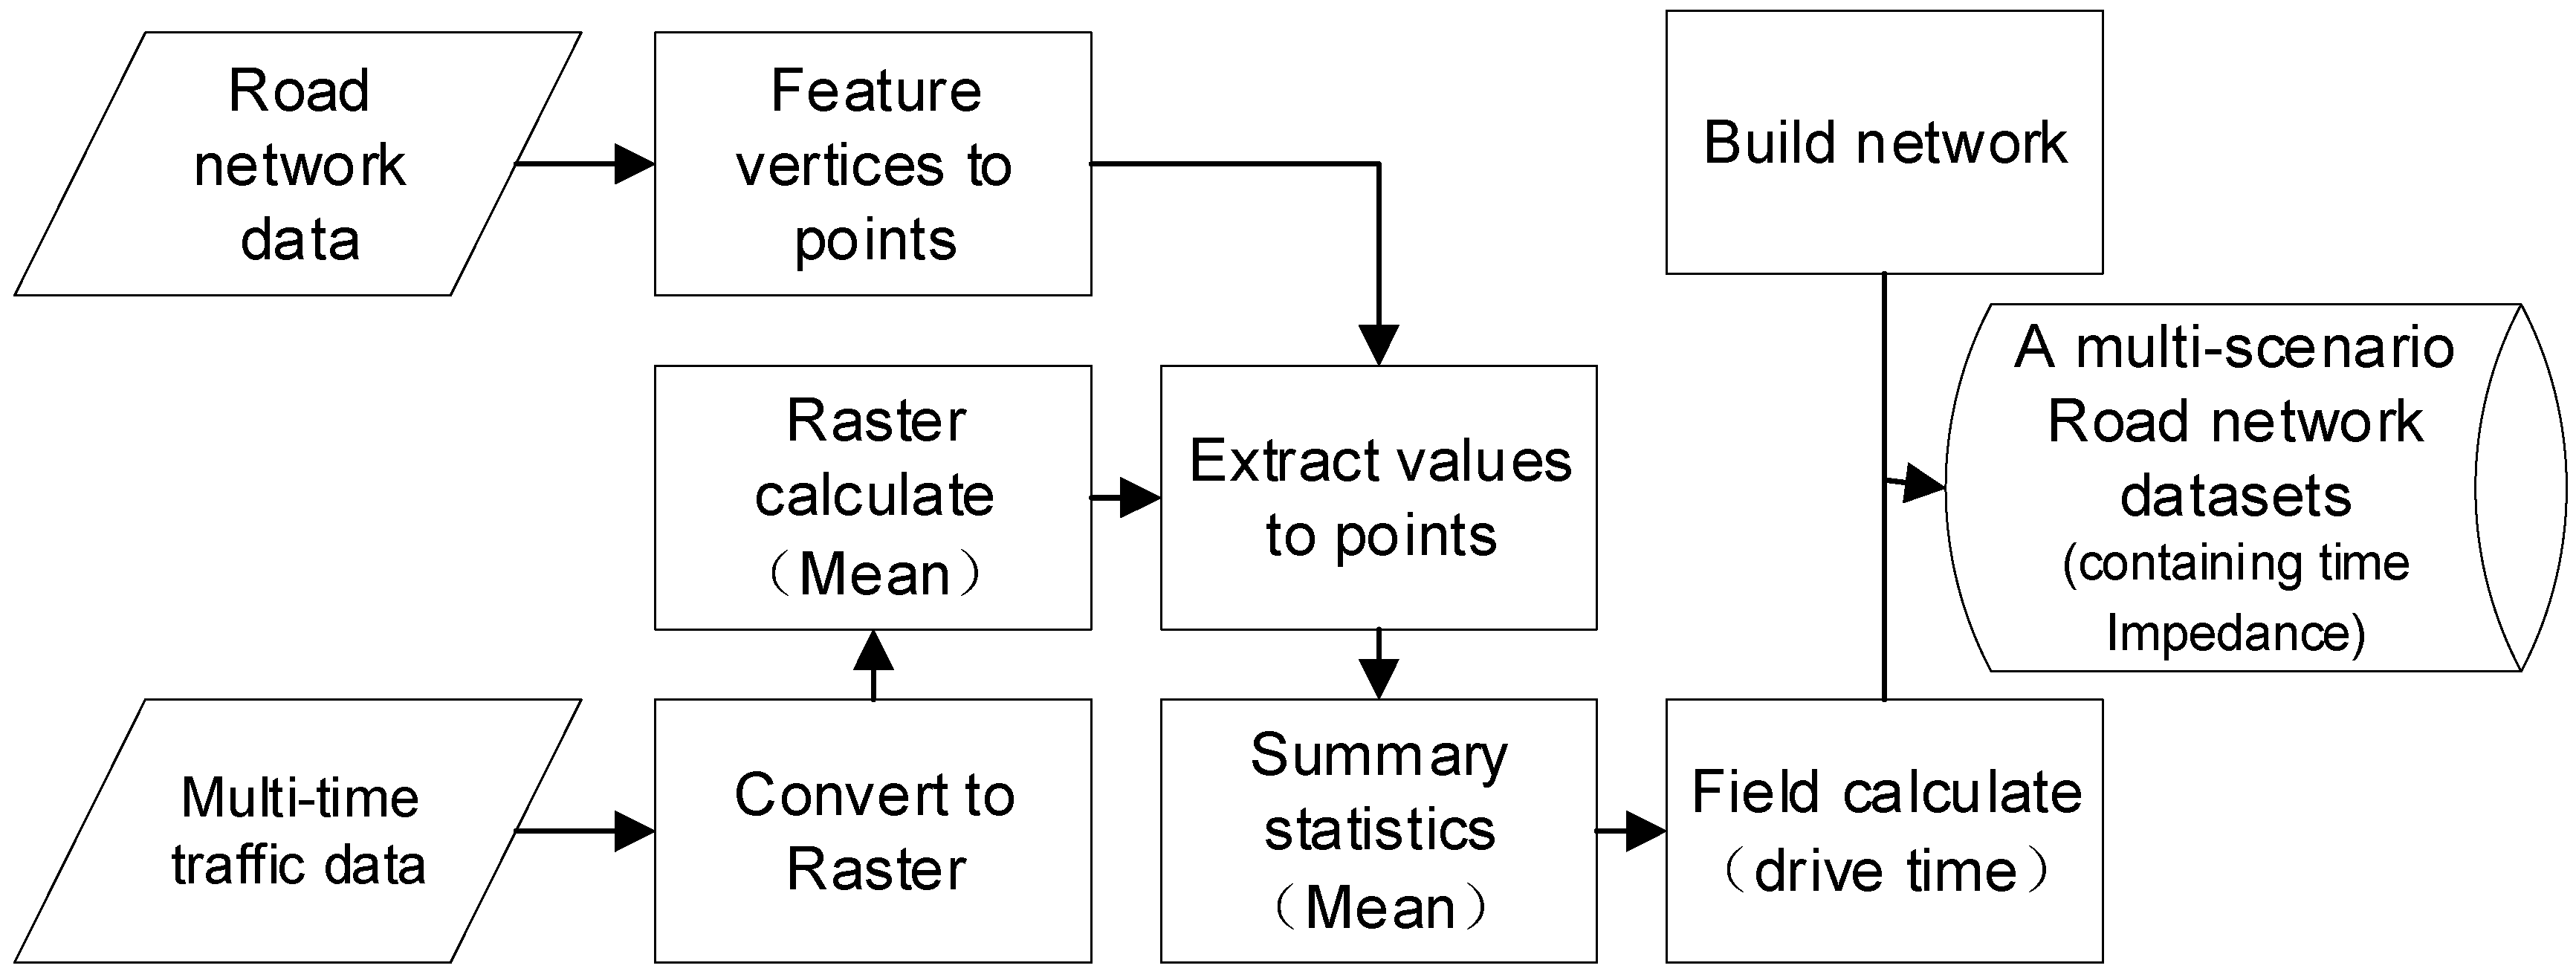
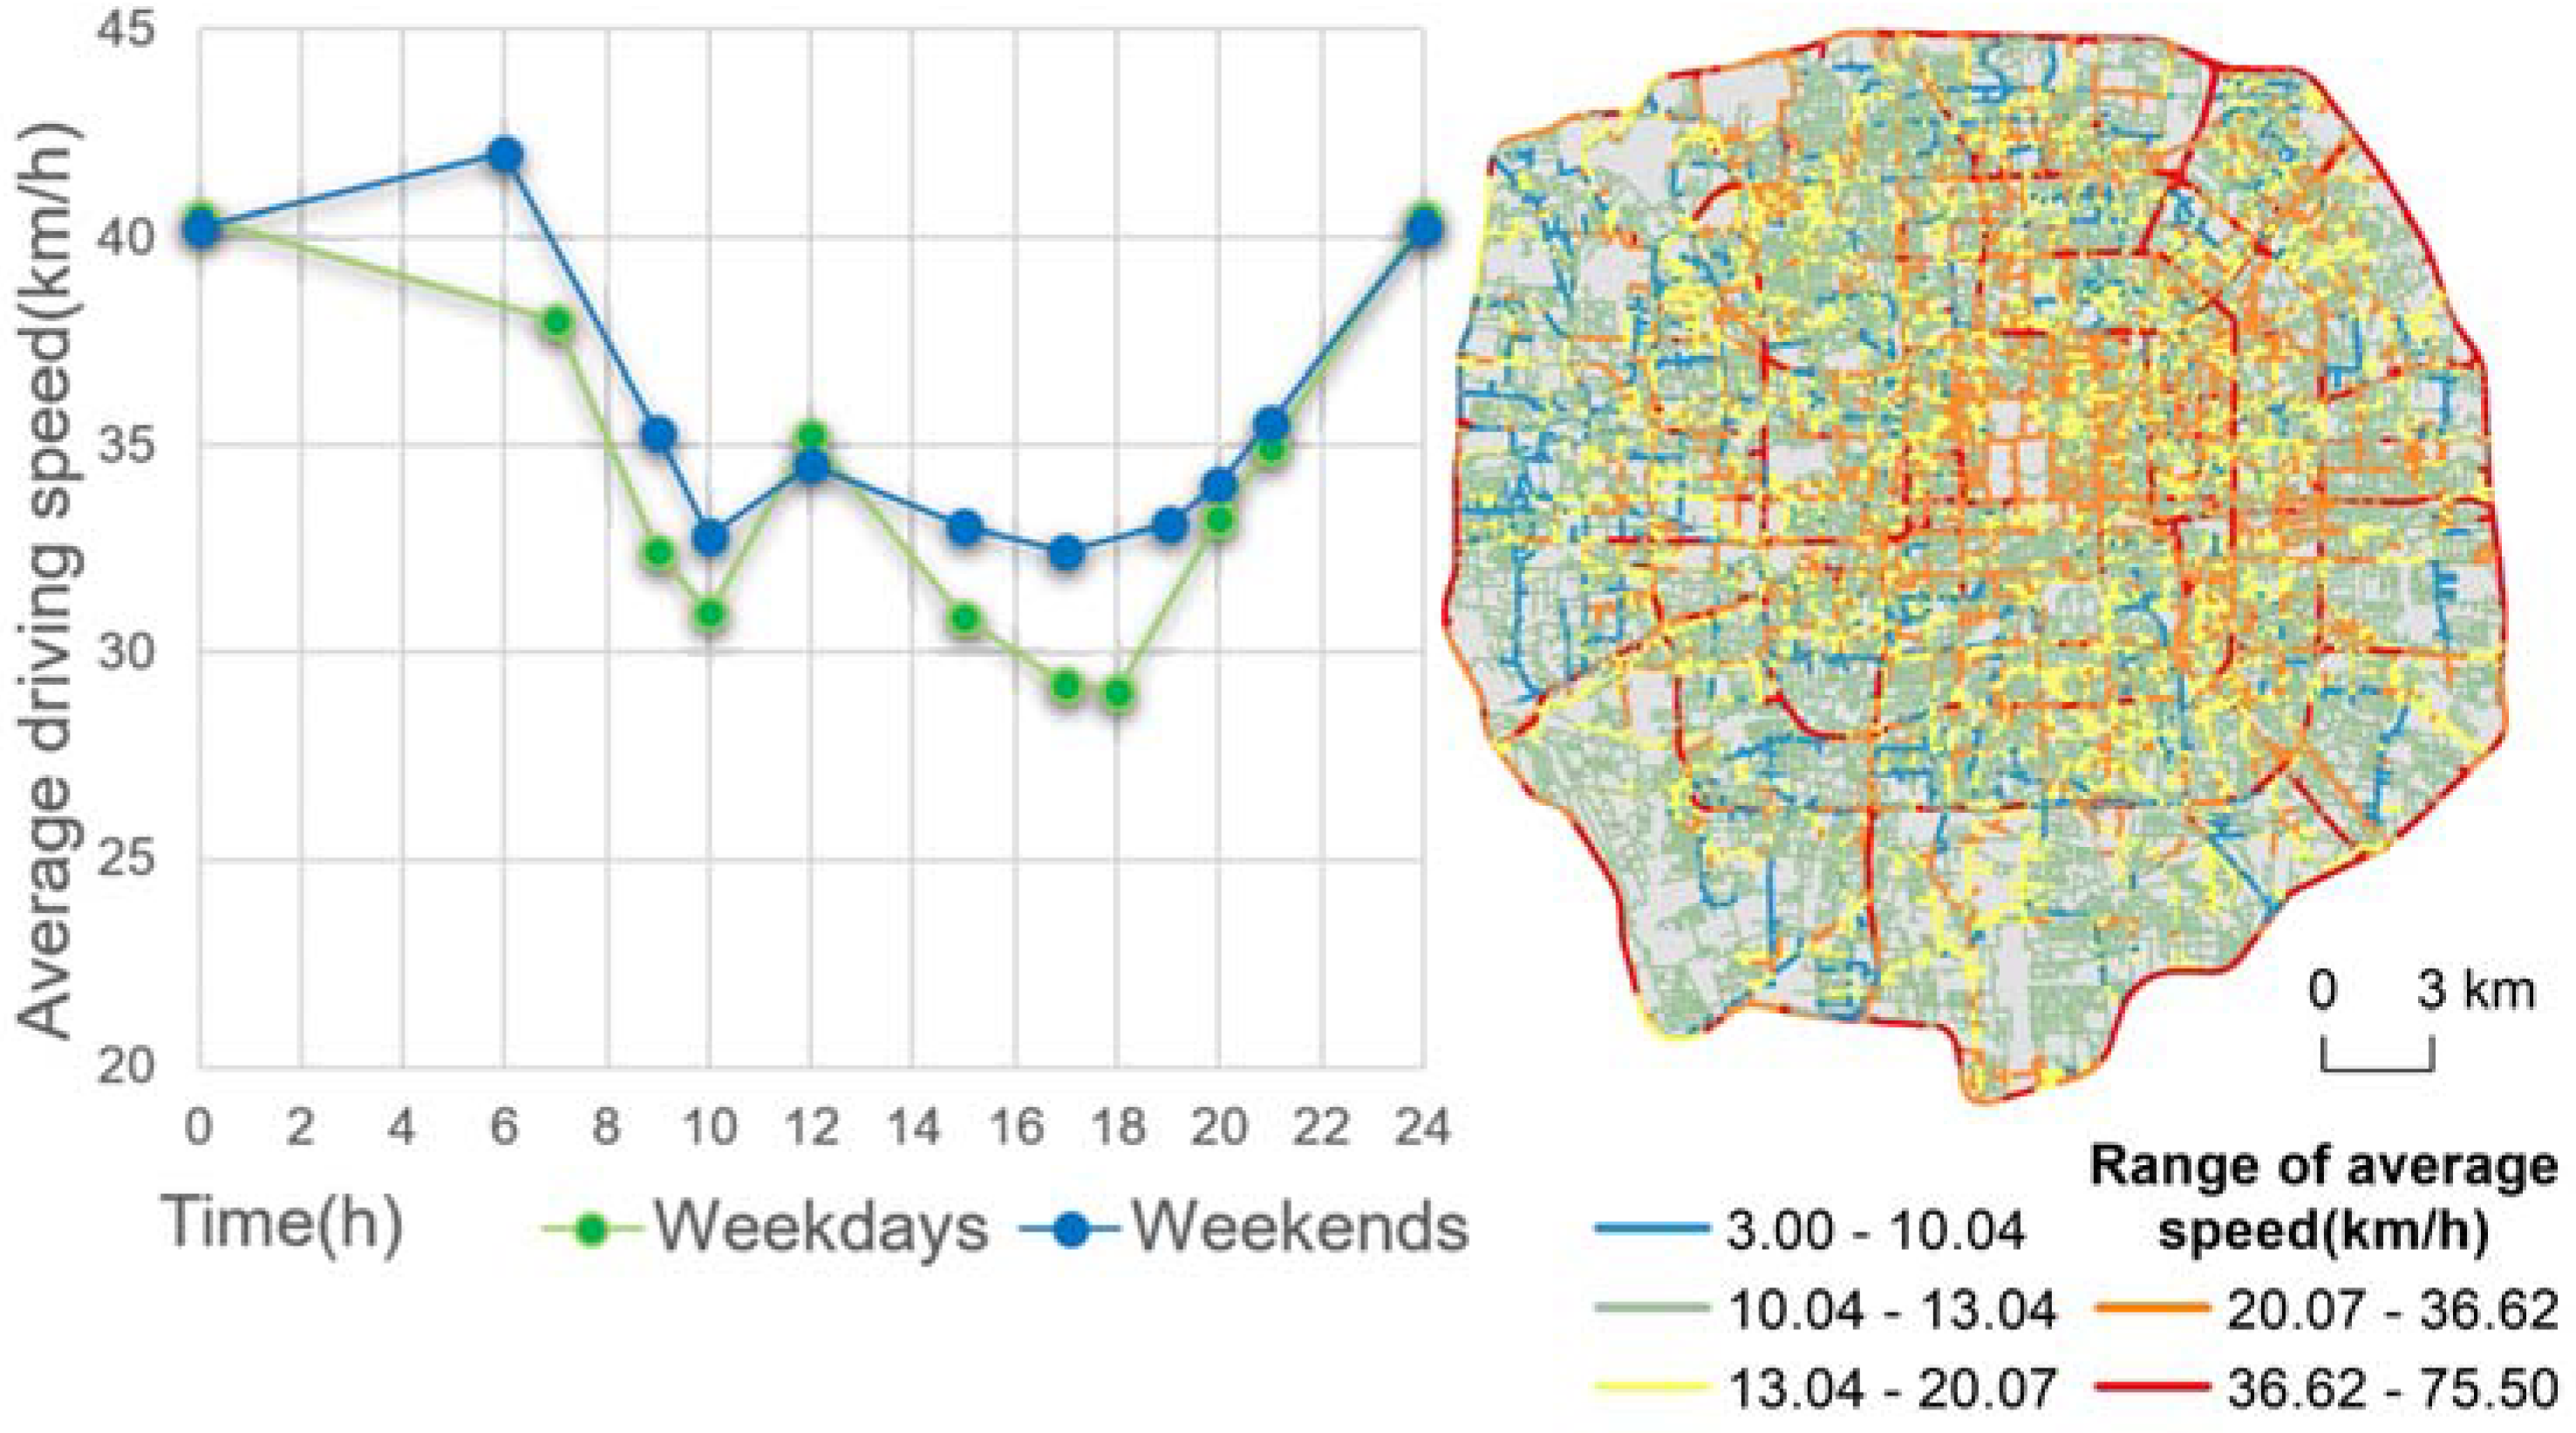
3.3. Generate a Multi-Scenario Road Network

This section mainly describes how to integrate real-time traffic data obtained from AMAP at multiple times to generate road network geographic information data under different traffic scenarios. The original real-time traffic data contain each road segment and its average driving speed. In the final road network data set, the speed information is converted into the time cost of passing each road segment through calculation, that is, the length of the road segment is divided by the average driving speed.
In the original data obtained from AMAP, each road is divided into sections with different speeds. After the time dimension is superimposed, the division of road sections is highly variable. If such raw data are directly used for road network construction and subsequent network analysis, they will have a high degree of complexity. Original MTS data were, therefore, converted into a 10 m by 10 m raster format in this analysis, and the speeds of each grid at the same time point on different days were added together to generate an average value. Speed values at each point on a road where then extracted, and the average speed of all individual points was taken as the overall driving speed for the complete section. As the traffic data provided by AMAP does not include low-level local roads, the average driving speeds for all other roads at the same time were used as replacements for no speed data sections. Once the speed of each road segment had been calculated, we employed the field calculator function in the software ArcGIS to calculate travel times based on traffic pace and the length of each road to generate a network dataset. Although our method for establishing network datasets in ArcGIS is not repeated here, it is nevertheless worth noting that the fact that fire engines always have road priority must be considered during this process as they are not subject to road turns, traffic lights, and other road traffic directions. Thus, appropriate settings for corresponding road network parameters should always be used, with field “drive time” set as road impedance. The overall flowchart for generating a multi-scenario road network is shown in Figure 3. Finally, we integrated multiple scenarios of traffic situation at different times to build a GIS road network data set.

3.4. The Spatial Optimization of Fire Stations

Subsequent to the quantitative identification of fire risk zones and the generation of a multi-scenario road network, a L-A model was applied to analyze the coverage of existing fire stations and to optimize for blind areas. In this context, the three algorithms that comprise this model are used for different purposes and were, therefore, calculated and analyzed in conjunction with GIS network analysis. A number of features were considered in this analysis in the context of spatial optimization with regard to standard and relevant local laws, including the current fire station situation, coverage of high fire risk areas and important risk types, total POI and area coverage, and individual fire station coverage areas.
(1) Fire station coverage standard. According to the planning requirements that cover fire stations and their site selection outlined in the Chinese “Code for the Planning of Urban Fire Control” (2015) and “Urban Fire Station Construction Standards” (2017), the layout of these facilities is generally determined by the principle that it is imperative for a fire brigade to reach the edge of its jurisdiction within five minutes following receipt of a dispatch order. This five-minute time period is related to 15 min of firefighting time; the fire development process can generally be divided into five stages that include an initial stage as well as development, fierce, decline, and extinguishing phases. These five stages reveal that a building fire within 15 min of initiation is still within an initial stage in a general solid flammable case; thus, a fire within this time period is characterized by a small burning area, a flame that is not too high, radiation that remains weak, a low level of smoke and gas flow, and a limited speed. Therefore, if a brigade can carry out the fire-fighting process within 15 min of initiation, an event can generally be controlled and extinguished; if not, a fire will spread quickly and cause serious losses. This 15-minute firefighting time period includes discovery (four minutes), command center handling (two and a half minutes), receipt of instructions (one minute), driving time to the field (four minutes), and starting water (three and a half minutes). At the same time, existing fire station planning and construction standards stipulate that the area covered by an ordinary facility should not be larger than 7 km2, rising to 15 km2 in cases where the area covered encompasses the edge of urban construction land, new areas, and unimpeded road systems. Special fire stations that include both firefighting and rescue missions have the same jurisdiction areas as their ordinary counterparts.
(2) L-A model. The use of L-A models provides one approach to achieve the most effective allocation of public facilities [39]; these models have been successfully applied to determine the locations of educational [40], medical [41], and emergency facilities [42], as well as fire stations [11] and other services. The goal of L-A models is to locate the facilities in a way that supplies the demand points most efficiently, and it is a twofold problem that simultaneously locates facilities and allocates demand points to the facilities. The L-A models offer different algorithms to answer specific kinds of questions, for example, maximizing the accessibility of facilities, providing the widest range of services by facilities, or maximizing the efficiency of facilities. Three algorithms from the L-A models are applied in this study: (i) Maximize Coverage (also referred to as MCLP), which refers to locating the facility so that as many demand points as possible can be allocated to solution facilities within the impedance cutoff (travel time). The use of this algorithm, therefore, ensures that the location of a fire station (facilities) within a certain time period (impedance) covers most demand points within a given range. (ii) Minimize Facilities (also referred to as LSCP) is used to locate a facility so that as many demand points as possible are allocated to solution facilities within the impedance cutoff; additionally, the number of facilities required to cover demand points is minimized. In other words, this algorithm ensures that all fire stations cover as many demand points as possible within a given time period while minimizing the total number of fire stations; this algorithm, therefore, also considers the total cost of fire stations based on coverage maximization. (iii) Minimize Impedance (also referred to as a p-median problem); in this algorithm, facilities are located such that the sum of all weighted costs between demand points and solution facilities is minimized. This algorithm ensures that each fire station has the lowest total time cost for all demand points within its coverage area. The mathematical description of these three algorithms are shown in Table 2.
The specific interpretation of the parameters can be seen in the literatures [4,5,9]. The above three algorithms <are integrated in the ArcGIS software, so we can conveniently use the analysis tools in ArcGIS to do the implementation. For the specific operations, please refer to the ArcGIS help documentation, which will not be repeated here.

4. Result

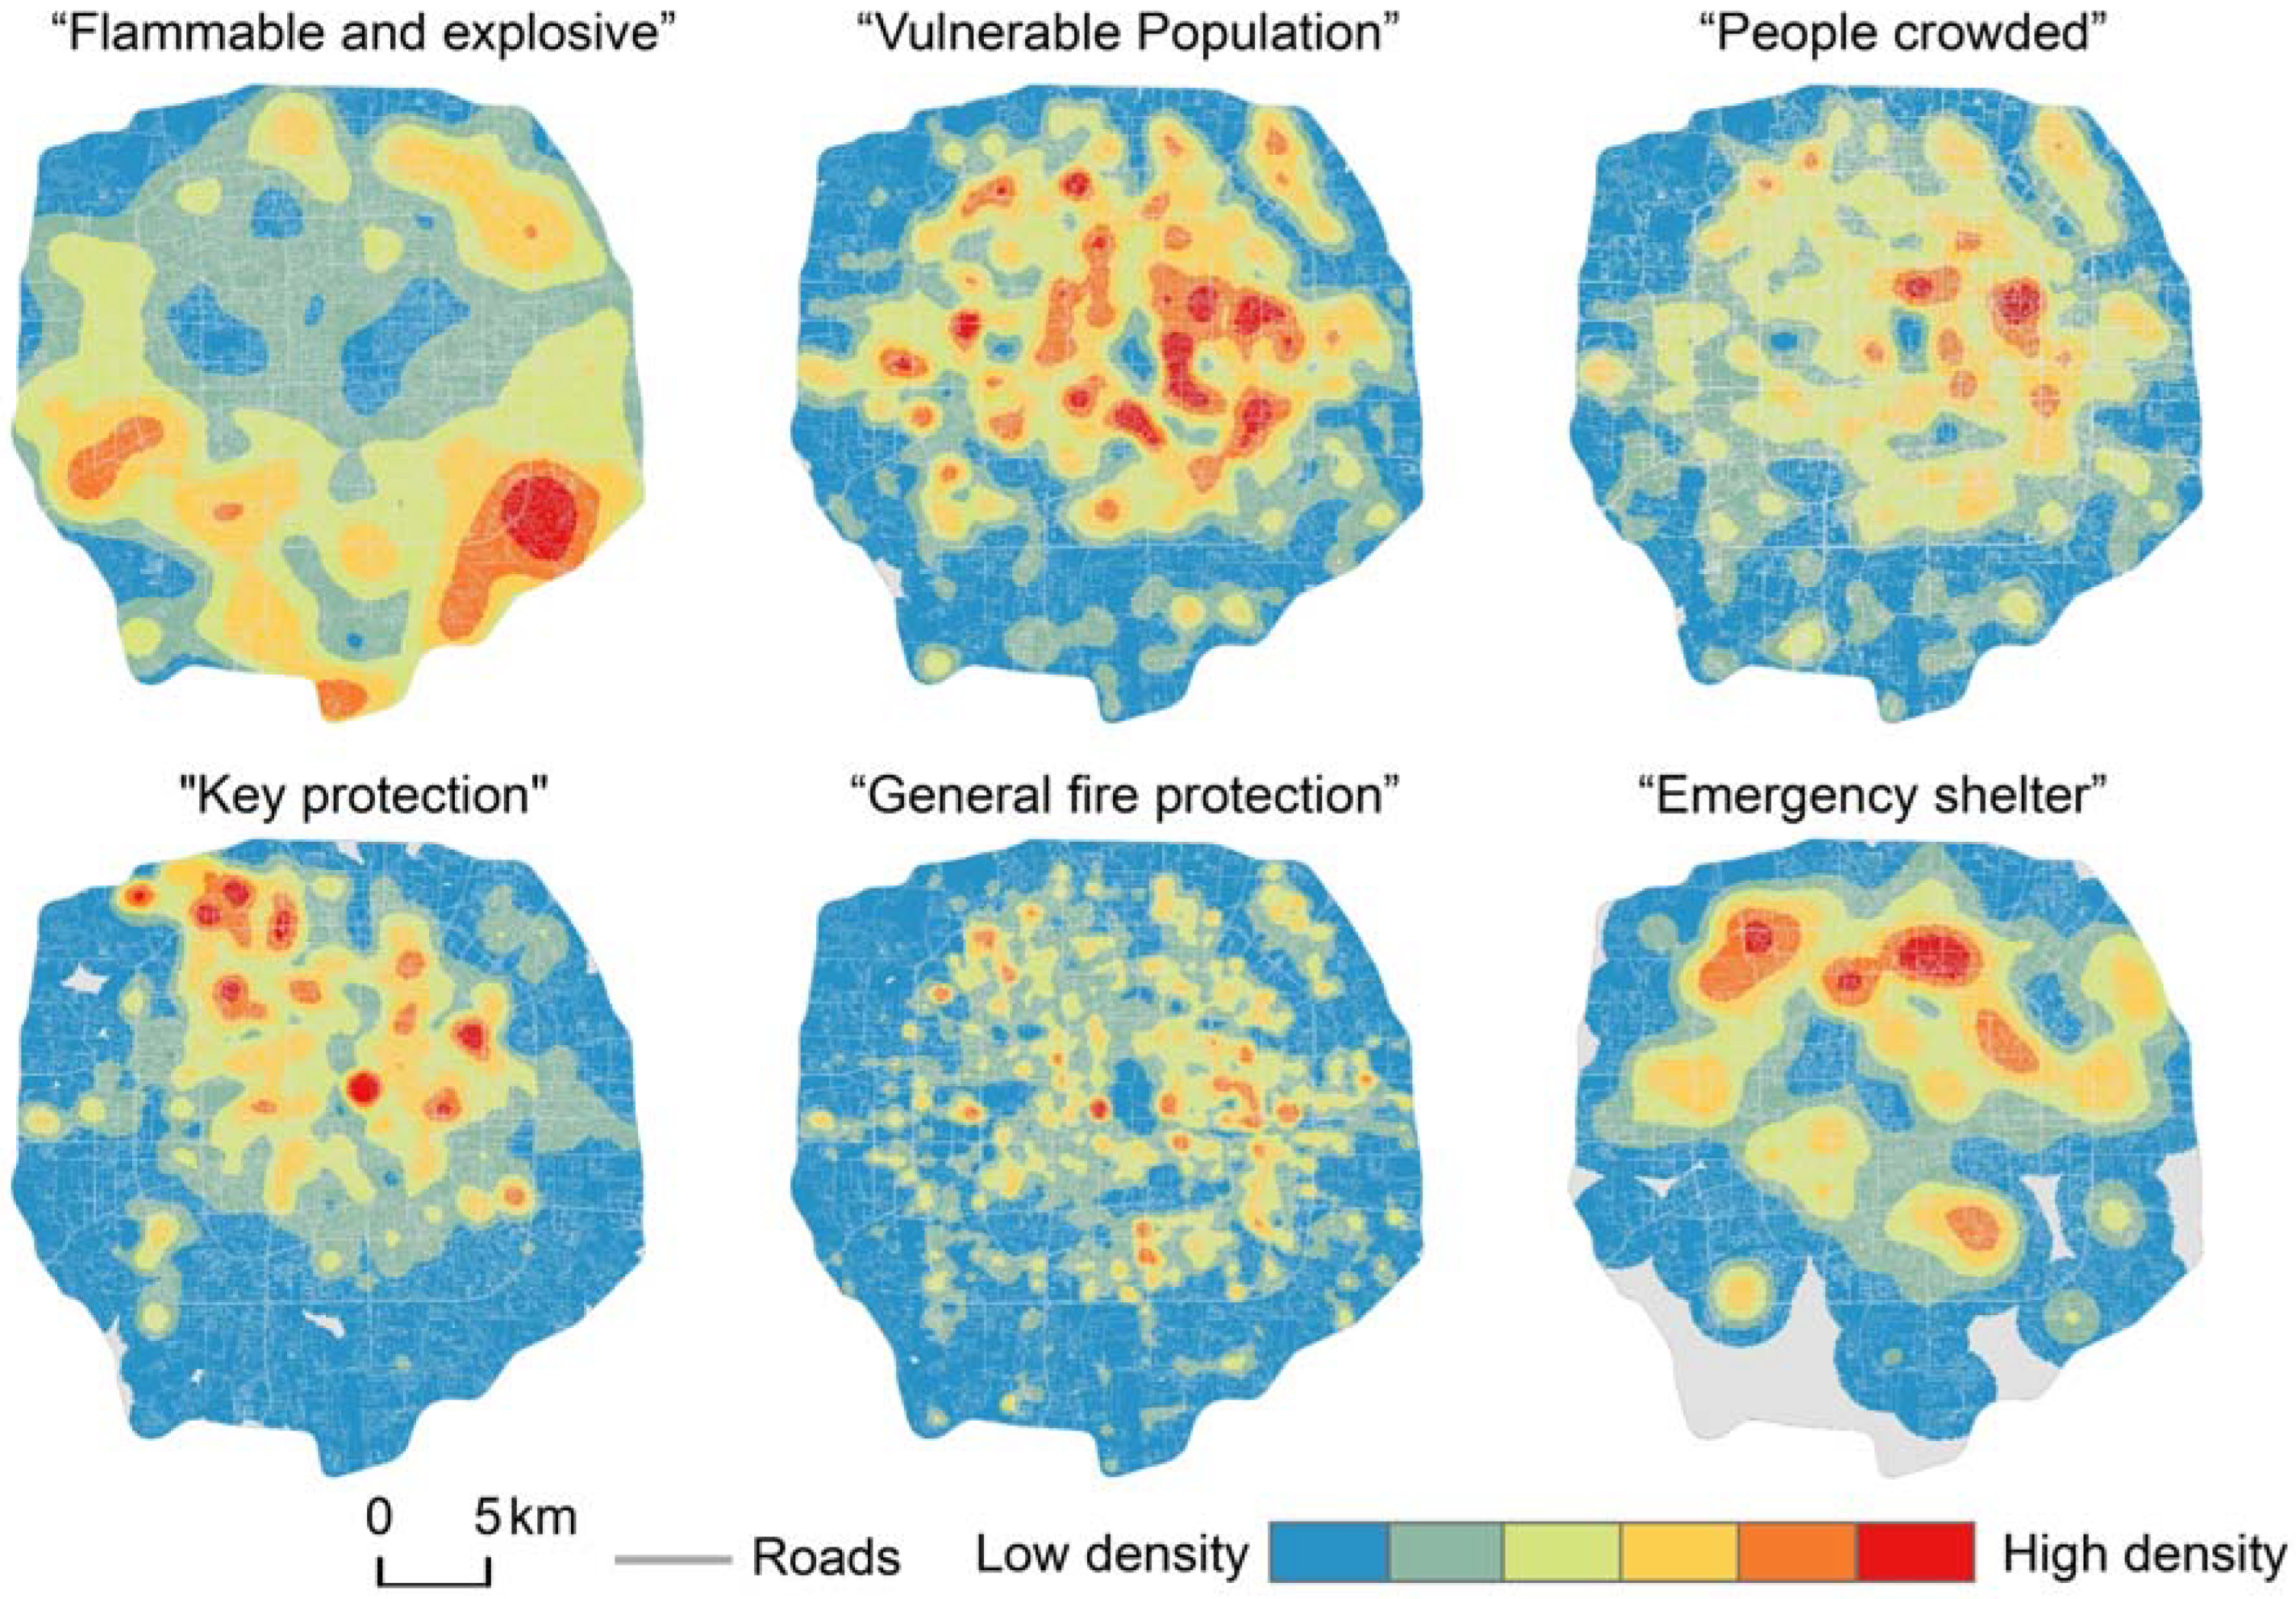
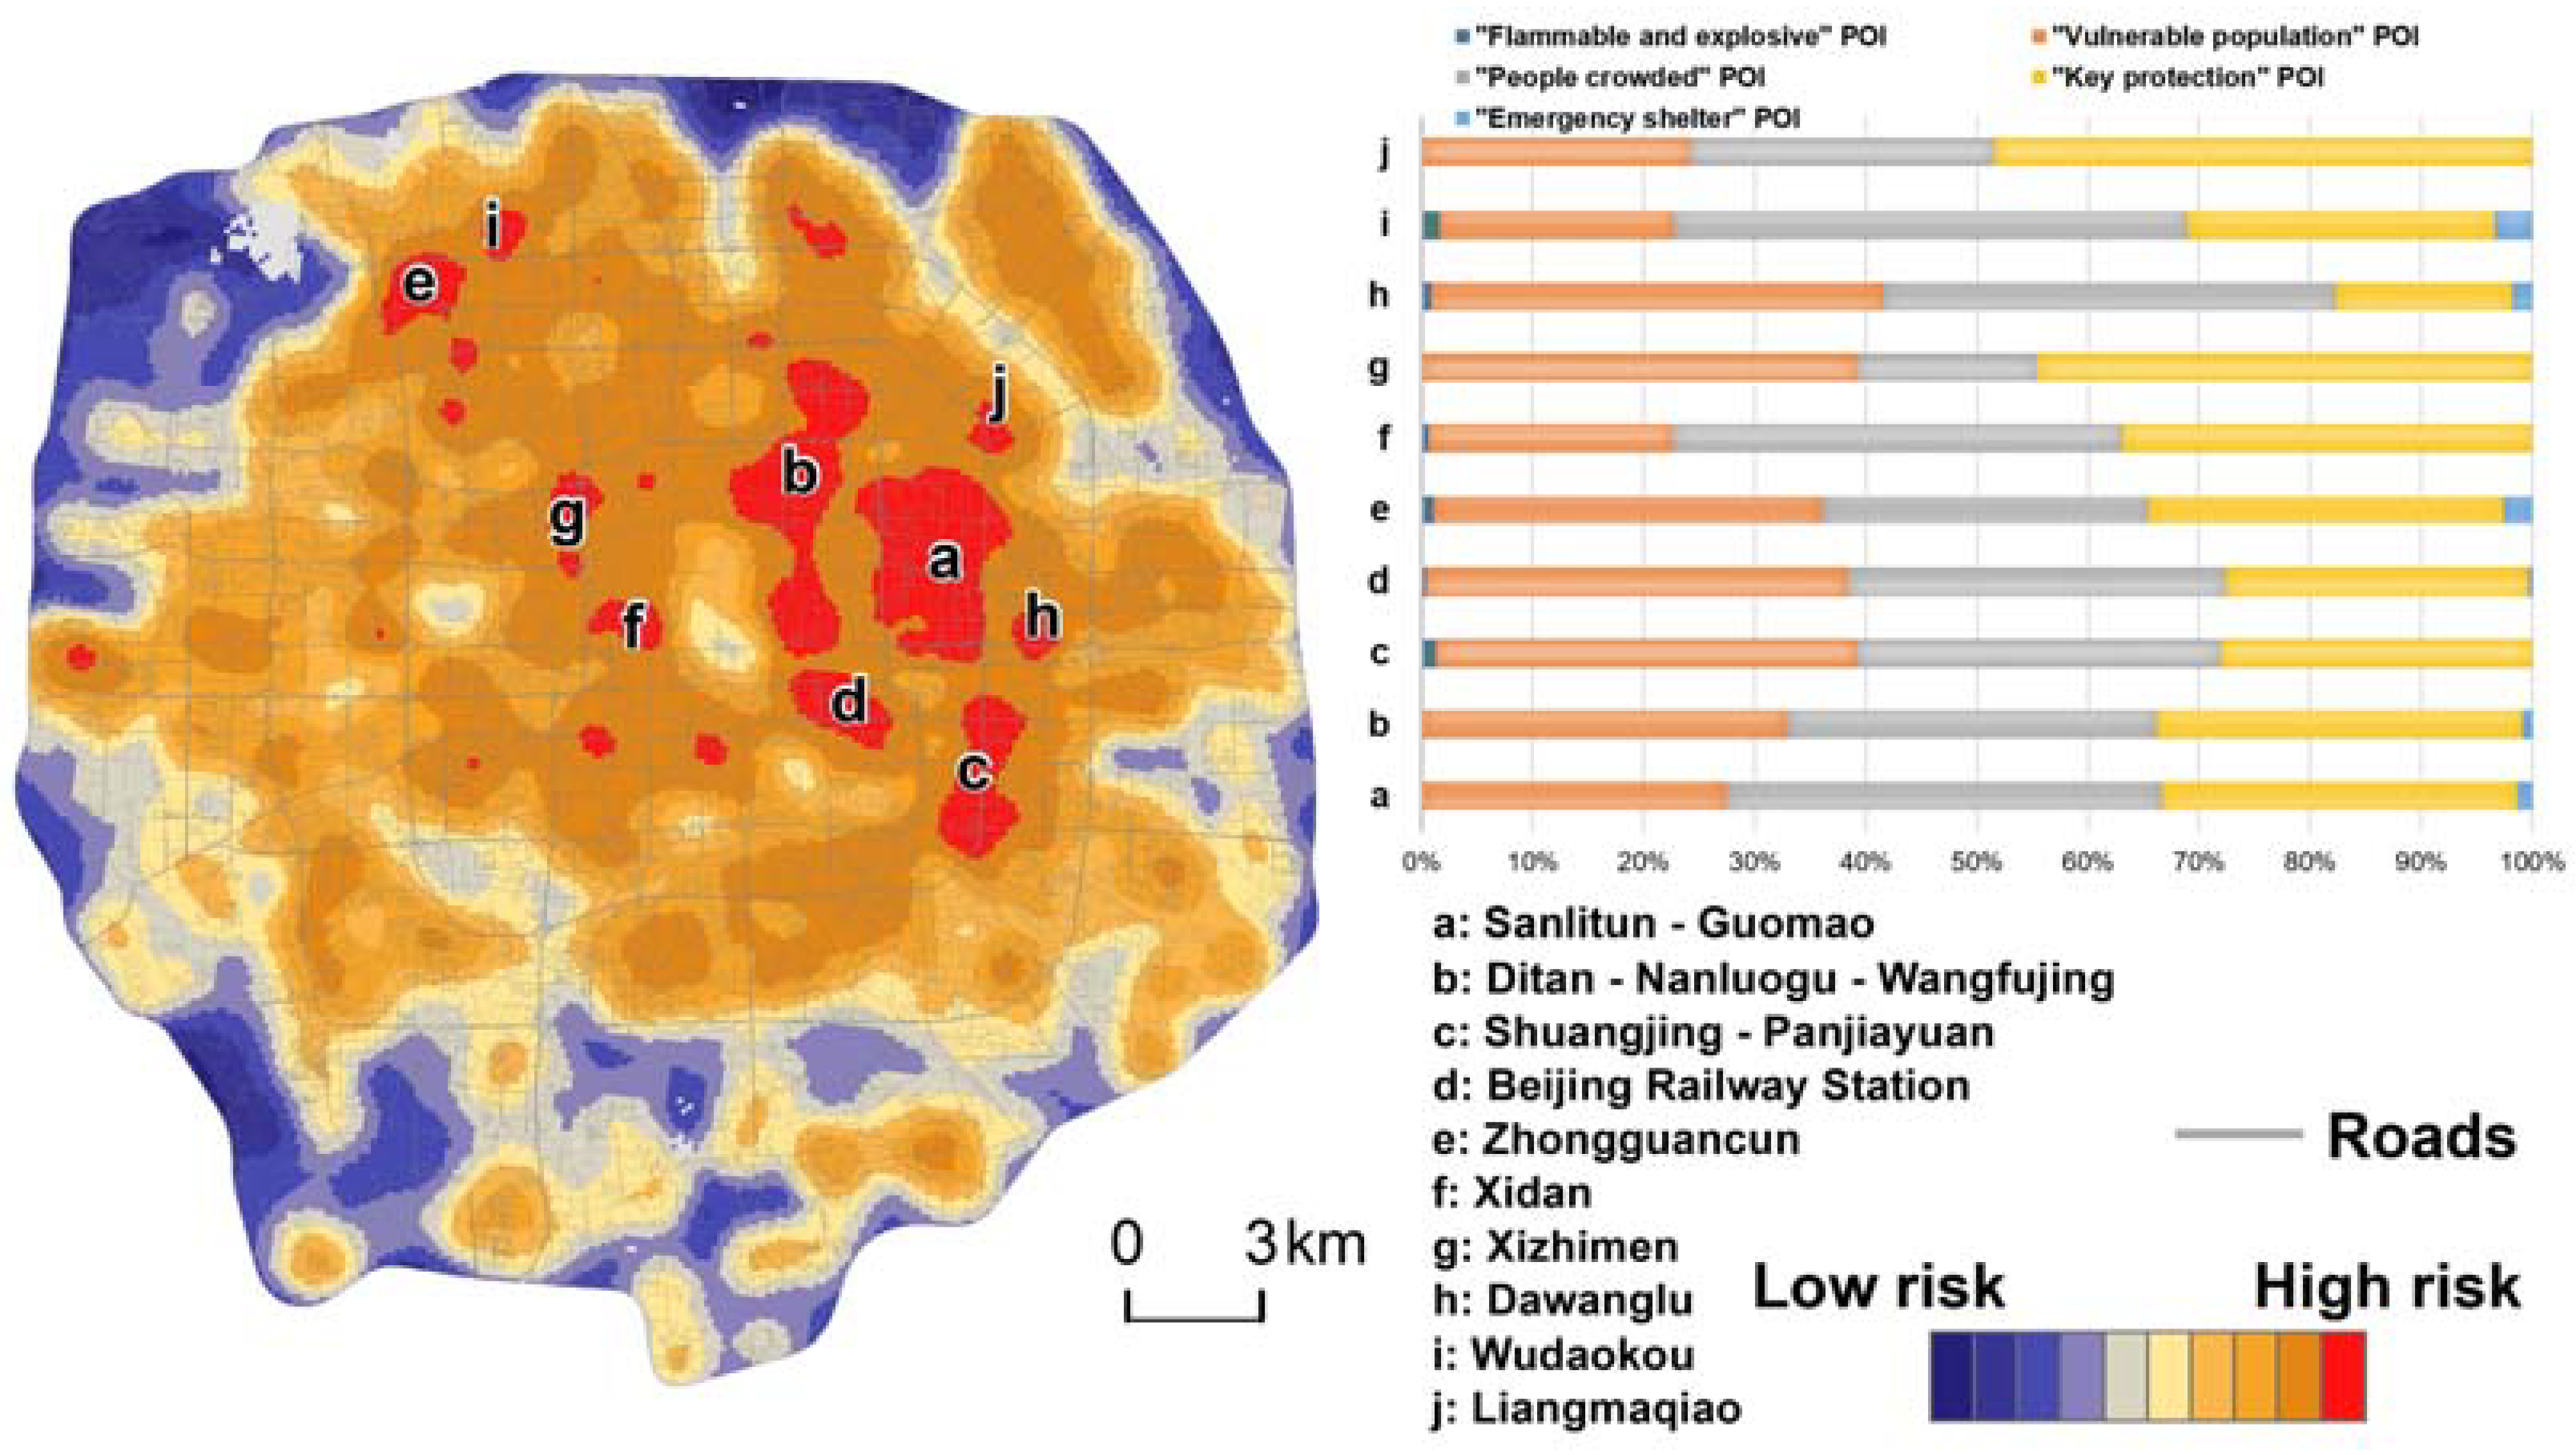
4.1. The Distribution of Fire Risk Zones within the Study Area

Perform kernel density analysis on POI classified by fire risk to obtain the spatial distribution of each fire risk type as shown in Figure 4. It shows that “flammable and explosive” places within the study area are mainly distributed within southeastern and southwestern regions, while “vulnerable population”, “people crowded”, and “general fire protection” locations are mainly distributed within the center of this area and are more intensive in the east. Results show that “key protection” zones are more intensively located in Haidian District because of the presence of more colleges, universities and high-tech companies in this area. Emergency shelter is mainly located in the northern part of the study area.
Once fire risk density calculations were completed, all data were normalized and weighting coefficients were added according to the differences of the impact of each fire risk on the total fire risk. By using the Delphi method, the weight coefficients for the categories of “flammable and explosive”, “vulnerable population”, “people crowded”, “key protection”, “general fire protection”, “emergency shelter”, and “population grid” were respectively determined as 0.6, 0.4, 0.4, 0.3, 0.2, 0.1, 0.1. The adjusted data of each risk factor were integrated and calculated through iterative calculations with the help of the SAVEE model, so as to obtain the overall fire risk distribution of the study area. These results can be divided into 10 levels based on an equal interval classification (Figure 5); thus, a high-risk zone refers to a large fire risk or a high degree of severity given such an event, while a low-risk zone refers to a relatively small risk of fire or relatively low losses given such an event.
The classification results presented in Figure 5 enable us to evaluate the risk of fire from high to low. These data show that the top 10% high-risk areas are mainly concentrated in “Sanlitun-Guomao”, “Ditan-Nanluogu-Wangfujing”, and “Shuangjing-Panjiayuan”, as well as at Beijing Railway Station, and in Zhongguancun, Xidan, Xizhimen, Dawanglu, Wudaokou, and Liangmaqiao. Small-scale high-risk areas also include Huixinxijie Beikou, the Beijing Friendship Hospital, Niujiexili, and Shijingshan Wanda. The data presented in Figure 5 also provide a POI statistical breakdown of the top 10 high fire risk areas; these data show that “people crowded” POI are dominant components in “Sanlitun-Guomao”, as well as in Xidan, Dawanglu, and Wudaokou, while “key protection” POI comprise the dominant component in Liangmaqiao, and “vulnerable population” and “key protection” POI are the dominant components in Xizhimen. The other areas included in this figure are also mostly densely populated areas, vulnerable areas and key protected areas and all have low fire resistance.

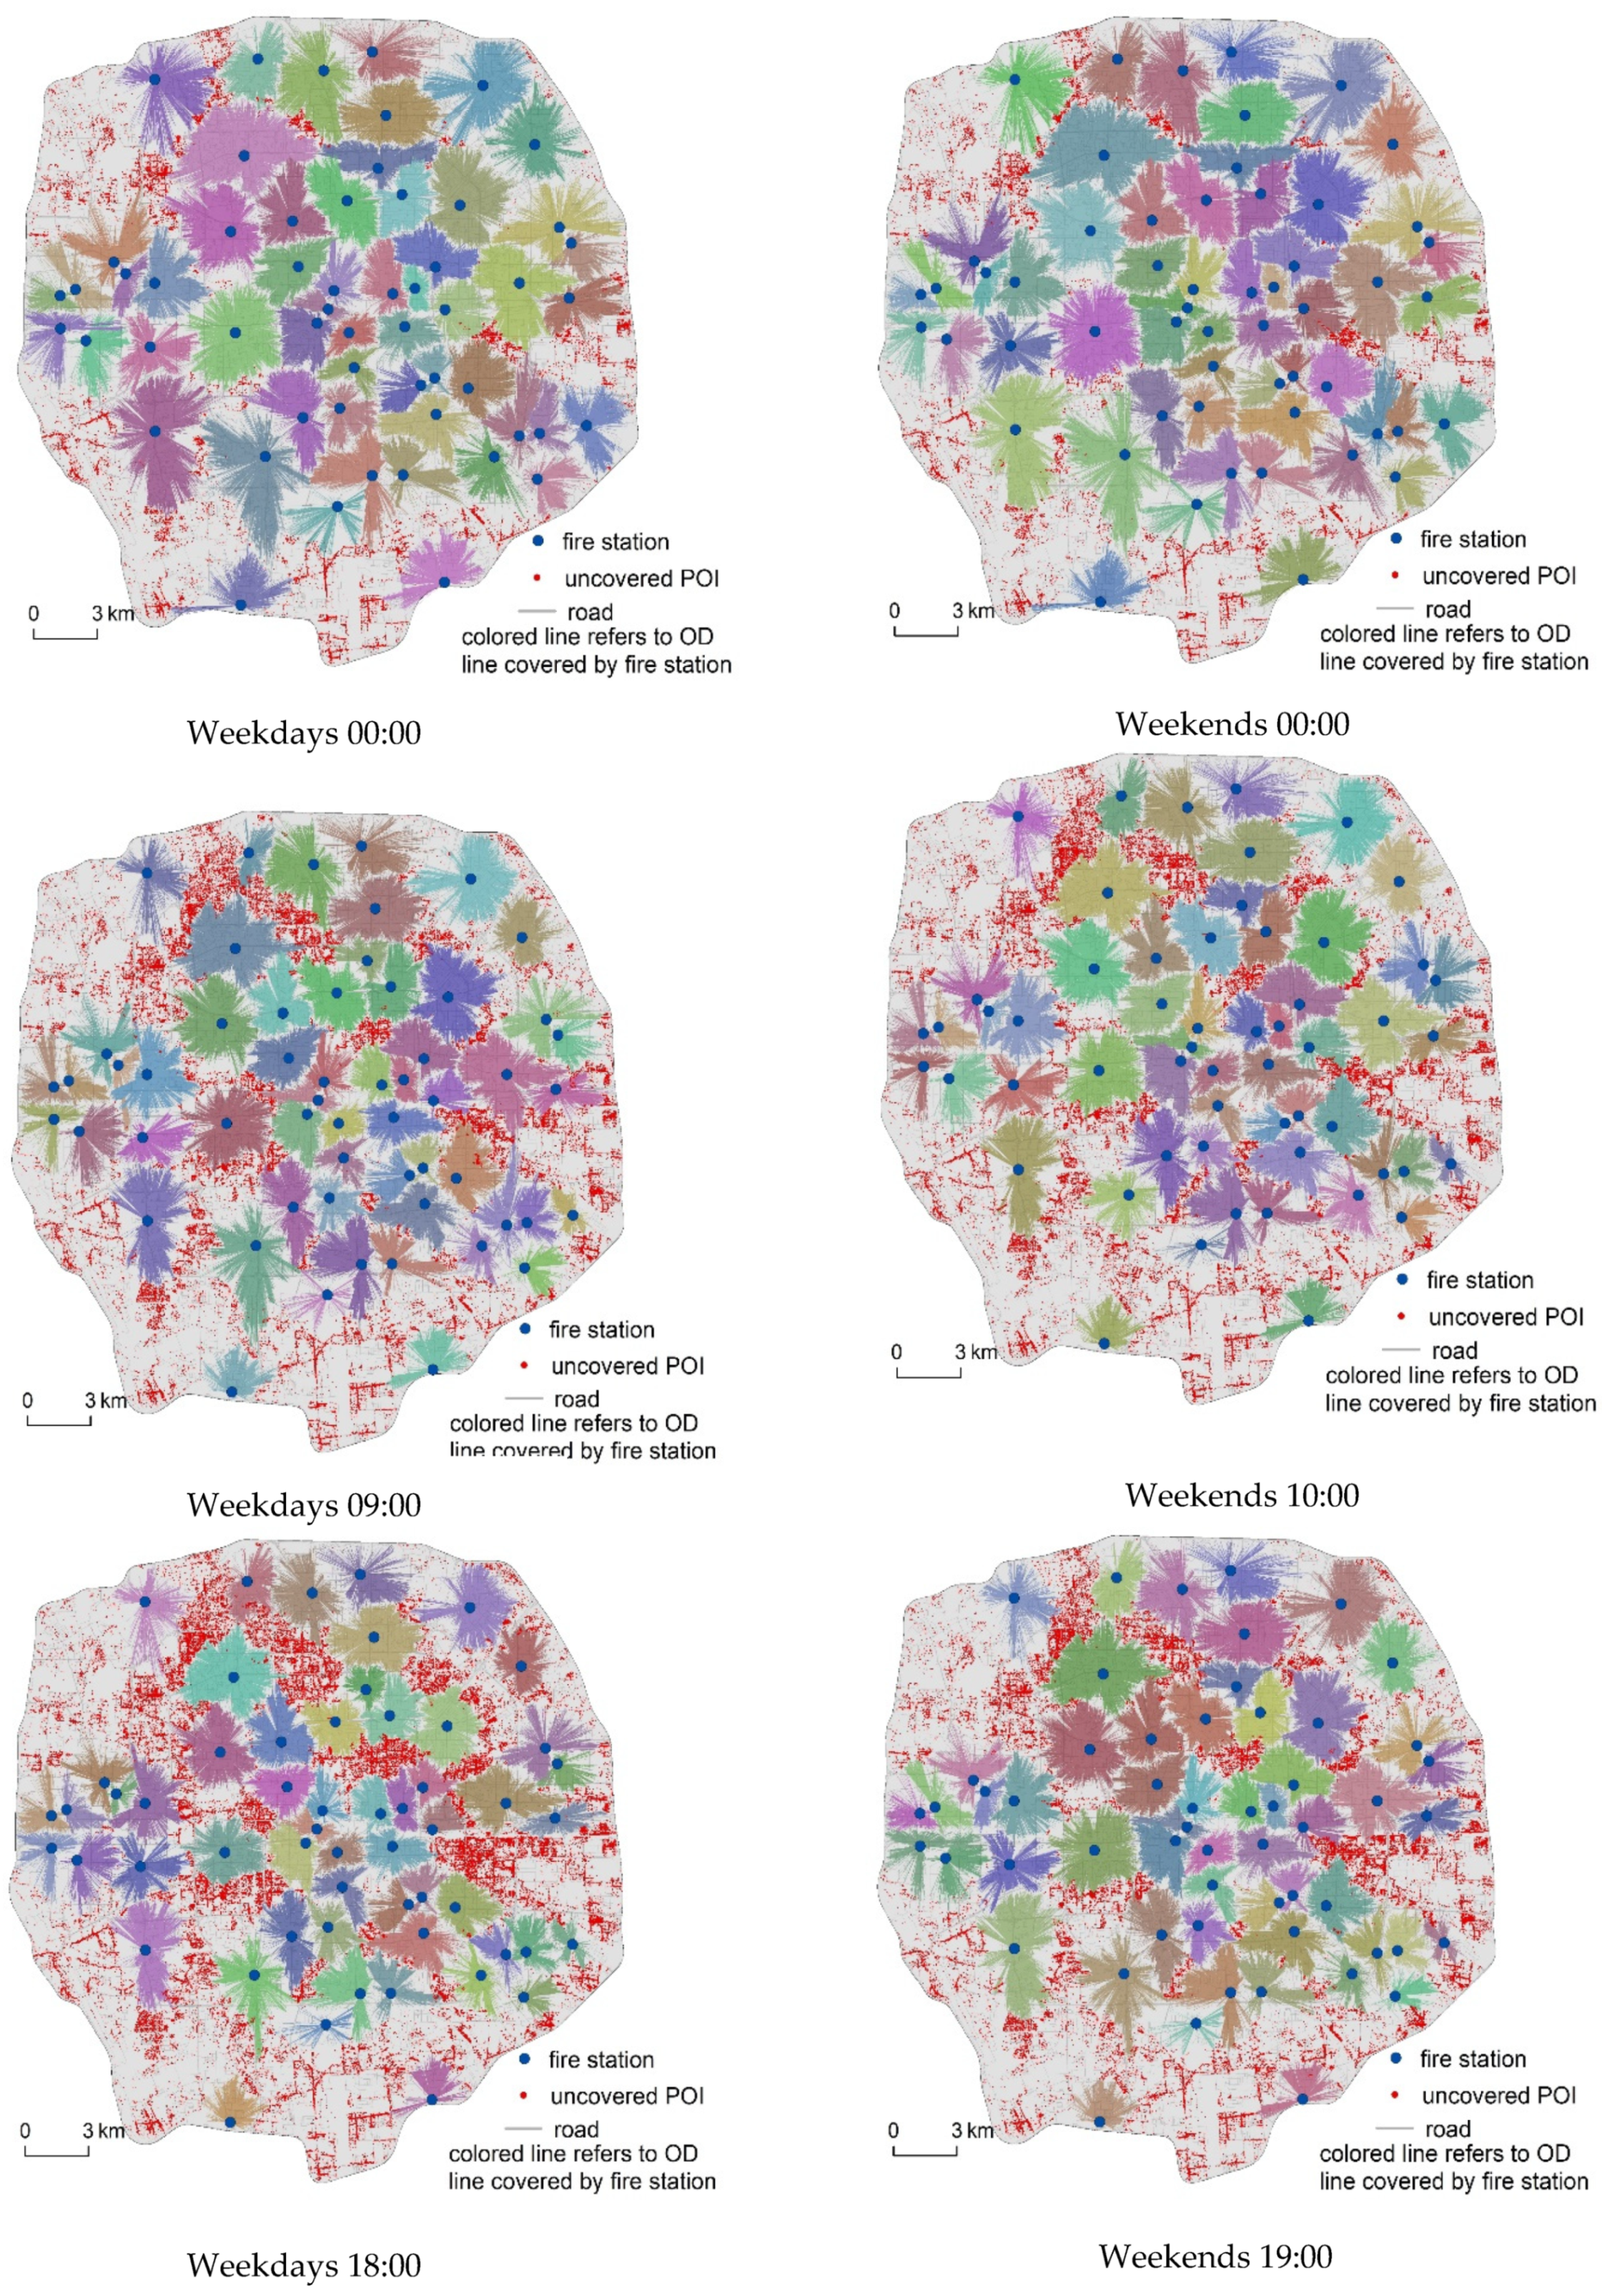
4.2. Existing Fire Station Coverage within the Study Area

Travel speeds for different roads at various times were obtained by applying the methods described above. The average driving speed of all the roads in the study area at 20 time points on weekdays and weekends is calculated as shown in Figure 6 (left). Time-period analysis shows that average driving speed in Beijing decreases sharply during the morning rush period (i.e., between 07:00 and 09:00) as well as during the busy evening period (i.e., between 17:00 and 19:00), while average speed also increases slightly around 12:00 (midday). Similarly, average driving speed at weekends at the same time point is mostly slightly higher than on weekdays; indeed, compared to 00:00 (midnight) the average driving speed at 06:00 on weekends is slightly increased, perhaps because people tend to experience more nightlife at weekends and have fewer morning activities. It is also noteworthy that the average driving speed at 12:00 (midday) is slightly higher at weekdays than at the same time on weekends, perhaps because residents tend to travel over a larger time period on these non-working days. We also calculated the range between highest and lowest speed values at different times on particular roads (Figure 6, right); these data show that sections exhibiting the largest differences tend to be trunk roads, and that the ten with maximum ranges are mostly concentrated within Wufangqiao to the east of the fifth ring road along the Jingha Expressway, as well as in Majialou to the south of the fourth ring road along the Nansihuan-Jingkai Expressway.
Considering the multiple scenarios of traffic situation on weekdays and weekends, morning rush hour and evening rush hour, 6 time points were selected for the fire station coverage analysis. They are 0, 9, 18 o’clock on weekdays and 0, 10, 19 o’clock on weekdays. We used the network analysis to determine the maximum coverage of the existing 56 fire stations in the study area within a five-minute fire engine driving time. As discussed above, this five-minute period includes one minute to receive instructions to dispatch as well as four minutes of driving time; indeed, in actual situations as fire engines are not restricted by traffic jams and lights, speeds should be greater than real-time traffic statistics and so five minutes of driving time was used here to calculate fire station coverage. Thus, the coverage of existing fire stations was calculated for six time points (Figure 7). These data show that due to variable traffic situations, the coverage of stations within a five-minute period also changes; in the case of less traffic congestion, uncovered POIs are mainly concentrated in the northwest, southwest, and southern parts of the Beijing study area and that coverage within the third ring road is generally good. Results show that during the morning busy period, both on weekdays and at weekends (i.e., between 09:00 and 10:00), the number of uncovered POI dramatically increases and are mainly located along lines between “Shijicheng and Wudaokou-Mudanyuan”, between “Nanluogu and Dongsi Subway Station”, and between “Shuangjing and Baiziwan”, as well as in the area between Honglian South and Lize roads, and within the southwest, south, and east of the study area. In contrast, a number of differences are evident between weekdays and weekends during the evening busy period; for example, POI coverage at 18:00 on weekdays dropped sharply compared to the corresponding morning busy period, and uncovered points along the lines “Wudaokou-Mudanyuan”, “Nanluogu-Dongsi Subway Station”, and “Shuangjing-Baiziwan” as well as within the area encompassed by Taiyanggong and Liangmaqiao increased significantly. POI coverage at 19:00 on weekends changed little compared with the corresponding morning busy period. Comprehensive analysis of the six time points considered in this study reveals that fire station coverage remained at a relatively high level, in particular within the center of the study area (especially within the second Beijing ring road), while areas that existing fire stations are unable to cover are mainly distributed within the northwest and southwest. It is noteworthy that POI density within these areas is lower compared to other areas, while zones that experience traffic fluctuation in fire station coverage are mainly distributed within the areas demarked as “Wudaokou-Mudanyuan”, “Nanluogu-Dongsi Subway Station”, and “Shuangjiang-Baiziwan”, as well as in the region between the Honglian South and Lize roads.
The extent of coverage from existing fire stations within five minutes was analyzed for different fire risk zones as well as based on the distribution of various kinds of risk. We selected and analyzed cross-sectional data at six time points and also considered the general situation at all times. Therefore, we added quarterly average speed data (also derived from AutoNavi) within the same time period to our POI data. Data show that the average speed of traffic within Beijing is 48.19 km/h under no-congestion conditions; thus, the results of different coverage indices for current fire stations given seven different traffic situations are shown in Table 3. In this case, “total POI coverage” represents the coverage ratio of all points; the coverage ratio for fire risk areas was, therefore, calculated for the top 10%, top 30%, and the top 50% coverage ratios for fire risk zones, respectively, while the “coverage of various types of fire risk” was calculated on the basis of various risk coverage rates. These data show that although the current situation for fire stations at different time points varies, coverage is generally better under quarterly average traffic conditions. Indeed, under these conditions, the POI coverage rate for current fire stations within the top 10% high-risk areas reached up to 100%, while coverage within the top 50% risk areas was also close to 98%. These data show that of the various blind areas for fire risk coverage, those for “flammable and explosive” POI are mainly distributed within Xishan and Jinxingxiang, while those for “vulnerable population” and “people crowded” are sporadically distributed across the Shijicheng and around Fengtai West Railway Station. In contrast, blind areas for “key protection” POI are mainly distributed within the Shijicheng as well as the 11th and 12th district of Zongbujidi.
Coverage at the individual fire station scale was also analyzed in this study, using quarterly averaged road condition data. In this case, both the number and size of POI covered by fire stations within a response time of five minutes were counted, and a minimum boundary geometry (i.e., a convex hull) was calculated. A convex hull in this case is regarded as the jurisdiction of each fire station, and thus the number of cover points and coverage area (km2) in each case can be obtained. This analysis shows that in terms of the number of fire stations covering each POI, eight of the top 10 are within the third ring road, while one is located between the third and fourth right roads, and one is between the fourth and fifth ring roads. Similarly, eight of the top 10 fire stations are located within the middle of the study area, while the remaining two are in the northern part. In terms of coverage area, nine of the top 10 sites are located outside the third Beijing ring road; six of these are located outside the fourth ring road, and one is located inside the third ring road. Four of the top 10 sites are located in the northern part of the study area, while one is located centrally and five are located in the south. As noted above, Chinese “Urban Fire Station Construction Standards” stipulate that the area covered by an ordinary facility should not exceed 7 km2, and that the zone covered by such a station within a suburban area should not be larger than 15 km2. However, 13 fire stations within Beijing cover an area less than 7 km2, and of these, ten are located within the second ring road. A total of 39 out of 56 fire stations do conform to the 15 km2 coverage construction standard, while the 17 that do not are all located outside of the second ring road. The analysis presented in this study reveals a gap in the construction of fire stations within rapidly expanding areas of Beijing, and that the coverage of these facilities is still some way below the national standard.
The current status of overall fire stations as well as the individual data presented in this study reveal that while the total POI coverage by existing facilities is good, and that some regions are better than others, deficiencies still remain in the northwestern and southwestern parts of the study area. Indeed, coverage within a five-minute response time is not achieved throughout the study area in both the “flammable and explosive” and other categories. Data also show that while existing fire stations within the old urban area inside the second Beijing ring road are relatively densely distributed and are able to meet local needs and related construction standards, most of these facilities outside the third ring road cover more area than standard. Thus, considering current trends in Beijing population growth within the suburbs, the area studied in this paper has a number of construction and optimization needs, both in terms of fire station coverage collectively and individually.

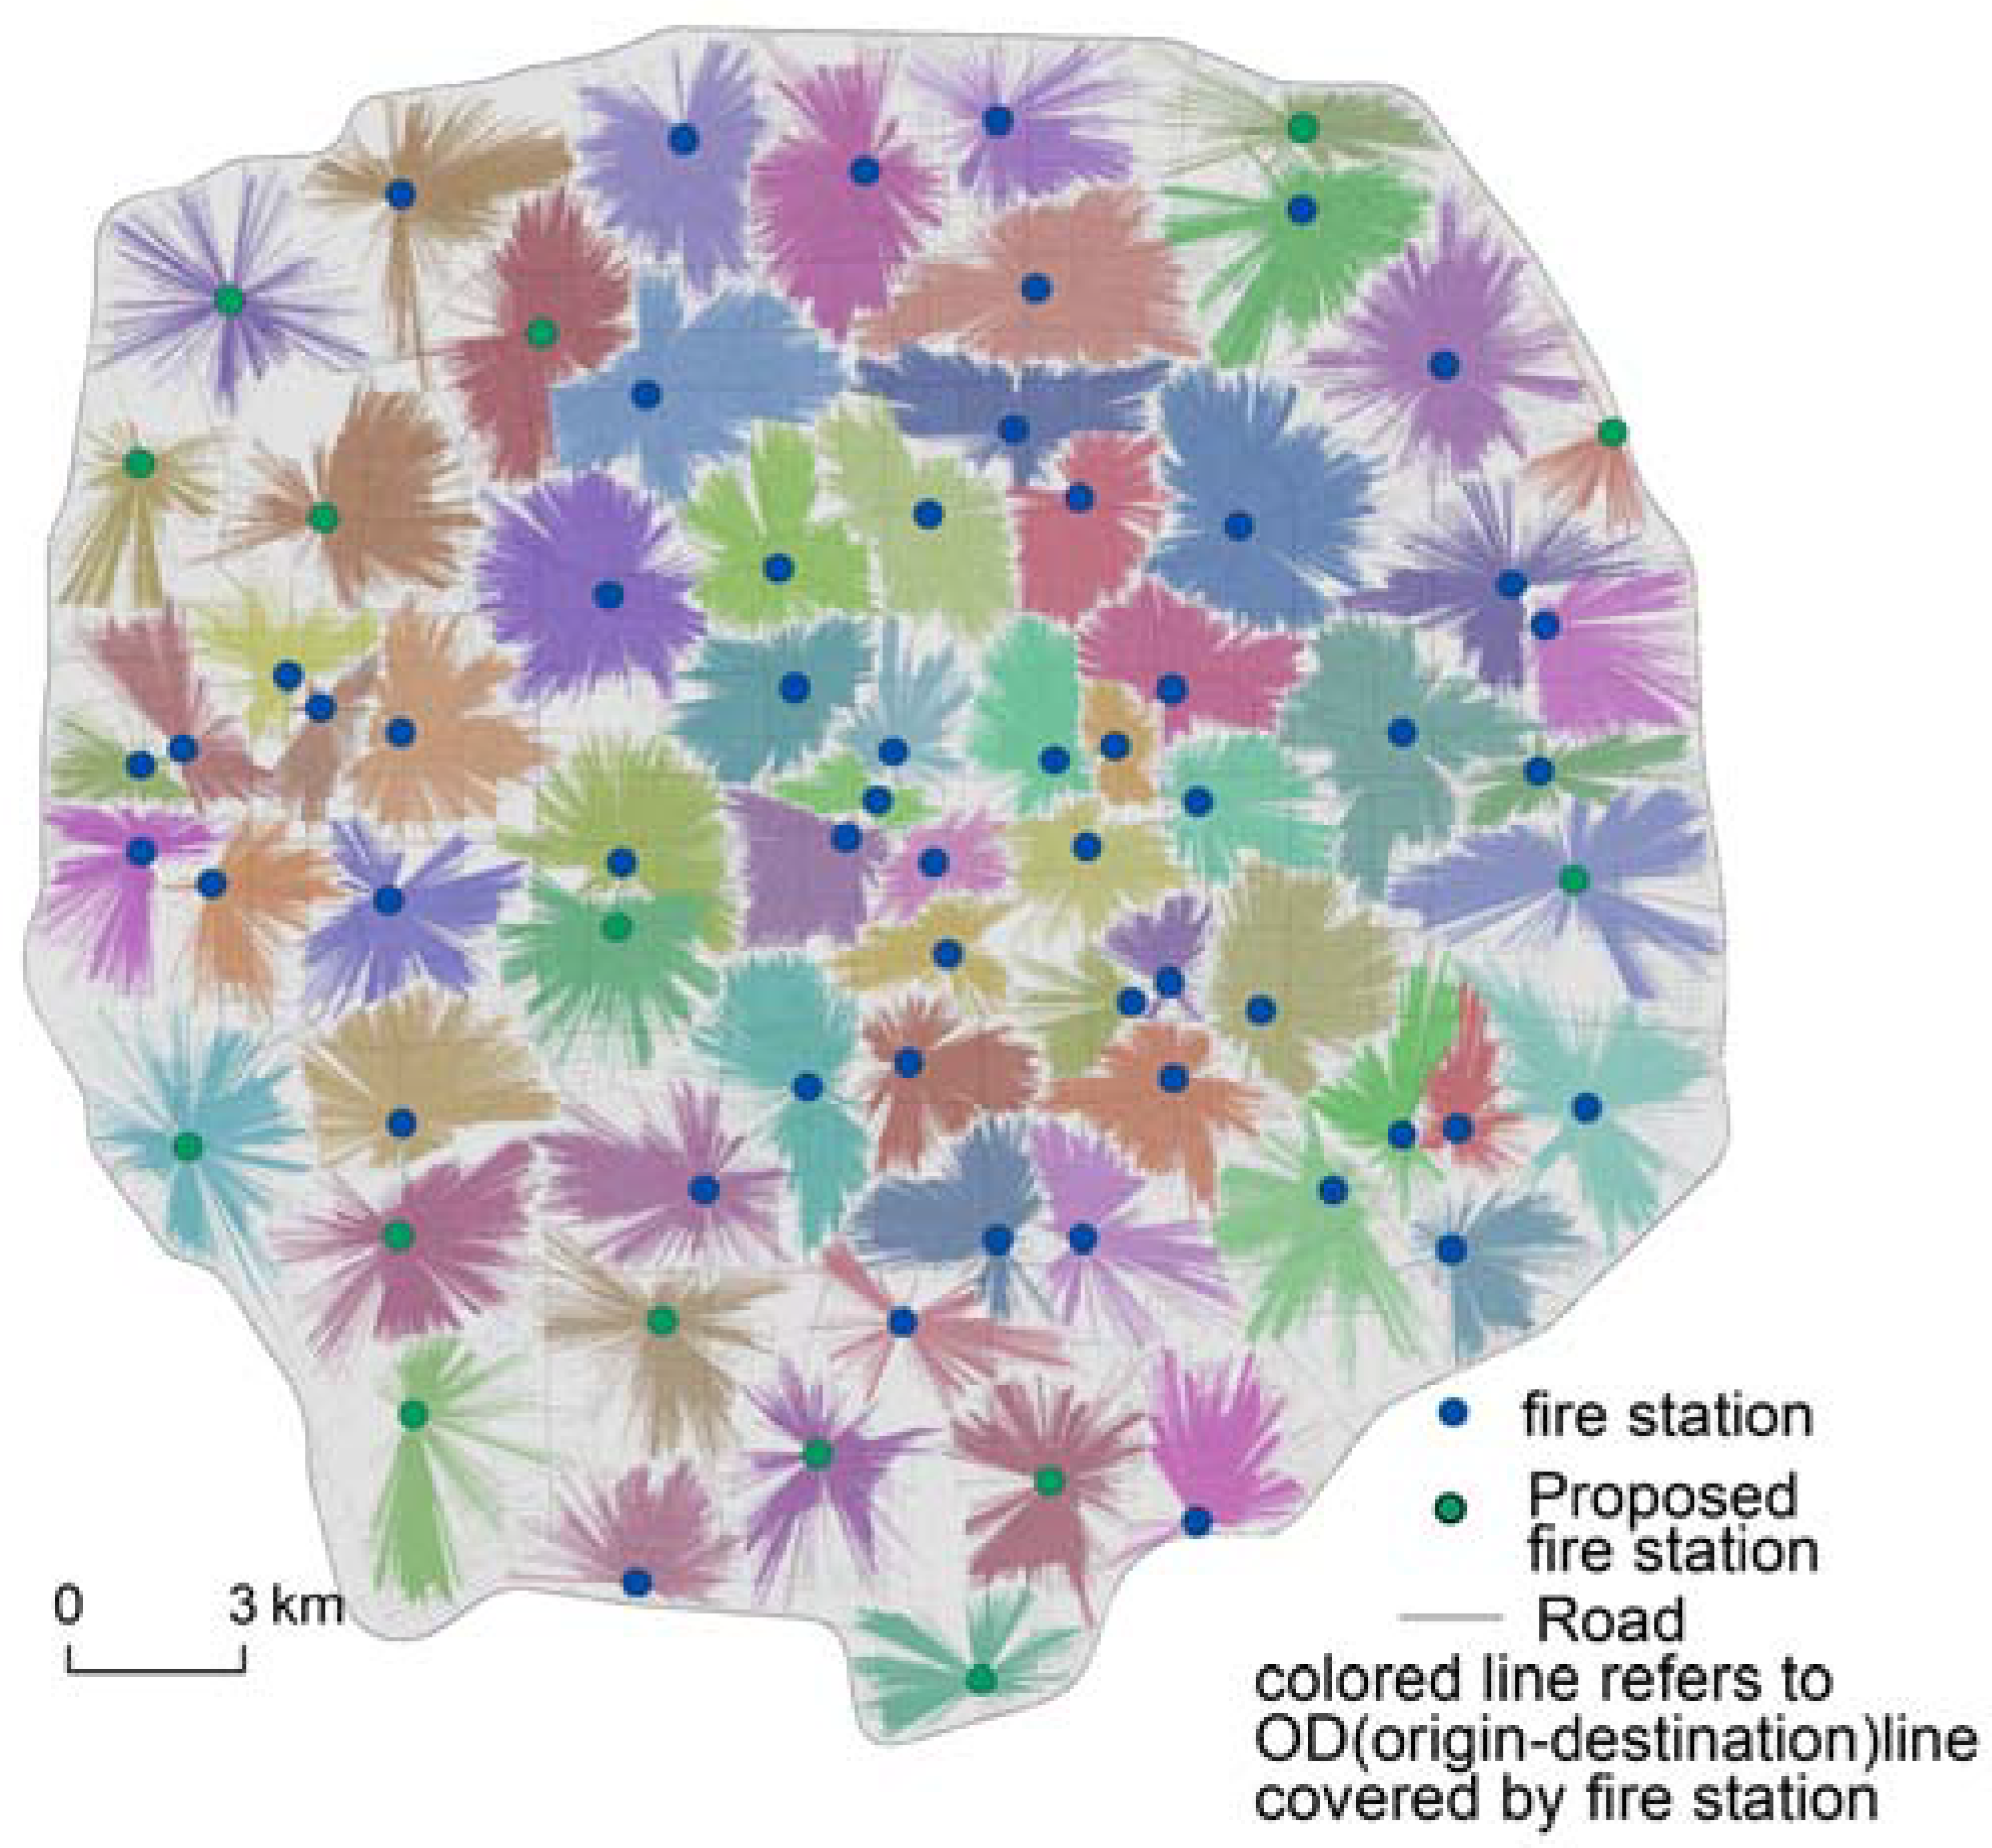
4.3. Spatial Optimization of Fire Stations within the Study Area

We considered coverage in high fire risk areas as well as in zones comprising important fire risk types, total coverage of POI, total area coverage, and the coverage area of individual fire stations in order to optimize facilities within the study area by L-A model. A fire station candidate set was, therefore, initially established as the study area was divided into a 35 by 35 grid on the basis of boundary data and 930 candidate points were obtained. It is necessary to point out that the traffic data used for this section are quarterly average values.
(1) Idealized fire station coverage predictions. A number of initial predictions were made without considering restrictions within each area in addition to manpower and material resources for each fire station. This approach enabled an optimal prediction to be made for the location of each fire station based on the “Minimize Facilities” algorithm. In this case, each fire station is able to cover as many POI as possible within a five-minute response time, while also minimizing the total number of facilities. In this section, two methods were conducted for the calculation of “Minimize Facilities” model to optimize the distribution and number of new fire stations, including: (i) only use the candidate points of fire station without considering the existing stations; and (ii) include the 56 existing fire stations in the evaluation. The former approach can help to establish the minimum number of stations that meet the fire-fighting demand of the study area, while use of the latter method can be useful to optimize the selection of new stations opening under existing circumstances. Calculations show that while the first approach necessitates a total of 46 fire stations, the second requires a total of 80; There are 56 fire stations in the study areas, which is within the range of the maximum and minimum values. Although its number is reasonable, in terms of the spatial distribution, it can be found that the distribution of fire stations in some central and western parts of the study area is denser. The idealized model was built under the premise of not considering the area of the fire station, and human and material resources and other factors. In an actual situation, these factors should be considered alongside differences in fire risk and land use across the study area. Future analysis could incorporate these variables by not changing existing fire stations and by emphasizing the number and optimal location of new facilities.
(2) Fire station optimization for coverage of high fire risk areas and important risk types. One goal of this study was to ensure complete coverage of key fire risk areas. High fire risk areas were, therefore, defined as the first 30% within identified fire risk zones (Figure 5); in this context, the important fire risk types comprise the “flammable and explosive” categories and the “key protection” categories (Table 1). The specific optimization index was set to increase the coverage rate within 5 min response time of high fire risk area to over 99.9%, and increase the total coverage rate within 5 min response time of important fire risk types to over 98%. Data show that the coverage rate for all 56 fire stations within the high fire risk area is 99.10%, while an area of blind coverage is located in the area of Shijicheng. The total coverage rate of important fire risk types based on existing fire stations is 96.73% and that blind areas with no coverage are mainly located within the Xishan and Jinxingxiang, areas covered by the 11th and 12th district of Zongbujidi, and in the area of Shijicheng. In contrast, simulations using the “Maximize Coverage” model suggest that when a new fire station is added near to the intersection between the Changqingyuan and Xingshikou roads, coverage of high fire risk areas and important fire risk types is increased to 99.89% and 97.65%, respectively. Indeed, the further addition of a fire station near to the Beijing World Park increases the coverage rate of high fire risk areas and coverage rate of important fire risk types to 99.93% and 98.10%, fulfilling the optimization goal of this study.
(3) Fire station optimization for total POI and area coverage rates. Another goal of this study was to improve the overall coverage of fire stations within the study area. In this context, total POI coverage rate refers to the proportion of the total number of such points that can be reached within a response time of five minutes, relative to the overall total number of such points, while total area coverage refers to the minimum geometric boundary (i.e., convex hull) area of all covered points within this response time divided by the total study area. Note that it is first necessary to merge the overlapping parts of different convex hulls to calculate the coverage of the whole area. According to the actual situation in the study area, the specific optimization index is to increase the total POI coverage rate to more than 98% and the total area coverage to more than 90%. Results reveal that the total POI coverage of the existing 56 fire stations within the study area is 96.51%, and that coverage in northwest, southwest, and southern areas remains insufficient. Simulations based on the “Maximize Coverage” model show that when a new fire station is set up adjacent to the intersection between the Changqingyuan and Xingshikou roads, the total coverage rate rises to 97.56%, while if a new facility is added near to the Beijing World Park, a total of 435,203 POI are covered. In this case, the total POI coverage rate reaches 98.15%, meeting the optimization target. The total area coverage of existing fire stations is 86.01%; use of the “Maximize Coverage” model to simulate a new fire station adjacent to the intersection between the Changqingyuan and Xingshikou roads increases the total area coverage rate to 87.72%, while the development of a second new facility next to the Beijing World Park increases the total area coverage rate to 89.67%. The development of a third new fire station to the southeast of Nanyuan airport is sufficient to increase the total area coverage rate to 90.79%, again meeting the optimization goal of this study.
(4) Optimizing the coverage area of individual fire stations. Current data show that the existing area of jurisdiction for individual fire station are far below Chinese “Urban Fire Station Construction Standards”, and so the purpose of this paragraph is to develop solutions to ensure that these areas can be extended to the requisite levels. The specific optimization index in this case is that the coverage area of all sites is not less than the required lower limit standard, 15 km2. Data show that subsequent to the optimization of the steps mentioned above, 17 out of 59 total fire stations do not meet these standards. The method used in the adjustment is to calculate the location of fire stations one by one according to their coverage area size (from large-to-small) by the method of “Minimize Impedance”. When calculating, one or two new fire stations will be added according to the size of the coverage area. After each calculation is completed, the “Maximize Coverage” model needs to be used to recalculate the convex hull covered by each fire station. The iteration process was then continued to address the next largest area, until each fire station has a coverage area of less than 15 km2. It is also noteworthy that if a site within an area of adjustment is an existing fire station, then this site will remain unchanged because of the larger costs of reconstruction and relocation. However, if the site within an adjustment area is a new site added by the steps above, then this facility can be deleted and relocated; similarly, if adjustments are made to a region, uncovered POI within the surrounding area were also included within the re-calculated area. On the basis of this process, after 12 iterations, 15 fire stations were added to the existing 56 within the study area taking the current situation into account. The coverage area of all the stations following the removal of overlapping regions conformed with the 15 km2 lower coverage limit and thus the objectives of this study were achieved.
As a result of all the processing steps described above, the coverage of high fire risk areas, important fire risk types, total POI and area coverage, and the coverage area of individual fire stations have all been assessed. Our use of three L-A models, “Maximize Coverage”, “Minimize Facilities”, and “Minimize Impedance” enabled convergence to a final optimized solution for fire stations within the study area. Thus, building on the existing 56 stations within the study area, this research proposes the addition of 15 new facilities to generate the distribution shown in Figure 8. Results show that if the number of stations within the study area is increased to 71 then 99.73% of all POI can be reached within a response time of five minutes. This increased number of fire stations would also mean that 96.63% of study areas could be reached within this response time, encompassing 99.98% and 99.42% of high fire risk areas (i.e., the top 30%) and important fire risk types sites (“flammable and explosive” and “key protection”), respectively. The areas of jurisdiction of all these fire stations also would achieve the 15 km2 standard stipulated in Chinese “Urban Fire Station Construction Standards”; these optimized fire stations, together with community fire studios and volunteer brigades (not considered in this article) would be sufficient to meet the disaster needs of this study area.

5. Discussion and Conclusions

5.1. Discussion

Fire safety is an important component of urban safety, and thus the locations and spatial optimization of fire stations are critical. In mega-cities such as Beijing, land-use and building function are subject to frequent changes, hence a complete picture of risk profiles is likely to be lacking. Challenges for prevention can be overwhelming for city managers and emergency responders. Since POI has a high degree of completeness and timeliness for the expression of geographic locations, our article demonstrates the potential and value of POI in urban fire risk assessment. Moreover, we also addressed the necessity of the multi-scenario traffic situation in fire station assessment and site selection. Although Beijing is only one type of mega city, the POI and MTS data have almost covered most of the mega cities with the development of Internet maps, which means that the framework of this article can be transferred to other types of mega city. Meanwhile, local characteristics should also be considered during the transfer process. Mega cities are complex dynamic giant systems, which also means that there are still some issues that remain unsolved. First, population flow also needs to be addressed and added to fire risk considerations. Second, as POI are unable to express the geometric contours of buildings, this may influence the estimated accuracy of firefighting areas. Moreover, the fire risks of specific spaces expressed by the same type of POI may be different. For example, the fire risk of a warehouse is affected by the goods in it, while this more detailed information is still difficult to obtain. Lastly, the intensity, scale, and frequency of fire disasters also need to be further investigated using historical data if they are to be included with accuracy within future risk assessments. We believe that with the development of information and communication technology, the emergence of more new data will provide ideas for solving these problems.

5.2. Conclusions

The investigation presented in this study has addressed the optimization of fire stations within the central area of Beijing, inside the fifth ring road. This study first shows that POI data can be used to effectively summarize all facilities within a building and identify the distribution of fire risk. We then identified several high fire risk hotspots in central Beijing: such as “Sanlitun-Guomao”, “Ditan-Nanluogu-Wangfujing”, etc. Secondly, MTS data helped us analyze the coverage of current fire stations under different traffic situations (e.g., normal or rush hour on weekdays and weekend, etc.). We found that although the current fire stations exhibit a good overall coverage under the quarterly average traffic situation, areas such as “Wudaokou-Mudanyuan” and “Shuangjiang-Baiziwan” cannot be covered during the daily rush hour. Finally, considering high fire risk area coverage, as well as important fire risk types, total POI and area coverage, the area encompassed by individual fire stations and related national standards, a spatial optimization of facilities within the study area was performed. Therefore, solutions including the number and the optimal location of new fire stations that need to be built are proposed. Our solution can effectively address the existing firefighting problems that characterize the urban fire stations within this region of Beijing.

Author Contributions

Conceptualization, Wenda Wang and Zhibang Xu; methodology, Wenda Wang and Zhibang Xu; validation, formal analysis, investigation, Wenda Wang; resources, Zhibang Xu, Dongqi Sun and Ting Lan; writing—original draft preparation, Wenda Wang; writing—review and editing, Zhibang Xu, Dongqi Sun and Ting Lan; supervision, project administration, Dongqi Sun. All authors have read and agreed to the published version of the manuscript.

Funding

This research was funded by National Natural Science Foundation of China (Grant No. 41971162).

Institutional Review Board Statement

Not applicable.

Informed Consent Statement

Not applicable.

Data Availability Statement

The data used in this study are available from the corresponding author upon reasonable request.

Acknowledgments

The authors would like to thank the anonymous reviewers for their helpful and valuable comments and suggestions.

Conflicts of Interest

The authors declare no conflict of interest.

References

  1. Xue, D.; Zeng, X. Evaluation of China’s urbanization quality and analysis of its spatial pattern transformation based on the modern life index. Acta Geogr. Sin. 2016, 71, 194–204. [Google Scholar] [CrossRef]
  2. Zhou, L.; Dang, X.; Sun, Q.; Wang, S. Multi-scenario simulation of urban land change in Shanghai by random forest and CA-Markov model. Sustain. Cities Soc. 2020, 55, 102045. [Google Scholar] [CrossRef]
  3. Hogg, J.M. The Siting of Fire Stations. OR 1968, 19, 275. [Google Scholar] [CrossRef]
  4. Walter, H. Urban Systems Models; Academic Press: New York, NY, USA, 1975; ISBN 978-0-12-339450-7. [Google Scholar]
  5. Plane, D.R.; Hendrick, T.E. Mathematical Programming and the Location of Fire Companies for the Denver Fire Department. Oper. Res. 1977, 25, 563–578. [Google Scholar] [CrossRef]
  6. Reilly, J.M.; Mirchandani, P.B. Development and application of a fire station placement model. Fire Technol. 1985, 21, 181–198. [Google Scholar] [CrossRef]
  7. Habibi, K.; Lotfi, S.; Koohsari, M.J. Spatial analysis of urban fire station location by integrating AHP model and IO logic using GIS (a case study of zone 6 of Tehran). J. Appl. Sci. 2008, 8, 3302–3315. [Google Scholar] [CrossRef]
  8. Erden, T.; Coşkun, M.Z. Multi-criteria site selection for fire services: The interaction with analytic hierarchy process and geographic information systems. Nat. Hazards Earth Syst. Sci. 2010, 10, 2127–2134. [Google Scholar] [CrossRef]
  9. Chaudhary, P.; Chhetri, S.K.; Joshi, K.M.; Shrestha, B.M.; Kayastha, P. Application of an Analytic Hierarchy Process (AHP) in the GIS interface for suitable fire site selection: A case study from Kathmandu Metropolitan City, Nepal. Socioecon. Plann. Sci. 2016, 53, 60–71. [Google Scholar] [CrossRef]
  10. Murray, A.T.; Tong, D. GIS and spatial analysis in the media. Appl. Geogr. 2009, 29, 250–259. [Google Scholar] [CrossRef]
  11. Murray, A.T. Optimising the spatial location of urban fire stations. Fire Saf. J. 2013, 62, 64–71. [Google Scholar] [CrossRef]
  12. Chevalier, P.; Thomas, I.; Geraets, D.; Goetghebeur, E.; Janssens, O.; Peeters, D.; Plastria, F. Locating fire stations: An integrated approach for Belgium. Socioecon. Plann. Sci. 2012, 46, 173–182. [Google Scholar] [CrossRef] [Green Version]
  13. Badri, M.A.; Mortagy, A.K.; Alsayed, C.A. A multi-objective model for locating fire stations. Eur. J. Oper. Res. 1998, 110, 243–260. [Google Scholar] [CrossRef]
  14. Yang, L.; Jones, B.F.; Yang, S.-H. A fuzzy multi-objective programming for optimization of fire station locations through genetic algorithms. Eur. J. Oper. Res. 2007, 181, 903–915. [Google Scholar] [CrossRef] [Green Version]
  15. Schreuder, J.A.M. Application of a location model to fire stations in Rotterdam. Eur. J. Oper. Res. 1981, 6, 212–219. [Google Scholar] [CrossRef] [Green Version]
  16. Kanoun, I.; Chabchoub, H.; Aouni, B. Goal Programming Model for Fire and Emergency Service Facilities Site Selection. INFOR Inf. Syst. Oper. Res. 2010, 48, 143–153. [Google Scholar] [CrossRef] [Green Version]
  17. Liu, N.; Huang, B.; Chandramouli, M. Optimal Siting of Fire Stations Using GIS and ANT Algorithm. J. Comput. Civ. Eng. 2006, 20, 361–369. [Google Scholar] [CrossRef] [Green Version]
  18. Chen, C.; Ren, A. Optimization of fire station locations using computer. Qinghua Daxue Xuebao/J. Tsinghua Univ. 2003, 1390–1393. [Google Scholar] [CrossRef]
  19. Yu, Y.; Guo, Q.; He, J.; Yuan, Y. Gradual optimization of Urban fire station location based on geographical network attribute. Geomat. Inf. Sci. Wuhan Univ. 2005, 30, 332–336. [Google Scholar] [CrossRef]
  20. Guang Zhang Urban fire risk evaluation and its application based on spatial analysis: A case study of Xi’an. City Plan. Rev. 2016, 40, 59–64. [CrossRef]
  21. Li, X.; Xu, G.; Chen, E.; Zong, Y. Learning recency based comparative choice towards point-of-interest recommendation. Expert Syst. Appl. 2015, 42, 4274–4283. [Google Scholar] [CrossRef]
  22. Yao, Y.; Li, X.; Liu, X.; Liu, P.; Liang, Z.; Zhang, J.; Mai, K. Sensing spatial distribution of urban land use by integrating points-of-interest and Google Word2Vec model. Int. J. Geogr. Inf. Sci. 2017, 31, 825–848. [Google Scholar] [CrossRef]
  23. Milias, V.; Psyllidis, A. Assessing the influence of point-of-interest features on the classification of place categories. Comput. Environ. Urban Syst. 2021, 86, 101597. [Google Scholar] [CrossRef]
  24. Martí, P.; Serrano-Estrada, L.; Nolasco-Cirugeda, A. Social Media data: Challenges, opportunities and limitations in urban studies. Comput. Environ. Urban Syst. 2019, 74, 161–174. [Google Scholar] [CrossRef]
  25. Xiong, X.; Qiao, S.; Li, Y.; Han, N.; Yuan, G.; Zhang, Y. A point-of-interest suggestion algorithm in Multi-source geo-social networks. Eng. Appl. Artif. Intell. 2020, 88, 103374. [Google Scholar] [CrossRef]
  26. Zhu, D.; Wang, N.; Wu, L.; Liu, Y. Street as a big geo-data assembly and analysis unit in urban studies: A case study using Beijing taxi data. Appl. Geogr. 2017, 86, 152–164. [Google Scholar] [CrossRef]
  27. McKenzie, G.; Janowicz, K. Where is also about time: A location-distortion model to improve reverse geocoding using behavior-driven temporal semantic signatures. Comput. Environ. Urban Syst. 2015, 54, 1–13. [Google Scholar] [CrossRef]
  28. Meng, X.; Zhang, K.; Pang, K.; Xiang, X. Characterization of spatio-temporal distribution of vehicle emissions using web-based real-time traffic data. Sci. Total Environ. 2020, 709, 136227. [Google Scholar] [CrossRef]
  29. Goodchild, M.F. Citizens as sensors: The world of volunteered geography. GeoJournal 2007, 69, 211–221. [Google Scholar] [CrossRef] [Green Version]
  30. Alibaba Group. AutoNavi Open Map Platform. Available online: http://lbs.amap.com/ (accessed on 21 August 2017).
  31. Baidu China. Baidu Maps Platform. Available online: http://lbsyun.baidu.com/ (accessed on 21 August 2017).
  32. Tecent Company. Tencent Location Services. Available online: https://lbs.qq.com/ (accessed on 21 August 2017).
  33. Lloyd, C.T. High Resolution Global Gridded Data for Use in Population Studies. ISPRS-Int. Arch. Photogramm. Remote Sens. Spat. Inf. Sci. 2017, XLII-4/W2, 117–120. [Google Scholar] [CrossRef] [Green Version]
  34. Beijing Municipal Bureau Statistics. Beijing Statistical Yearbook. Available online: http://tjj.beijing.gov.cn/ (accessed on 1 January 2020).
  35. Kim, M.O.; Kim, K.; Yun, J.H.; Kim, M.K. Fire risk assessment of cable bridges for installation of firefighting facilities. Fire Saf. J. 2020, 115, 103146. [Google Scholar] [CrossRef]
  36. Silverman, B.W. Density Estimation for Statistics and Data Analysis; CRC Press: Boca Raton, FL, USA, 1986; ISBN 0-412-24620-1. [Google Scholar]
  37. Loh, D.K.; Hsieh, Y.-T.C.; Choo, Y.K.; Holtfrerich, D.R. Integration of a rule-based expert system with GIS through a relational database management system for forest resource management. Comput. Electron. Agric. 1994, 11, 215–228. [Google Scholar] [CrossRef]
  38. Loh, D.K.; Holtfrerich, D.R.; Van Stipdonk, S.E.P. Automated construction of rulebases for forest resource planning. Comput. Electron. Agric. 1998, 21, 117–133. [Google Scholar] [CrossRef]
  39. Cooper, L. Location-Allocation Problems. Oper. Res. 1963, 11, 331–343. [Google Scholar] [CrossRef]
  40. Menezes, R.C.; Pizzolato, N.D. Locating Public Schools in Fast Expanding Areas: Application of the Capacitated p-Median and Maximal Covering Location Models. Pesqui. Oper. 2014, 34, 301–317. [Google Scholar] [CrossRef] [Green Version]
  41. Zarrinpoor, N.; Fallahnezhad, M.S.; Pishvaee, M.S. Design of a reliable hierarchical location-allocation model under disruptions for health service networks: A two-stage robust approach. Comput. Ind. Eng. 2017, 109, 130–150. [Google Scholar] [CrossRef]
  42. Rahman, M.; Chen, N.; Islam, M.M.; Dewan, A.; Pourghasemi, H.R.; Washakh, R.M.A.; Nepal, N.; Tian, S.; Faiz, H.; Alam, M.; et al. Location-allocation modeling for emergency evacuation planning with GIS and remote sensing: A case study of Northeast Bangladesh. Geosci. Front. 2021, 12, 101095. [Google Scholar] [CrossRef]
Figure 1. The case study area within the fifth ring road of Beijing, China.
Ijgi 10 00282 g001
Figure 2. Flowchart for identifying fire risk zones.
Ijgi 10 00282 g002
Figure 3. Flowchart to generate a multi-scenario road network.
Ijgi 10 00282 g003
Figure 4. Kernel density distribution results for kinds of fire risks (Natural Breaks (Jenks) method).
Ijgi 10 00282 g004
Figure 5. The spatial distribution of fire risk zones within the fifth ring road of Beijing (the central urban area).
Ijgi 10 00282 g005
Figure 6. Average vehicle speeds at different times within the study area (left) and ranges on different road (right).
Ijgi 10 00282 g006
Figure 7. Zones with coverage within five minutes from existing fire stations under different time-traffic conditions.
Ijgi 10 00282 g007
Figure 8. The distribution of fire stations within the study area following optimization.
Ijgi 10 00282 g008
Table 1. Fire risk classification for different facilities.
Fire RiskIncluded Points of Interest (POI)
“Flammable and
explosive”
Filling and natural gas stations, chemical plant, industrial park, and warehouses
“Vulnerable
population”
Schools (i.e., kindergartens, primary and middle schools), hospitals (i.e., clinics, and disease prevention institutions), and baby service locations (i.e., baby swimming pool, maternity and midwife facilities)
“People crowded”Commercial areas (i.e., shopping malls, commercial streets, and entertainment locations), and transportation hubs (i.e., airports, railway, car, and city bus stations)
“Key protection”Government buildings (i.e., at the county level and above), foreign institutions, legislative, judicial, police, and scientific research institutions, as well as libraries, museums, archives, and historic sites
“General fire protection”Residential areas, Office Building, companies (excluding chemical plants and warehouses), industrial parks (excluding industrial parks), restaurants, public facilities, banks, hotels, convenience stores, sports leisure and life service sites, logistical courier locations (excluding warehouses), park plazas, government buildings (below the county level), colleges, and medical sales sites
“Emergency shelter”Emergency shelters/refuges
Table 2. Mathematical description of the three L-A algorithms applied in this study
Maximize CoverageMinimize FacilitiesMinimize Impedance
objective
function
Maximize i a i y i Minimize j J c j x j Minimize t = 1 n j = 1 n a i d i j x i j
subject to j N i x j y i i
j x j = p
x j = { 0 , 1 } j
y i = { 0 , 1 } i
j J x j 1 j J
x j { 0 , 1 } , j J
j = 1 n x i j = 1 ; i = 1 , 2 , 3 , , n
x i j y j ; i , j = 1 , 2 , 3 , , n
j = 1 n y j = p
x i j , y j { 0 , 1 } i , j = 1 , 2 , 3 , n
Table 3. Coverage index results for existing Beijing fire stations under different traffic conditions.
TimeTotalFire Risk Zone Coverage RateCoverage of Various Fire Risk Types
POI CoverageTop
10%
Top
30%
Top
50%
“Flammable and Explosive”“Vulnerable Population”“People Crowded”“Key Protection”
Weekdays 00:0093.42%97.46%97.46%95.06%80.04%91.71%91.96%94.33%
Weekdays 09:0082.01%92.97%92.97%83.95%65.45%80.08%80.38%78.61%
Weekdays 18:0071.43%80.90%80.90%73.15%60.30%70.05%70.38%68.48%
Weekends 00:0093.06%96.66%96.66%94.75%79.61%91.42%91.36%93.82%
Weekends 10:0081.21%90.76%90.76%83.31%64.16%79.92%79.85%79.37%
Weekends 19:0080.63%88.77%88.77%82.60%65.02%79.23%79.38%80.05%
Quarterly average96.51%100%100%97.85%87.77%95.98%95.38%97.11%
Publisher’s Note: MDPI stays neutral with regard to jurisdictional claims in published maps and institutional affiliations.

