
Geospatial Analysis of Solar Energy in Riyadh Using a GIS-AHP-Based Technique


Information Technology Department, College of Computer and Information Sciences, King Saud University, Riyadh 145111, Saudi Arabia
*
Author to whom correspondence should be addressed.
ISPRS Int. J. Geo-Inf. 2021, 10(5), 291; https://0-doi-org.brum.beds.ac.uk/10.3390/ijgi10050291
Submission received: 24 March 2021
/
Revised: 22 April 2021
/
Accepted: 1 May 2021
/
Published: 3 May 2021
(This article belongs to the Special Issue Geographical Analysis, Urban Modelling, Spatial Statistics, Econometric and Multidimensional Evaluation in Urban Environment)
Abstract
:In recent years, spatial multi-criteria decision analysis (MCDA) has been applied to different types of spatial problems, such as solar power site suitability. MCDA can be used to support the process of identifying suitable regions for solar energy projects. To the best of our knowledge, no study has addressed the problem of site evaluation for solar photovoltaic PV systems in the Riyadh region. Therefore, a spatial MCDA framework is proposed to perform a geospatial analysis of solar energy in the Riyadh region, which includes data collection, spatial analysis, a spatial decision support system and visualization. The methodology that was used to solve the site suitability problem is described. It involved the combination of a Geographical Information System (GIS) and the Analytic Hierarchy Process (GIS-AHP). The results show that the most suitable sites are in the north and northwest of the Riyadh region, with an area that represents 16,748 Km2 with an 80% suitability degree. In addition, it was proven that Afif is the largest suitable city. It has high solar radiation, at an average of 2.631687 MWh/m2/year, and low temperatures, at an average of 26.3 °C, as well as having flat areas with a slope under 5°. The results were validated using a sensitivity analysis model and also compared with those for ground-based stations.
Keywords:
GIS; spatial analysis; MCDM; solar energy; photovoltaic; site evaluation; geospatial; MCDA; site suitability; AHP; remote sensing1. Introduction
Our planet is facing critical threats due to environmental pollution and global warming [1]. A large amount of CO2 has been released into the atmosphere as a result of the combustion of fossil fuels for energy generation [2]. Applicable solutions for environmental crises caused by conventional energy sources are offered by the increasing adoption of renewable energy sources. Sustainable environment and safety are the main characteristics of renewable energy. In this regard, solar energy is one such safe, clean, and substantial renewable energy source. Saudi Arabia is an attractive site for solar energy projects, and it is has a large amount of solar resources, thus encouraging researchers and building projects. Additionally, Saudi Arabia is aiming to include around 40 GW of renewable energy generation from solar PV technologies by 2030 [3]. The demand for electricity in Saudi Arabia has increased in recent years [4]. Therefore, solar energy is essential to support energy production. However, the cost of installation for solar energy projects is very high. Therefore, there is a need to conduct research that analyzes the amount of solar energy obtainable in different places before the installation of a solar energy project. This can contribute to reducing the cost of the operation stage.
It should be mentioned that few studies have been conducted in the field of solar energy in Saudi Arabia. Additionally, no spatial analysis has been conducted on solar energy in the Riyadh region; therefore, this creates a research gap that needs to be filled.
A number of studies have been conducted in the field to examine site suitability for solar energy projects. Studies, such as those in [5,6,7,8], have been conducted in a variety of different areas, including Aswan, Mauritius, the Amhara Region and the southeast US, using various methods including a Geographical Information System (GIS) paired with the Analytic Hierarchy Process technique (GIS-AHP), the Technique for Order of Preference by Similarity to Ideal Solution (GIS-TOPSIS), and the Fuzzy Analytical Hierarchy process (GIS-FAHP). In Saudi Arabia, to our knowledge, the only studies conducted in the same field are [9,10,11]. Furthermore, despite the natural interest in photovoltaic energy in the region, no-one, to the best of our knowledge, has yet considered the Riyadh region as a study area for such work. The aim of the proposed study is, therefore, to perform a geospatial analysis of solar energy in the Riyadh region in order to evaluate suitable sites for the deployment of solar energy projects. The techniques used in this study will, thus, combine GIS and Multi-Criteria Decision Making (MCDM) methods to perform the most accurate spatial analysis possible.
To sum up, this research aimed to perform a geospatial analysis of solar energy in the Riyadh region in order to evaluate the sites suitable for deploying solar energy projects. The contributions of this research can be presented as follows:
- -
- Conducting a comprehensive review of the related studies in the field of the geospatial analysis of solar energy, categorized into remote sensing techniques, ground-based station techniques and hybrid techniques;
- -
- Developing a GIS-AHP-based technique to perform a spatial analysis of the Riyadh region in order to find suitable sites for solar energy projects;
- -
- Delivering visualization maps to present the sites suitable for solar energy projects in the Riyadh region to assist in decision-making processes.
2. Related Work
In this section, previous research studies conducted in the field of solar energy and site suitability analysis are presented. Site suitability testing, also known as geospatial analysis, is defined as the identification and selection of suitable locations for establishing solar energy projects in order to increase the possibility of project success in terms of maximizing electricity generation [12].
Several different techniques can be used for site evaluation. In terms of site evaluation, techniques include GIS, spatial analysis, visualization and Multi-Criteria Decision Analysis (MCDA). MCDA techniques, developed to support decision making, take into consideration various criteria to solve the problem, including various methods such as AHP, FAHP, TOPSIS, and weighted linear combination (WLC).
In terms of examining sites on a larger scale, a study was conducted by Hassan and Anjali [9] to identify the most suitable sites for PV projects in Saudi Arabia using GIS systems and MCDM techniques. The evaluation criteria in that study were mainly technical criteria, including the amount of solar irradiation and the average air temperature, although economic factors affecting the project cost such as proximity to urban areas, roads and power lines, slope and the aspect of the land were used as additional criteria. The analysis was, thus, performed in four stages. To exclude unsuitable sites, a GIS map overlay technique was used. The criteria were then weighted using the AHP. After that, each candidate site was evaluated using a weighted sum overlay approach, and in the final stage, all unsuitable sites were excluded, and a land suitability index (LSI) was applied to categorize the selected sites according to their level of suitability.
On a smaller scale, research was performed in Aswan [5] to identify potential zones for solar energy around Lake Nasser. This work used AHP techniques in addition to a GIS approach. The results identified the zones most suitable for installing solar energy stations, which covered 20% of the region. However, as this study used a special AHP rating, the rating referred to different ranges of criteria values rather than the criteria themselves. In 2018, Jay et al. [6] examined the best sites for installing solar panels in Mauritius based on numerous factors that were categorized into legal, social, technical, economic environmental, and cultural perspectives. That study used GIS analysis in addition to MCDM techniques, and an AHP algorithm was used to assign the weightings for various criteria. Based on this, three suitable sites were identified on the island for the installation of ground-mounted PV power plants. This research thus contributed to reducing the time, cost, and resources required to evaluate sites for solar PV installation in Mauritius.
In 2020, a site suitability analysis of solar PV power generation was conducted in South Gondar, in the Amhara Region [7]. The research sought to identify a suitable location in Ethiopia for solar energy exploitation, as few researchers have explored solar energy in the area. The technique used to determine site suitability was GIS-based AHP, generating a suitability map indexing of sites. Temperature was not considered in the evaluation criteria used for MCDA in that case.
Dongrong [13] also conducted a site selection analysis for solar panel installation using the GIS-AHP method; however, the study areas selected in that instance were the University of Waterloo main campus and the City of Waterloo in Canada. That study combined microscale and macroscale analyses, with the microscale represented by rooftop installations and the macroscale involving ground-mounted installations at a city-wide level. Monthly and yearly accumulated solar radiation maps of building rooftops were, thus, generated alongside shadow maps produced from solar radiation. However, no land surface features (topography) were considered in the slope and aspect calculations, and no suitability index was produced for the final suitability map.
In 2020, a study was conducted in Indonesia [14] to analyze surface solar irradiance using satellite data in order to identify the optimal locations for solar power plants in the West Kalimantan Province. That study calculated surface solar radiation without consideration of any other factors, using a GIS-AHP model to generate maps to identify potential areas for solar power plants. Multiple software types were used in this methodology, which may have produced errors; the use of a GIS combining all of the required processes, may have been a better option. In 2019, a similar study [15], also using GIS and AHP, was conducted to assess potential sites for PV solar plants in County Kilkenny in southeastern Ireland. However, that study used fewer criteria such as (solar radiation, slope, aspects, roads, and urban areas) for analysis than many similar studies [6,9,10,14].
Continuing the focus on site suitability, a study was conducted in southeastern Spain [16], in response to the recent growth in greenhouse gas (GHG) emissions in Spain. That study evaluated the optimal placement of photovoltaic solar power plants using a combination of GIS and MCDM. Two types of criteria were considered: restrictive criteria and evaluation criteria. The restrictive criteria were used to identify unsuitable areas, while the evaluation criteria were applied to address the suitability problem. The methodology was applied in two phases: in the first phase, an AHP method was used to determine the importance of the different criteria used in the process; then, TOPSIS was used to determine which sites or areas offered results as close as possible to the ideal solution, which, in that study, were determined by expert preferences. In terms of implementation, the GIS used was gvSIG, which has a limitation in that data formats must meet specific requirements. The criteria weighting used in the study, which emphasized the distance to power lines over solar radiation, was also inconsistent with that of most studies in this field.
In 2014, a study [8] was undertaken to explore suitable areas for solar power plant deployment in the southeast US to attempt to encourage growth in PV development in the country. The technique used was the GIS and TOPSIS method. GIS was used initially to perform a site suitability analysis, and then, an overlay was performed to obtain the required results. The technical potential and electricity production of PV systems for each site were calculated, and an MCDA approach using the TOPSIS method was applied to establish an MCDA model to support decision making with regard to solar power planning and deployment. That study identified several feasible areas for large-scale solar plant installation, along with an assessment that the average technical potential in the four states was around 13 GW. The study was, however, designed specifically to meet the minimum conditions to account for all possible feasible areas for PV installation.
Iran offers good potential for PV generation due to its position, available land for solar radiation capture and climate diversity, making it necessary to invest in solar energy site deployment in the region. In [17], the authors identified suitable regions for exploiting solar energy by using GIS with an MCDM approach. There were two main steps in their framework: initially, unsuitable regions were extracted, and then, the most suitable regions were identified. The authors used the FAHP technique to identify appropriate criteria weights and then overlaid these criteria to generate a final map. However, no sensitivity analysis was considered.
In [18], researchers aimed to determine the most suitable location for solar energy across the Sinai Peninsula in Egypt in support of the country’s aim to generate about 20% of its electricity using renewable resources. The technique used was the application of GIS and WLC to produce a suitability map. However, the authors did not provide any specifications or sources for the weights given to the various factors. Another study conducted in Saudi Arabia also used WLC [11] and offered a geospatial analysis combining technical and environmental factors. The methodology integrated these factors to produce a final suitability map; however, no sensitivity analysis was offered.
Table 1 summarizes the related works presented in this section.
Based on the previous research examined, renewable energy is becoming a high priority around the world based on the need to protect the environment by promoting the use of renewable energy sources (RES). Solar energy is one of the most essential RES, and many projects have been conducted to facilitate site evaluation as well as to perform potential assessment. As the cost of installing solar energy stations and panels is very high, there is also a great deal of work on remote sensing and GIS approaches in the research community. As mentioned in [20,21], remote sensing techniques offer accurate results based on validation from ground-based stations. Remote sensing supported by appropriate GIS techniques, therefore, is adopted in the proposed study.
As shown in Table 1, previous research in this field was summarized according to different factors, including the method, study area, data source, GIS tools, results, and validation model. Few studies have been conducted in the field of solar energy analysis in Saudi Arabia; therefore, more research efforts should be focused on this field. In terms of site suitability, three studies have been conducted on a large scale with Saudi Arabia as the study area [9,10,11]. However, no spatial analysis has been performed for solar energy in the Riyadh region; therefore, this creates a gap that needs to be filled by research. Conducting such research will contribute to reducing solar (PV) project development costs.
In addition, most of the studies presented in this section focused on site suitability and spatial analysis, supporting the proposed research, with various MCDM methods used to support spatial analysis decision making.
Multiple-criteria decision making or multiple-criteria decision analysis are techniques that can be used to design, evaluate, and prioritize multiple conflicting criteria to support decision making. MCDM in particular refers to making decisions in the presence of multiple, conflicting criteria. Various MCDA methods have been applied in the field of solar energy—including WLC, TOPSIS, AHP, and FAHP. Other methods such as CRITIC, EDAS, PROMETHEE and WASPAS are also used to support decision making in many aspects of a site suitability analysis, including for wind, water, and telecom towers; however, this study focuses on methods that are suitable for solar energy analysis [22].
Table 2 outlines the strengths and weaknesses of the MCDM methods used for site suitability analysis for solar energy [23]. WLC is a very simple computation process based on a combination of all criteria using given weights; however, it operates only in one dimension. TOPSIS is based on the concept that the best solution should sit at the shortest distance from the positive ideal solution (PIS) and the furthest distance from the negative ideal solution (NIS); the final ranking is determined based on a closeness index [8]. However, this creates inaccurate results if any indicator deviates from the ideal solution, making it less appropriate as compared with AHP. AHP is a structured technique for organization, allowing for the management of multiple factors based on utilizing expert decisions to estimate the weights of factors through a pairwise comparison matrix. AHP values are generally assigned on a scale of 1 to 9. FAHP combines fuzzy theory with AHP methods to deal with uncertainty; triangular fuzzy numbers (TFNs) are used to create pairwise comparisons in the judgment matrix [24]. However, this method does not provide any additional advantage over AHP, as shown by [25].
WLS was used by [11,18,19], which used only one dimension of factors, while in our domain, we need more than one dimension of factors, such as technical and environmental factors, as a hierarchical structure. However, [8,16] used TOPSIS, which has high subjectivity, while AHP was used in [5,6,7,9,13,14,15], with multiple dimensions and a hierarchical structure. This analysis shows that GIS-AHP is the most common method used in site suitability assessments for solar PV projects and that this offers accurate results in comparison with other MCDA methods. This method will, thus, be used to perform the spatial analysis of solar energy in the Riyadh region.
In terms of data sources, based on the reviewed studies, a number of open and free sources are available to support both remote sensing and ground-based approaches. All GISs deal with spatial data; however, as some have restrictions on data formats as well as resolutions that may affect the result accuracy, the data collection process poses some challenges due to the diversity of the datasets and the different data formats used. For the tools used in GIS processing, ArcGIS and ArcGIS Pro are the most commonly used systems, as these are flexible and provide high performance.
Most site suitability studies include solar suitability maps within their results. Some of these classify their results into four categories based on result indexing (highly suitable, moderately suitable, marginally suitable, and unsuitable), while others categorize areas simply as suitable or unsuitable on their maps with no indexing. The results of potential assessment studies include calculations of electricity production for rooftop photovoltaic capacity or any other area potentially available to produce energy. The validation models used to validate results in this field generally incorporate a physical on-site feasibility assessment or a sensitivity analysis. A sensitivity analysis was conducted in order to understand the influence of the individual criteria that make up the model on the final result.
3. Materials and Methods
3.1. Study Area
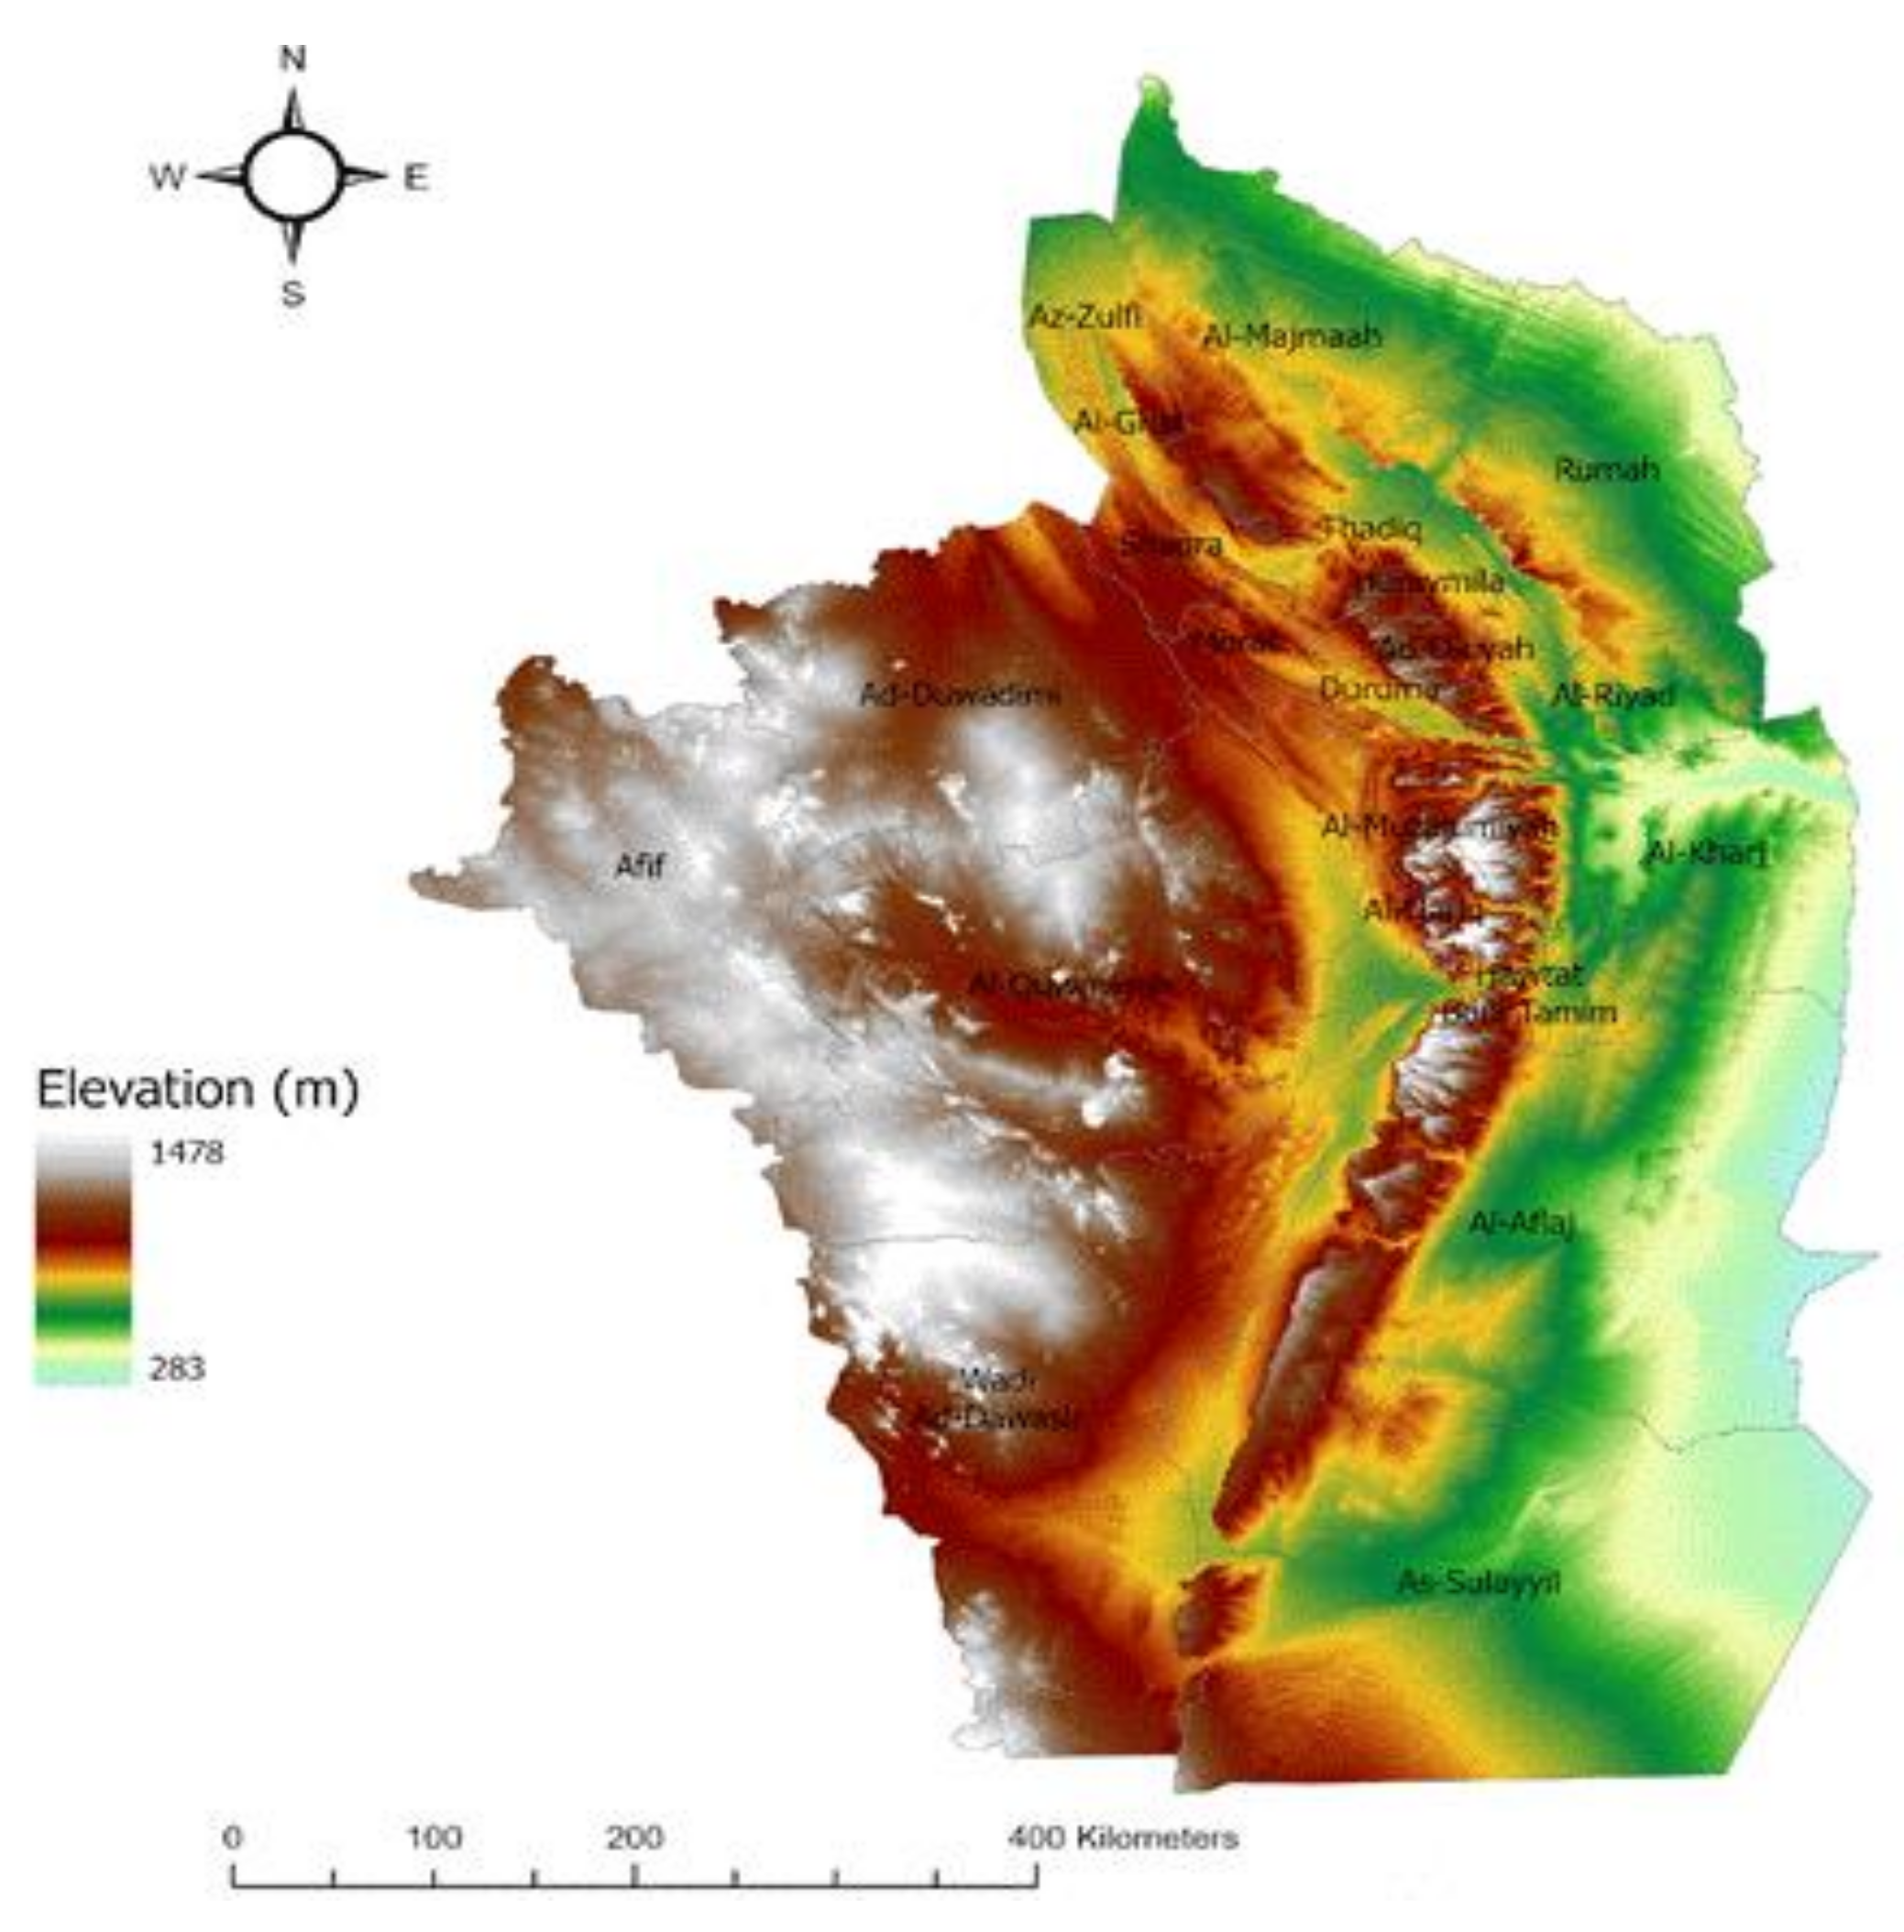
The study area considered in this research is the Riyadh region, which occupies the central parts of Saudi Arabia between degrees of longitude 4200 and 4817 east, and degrees of latitude 1900 and 2745 north. It has an area of around 380,000 km2, and the population in this area is around 8,216,284. The Riyadh region consists of 22 cities and villages. The Riyadh region is dominated by a desert climate, characterized by heat and dryness in the summer and cold in the winter, with medium and unsecured rain. The Riyadh region contains various landforms such as plateaus, deserts, and mountains. It is located on the Najd plateau, which consists of a group of rocky ridges, plateaus, plains and sand seas. As shown in Figure 1, the lowest point is located east of the Dahna desert, which has a height of 283 meters, while the highest point is in the southwestern Tuwaiq Mountains, which have a height of 1478 meters. Riyadh is geographically appropriate because it is located in the so-called sunbelt, with widespread desert land and clear skies over the year, which make it a suitable area for PV projects [26].
The Global Horizontal Irradiance (GHI) in Riyadh averages to about 2200 kWh/m2/year. There has been a high interest since 1960 in developing solar energy projects in Saudi Arabia. As reported from the King Abdullah Petroleum Studies and Research Center (KAPSARC) publication in 2018, the country has one of the largest renewable production capacities in the Gulf Cooperation Council (GCC), accounting for 18% of total GCC solar production [27]. It has an ambitious plan to deploy more renewable energy projects; one of the goals of Saudi Vision 2030 is to achieve environmental sustainability. Saudi Arabia is currently ranked sixth for solar energy potential worldwide. It has recently increased its use of renewable energy, with a focus on solar power. The country’s installed renewable energy capacity as of the end of 2018 was 142 MW, with solar power accounting for 139 MW [28,29].
One of the solar applications developed in Riyadh is a solar village project site located northwest of Riyadh with an area of 50 km, supplying between 1 and 1.5 MWh of electric energy per day to three villages. It was the big8gest project of its type in 1980 and cost USD 18 million [28]. Additionally, recently, the Ministry of Energy in Saudi Arabia announced plans to develop solar projects around Saudi Arabia. These projects will provide electrical power for 600,000 housing units and cut about 7 million tons of greenhouse gas emissions [29,30].
Figure 1.
Study area [31].
Figure 1.
Study area [31].

3.2. Defining Criteria
In the planning process, we identified two types of criteria: evaluation criteria that will be used in the site suitability analysis and constraints that will be used to eliminate the unsuitable areas. Evaluation criteria and constraints were chosen using the designed principles developed by the National Renewable Energy Laboratory (NREL) and previous studies [7,9,13,18]. NREL is a solar energy research institute in Golden, Colorado, US. It has research power, including in the development, testing and deployment of solar projects [18,32]. One of the most important steps in site suitability analysis is identifying factors or criteria used to evaluate suitable locations. Evaluation criteria involve factors that directly affect the performance of the solar power plants and the cost of solar projects. In this field of research, there are common criteria used, such as Global Horizontal Irradiance (GHI), slope, and land cover. However, the criteria differ slightly from one study to another, depending on the study area and the researchers’ point of view.
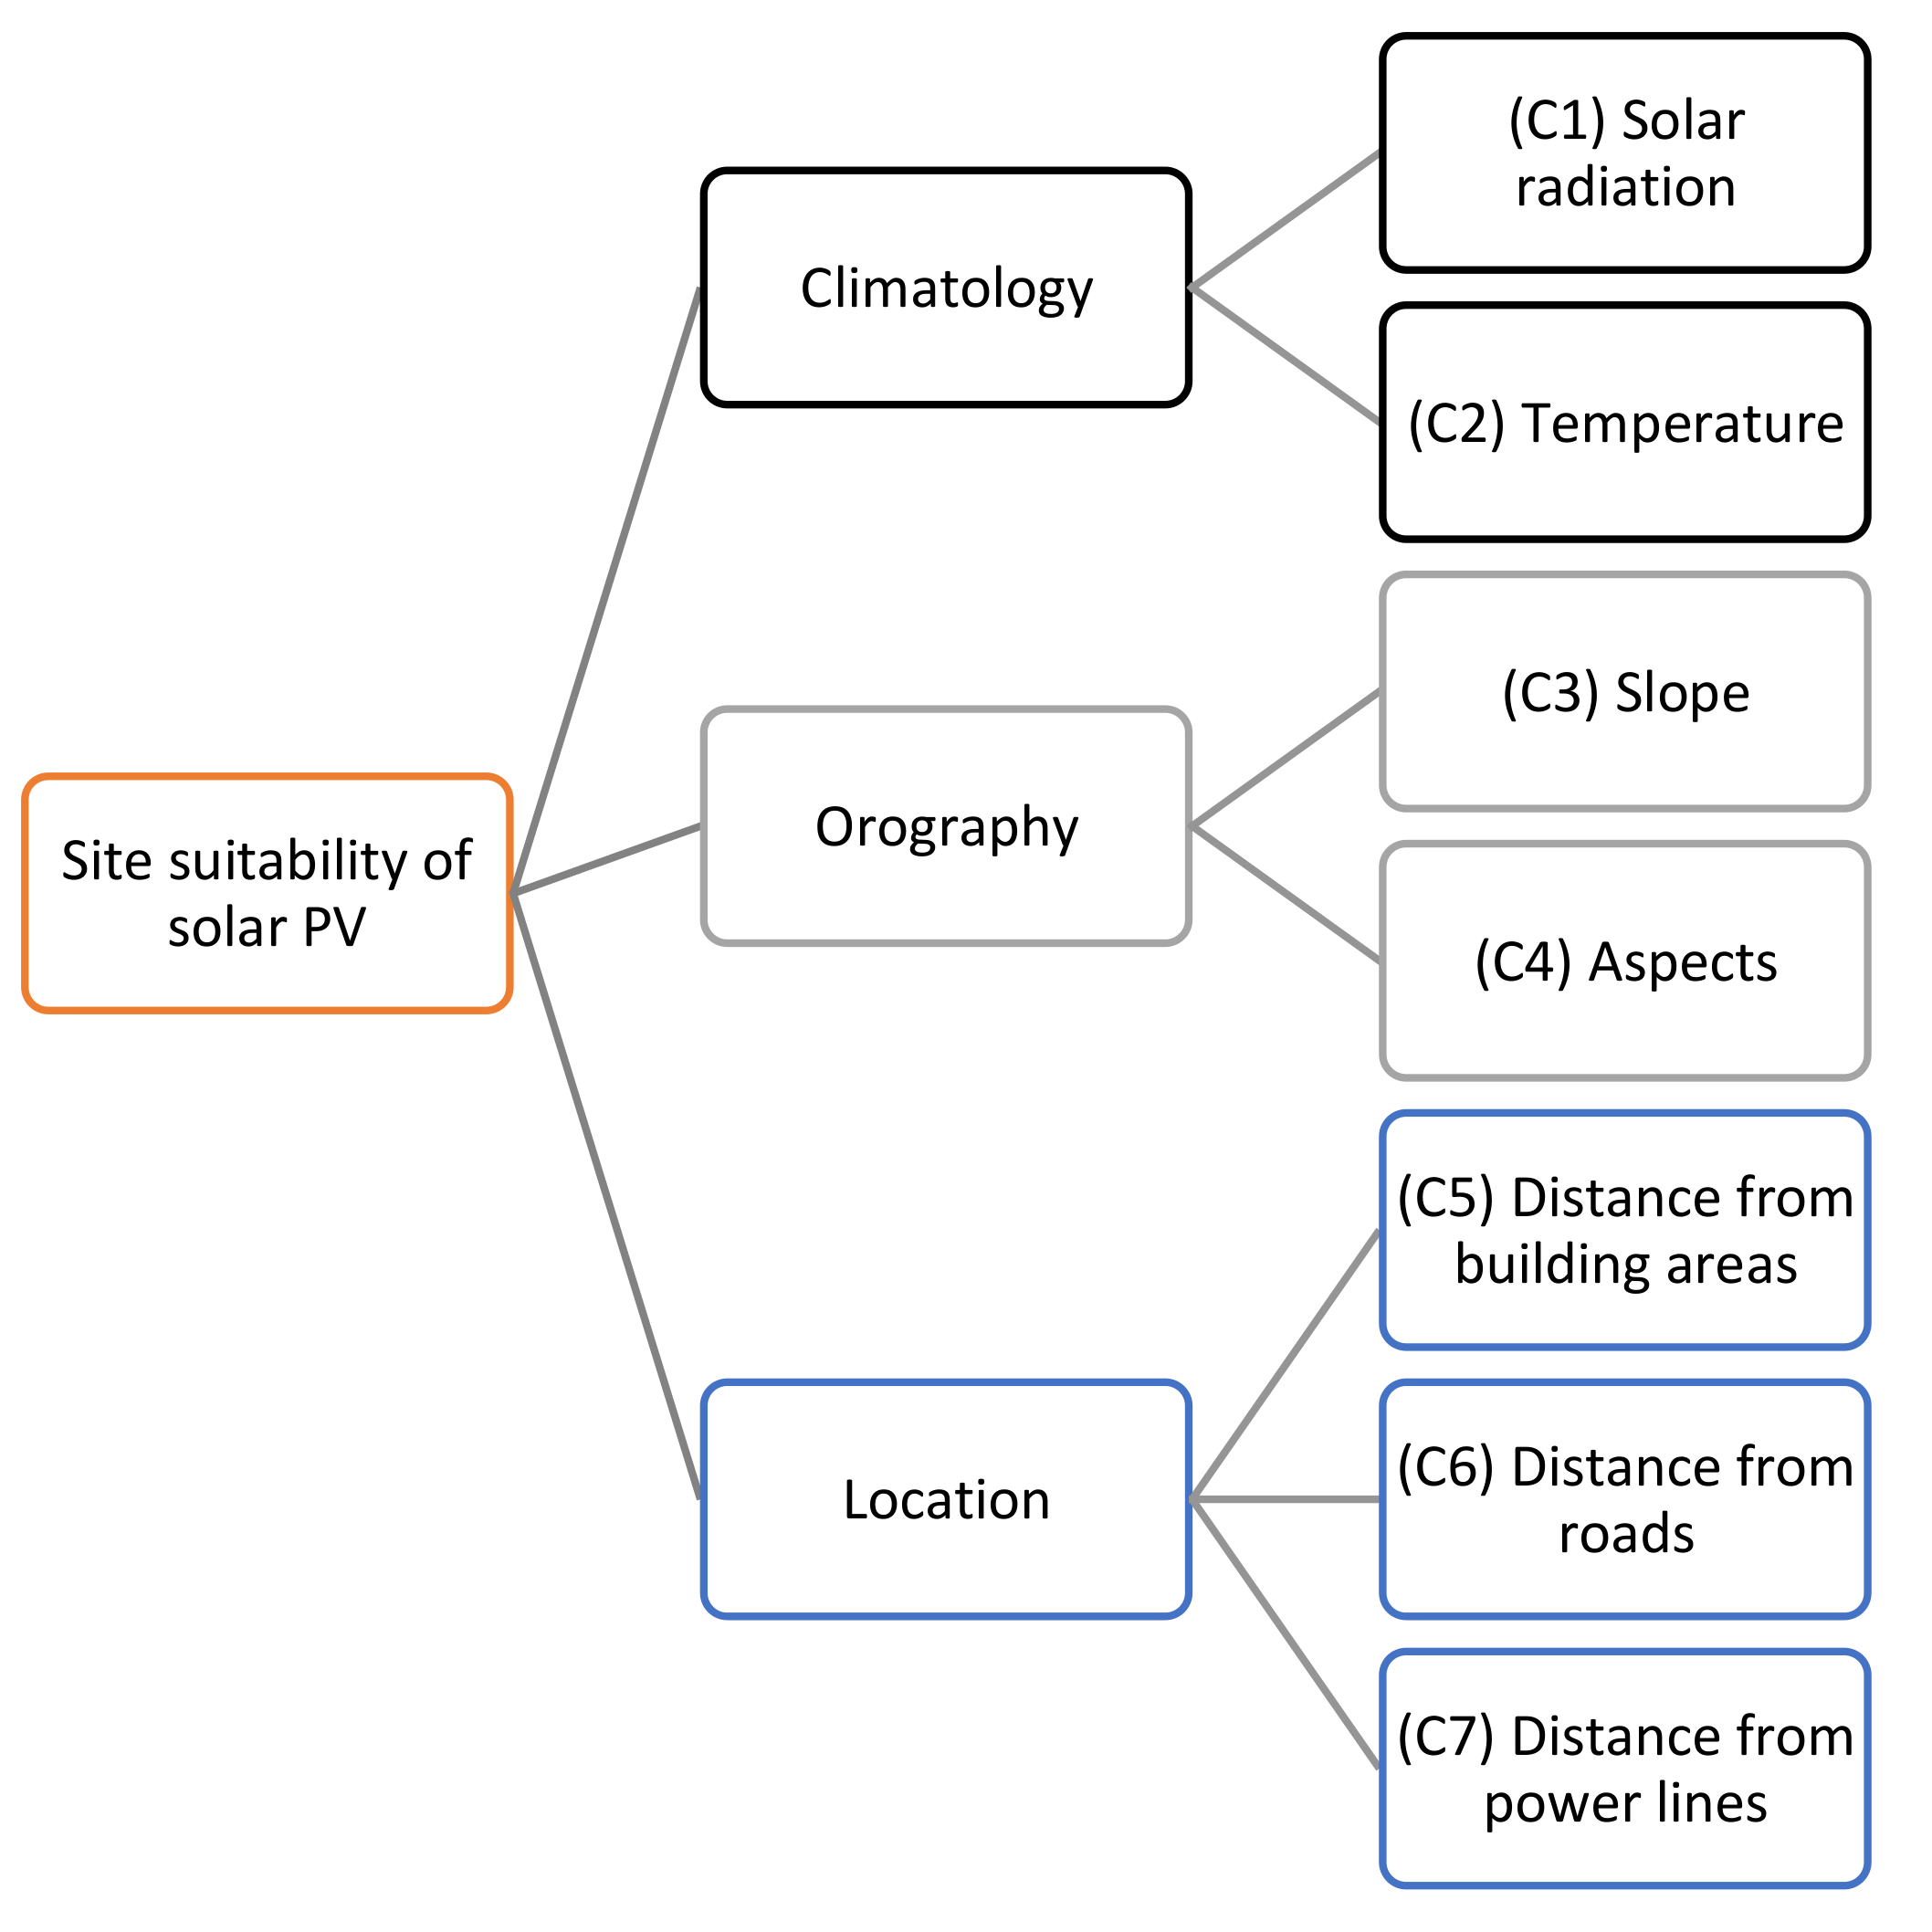
In this study, the criteria were selected after reviewing the related works conducted in this field, especially the ones that consider Saudi Arabia as the study area. The criteria included climatology, orography, and location criteria. The climatology criteria included (C1) solar radiation and (C2) temperature, while orography criteria included (C3) slope and (C4) aspects, and the location criteria included the (C5) distance from building areas, (C6) distance from roads, and (C7) distance from power lines [10]. The description of these criteria is presented in Table 3.
Constraints are defined to reduce a study area by removing the regions that violate these restrictions. Constraints can be applied at the beginning to exclude non-suitable areas. They can be used to restrict ranges for all evaluation criteria. To apply site suitability analysis of solar energy projects, it is essential to consider technical and environmental constraints to remove inappropriate regions. The constraints used in this study are described in Table 4.
3.3. Proposed Framework
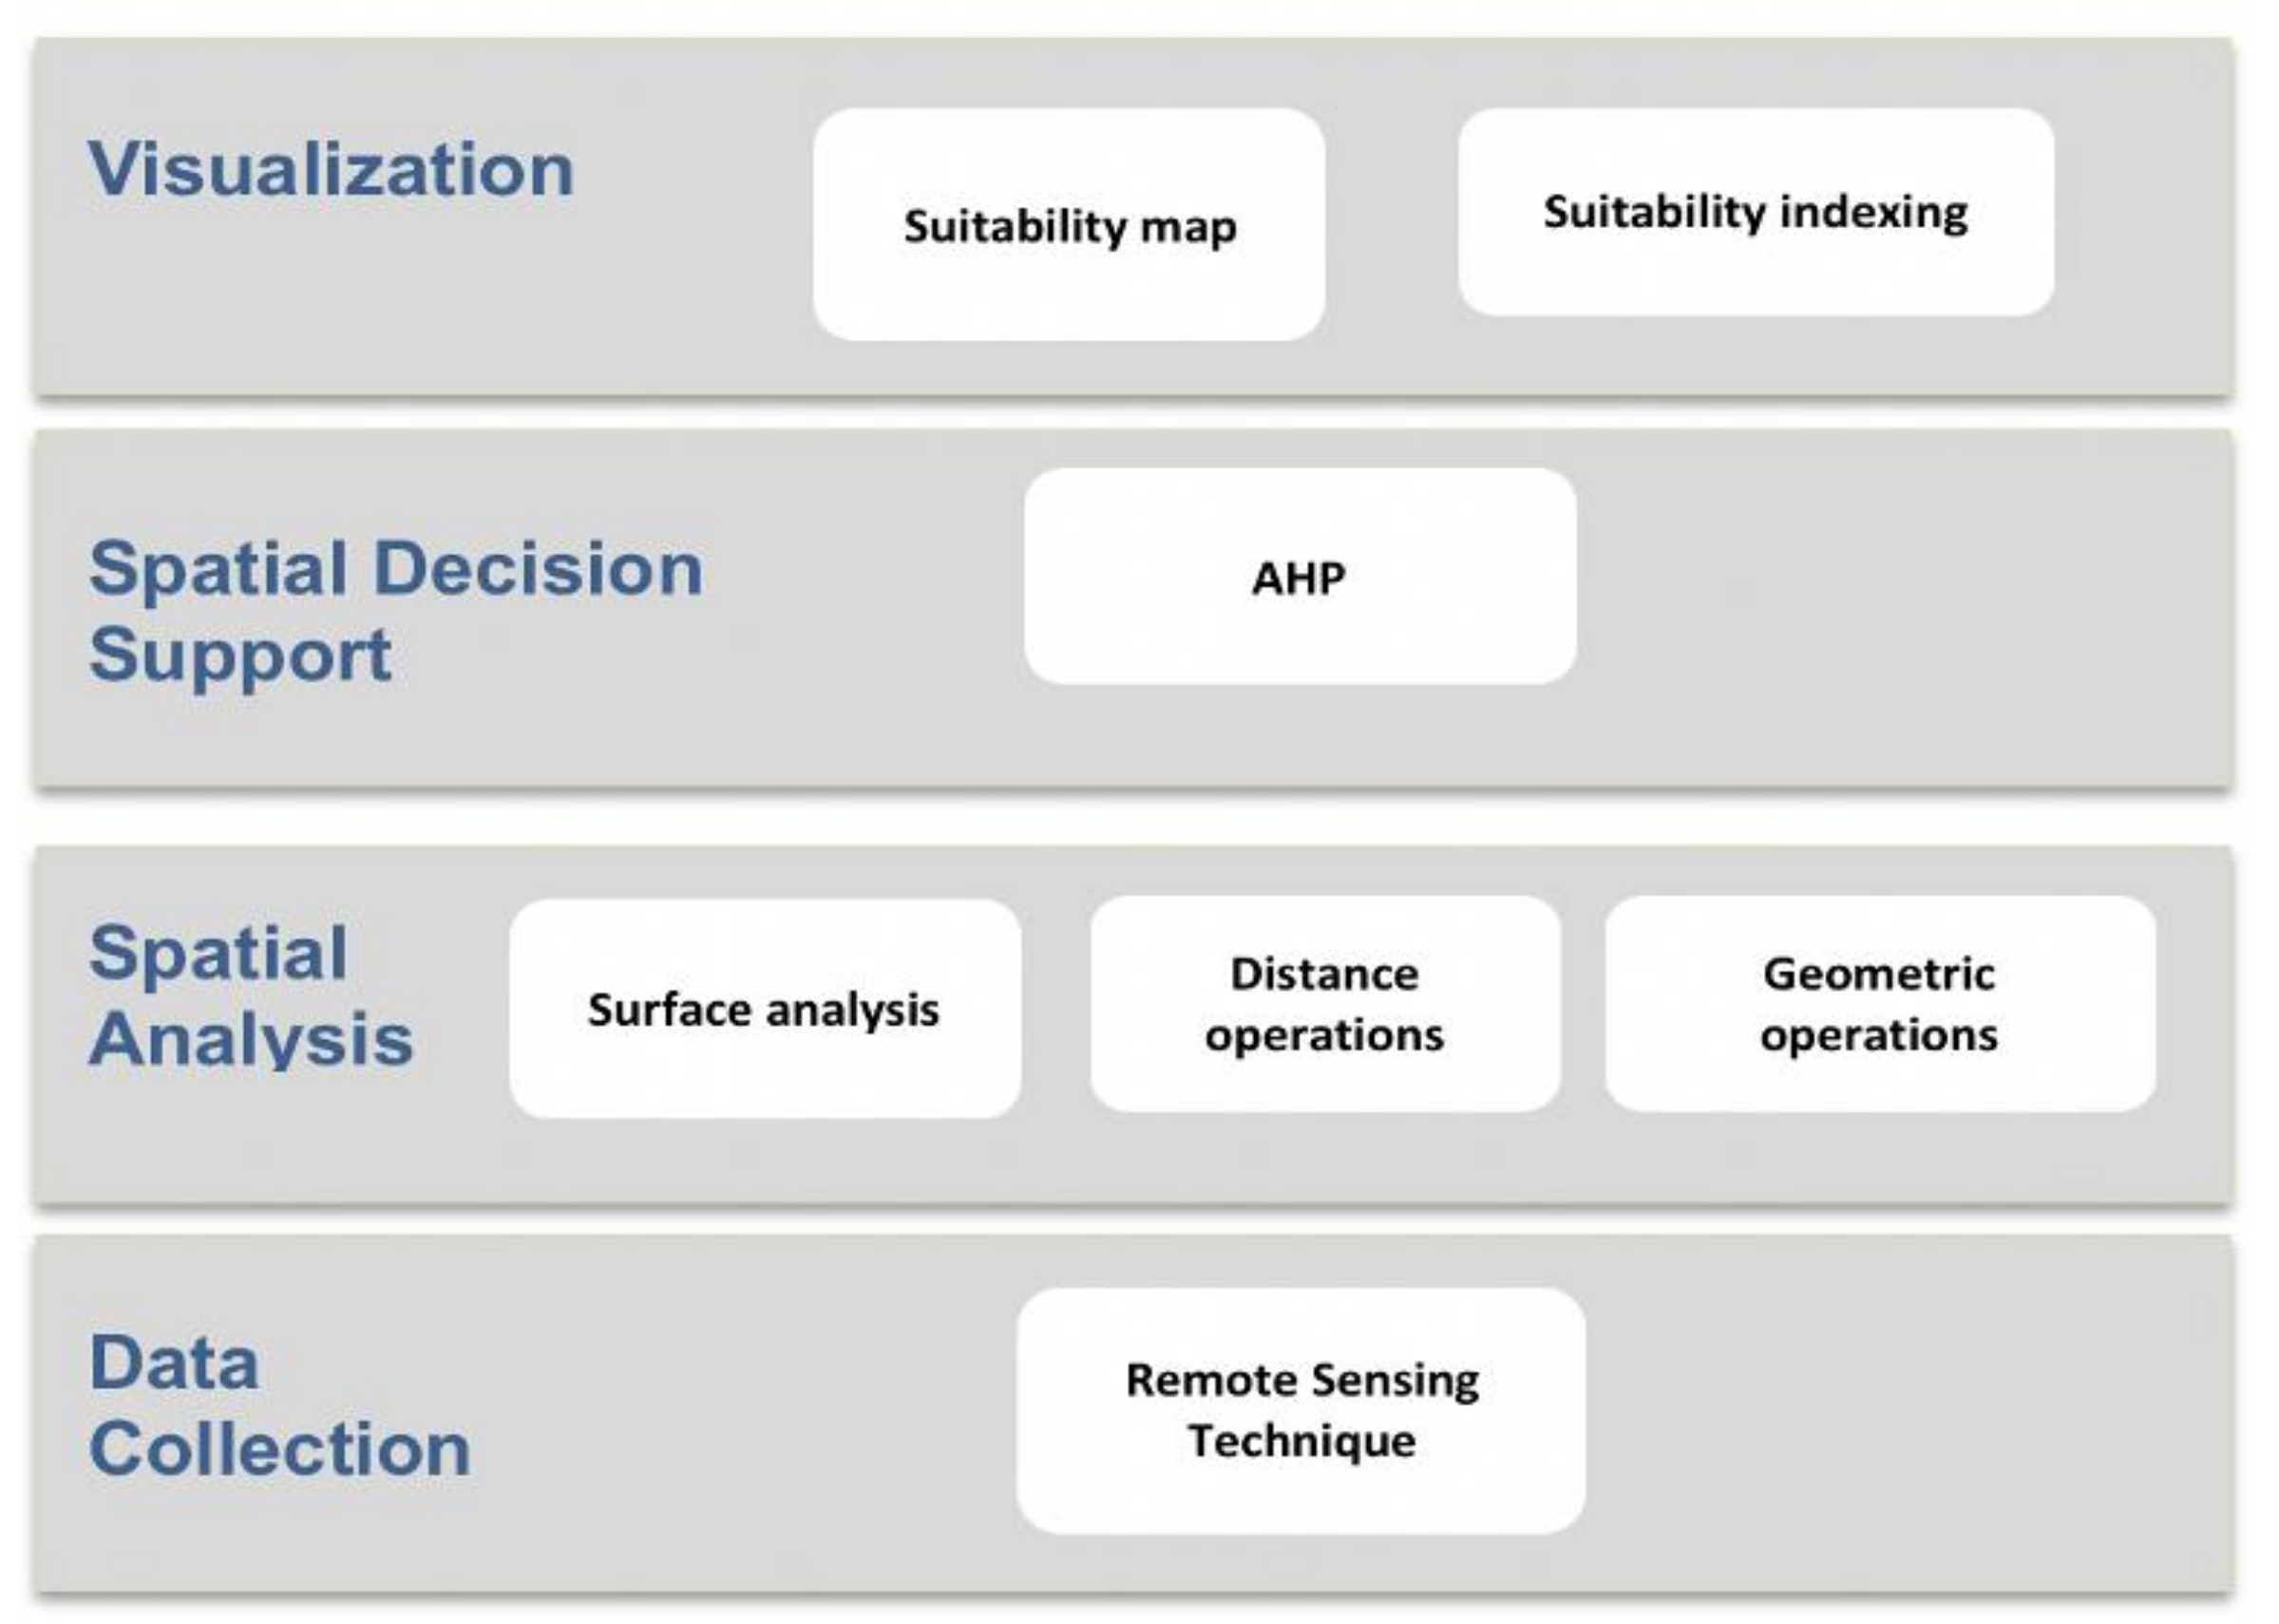
The methodology used to perform the geospatial analysis of solar energy in the Riyadh region is presented. Since site suitability is a complex problem and depends on different criteria, a combination of GIS and MCDM methods was applied to perform the site suitability analysis. The steps are discussed below according to the proposed framework as shown in Figure 2. The methodology is as follows:
- Data collection, which includes the data collection process according to the required criteria.
- Spatial analysis, which includes the spatial analysis involving several methods such as surface analysis, geometric operations, and distance operations.
- Spatial decision support, whereby the multi-criteria decision analysis (MCDA) is applied using the analytical hierarchical process (AHP).
- Visualization, which consists of the final results of the methodology, represented by suitability maps, as well as the sensitivity analysis, which is conducted to evaluate the result.
3.3.1. Data Collection
The datasets that were collected for use in this research along with their sources, formats and resolutions are shown in Table 5.
It can be seen that the data were collected according to the evaluation criteria considered previously. A digital elevation model (DEM) was requested from the Saudi Geological Survey, which was derived from the Shuttle Radar Topography Mission (SRTM) for remote sensing applications, with a 90-meter resolution, represented in raster format. It was used to calculate solar radiation, which is a key factor in the site suitability analysis of solar energy projects. Additionally, it was used to calculate the slope and aspects. Following this, temperature, another major factor, was also represented in raster format. The temperature dataset was accessed through SolarGIS and included the annual average temperature based on 24 h of data for each day’s temperature.
Distance from power lines, roads and building areas provided another three primary factors. Datasets for power lines and building areas were accessed through World Bank Group 2020, represented in vector format. The main road data source was also the Saudi Geological Survey, represented in vector format.
The data collection began by defining the study area using GIS data for Saudi map regions [33]; we only extracted Riyadh’s boundaries to be used as a mask for all criteria. This step helped us to reduce time of possessing and focusing only on Riyadh. Then, data were uploaded on ArcGIS Pro, including base criteria, which were elevation, temperature, main roads, electricity network, and building areas. The maps of these criteria are presented in Figure 3. As shown in Table 5, the resolutions of the input are different, the default settings of raster analysis that are used in ArcGIS produce the final result with cell size that are equal to (maximum of inputs).
3.3.2. Spatial Analysis
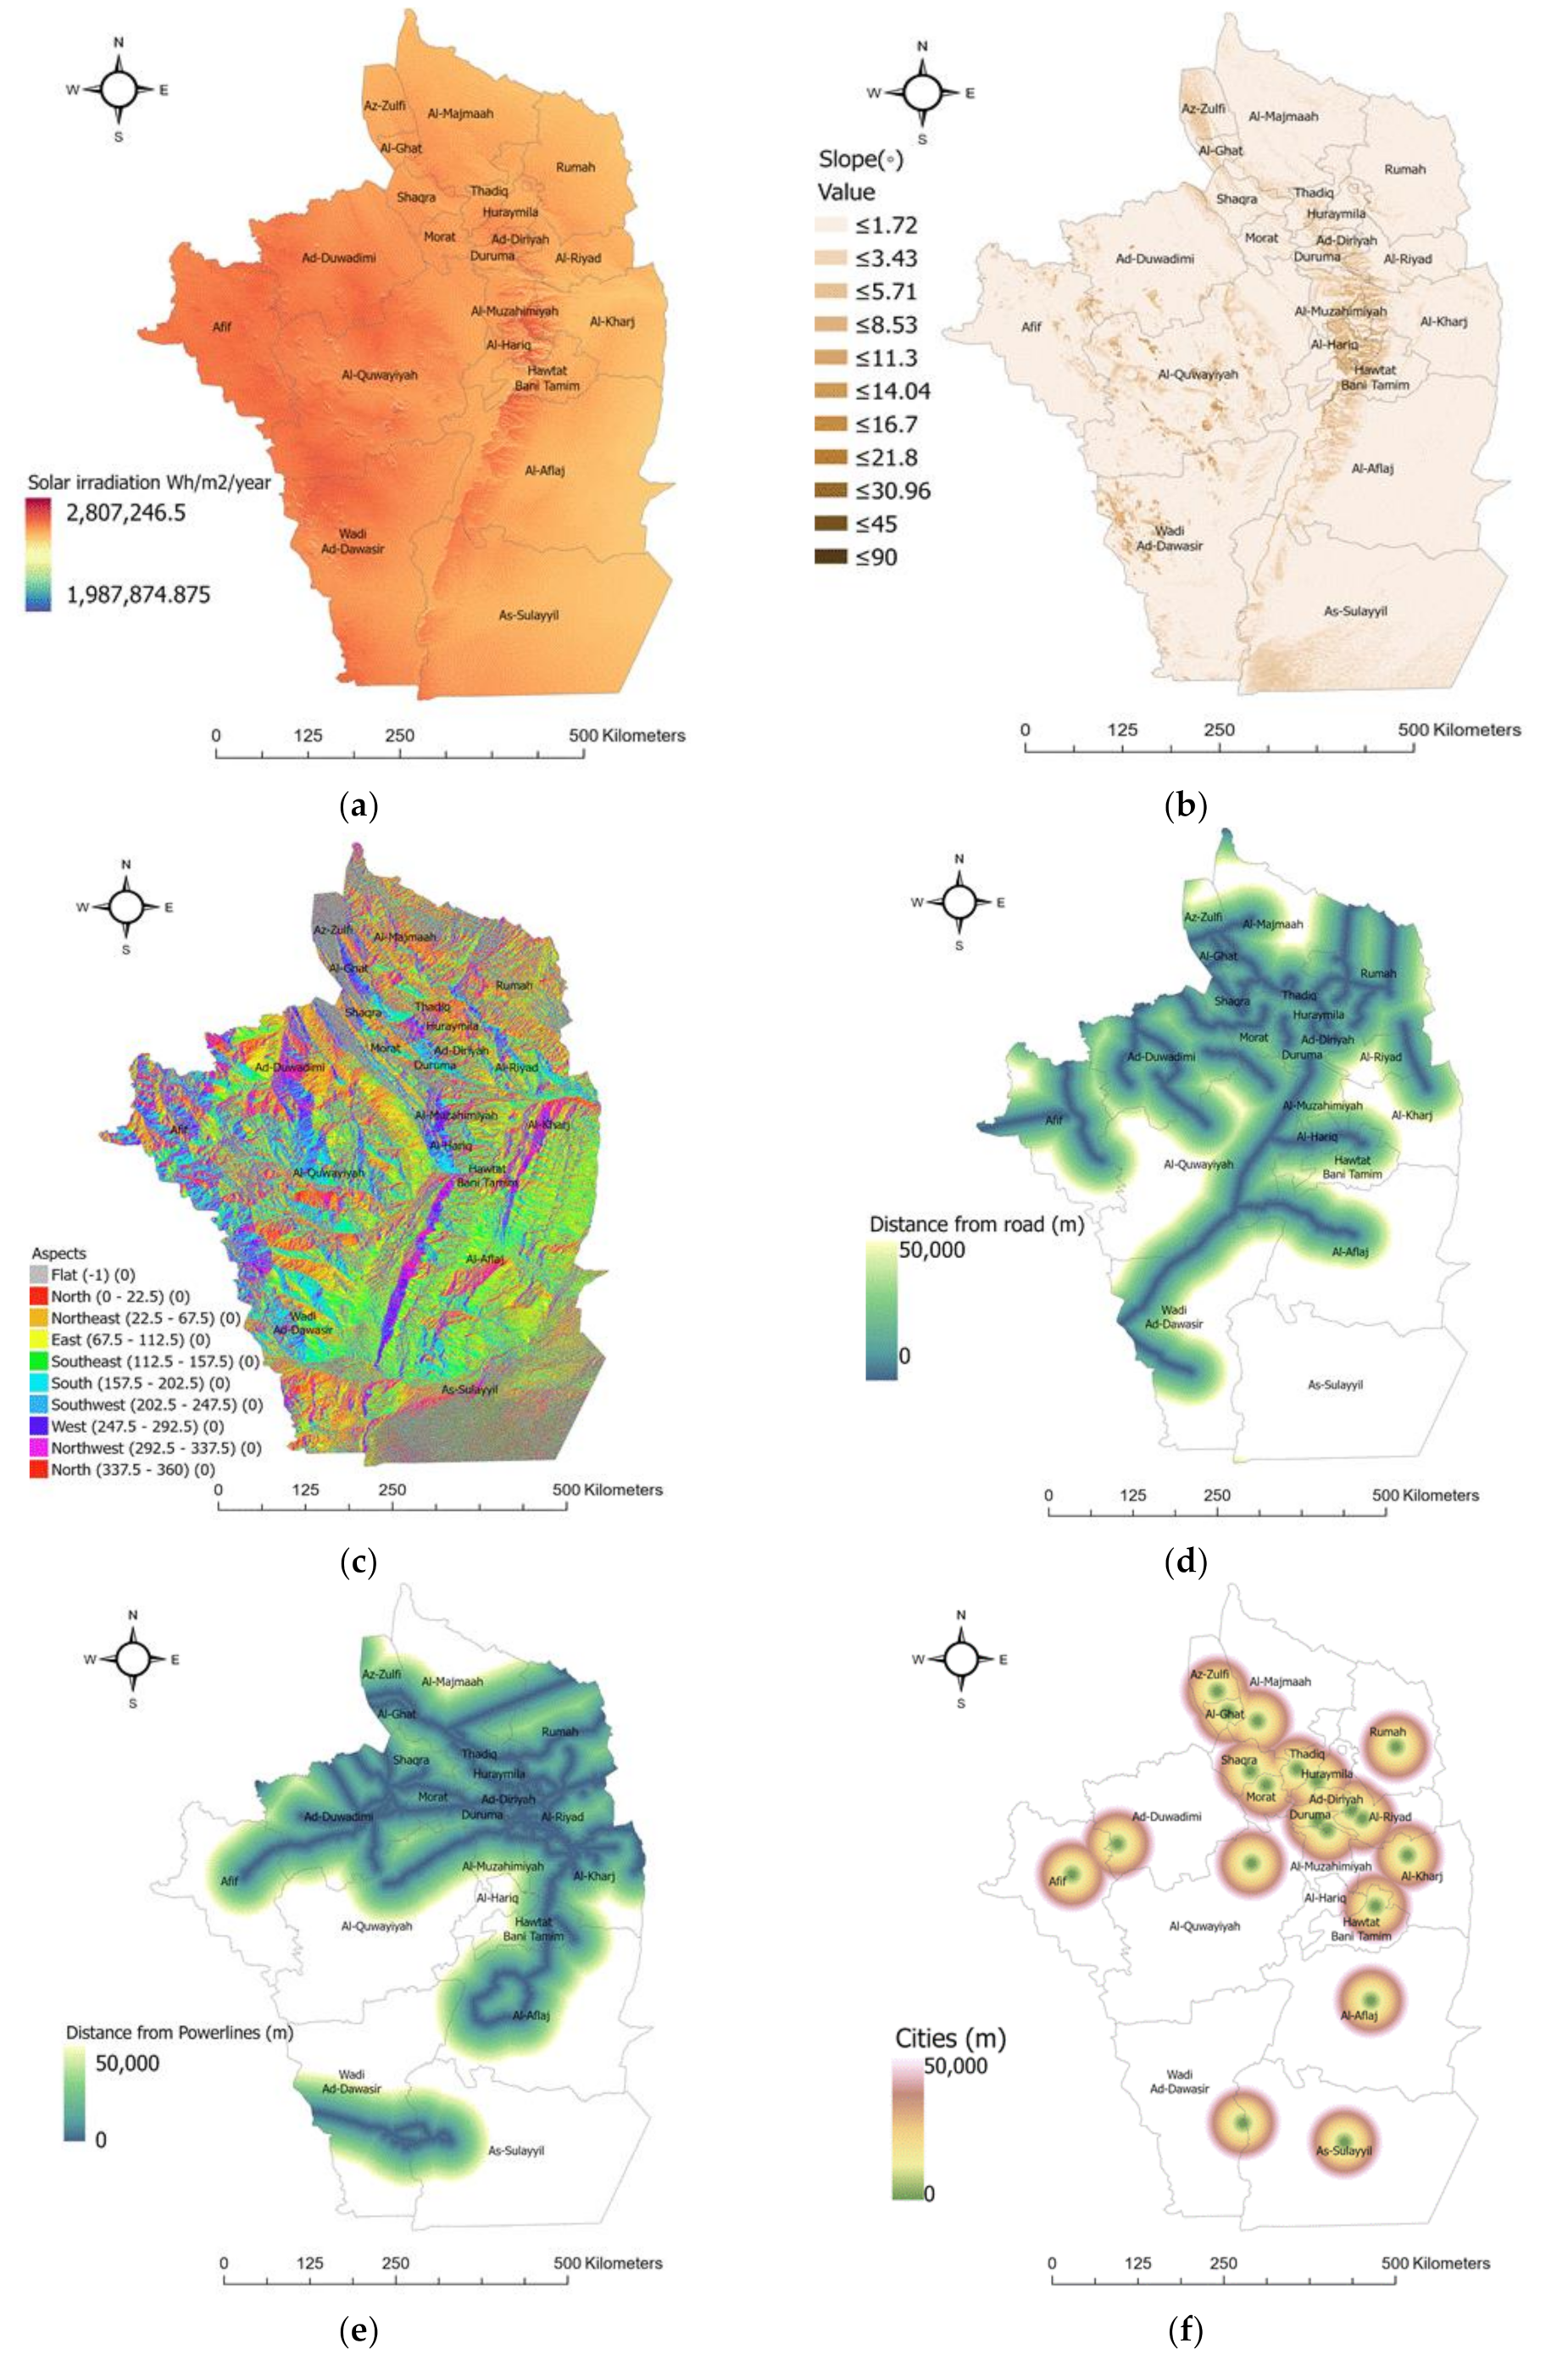
This section includes the surface analysis, geometric operation and distance operation methods applied to the spatial data to turn them into useful information. The following sections present how the datasets of each evaluation criterion were prepared, processed, and analyzed. Figure 4 presents the criteria maps after applying the spatial analysis methods.
- Solar radiation (C1). The solar irradiance was calculated using the solar analyst area tool that exists in ArcGIS Pro, which takes DEM as the input. The solar tool uses three layers internally (viewshed map, sky map, and sun map) to calculate solar radiation. Table 6 shows the parameters used in the solar analyst tool [9].
- Temperature (C2). Areas with a high temperature affect energy production negatively [9].
- Slope (C3) is the steepness of a surface and it can affect the receiving of radiation and energy production. Flat areas will receive more radiation. The slope was calculated using DEM as the input for the slope tool in ArcGIS pro [10].
- Aspect (C4) is the orientation of a surface. South-facing panels are preferable for solar energy production. The aspect was also calculated using DEM as the input for the aspect tool in ArcGIS [10].
- Distance from building areas (C5), distance from main road (C6), and distance from electricity network (C7). Transportation cost is one of the dominant factors in energy production. Areas far from roads and electricity networks as well as building areas are not economically feasible and are unsuitable. Euclidean distance is the most commonly used method for creating rasters that have a distance value for each cell. The value represents the distance between the cell and vector-based data (roads, electricity network, and building areas) [9].
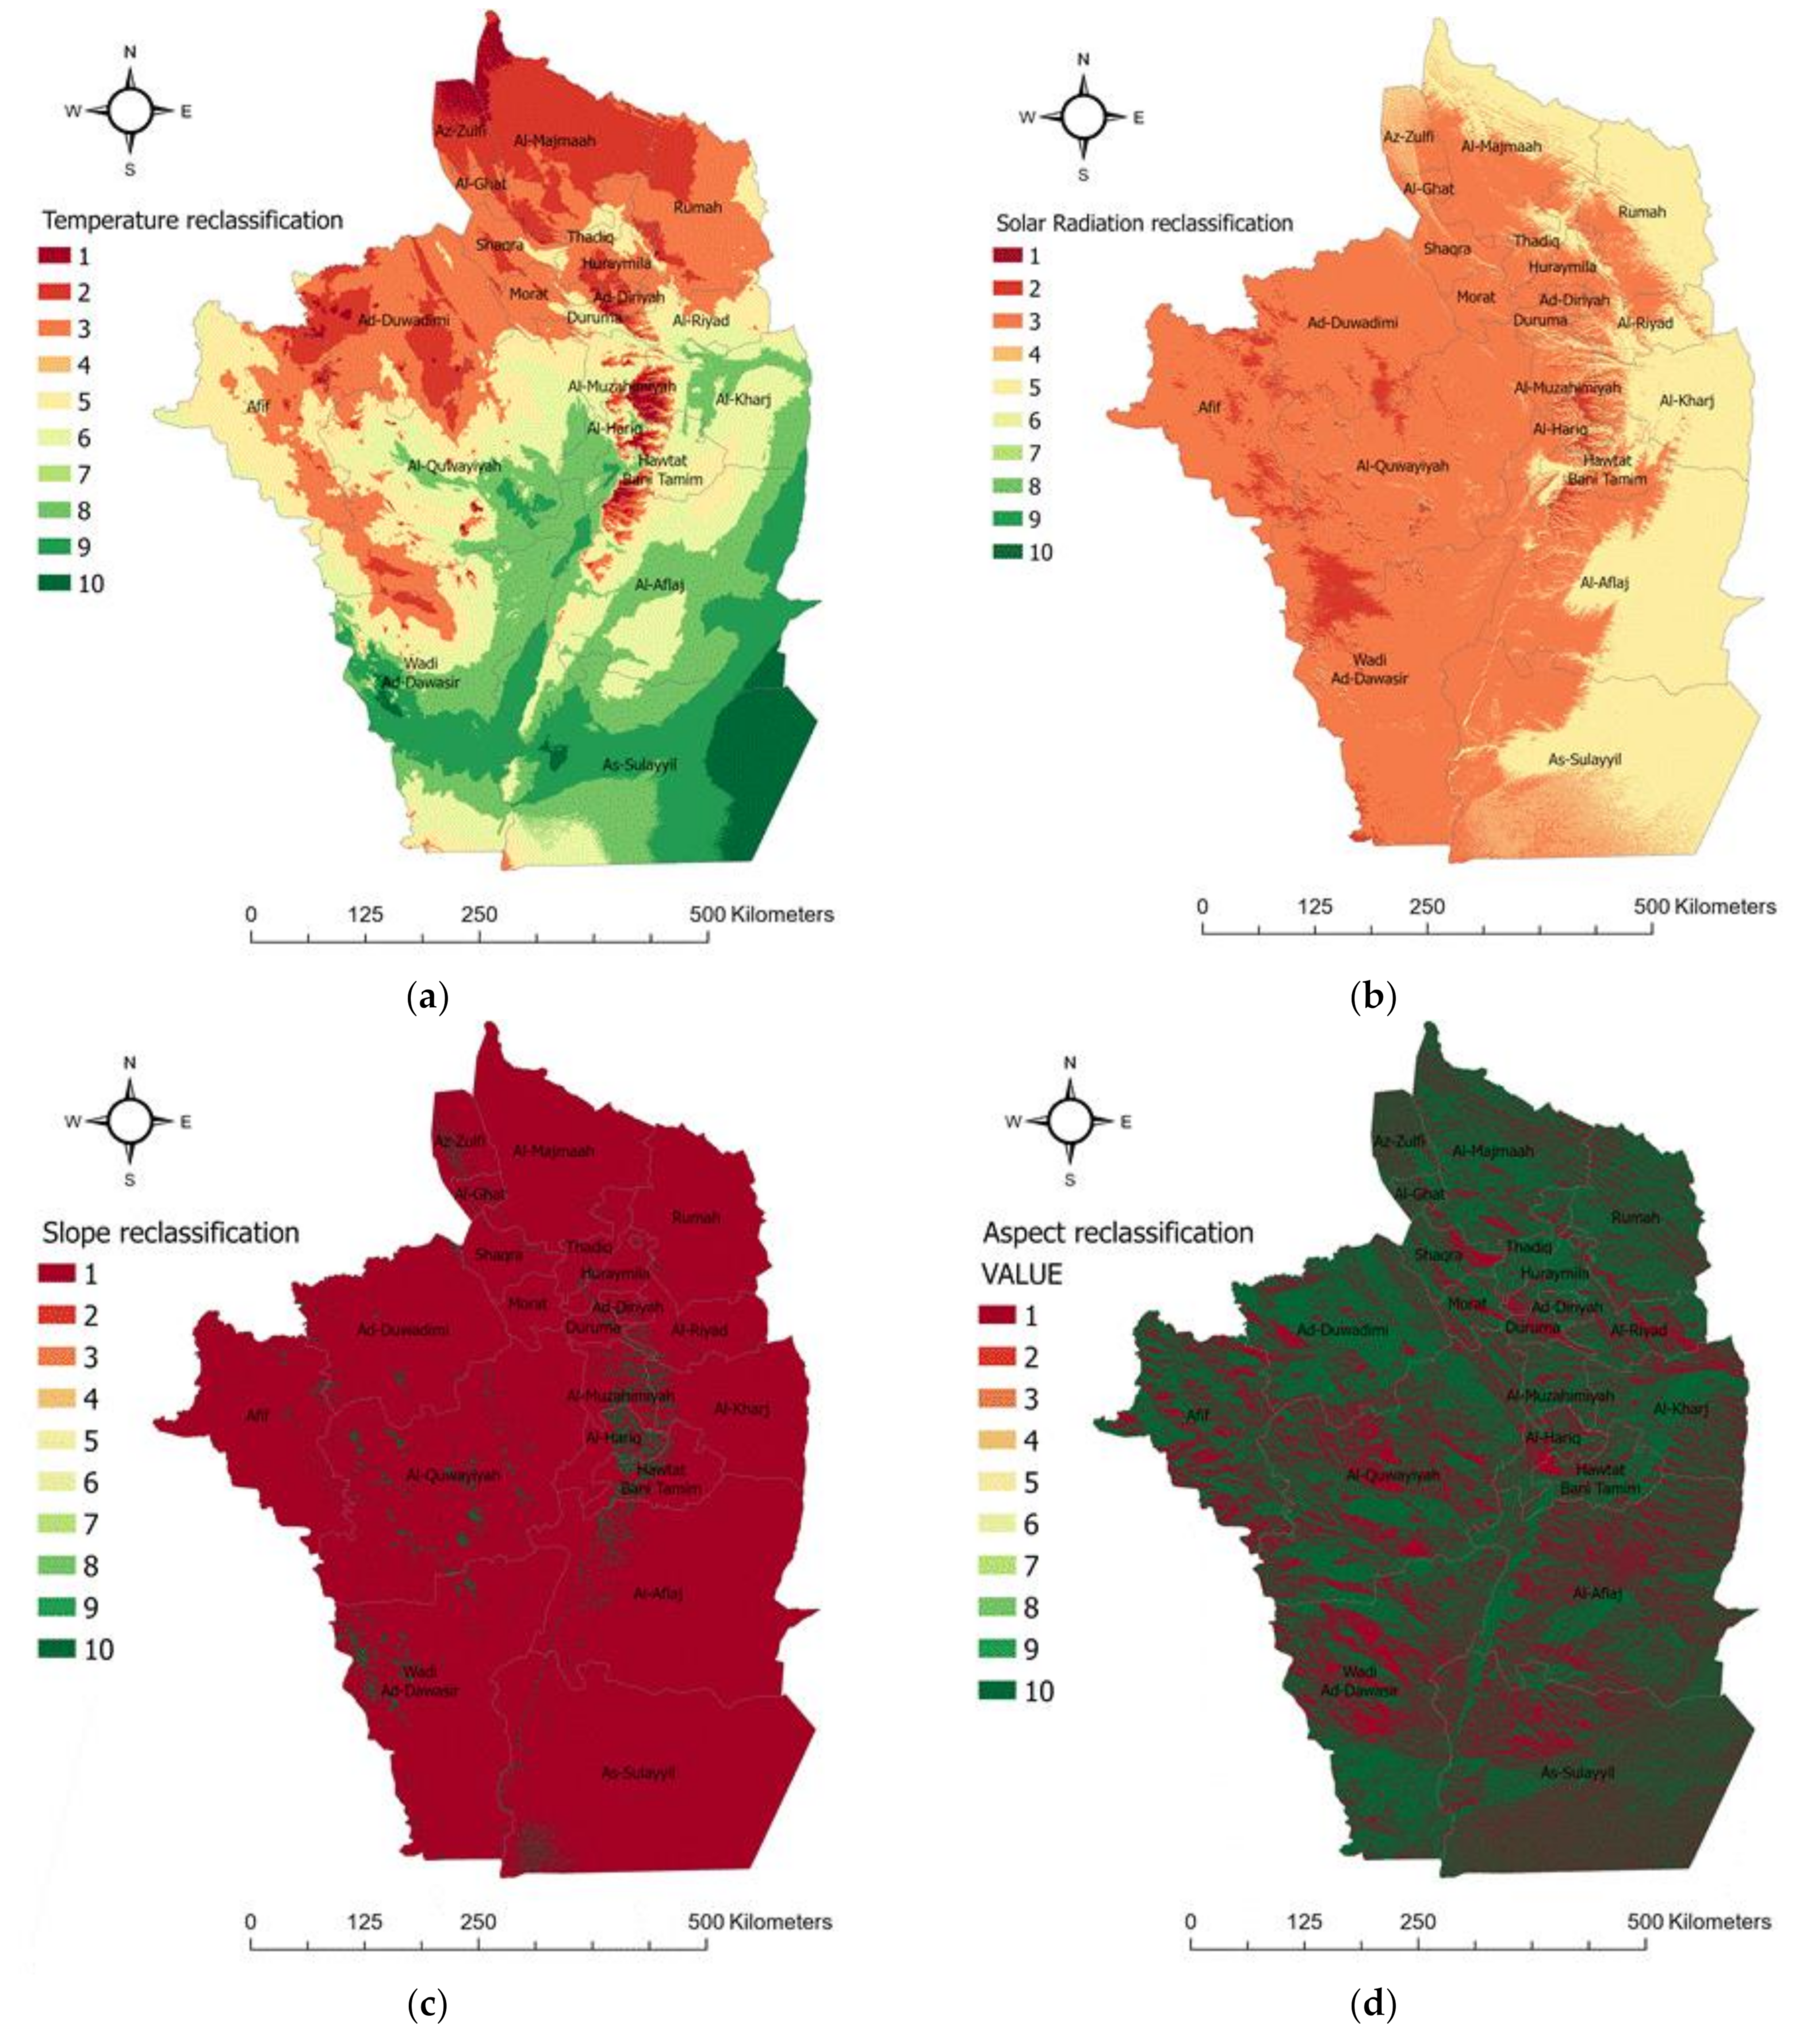
Since all of these criteria have different values and ranges, they needed a common scale in order to be integrated in one layer. Consequently, all the criteria were reclassified to 10 classes from 1 to 10, where 1 is the most suitable and 10 is the least suitable. Therefore, after integrating the rasters, smaller values represent a higher suitability.
The site suitability module, a tool in the ArcGIS analytics toolbox, was used for reclassification. The module uses several functions for reclassification; the best suitable functions in this study were equal interval and manual interval. Equal intervals were applied to the solar radiation, temperature, road, electricity, and building area rasters. For example, the temperature raster‘s values ranged from 23.8 until 28.9, and the module reclassified it to 10 values (1–10) using equal intervals. Meanwhile manual intervals were applied on aspect and slope because there were restrictions that needed to be considered, as presented in Table 4. Therefore, for aspects we rated south-facing as 1 and all other directions as 10. Additionally, a slope above 5 degrees was assigned 1 and those below 5 degrees, 10.
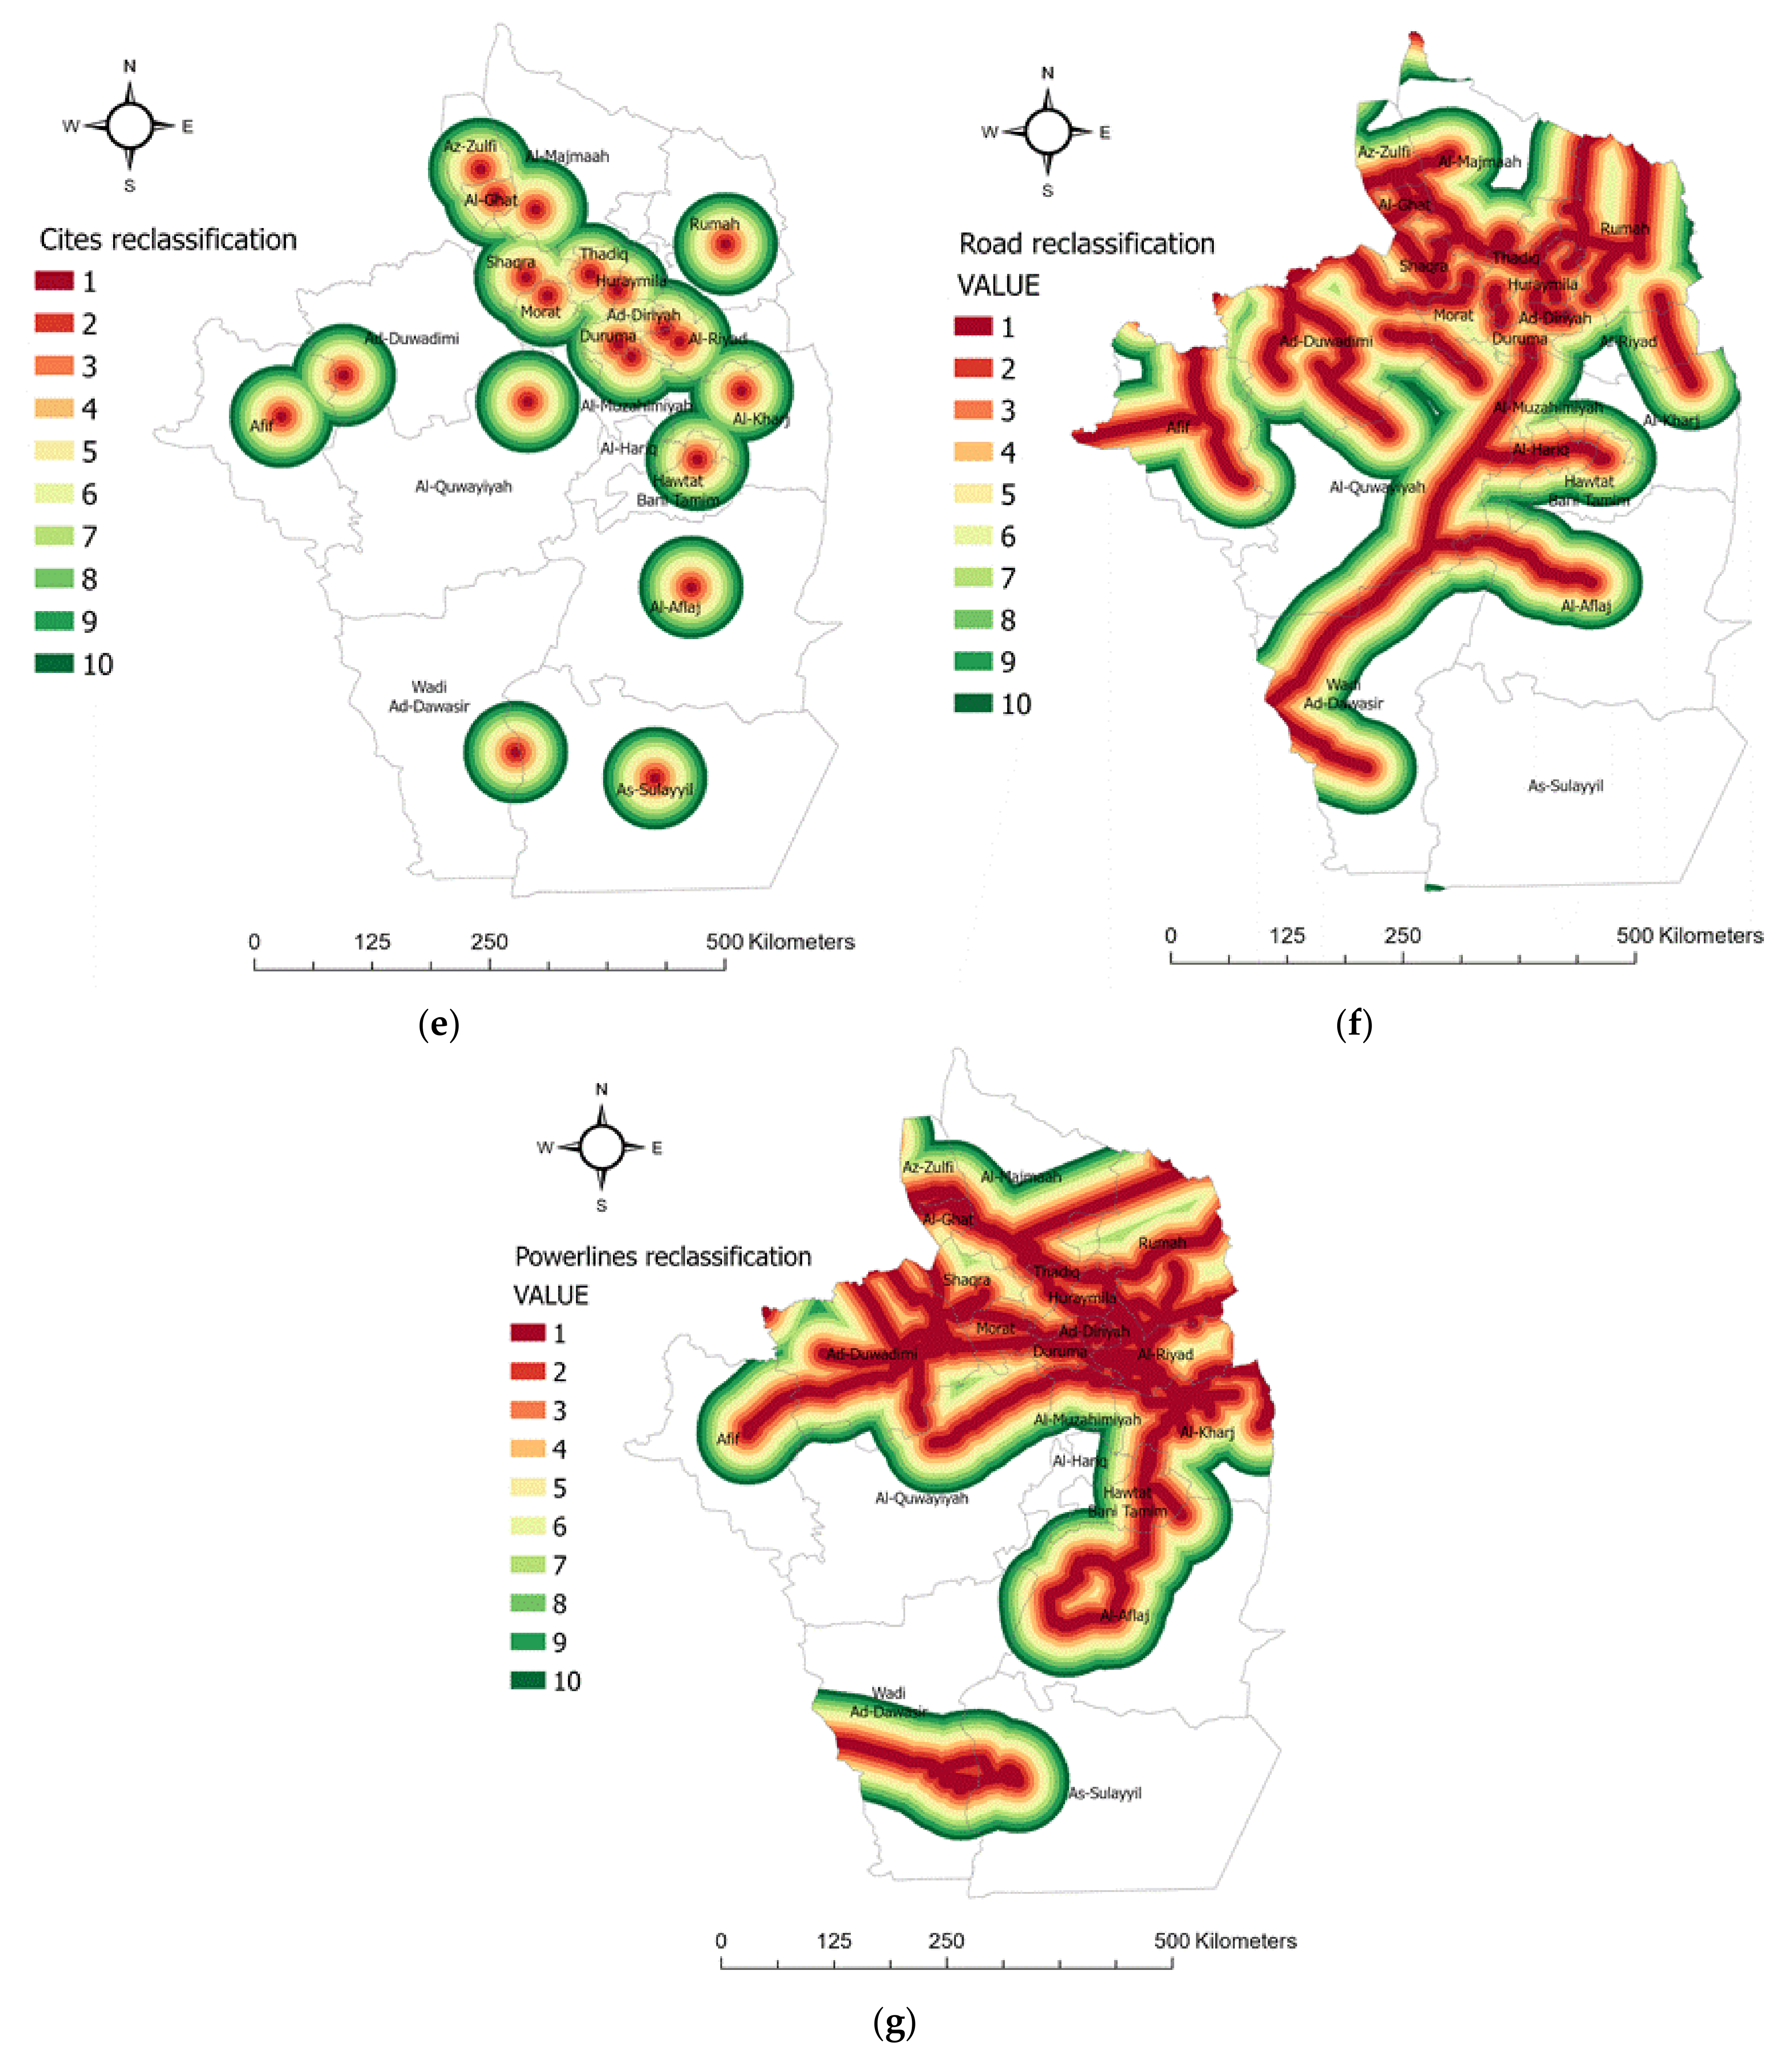
Figure 5a shows that the suitable areas in terms of temperature are mostly in the north of Riyadh. Figure 5b illustrates that the most suitable areas for solar radiation are in the west of Riyadh. For the slope, the green areas are unsuitable since they have more than 5 degrees, while the red areas are suitable, which have slope values under 5 degrees. Figure 5d shows the aspects, where only south-facing areas are suitable and all other orientations have been selected as unsuitable. Figure 5f represents the distance rasters for roads with the new reclassification values. Figure 5g represents the distance rasters for electricity with the new reclassification values. Figure 5e represents the distance rasters or building areas with the new reclassification values.
3.3.3. Spatial Decision Support System
Spatial analysis can be seen as part of a decision support infrastructure. As a consequence, GIS communities have developed algorithms to facilitate spatial decision support systems (SDSSs) such as AHP [34]. There are a number of MCDM approaches such as TOPSIS, FAHP, and WLC. In renewable energy, AHP is a preferable approach that gives accurate results, especially for site suitability analysis of solar energy projects. Therefore, in this study, the AHP algorithm was chosen because it is a robust and flexible MCDM method. It allows for structuring the decision hierarchically to reduce its complexity and shows the relationships between criteria. It also has the ability to mix qualitative and quantitative criteria in the same decision framework.
The basic theory of AHP can be described as follows: we assume that we have n different and independent criteria, C1; C2; …; Cn, and that they have the weights w1; w2; …; wn. The decision-maker does not know the values of these weights, but they are capable of making a pairwise comparison between the different criteria [16].
The AHP has four basic concepts: First, the complex decision problem is structured as a hierarchy of goal, criteria, and sub-criteria. Second, a pairwise comparison of criteria is performed at each level of the hierarchy using Saaty scale judgments, as shown in Table 7. Third, the judgments are summed vertically at different levels of the hierarchy. The fourth and final step is to check the consistency of the judgments [9,35].
In the first step, we developed a model for the decision problem by breaking down the criteria into a hierarchy, as shown in Figure 6. The structuring of the problem in this way can provide a better understanding of the criteria that are used and evaluated and also the decision that will be made.
In the next step, we built a pairwise comparison matrix (PCM). The size of a PCM depends on the number of criteria n ∗ n. The weight of each criterion was determined using the numerical scale for comparison, as shown in Table 7. The judgments between criteria are usually gathered from a questionnaire filled in by a group of experts in the same field related to the problem, which, is in our example, was solar energy. This research determined the weights based on previous studies and features of the study area [9]. The resulting pairwise comparison matrix is shown in Table 8.
For more clarification, as an example, if we consider that the factor C1 (GHI) is very strongly more important than the factor C6 (distance from power lines), the C1–C6 comparison cell will contain the value 5, as shown in Table 8. Mathematically, this means that the ratio of the importance of C1 versus the importance of C6 is 5 (X/Y = 5). Due to this, the opposite comparison, the importance of C6 relative to the importance of C1, will yield the reciprocal of this value (C6/C1 = 1/5), as shown in the C6–C1 cell in the comparison matrix in Table 8.
In the third step, the final criteria weights were calculated using an approximate method, which requires a normalization matrix. Three steps were required to create the normalization matrix and calculate the final result. Let Pij reveal the priority score of criteria i to criteria j using the nine-number value scale as presented in Table 7.
- Sum all cells in the column.
- Divide each cell by the total of the column.
- Generate weights by calculating the average for each row.
In the last step, it is necessary to check the consistency of the judgments; consistency is needed because there is some inconsistency expected in this method. Consistency occurs because, for example, if the C1 criterion has a given value of 2 over C2, and C2 has a value of 2 over C3, then the value of C1 over C3 should be 2 * 2 = 4, but the decision-makers or experts may assign a value such as 5, as in our matrix, or 6 or 7. This will lead to a level of inconsistency. Therefore, we needed to calculate a level of inconsistency, which can be referred to as the consistency ratio (CR). The acceptable CR value to continue the AHP analysis is 0.10 or less [30]. Therefore, if the acceptable CR value is exceeded, it is necessary to revise the judgments to locate the cause of the inconsistency and correct it.
The consistency ratio (CR) was calculated by comparing the value of the consistency index (CI) with the consistency index of a random-like matrix (RI), as shown in Equation (3)
A random matrix is one where the judgments have been entered randomly. Therefore, it is highly inconsistent. Saaty provides generally calculated RI values based on different criteria’s sizes, as shown in Table 9.
The calculation of the CR was performed as summarized in the steps below.
Calculate as follows:
- Multiply each value in each column in the comparison matrix as shown in Table 8 with the final generated weight of corresponding criteria resulting from step 3; this step will generate a matrix with calculation of the weighted columns.
- Sum the values in each row to generate another column with a value called the weighted sum.
- Divide the criteria’s weighted sum (obtained in the previous step) by the corresponding priority of each criterion and generate another column; the sum of this column represents a single value called
Calculate the consistency index (CI) as follows, where n is the number of criteria
Calculate the consistency ratio, defined as
For the implementation of the AHP algorithm, we used the Python programing language, and the pseudocode is presented below [36].
- Step 1:
- Calculate Each column sum of priority score as CS1, CS2 … CSn where n is a number of criteria.
- Step 2:
- Divide each priority score in a column by its CS and store value in
- Step 3:
- Calculate final weight by sum all for single row and then divide it by n then store in CW1, CW2, … CWn.
- Step 4:
- Calculate consistency index (C1)
- Step 5:
- Random consistency index n = 6, then RI = 1.24
- Step 6:
- Calculate the consistency ratio
3.3.4. Visualization
In the visualization step, we included the final results of the methodology, represented by a suitability map as well as suitability indexing.
3.3.5. Solar Suitability Map
After conducting the analysis, each criterion had a raster with the same classification range, as well as a weights for each of them resulting from the AHP. A solar suitability map (SSM) was generated by giving each raster its weight and then combining them with the restriction using the union overlay method, as shown in Equitation (6), where r is a restriction (0 or 1), w is the weight and x is the criterion value.
4. Results and Discussion
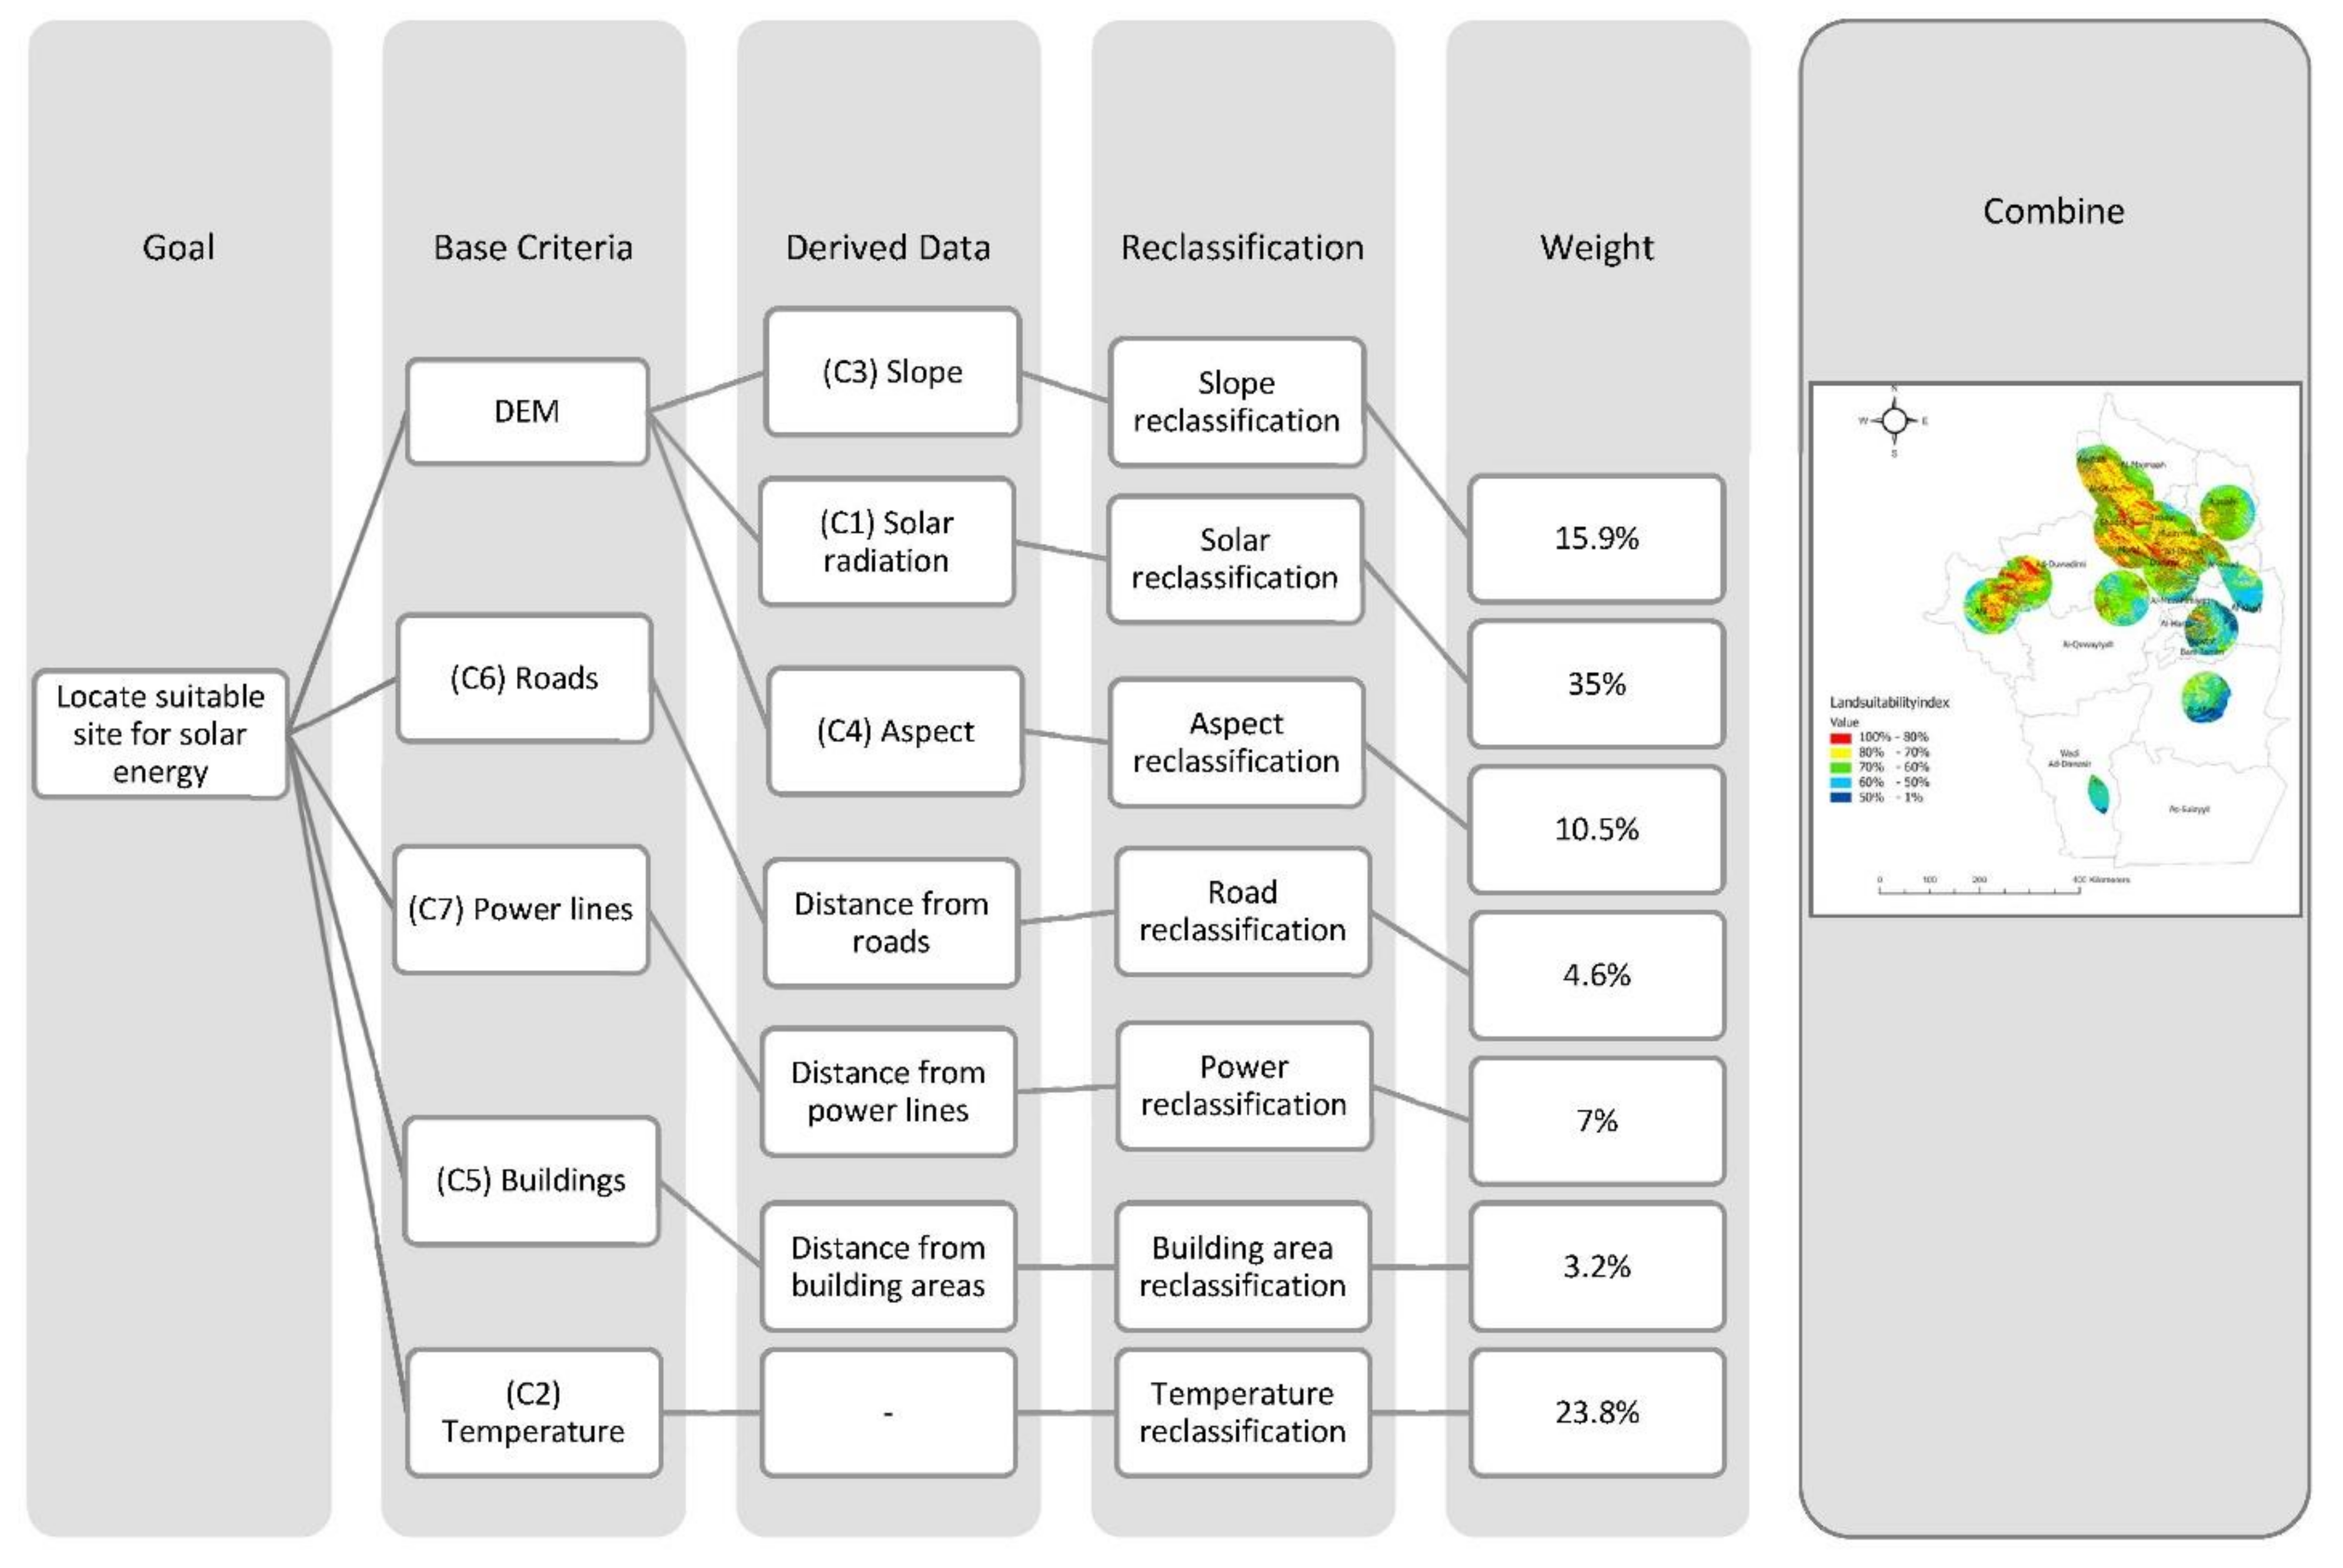
The goal of this study was to locate sites suitable for solar energy panels in the Riyadh region, which contains 22 cities. Five basic criteria (DEM, main road, power lines, building areas, and temperature) were used to derive three more criteria (slope, aspects, and solar radiation) using multiple spatial processing techniques as shown in Figure 7. All of these criteria were reclassified to a common range from 1 to 10, where 1 is the most suitable value. Moreover, all criteria were overlaid by taking into account their weight values. These weight values were calculated using the MCDM-AHP technique. ArcGIS is the GIS software used for processing. The results show that the Riyadh region has an area of around 16,738 km2 that is suitable, with a suitability degree above 80%.
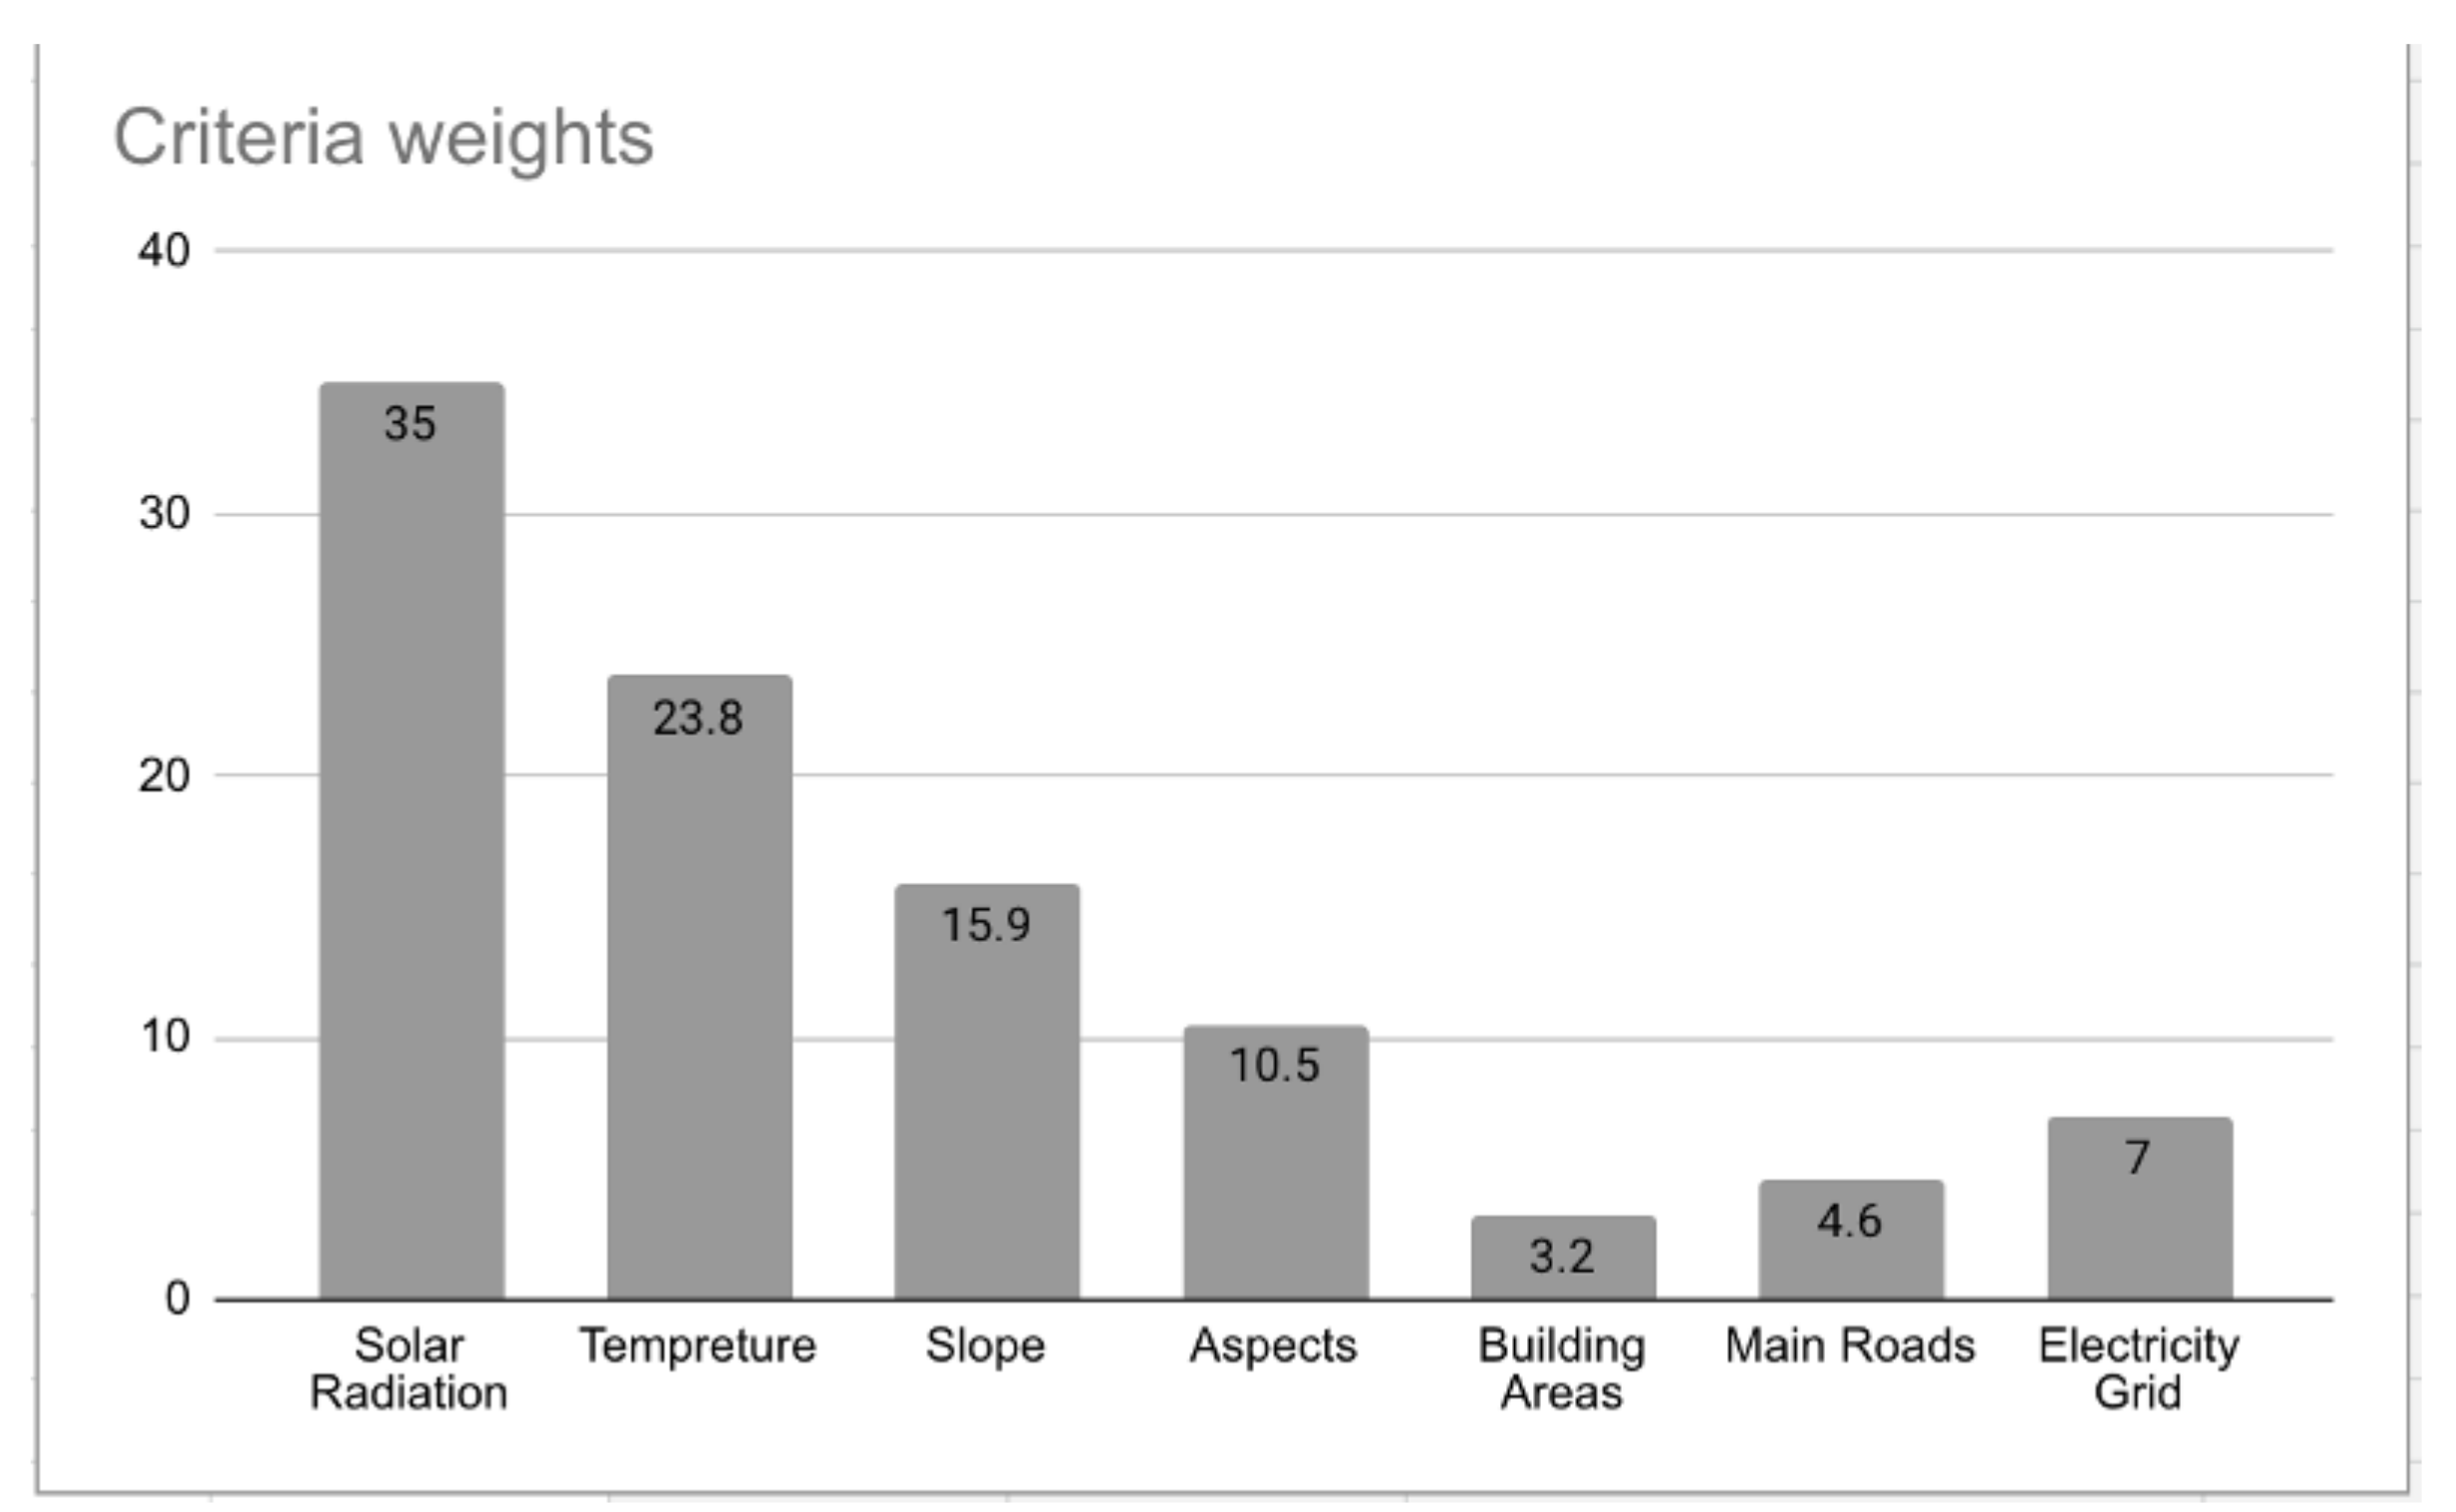
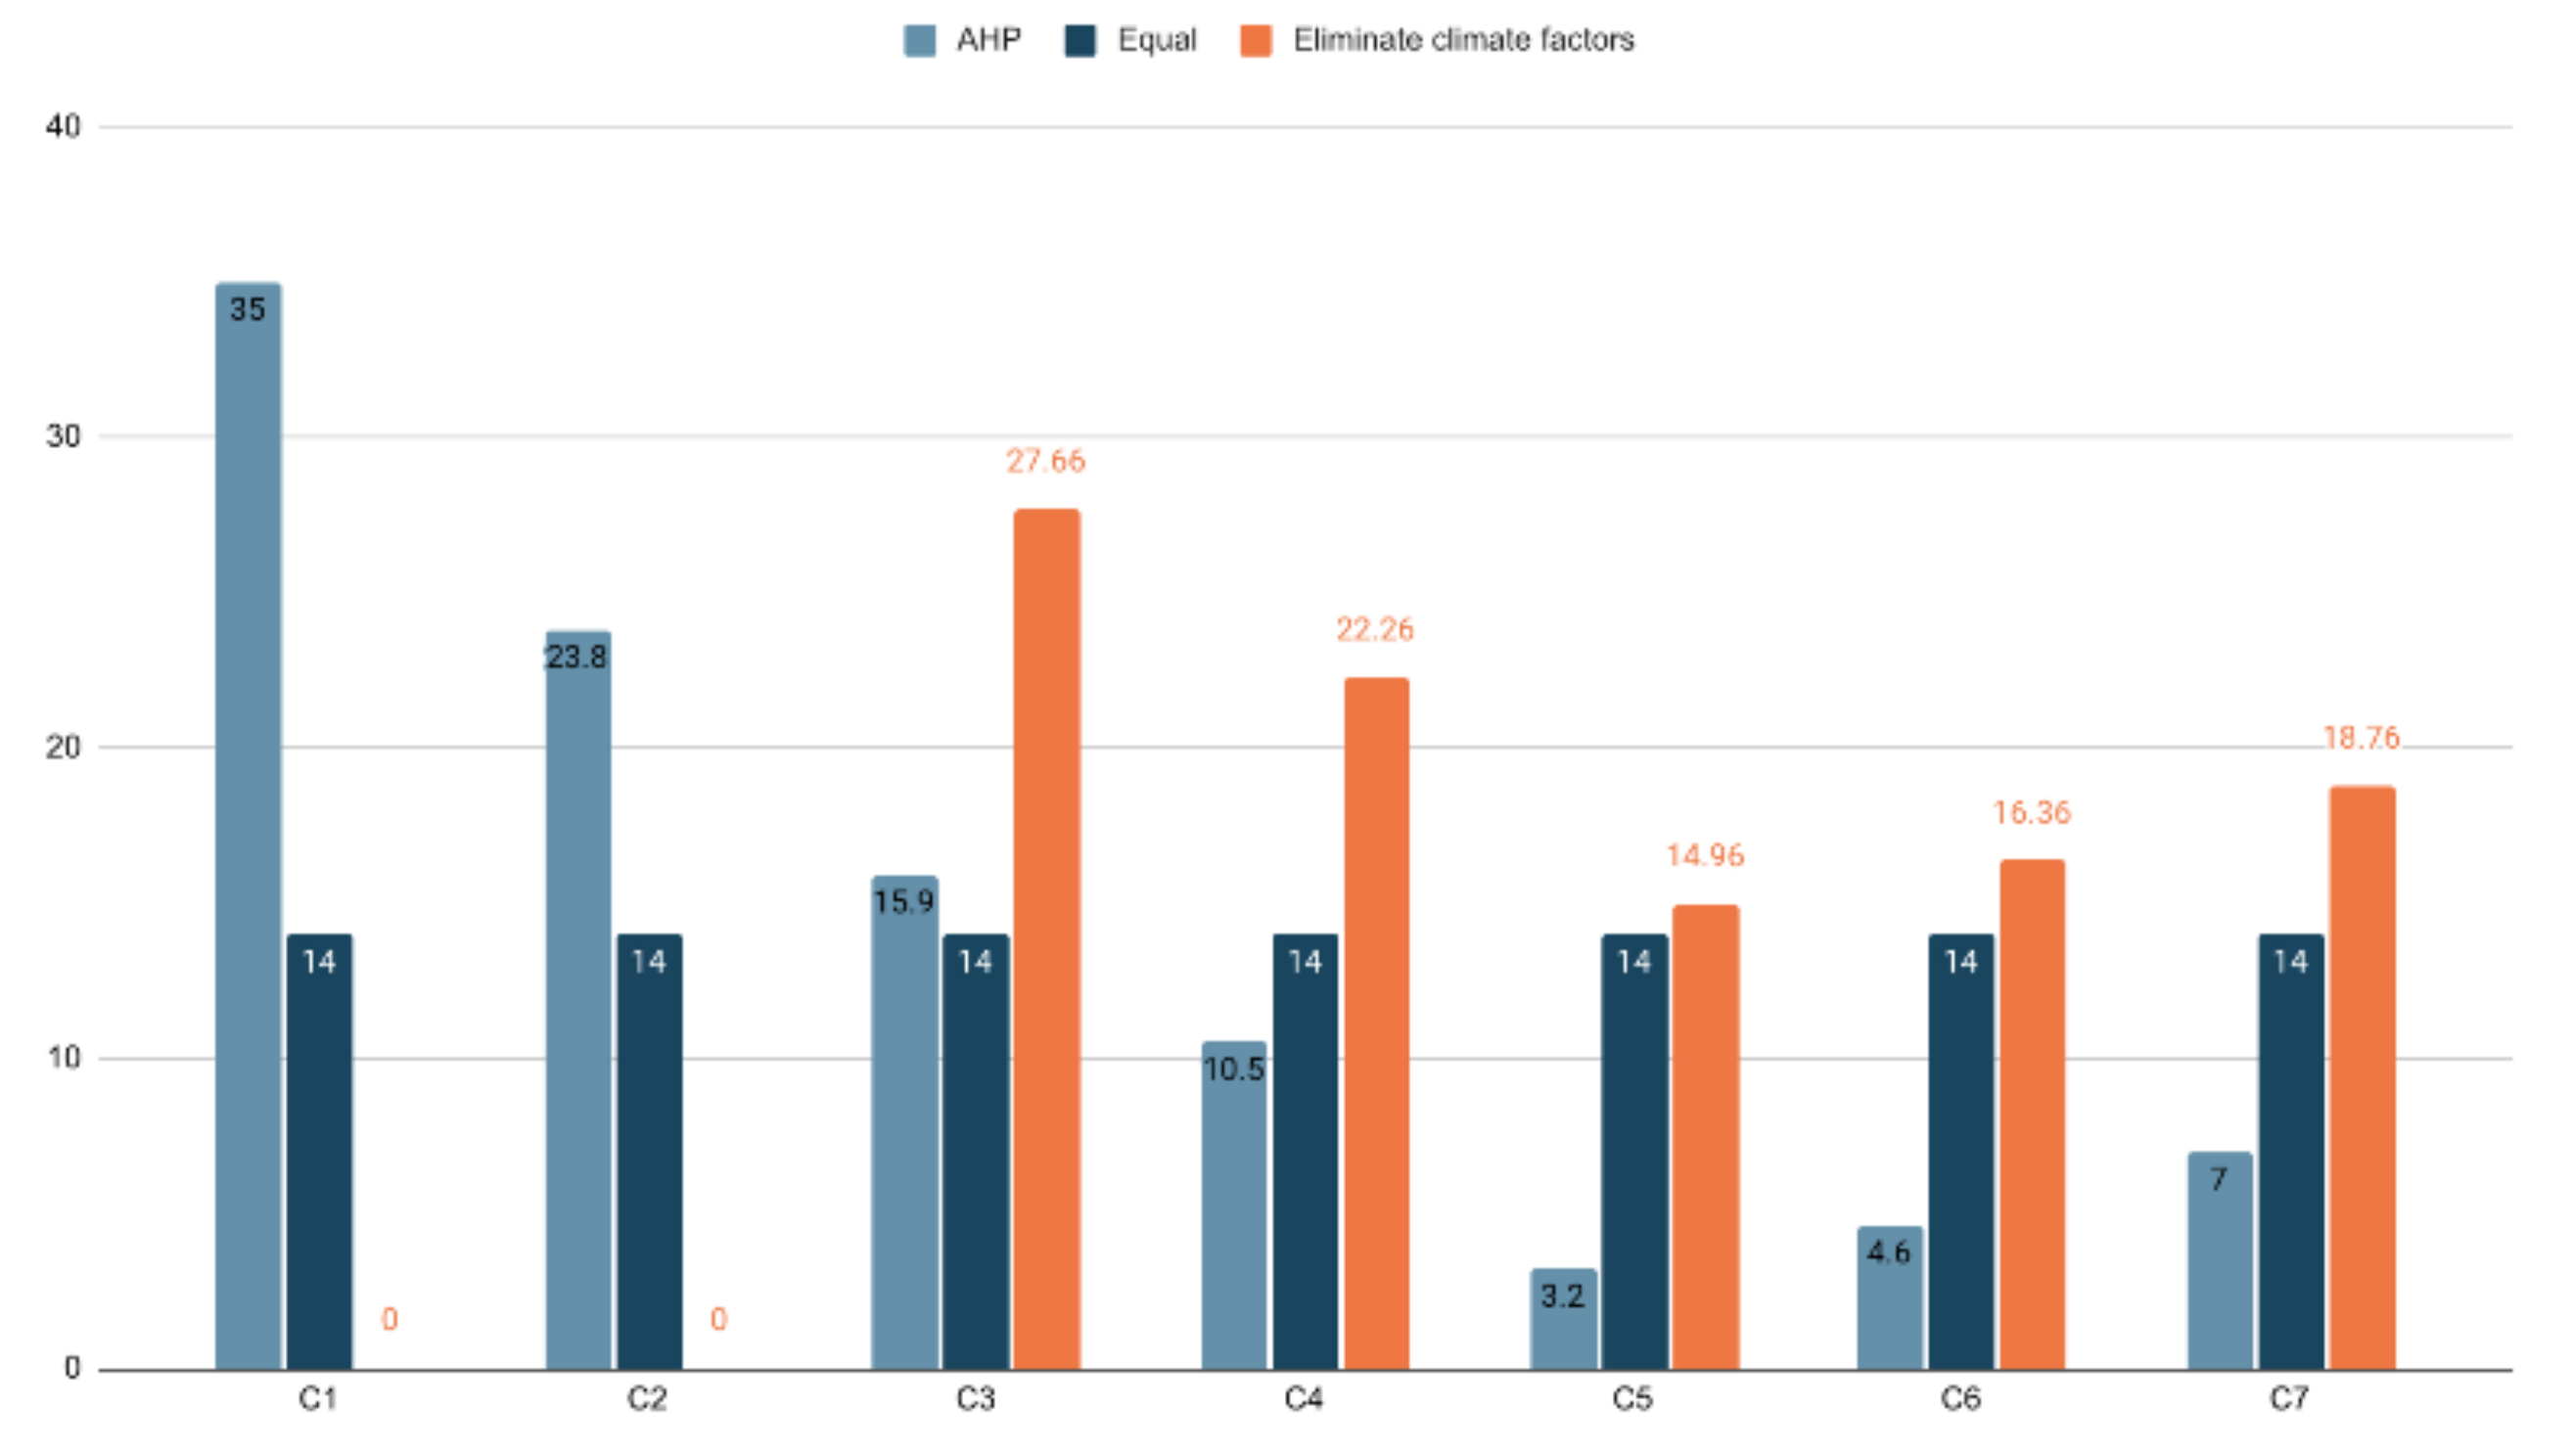
Seven factors were chosen as the decision criteria for producing a suitability map. Accordingly, RI = 1.32 and CR = 0.02, which are in the acceptable range. Figure 8 shows the weight for each criterion. As presented, solar radiation has a weight of 35%, which has the biggest impact on the final result, followed by temperature, with 23%, and slope, with 15%.
Table 10 presents the selected alternatives and the selected criteria. In total, 21 alternatives (cities) had accessible data and satisfied the purpose of this study. In Table 10, the entry values represent the average of collected data of the corresponding criteria. Column C1 represents the average of solar radiation for each city; C2 represents the average value of temperature; C3 represents degree slope under 5 degrees, representing the area selected in the cities; and for C4, only south-facing areas inside each city are selected. C5 represents the cover area 50 km from the center of each city. C6 represents a buffer for road lines. C7 represents a 1000-m buffer for power lines.
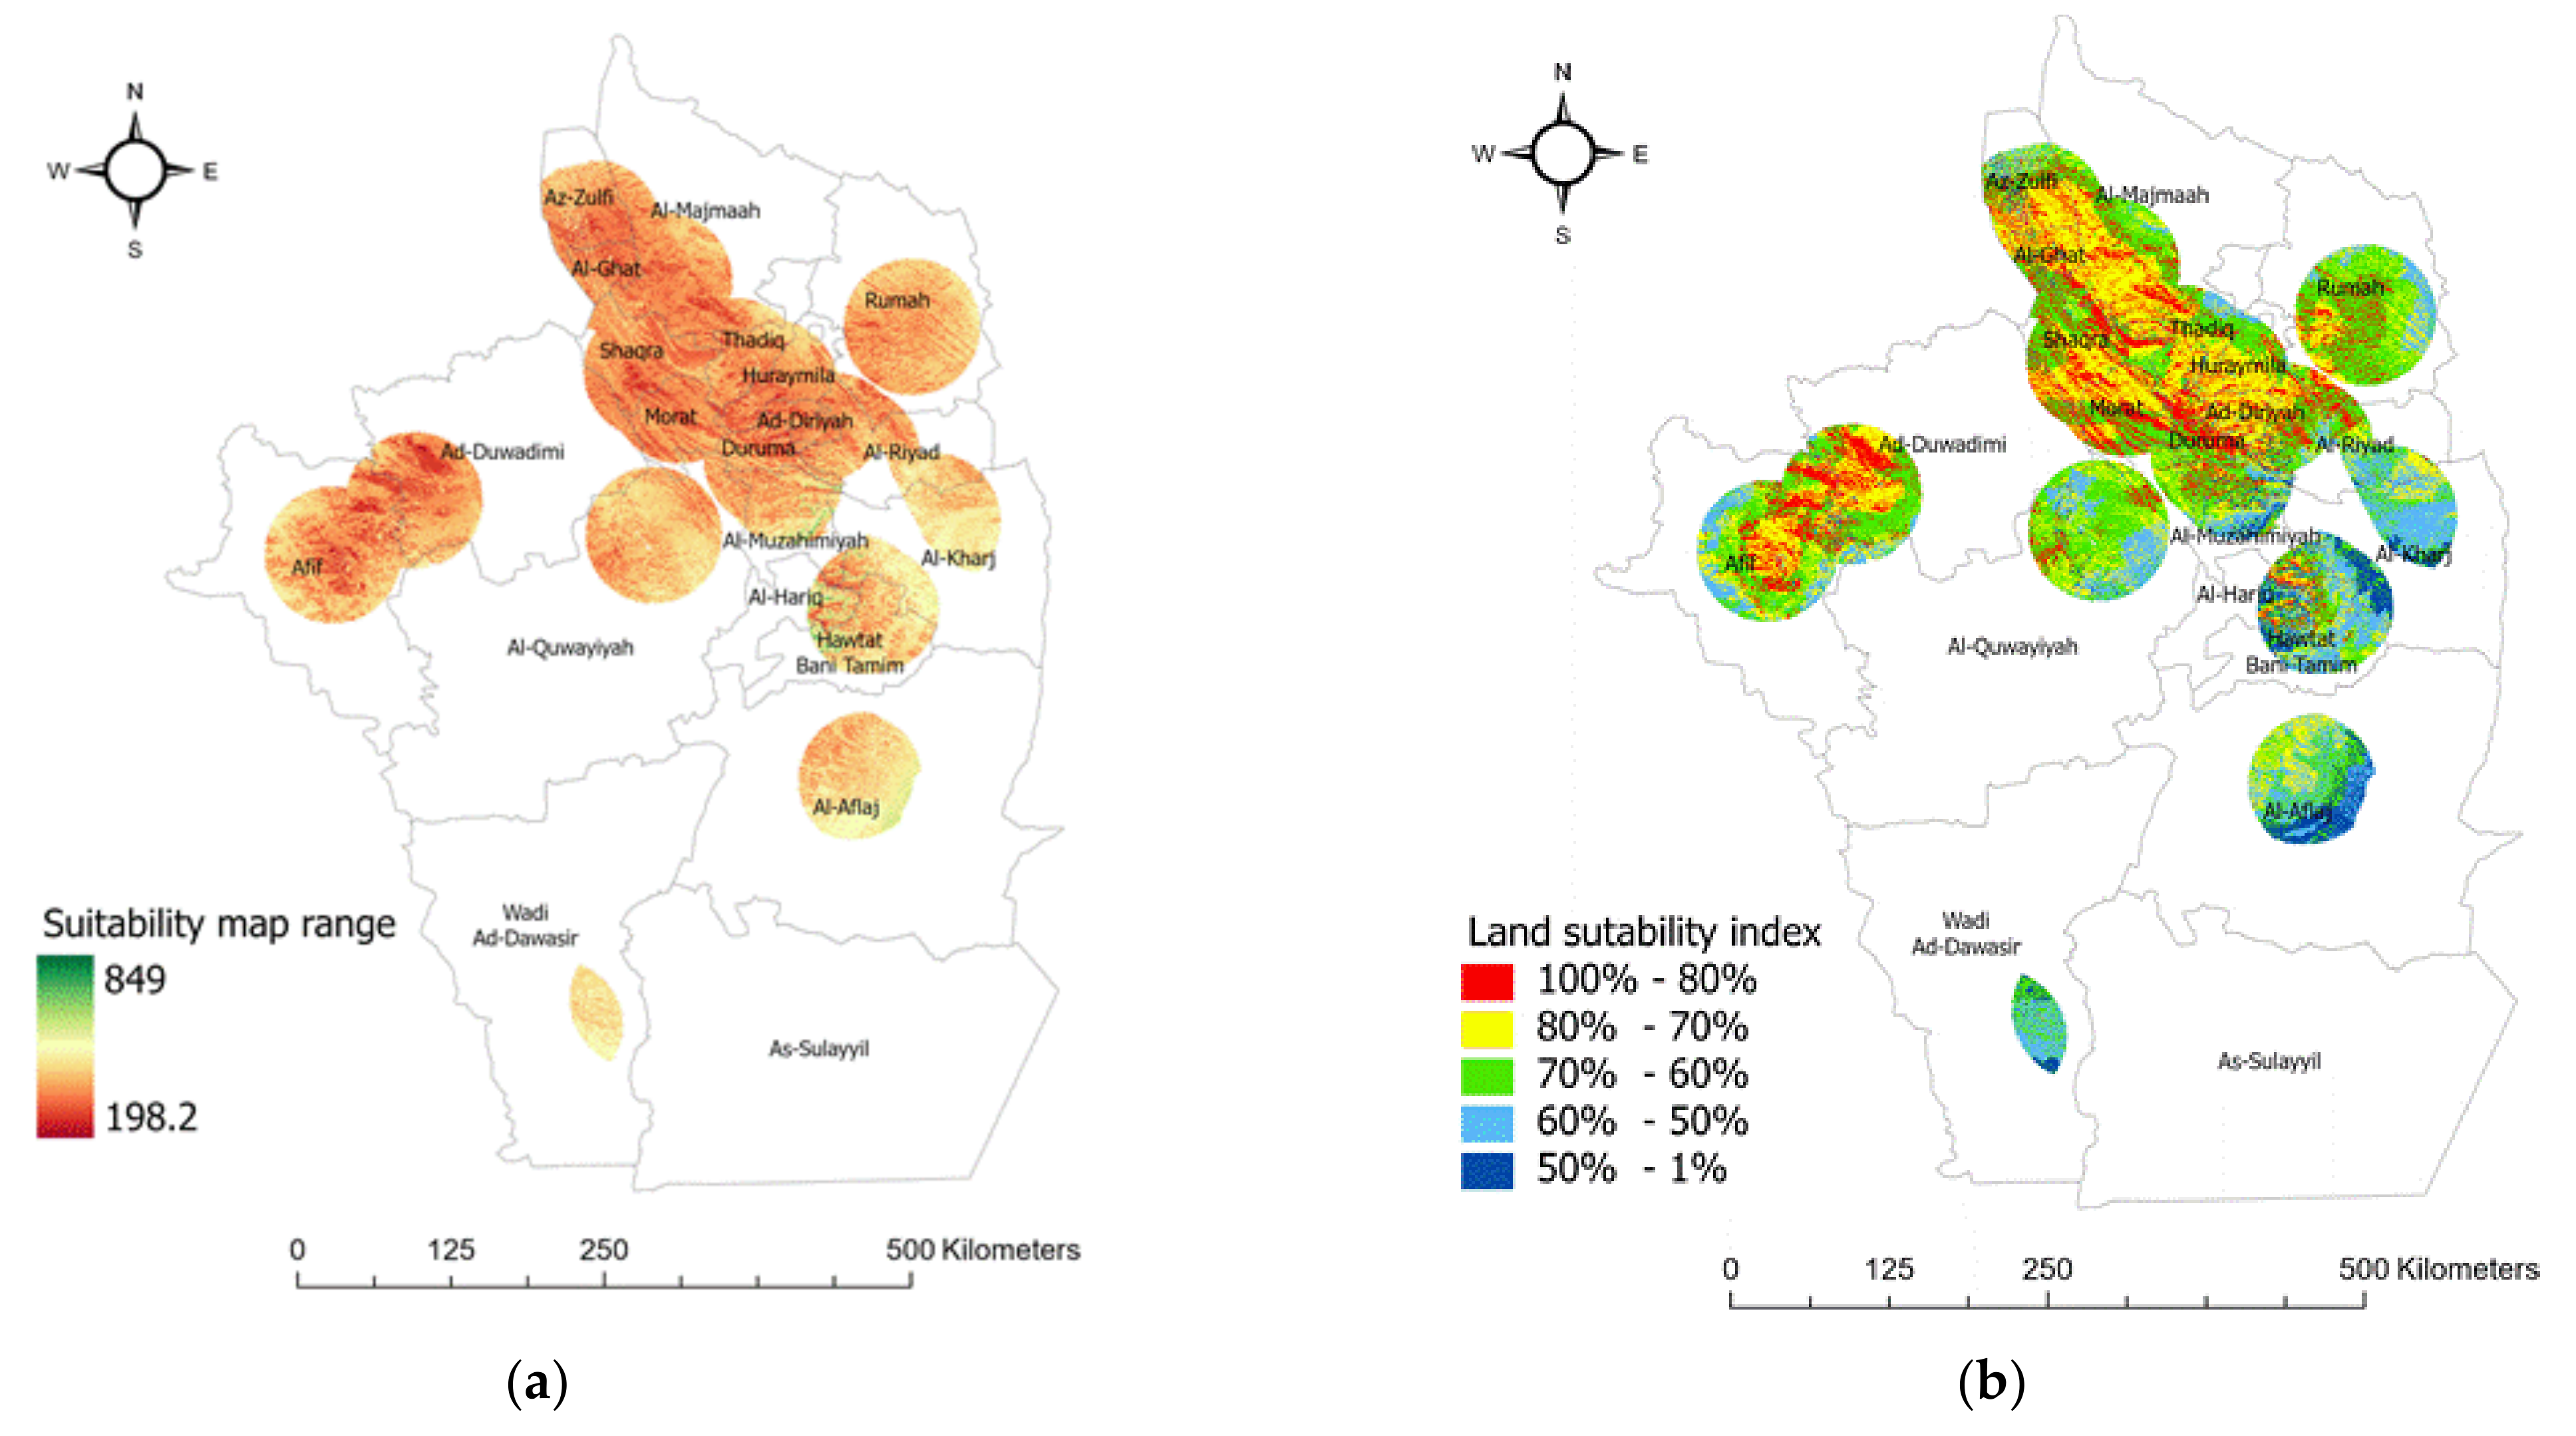
Figure 9a shows the results of the final suitability model, which indicate the range of suitability, where dark red and low values indicate the most suitable areas. The resulting range of suitability is from 198, which indicates the highest suitability, to 849, as shown in Figure 9a. This range is a combination of all of the criteria classified into 10 classes from 1 to 10, where 1 is the most suitable class, as presented in Figure 9.
To discuss the results, the land suitability index (LSI) was defined, as shown in Table 11. This index can help to define the degree to which each site is suitable for PV projects according to the associated criteria and excluding all restrictions. Accordingly, the final results were reclassified according to the LSI, as presented in Table 11, and the results are shown in Figure 9b. The most suitable range is represented by a suitability degree > 80%; a highly suitable area has a range between 70% and 80%; a moderately suitable area has a range between 70% and 60%; a marginally suitable area has a range between 60% and 50% and, finally, the least suitable area is < 50%.
As shown in Figure 9b, the most suitable and also the highly suitable areas are located in the north and northwest, which are represented by classes 1 and 2. This is due to the lower temperature and higher solar radiation as well as the high density of main roads and power lines, as presented in Figure 5. It is also shown that the western areas of Riyadh mostly have higher solar radiation than the north, as shown in Figure 5. On the other hand, in the southern areas, classes 4 and 5 dominate; this may be due to the higher temperature and the low density of main roads and power lines, which is mainly due to the low population density.
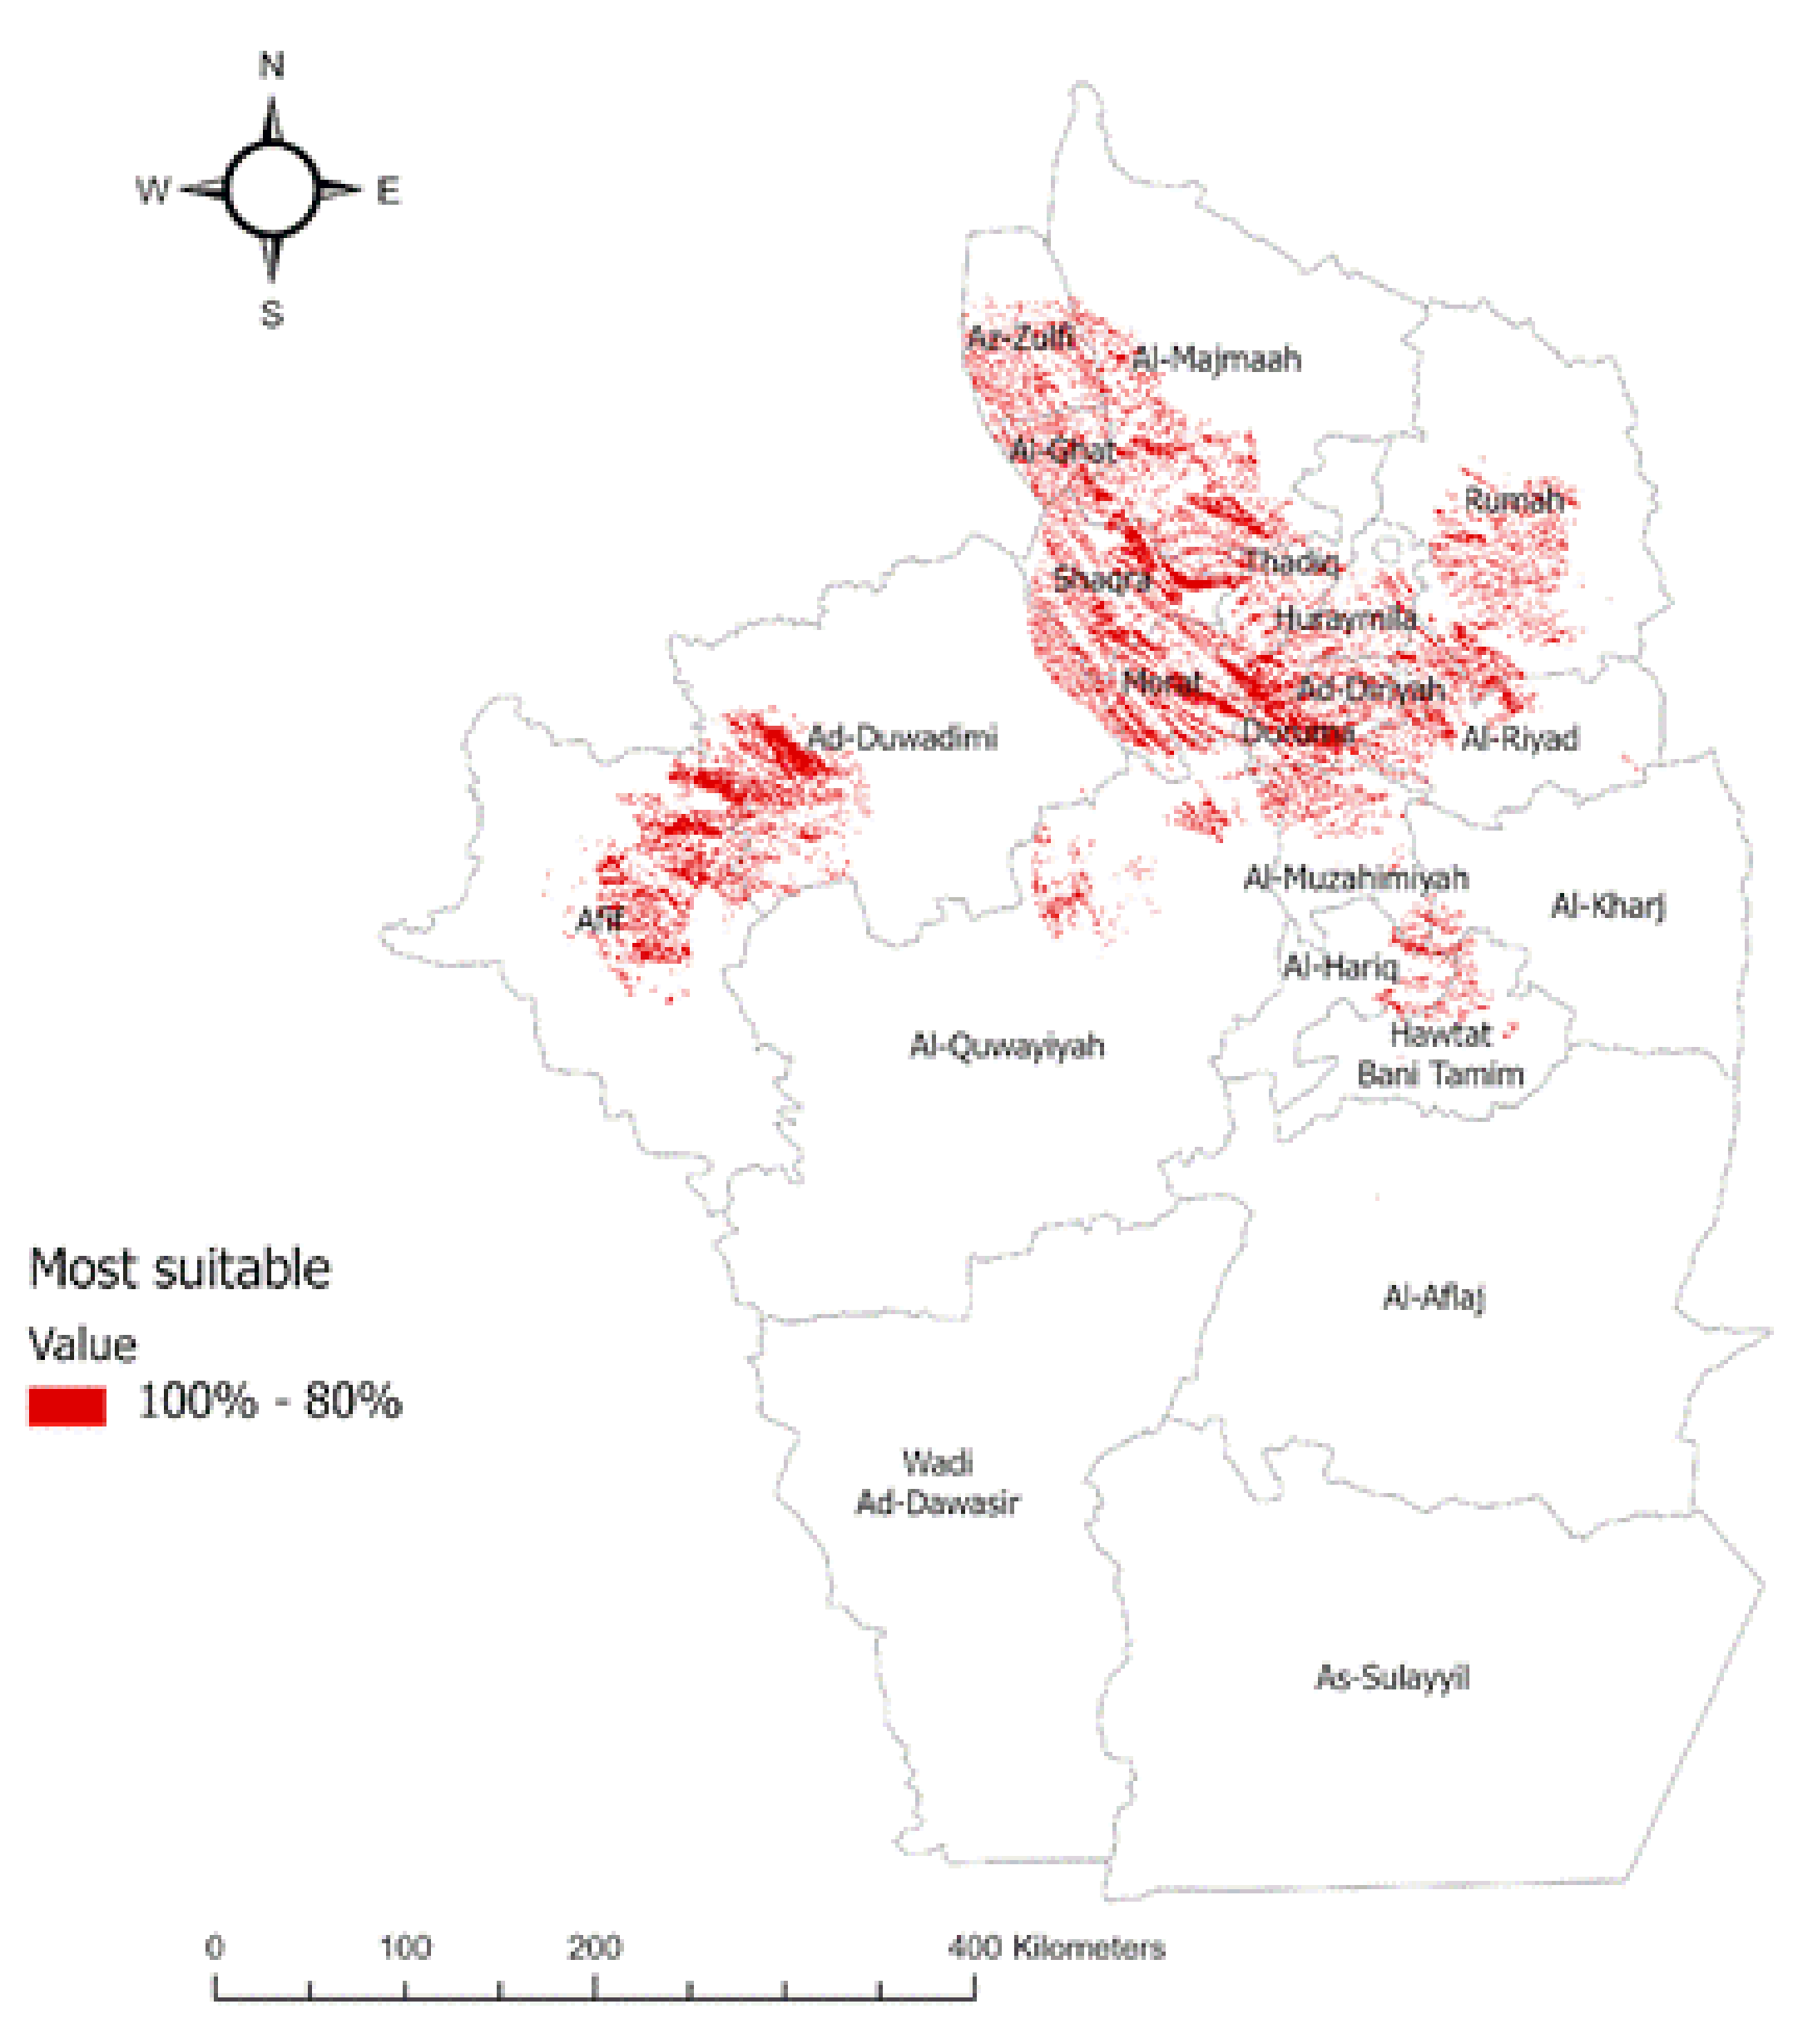
By analyzing these spatial locations and their degree of suitability, it was found that areas with a suitability rate greater than 80% are distributed in the north and northwest of the Riyadh region, as presented in Figure 10, with an area of 16,748 Km2. Figure 11 and Table 12 illustrate the score of the region along with the area percentage for each city. Afif has the largest suitable area, followed by Dawadmi and Al Majma’ah. On further analysis, Afif obtained a high score because it combines a high average solar radiation of 2.631687 MWh/m2/year and a low temperature with an average of 26.3 °C, as well as having flat areas with a slope under 5, followed by Dawadmi and Al Majma’ah with a most suitable area that represents 11% of their areas. In the middle of Riyadh, Diriyah and Murrat have the same average of solar radiation, which is around 2.58 Mw. However, Diriyah has a very low score because it has non-south-facing areas and has a slope higher than 5 degrees; it also includes mountain areas, which affects its score negatively. On other hand, Wadi ad-Dawasir and As Sulayyil are excluded from having a suitability rate above 80%, despite having high solar radiation, because they have the highest temperatures at values of 27.9 °C and 27.3 °C.
The solar site suitability analysis conducted in this research can be proactive step for supporting decision-makers in finding and selecting the most suitable locations for developing PV systems in the Riyadh region—whether they are small-scale PV systems or large-scale PV systems. Large-scale PV systems in specific empty lands that achieve a high degree of suitability, such as areas with an 80% suitability rate as shown in Figure 10, can serve one or more neighborhood with electricity and a supporting power grid, while small-scale PV systems can be developed on buildings’ roof tops.
To validate the model, the results were compared with two different studies that were conducted in Saudi Arabia and used a ground-based station approach [37,38]. The first study [37] presents a detailed analysis of one-year solar radiation data and energy PV systems at 44 different locations in Saudi Arabia. The authors concluded with top selected sites, and Afif was the fourth best site, which supports the results of our study. The second study [38] also used monitoring sensors that are installed in 32 different locations in Saudi Arabia. These sensors measure real-time solar radiation and air temperature. Their results are consistent with the results of the proposed model that used GIS-AHP. As an example, Afif and Dawadmi have a lower air temperature both in their results and in the presented model (with yearly average temperature ≈26 °C) and high solar irradiation (annual average of GHI ≈6.5 kWh/m2) for their results and for the proposed model (7.2 kWh/m2), showing them to be sites with good suitability [38], which is compatible with the proposed results. Additionally, the Al-Aflaj site gives high generated energy due to the high solar radiation compared to all locations (≈ 7 kWh/m2) [38]. However, in the proposed study, it had a low suitability index due to the low distribution of power lines, major roads, and urban areas.
Sensitivity analysis is an important step in the AHP to check the reliability of a suitability model. The data in MCDM problems are often changeable and the judgments are subjective; therefore, it is important to perform a sensitivity analysis to test the stability of the rankings under varying weights. Changes in the priorities can be observed by increasing or decreasing the weights of individual criteria.
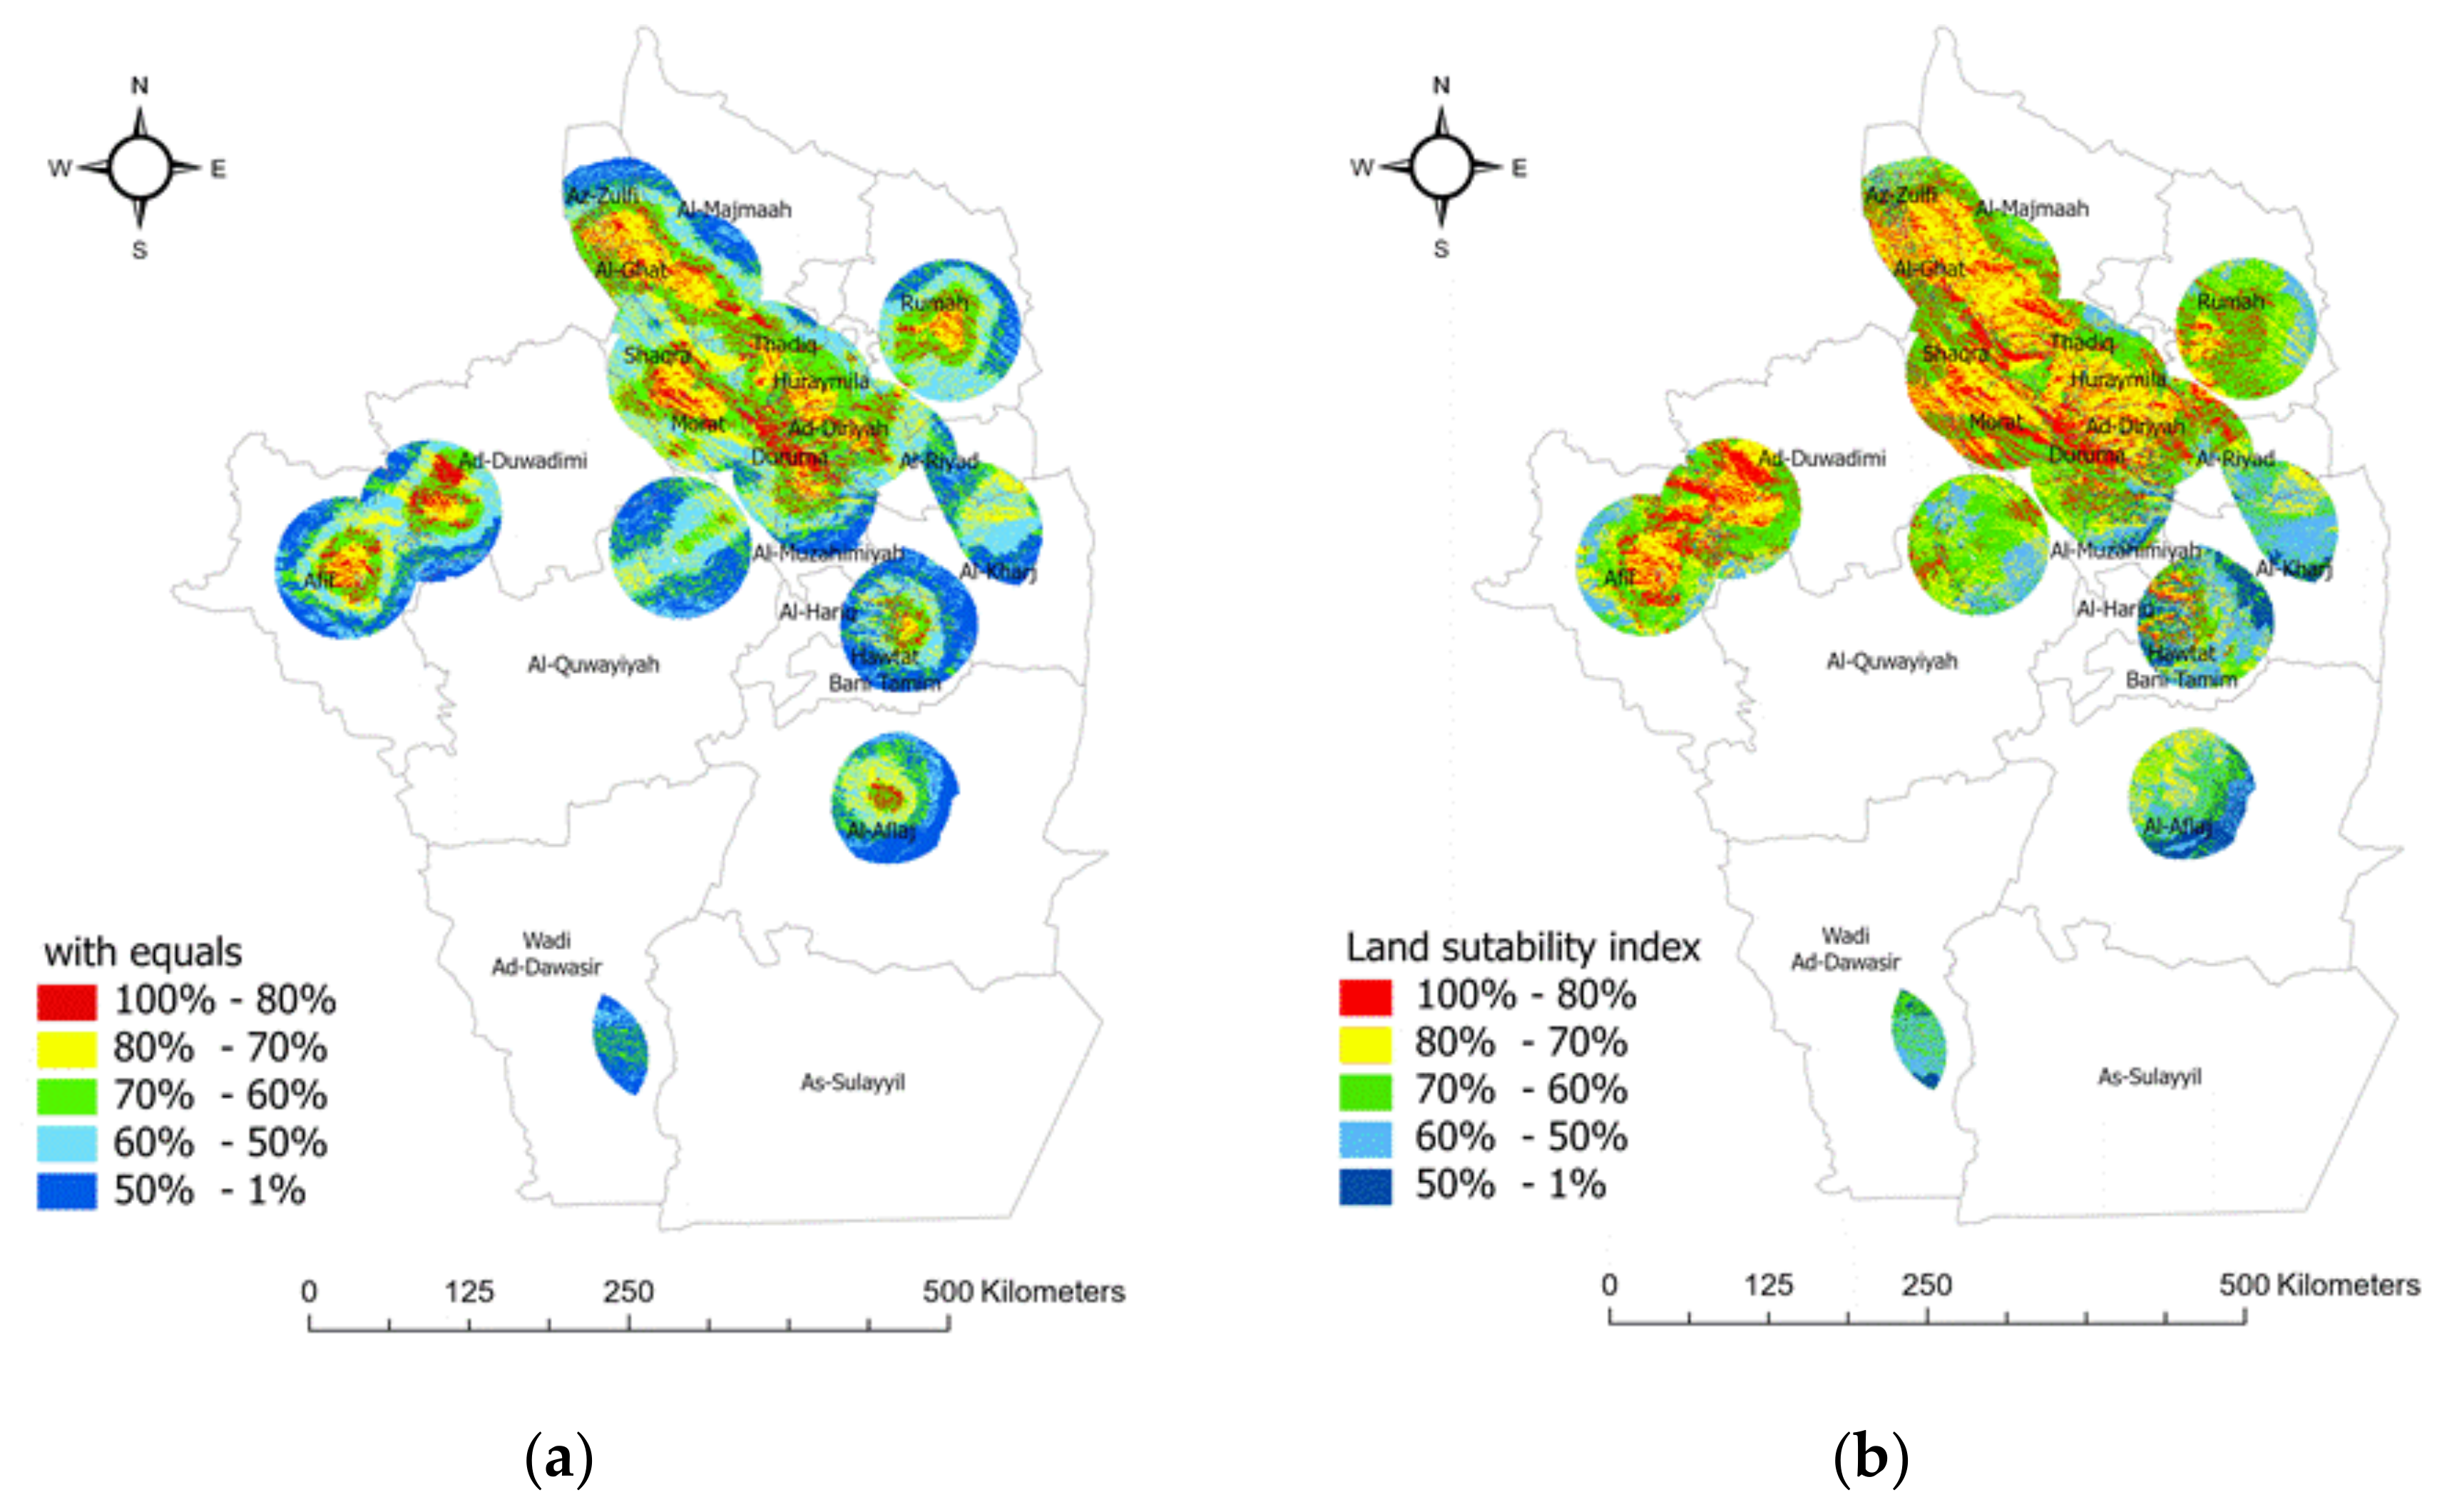
A sensitivity analysis was performed to check how alterations in the parameters change the results. Different scenarios were generated by making slight modifications to the input data (weight values) as shown Figure 12 in order to be able to compare them with the suitability map produced earlier. The first scenario included equal weightings for all seven factors; Figure 13 and Table 13 shows the stability of the model. According to the equal weight sensitivity analysis, the stability of the model can be confirmed, since the main trends observed by visual inspection match the original model. Although considerably fewer class 4 values emerged, these are still present in the same preferred region. In either case, the highest suitability values are mostly scattered in the north and northwest areas of the study region.
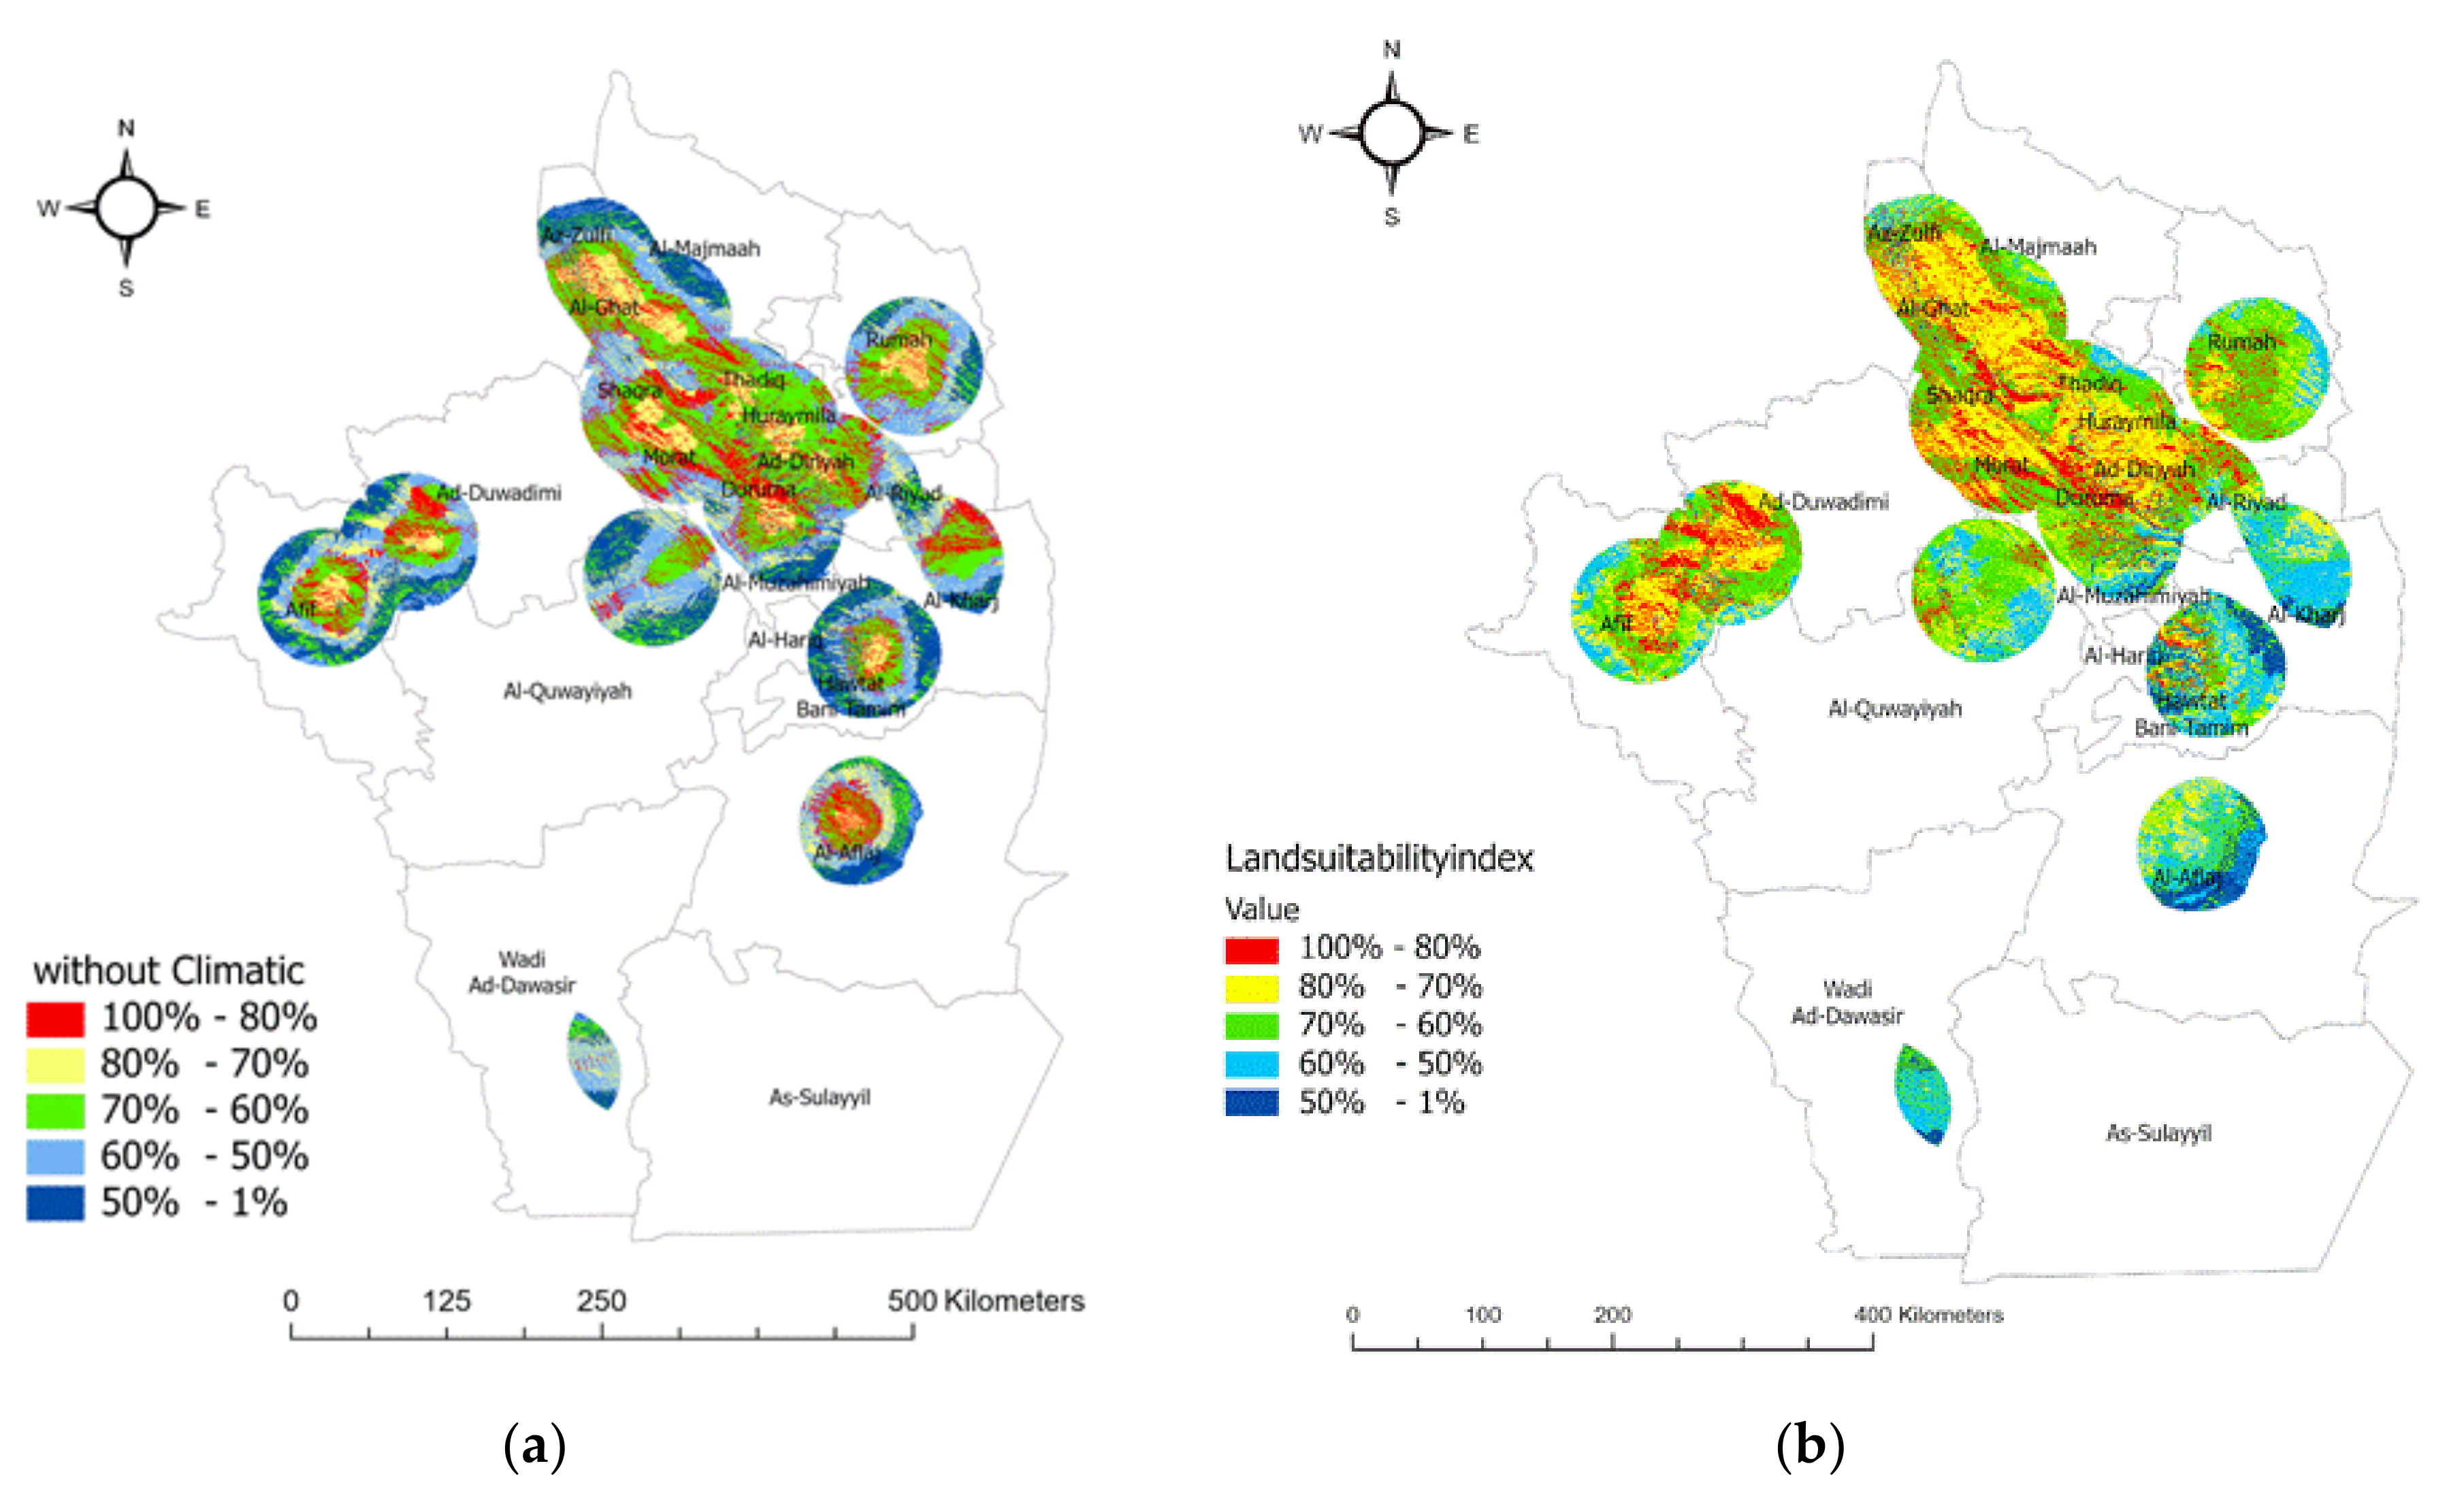
Secondly, the model was tested without the influence of the climatic factor as shown in Figure 14 and Table 14. Solar radiation and temperature, which have the two greatest weights, were ignored, while the remaining factors kept the same proportions to each other as produced in the AHP criteria weighting (slope and aspect factors remained with weights of 27.66% and 22.26% respectively; urban areas, main roads and electricity factors with weights of 14.96%, 16.36%, and 18.76%, respectively). This scenario evaluated the suitable locations without considering the climatic factor influencing solar sites’ performance. The second scenario did not consider solar radiation and temperature data. As a result, the suitable sites identified did not follow the same patterns as in the original model. Higher values were predominantly determined by the slope factor as well as aspects.
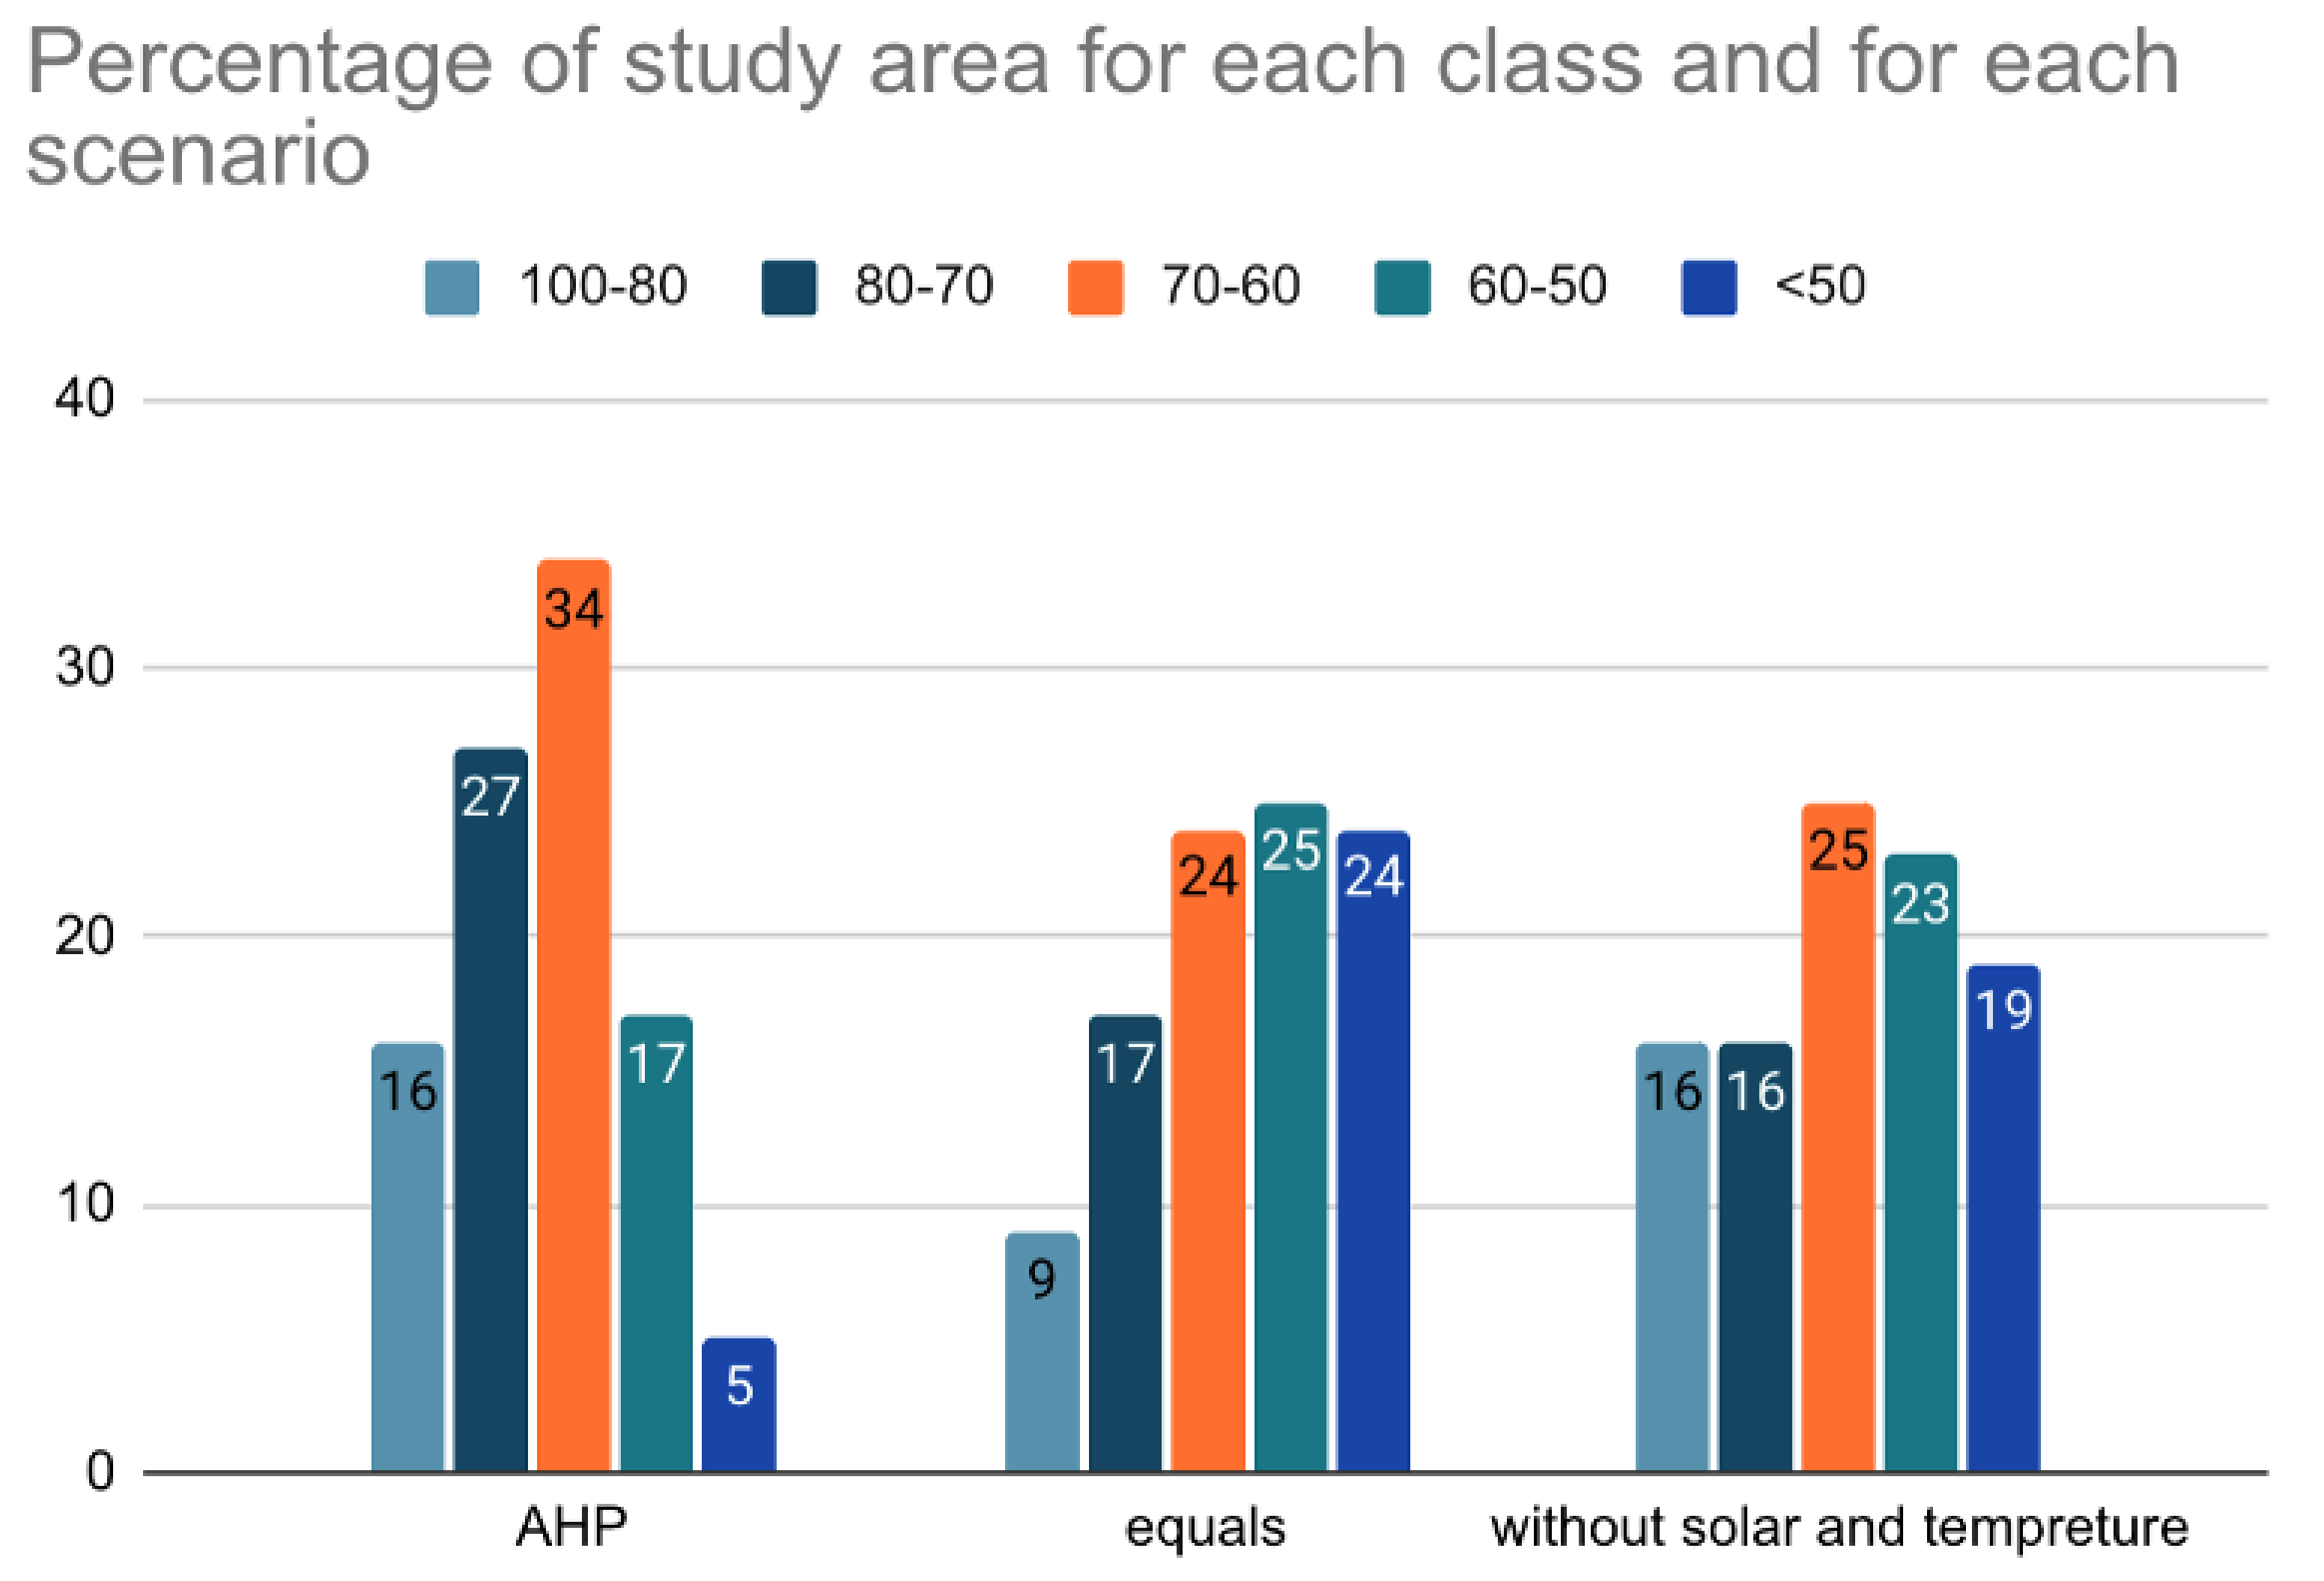
Both sensitivity analysis results show lower values for the highest suitability index as presented in Figure 15 and Figure 16. The most suitable LSI area decreased by 7% around the whole study area for the first scenario and by 0.01% for the second scenario. The highly suitable LSI area decreased by 10% around the whole study area for the first scenario and by 11% for the second scenario. The moderately suitable LSI area decreased by 10% around the whole study area for first scenario and by 9% for the second scenario. The marginally suitable LSI area increased by 8% around the whole study area for first scenario and by 6% for the second scenario. The least suitable LSI area increased by 19% around the whole study area for first scenario and by 14% for the second scenario as shown in Table 15.
Overall, in both cases, the highest category values covered a lesser area. The outcome visualizes the sensibility of the suitability layer to the influences of criteria weights and was found to be both sensitive and robust enough to incorporate different criteria originating from various possible interest groups.
5. Conclusions
In this study, a spatial GIS-MCDA framework was proposed to perform a geospatial analysis of solar energy in the Riyadh region depending on seven criteria, namely solar radiation, temperature, slope, aspects, distance to power lines, distance to main roads, and distance to urban areas. The framework contains four layers: the first layer is data collection, which includes identifying the study area and defining the criteria. The second layer includes the spatial analysis process, such as surface analysis, geometric operations, and distance operations, and is followed by the third layer, which is the spatial decision support layer, in which the analytical hierarchical process (AHP) is used. Finally, the fourth layer, which is the visualization layer, consists of the final results that are represented by the suitability map and the land suitability index of the Riyadh region.
The results show that the most suitable sites are in the north and northwest of the Riyadh region, with an area of 16,748 Km2 and an 80% suitability degree. Moreover, Afif city had the largest suitability score. It has high solar radiation with an average of 2.631687 MWh/m2/year and low temperature with an average of 26.3 °C, as well as having flat areas with a slope under 5. The result was validated by comparing it with two studies conducted in Saudi Arabia using a ground-based stations approach, which showed that the results are consistent and valid. Additionally, a sensitivity analysis was used for evaluation.
In future works, different evaluation criteria such as humidity, population and dust storms can be considered to obtain a suitability map. In addition, the Fuzzy AHP algorithm can be used and evaluated to obtain a suitability map. It is recommended to also study different regions in Saudi Arabia and provide their results. Furthermore, the site suitability for wind energy can also be explored.
It is also suggested for future work to discuss the sustainability of the proposed framework and use different parameters to assess the extent to which the framework can provide sustainable solutions. There are different aspects of sustainability, including economic, social, and environmental aspects [39]. Accordingly, under each aspect, many parameters can be used to measure sustainability. For the economic aspect, the cost of the required solar panels can be computed. Additionally, the benefit of installing solar panels can be computed depending on the area of the suggested suitable sites. Regarding the environmental aspect, pollution reduction, and the land use can be considered. For the social aspect, public acceptance is a key factor in the installation of solar panels in specific sites. All of these measurements can be used to evaluate the sustainability of the suggested sites for installing solar panels [40].
Author Contributions
All authors contributed equally to the work presented in this paper. All authors have read and agreed to the published version of the manuscript.
Funding
This research project was supported by a grant from the “Research Center of the Female Scientific and Medical Colleges”, Deanship of Scientific Research, King Saud University.
Data Availability Statement
The data of ‘Distance from power lines’ can be found on OpenStreetMap (https://data.nextgis.com/en/region/SA/ (accessed on 22 March 2021)). For ‘Temperature’ data it can be found on SolarGIS (https://solargis.com/maps-and-gis-data/download/saudi-arabia (accessed on 22 March 2021)). For ‘Distance from building areas’ Mapcruzin (https://mapcruzin.com/free-saudi-arabia-country-city-place-gis-shapefiles.htm (accessed on 22 March 2021)).
Acknowledgments
The authors thank the Deanship of Scientific Research and RSSU at King Saud University for their technical support.
Conflicts of Interest
The authors declare no conflict of interest.
References
- Crabtree, G.W.; Lewis, N.S. Solar energy conversion. Phys. Today 2007, 60, 37–42. [Google Scholar] [CrossRef]
- Bruggink, J.; Van Der Zwaan, B. The role of nuclear energy in establishing sustainable energy paths. Int. J. Glob. Energy Issues 2002, 18, 151. [Google Scholar] [CrossRef]
- Elshurafa, A.M.; Muhsen, A.R. The Upper Limit of Distributed Solar PV Capacity in Riyadh: A GIS-Assisted Study. Sustainability 2019, 11, 4301. [Google Scholar] [CrossRef] [Green Version]
- Asif, M.; Hassanain, M.A.; Nahiduzzaman, K.M.; Sawalha, H. Techno-economic assessment of application of solar PV in building sector. Smart Sustain. Built Environ. 2019, 8, 34–52. [Google Scholar] [CrossRef]
- Effat, H.A. Mapping Solar Energy Potential Zones, using SRTM and Spatial Analysis, Application in Lake Nasser Region, Egypt. Int. J. Sustain. Land Use Urban Plan. 2016, 3. [Google Scholar] [CrossRef]
- Doorga, J.R.; Rughooputh, S.D.; Boojhawon, R. Multi-criteria GIS-based modelling technique for identifying potential solar farm sites: A case study in Mauritius. Renew. Energy 2019, 133, 1201–1219. [Google Scholar] [CrossRef]
- Nebey, A.H.; Taye, B.Z.; Workineh, T.G. Site Suitability Analysis of Solar PV Power Generation in South Gondar, Amhara Region. J. Energy 2020, 2020, 1–15. [Google Scholar] [CrossRef]
- Tisza, K. GIS-Based Suitability Modeling and Multi-Criteria Decision Analysis for Utility Scale Solar Plants in Four States in the Southeast US. Master’s Thesis, Clemson University, Clemson, SC, USA, 2014. [Google Scholar]
- Al Garni, H.Z.; Awasthi, A. Solar PV power plant site selection using a GIS-AHP based approach with application in Saudi Arabia. Appl. Energy 2017, 206, 1225–1240. [Google Scholar] [CrossRef]
- Al-Shammari, S.; Ko, W.; Al Ammar, E.A.; Alotaibi, M.A.; Choi, H.-J. Optimal Decision-Making in Photovoltaic System Selection in Saudi Arabia. Energies 2021, 14, 357. [Google Scholar] [CrossRef]
- Ibarra, M.; Gherboudj, I.; Al Rished, A.; Ghedira, H. Geospatial assessment of solar energy potential for utility scale parabolic trough collector power plant in Saudi Arabia. In SOLARPACES 2016: International Conference on Concentrating Solar Power and Chemical Energy Systems; AIP Publishing LLC.: Melville, NY, USA, 2017; Volume 1850, p. 160015. [Google Scholar] [CrossRef]
- Choi, Y.; Suh, J.; Kim, S.-M. GIS-Based Solar Radiation Mapping, Site Evaluation, and Potential Assessment: A Review. Appl. Sci. 2019, 9, 1960. [Google Scholar] [CrossRef] [Green Version]
- Li, D. Using GIS and Remote Sensing Techniques for Solar Panel Installation Site Selection. Master’s Thesis, University of Waterloo, Waterloo, ON, Canada, 2013. [Google Scholar]
- Ruiz, H.S.; Sunarso, A.; Ibrahim-bathis, K.; Murti, S.A.; Budiarto, I. GIS-AHP Multi-Decision-Criteria-Analysis for the Optimal Location of Solar Energy Plants at Indonesia. ArXiv Prepr. 2020, arXiv:200715351. [Google Scholar]
- Piirisaar, I. A Multi-Criteria GIS Analysis for Siting of Utility-Scale Photovoltaic Solar Plants in County Kilkenny, Ireland. Master’s Thesis, Geographical Information Science, Lund University, Lund, Sweden, 2019. [Google Scholar]
- Díaz-Cuevas, P.; Domínguez-Bravo, J.; Prieto-Campos, A. Integrating MCDM and GIS for renewable energy spatial models: Assessing the individual and combined potential for wind, solar and biomass energy in Southern Spain. Clean Technol. Environ. Policy 2019, 21, 1855–1869. [Google Scholar] [CrossRef]
- Noorollahi, E.; Fadai, D.; Shirazi, M.A.; Ghodsipour, S.H. Land Suitability Analysis for Solar Farms Exploitation Using GIS and Fuzzy Analytic Hierarchy Process (FAHP)—A Case Study of Iran. Energies 2016, 9, 643. [Google Scholar] [CrossRef] [Green Version]
- Abdelrazek, M. GIS Approach to Find Suitable Locations for Installing Renewable Energy Production Units in Sinai Peninsula. Egypt. Master’s Thesis, University of Salzburg, Salzburg, Austria, 2017; pp. 1–84. [Google Scholar]
- Senteles, A. GIS-Based Multicriteria Decision Analysis Approach on Wind Power Development: The Case Study of Nova Scotia, Canada. Master’s Thesis, Uppsala University, Uppsala, Sweden, 2018. [Google Scholar]
- Alyahya, S.; Irfan, M.A. Analysis from the new solar radiation Atlas for Saudi Arabia. Sol. Energy 2016, 130, 116–127. [Google Scholar] [CrossRef]
- Gašparović, I.; Gašparović, M. Determining Optimal Solar Power Plant Locations Based on Remote Sensing and GIS Methods: A Case Study from Croatia. Remote. Sens. 2019, 11, 1481. [Google Scholar] [CrossRef] [Green Version]
- Zeleny, M. Multiple Criteria Decision Making Kyoto 1975; Springer Science & Business Media: Berlin/Heidelberg, Germany, 2012; Volume 123. [Google Scholar]
- Siksnelyte-Butkiene, E.; Zavadskas, K.; Streimikiene, D. Multi-criteria decision-making (MCDM) for the assessment of renewable energy technologies in a household: A review. Energies 2020, 13, 1164. [Google Scholar] [CrossRef] [Green Version]
- Mahad, N.F.; Yusof, N.; Ismail, N.F. The application of fuzzy analytic hierarchy process (FAHP) approach to solve multi-criteria decision making (MCDM) problems. J. Phys. Conf. Ser. 2019, 1358, 012081. [Google Scholar] [CrossRef] [Green Version]
- Chan, H.K.; Sun, X.; Chung, S.-H. When should fuzzy analytic hierarchy process be used instead of analytic hierarchy process? Decis. Support Syst. 2019, 125, 113114. [Google Scholar] [CrossRef]
- ‘الهيئة العامة للإحصاء’, الهيئة العامة للإحصاء. Available online: https://www.stats.gov.sa/ar (accessed on 27 November 2020).
- KAPSARC | King Abdullah Petroleum Studies and Research Center | Home. KAPSARC. Available online: https://www.kapsarc.org/ (accessed on 21 April 2021).
- Almasoud, A.; Gandayh, H.M. Future of solar energy in Saudi Arabia. J. King Saud Univ. Eng. Sci. 2015, 27, 153–157. [Google Scholar] [CrossRef] [Green Version]
- ‘وزارة الطاقة’. Available online: https://www.moenergy.gov.sa/arabic/Pages/default.aspx (accessed on 9 April 2021).
- Al-Saleh, A.M. The Kirsh gneiss dome: An extensional metamorphic core complex from the SE Arabian Shield. Arab. J. Geosci. 2010, 5, 335–344. [Google Scholar] [CrossRef]
- ‘البوابة الجيومكانية’. Available online: https://geoportal.sa/ (accessed on 6 April 2021).
- National Renewable Energy Laboratory (NREL) Home Page. Available online: https://www.nrel.gov/index.html (accessed on 27 November 2020).
- ArcGIS Hub. Available online: https://hub.arcgis.com/datasets/c87aee58fb0940dc8539c60b179dee42 (accessed on 3 April 2021).
- De Smith, M.J.; Goodchild, M.F.; Longley, P. Geospatial Analysis A Comprehensive Guide to Principles Techniques and Software Tools, 6th ed.; Troubador Publishing Ltd.: Kibworth Harcourt, UK, 2018. [Google Scholar]
- Kulakowski, K. Understanding the Analytic Hierarchy Process; CRC Press: Boca Raton, FL, USA, 2020. [Google Scholar]
- Mishra, B.K.; Kumar, R. Big Data Management and the Internet of Things for Improved Health Systems; IGI Global: Raipur, India, 2018. [Google Scholar]
- Awan, A.B.; Zubair, M.; Abokhalil, A.G. Solar Energy Resource Analysis and Evaluation of Photovoltaic System Performance in Various Regions of Saudi Arabia. Sustainability 2018, 10, 1129. [Google Scholar] [CrossRef] [Green Version]
- Almarshoud, A. Performance of solar resources in Saudi Arabia. Renew. Sustain. Energy Rev. 2016, 66, 694–701. [Google Scholar] [CrossRef]
- Saiu, V. The Three Pitfalls of Sustainable City: A Conceptual Framework for Evaluating the Theory-Practice Gap. Sustainability 2017, 9, 2311. [Google Scholar] [CrossRef] [Green Version]
- Fang, H.; Li, J.; Song, W. Sustainable site selection for photovoltaic power plant: An integrated approach based on prospect theory. Energy Convers. Manag. 2018, 174, 755–768. [Google Scholar] [CrossRef]
Figure 2.
The proposed framework.

Figure 3.
Criteria maps used in the proposed GIS-MCDM: (a) Temperature; (b) DEM; (c) power lines; (d) cities; (e) road.
Figure 3.
Criteria maps used in the proposed GIS-MCDM: (a) Temperature; (b) DEM; (c) power lines; (d) cities; (e) road.

Figure 4.
(a) Solar radiation resulting from a solar tool, which is derived from DEM; the value unit is WH/m2/year. Results of slope (b) and aspect (c). Results of Euclidean distance algorithm with range value of 0 to 50 km for (d) road, (e) electricity network, and (f) building areas.
Figure 4.
(a) Solar radiation resulting from a solar tool, which is derived from DEM; the value unit is WH/m2/year. Results of slope (b) and aspect (c). Results of Euclidean distance algorithm with range value of 0 to 50 km for (d) road, (e) electricity network, and (f) building areas.

Figure 5.
Criteria range of suitability: (a) temperature, (b) solar radiation, (c) slope, (d) aspects, (e) cities, (f) roads and (g) power lines.
Figure 5.
Criteria range of suitability: (a) temperature, (b) solar radiation, (c) slope, (d) aspects, (e) cities, (f) roads and (g) power lines.


Figure 6.
Comparison matrix of the adopted decision criteria.

Figure 7.
Process for identifying the preferred locations of solar energy projects in Riyadh.

Figure 8.
Final GIS criteria weights.

Figure 9.
(a) Solar suitability map of Riyadh region. (b) Land suitability index.

Figure 10.
Distribution of sites with a suitability factor greater than 80% in the cities.

Figure 11.
Distribution of sites with a suitability factor greater than 80% in the cities.

Figure 12.
Weights of decision criteria considering different scenarios.

Figure 13.
Sensitivity analysis with equal weights (a); original (b).

Figure 14.
Sensitivity analysis without climatic factors (a); original (b).

Figure 15.
Area in km per suitability (comparison of suitability and sensitivity analysis results).

Figure 16.
Percentage of study area for each class and for each scenario.


Table 1.
Remote sensing and site suitability studies.
| Method | Ref, Year | Study Area | Data | GIS Tool | Result | Validation Model |
|---|---|---|---|---|---|---|
| GIS-AHP | Ref. [9], 2017 | Saudi Arabia | Renewable Atlas, (K.A.CARE) | ArcGIS | Suitability map | Sensitivity analysis |
| Ref. [14], 2020 | Indonesia | One Map Kalbar, WebGIS DEN, IMEF WebGIS, PLN, (WBG) | ArcGIS | Suitability map | Sensitivity study | |
| Ref. [5], 2016 | Lake Nasser, Egypt | SRTM, Landsat ETM+, Egyptian General Survey Authority | ArcGIS | Suitability index | Model validation | |
| Ref. [6], 2019 | Mauritius | Government agency | ArcMap | Suitability map | Sensitivity analysis | |
| Ref. [7], 2020 | Amhara | NASA | ArcGIS | Suitability map | Sensitivity analysis | |
| Ref. [13], 2013 | Waterloo | GRCA, Regional Municipality, Municipal Data, DMTI, MNR | ArcGIS | Determined potential sites for solar power production | On-site feasibility assessment | |
| Ref. [15], 2019 | Kilkenny, Ireland | Irish National Grid | ArcGIS | Suitability map | Sensitivity analysis | |
| TOPSIS | Ref. [8], 2014 | Southeast US | National Renewable Energy Laboratory (NREL) | ArcGIS | Three suitability maps | Sensitivity |
| AHP- TOPSIS | Ref. [10], 2021 | Saudi Arabia | K.A. CARE, Alaska Satellite facilities, KAPSARK | PVGIS | Suitability map | None |
| Ref. [16], 2013 | Southeast Spain | Government | gvSIG | Suitability map | Sensitivity study | |
| AHP Fuzzy | Ref. [17], 2016 | Iran | National Oceanic and Atmospheric Administration (NOAA) | ArcGIS | Suitability map | No |
| Weighted Linear Combination (WLC) | Ref. [19], 2018 | Nova Scotia, Canada | NS Gov, OpenStreetMap, Open Government | ArcGIS | Suitability map for wind | Sensitivity analysis |
| Ref. [11] | Saudi Arabia | WBD, Arabia Renewable Resource Atlas | WebGIS | Suitability map | None | |
| Ref. [18], 2017 | Sinai, Egypt | Global Solar Atlas, SRTM, FAO, Egyptian Survey Authority, WDPA, | ArcGIS | Suitability map | Sensitivity analysis |
Table 2.
Comparison between multi-criteria decision analysis (MCDA) methods [23].
Table 2.
Comparison between multi-criteria decision analysis (MCDA) methods [23].
| Methods | Strengths | Weaknesses |
|---|---|---|
| Analytic Hierarchy Process (AHP) | -Computational simplicity -Method adaptability and applicability -Evaluates qualitative and quantitative criteria and alternatives on a similar preference scale -Intuitive method of problem solving -Hierarchical structure offers excellent focus on each criterion used in the calculation | -Results are affected by interdependence between objectives and criteria -Model complexity increases when more decision makers are involved -Additional analysis is required to verify the results |
| Weighted Linear Combination (WLC) | -Very simple computation process -Suitable for managing single-dimension problems | -It does not integrate multiple preferences -Only one dimension-Issues with weight allocation for objective functions -Does not achieve optimal solutions in non-convex problems |
| Technique for Order of Preference by Similarity to Ideal Solution (TOPSIS) | -Works with a fundamental ranking -Uses all allocated information -Interdependency of attribute preferences is not required -Rational and comprehensible logic -Simple mathematical form | -Based on Euclidean distance; negative and positive values do not influence calculations -A strong deviation of one indicator from the ideal solution strongly influences the results -The method is only suitable when the indicators of alternatives do not vary very strongly -All attribute values must be numeric |
| Fuzzy Analytic Hierarchy Process (FAHP) | -Takes into consideration the vagueness, imprecision, and uncertainty associated with the process | -Affected by stakeholder preferences |
Table 3.
Description of the evaluation criteria.
| Criteria | Description |
|---|---|
| Solar radiation | The most crucial factor in finding the most suitable locations for solar power plants. These locations should receive sufficient sunlight throughout the year [18]. |
| Temperature | PV performance can be affected by the increasing temperature of PV cells. The best value of temperature in solar energy production is lower than 25 °C. Every increase of 1 °C will lead to a decrease in the power output (PV) of 0.4–0.5% [13]. |
| Distance from roads | Proximity to roads reduces the cost of constructing and maintaining the infrastructure of a solar energy project [13]. |
| Distance from power lines | Proximity of solar projects to an electricity network infrastructure is preferable to connect supply with demand [13]. |
| Distance from building areas | Close proximity to the city is preferable to support buildings with energy and decrease economic effects [9]. |
| Elevation | The elevation of a geographic location is its height above or below a fixed reference point, such as Earth’s sea level. Higher elevation shows a greater result in receiving solar radiation compared with lower elevation [13]. |
| Slope | The gradient of the land will affect the reception of solar radiation; with flatter land, more radiation will be received [7]. |
| Aspect (orientation) | A critical topographical factor that plays a considerable role in land suitability for PV system location, where south-facing is the best for PVs [10]. |
Table 4.
Constraints.
| No. | Constraint |
|---|---|
| 1 | Based on the NREL report, areas with less than 3.56 kWh/m2 solar irradiance per day were considered as unsuitable in this study because it is not economically feasible [7]. |
| 2 | Areas with a slope of more than 5° were excluded in order to avoid the shadow effect on the generation of the PV system [10]. |
| 3 | Maximum distance of 50 km from roads to obtain an optimum location of the PV system [9]. |
| 4 | Areas at a distance of more than 50 km from the electricity grid were excluded to obtain an optimum location of the PV system [9]. |
| 5 | Areas at a distance of more than 50 km from building areas were excluded to obtain an optimum location of the PV system [10]. |
| 6 | 500-meter buffer to roads [9]. |
| 7 | Excluded non-south-facing aspects in order to avoid the shadow effect on the generation of the PV system [10]. |
Table 5.
Datasets.
| Dataset | Resolution | Source | Format |
|---|---|---|---|
| Temperature | 800 m | 2019 The World Bank, Source: Global Solar Atlas 2.0, Solar resource data: SolarGIS. | Raster |
| Elevation (DEM) | 90 m | Saudi Geological Survey www.gasgi.gov.sa (accessed on 22 March 2021) | Raster |
| Distance from power lines | 500 m | OpenStreetMap https://data.nextgis.com/en/region/SA/ (accessed on 22 March 2021) | Vector |
| Distance from roads network | 500 m | Saudi Geological Survey www.gasgi.gov.sa (accessed on 22 March 2021) | Vector |
| Distance from building areas | 500 m | Mapcruzin https://mapcruzin.com/free-saudi-arabia-country-city-place-gis-shapefiles.htm (accessed on 22 March 2021) | Vector |
Table 6.
Solar analyst tool parameters.
| Parameters | Value | Parameters | Value |
|---|---|---|---|
| DEM | 90 resolution | Diffuse Model Type | Uniform_sky |
| Time configuration | Whole year 2020 | Diffuse Proportion | 0.36 |
| Z unit | 1 | Transmissivity | 0.65 |
Table 7.
Saaty’s pairwise comparison scale.
| Verbal Judgements of Preferences | Numerical Rating |
|---|---|
| Ci is equally important to Cj | 1 |
| Ci is slightly more important than Cj | 3 |
| Ci is strongly more important than Cj | 5 |
| Ci is very strongly more important than Cj | 7 |
| Ci is extremely more important than Cj | 9 |
| Intermediate values | 2,4,6,8 |
Table 8.
Comparison matrix of the adopted decision criteria.
| Criteria | C1 | C2 | C3 | C4 | C5 | C6 | C7 |
|---|---|---|---|---|---|---|---|
| C1 | 1 | 2 | 3 | 4 | 7 | 6 | 5 |
| C2 | 1/2 | 1 | 2 | 3 | 6 | 5 | 4 |
| C3 | 1/3 | 1/2 | 1 | 2 | 5 | 4 | 3 |
| C4 | 1/4 | 1/3 | 1/2 | 1 | 4 | 3 | 2 |
| C5 | 1/7 | 1/6 | 1/5 | 1/4 | 1 | 1/2 | 1/3 |
| C6 | 1/6 | 1/5 | 1/4 | 1/3 | 2 | 1 | 1/2 |
| C7 | 1/5 | 1/4 | 1/3 | 1/2 | 3 | 2 | 1 |
Table 9.
Consistency indices for a randomly generated matrix.
| Number of Criteria | 4 | 5 | 6 | 7 |
|---|---|---|---|---|
| RI | 0.9 | 1.12 | 1.24 | 1.32 |
Table 10.
Average of criteria values for Riyadh regions.
| ID | Name | C1 (kWh/m2/Year) | C1 (kWh/m2/Day) | C2 (°C) | C3 (°) | C4 | C5 | C6 | C7 |
|---|---|---|---|---|---|---|---|---|---|
| 100 | Riyadh | 2559.5 | 7.1 | 26.6 | Under 5° | South | 50 km2 | 500 m2 | 1000 m2 |
| 101 | Diriyah | 2587.4 | 7.2 | 25.9 | Under 5° | South | 50 km2 | 500 m2 | 1000 m2 |
| 102 | Al Kharj | 2542.3 | 7.1 | 27.1 | Under 5° | South | 50 km2 | 500 m2 | 1000 m2 |
| 103 | Dawadmi | 2612.4 | 7.3 | 25.9 | Under 5° | South | 50 km2 | 500 m2 | 1000 m2 |
| 104 | Al Majma’ah | 2561.9 | 7.1 | 25.6 | Under 5° | South | 50 km2 | 500 m2 | 1000 m2 |
| 105 | Al-Quwai’yah | 2608.9 | 7.2 | 26.7 | Under 5° | South | 50 km2 | 500 m2 | 1000 m2 |
| 106 | Wadi ad-Dawasir | 2603.4 | 7.2 | 27.3 | Under 5° | South | 50 km2 | 500 m2 | 1000 m2 |
| 107 | Al-Aflaj | 2554.1 | 7.1 | 27.4 | Under 5° | South | 50 km2 | 500 m2 | 1000 m2 |
| 108 | Zulfi | 2563.9 | 7.1 | 25.5 | Under 5° | South | 50 km2 | 500 m2 | 1000 m2 |
| 109 | Shaqra | 2584.2 | 7.2 | 26. | Under 5° | South | 50 km2 | 500 m2 | 1000 m2 |
| 110 | Huta Bani Tamim | 2563.7 | 7.1 | 26.9 | Under 5° | South | 50 km2 | 500 m2 | 1000 m2 |
| 111 | Afif | 2631.7 | 7.3 | 26.3 | Under 5° | South | 50 km2 | 500 m2 | 1000 m2 |
| 112 | As Sulayyil | 2556.3 | 7.1 | 27.9 | Under 5° | South | 50 km2 | 500 m2 | 1000 m2 |
| 113 | Durrma | 2583.4 | 7.2 | 26.2 | Under 5° | South | 50 km2 | 500 m2 | 1000 m2 |
| 114 | Muzahmiyah | 2586.3 | 7.2 | 26.4 | Under 5° | South | 50 km2 | 500 m2 | 1000 m2 |
| 115 | Rumah | 2550.7 | 7.1 | 26 | Under 5° | South | 50 km2 | 500 m2 | 1000 m2 |
| 116 | Thadiq | 2571.2 | 7.1 | 26.1 | Under 5° | South | 50 km2 | 500 m2 | 1000 m2 |
| 117 | Huryimla | 2577.5 | 7.2 | 26 | Under 5° | South | 50 km2 | 500 m2 | 1000 m2 |
| 118 | Hariq | 2579.9 | 7.2 | 26.9 | Under 5° | South | 50 km2 | 500 m2 | 1000 m2 |
| 119 | Ghat | 2576.1 | 7.2 | 25.9 | Under 5° | South | 50 km2 | 500 m2 | 1000 m2 |
| 120 | Murat | 2584.9 | 7.2 | 26.1 | Under 5° | South | 50 km2 | 500 m2 | 1000 m2 |
Table 11.
Land suitability index.
| Suitability Rate | Land Suitability Index | Area (km2) |
|---|---|---|
| 80–100% | 1 (198–328) Most suitable | 16,748 |
| 70–80% | 2 (328–393) Highly suitable | 27,393 |
| 60–70% | 3 (393–458) Moderately suitable | 35,222 |
| 50–60% | 4 (458–523) Marginally suitable | 17,529 |
| 1–50% | 5 (523–849) Least suitable | 5228 |
Table 12.
Scoring of regions with a suitability degree greater than 80%.
| Cities | Area (Km2) | % | Scoring |
|---|---|---|---|
| Afif | 2178 | 13.01230732 | 1 |
| Dawadmi | 1933 | 11.54857211 | 2 |
| Al Majma’ah | 1895 | 11.32154379 | 3 |
| Shaqra | 1638 | 9.786115426 | 4 |
| Rumah | 1473 | 8.800334568 | 5 |
| Murat | 1325 | 7.916119011 | 6 |
| Zulfi | 860 | 5.13800932 | 7 |
| Durrma | 860 | 5.13800932 | 8 |
| Huryimla | 786 | 4.695901541 | 9 |
| Riyadh | 760 | 4.540566376 | 10 |
| Al-Quwai’yah | 696 | 4.158202892 | 11 |
| Muzahmiyah | 517 | 3.088780022 | 12 |
| Ghat | 511 | 3.052933445 | 13 |
| Thadiq | 500 | 2.987214721 | 14 |
| Diriyah | 343 | 2.049229299 | 15 |
| Huta Bani Tamim | 185 | 1.105269447 | 16 |
| Hariq | 174 | 1.039550723 | 17 |
| Al Kharj | 104 | 0.621340662 | 18 |
| ALL | 16,738 | 100% |
Table 13.
Sensitivity analysis with equal weights.
| Suitability Rate | Land Suitability Index | Area (km2) |
|---|---|---|
| 80–100% | 1 (171–311) Most suitable | 9352 |
| 70–80% | 2 (311–381) Highly suitable | 17,889 |
| 60–70% | 3 (381–451) Moderately suitable | 24,633 |
| 50–60% | 4 (451–521) Marginally suitable | 25,386 |
| 1–50% | 5 (521–871) Least suitable | 24,854 |
Table 14.
Sensitivity analysis without climatic factors.
| Suitability Rate | Land Suitability Index | Area (km2) |
|---|---|---|
| 80–100% | 1 (100–276) Most suitable | 16,737 |
| 70–80% | 2 (276–364) Highly suitable | 16,148 |
| 60–70% | 3 (364–452) Moderately suitable | 25,975 |
| 50–60% | 4 (452–540) Marginally suitable | 24,051 |
| 1–50% | 5 (540–981) Least suitable | 19,215 |
Table 15.
Difference between the original map and two scenarios around the whole study area.
| Class | Equal | Without Solar Radiation and Temperature |
|---|---|---|
| 100–80% | Decreased by 7% | Decreased by 0.01% |
| 80–70% | Decreased by 10% | Decreased by 11% |
| 70–60% | Decreased by 10% | Decreased by 9% |
| 60–50% | Increased by 8% | Increased by 6% |
| <50% | Increased by 19% | Increased by 14% |
Publisher’s Note: MDPI stays neutral with regard to jurisdictional claims in published maps and institutional affiliations. |
© 2021 by the authors. Licensee MDPI, Basel, Switzerland. This article is an open access article distributed under the terms and conditions of the Creative Commons Attribution (CC BY) license (https://creativecommons.org/licenses/by/4.0/).
Share and Cite
MDPI and ACS Style
Albraheem, L.; Alabdulkarim, L. Geospatial Analysis of Solar Energy in Riyadh Using a GIS-AHP-Based Technique. ISPRS Int. J. Geo-Inf. 2021, 10, 291. https://0-doi-org.brum.beds.ac.uk/10.3390/ijgi10050291
AMA Style
Albraheem L, Alabdulkarim L. Geospatial Analysis of Solar Energy in Riyadh Using a GIS-AHP-Based Technique. ISPRS International Journal of Geo-Information. 2021; 10(5):291. https://0-doi-org.brum.beds.ac.uk/10.3390/ijgi10050291
Chicago/Turabian StyleAlbraheem, Lamya, and Leena Alabdulkarim. 2021. "Geospatial Analysis of Solar Energy in Riyadh Using a GIS-AHP-Based Technique" ISPRS International Journal of Geo-Information 10, no. 5: 291. https://0-doi-org.brum.beds.ac.uk/10.3390/ijgi10050291
Note that from the first issue of 2016, this journal uses article numbers instead of page numbers. See further details here.