Article

Exploring Spatial Patterns of Virginia Tornadoes Using Kernel Density and Space-Time Cube Analysis (1960–2019)

1
Geography Program, Old Dominion University, Norfolk, VA 23529, USA
2
Center for Geospatial Science, Education & Analytics, Old Dominion University, Norfolk, VA 23529, USA
*
Author to whom correspondence should be addressed.
ISPRS Int. J. Geo-Inf. 2021, 10(5), 310; https://0-doi-org.brum.beds.ac.uk/10.3390/ijgi10050310
Submission received: 1 March 2021 / Revised: 28 April 2021 / Accepted: 1 May 2021 / Published: 7 May 2021
(This article belongs to the Special Issue Disaster Management and Geospatial Information)

Abstract

:
This study evaluates the spatial-temporal patterns in Virginia tornadoes using the National Weather Service Storm Prediction Center’s Severe Weather GIS (SVRGIS) database. In addition to descriptive statistics, the analysis employs Kernel Density Estimation for spatial pattern analysis and space-time cubes to visualize the spatiotemporal frequency of tornadoes and potential trends. Most of the 726 tornadoes between 1960–2019 occurred in Eastern Virginia, along the Piedmont and Coastal Plain. Consistent with other literature, both the number of tornadoes and the tornado days have increased in Virginia. While 80% of the tornadoes occurred during the warm season, tornadoes did occur during each month including two deadly tornadoes in January and February. Over the 60-year period, a total of 28 people were killed in the Commonwealth. Most tornado activity took place in the afternoon and early evening hours drawing attention to the temporal variability of risk and vulnerability. Spatial analysis results identify significant, non-random clusters of tornado activity and increasing temporal frequency. While this study improves weather-related literacy and addresses a need in the Commonwealth, more research is necessary to further evaluate the synoptic and mesoscale mechanisms of Virginia tornadoes.

1. Introduction

Aimed to enhance the awareness of severe weather and climate hazards for the Commonwealth of Virginia, this study builds on similar regional tornado assessments [1]. Our general objective is to provide a spatial-temporal analysis of tornadoes across Virginia, with the specific objective of detecting and describing spatial patterns of tornadoes in Virginia, particularly to explore clusters or significant hot spots. Secondarily, we intend to explore available data for any trends, including spatial anomalies of tornado severity or emergent patterns over time. Our research question posits that, like intensity of tornado activity in the upper (inner) Coastal Plain and Piedmont of North Carolina [2], we may find a significant clustering of tornadoes in Virginia in the lee of the Blue Ridge and along the Fall Line where the Coastal Plain and Piedmont adjoin, or potentially on the outer coastal plain associated with passing tropical storms or severe air mass thunderstorms. Meteorological conditions generally supporting this include the availability of thermal troughing along the Piedmont front range, urban agglomerations supporting thermal forcing, and onshore flow from sea breezes and pre-frontal warm air advection and unstable tropical airmasses along the Coastal Plain. Combined with frontal uplift and leeward side vorticity associated with the Blue Ridge Mountains, the eastern half of the state should support elevated tornado activity with strong storms and squall lines [3,4].
Studies indicate smaller, spatial scale analysis is more appropriate for analyzing trends in tornado variability than national-level studies [1,5]. Such climatologies consider favorable atmospheric conditions for tornadic outbreaks [3,6] and the role of larger-scale teleconnections such as El Niño [7]. More recently, Moore (2018) showed increasing E(F)1+ tornadoes across the Southeast U.S. [8], a conclusion supported by Gensini and Brooks (2018) [9].
While the influence of climate change on extreme events is well documented [10], the multitude of factors associated with severe weather indicates no clear trend as to an increasing frequency or intensity of tornadoes [11,12,13]. Recently, Elsner et al. (2019) noted an upward trend in the power of tornadoes due to changes in convective storm environments [14]. Other researchers have sought to document an east to southeasterly shift of the traditionally perceived Tornado Alley, sparking a debate over the existence and popular interest in the “Dixie Alley,” in the Southeast of the U.S. [15,16]. Future changes in risk and exposure may increase the disaster potential [17], thus a comprehensive assessment of tornado climatology is necessary to inform stakeholders in the Commonwealth of Virginia.
A suite of spatial analysis techniques is available to explore and quantify the spatial pattern and timing (including annual and seasonal occurrence as well as climatological trends). Among the available techniques, this project applies linear spatial pattern analysis to quantify the spatial distribution of documented tornadoes, seeking to discern regional hotspots and potential clusters. Tornadoes and clusters of outbreaks can be mapped as points or choropleths at small scales to infer and communicate broad risk patterns between regions or states [18]. Cartographic visualization and Kernel Density Estimates (KDE) are appropriate techniques for exploring such spatial patterns and subsequent analytical inferences using symbology and visual techniques (e.g., line density plots, 3D, or surface analyses). KDE methods have a long history in spatial analysis and frequent application to point-based, discrete events such as crimes [19] or road accidents [20]. With respect to severe weather, Brown et al. (2016) explored the seasonal as well as spatial pattern of tornadoes by comparing three cities and aiming to control for the observational bias of observer density in urban areas [21]. Coleman and Dixon (2014) mapped the number of tornadoes, using cartographic visualization to explore patterns, derived isopleths of tornado counts, and calculated the density and an average annual path length using KDE techniques [22]. They further plotted different severity and path-lengths of tornado tracks to ascertain potential damage impacts and area affected. KDE techniques, however, are not without their faults, and sensitive parameters such as the spatial search distance (bandwidth selection) are advisable to use iteratively after visual inspection [23]. Further, “Space-Time Cubes” (STCs) have a history in their conceptualization dating to Hagestrand (1970) yet also newly accessible computational tools in Esri ArcGIS Pro [24,25]. STCs are applicable to discerning and evaluating spatial patterns intrinsically over time, or spatial-temporal “trajectories” of phenomena. STCs have shown promise for analytical potential where domain experts (e.g., tornado forecast meteorologists, climatologists, and emergency managers) can be empowered with deeper understanding of the spatial-temporal patterns relevant to tornado forecasting, climate-sensitivity, or disaster risk reduction. Research on STCs, however, has shown limited success where STCs have not provided a user-centered perspective and analytical capabilities have not been functionally demonstrated, and careful use of visual variables and depth cues has been suggested to improve their functionality [26].
With most of the Virginia population situated along and east of I-95, understanding where and when tornado activity has taken place may help inform hazard researchers interested in mitigating risk (Figure 1). Currently, no comprehensive assessment of tornadoes for the Commonwealth of Virginia exists. This study also strengthens the weather-related information for the Commonwealth of Virginia, filling a knowledge gap within the Virginia Climate Office [27,28]. The development of such assessments helps build synergies across local and regional stakeholders beyond the Weather Forecast Office (WFO). Virginia’s Department of Emergency Management conducts an annual Tornado Exercise in March, aligning with the National Weather Service’s annual Severe Weather Awareness Week [29]. Having updated and spatially refined information on the pattern and timing of tornado hazards could thus inform the implementation of these efforts, such as providing forecasters and science communicators graphical educational materials, guiding counties or areas for media campaigns and outreach, or also providing preparatory background to forecasters and emergency responders working in areas predisposed to tornado events.

2. Materials and Methods

2.1. Datasets

Tornado information was downloaded from the National Oceanic and Atmospheric Administration’s (NOAA) National Weather Service Storm Prediction Center Severe Weather GIS (SVRGIS) database (https://www.spc.noaa.gov/gis/svrgis/, accessed on 1 January 2021). The SVRGIS database [30] contains severe weather event information in tabular and GIS formats and includes verified tornado information on the track path, intensity, and associated impacts (e.g., categorized estimated property loss). In addition to enabling mapping and spatial analyses, these data enabled descriptive statistics to be compiled for tornadoes in Virginia (1960–2019). Other studies noted database deficiencies and tornado reporting bias [31,32,33]. The 60-year time period provides a long-term record for analyzing trends. The SVRGIS tornado data include unique tornado identifier, date of occurrence (local time, day, month, and year), U.S. state, EF-scale magnitude, track length, tornado width, and begin- and end-points (latitude and longitude).

2.2. Tornado Track Mapping

The initial exploratory phase of the spatial analysis focused on mapping the extent of tornado tracks extracted from SVRGIS for the period of study. Tornado track data were extracted by a spatial selection of the full conterminous U.S. database, including a buffer of approximately 100 km and any tracks that intersected the boundaries of the Commonwealth of Virginia (including starting or ending within the state boundary). Including tornado tracks within a buffer distance ensured that no tracks having any extent within Virginia were excluded or would erroneously affect the density and proximity analysis. Including tornadoes proximate but not within the state is also justifiable to mitigate against potential neighborhood statistical calculations around the periphery of the state. As a step of quality assurance and exploratory analysis, we first visually analyzed all the retrieved tornado checks, observing for potential gross errors or spurious digitizing errors that may affect subsequent spatial analyses. One tornado track was found to be anomalous and oriented as a perfectly south-north arc; the tornado event was cross-checked and determined that a geographic coordinate was likely erroneously entered into SVRGIS for this unique track. The begin- and end-points suggested a long track and gross error near Middlesex County and between towns of Deltaville and Whitestone on the Middle Peninsula of the Chesapeake Bay. In addition, this single long track could not be verified from any media or WFO reported tornado events. Likely an erroneous input of the lift point coordinate, this datapoint was removed out of concern for the error propagation of the track in subsequent spatial analyses.
Inspection of the general pattern of tornado tracks suggested the use of linear kernel density techniques (to capture the line density across space, e.g., track length per unit area) and replication of the map to see if the pattern and density would hold for differing levels of tornado intensity with the Enhanced Fujita (EF) scale (the Enhanced F scale adopted by the National Weather Service in 2007) [34,35]. Visualizations of tornado frequency and density were created using kernel density analysis. Point kernel density estimation produces a continuous density surface based on the tornado tracks, highlighting areas of Virginia where tornado characteristics such as strength and length are more pronounced [36]. Using Virginia tornado track lines segmented by magnitude, we produced a 100-m cell resolution density surface that illustrated differences in frequency of higher-magnitude tornadoes. It was revealed that Northern Virginia near Washington, D.C., Richmond (central Virginia), and the Hampton Roads region (Southeastern Virginia) have experienced a higher frequency of strong tornadoes than other parts of the Commonwealth. We also examined the distribution of Virginia’s longest tracking tornadoes. Using the Virginia tornado track line length, another 100-m cell resolution density surface that illustrated differences in the tornado travel distance was developed.

2.3. Spatial Statistics and Kernel Density Analysis

Our approach to visually assess observed tornadoes included both cartographic visualizations using a composite map of all recorded events and an index of tornado density interpolated by kernel line density estimation. To expand beyond choroplethic mapping and Modifiable Areal Unit Problem (MAUP) effects [37], we sought a spatial representation of the overall pattern and density (tornado track lengths per unit area) and opted to implement kernel line density interpolation. The selection of the search distance for KDE followed iterative visual analysis of results and computation of a nominal search distance [25]. The KDE output grid resolution was also evaluated after the methods of Scott (1992) and rule of thumb for KDE to evaluate the standard distance of measured observation [38]. Our method used a KDE approach with polylines, similar to a linear KDE analysis of road density presented by Tang et al. (2015) [39]. After iterative computation with KDE bandwidths between 1 km to 10 km, we ultimately implemented a 4 km bandwidth very close to the default 1/30th ratio of the maximum divided by the minimal length-width ratio of the study area (Commonwealth of Virginia) and similarly implemented by Cai et al. (2013) [40]. This selection of bandwidth provided for visual discrimination within counties and along potential patterning to capture topographic influences, such as the Blue Ridge Mountains, Ridge and Valley Province, and the Fall Zone running north-south. A coarser bandwidth may overly smooth the density of tornado patterns along these features, while a finer scale visually obscured a subregional trend.

2.4. Space-Time Cube

As a temporally variable pattern, a space-time analysis or pattern persistence metrics were deemed worth exploring. For this geographic extent, having evidently patchy areas of concentrated tornado activity and relatively sparse areas (even empty), we opted to explore the application of new Space-Time cubes.
Our space-time cube analysis workflow using the Esri’s ArcGIS Pro software required the disaggregation of tornado track line data into point data evenly spaced at 5-km intervals along each original track line. Each resulting point contained key tornado attributes including magnitude, direction, and a unique date/time stamp. All data points were then binned into decadal time step intervals between 1960 and 2020. A net CDF format data cube was aggregated using the time-binned tornado points to produce hexbin polygons, each covering 250 square kilometers. The rationale for hexbinning (i.e., hexagonal tessellation) is to primarily optimize equidistant measurements between centroids of areal bins [41]. Square or rectangular tessellations also tend to break-up or distort curvilinear patterns owing to acute angles. There is also an inherent benefit to using hexagons to reduce the spatial sampling bias of phenomena, since they have a low perimeter-area ratio. Since our study included the relatively large area of Virginia (east-west ~690 km), hexagons would also show less distortion owing to the curvature of the earth as compared to a fishnet or grid tessellation [41].
Development of the netCDF cube allowed us to visualize trends in tornado activity over time as a 2-dimensional hexagonal polygon surface wherein temporal trends for each polygon were exposed using a “trend description” attribute. Our approach sought to discover and describe spatial-temporal patterns of tornado activity, a research challenge appropriate to applying advances in geocomputation and visualization [42]. To facilitate analysis temporal trends in the spatial pattern of tornadoes, we opted to enhance the cartographic analysis of the decadal small multiples using space-time cube computation. This approach emphasized the discrete, event-based nature of tornadoes and referenced time-scale changes by decade. The cubic spatial-temporal compartmentalization would also provide for temporal assessments, such as changes in rates or patterns of tornado activity by decade across the study area. Rather than computing Markov Chains for discrete state transitions (e.g., classifying tornado activity into ranked levels of intensity), we instead chose to use the space-time cube inferentially to explore and assess potential gross changes in activity and statistical significance [43].

3. Results

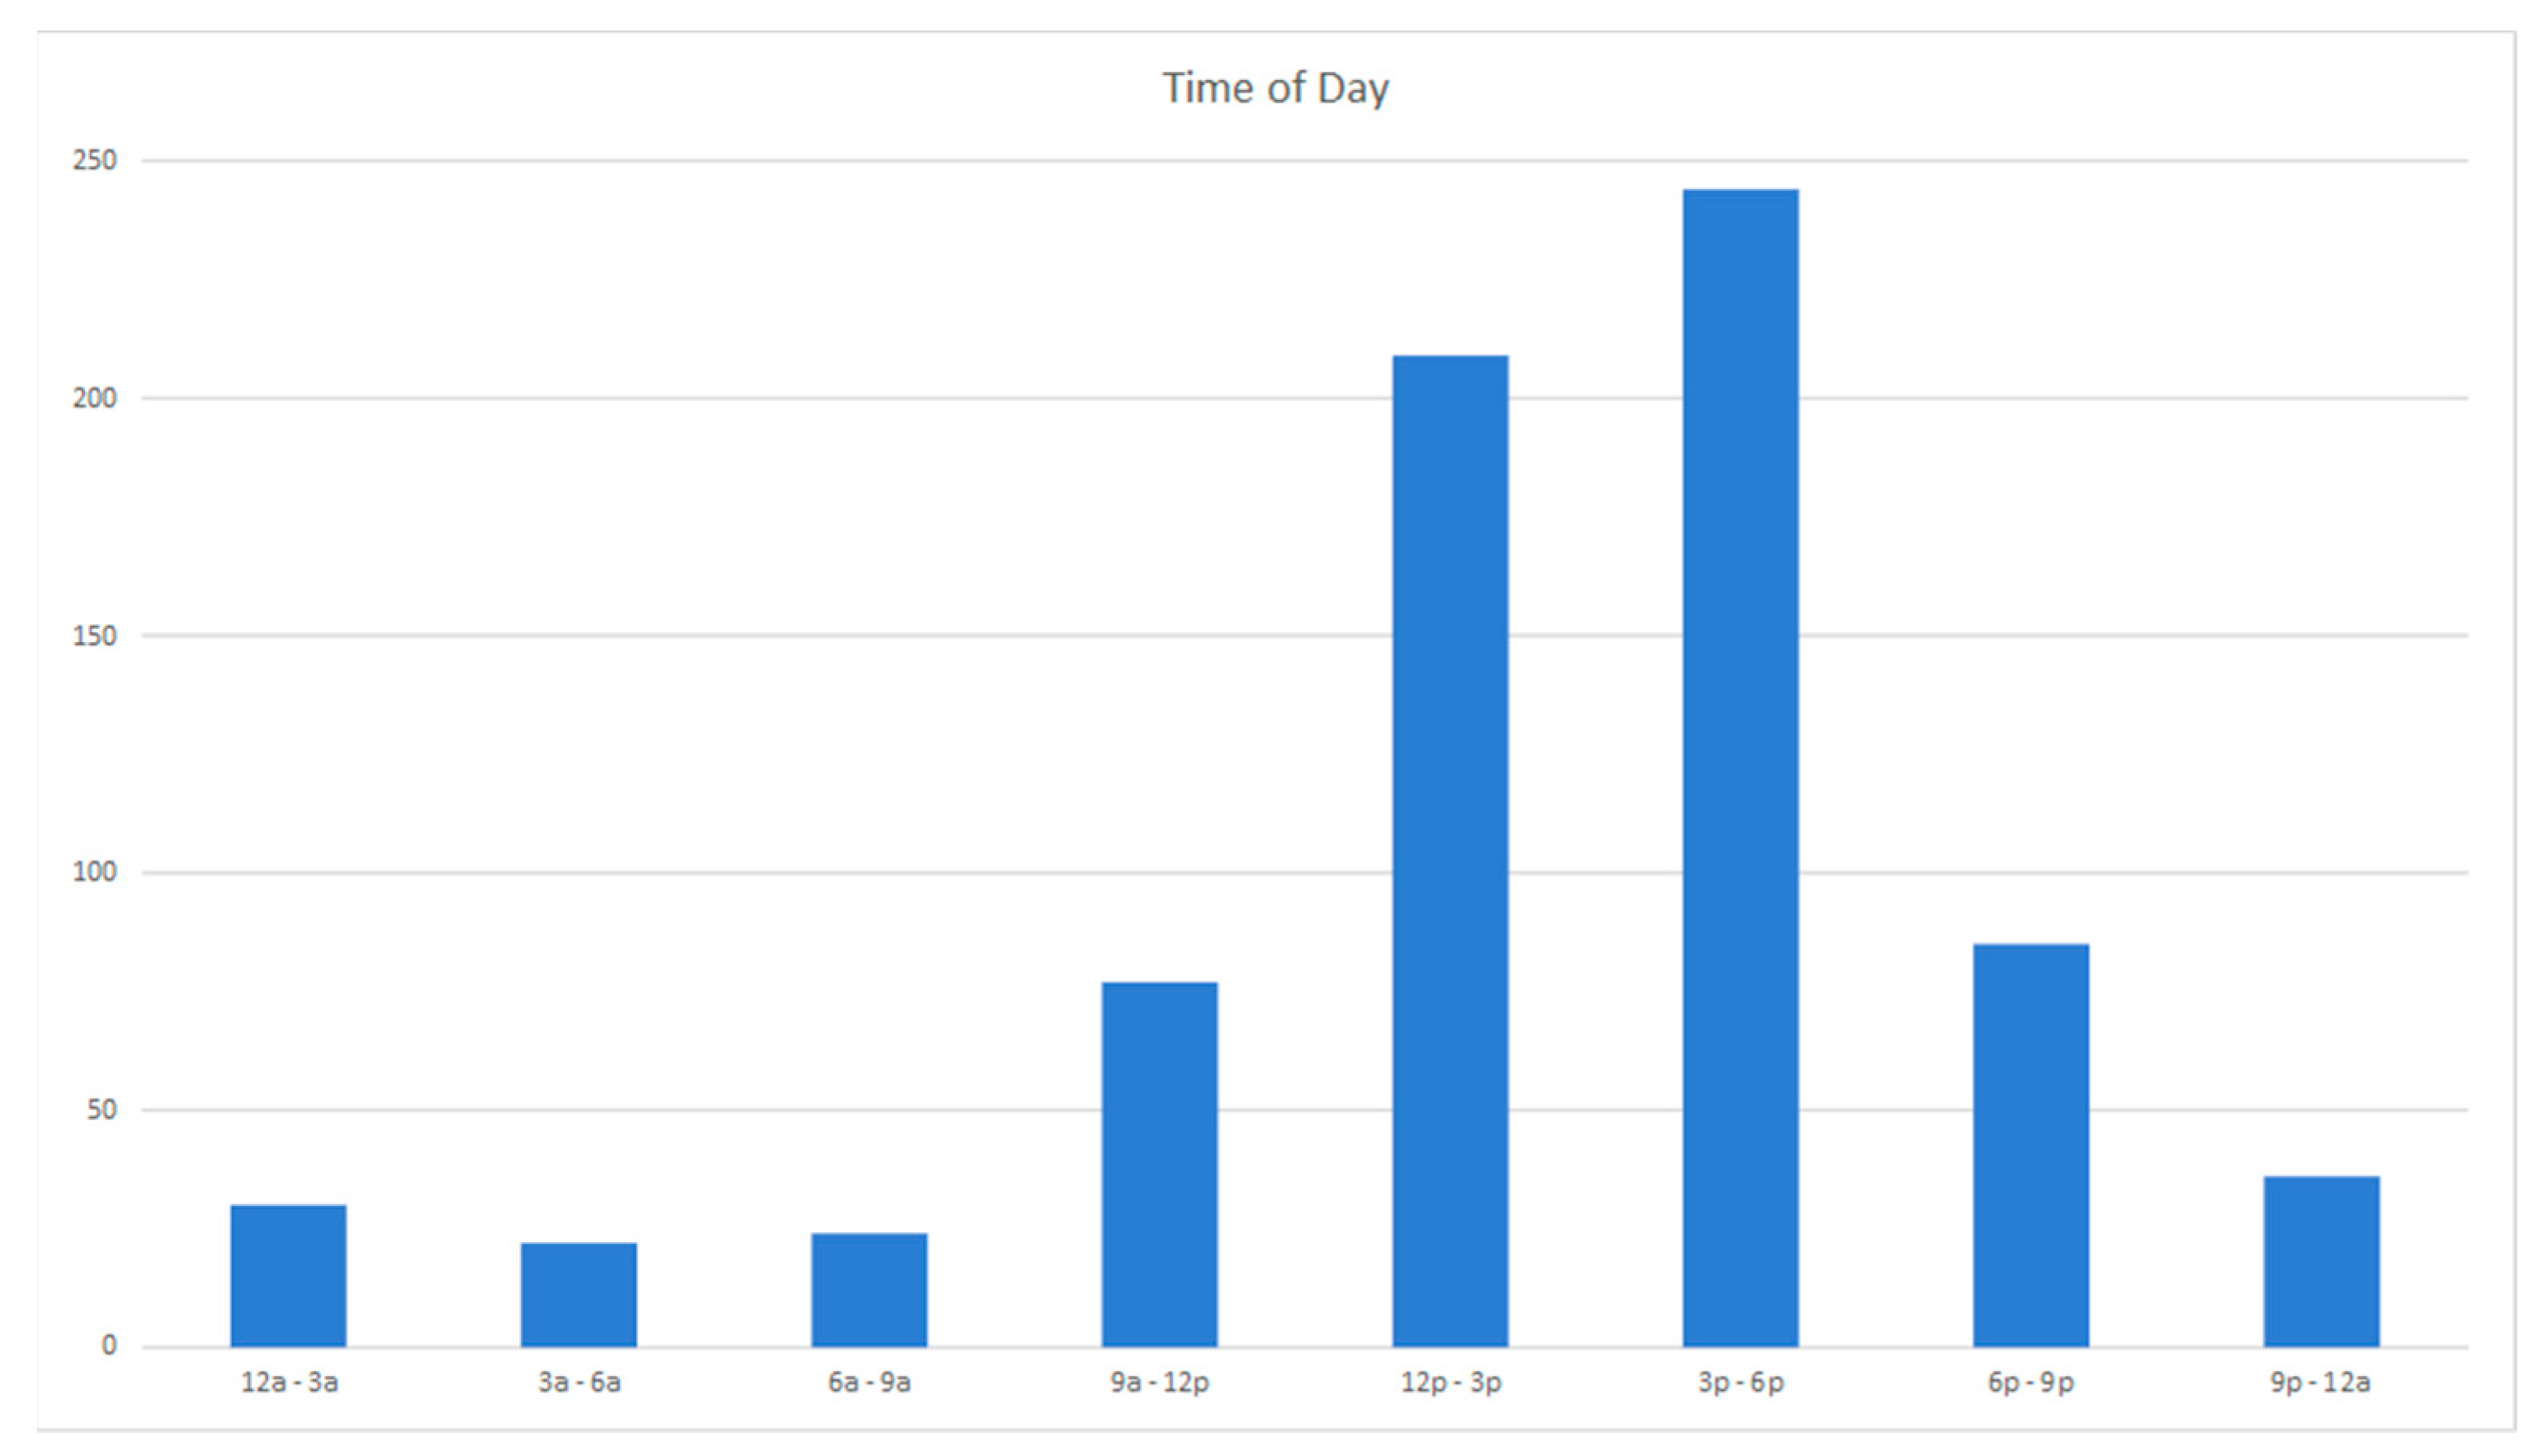
3.1. Statistical Descriptive Analysis

Of the 69 FEMA disaster declarations in Virginia, five are associated with tornadoes. One of these was linked to a tropical cyclone, Gaston in 2004 [44]. Over the course of 338 tornado days, a total of 727 tornadoes occurred over the time period (Figure 2 and Figure 3). Most tornadoes occurred in the Piedmont and Coastal Plain region of Virginia.
When comparing the earlier (1960–1989) to the more recent time periods (1990–2019), average tornadoes (tornado days) per year increased from 5.9 (4.4) to 18.3 (6.9) per year (Figure 3). As shown in Figure 3, an upward trend is observed over the full study period. We may infer that decadal changes in tornadoes reflect increasing storminess from tropical systems affecting the coast or inland “backdoor” storms, that land use change and suburban sprawl could indirectly increase the observation and reporting of tornadoes, and/or that technological advances in weather radar across coastal, Piedmont, and mountain areas could impart the increased tornado detection and verification [32,33,45]. The precise atmospheric mechanics behind the changes are beyond the scope of this research and draw attention to the need for continued investigation. With 83 tornadoes, 2004 recorded the highest number of tornadoes in Virginia for a single year. 17 September 2004 was the largest tornado outbreak in Virginia’s history. This outbreak, associated with Hurricane Ivan, resulted in 37 individual tornadoes. Fortunately, no one was killed during this historic outbreak. Three other years (2003, 2008, 2011) each had more than 30 tornadoes.
Across the 60 years, 28 people were killed across 15 individual tornado days (Table 1). It is worth noting that the most deadly tornado outbreak in Virginia’s history occurred outside of the time period of this study, on 30 September 1959. On this day, 12 people died. With an estimated $20 million damage, the costliest tornado occurred on 15 April 2018 near Lynchburg, Virginia. In the last 5 years (2015–2019), total damages exceeded $65 million. Other studies highlight the potential causality and economic impacts of tornadoes [46,47]. For example, Fricker and Elsner (2020) draw attention to how community socioeconomic and demographic characteristics increase vulnerability to unusually devasting tornadoes [48]. Mere geographic location is not the only contributing factor to vulnerability.
Only two systems resulted in EF 4 tornadoes: the historic 6 August 1993 outbreak that transversed North Carolina and Southeast Virginia, killing 4 and injuring over 250, and the 24 September 2001 event which was part of a severe weather outbreak in the Washington, DC—Baltimore metro area causing over $100 million in damage. In all, nine days with more than 10 tornadoes occurred (Table 1). Associated with a well-forecast extratropical system, two of the longest tornadoes were part of a major tornado outbreak in the United States, resulting in over 175 confirmed tornadoes (14–16 April 2011). In terms of seasonal cycle, a bimodal distribution was found with spring (April) and autumn (September) peaks (Figure 4). While 80% of the tornadoes occurred during the warm season (April to September), tornadoes did occur during each month including two deadly tornados in January and February. Like other studies, most tornado activity took place in the afternoon and early evening hours (Figure 5).

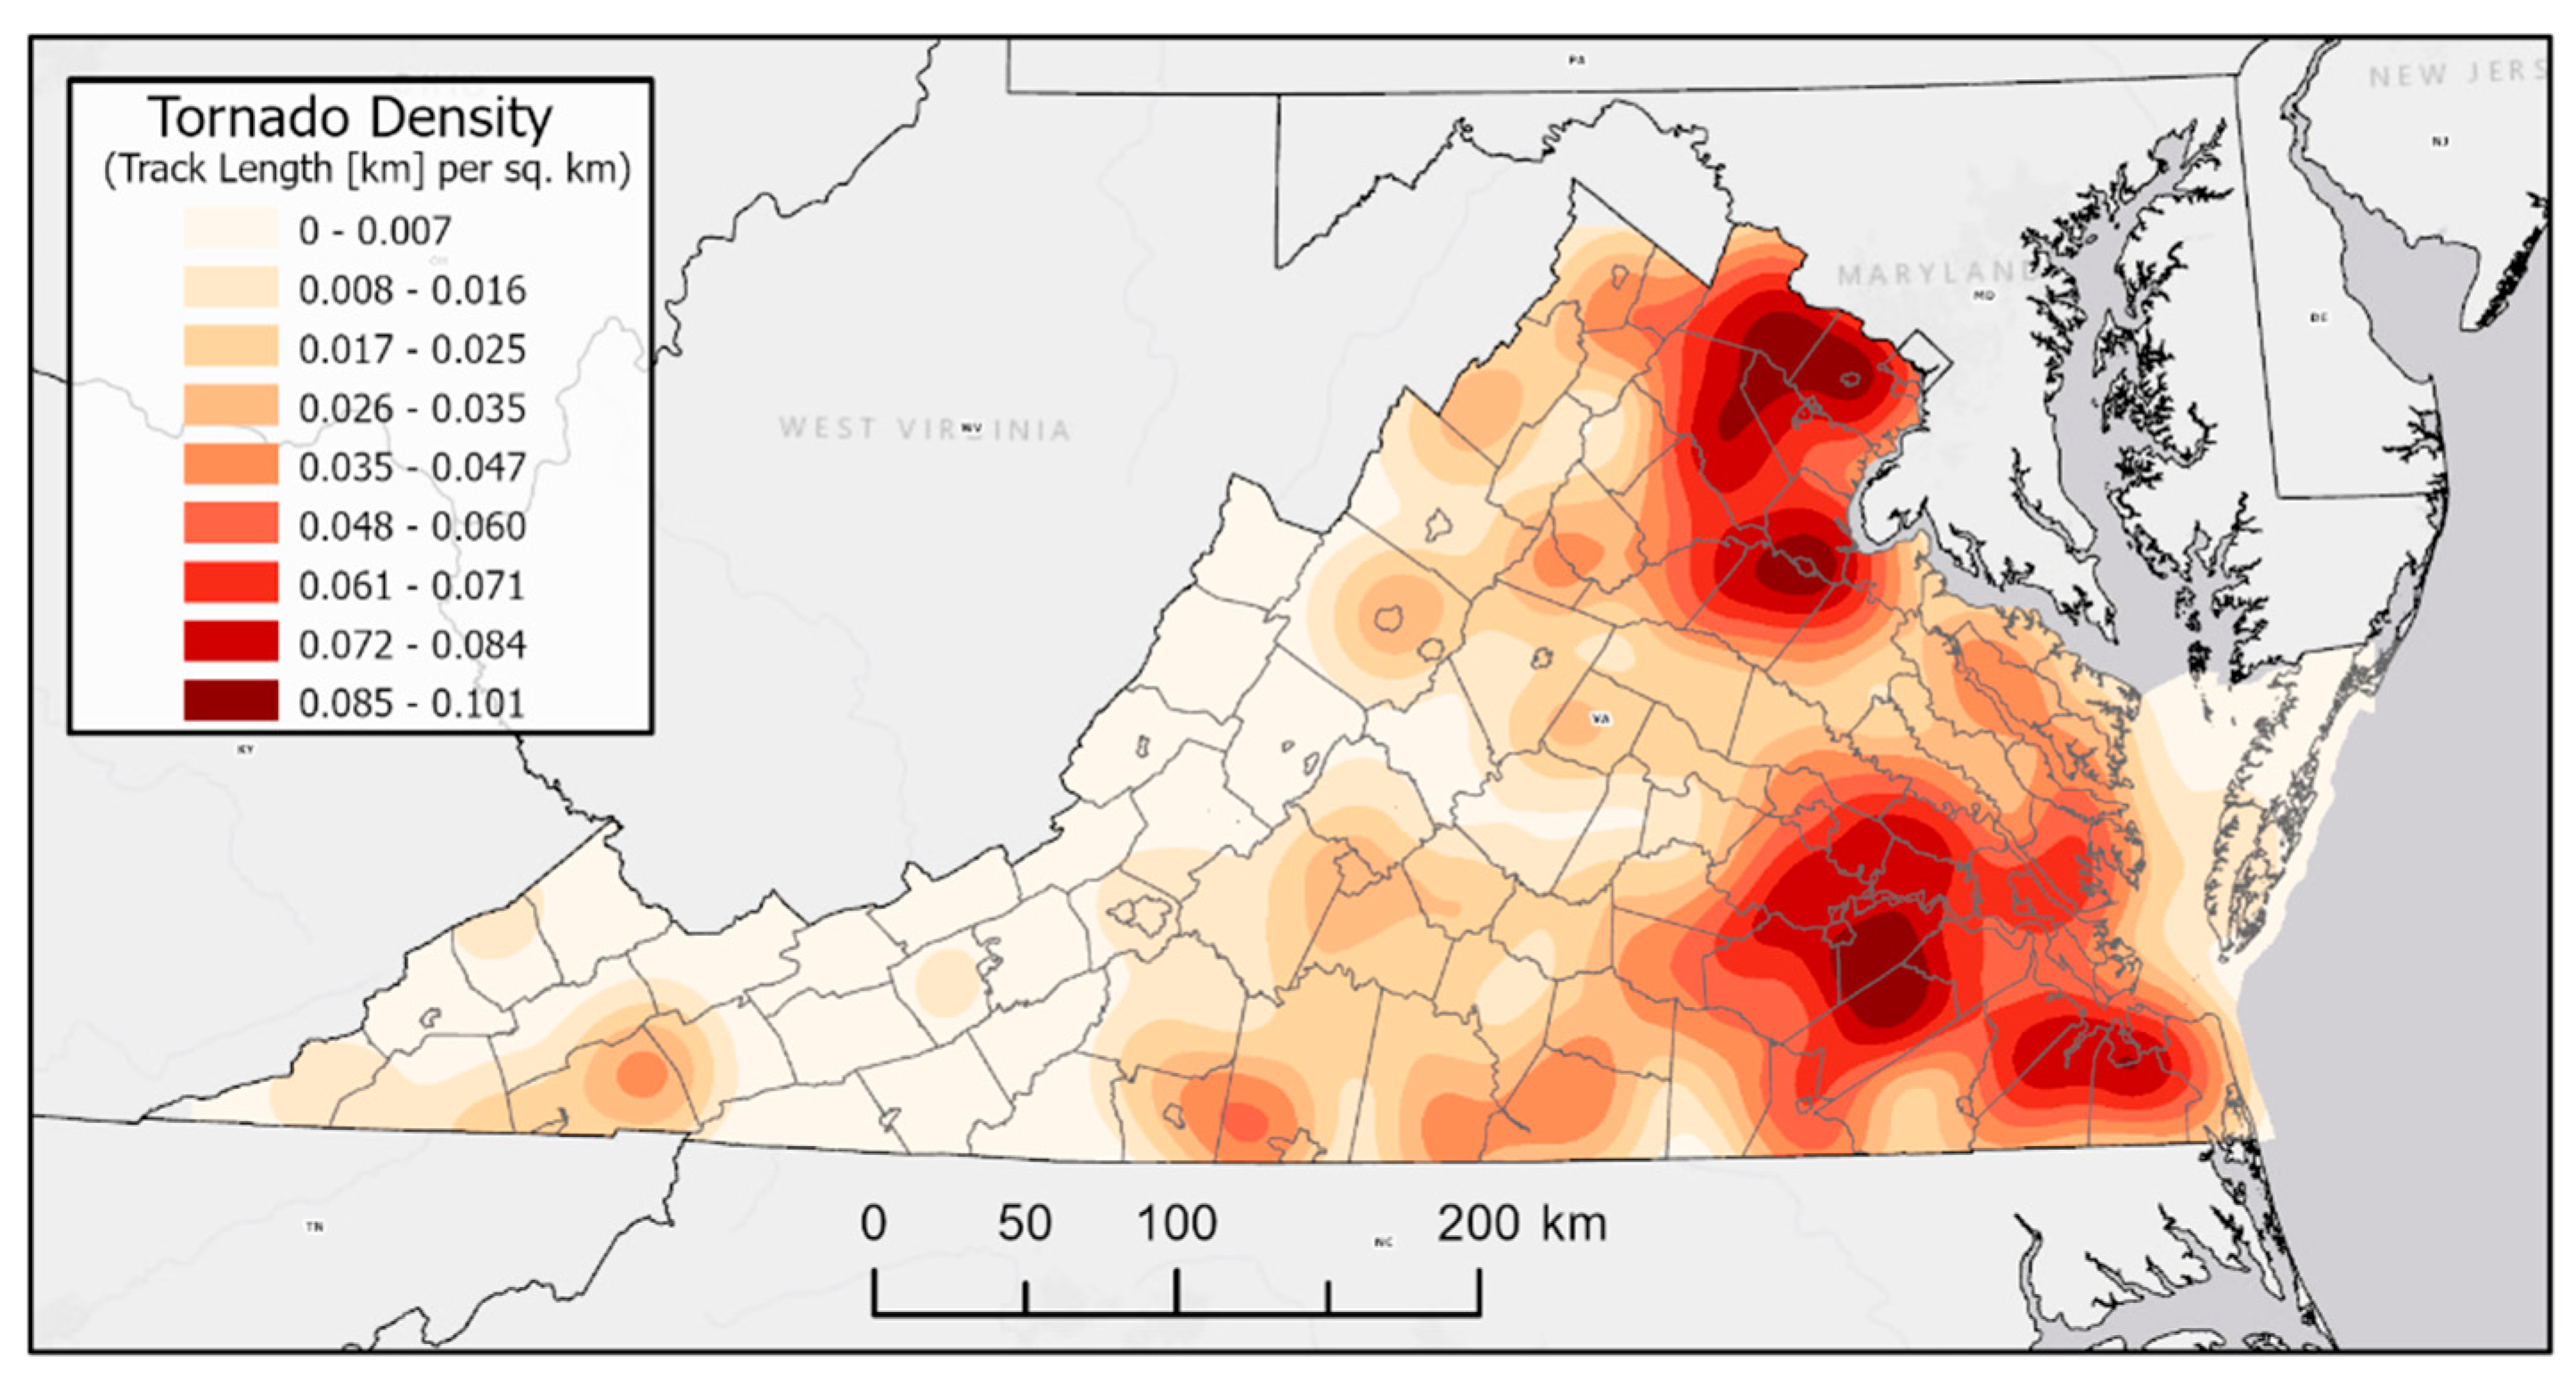
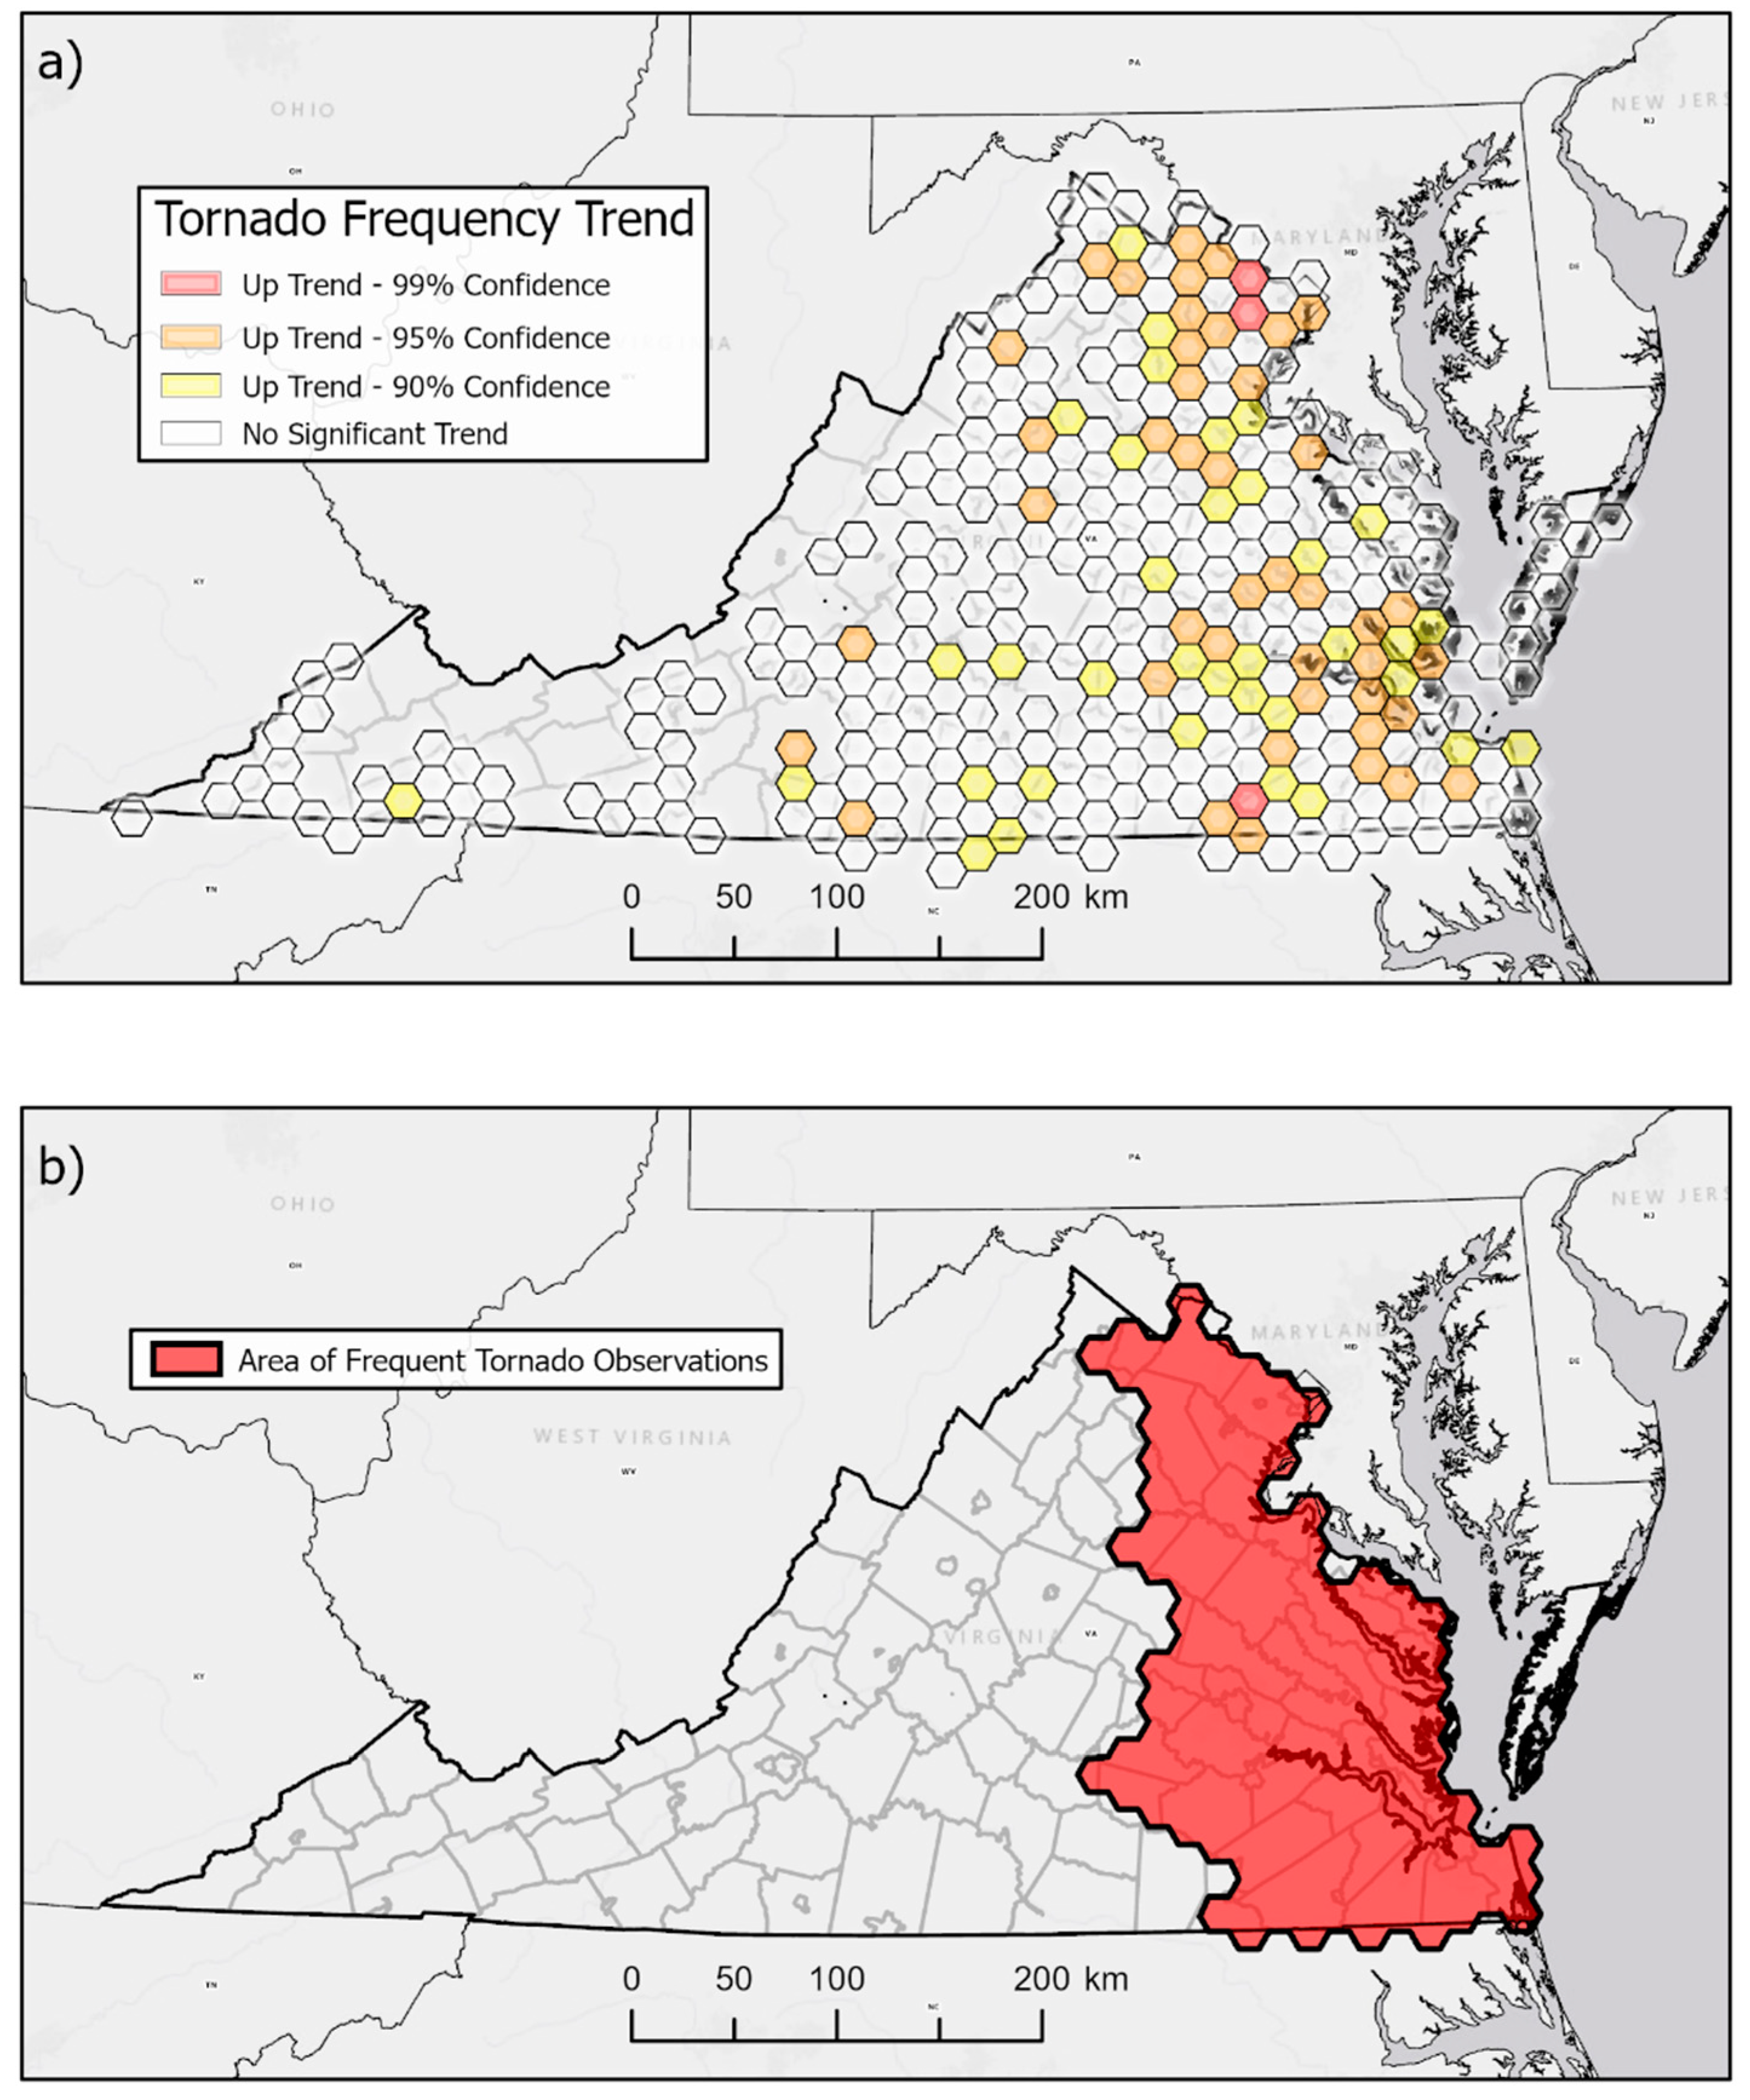
3.2. Patterns, Trends and Spatial Statistics

A trend of longer tracking tornadoes was evidenced for areas immediately south of Richmond (central VA), Washington, DC, USA (Northern VA), and the Middle Peninsula region (Eastern VA) (Figure 6). Three principal clusters are visually evident in the KDE density map surface of Figure 6, two large clusters are visible along the Fall Line in Northern Virginia and southeast of Petersburg near the Richmond Metro area, while a third is distinguishable on the outer Coastal Plain from Suffolk to Chesapeake. These derived patterns are inferred as significant clustering, supported by a statistically significant nearest neighbor ratio (Nr = 0.5996, z-score -18.434, p < 0.000). The Piedmont/Fall Line clusters are somewhat expected, owing to leeward side troughing and frontogenesis where subtropical airmass along the coastal plain and Chesapeake Bay increase the baroclinicity and moisture advection, especially in the case of approaching cold fronts trailing Midwest and Atlantic storm track shortwave lows. The cluster evident in Southeast Virginia, the rural areas of Hampton Roads metropolitan area, is suggestive of tropical storm influences from passing, recurving tropical storms and hurricanes. Results also depict minor clusters in Southwest Virginia in the Southern Shenandoah Valley and the inner Piedmont (also where favorable lee-side troughing exists). These areas show a prevalence for short-track tornadoes suggestive of somewhat terrain-controlled airmass thunderstorms in addition to frontal systems. We also found that developing high-resolution (100 m) density surfaces, as suggested by Deng et al. (2016), provided for the inference of clusters of tornado hazard [49]. The multi-modality of the clusters (Piedmont and Coastal) suggests a disjunct process, providing our hypothesis generation as to frontal, tropical, and combined tornadogenic events. However, quantifying the event conditions and origins requires a more careful consideration of the temporal circumstances as well as the synoptic and dynamic meteorological forcing at the scale of days or hours. Nonetheless, to further explore and develop empirical awareness of the tornado patterns, we turn to the results of the space-time cube analysis.

3.3. Space-Time Cube Results

Space time cube analysis techniques which offer an opportune visual way to study the relationship between events with time- and space-related variables [41,50]. Trend attribution includes either an up or down trend description with an associated trend confidence (99%, 95%, 90%). A trend description of “No Significant Trend” is also possible. These trend surface hexagonal visualizations confirmed that areas in Northern Virginia, the Richmond metropolitan area, and the Hampton Roads area all exhibited upward trends with a high degree of confidence. We found that using space-time cube methods in concert with kernel density analyses of tornado path locations, strength, and length, allowed for the delineation of a large area of Virginia that exhibits high tornado activity (Figure 7). Temporal trends, summarized in hexagon bins in Figure 7a, depict two general zones of marked upward frequency trends in the Northern and central Piedmont-Fall Zone transition (overlapping these clusters observed in Figure 6) and a moderate upward trend surrounding the inner Coastal Plain (shown as an arc of orange hexes along the inner coastal plain from the Middle Peninsula south to Williamsburg and Suffolk.) While these same areas are qualitatively considered exurban land use growth areas since the 1980s, they also are on the inner range of some of the larger passing tropical cyclones of recent decades. For example, Hurricane Isabel (2003) and Hurricane Irene (2011) produced several tornadoes in that area. The STC methodology produced an estimate of statistical significance of non-random temporal trends for each hexagon, with the highlighted colors having increasing confidence through the 1951–2018 time-period. The zonal west-east pattern, when accounting for the cumulative spatial patterns of KDE and STC analysis, lead us to suggest that Virginia has a modest to minor area of elevated tornado activity (highlighted in Figure 7b.) This zone is qualitatively described as having both increased prevalence of tornadoes spatially (KDE results) and an increasing trend in their abundance temporally (STC results).

4. Discussion

This study provided the first comprehensive, spatial-temporal assessment of Virginia tornadoes (1960—2019). With most tornadoes occurring in Eastern Virginia, the geographic landscape offers insight as to the spatial patterns. Virginia experiences tropical storm activity which may serve as a catalyst for severe weather outbreaks. Leeward side dynamics associated with the Blue Ridge and Appalachian Mountains enhances vorticity. Onshore flow and warm air advection along the Coastal Plain provides unstable physical environments conducive for tornadic activity. Long-term and lagged effects of soil moisture deficit or drought with interspersed abundance in river valleys, reservoirs or topographic depressions may affect the seasonal tornado activity [51]. Davis et al. (1997) identified five synoptic patterns associated with Virginia tornadoes: thermodynamic/northwest flow air masses, a mixed thermodynamic/dynamic category, a polar front jet situation, cool season midlatitude cyclone events, and Great Plains type tornadic air masses [10,52]. Results indicate Eastern Virginia as a high-risk zone for tornadic activity, and a heightened focus for severe weather preparedness and warning coordination for the National Weather Service (Wakefield and Sterling weather forecast offices).
Studies indicate shifts in the frequency of tornadoes, particularly multi-tornado days, over the past few decades [8,14,53]. Gensini and Brooks (2018) found an upward trend in tornado occurrences across much of the Southeast United States including Eastern Virginia [9]. Elsner et al. (2014) postulate that climate change and increases in CAPE may be contributing factors to enhancing severe weather conditions [54]. While an increasing trend in Virginia tornadoes was found, this study did not explicitly evaluate the causal mechanisms. Improved reporting, technological monitoring, and dataset bias may also contribute to the observed shifts [31,32,33]. While cold-season tornadoes seem uncommon, Childs et al. (2018) found an increasing trend associated with these storms [55]. The study found conditions during La Niña episodes, characterized by warm, moist conditions across the southeast and an anomalous trough across the Western U.S., to be more favorable for cold-season severe weather development. The study also noted a relationship with the Arctic Oscillation; future analysis may consider the role of large-scale global circulation and how teleconnection patterns influence Virginia tornadoes [56]. Other studies note database deficiencies and tornado reporting bias [32,33,45,56,57]. Untrained witnesses [45] and improved detection methods [58] certainly present limitations, particularly in the early time period of this study.
Broomwell et al. (2020) notes the knowledge gaps in public knowledge about hazardous weather risks, particularly overnight and wintertime storms [59]. Using geo-visualization as a tool, this study increases severe weather salience in the Commonwealth of Virginia. This analysis fills a knowledge gap with respect to the spatial patterns, changes, and impacts of tornadoes in the Commonwealth of Virginia. Efforts such as NWS-Skywarn spotter training may benefit from the results of this research and the content may be used in K-16 educational networks.

5. Conclusions

This study was the first statewide evaluation of the Virginia tornadoes. Most tornadoes occurred (1) during the afternoon and evening hours, (2) during the warm season, and (3) along the eastern flank of the Piedmont and Coastal Plain. The physiographic features certainly play a role in the development of severe weather, but the precise impact of these environments is beyond the scope of this study and is an area of continued research [60,61]. Future research may consider the intersection of tornado tracks with social factors such as building material or socio-economic status [48,62,63]. While the relative number and severity of tornadoes may not rival that of the U.S. Midwest and Great Plains, the observational data explored are suggestive of a statistically significant concentration (clusters) of tornado activity as well as indications of temporal increases. Outlining the areas of higher tornado activity may facilitate further research on the meteorological mechanisms and potential for forecasting and communication improvements. The Commonwealth of Virginia and NWS host an annual Tornado Drill to exercise risk preparedness, communications, and awareness. Drawing attention to the evolving spatial and temporal patterns of tornado hazards and their causal weather and potential risks can improve the overall hazard management. Such information can help build a more detailed database for Virginia-related hazards and to inform various stakeholders, including emergency managers and the general public, as to the spatial-temporal variability of tornadoes.

Author Contributions

Conceptualization, M.J.A., T.R.A. and G.M.; data curation, C.D.; formal analysis, M.J.A. and C.D.; methodology, M.J.A., T.R.A., G.M. and C.D.; visualization, T.R.A. and Christo-pher Davis; writing—original draft, M.J.A., T.R.A.; writing—review and editing, M.J.A. and T.R.A. All authors have read and agreed to the published version of the manuscript.

Funding

This research received no external funding.

Institutional Review Board Statement

Not applicable.

Conflicts of Interest

The authors declare no conflict of interest.

References

  1. Leonard, J.; Law, K. Tornadoes in West Virginia. Southeast. Geogr. 2019, 59, 340–364. [Google Scholar] [CrossRef]
  2. Montz, B.E.; Allen, T.R.; Monitz, G.I. Systemic trends in disaster vulnerability: Migrant and seasonal farm workers in North Carolina. Risk Hazard Crisis Public Policy 2011, 2, 1–7. [Google Scholar] [CrossRef]
  3. Elsner, J.B.; Jagger, T.H.; Fricker, T. Statistical models for tornado climatology: Long and short-term views. PLoS ONE 2016, 11, e0166895. [Google Scholar] [CrossRef]
  4. Holden, J.; Wright, A. UK tornado climatology and the development of simple prediction tools. Q. J. R. Meteorolog. Soc. 2004, 130, 1009–1021. [Google Scholar] [CrossRef] [Green Version]
  5. Guo, L.; Wang, K.; Bluestein, H.B. Variability of tornado occurrence over the continental United States since 1950. J. Geophys. Res. Atmos. 2016, 121, 6943–6953. [Google Scholar] [CrossRef] [Green Version]
  6. Gaffin, D.M.; Parker, S.S. A climatology of synoptic conditions associated with significant tornadoes across the Southern Appalachian Region. Weather Forecast. 2006, 21, 735–751. [Google Scholar] [CrossRef]
  7. Daoust, M. An analysis of tornado days in Missouri for the period 1950–2002. Phys. Geogr. 2003, 24, 467–487. [Google Scholar] [CrossRef]
  8. Moore, T.W. Annual and seasonal tornado trends in the contiguous United States and its regions. Int. J. Climatol. 2018, 38, 1582–1594. [Google Scholar] [CrossRef]
  9. Gensini, V.A.; Brooks, H.E. Spatial trends in United States tornado frequency. NPJ Clim. Atmos. Sci. 2018, 1, 1–5. [Google Scholar] [CrossRef] [Green Version]
  10. National Academies of Sciences. Engineering, and Medicine. Attribution of Extreme Weather Events in the Context of Climate Change; National Academies Press: Washington, DC, USA, 2016. [Google Scholar]
  11. Long, J.A.; Stoy, P.C. Peak tornado activity is occurring earlier in the heart of Tornado Alley. Geophys. Res. Lett. 2014, 41, 6259–6264. [Google Scholar] [CrossRef] [Green Version]
  12. Moore, T.W. On the temporal and spatial characteristics of tornado days in the United States. Atmos. Res. 2017, 184, 56–65. [Google Scholar] [CrossRef]
  13. Tippett, M.K.; Cohen, J.E. Tornado outbreak variability follows Taylor’s power law of fluctuation scaling and increases dramatically with severity. Nat. Commun. 2016, 7, 1–7. [Google Scholar] [CrossRef] [Green Version]
  14. Elsner, J.B.; Fricker, T.; Schroder, Z. Increasingly powerful tornadoes in the United States. Geophys. Res. Lett. 2019, 46, 392–398. [Google Scholar] [CrossRef] [Green Version]
  15. Dixon, P.G.; Mercer, A.E.; Choi, J.; Allen, J.S. Tornado risk analysis: Is Dixie alley an extension of tornado alley? Bull. Am. Meteorol. Soc. 2011, 92, 433–441. [Google Scholar] [CrossRef] [Green Version]
  16. Foglietti, R.V.; Mitchell, T.J.; Ortegren, J.T. US tornado outbreak climatologies based on different definitions of outbreak, 1975–2014. Southeast. Geogr. 2020, 60, 6–22. [Google Scholar] [CrossRef]
  17. Strader, S.M.; Ashley, W.S.; Pingel, T.J.; Krmenec, A.J. Projected 21st century changes in tornado exposure, risk, and disaster potential. Clim. Chang. 2017, 141, 301–313. [Google Scholar] [CrossRef]
  18. Shen, G.; Hwang, S.M. A spatial risk analysis of tornado-induced human injuries and fatalities in the USA. Nat. Hazards 2015, 77, 1223–1242. [Google Scholar] [CrossRef]
  19. Anselin, L.; Cohen, J.; Cook, D.; Gorr, W.; Tita, G. Spatial analysis of crime. Crim. Justice 2000, 4, 211–233. [Google Scholar]
  20. Erdogan, S.; Yilmaz, I.; Baybura, T.; Gullu, M. Geographical information systems aided traffic accident analysis system case study: City of Afyonkarahisar. Accid. Anal. Prev. 2008, 40, 174–181. [Google Scholar] [CrossRef] [PubMed]
  21. Brown, V.M.; Ellis, K.N.; Bleakney, S.A. Tennessee tornado climate: A comparison of three cities. Southeast. Geogr. 2016, 56, 118–133. [Google Scholar] [CrossRef]
  22. Coleman, T.A.; Dixon, P.G. An objective analysis of tornado risk in the United States. Weather Forecast. 2014, 29, 366–376. [Google Scholar] [CrossRef]
  23. Krisp, J.M.; Peters, S.; Murphy, C.E.; Fan, H. Visual bandwidth selection for kernel density maps. Photogramm. Fernerkundung Geoinf. 2009, 5, 441–450. [Google Scholar] [CrossRef]
  24. Hägerstrand, T. What about people in Regional Science? Pap. Reg. Sci. 1970, 24, 6–21. [Google Scholar] [CrossRef]
  25. Kang, Y.; Cho, N.; Son, S. Spatiotemporal characteristics of elderly population’s traffic accidents in Seoul using space-time cube and space-time kernel density estimation. PLoS ONE 2018, 13, e0196845. [Google Scholar] [CrossRef] [Green Version]
  26. Kveladze, I.; Kraak, M.J. What do we know about the space-time cube from cartographic and usability perspective? Columb. Ohio USA Proc. Autocart. 2012, 16, 16–18. [Google Scholar]
  27. Allen, M.J.; Allen, T.R. Precipitation trends across the commonwealth of Virginia (1947–2016). Virginia J. Sci. 2019, 70, 4. [Google Scholar]
  28. Hoffman, J.S.; Allen, M.J.; Labosier, C.F. Detecting change: Observations of temperature and precipitation across Virginia’s climate divisions. Virginia J. Sci. 2019, 70, 1. [Google Scholar]
  29. National Weather Service. NWS Awareness and Preparedness Calendar, National Oceanic & Atmospheric Administration, National Weather Service. Available online: https://www.weather.gov/dvn/Awareness_Weeks (accessed on 21 February 2021).
  30. Storm Prediction Center. Storm Prediction Center Severe Weather GIS (SVRGIS) Database. Storm Prediction Center, National Weather Service, US National Oceanic and Atmospheric Administration, Washington, D.C. Available online: https://www.spc.noaa.gov/gis/svrgis/ (accessed on 15 May 2020).
  31. Elsner, J.B.; Michaels, L.E.; Scheitlin, K.N.; Elsner, I.J. The decreasing population bias in tornado reports. Weather Clim. Soc. 2013, 5, 221–232. [Google Scholar] [CrossRef]
  32. Potvin, C.K.; Broyles, C.; Skinner, P.S.; Brooks, H.E.; Rasmussen, E. A Bayesian hierarchical modeling framework for correcting reporting bias in the U.S. tornado database. Weather Forecast. 2019, 34, 15–30. [Google Scholar] [CrossRef]
  33. Verbout, S.M.; Brooks, H.E.; Leslie, L.M.; Schultz, D.M. Evolution of the US tornado database: 1954–2003. Weather Forecast. 2006, 21, 86–93. [Google Scholar] [CrossRef]
  34. National Weather Service. Storm Data Preparation Instruction Directive 10-1605. National Oceanic & Atmospheric Administration, National Weather Service, Operations and Services Performance, Directive NWSPD 2018. Available online: https://www.nws.noaa.gov/directives/sym/pd01016005curr.pdf (accessed on 18 January 2021).
  35. WSEC. A Recommendation for an Enhanced Fujita Scale (EF-Scale). Report to US National Weather Service, June 2004. 2004 Wind Science Engineering Center, Texas Tech. University, Lubbock, Texas. Available online: https://www.spc.noaa.gov/faq/tornado/ef-ttu.pdf (accessed on 20 December 2020).
  36. Yin, P. Kernels and Density Estimation. In The Geographic Information Science & Technology Body of Knowledge; Wilson, J.P., Ed.; Association of American Geographers: Washington, DC, USA; Available online: https://gistbok.ucgis.org/bok-topics/2020-quarter-02/kernels-and-density-estimation-0 (accessed on 1 January 2021).
  37. Openshaw, S.; Alvanides, S. Applying geocomputation to the analysis of spatial distributions. In Geographical Information Systems: Principles, Techniques, Management and Applications; Longley, P.A., Goodchild, M.F., Maguire, D.J., Rhind, D.W., Eds.; Wiley: Hoboken, NJ, USA, 2005; pp. 567–580. [Google Scholar]
  38. Scott, D.W. Multivariate Density Estimation: Theory, Practice, and Visualization; Wiley: New York, NY, USA, 1992. [Google Scholar]
  39. Tang, L.; Kan, Z.; Zhang, X.; Sun, F.; Yang, X.; Qingquan, L. A network kernel density estimation for linear features in space–time analysis of big trace data. Int. J. Geogr. Inf. Sci. 2015. [Google Scholar] [CrossRef]
  40. Cai, X.; Wu, Z.; Cheng, J. Using kernel density estimation to assess the spatial pattern of road density and its impact on landscape fragmentation. Int. J. Geogr. Inf. Sci. 2013, 27, 222–230. [Google Scholar] [CrossRef]
  41. Birch, C.P.; Oom, S.P.; Beecham, J.A. Rectangular and hexagonal grids used for observation, experiment and simulation in ecology. Ecol. Model. 2007, 206, 347–359. [Google Scholar] [CrossRef]
  42. ESRI. How Create Space Time Cube by Aggregating Points Works. Available online: https://desktop.arcgis.com/en/arcmap/latest/tools/space-time-pattern-mining-toolbox/learnmorecreatecube (accessed on 18 April 2021).
  43. Yuan, M.; Hornsby, K.S. Computation and Visualization for Understanding Dynamics in Geographic Domains: A Research Agenda. University Consortium for Geographic Information Science (UCGIS); CRC Press: Boca Raton, FL, USA, 2008; p. 112. [Google Scholar]
  44. FEMA Declared Disasters. 2020. Available online: https://www.fema.gov/disasters/disaster-declarations (accessed on 22 June 2020).
  45. Brooks, H.; Doswell, C., III. Some aspects of the international climatology of tornadoes by damage classification. Atmos. Res. 2001, 56, 191–201. [Google Scholar] [CrossRef] [Green Version]
  46. Fricker, T.; Elsner, J.B.; Mesev, V.; Jagger, T.H. A dasymetric method to spatially apportion tornado casualty counts. Geomat. Nat. Hazards Risk 2017, 8, 1768–1782. [Google Scholar] [CrossRef]
  47. Ashley, W.S. Spatial and temporal analysis of tornado fatalities in the United States: 1880–2005. Weather Forecast. 2007, 22, 1214–1228. [Google Scholar] [CrossRef]
  48. Fricker, T.; Elsner, J.B. Unusually devastating tornadoes in the United States: 1995–2016. Ann. Am. Assoc. Geogr. 2020, 110, 724–738. [Google Scholar] [CrossRef] [Green Version]
  49. Deng, Y.; Wallace, B.; Maassen, D.; Werner, J. A few GIS clarifications on tornado density mapping. J. Appl. Meteorol. Climatol. 2016, 55, 283–296. [Google Scholar] [CrossRef]
  50. Kraak, M.J. The space-time cube revisited from a geovisualization perspective. In Proceedings of the 21st International Cartographic Conference, Durban, South Africa, 10 August 2003; pp. 1988–1996. [Google Scholar]
  51. Shepherd, M.; Niyogi, D.; Mote, T.L. A seasonal-scale climatological analysis correlating spring tornadic activity with antecedent fall–winter drought in the southeastern United States. Environ. Res. Lett. 2009, 4, 024012. [Google Scholar] [CrossRef]
  52. Davis, R.E.; Stanmeyer, T.M.; Jones, G.V. A synoptic climatology of tornadoes in Virginia. Phys. Geogr. 1997, 18, 383–407. [Google Scholar] [CrossRef]
  53. Brooks, H.E.; Carbin, G.W.; Marsh, P.T. Increased variability of tornado occurrence in the United States. Science 2014, 346, 349–352. [Google Scholar] [CrossRef]
  54. Elsner, J.B.; Jagger, T.H.; Elsner, I.J. Tornado intensity estimated from damage path dimensions. PLoS ONE 2014, 9, e107571. [Google Scholar] [CrossRef] [Green Version]
  55. Childs, S.J.; Schumacher, R.S.; Allen, J.T. Cold-season tornadoes: Climatological and meteorological insights. Weather Forecast. 2018, 33, 671–691. [Google Scholar] [CrossRef]
  56. Allen, J.T.; Tippett, M.K.; Sobel, A.H. Influence of the El Niño/Southern Oscillation on tornado and hail frequency in the United States. Nat. Geosci. 2015, 8, 278–283. [Google Scholar] [CrossRef]
  57. Agee, E.; Childs, S. Adjustments in tornado counts, F-scale intensity, and path width for assessing significant tornado destruction. J. Appl. Meteorol. Climatol. 2014, 53, 1494–1505. [Google Scholar] [CrossRef]
  58. Valente, F.; Laurini, M. Tornado occurrences in the United States: A spatio-temporal point process approach. Econometrics 2020, 8, 25. [Google Scholar] [CrossRef]
  59. Broomell, S.B.; Wong-Parodi, G.; Morss, R.E.; Demuth, J.L. Do we know our own tornado season? A psychological investigation of perceived tornado likelihood in the southeast united states. Weather Clim. Soc. 2020, 12, 771–788. [Google Scholar] [CrossRef]
  60. Elsner, J.B.; Fricker, T.; Widen, H.M.; Castillo, C.M.; Humphreys, J.; Jung, J.; Rahman, S.; Richard, A.; Jagger, T.H.; Bhatrasataponkul, T.; et al. The relationship between elevation roughness and tornado activity: A spatial statistical model fit to data from the central Great Plains. J. Appl. Meteorol. Climatol. 2016, 55, 849–859. [Google Scholar] [CrossRef]
  61. Kellner, O.; Niyogi, D. Land surface heterogeneity signature in tornado climatology? An. illustrative analysis over Indiana, 1950–2012. Earth Interact. 2014, 18, 1–32. [Google Scholar] [CrossRef]
  62. Shears, A.; Schwartz, R.M. Tornadoes and mobile homes: The geographic data of a stereotype. J. Emerg. Manag. 2008, 6, 11–22. [Google Scholar]
  63. Sutter, D.; Simmons, K.M. Tornado fatalities and mobile homes in the United States. Nat. Hazards 2010, 53, 125–137. [Google Scholar] [CrossRef]
Figure 1. Inset map of the study location. (a) Physiography of Virginia with Provinces and Hillshade, (b) dot density map of population. Enumeration units census tracts (2014–2018 American Community Survey). Dots mapped to county and city boundaries. 1 Dot = 5000 people.
Ijgi 10 00310 g001
Figure 2. Tornado track time series by decade and EF scale starting in 1950 and ending in 2018. (a) 1960–1969, (b) 1970–1979, (c) 1980–1989, (d) 1990–1999, (e) 2000–2009, (f) 2010–2019, (g) 1960–2019, all Virginia tornadoes.
Ijgi 10 00310 g002
Figure 3. Annual tornadoes and tornado days in the Commonwealth of Virginia. The blue-dotted line represents the long-term, upward trend in tornadoes (1960–2019).
Ijgi 10 00310 g003
Figure 4. Seasonal cycle of Virginia tornadoes.
Ijgi 10 00310 g004
Figure 5. Diurnal cycle of Virginia tornado activity.
Ijgi 10 00310 g005
Figure 6. Kernel density analysis of Virginia tornadoes.
Ijgi 10 00310 g006
Figure 7. Space-time cube results for (a) 2D temporal trend confidence (99%, 95%, 90%, no significance) and (b) concentration and increasing frequency of Virginia tornadoes.
Ijgi 10 00310 g007
Table 1. Notable Virginia tornado statistics.
Longest Tornadoes (kilometers)
16 April 2011 (75.46)
30 March 1981 (70.49)
6 August 1993 (61.16)
4 April 1974 (58.10)
19 April 1978 (57.30)
Widest Tornadoes (meters)
4 April 1974 (2286)
8 May 1994 (1372)
27 April 2011 (1207)
8 May 1984 (914)
16 April 2011 (823)
Outbreak Days (more than 10 tornadoes)
19 April 2019
17 September 2004
6 August 1993
5 September 1979
27 April 2011
16 April 2011
24 February 2016
14 October 1986
28 April 2008
Deadly Virginia Tornado Days (Deaths)
27 April 2011 (4)
24 February 2016 (4)
6 August 1993 (4)
16 April 2011 (2)
1 April 1998 (2)
4 May 1990 (2)
30 March 1981 (2)
17 September 2018 (1)
18 October 1990 (1)
5 September 1979 (1)
26 January 1978 (1)
4 April 1974 (1)
24 March 1969 (1)
8 May 1962 (1)
8 April 1962 (1)
Publisher’s Note: MDPI stays neutral with regard to jurisdictional claims in published maps and institutional affiliations.

