
Mapping and Quantification of the Dwarf Eelgrass Zostera noltei Using a Random Forest Algorithm on a SPOT 7 Satellite Image


Abstract
:1. Introduction
2. Materials and Methods
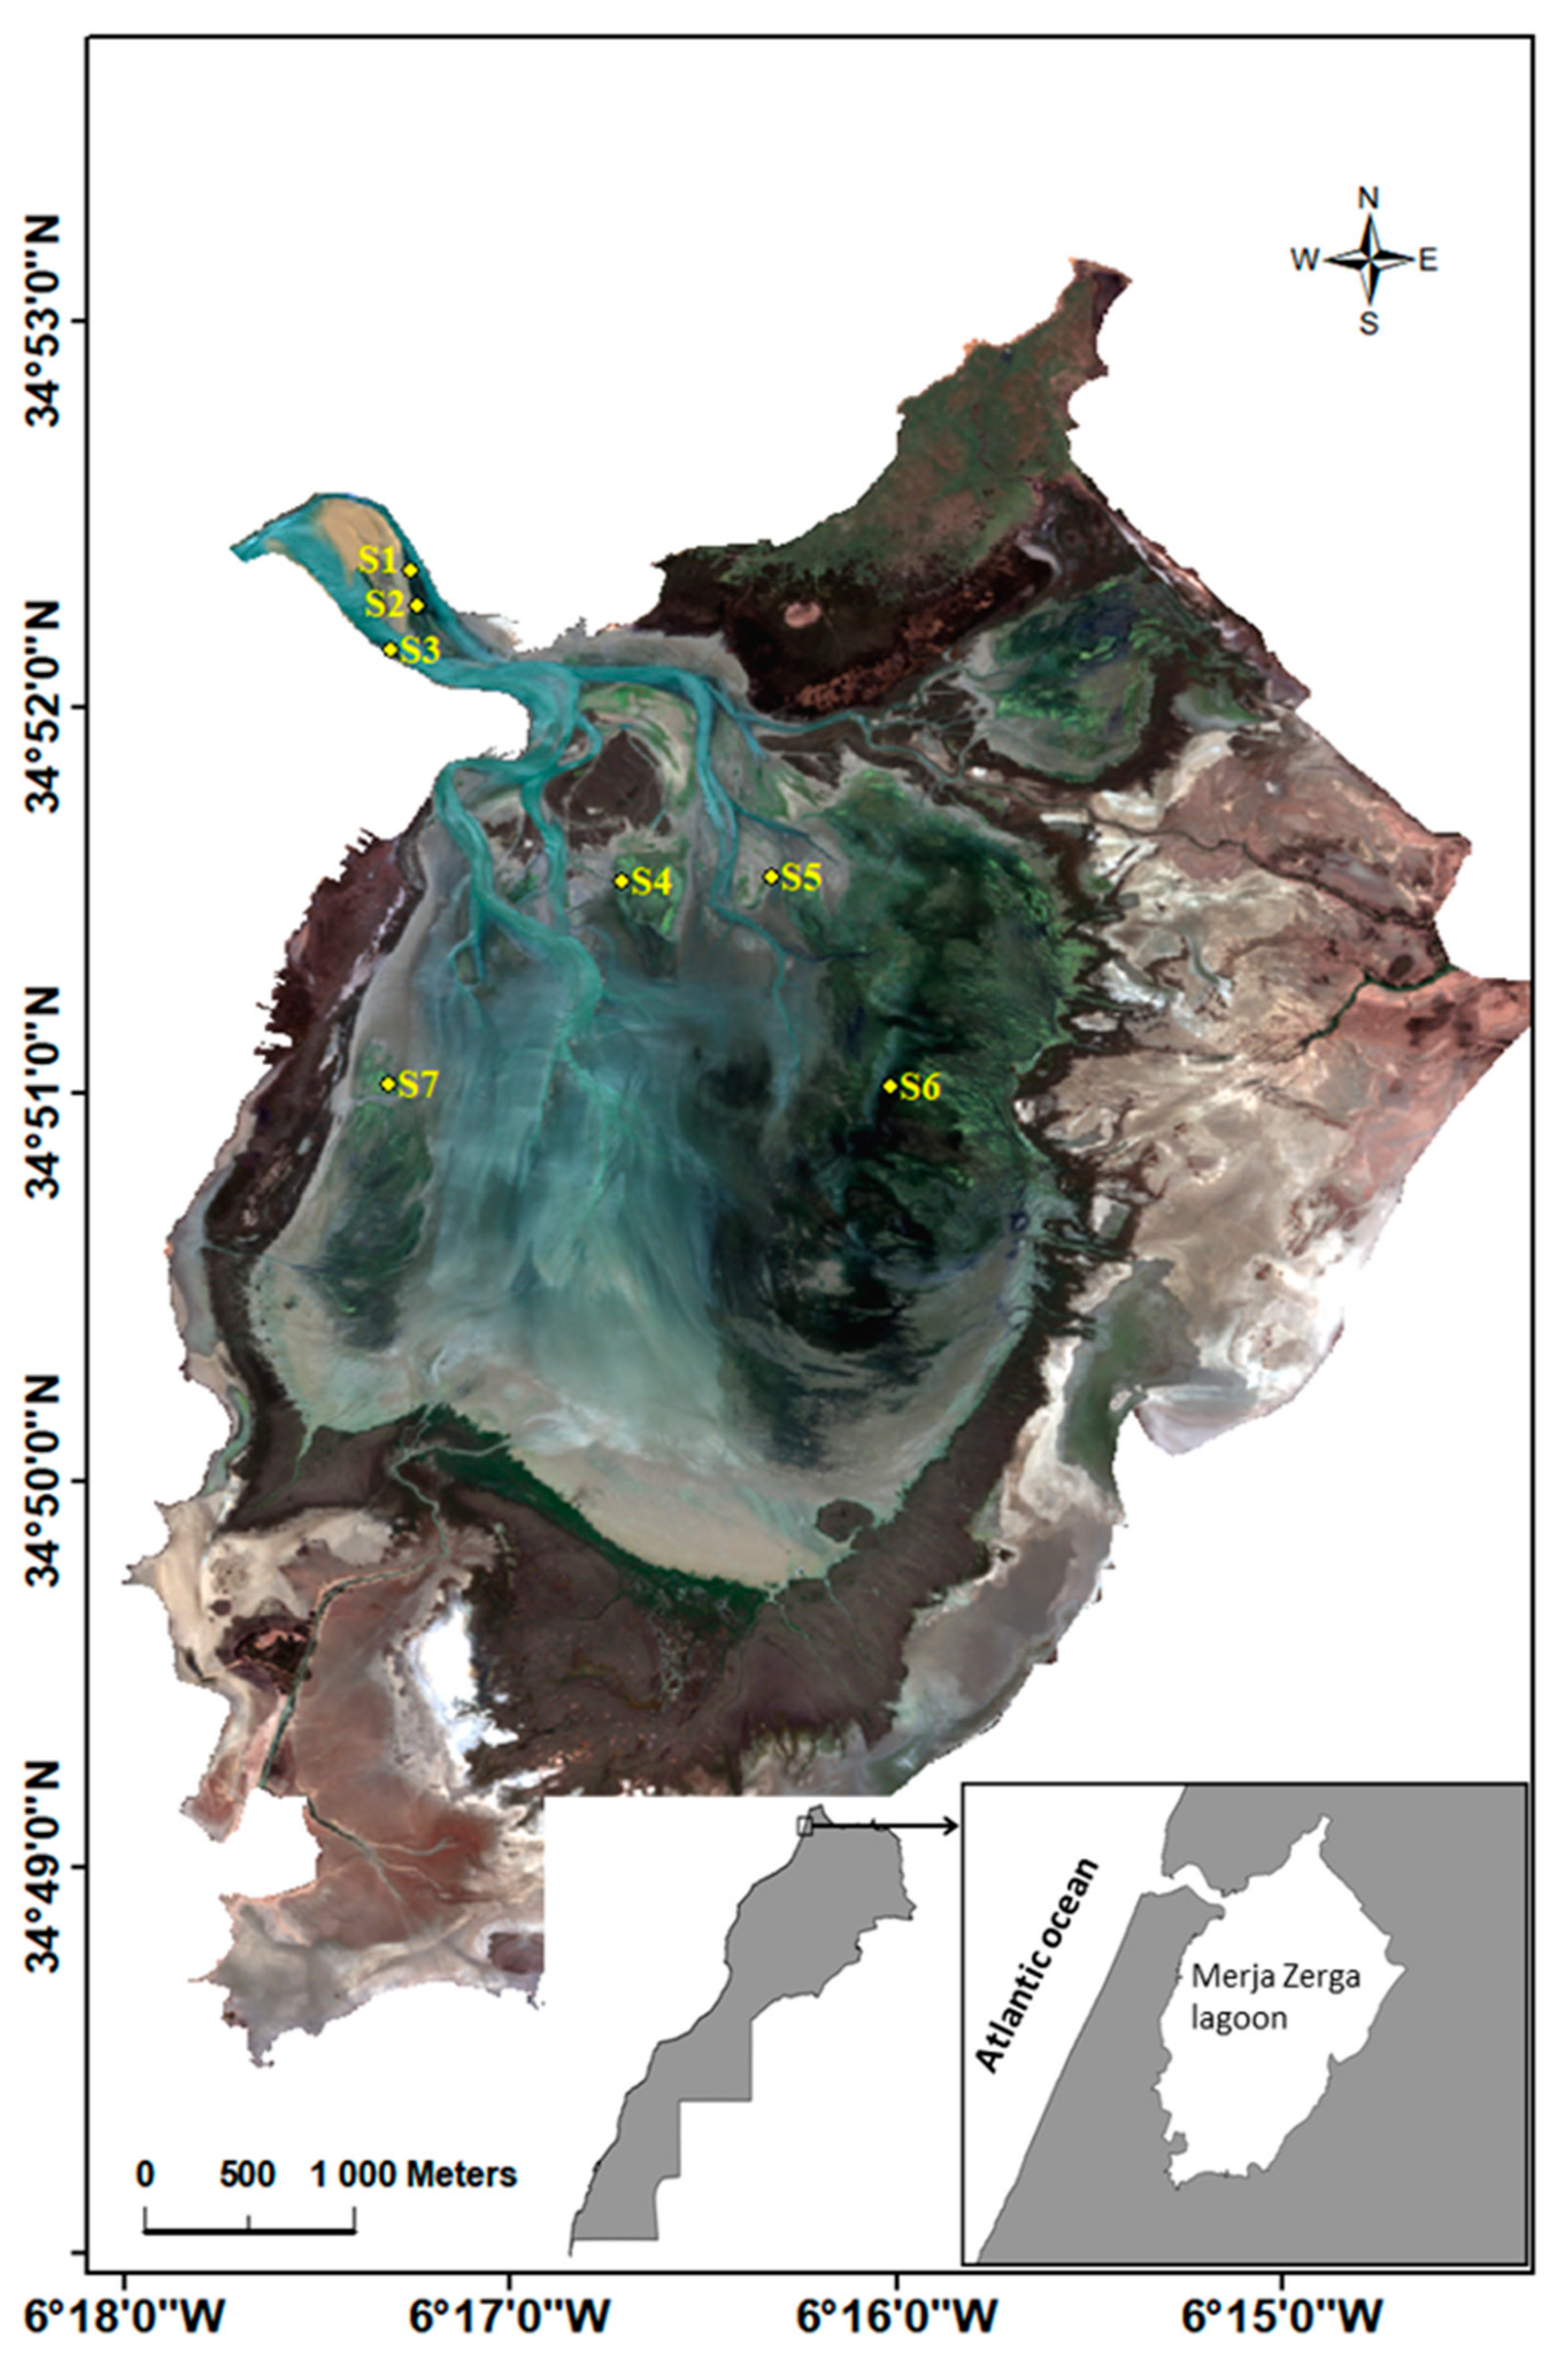
2.1. Study Area
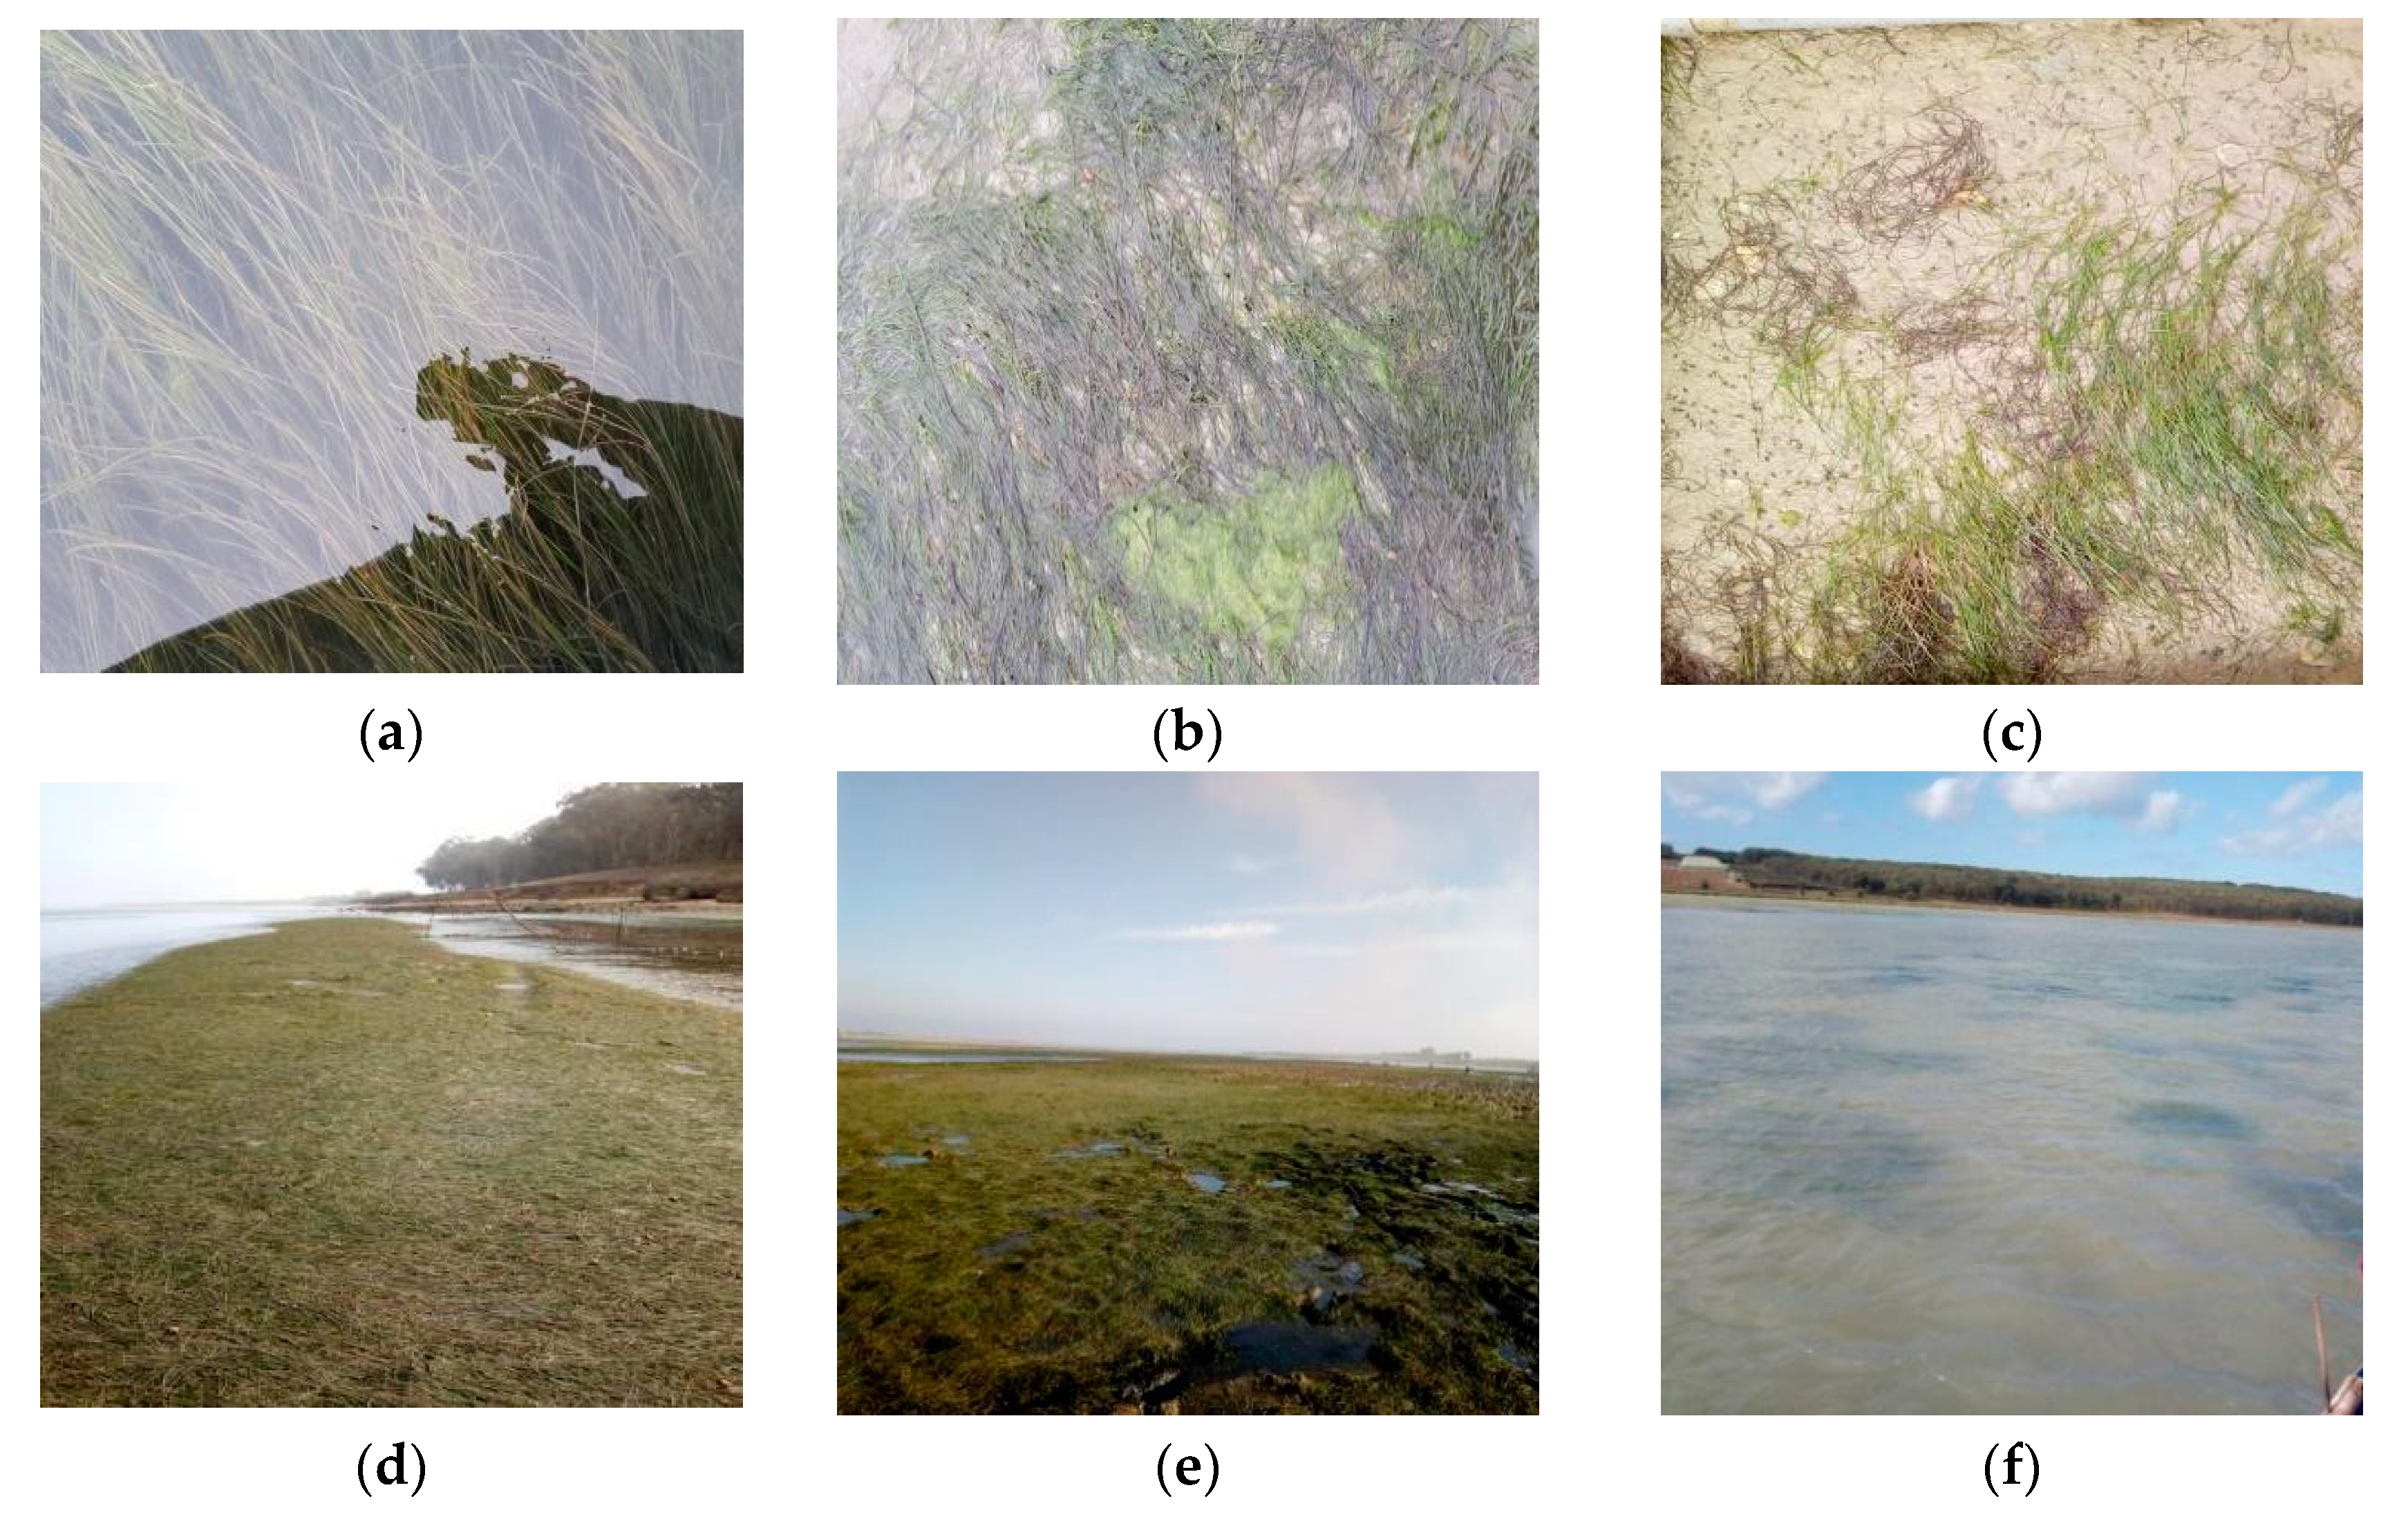
2.2. Field Data
2.3. Satellite Images
2.4. Typology
- Hygrophilous species, which colonize wetlands (wet lawns): Baldellia ranunculoides (L.) Parl., Scirpus lacustris (L.) Palla., Typha domigensis (Pers.) Steud., Mentha aquatica (L.), Nasturtium officinale (R.Br.);
- Aquatic species, some of which thrive in marine environments (Z. noltei, Nitella sp. (C. A.) Agardh), while the others colonize calm or stagnant waters and can be floating (Lemna gibba (L.)) or fixed (Myriophyllum sp. (L.), Potamogeton pectinatus (L.) Börner);
- Terrestrial species, which develop in generally humid edge habitats during the rainy period (Centaurea calcitrapa (L.), Euphorbia clementei Boiss., Solanum nigrum (L.)).
2.5. Image Processing
3. Results
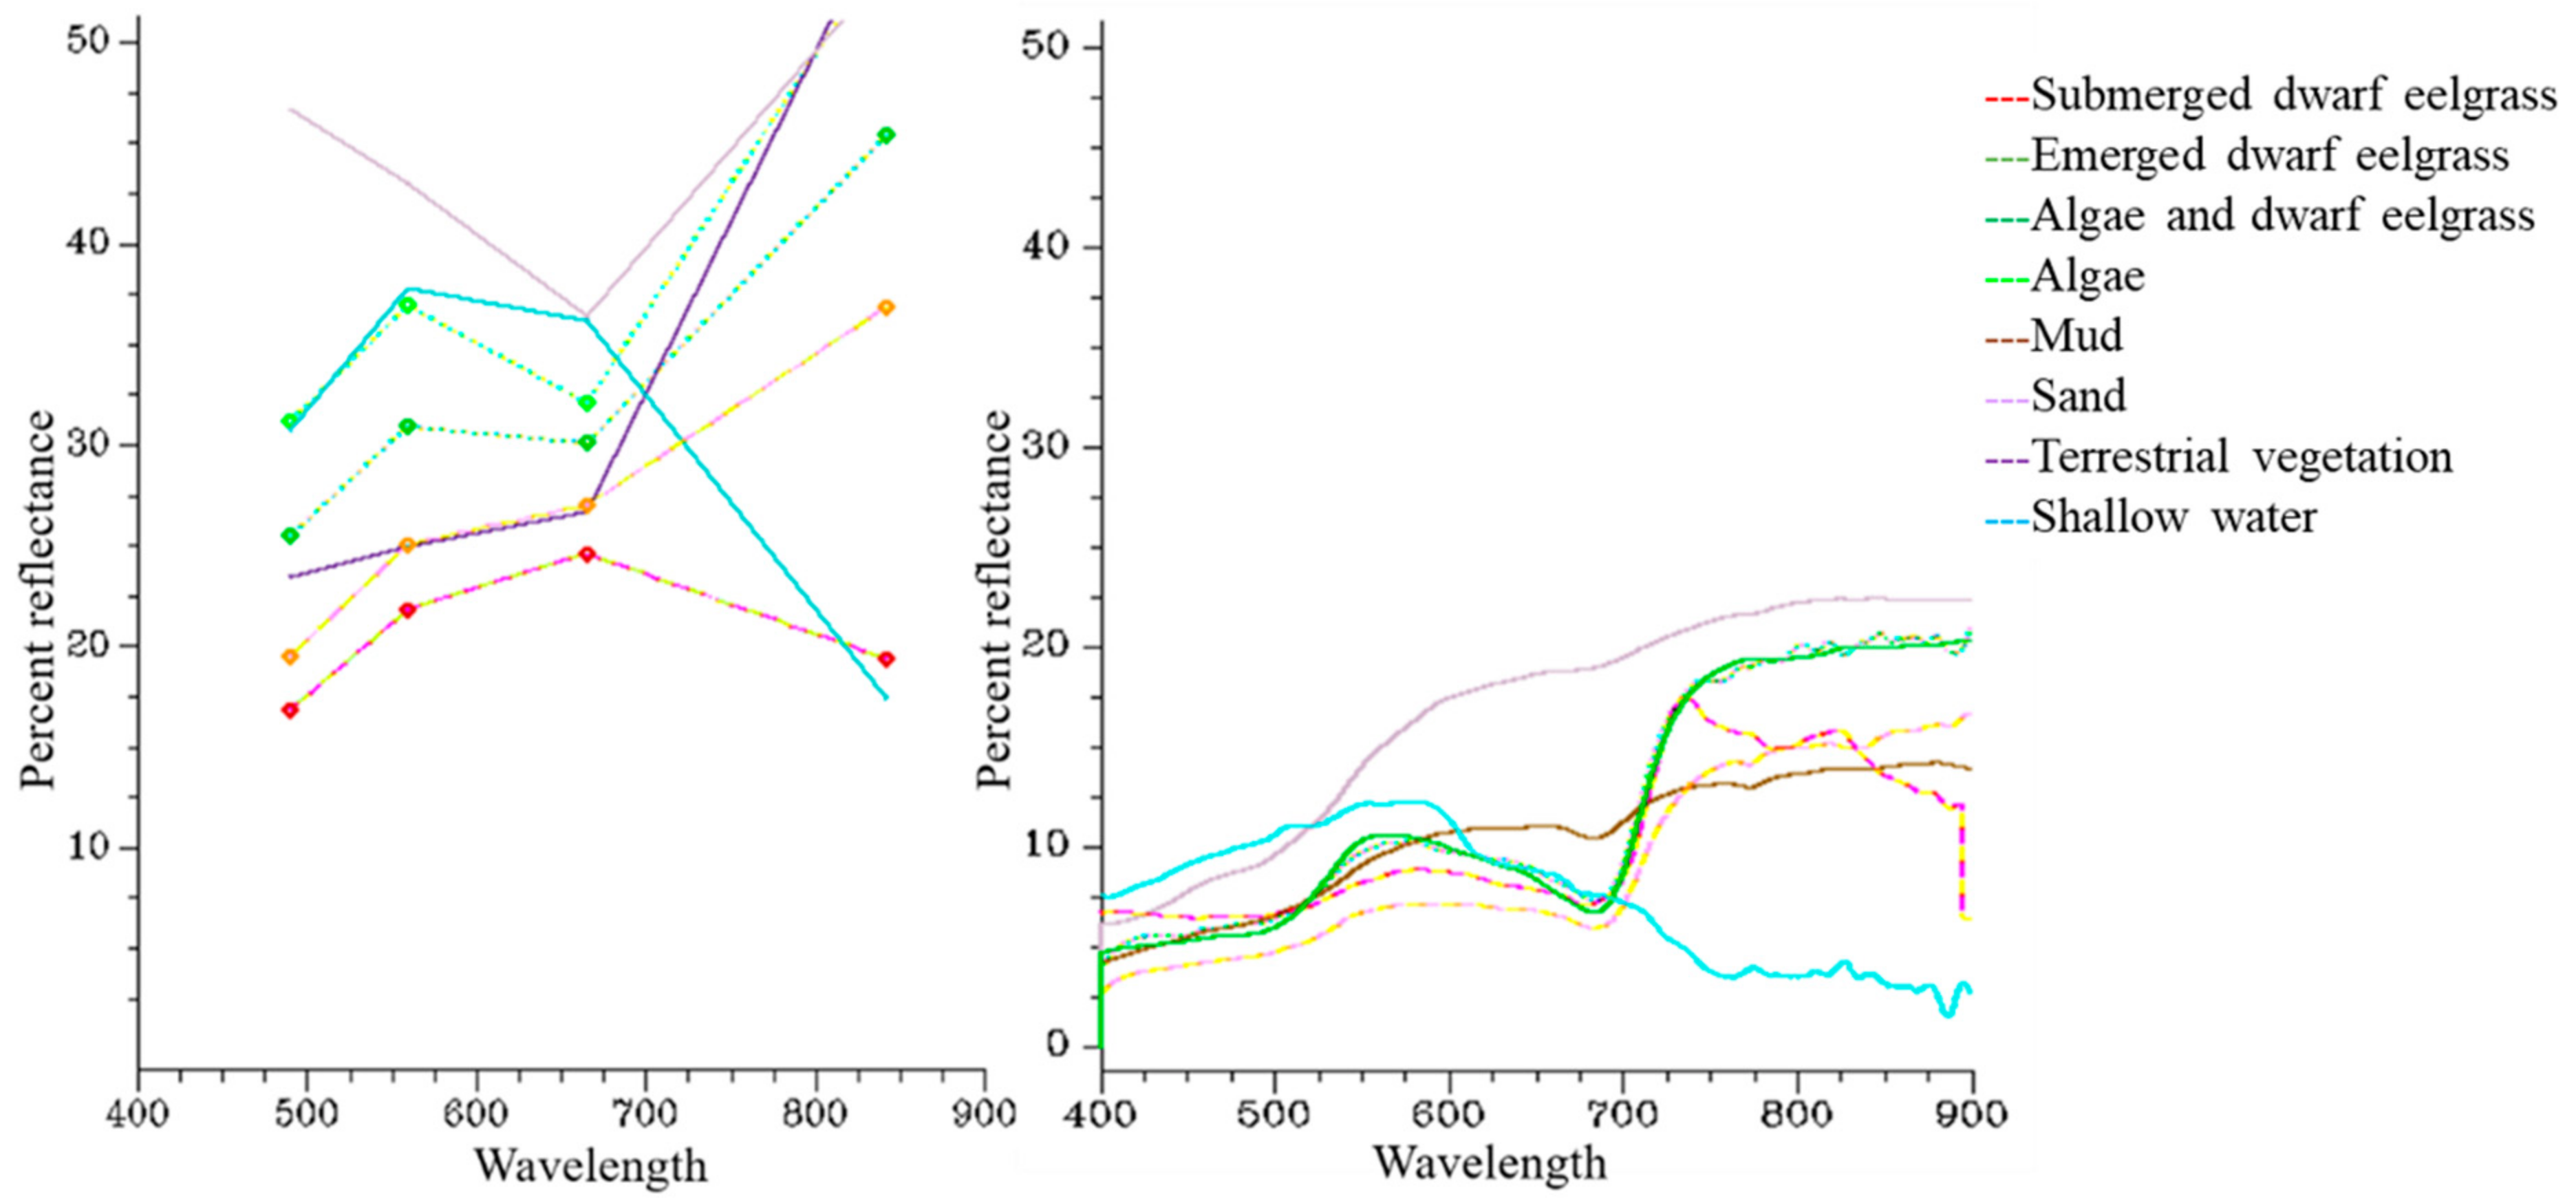
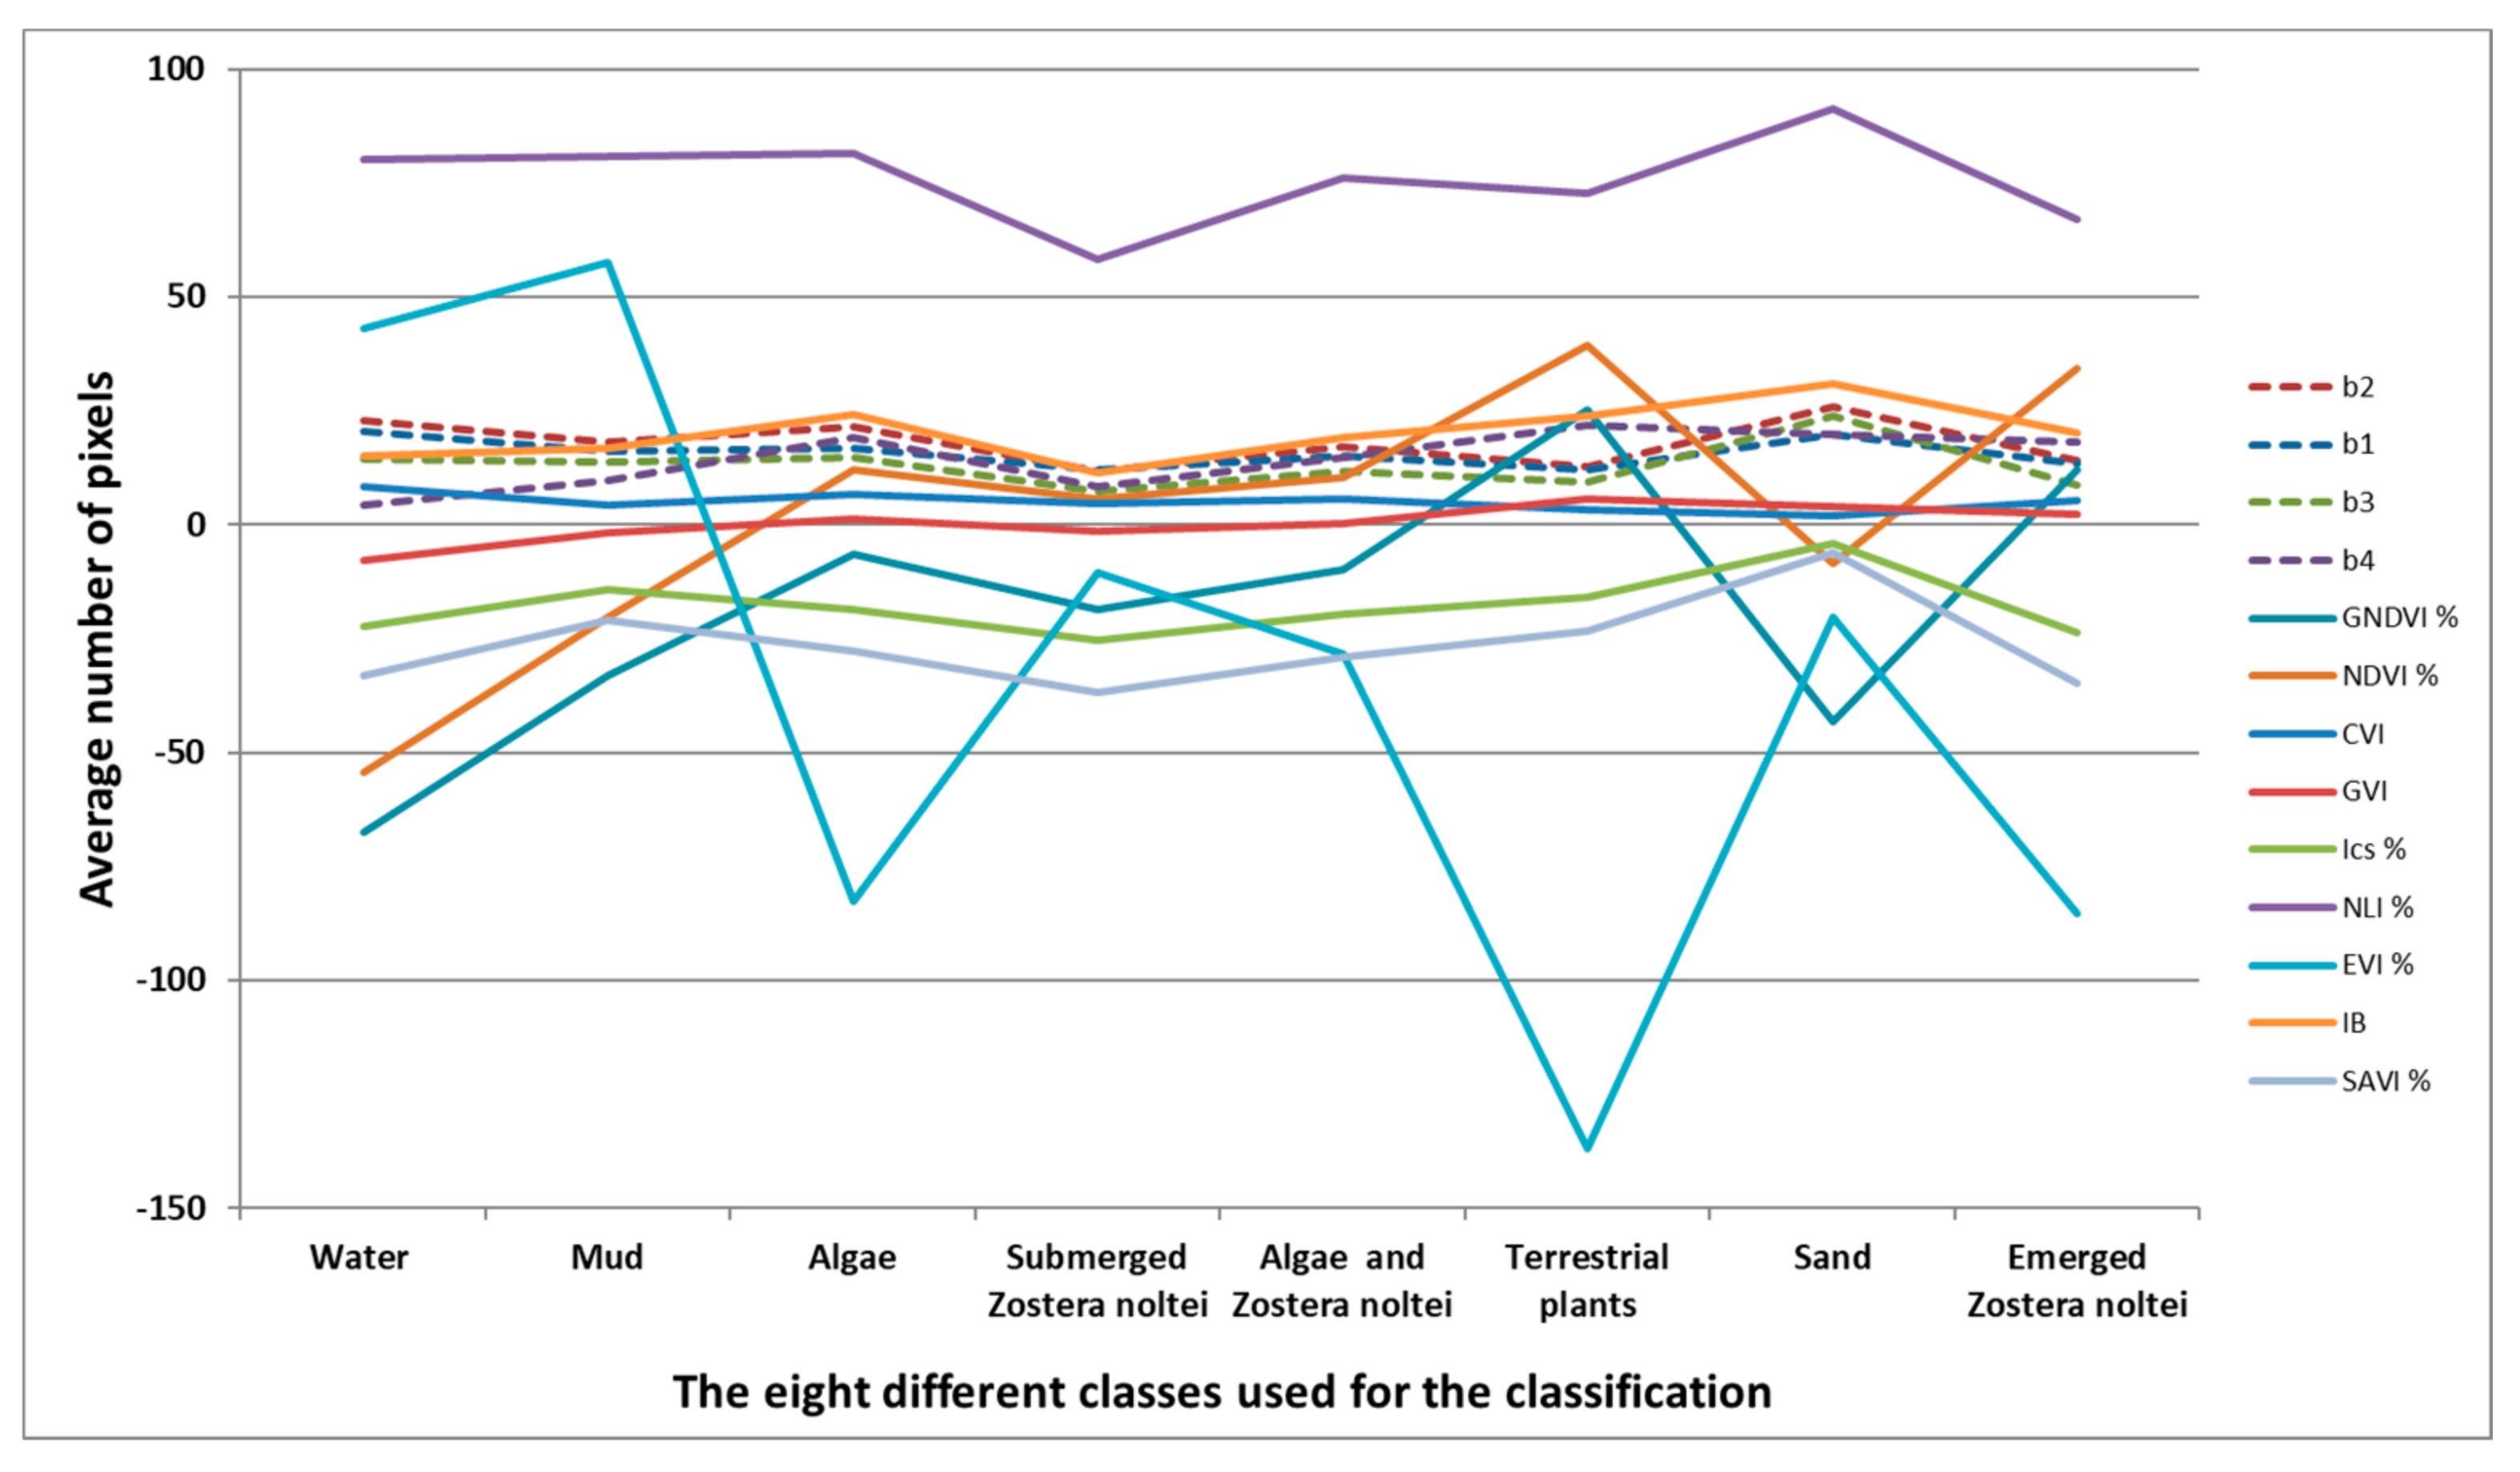
3.1. Spectral Results
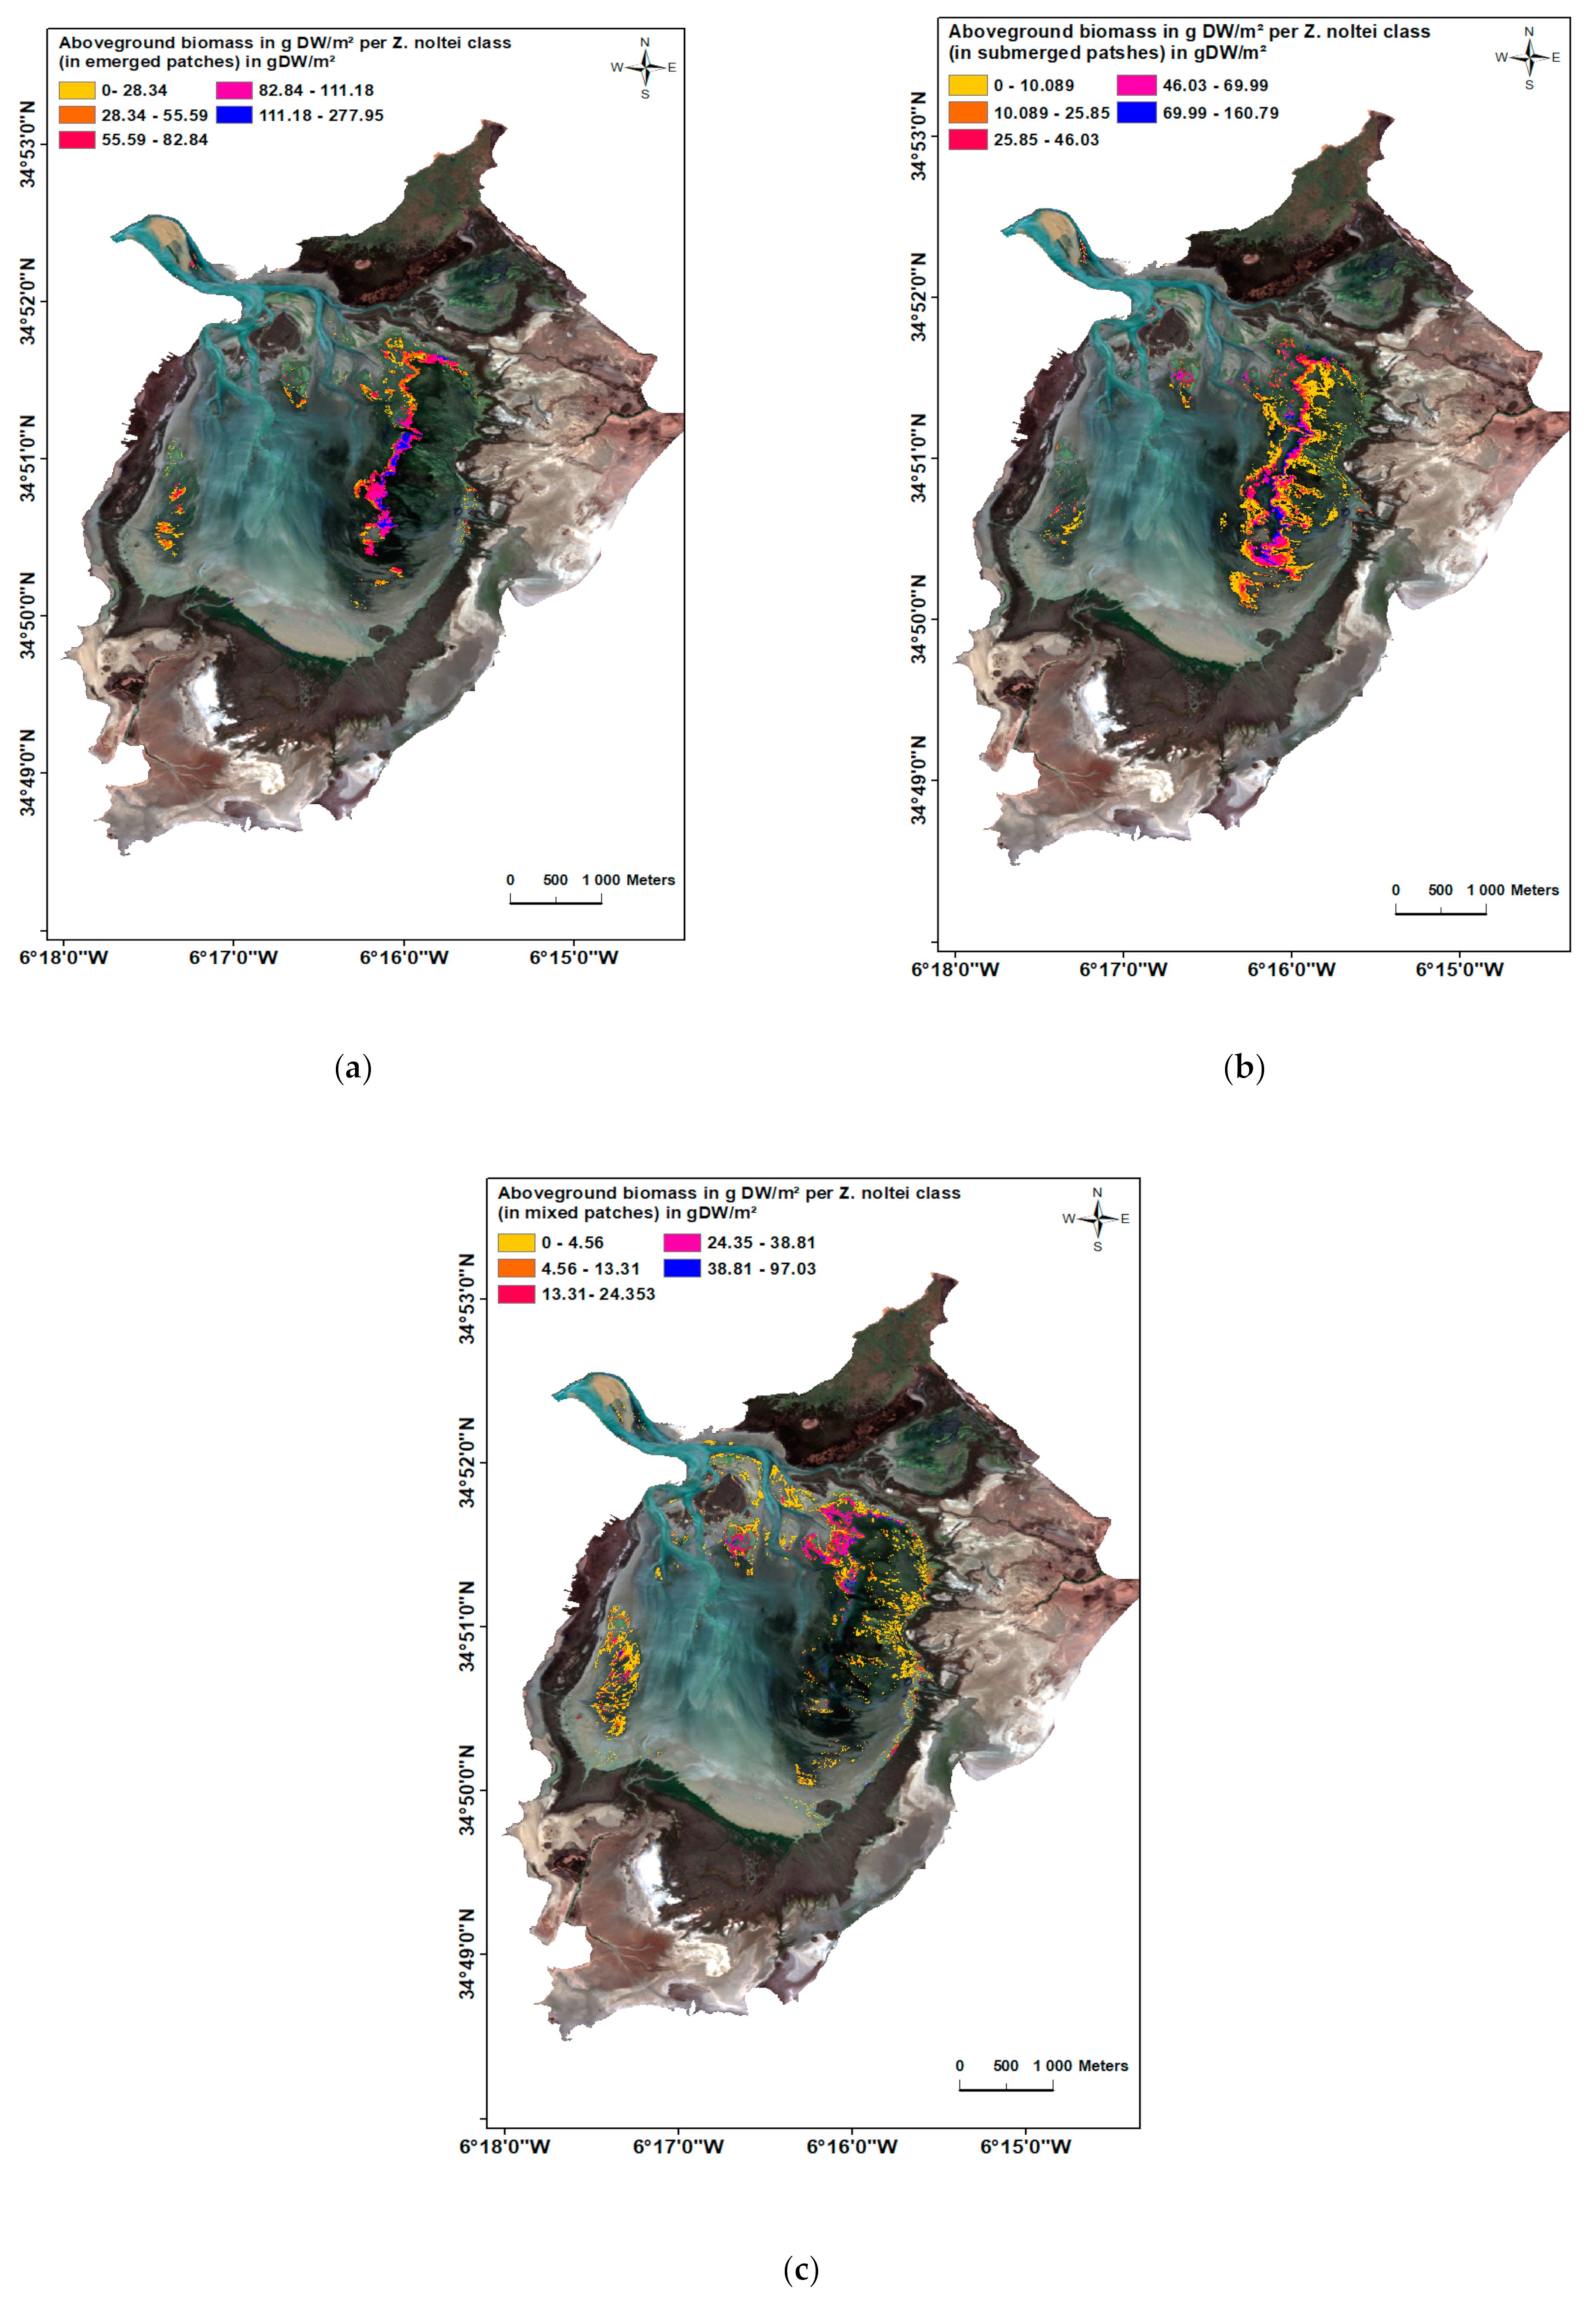
3.2. Biomass and Cover Percentage of Z. noltei
3.3. Satellite Image Processing
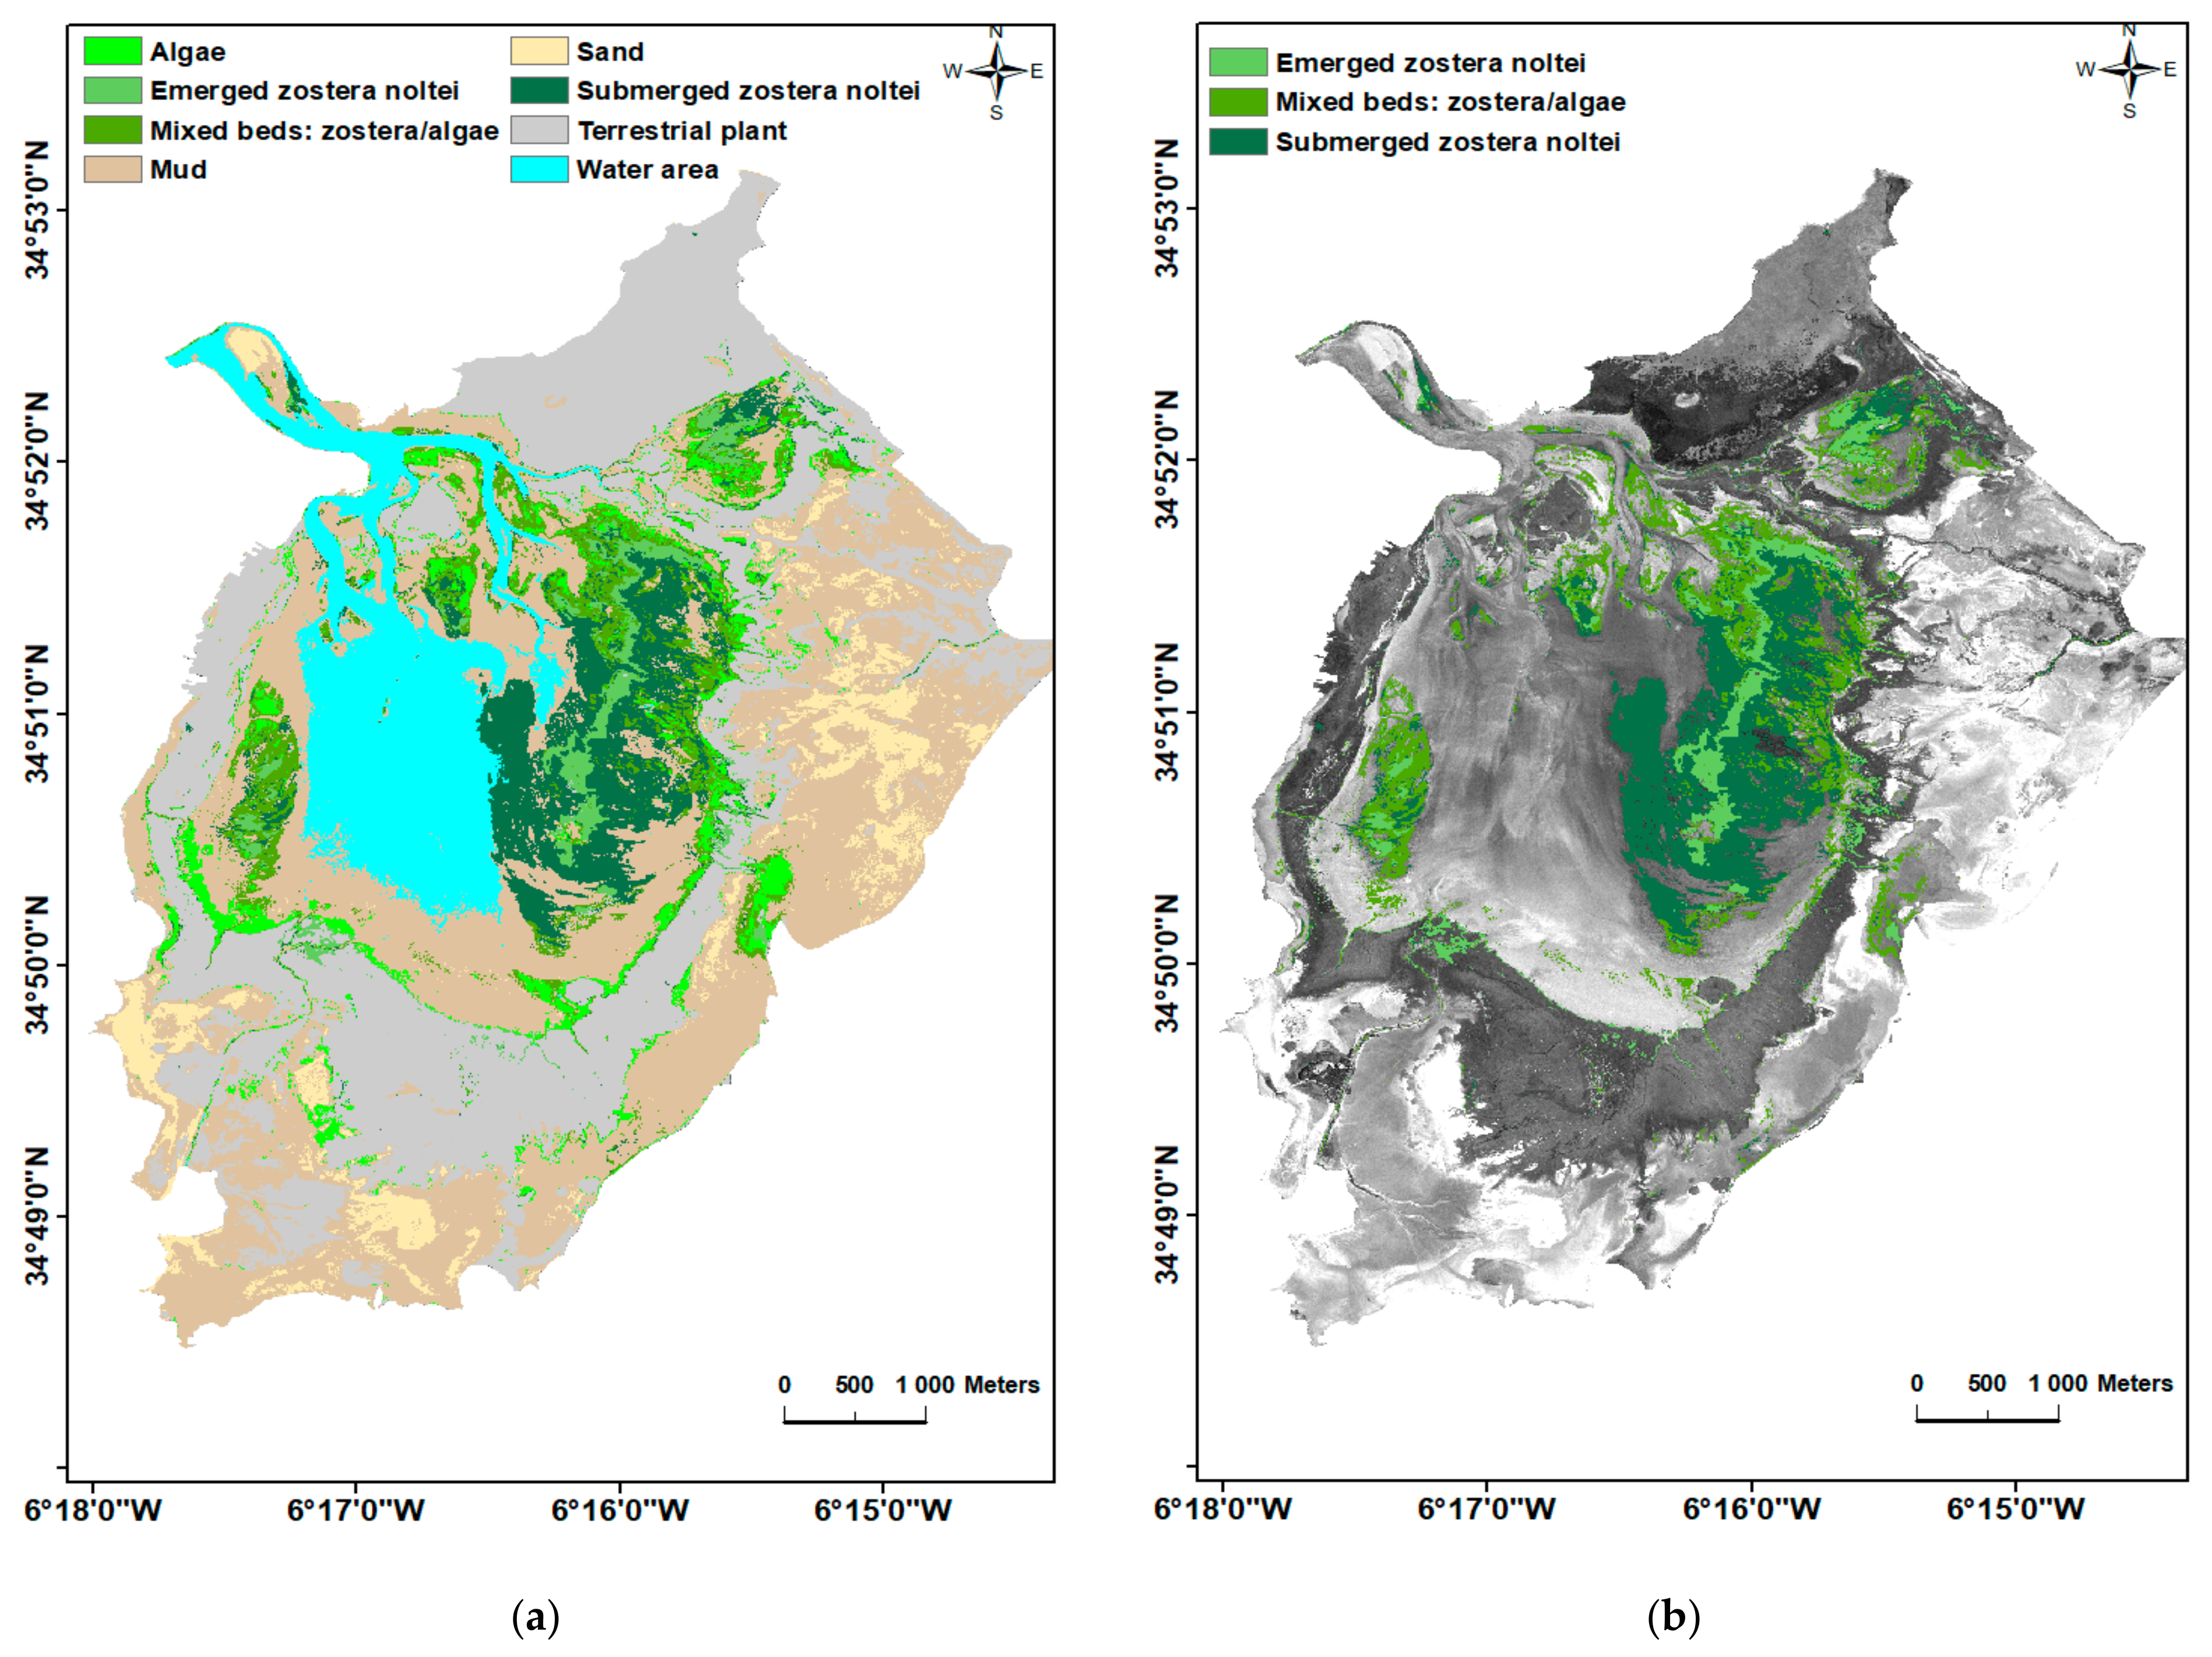
3.4. Image Classification
4. Discussion
5. Conclusions
Author Contributions
Funding
Institutional Review Board Statement
Informed Consent Statement
Data Availability Statement
Acknowledgments
Conflicts of Interest
References
- Orth, R.J.; Carruthers, T.J.; Dennison, W.C.; Duarte, C.M.; Fourqurean, J.W.; Heck, K.L.; Hughes, A.R.; Kendrick, G.A.; Kenworthy, W.J.; Olyarnik, S. A Global Crisis for Seagrass Ecosystems. Bioscience 2006, 56, 987–996. [Google Scholar] [CrossRef] [Green Version]
- Duarte, C.; Borum, J.; Short, F.T.; Walker, D.I. Seagrass Ecosystems: Their Global Status and Prospects. In Aquatic Ecosystems: Trends and Global Prospects; Cambridge University Press: Cambridge, UK, 2008; pp. 281–294. [Google Scholar] [CrossRef]
- Short, F.T.; Polidoro, B.; Livingstone, S.R.; Carpenter, K.E.; Bandeira, S.; Bujang, J.S.; Calumpong, H.P.; Carruthers, T.J.B.; Coles, R.G.; Dennison, W.C.; et al. Extinction risk assessment of the world’s seagrass species. Biol. Conserv. 2011, 144, 1961–1971. [Google Scholar] [CrossRef]
- Duffy, J. Biodiversity and the functioning of seagrass ecosystems. Mar. Ecol. Prog. Ser. 2006, 311, 233–250. [Google Scholar] [CrossRef] [Green Version]
- Short, F.; Carruthers, T.; Dennison, W.; Waycott, M. Global seagrass distribution and diversity: A bioregional model. J. Exp. Mar. Biol. Ecol. 2007, 350, 3–20. [Google Scholar] [CrossRef]
- Gutiérrez, J.L.; Jones, C.G.; Byers, J.E.; Arkema, K.; Berkenbusch, K.; Commito, J.A.; Duarte, C.M.; Hacker, S.D.; Lambrinos, J.G.; Hendriks, I.E.; et al. Physical Ecosystem Engineers and the Functioning of Estuaries and Coasts. In Treatise on Estuarine and Coastal Science; Academic Press: Waltham, MA, USA, 2011; Volume 7, pp. 53–81. [Google Scholar]
- Marbà, N.; Krause-Jensen, D.; Alcoverro, T.; Birk, S.; Pedersen, A.; Neto, J.M.; Orfanidis, S.; Garmendia, J.M.; Muxika, I.; Borja, A.; et al. Diversity of European seagrass indicators: Patterns within and across regions. Hydrobiologia 2012, 704, 265–278. [Google Scholar] [CrossRef]
- Fontan, E.; Dumas, P.; Ponton, D. Méthodes de Cartographie, de Caractérisation et de Suivi des Herbiers Marins. 2011. Available online: https://www.google.com/url?sa=t&rct=j&q=&esrc=s&source=web&cd=&cad=rja&uact=8&ved=2ahUKEwjenJLGiLHwAhWJFMAKHcgtA4gQFjAAegQIAxAD&url=https%3A%2F%2Fwww.zoneco.nc%2Fsystem%2Ffiles_force%2Fdocuments%2Fmethode_de_cartographie_de_caracterisation_et_de_suivi_des_herbiers_marins.pdf%3Fdownload%3D1&usg=AOvVaw3mGzT8NjBkgJVlHJK_Yj1R (accessed on 25 February 2021).
- Borum, J.; Duarte, C.M.; Krause-Jensen, D.; Greve, T.M. European Seagrasses: An Introduction to Monitoring and Management; The EU Project Monitoring and Management of European Seagrasses (M&MS Project): Hilleroed, Danmark, 2004; ISBN 87-89143-21-3. [Google Scholar]
- Short, F.T.; Coles, R.G. Global Seagrass Research Method; Elsevier Science B.V.: Amsterdam, The Netherlands, 2001; 473p. [Google Scholar]
- Green, E.R.; Short, F.T. World Atlas of Seagrasses; University of California Press: Berkeley, CA, USA, 2003. [Google Scholar]
- Moore, K.A.; Short, F.T. Zostera: Biology, ecology and management. In Seagrasses: Biology, Ecology and Conservation; Larkum, T., Orth, R., Duarte, C., Eds.; Springer: Dordrecht, The Netherlands, 2006; pp. 361–386. [Google Scholar]
- Diekmann, O.E.; Gouveia, L.; Perez, J.A.; Gil-Rodriguez, C.; Serrão, E.A. The possible origin of Zostera noltii in the Canary Islands and guidelines for restoration. Mar. Biol. 2010, 157, 2109–2115. [Google Scholar] [CrossRef]
- Dalloyau, S. Qualité Ecologique des Herbiers Intertidaux à Zostère Naine Zostera Noltei dans les Sites Fonctionnels des Réserves Naturelles Nationales Gérées par la LPO (Pertuis Charentais). 2020. Available online: https://www.researchgate.net/publication/349345847_Qualite_ecologique_des_herbiers_intertidaux_a_Zostere_naine_Zostera_noltei_dans_les_sites_fonctionnels_des_Reserves_Naturelles_Nationales_gerees_par_la_LPO_Pertuis_Charentais (accessed on 25 February 2021).
- Polte, P.; Schanz, A.; Asmus, H. The contribution of seagrass beds (Zostera noltii) to the function of tidal flats as a juvenile habitat for dominant, mobile epibenthos in the Wadden Sea. Mar. Biol. 2005, 147, 813–822. [Google Scholar] [CrossRef]
- Bououarour, O.; El Kamcha, R.; Boutoumit, S.; Pouzet, P.; Maanan, M.; Bazairi, H. Effects of the Zostera noltei meadows on benthic macrofauna in North Atlantic coastal ecosystems of Morocco: Spatial and seasonal patterns. Biologia 2021, 1–13. [Google Scholar] [CrossRef]
- Cabaço, S.; Santos, R.; Sprung, M. Population dynamics and production of the seagrass Zostera noltii in colonizing versus established meadows. Mar. Ecol. 2011, 33, 280–289. [Google Scholar] [CrossRef]
- Chust, G.; Borja, Á.; Caballero, A.; Irigoien, X.; Sáenz, J.; Moncho, R.; Marcos, M.; Liria, P.; Hidalgo, J.; Valle, M.; et al. Climate change impacts on coastal and pelagic environments in the southeastern Bay of Biscay. Clim. Res. 2011, 48, 307–332. [Google Scholar] [CrossRef]
- Massa, S.I.; Arnaud-Haond, S.; Pearson, G.A.; Serrão, E.A. Temperature tolerance and survival of intertidal populations of the seagrass Zostera noltii (Hornemann) in Southern Europe (Ria Formosa, Portugal). Hydrobiol. 2008, 619, 195–201. [Google Scholar] [CrossRef]
- Short, F.T.; Neckles, H.A. The effects of global climate change on seagrasses. Aquat. Bot. 1999, 63, 169–196. [Google Scholar] [CrossRef]
- Chauvaud, S.; Bouchon, C.; Maniere, R. Remote sensing techniques adapted to high resolution mapping of tropical coastal marine ecosystems (coral reefs, seagrass beds and mangrove). Int. J. Remote Sens. 1998, 19, 3625–3639. [Google Scholar] [CrossRef]
- Dekker, A.; Brando, V.; Antsee, J.; Fyfe, S.; Malthus, T.; Karpouzli, A. Remote Sensing of Seagrass Ecosystems: Use of Space-borne and Airborne Sensors. In Seagrasses: Biology, Ecology and Conservation; Larkum, T., Orth, R.J., Duarte, C.M., Eds.; Springer: Dordrecht, The Netherlands, 2006; pp. 347–359. ISBN 978-1-4020-2983-7. [Google Scholar]
- Ferwerda, J.G.; De Leeuw, J.; Atzberger, C.; Vekerdy, Z. Satellite-based monitoring of tropical seagrass vegetation: Current techniques and future developments. Hydrobiologia 2007, 591, 59–71. [Google Scholar] [CrossRef]
- Hossain, M.S.; Bujang, J.S.; Zakaria, M.H.; Hashim, M. Application of Landsat images to seagrass areal cover change analysis for Lawas, Terengganu and Kelantan of Malaysia. Cont. Shelf Res. 2015, 110, 124–148. [Google Scholar] [CrossRef]
- Hossain, M.S.; Hashim, M. Potential of Earth Observation (EO) technologies for seagrass ecosystem service assessments. Int. J. Appl. Earth Obs. Geoinf. 2019, 77, 15–29. [Google Scholar] [CrossRef]
- Dingtian, Y.; Chaoyu, Y.D.A.Y. Seagrass Distribution in China with Satellite Remote Sensing. In Remote Sensing of Planet Earth; IntechOpen: London, UK, 2012; p. 29043. Available online: https://www.intechopen.com/books/remote-sensing-of-planet-earth/seagrass-distribution-in-china-with-remote-sensin (accessed on 25 February 2021).
- Meyer, C.A.; Pu, R. Seagrass resource assessment using remote sensing methods in St. Joseph Sound and Clearwater Harbor, Florida, USA. Environ. Monit. Assess. 2011, 184, 1131–1143. [Google Scholar] [CrossRef]
- Roelfsema, C.M.; Phinn, S.R.; Udy, N.S.; Maxwell, P.S. An integrated field and remote sensing approach for mapping Seagrass Cover, Moreton Bay, Australia. J. Spat. Sci. 2009, 54, 45–62. [Google Scholar] [CrossRef]
- Bououarour, O.; El Kamcha, R.; Boutahar, L.; Tnoumi, A.; Zourarah, B.; Benhoussa, A.; Bazairi, H. Spatial patterns of the Zostera noltei meadows across the Atlantic coast of Morocco: Is there a latitudinal gradient? PeerJ PrePr. 2015, 3, e1076v1. [Google Scholar] [CrossRef]
- Boutahar, L.; Maanan, M.; Bououarour, O.; Richir, J.; Pouzet, P.; Gobert, S.; Maanan, M.; Zourarah, B.; Benhoussa, A.; Bazairi, H. Biomonitoring environmental status in semi-enclosed coastal ecosystems using Zostera noltei meadows. Ecol. Indic. 2019, 104, 776–793. [Google Scholar] [CrossRef]
- Ahmed, M.H.; El Leithy, B.M.; Thompson, J.R.; Flower, R.J.; Ramdani, M.; Ayache, F.; Hassan, S.M. Application of remote sensing to site characterisation and environmental change analysis of North African coastal lagoons. Hydrobiologia 2009, 622, 147–171. [Google Scholar] [CrossRef]
- Maanan, M.; Landesman, C.; Maanan, M.; Zourarah, B.; Fattal, P.; Sahabi, M. Evaluation of the anthropogenic influx of metal and metalloid contaminants into the Moulay Bousselham lagoon, Morocco, using chemometric methods coupled to geographical information systems. Environ. Sci. Pollut. Res. 2013, 20, 4729–4741. [Google Scholar] [CrossRef] [PubMed]
- Bazaïri, H.; Bayed, A.; Glémarec, M.; Hily, C. Spatial organisation of macrozoobenthic communities in response to envi-ronmental factors in a coastal lagoon of the NW African coast (Merja Zerga, Morocco). Oceanol. Acta 2003, 26, 457–471. [Google Scholar] [CrossRef] [Green Version]
- Kraiem, M.; Ben Hamza, C.; Ramdani, M.; Fathi, A.; Abdelzaher, H.; Flower, R. Some observations on the age and growth of thin-lipped grey mullet, Liza ramada Risso, 1826 (Pisces, Mugilidae) in three North African wetland lakes: Merja Zerga (Morocco), Garâat Ichkeul (Tunisia) and Edku Lake (Egypt). Aquat. Ecol. 2001, 35, 335–345. [Google Scholar] [CrossRef]
- Labbardi, H.; Ettahiri, O.; Lazar, S.; Massik, Z.; El Antri, S. Étude de la variation spatio-temporelle des paramètres physico-chimiques caractérisant la qualité des eaux d’une lagune côtière et ses zonations écologiques: Cas de Moulay Bousselham, Maroc. CR GEOSCI 2005, 337, 505–514. [Google Scholar] [CrossRef]
- Alaoui, A.M.; Choura, M.; Maanan, M.; Zourarah, B.; Robin, M.; Conceição, M.F.; Andrade, C.; Khalid, M.; Carruesco, C. Metal fluxes to the sediments of the Moulay Bousselham lagoon, Morocco. Environ. Earth Sci. 2009, 61, 275–286. [Google Scholar] [CrossRef]
- Flower, R.J.; Thompson, J.R. An overview of integrated hydro-ecological studies in the MELMARINA Project: Monitoring and modelling coastal lagoons—making management tools for aquatic resources in North Africa. Hydrobiologia 2008, 622, 3–14. [Google Scholar] [CrossRef]
- Appleby, P.G.; Birks, H.H.; Flower, R.J.; Rose, N.; Peglar, S.M.; Ramdani, M.; Kraïem, M.M.; Fathi, A.A. Radiometrically determined dates and sedimentation rates for recent sediments in nine North African wetland lakes (the CASSARINA Pro-ject). Aquat. Ecol. 2001, 35, 347–367. [Google Scholar] [CrossRef]
- Peters, A.; Jones, K.C.; Flower, R.; Appleby, P.; Ramdani, M.; Kraiem, M.; Fathi, A. Recent environmental change in North African wetland lakes: A baseline study of organochlorine contaminant residues in sediments from nine sites in the CASSARINA Project. Aquat. Ecol. 2001, 35, 449–459. [Google Scholar] [CrossRef]
- Ramdani, M.; Flower, R.J.; Elkhiati, N.; Kraïem, M.M.; Fathi, A.A.; Birks, H.H.; Patrick, S.T. North African wetland lakes: Characterization of nine sites included in the CASSARINA Project. Aquat. Ecol. 2001, 35, 281–302. [Google Scholar] [CrossRef] [Green Version]
- Ramdani, M.; Elkhiati, N.; Flower, R.J.; Thompson, J.R.; Chouba, L.; Kraiem, M.M.; Ayache, F.; Ahmed, M.H. Environmental influences on the qualitative and quantitative composition of phytoplankton and zooplankton in North African coastal la-goons. Hydrobiologia 2009, 622, 113–131. [Google Scholar] [CrossRef]
- Thompson, J.R.; Flower, R.J.; Ramdani, M.; Ayache, F.; Ahmed, M.H.; Rasmussen, E.K.; Petersen, O.S. Hydrological charac-teristics of three North African coastal lagoons: Insights from the MELMARINA project. Hydrobiologia 2009, 622, 45–84. [Google Scholar] [CrossRef]
- Hily, C.; Sauriau, P.G.; Auby, I. Protocoles Suivi Stationnel des Herbiers à Zostères pour la Directive Cadre sur l’Eau (DCE) Zostera marina; Rapport Ifremer/ODDE/UL/LER/AR/18.017; Ifremer: Brest, France, 2007. [Google Scholar]
- Wong, M.C.; Bravo, M.A.; Dowd, M. Ecological dynamics of Zostera marina (eelgrass) in three adjacent bays in Atlantic Canada. Bot. Mar. 2013, 56, 413–424. [Google Scholar] [CrossRef]
- Astrium Services. SPOT 6 & SPOT 7 Imagery User Guide. France. 2013. Available online: https://www.google.com/url?sa=t&rct=j&q=&esrc=s&source=web&cd=&ved=2ahUKEwj-r6nx_LDwAhWC7eAKHQ8lBF8QFjABegQIAhAD&url=https%3A%2F%2Fwww.spaceoffice.nl%2Fblobs%2FDataportaal%2FUser_Guide_SPOT6_V1.0.pdf&usg=AOvVaw1ppInVLdBsoFQgGFiigs5a (accessed on 25 February 2021).
- Hammada, S. Etudes sur la Végétation des zones Humides du Maroc: Catalogue et Analyse de la Biodiversité Floristique et Identification des Principaux Groupements Végétaux, 2017; Université Mohammed V-Agdal, Faculté des Sciences Rabat: Rabat, Morocco, 27 February 2007. [Google Scholar]
- Ha, N.T.; Manley-Harris, M.; Pham, T.D.; Hawes, I. A Comparative Assessment of Ensemble-Based Machine Learning and Maximum Likelihood Methods for Mapping Seagrass Using Sentinel-2 Imagery in Tauranga Harbor, New Zealand. Remote Sens. 2020, 12, 355. [Google Scholar] [CrossRef] [Green Version]
- Scornet, E. Tuning parameters in random forests. ESAIM: Proc. Surv. 2017, 60, 144–162. [Google Scholar] [CrossRef] [Green Version]
- Gitelson, A.A.; Kaufman, Y.J.; Merzlyak, M.N. Use of a green channel in remote sensing of global vegetation from EOS-MODIS. Remote Sens. Environ. 1996, 58, 289–298. [Google Scholar] [CrossRef]
- Rouse, J.W.J.; Haas, R.H.; Schell, J.A.; Deering, D.W. Monitoring vegetation systems in the Great Plains with ERTS. NASA Spec. Publ. 1974, 351, 309–317. [Google Scholar]
- Kauth, R.J.; Thomas, G.S. The tasselled cap--a graphic description of the spectral-temporal development of agricultural crops as seen by Landsat. In LARS Symposia; Purdue University: West Lafayette, IN, USA, 1976. [Google Scholar]
- Escadafal, R.; Huete, A. Improvement in remote sensing of low vegetation cover in arid regions by correcting vegetation indices for soil ‘‘noise’’; Etude des propriétés spectrales des sols arides appliquée à l’amélioration des indices de végétation obtenus par télédétection. FAO. C. R. Acad. Sci. 1991, 312, 1385–1391. [Google Scholar]
- Goel, N.S.; Qin, W. Influences of canopy architecture on relationships between various vegetation indices and LAI and Fpar: A computer simulation. Remote Sens. Rev. 1994, 10, 309–347. [Google Scholar] [CrossRef]
- Huete, A.; Justice, C.; Liu, H. Development of vegetation and soil indices for MODIS-EOS. Remote Sens. Environ. 1994, 49, 224–234. [Google Scholar] [CrossRef]
- Rapinel, S. Contribution de la Télédétection à l’évaluation des Fonctions des Zones Humides: De l’Observation à la Modélisation Prospective; Histoire; Université Rennes 2: Rennes, France, 2012. [Google Scholar]
- Huete, A.; Jackson, R. Soil and atmosphere influences on the spectra of partial canopies. Remote Sens. Environ. 1988, 25, 89–105. [Google Scholar] [CrossRef]
- Dehouck, A.; Lafon, V.; Lubac, B.; Kervella, S.; Bru, D.; Schmeltz, M.; Roubache, A. Hyperspectral field database in support to coastal wetland mapping. In Proceedings of the 2012 IEEE International Geoscience and Remote Sensing Symposium, Munich, Germany, 22–27 July 2012; pp. 2649–2652. [Google Scholar] [CrossRef]
- Lillesand, M.T.; Kiefer, R. Remote Sensing and Image Interpretation, 4th ed.; John Wiley and Sons: New York, NY, USA, 2000; 736p. [Google Scholar]
- Barillé, L.; Robin, M.; Harin, N.; Bargain, A.; Launeau, P. Increase in seagrass distribution at Bourgneuf Bay (France) detected by spatial remote sensing. Aquat. Bot. 2010, 92, 185–194. [Google Scholar] [CrossRef]
- Bargain, A.; Robin, M.; Meleder, V.; Rosa, P.; Le Menn, E.; Harin, N.; Barille, L. Seasonal spectral variation of Zostera noltii and its influence on pigment-based Vegetation Indices. J. Exp. Mar. Biol. Ecol. 2013, 446, 86–94. [Google Scholar] [CrossRef]
- Dakki, M.; Benhoussa, A.; Hammada, S.; Ibn Tattou, M.; Qninba, A.; El Agbani, M.A. Cartographie des Habitats Naturels et de la Végétation de Merja Zerga, Maroc. Rapp; Inédit, MedWet 2; Bureau Ramsar/Administration des Eaux & Forêts et de la Conservation du sol: Dakar, Senegal, 1998. [Google Scholar]
- Elso, M.Z.; Manent, P.; Luque, A.; Ramdani, M.; Robaina, R. Genetic Description and Remote Sensing Techniques as Management Tools for Zostera noltii Seagrass Populations along the Atlantic Moroccan Coast. J. Coast. Res. 2017, 33, 78–87. [Google Scholar] [CrossRef]
- Qninba, A.; Benhoussa, A.; El Agbani, M.-A.; Dakki, M.; Thevenot, M. Etude phénologique et variabilité interannuelle d’abondance des Charadriidés (Aves, Charadrii) dans un site Ramsar du Maroc: La Merja Zerga. Bull. l’Institut Sci.-Fique 2006, 28, 35–47. [Google Scholar]
- McKenzie, L.J.; Finkbeiner, M.A.; Kirkman, H. Methods for mapping seagrass distribution. In Global Seagrass Research Methods; Elsevier Science B.V: Amsterdam, The Netherlands, 2001; Volume 33, pp. 101–121. [Google Scholar]
- Andrade, F.; Ferreira, M.A. A method for monitoring shallow seagrass meadows (Zostera spp.) using terrestrial oblique large-scale photography. Aquat. Bot. 2011, 95, 103–109. [Google Scholar] [CrossRef]
- Calleja, F.; Galván, C.; Silió-Calzada, A.; Juanes, J.A.; Ondiviela, B. Long-term analysis of Zostera noltei: A retrospective approach for understanding seagrasses’ dynamics. Mar. Environ. Res. 2017, 130, 93–105. [Google Scholar] [CrossRef]
- Kohlus, J.; Stelzer, K.; Müller, G.; Smollich, S. Mapping seagrass (Zostera) by remote sensing in the Schleswig-Holstein Wadden Sea. Estuar. Coast. Shelf Sci. 2020, 238, 106699. [Google Scholar] [CrossRef]
- Traganos, D.; Reinartz, P. Interannual Change Detection of Mediterranean Seagrasses Using RapidEye Image Time Series. Front. Plant Sci. 2018, 9, 96. [Google Scholar] [CrossRef] [Green Version]
- Zhang, C. Applying data fusion techniques for benthic habitat mapping and monitoring in a coral reef ecosystem. ISPRS J. Photogramm. Remote Sens. 2015, 104, 213–223. [Google Scholar] [CrossRef]
- Traganos, D.; Reinartz, P. Mapping Mediterranean seagrasses with Sentinel-2 imagery. Mar. Pollut. Bull. 2018, 134, 197–209. [Google Scholar] [CrossRef] [Green Version]
- Zhang, C.; Selch, D.; Xie, Z.; Roberts, C.; Cooper, H.; Chen, G. Object-based benthic habitat mapping in the Florida Keys from hyperspectral imagery. Estuar. Coast. Shelf Sci. 2013, 134, 88–97. [Google Scholar] [CrossRef]
- Gam, M.; Bazairi, H.; De Montaudouin, X. Impact de la présence d’herbiers à Zostera noltii sur l’infestation parasitaire des coques Cerastoderma edule dans la lagune de Merja Zerga (Maroc). Bull. l’Institut Sci. 2009, 31, 13–20. [Google Scholar]
- Grignon-Dubois, M.; Rezzonico, B. Phenolic chemistry of the seagrass Zostera noltei Hornem. Part 1: First evidence of three infraspecific flavonoid chemotypes in three distinctive geographical regions. Phytochemistry 2018, 146, 91–101. [Google Scholar] [CrossRef] [PubMed]
- Natij, L.; Khalil, K.; Loudiki, M.; Elkalay, K. A first attempt at seagrass repartitioning in the Moroccan coasts. Int. J. Innov. Sci. 2014, 10, 2351–8014. [Google Scholar]
- Touhami, F.; Bazairi, H.; Badaoui, B.; Bouarour, O.; Benhoussa, A. Merja Zerga lagoon: Study of the functional structure and bioassessment of the ecological quality of benthic communities. J. Mater. Environ. Sci. 2017, 8, 4591–4599. [Google Scholar] [CrossRef]
- Touhami, F.; Bazairi, H.; Badaoui, B.; Benhoussa, A. Vertical Distribution of Benthic Macrofauna in Intertidal Habitats Frequented by Shorebirds at Merja Zerga Lagoon. Thalass. Int. J. Mar. Sci. 2017, 34, 255–265. [Google Scholar] [CrossRef]
- Proença, B.; Frappart, F.; Lubac, B.; Marieu, V.; Ygorra, B.; Bombrun, L.; Michalet, R.; Sottolichio, A. Potential of High-Resolution Pléiades Imagery to Monitor Salt Marsh Evolution After Spartina Invasion. Remote Sens. 2019, 11, 968. [Google Scholar] [CrossRef] [Green Version]
- Valle, M.; Palà, V.; Lafon, V.; Dehouck, A.; Garmendia, J.M.; Borja, Á.; Chust, G. Mapping estuarine habitats using airborne hyperspectral imagery, with special focus on seagrass meadows. Estuar. Coast. Shelf Sci. 2015, 164, 433–442. [Google Scholar] [CrossRef]
- Tulldahl, H.M.; Wikström, S.A. Classification of aquatic macrovegetation and substrates with airborne lidar. Remote Sens. Environ. 2012, 121, 347–357. [Google Scholar] [CrossRef]
- Pan, Z.; Fernandez-Diaz, J.C.; Glennie, C.L.; Starek, M. Shallow water seagrass observed by high resolution full waveform bathymetric LiDAR. In Proceedings of the 2014 IEEE Geoscience and Remote Sensing Symposium, Quebec City, QC, Canada, 13 June 2017. [Google Scholar]
- Zavalas, R.; Ierodiaconou, D.; Ryan, D.; Rattray, A.; Monk, J. Habitat Classification of Temperate Marine Macroalgal Communities Using Bathymetric LiDAR. Remote Sens. 2014, 6, 2154–2175. [Google Scholar] [CrossRef] [Green Version]
- Ishiguro, S.; Yamada, K.; Yamakita, T.; Yamano, H.; Oguma, H.; Matsunaga, T. Classification of Seagrass Beds by Coupling Airborne LiDAR Bathymetry Data and Digital Aerial Photographs. In CO2, Temperature, and Trees; Springer: Singapore, 2016; pp. 59–70. [Google Scholar]
- Parrish, C.E.; Dijkstra, J.A.; O’Neil-Dunne, J.P.M.; McKenna, L.; Pe’eri, S. Post-Sandy benthic habitat mapping using new topobathymetric lidar technology and object-based image classification. J. Coast. Res. 2016, 76, 200–208. [Google Scholar] [CrossRef] [Green Version]
- Webster, T.; McGuigan, K.; Crowell, N.; Collins, K.; Macdonald, C. Optimization of Data Collection and Refinement of Post-processing Techniques for Maritime Canada’s First Shallow Water Topographic-bathymetric Lidar Survey. J. Coast. Res. 2016, 76, 31–43. [Google Scholar] [CrossRef]
- Webster, T. Results from 3 seasons of surveys in maritime Canada using the Leica Chiroptera II shallow water topo-bathymetric lidar sensor. In Proceedings of the OCEANS 2017, Aberdeen, UK, 19–22 June 2017; pp. 1–4. [Google Scholar] [CrossRef]
- Collings, S.; Campbell, N.A.; Keesing, J.K. Quantifying the discriminatory power of remote sensing technologies for benthic habitat mapping. Int. J. Remote Sens. 2018, 40, 2717–2738. [Google Scholar] [CrossRef]
- Dierssen, H.M.; Zimmerman, R.C.; Leathers, R.A.; Downes, T.V.; Davis, C.O. Ocean color remote sensing of seagrass and bathymetry in the Bahamas Banks by high-resolution airborne imagery. Limnol. Oceanogr. 2003, 48, 444–455. [Google Scholar] [CrossRef]
- Garcia, R.A.; Hedley, J.D.; Tin, H.C.; Fearns, P.R.C.S. A Method to Analyze the Potential of Optical Remote Sensing for Benthic Habitat Mapping. Remote Sens. 2015, 7, 13157–13189. [Google Scholar] [CrossRef] [Green Version]
- Pan, Z.; Glennie, C.; Diaz, J.C.F.; Starek, M. Comparison of bathymetry and sea- grass mapping with hyperspectral imagery and airborne bathymetric lidar in a shallow estuarine environment. Int. J. Remote Sens. 2016, 37, 516–536. [Google Scholar] [CrossRef]
- Castillo-López, E.; Dominguez, J.A.; Pereda, R.; De Luis, J.M.; Pérez, R.; Piña, F. The importance of atmospheric correction for airborne hyperspectral remote sensing of shallow waters: Application to depth estimation. Atmos. Meas. Tech. 2017, 10, 3919–3929. [Google Scholar] [CrossRef] [Green Version]
- Frederiksen, M.; Krause-Jensen, D.; Holmer, M.; Laursen, J.S. Spatial and temporal variation in eelgrass (Zostera marina) landscapes: Influence of physical setting. Aquat. Bot. 2004, 78, 147–165. [Google Scholar] [CrossRef]
- Lathrop, R.G.; Montesano, P.; Haag, S. A Multi-scale Segmentation Approach to Mapping Seagrass Habitats Using Airborne Digital Camera Imagery. Photogramm. Eng. Remote Sens. 2006, 72, 665–675. [Google Scholar] [CrossRef] [Green Version]
- Fletcher, R.S.; Pulich, W.; Hardegree, B. A Semiautomated Approach for Monitoring Landscape Changes in Texas Seagrass Beds from Aerial Photography. J. Coast. Res. 2009, 252, 500–506. [Google Scholar] [CrossRef]
- Young, D.R.; Clinton, P.J.; Specht, D.T. Mapping intertidal eelgrass (Zostera marina L.) in three coastal estuaries of the Pa-cific Northwest USA using false colour near-infrared aerial photography. Int. J. Remote Sens. 2010, 31, 1699–1715. [Google Scholar] [CrossRef]
- Uhrin, A.V.; Townsend, P.A. Improved seagrass mapping using linear spectral unmixing of aerial photographs. Estuar. Coast. Shelf Sci. 2016, 171, 11–22. [Google Scholar] [CrossRef]
- Gullström, M.; Lundén, B.; Bodin, M.; Kangwe, J.; Öhman, M.C.; Mtolera, M.S.; Björk, M. Assessment of changes in the seagrass-dominated submerged vegetation of tropical Chwaka Bay (Zanzibar) using satellite remote sensing. Estuar. Coast. Shelf Sci. 2006, 67, 399–408. [Google Scholar] [CrossRef]


| Station | S1 | S2 | S3 | S4 | S5 | S6 | S7 |
|---|---|---|---|---|---|---|---|
| Location of the station | Pass 1 | Pass 2 | Pass 3 | Center 1 | Center 2 | East | West |
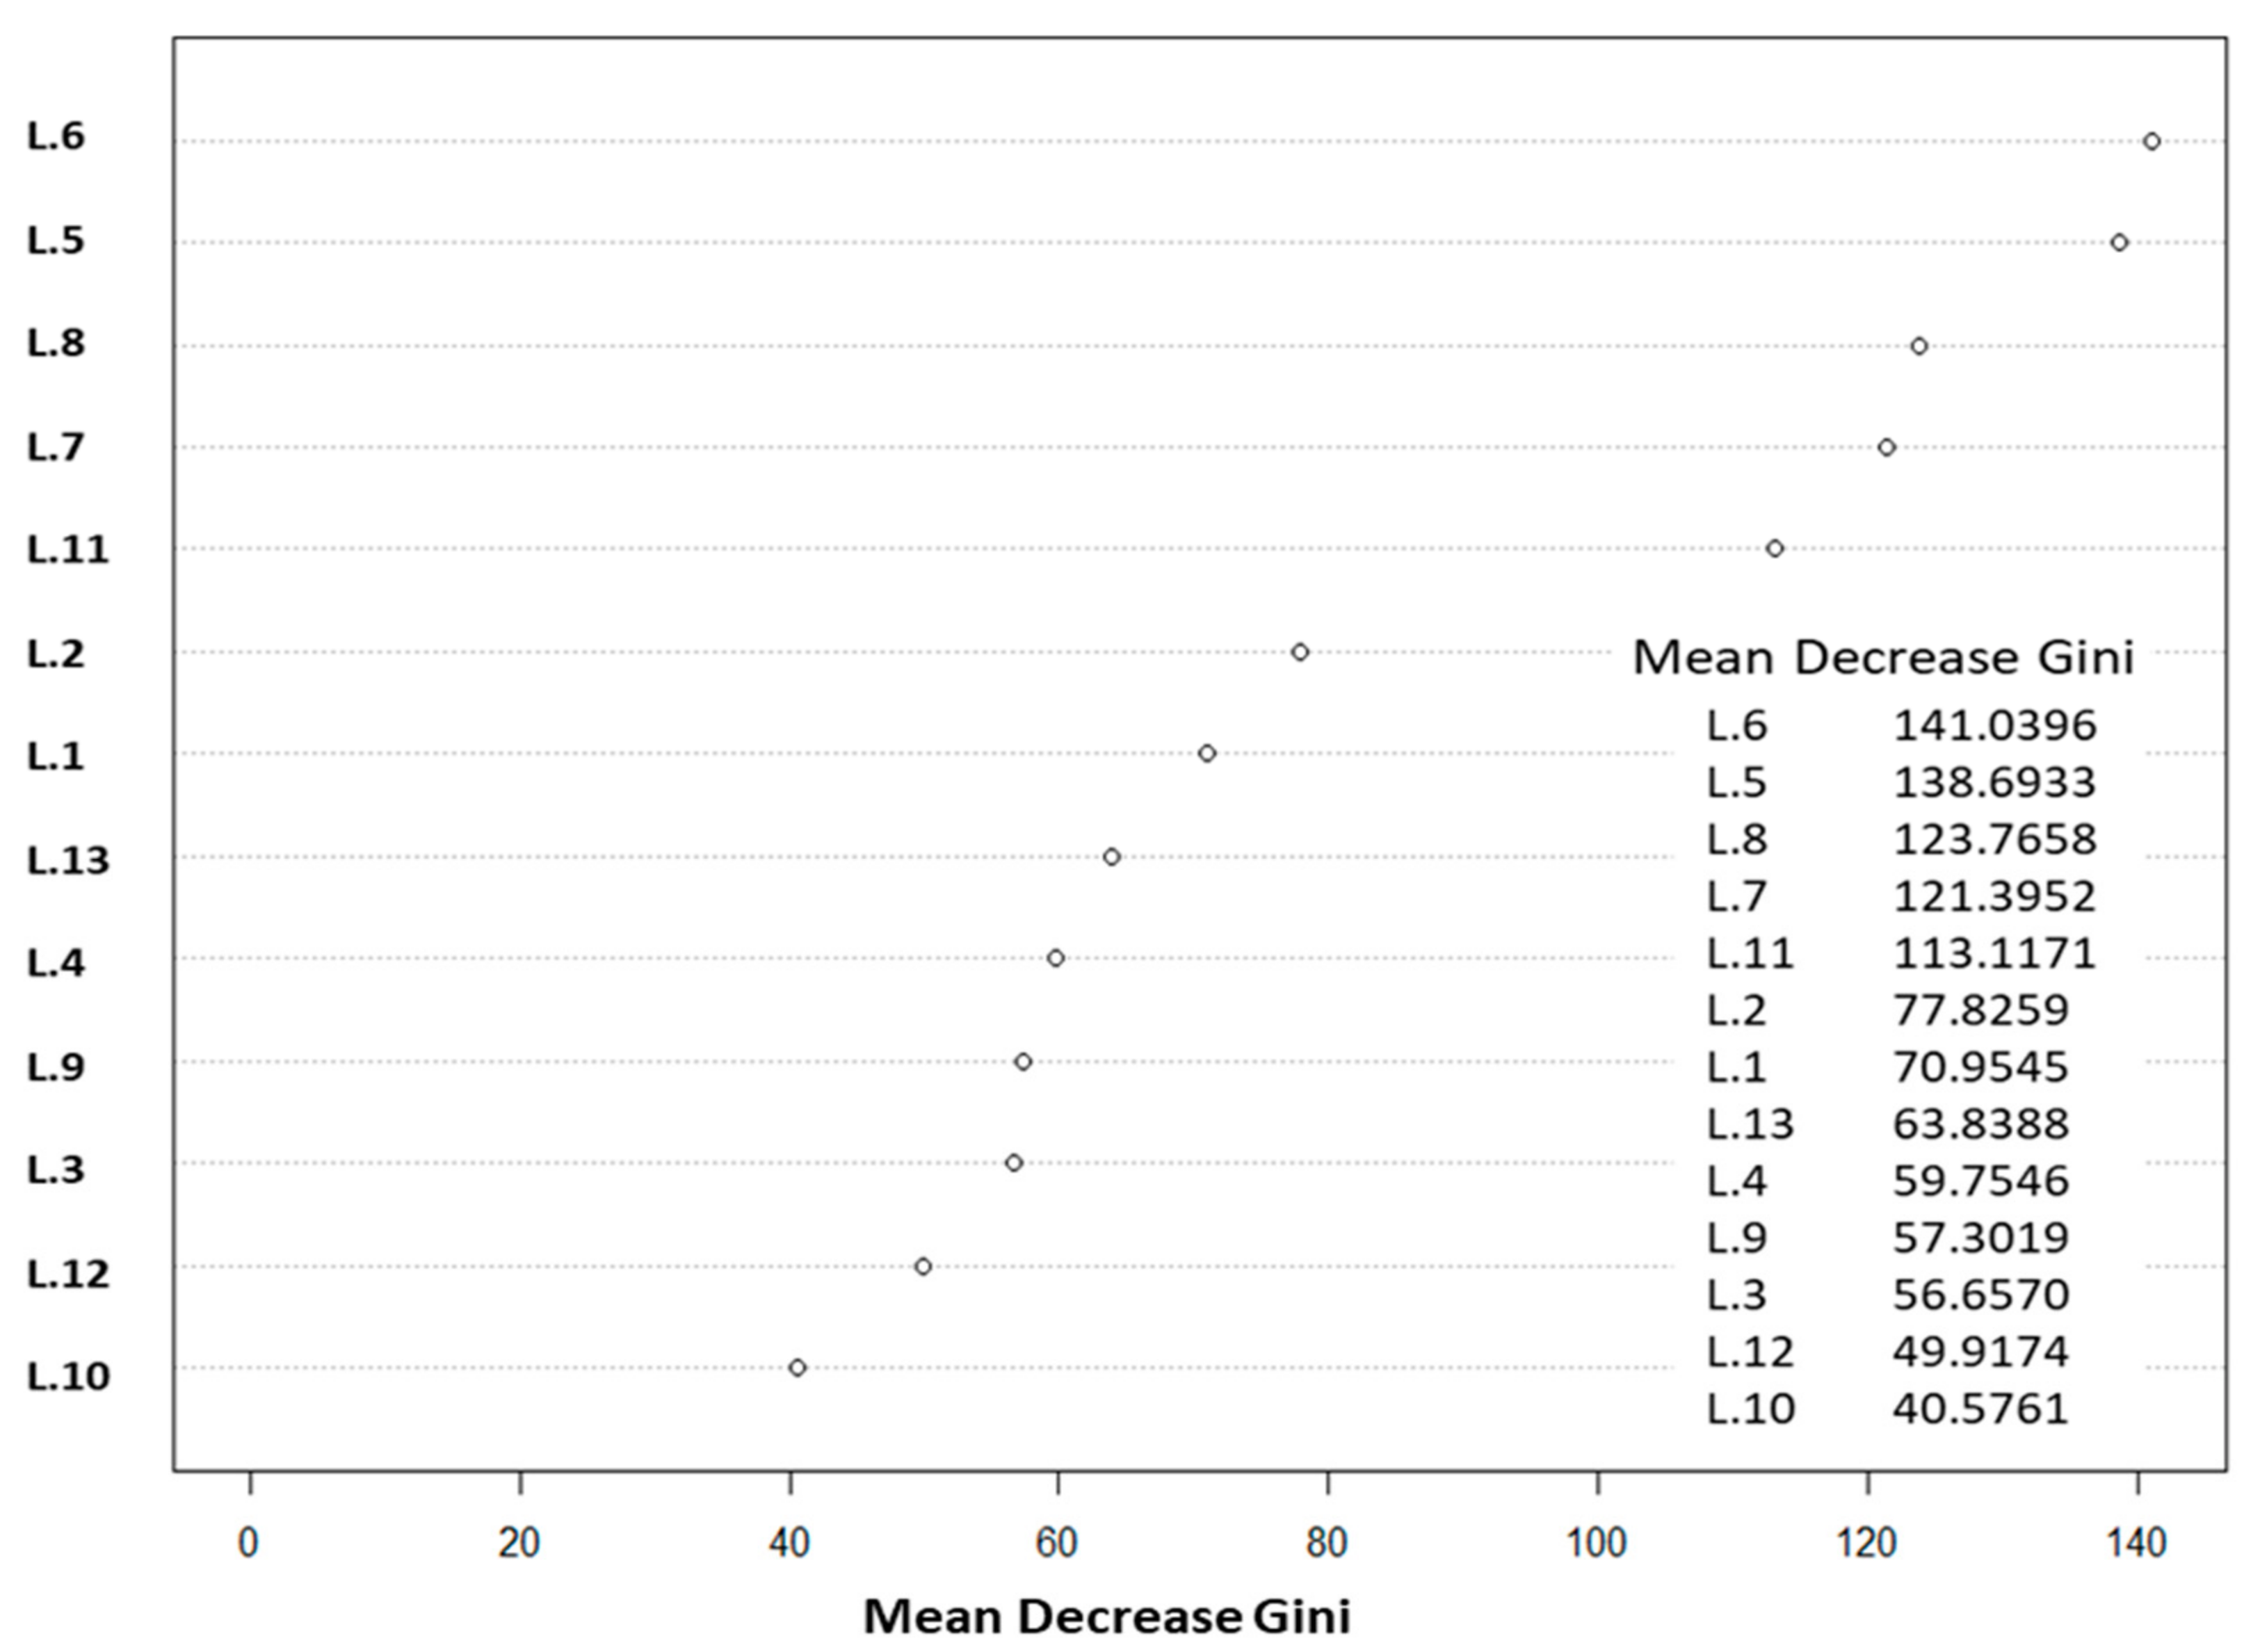
| Bands | Bands and Indices | Band Name and Full Form of Indices |
|---|---|---|
| L.1 | Band 1 | Reflectance in Blue |
| L.2 | Band 2 | Reflectance in Green |
| L.3 | Band 3 | Reflectance in Red |
| L.4 | Band 4 | Reflectance in Near Infra-Red (NIR) |
| L.5 | GNDVI | Green Normalized Vegetation Index [49] |
| L.6 | NDVI | Normalized Vegetation Index [50] |
| L.7 | CVI | Chlorophyll Vegetation Index = (Reflectance in Green–Reflectance in Red) |
| L.8 | GVI | Green Vegetation index [51] |
| L.9 | ICS | Normalized Difference Red/Green, Redness Index [52] |
| L.10 | NLI | Nonlinear Vegetation index [53] |
| L.11 | EVI | Enhanced Vegetation Index [54] |
| L.12 | IB | Brilliance Index [55] |
| L.13 | SAVI | Soil-Adjusted Vegetation Index [56] |
| Stations | S5 | S3 | S4 | S7 | S6 |
|---|---|---|---|---|---|
| Average biomass of Z. noltei g D.W.m2 | 36.17 | 84.749 | 96.48 | 106.448 | 142.81 |
| Stations | Cover Percentage of Z. noltei | ||
|---|---|---|---|
| September 2017 | September 2018 | November 2019 | |
| S1 | 0.72 | 0.92 | 0.80 |
| S2 | 0.70 | 0.72 | 0.75 |
| S3 | 0.96 | 0.94 | 0.97 |
| S5 | 0.78 | 0.76 | 0.77 |
| S4 | − * | 0.61 | 0.60 |
| S7 | − * | − * | 0.50 |
| S6 | − * | − * | 0.97 |
| Classes of Z. noltei beds | S6 | S7 | S5 | S4 | S3 | S1 and S2 |
|---|---|---|---|---|---|---|
| Submerged Z. noltei | 14.08 | 5.83 | 1.23 | 4.58 | 0.0888 | 1.49 |
| Emerged Z. noltei | 31.52 | 4.67 | 0.179 | 1.25 | 0.0094 | 0.286 |
| Mixed patches | 50.26 | 24.74 | 12.26 | 7.93 | 0.0736 | 0.26 |
| Z. noltei Beds Surfaces (ha) | S6 | S7 | S5 | S4 | S3 | S1 and S2 |
|---|---|---|---|---|---|---|
| Total surface area of Z. noltei and algae (ha) | 95.86 | 35.24 | 13.68 | 13.76 | 0.17 | 2.05 |
| Cover percentage of Z. noltei | 0.97 | 0.5 | 0.77 | 0.61 | 0.96 | 0.77 |
| Z. noltei surface area (ha) | 92.98 | 17.61 | 10.53 | 8.39 | 0.16 | 1.57 |
| Z. noltei Classes | Mixed Beds | Submerged/Emerged Beds | |||
| Maximum biomass of Z. noltei g D.W.m2 (from SPOT 7 image calibration) | 97.03 | 160.79/277.95 | |||
| Stations | S5 | S4 | S3 | S6 | S7 |
| Average biomass of Z. noltei g D.W.m2 (from field samples) | 36.17 | 96.48 | 77.62 to 84.749 | 142.81 | 106.448 |
Publisher’s Note: MDPI stays neutral with regard to jurisdictional claims in published maps and institutional affiliations. |
© 2021 by the authors. Licensee MDPI, Basel, Switzerland. This article is an open access article distributed under the terms and conditions of the Creative Commons Attribution (CC BY) license (https://creativecommons.org/licenses/by/4.0/).
Share and Cite
Benmokhtar, S.; Robin, M.; Maanan, M.; Bazairi, H. Mapping and Quantification of the Dwarf Eelgrass Zostera noltei Using a Random Forest Algorithm on a SPOT 7 Satellite Image. ISPRS Int. J. Geo-Inf. 2021, 10, 313. https://0-doi-org.brum.beds.ac.uk/10.3390/ijgi10050313
Benmokhtar S, Robin M, Maanan M, Bazairi H. Mapping and Quantification of the Dwarf Eelgrass Zostera noltei Using a Random Forest Algorithm on a SPOT 7 Satellite Image. ISPRS International Journal of Geo-Information. 2021; 10(5):313. https://0-doi-org.brum.beds.ac.uk/10.3390/ijgi10050313
Chicago/Turabian StyleBenmokhtar, Salma, Marc Robin, Mohamed Maanan, and Hocein Bazairi. 2021. "Mapping and Quantification of the Dwarf Eelgrass Zostera noltei Using a Random Forest Algorithm on a SPOT 7 Satellite Image" ISPRS International Journal of Geo-Information 10, no. 5: 313. https://0-doi-org.brum.beds.ac.uk/10.3390/ijgi10050313