Article

Are Electric Vehicles Reshaping the City? An Investigation of the Clustering of Electric Vehicle Owners’ Dwellings and Their Interaction with Urban Spaces

1
Graduate School of Advanced Science and Engineering, Hiroshima University, Higashi Hiroshima 739-8529, Japan
2
Department of City and Regional Planning, University of Pennsylvania, Philadelphia, PA 19104, USA
3
Baidu.com Times Technology (Beijing) Co., Ltd., Beijing 100085, China
*
Author to whom correspondence should be addressed.
ISPRS Int. J. Geo-Inf. 2021, 10(5), 320; https://0-doi-org.brum.beds.ac.uk/10.3390/ijgi10050320
Submission received: 1 March 2021 / Revised: 11 April 2021 / Accepted: 1 May 2021 / Published: 10 May 2021
(This article belongs to the Special Issue Geo-Information Science in Planning and Development of Smart Cities)

Abstract

:
With the rapid development of electric vehicles (EVs) around the world, debates have arisen with regard to their impacts on people’s lifestyles and urban space. Mining spatio-temporal patterns from increasingly smart city sensors and personal mobile devices have become an important approach in understanding the interaction between human activity and urban space. In this study, we used location-based service data to identify EV owners and capture the distribution of home and charging stations. The research goal was to investigate that how the urban form in regions under rapid urbanization is driven by EV use, from a geographical perspective. Using a case study of the expanding metropolis of Beijing, GIS-based spatial statistical analysis was conducted to characterize the spatial-pattern of the homes of EV owners as well as their charging preferences. Our results indicate that the spatial clustering of the homes of EV owners in non-urban central areas—suburban areas—is significantly higher than that in urban central areas. According to the records of visits to charging stations, the spatial interaction distance between the dwellings of EV owners and their visits to charging stations exhibits significant distance attenuation characteristics. 88% of EV owners in this research travels within 40 km (Euclidean distance) between housing and charging stations. At the same time, there were significant differences in the spatial patterns between working days and non-working days which are affected by commuting activities. The three types of urban spatial interaction patterns were identified and categorized by visualization. This transformation to EV use in the city influences several aspects of people’s decisions and behaviors in life. Understanding the impacts will provide valuable information for the development of EVs and their implications in the electrification of transportation, smart planning, and sustainable urbanization.

1. Introduction

The use of electric vehicles (EVs) has been growing in large metropolises across the world as an effective method of sustainable urban development due to their low carbon emissions and clean energy consumption which have many environmental benefits. Many countries, including Japan, China, members of the European Union, and the US, have announced plans to promote new energy vehicles in the upcoming decades [1]. It is estimated that by 2030, 50% of the world’s road traffic will be electrified (including electric-autonomous driving) [2]. EVs are expected to mitigate urban pollutions caused by fossil-fuel-powered internal combustion engine vehicles. These emerging concerns are pronounced in China where power generation is highly dependent on coalfired units. Researchers proved that higher fleet electrification ratios can synergistically deliver greater air quality, climate, and health benefits [3]. Nevertheless, there are concerns that EVs reduce carbon emissions of air pollutions on roads with limited consideration of the possibly increased emissions from electricity production processes [4]. In one recent interdisciplinary research study proposed in the U.S, it was stated that it is ‘imperative’ to understand the characteristics and relationships among urbanization, electrification, and cities [5]. The rapid development of EVs has caused tremendous changes in people’s lifestyles and travel patterns [6]. In particular, the possible dynamics of neighborhood change or transformation (e.g., the choice of residential location—suburban or urban—and the trip preferences for recharging of EVs) will determine the infrastructure planning strategy, further leading to fundamental impacts on the structural change of megaregions.
In earlier studies, researchers found that EV users tend to cluster in urban centers. Registration data from Norway and Sweden show clustering around urban centers, thus confirming earlier spatial analyses where a high-density charging infrastructure was deployed at urban centers [7]. EVs were promoted as the mainly transportation choice of renewable power sources in urban environments in that they bring many health benefits to residents. As such, EVs were originally supposed to be more suitable for usage in cities, where they can meet the needs of short-distance travel activities within the city, such as commuting [8,9]. However, with the development of new energy technology and the increasing numbers of EVs, researchers have begun to rethink the positioning of EVs in the city and rethink the relationship between the use of EVs and the urban environment. Some recent studies have found that the number of EV users in the Nordic region will decrease with the increase in urbanization [10]. Some different opinions have emerged, e.g., that the growth of EVs in suburban or rural areas will be faster than in urban centers. One European experience survey shows that suburban or rural residents are more willing to buy EVs than urban residents [11]. Studies from a consumer perspective support this point and show that people living in the suburbs of cities can benefit more from the lower operating costs of EVs [12]. Some studies claim that high-density urban areas are not the best choice for EVs due to the demand for a certain amount of open spaces for new energy infrastructure. Economically building charging stations will be challenging in high-density built-up areas, where parking spaces in the city are inherently limited. For example, one study from Germany shows that more than 40% of drivers do not have private parking spaces in the city [11]. Due to the fewer public transportation options in the suburbs and the sparse road network, EVs benefit residents who are more dependent on private vehicles [13]. The changes brought about by the rapid development of EVs will further affect the spatial structure of the city, as well as the layout and sustainable development of the infrastructure network [14]. Scholars in the field of transportation geography and planning are currently investigating the impact of the emerging electrification technologies on the travel and lifestyle of residents and whether they will drive people to live beyond the city and cause further decentralization.
In many aspects, EVs are different from traditional fuel vehicles. Specifically, EV batteries have a certain mileage limit, and EV charging requires a long charging session time (about 1.5–2 h for fast charging, and more than 4 h for slow charging) [15]. Generally, recharging is an essential issue that EV owners need to consider when planning a route, particular for long-distance trips [16]. Accordingly, studies have also shown that EV users place a higher priority on route optimization compared to non-EV users, in order to achieve a high efficiency of battery energy consumption [17]. With the increasing number of EV owners, it has been found that EV owners have a higher frequency of short-distance trips, but a longer total mileage compared with traditional fuel vehicles [18,19]. Some studies have simulated and modeled the charging and route choice behavior of EV drivers. A case study in Australia demonstrates that mileage anxiety tends to lead EV drivers to take advantage of any possible opportunity to recharge their vehicles, regardless of the remaining available mileage [17]. EV drivers tend to take into account the travel range and charging time when planning a trip. A case study from Beijing showed that EV drivers are more likely to choose a charging station closer to the origin or the destination of their trips. One case study from Southern Germany discussed destination charging demands and highlighted the importance of EV users’ behavior [20,21]. Different scenarios were discussed, including the convenience of charging at a given destination, as EV users can then do what they like during the charging period [22]. In the above-mentioned research on EV driver behaviors, the spatial activity in the urban context is not clear, although the origin or destination of one trip can explain the results.
Multiple data sources have been used to understand the characteristics of EV owners. Most of these studies focus on factors affecting who purchase EVs and why [11,23], travel behavior and charging choice [20,21], and the location planning of charging stations [7,24,25]. Extensive discussions about influencing factors have been widely conducted in the geoscience literature, such as cost/price, topography, impression of safety, convenience, income, education level, infrastructure accessibility, etc. [10,11,21,26]. However, clear results are missing in terms of the impact of EVs on cities, which calls for more investigation. There is little research on the possible changes in the residential location of EV users with urbanization or on travel preferences for charging. Currently, data on EV users are still limited. Since EVs only account for a small proportion of traffic flow data, it is difficult to distinguish EV from non-EV users [27]. The most direct information on EV users is mainly derived from questionnaire surveys or EV registration data [10]. Nevertheless, recent studies have pointed out that there are different EV consumer groups [28].More specifically, people in the suburbs may become the main force purchasing EVs so the deviations in sample acquisition may affect the conclusion. Charging consumption data from charging stations are another data source mainly used to study charging behavior and energy demand estimation, while the accessibility and feasibility of obtaining data are determined by operators in different regions [29]. In addition, traditional survey data generally lack temporal and spatial characteristics and human–land interaction processes, and there are few studies on the distribution pattern of charging spaces from the perspective of the travel mode of residents. The impact of EV development on urban space is not clear.
With the widespread application of smart sensors and mobile internet, location-based service (LBS) big data provide a new perspective for studying the spatiotemporal characteristics of the activities of urban residents [30,31]. For example, the LBS network and mobile apps (such as map services and social media data) generate substantial amounts of big data with individual and spatio-temporal semantic information and have been widely used in urban studies. Derived from studies with different research goals, many data mining algorithms have been developed for the identification of job-housing locations [32], the category of urban functional areas [33,34], and the observation and analysis of the characteristics of residents’ spatio-temporal activities in specific areas [35,36]. For example, LBS-based interactions between residents’ visits and urban POI have been used to re-define urban functional areas, namely the land use functional type, from the perspective of residents’ actual usage [37,38]. The job–housing balance of urban residents and the temporal characteristics of travel behavior have been used to evaluate the rationality of urban spatial layouts. Changes in the activity volume/density of urban residents reflect to some extent the vitality of the urban functions undertaken by the region. The interaction between urban spaces can be characterized as the mobility or energy flow driven by travel [39]. At present, the application of LBS big data in the study of EV mobility or travel behavior is under exploration and mostly focuses on planning public charging stations. For example, Tu et al. used the GPS data of EV ride-hailing groups to estimate charging demand [15]; Weldon et al. used the GPS-tracked EV fleet in Ireland to support charging station planning and Pedge et al. discussed the available data sources for charging behavior modelling [40,41]. Distinguishing between EV users and non-EV users and establishing an acceptable data security mechanism also become challenging when using these types of data.
Based on findings and discussions from existing studies, this study aims to fill the research gaps and explore the impact of EV development on people’s lives and the patterns of travel to charging stations from a geographic perspective. Regarding the data security and regulations, we designed an applicable data mining strategy and technical workflow to obtain the desensitized data products of EV groups derived from the LBS provider Baidu. Taking Beijing as a case study, LBS big data were used to identify EV groups and analyze the clustering features of residential locations—is the clustering present in urban centers or non-urban areas? Combined with the residential and employment land use data, we further analyzed the interactive features between the urban spaces driven by the EV user’s ‘dwelling–travelling for charging’ activity, considering the differences between weekdays and weekends. We use GIS-based spatial statistics methods, a distance attenuation model, and density-based spatial aggregation to investigate the research questions, moving the debate to issues connected to time, space, and distance, and mapping the spatial interaction patterns.
The article is arranged as follows. The second section gives an overview of the context of the research area and introduces the big data sources and the data preprocessing method, with a focus on how to use LBS data to identify EV users and obtain their home location. The third section introduces the spatial statistics and analysis and the visualization methods used in this research. The fourth part shows the research results and discussions. The fifth part summarizes the conclusions and contributions and details the recommendations for urban planning and transportation infrastructure layouts.

2. Research Area and Data Preprocessing
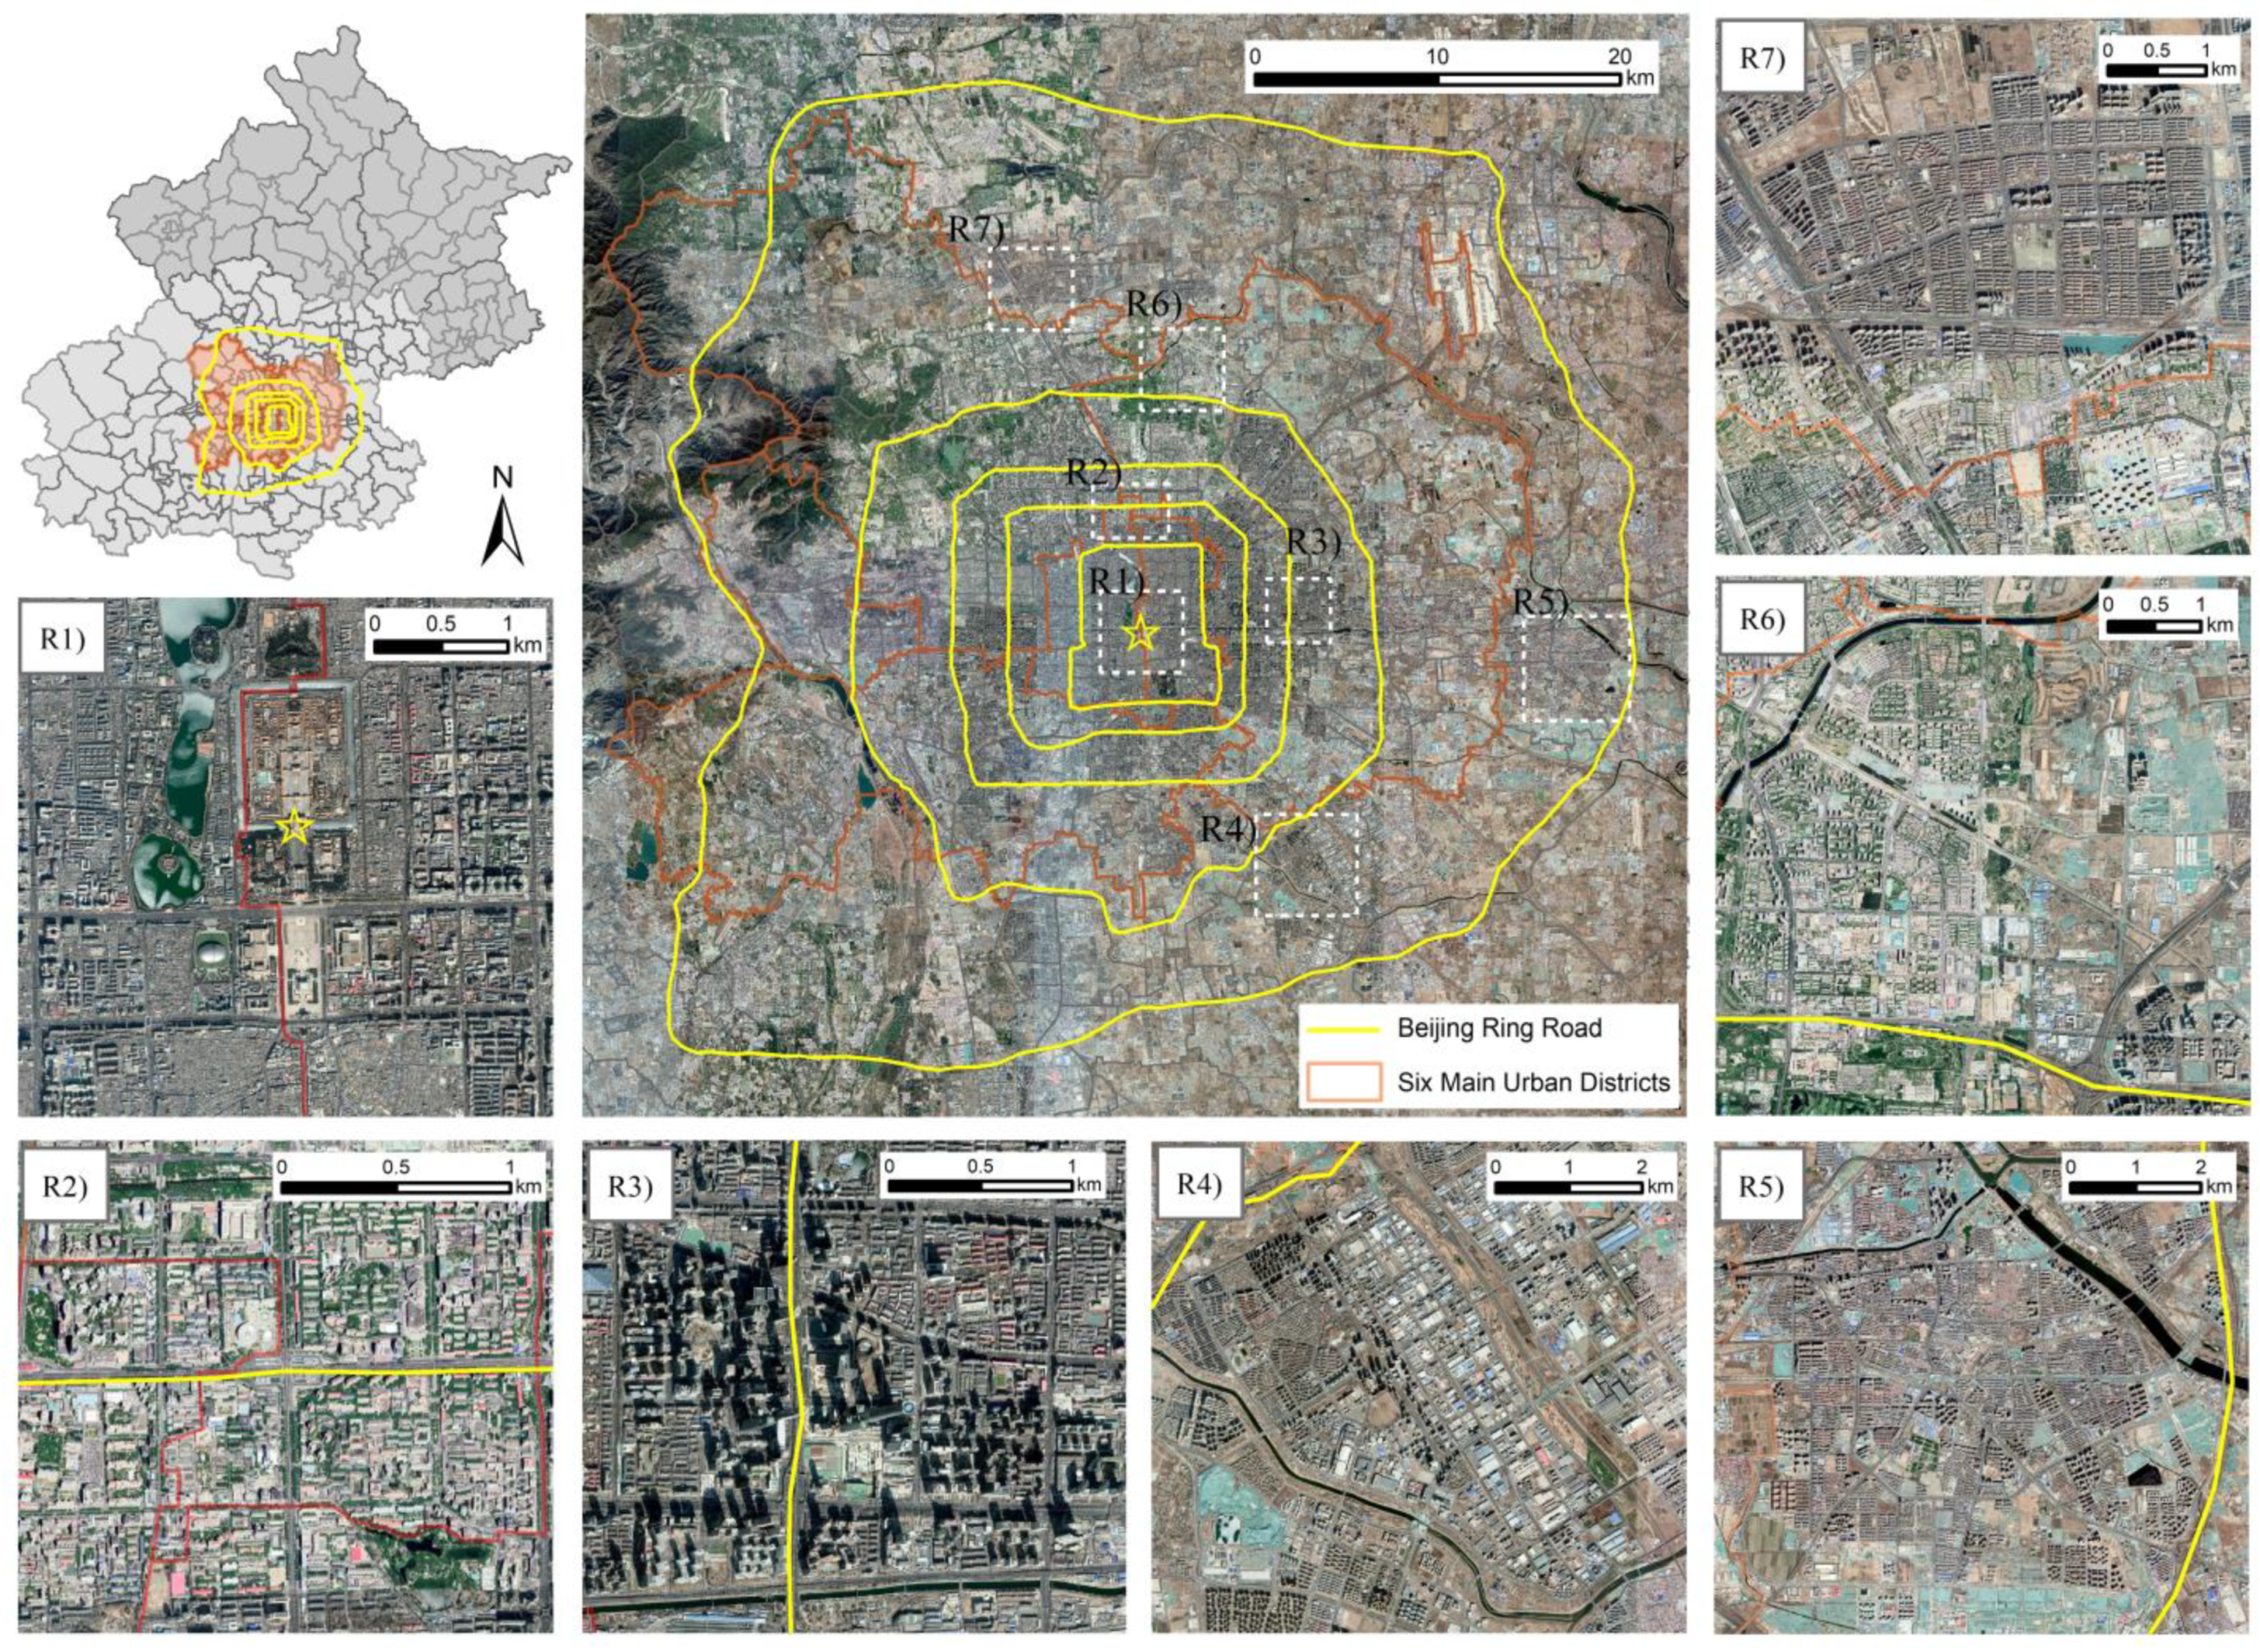
2.1. Research Area

The research area is Beijing, the capital city of China. This city has a total area of 16,410 km2 and a permanent population of more than 21 million. During the rapid expansion and development of urban areas, the issues of severe traffic congestion and environmental pollution highlight the importance of sustainable development. Among a series of urban governance policies, transportation electrification has become one of the strategies for environmental pollution control. Research indicates that transportation accounts for 25% of air pollution in the city [42]. Since 2014, the Beijing metropolitan area has largely promoted the usage of EVs, becoming the first city in China to implement transportation electrification. The current number of private EV cars in Beijing has reached about 230,000. The public charging network consisted of 3075 public charging stations in 2019 [43]. Therefore, this case study is expected to be a reference for the promotion of EVs in other cities, providing forward-looking suggestions for the impact of EVs on the development of urban space.
No common definition of urban/suburban/rural boundary has been formed due to different research contexts. From the perspective of the administrative map, Beijing is divided into 16 districts, and six urban areas make up the main urban area. Built and developed over 3000 years, many historical and cultural buildings are preserved within the second ring road of Beijing, namely the urban central areas. With the rapid development of urbanization, the spatial expansion of urban areas has been spreading outward from a single core marked by the ring roads. Most studies on Beijing’s urban spatial patterns use the ring roads as the primary framework as they correspond with the city’s centrifugal growth from the perspective of transport geography [44]. This study adopts the same approach for analyzing the impacts of EVs. The areas within the six ring roads is 2267 km2, accounting for 13.8% of the all administrative city areas. From the urban core center, namely Tian’anmen, to the sixth ring road, the maximum linear distance is about 35–40 km. There are 179 town-neighborhood units, also called ‘Jiedao’. This Jiedao unit is used as the basic geographic analysis unit in this study.
Figure 1 shows presentational research area overlay on satellite images, illustrating the urban forms of Beijing within the ring roads. From the second to sixth ring roads, representative regions marked by R1 to R7 are zoomed out to show the landcover details of urban space. The north and east of the city areas host the main vitality areas of the city (a high-density of population and employment). It can be seen from the satellite images that there are high-density buildings in the urban central areas (R1). Beyond the second ring road, this city has expanded significantly towards the six ring roads. High-density residential (R2) and commercial areas (R3) are formed along the third ring road. Notably, the area between the fifth and sixth ring roads is experiencing rapid development, showing uneven spatial distribution of urban land use, with a certain amount of unbuilt land. During the process of rapid urbanization, this region initially formed a spatial pattern of employment-driven housing (e.g., R4 and R7).

2.2. LBS Data

The LBS requests contain multi-dimensional information, temporal and spatial in particular, that has been widely used to mine the spatial and temporal distribution of the population in cities. The LBS data used in this study were derived from Baidu, the leading LBS provider and big data operator in China. The accumulative datasets over six months can reach more than 1 trillion, which is used to generate these population products by the XGBOOST machine learning algorithm [45]. The accuracy of these data mining results exceeds 90% (Urban population data product, from Baidu map big data. Available online: https://mp.weixin.qq.com/s?__biz=MzA4MzcxNjg5MQ==&mid=2651042375&idx=1&sn=c48cea76a6bcea57520d540dec1e44e2&chksm=84052c33b372a525be491f5cb52ec21c2f67898339b3a142e7fe4aa6017b2d53e525dfa0da0b&scene=21#wechat_redirect, accessed on 18 July 2018), compared with other datasets, such as communication signaling data. The data has been widely used in urban studies, and the validity of the data has been extensively verified [46,47]. Based on these basic population distribution datasets, we further proposed a data mining strategy and technical workflow to identify EV users. Three rules were designed to determine EV users and identify their dwelling/home location: (1) The EV candidate user had to have records of visiting public charging stations by using the LBS service. Indexed by this record, the EV users were distinguished from non-EV users—assuming that non-EV users would not have charging visits. (2) Referring to existing data products and previous studies [48,49], the place determined to be the home location depended on where the user stayed the longest during the interval from 10:00 p.m. to 6:00 a.m. (3) The home location had to be located within the Beijing City Region.
The data collection period was November 2019. Considering the data security and privacy protection regulation, anonymization, and down-scaling are key points for data preprocessing. Specifically, the original data were desensitized (privacy information removed and ID anonymized), and deduplicated by day. The output data product was resampled and stored in a 100 × 100 m grid (down-scaling), retaining the information of dwelling locations, the charging station location visited, and the number of people in the grid (the location was the latitude and longitude of the center point of the 100 m2 grid). In this study, these data were spatially joined with the Jiedao-level units for geographic spatial analysis. This processing flow means that the statistics were performed in down-sampling gridded units (one statistic value for a whole 100 m grid and Jiedao unit), so that no individual data or precise location was involved.
A total of 31,717 data records were collected, corresponding to the records of 32,068 visits of EV users to charging stations. This consisted of 21,351 records on weekdays and 10,717 records on weekends (4 weeks of data were collected, with one extra Friday and Saturday). It was estimated that an average of 1016 records of EV users were generated per day on weekdays. The average number of visits on weekends was higher than that on working days. The overall average total for weekends was higher than the average total for weekdays—1017 records, as shown in Table 1. The distribution of the dwellings of EV users was statistically analyzed in the regions divided by the ring roads, as shown in Table 2.

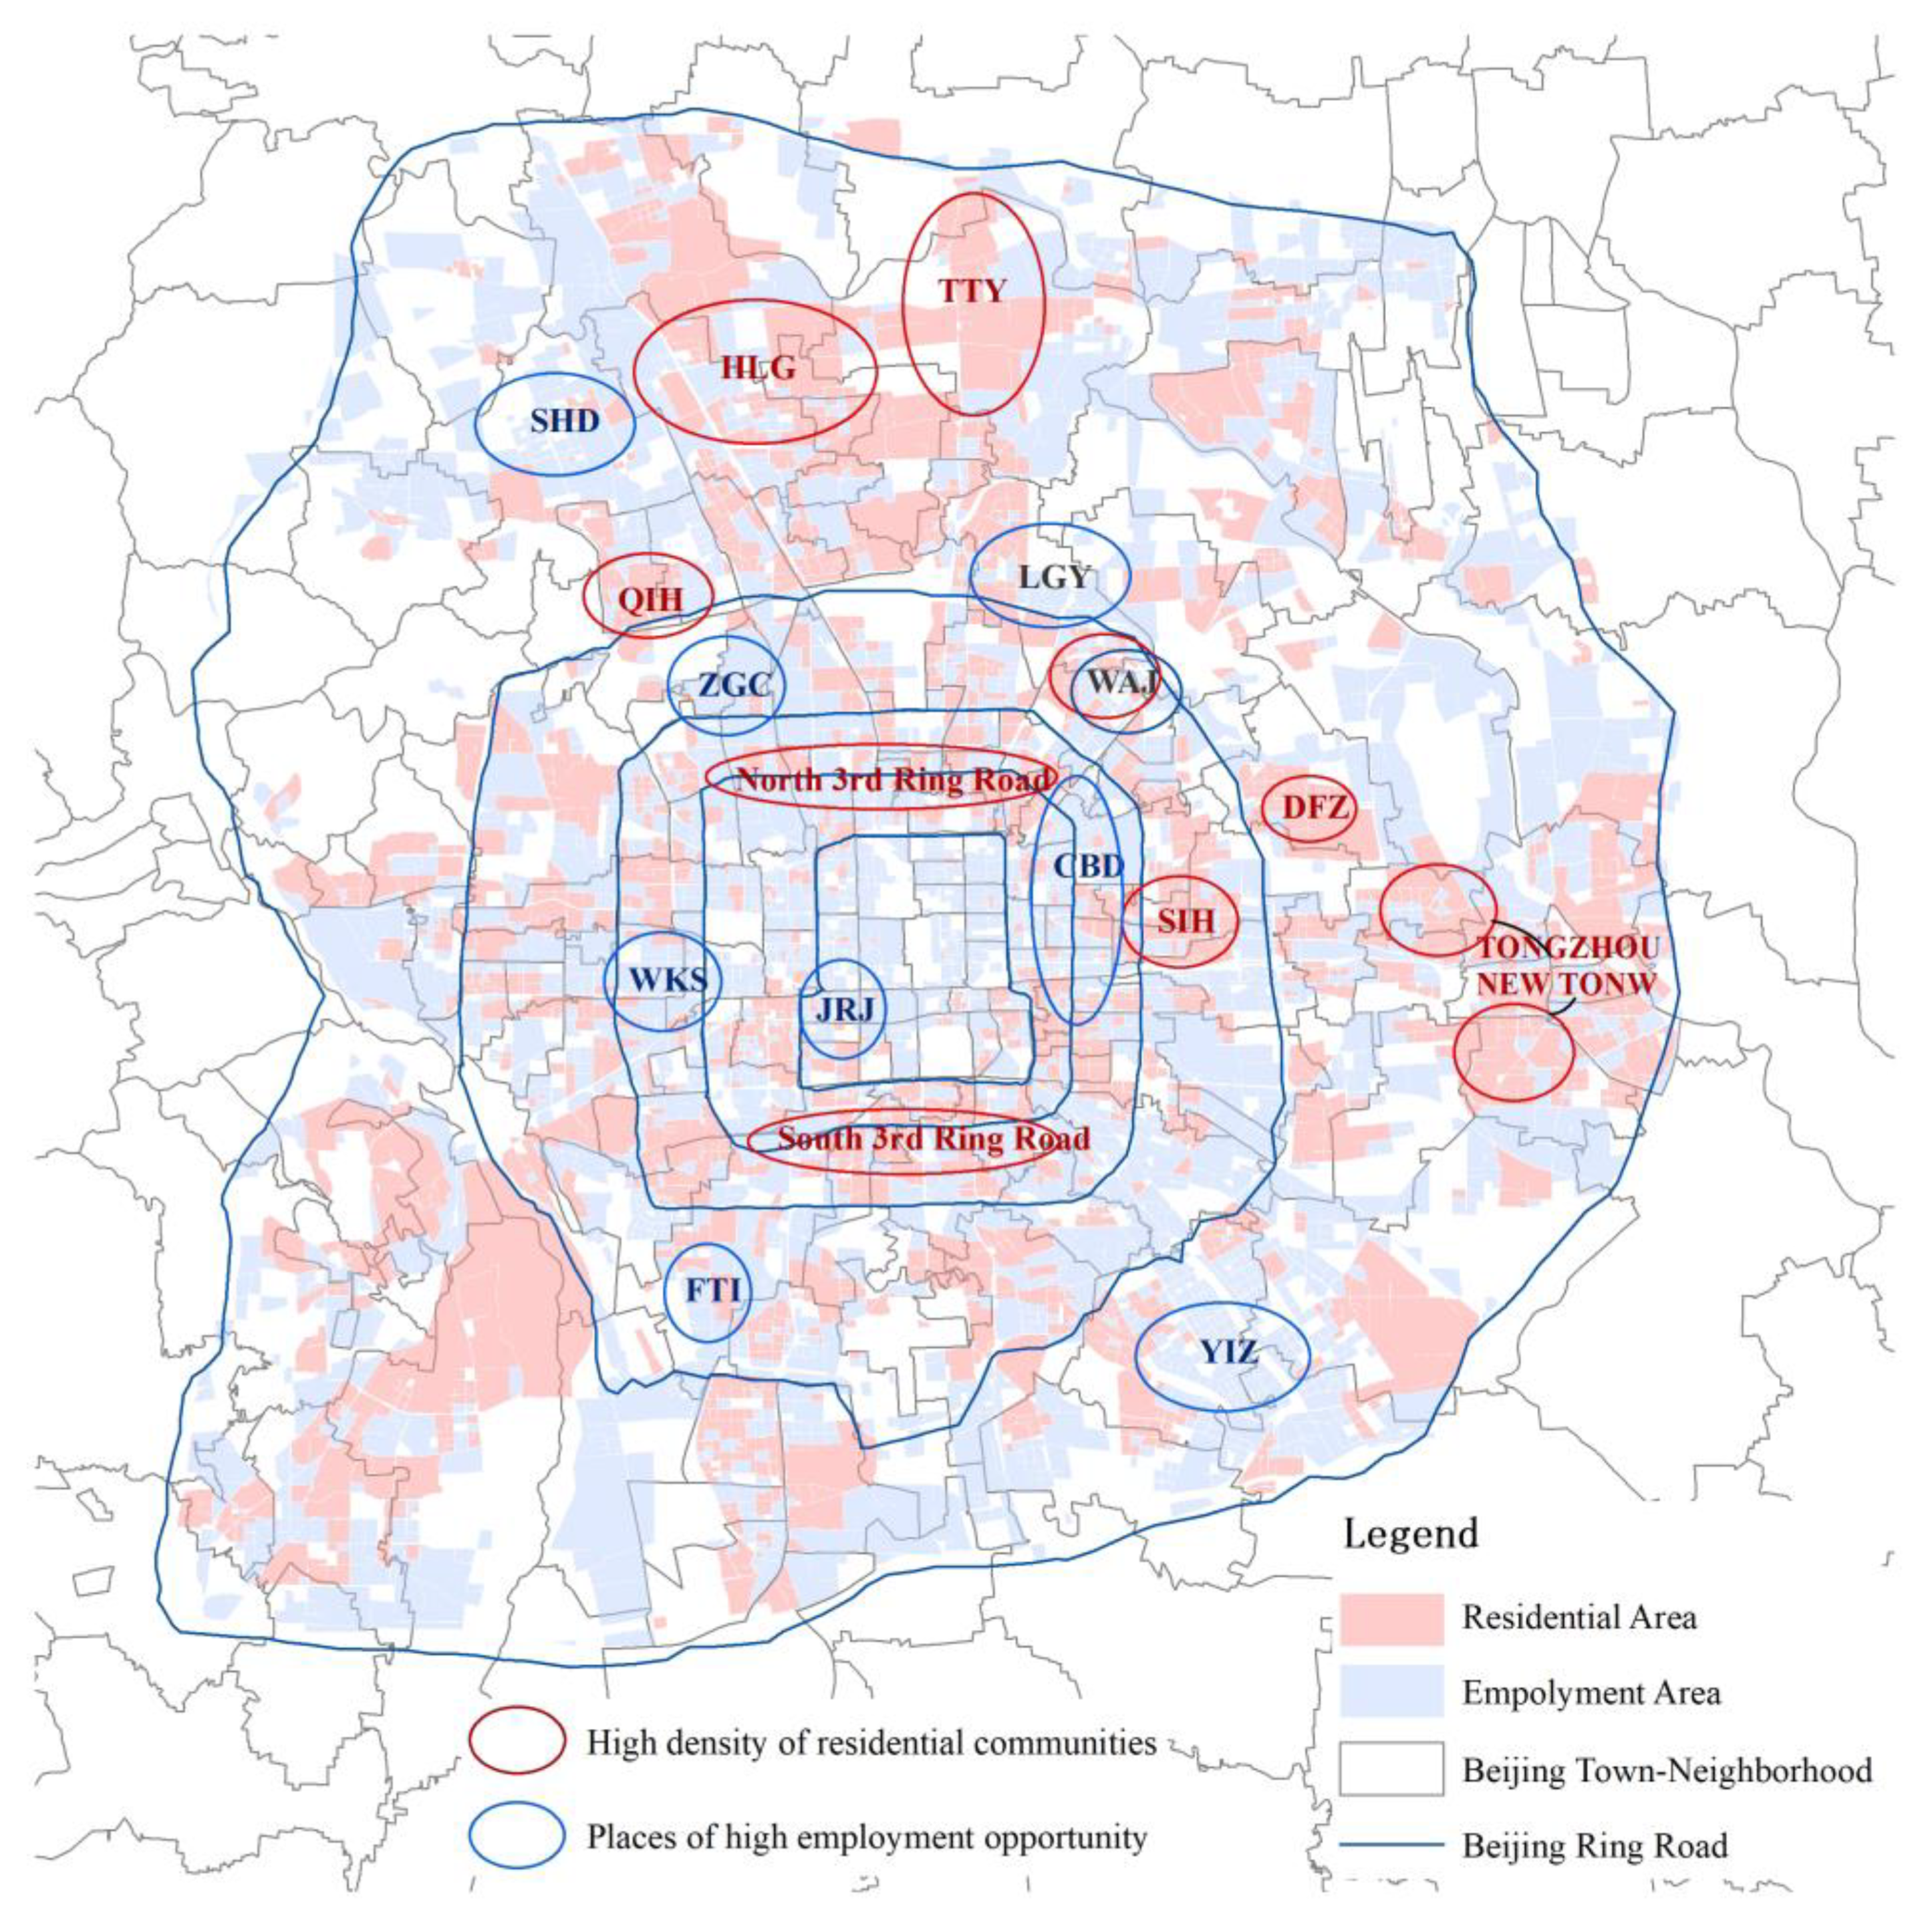
2.3. Land Use Data of Residential Areas and Employment

This paper uses land use maps of residential areas and employment as a base map to understand the patterns of ‘dwelling–travelling for charging’ activities of EV users. Notice that the land use map shows the spatial distribution characteristics, but it does not show the spatial heterogeneity of the population or employment density. As such, we marked the representative regions with high density residential populations and employment, combined with the report from the wireless signaling big data, as shown by the descriptive statistical data in Table 2 and the map in Figure 2. In general, 78% of the residents and 79% of the jobs were concentrated within the sixth ring road in Beijing. The land use map was provided by Baidu Maps, and the big data report was provided by the Beijing Transport Institute, both of which were updated in 2019.
Table 2 shows that the residential population within the fifth ring road accounts for 42% of the total (the area within the fifth ring road is about 667 km2, and the residential population density reaches 13,550 people per km2). Combining Figure 1 and Figure 2, the population is mainly distributed in the areas along the North (Figure 1 R2) and South Third Ring Road (N3RR and S3RR), Zhongguancun (ZGC), Sihui (SIH), and Wangjing (WAJ); correspondingly, the many employment locations within the Fifth Ring Road account for 49% of the total in the city, including the Central Business District (CBD, Figure 1 R3), ZGC, Financial Street (JRJ), WAJ, and Fengtai Science Park (FTP). Between the fifth and the sixth ring roads, some of the urban villages have developed rapidly with urbanization. The residential areas cluster sparsely, carrying 36% of the residential population (the area is about 1600 km2, and the population density is about 4850 people per km2, which is lower than the level within the fifth ring road). Large high-density residential communities have appeared, such as Huilongguan (HLG, Figure 1 R7), Tiantongyuan (TTY, Figure 1 R6), Qinghe (QIH), Dingfuzhuang (DFZ), and Tongzhou New Town (TZNT, Figure 1 R5). The employment facilities between the fifth and sixth ring roads account for 30% of the jobs in the city, mainly in Shangdi (SHD), Laiguangying (LGY), and Yizhuang (YZIP, Figure 1 R4) in emerging high-tech industrial parks. Based on the built-up areas and population density, this study regards the region within the fifth ring road as the urban area, the region between the fifth to sixth ring roads as the suburbs [4], and the region outside the sixth ring road as the rural area.

3. Method

Based on the EV group information obtained from the LBS data, we focused on analyzing the spatial clustering features of the dwelling places of EV users using geographic dimensions, and further investigated their “Dwelling–Travelling for Charging” (DTFC) relationship. The D represents the EV owners’ home location, and the TC represents the location of the public charging station that the EV owner visits. The DTFC flow is defined between the EV users’ home location and the public charging location, which represents the spatial preferences of their dwelling and charging station. In terms of the spatial-dimension, the distance and the intensity of interactions between urban space units were considered, and the influence of working days and non-working days was considered in terms of the time-dimension. The study used the ‘Jiedao’ unit as the geographic analysis unit, employed Moran’s I to measure the spatial autocorrelation and distribution characteristics of EV users’ dwelling, and used a single exponential function to quantify the distance characteristics of DTFC. We mapped the interaction between urban spaces based on the ‘Jiedao’ units driven by the DTFC flow of EV users.

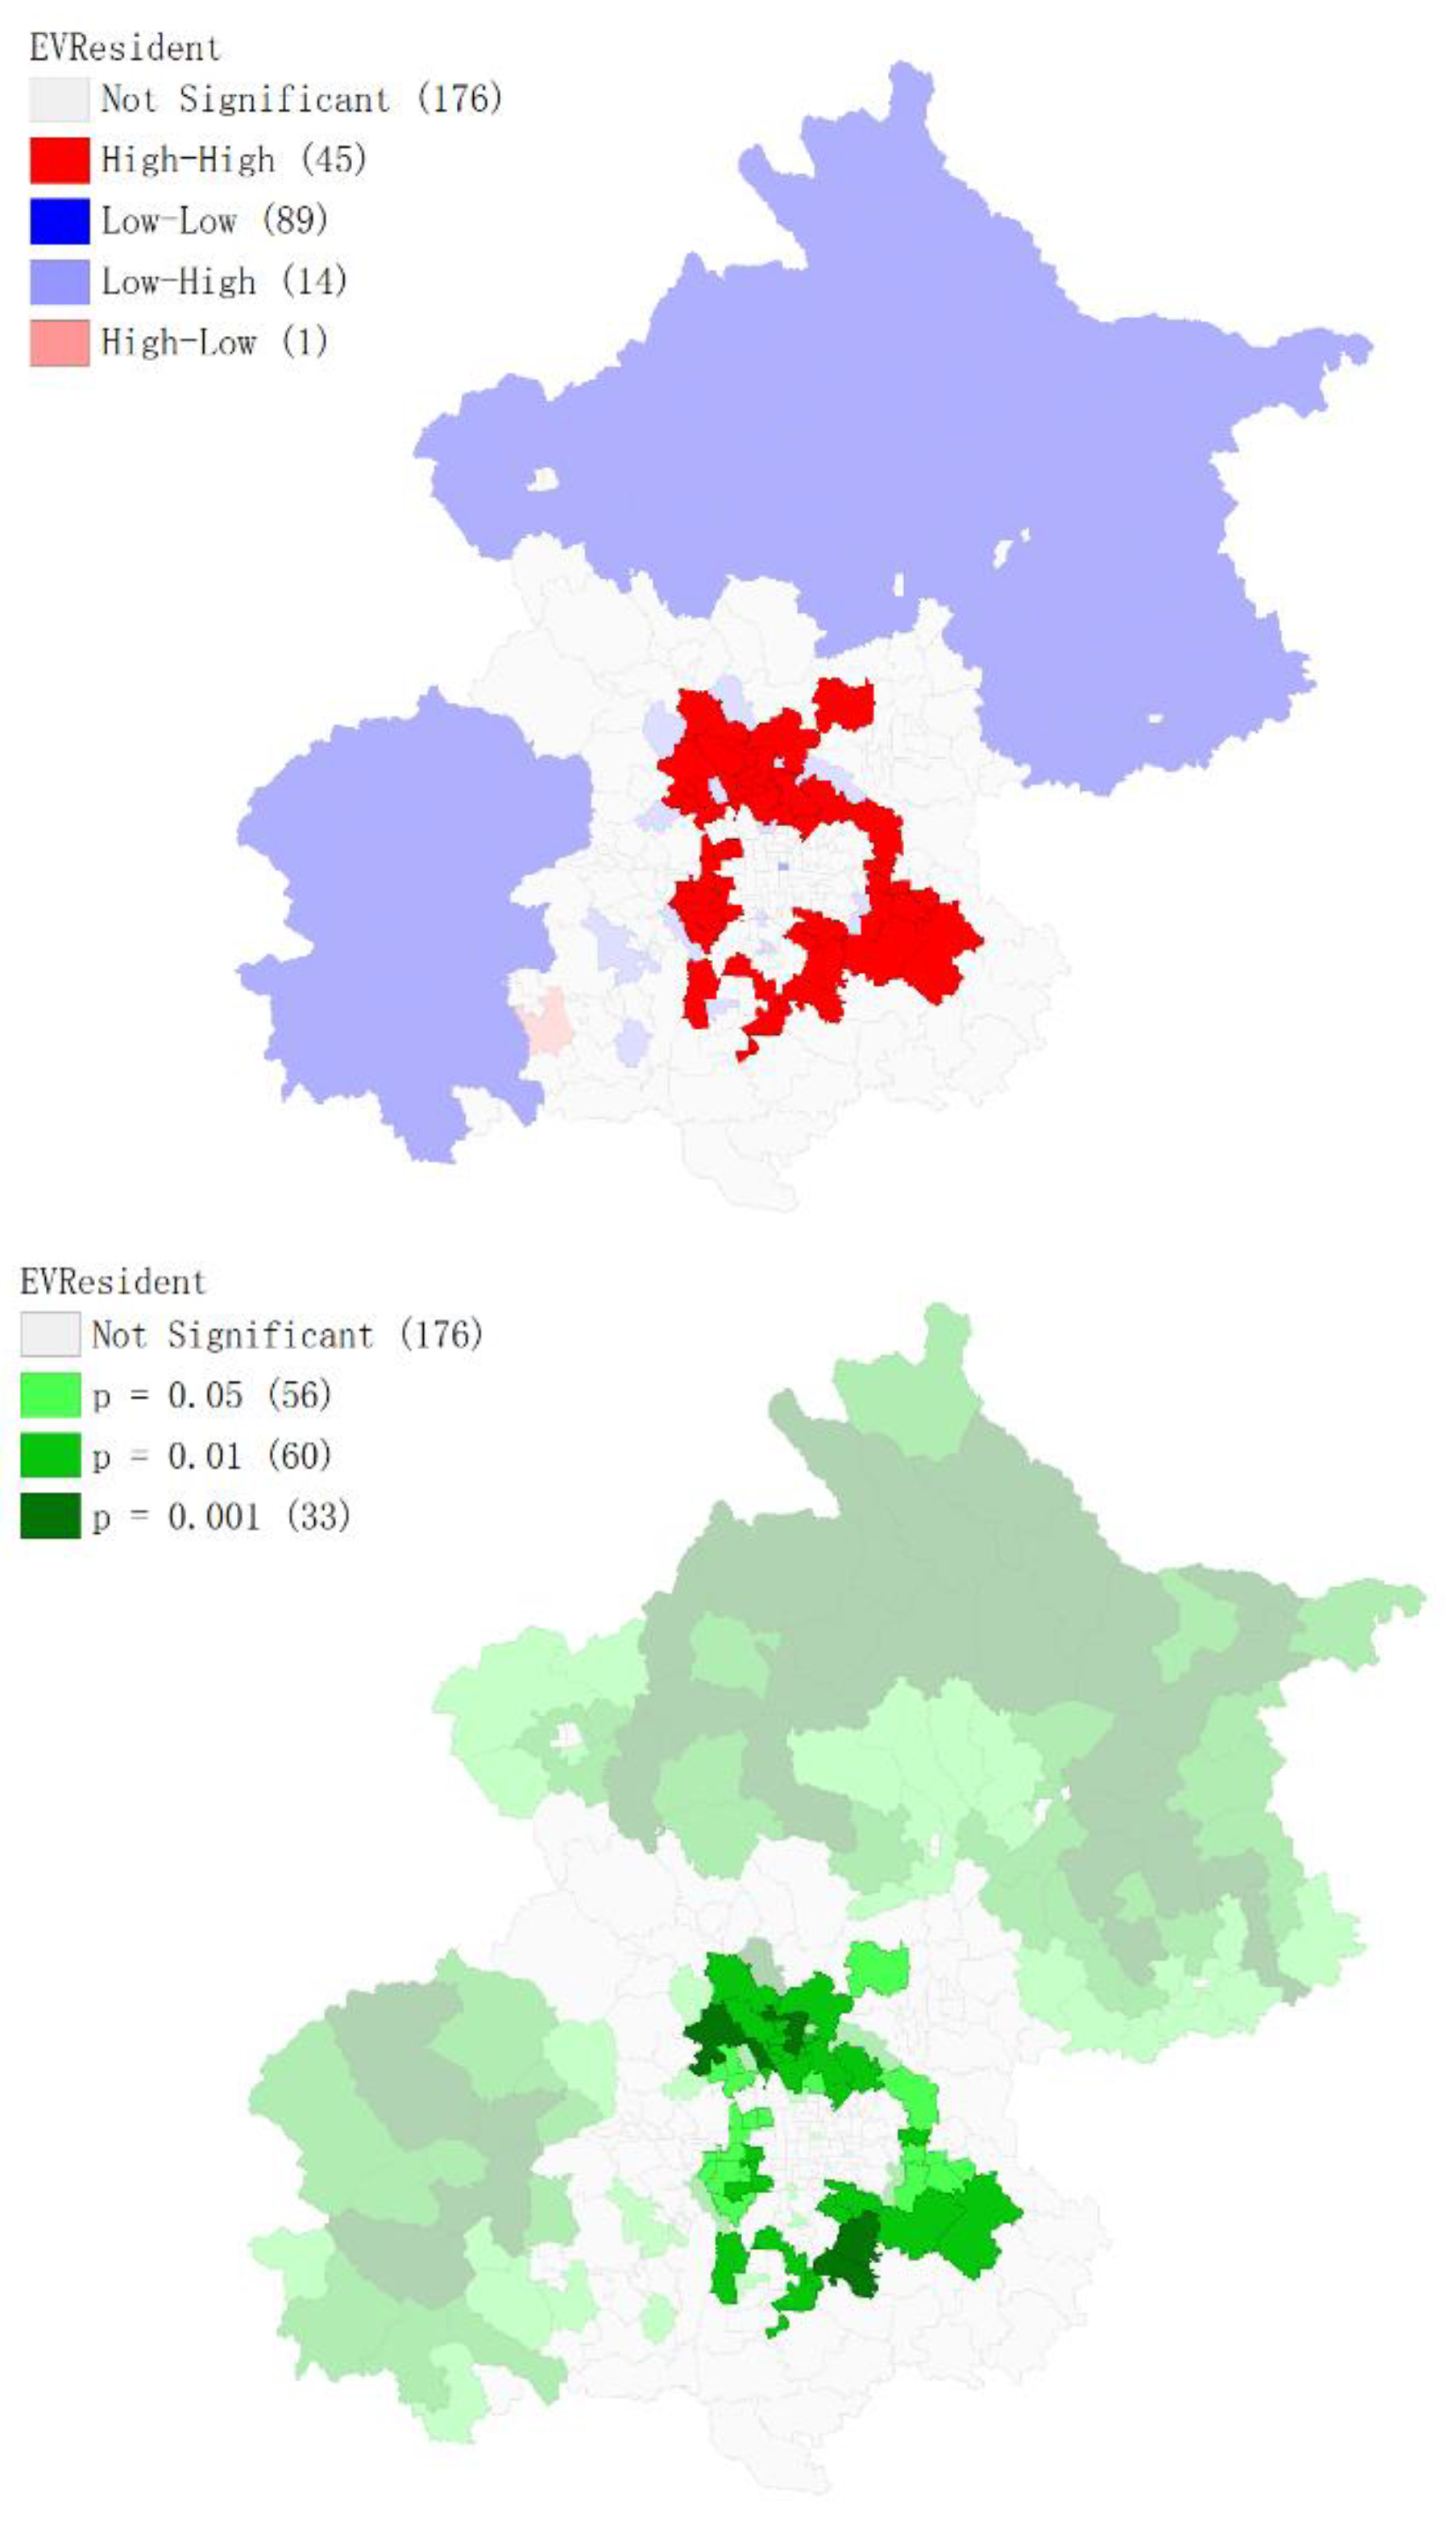
3.1. Spatial Autocorrelation

Moran’s I is the most widely used indicator to measure the existence of spatial autocorrelation, or spatial dependencies. According to the first law of geography, “Everything is related to everything else, but near things are more related than distant things” [50]. Spatial autocorrelation is an important research field of spatial statistics, and it is also one of the core theoretical methods to study the distributional correlation between spatial geographic features. Moran’s I was first proposed by Moran in 1950, and was later applied and developed by many scholars. In 1995, Anselin proposed the Local Indicator of Spatial Association (LISA) [51]. The value of Moran’s I range is [−1, 1]. The formula is
I = ( i = 1 n j = 1 n w i j ( X i X ¯ ) ( X j X ¯ ) i = 1 n j = 1 n w i j ) ( i = 1 n ( X i X ¯ ) 2 n )
LISA provides a method to measure the spatial association of each regional unit in a larger research area, which is a local value of the global Moran’s I statistic. For region i, the value of the Local Moran’s I at location i is computed using the formula
I i = n j = 1 n w i j j = 1 n w i j ( X i X ¯ ) ( X j X ¯ ) i = 1 n ( X i X ¯ ) 2
where X ¯   is the mean of the variable X—it is the number of EV residents in a geographic unit; X i is the variable value at a particular location I; X j is the variable value at another location j; w i j is a weight indexing location of i relative to j, representing the geo-spatial relationship between region i and j, using the Queen Neighbor weight matrix. n is the number of observations (points or areal units). As explained in global Moran’s I, LISA is more effective in detecting the spatial clusters or hot spots locally (when variable values in a local area are significantly higher or lower than the average). The results can be explained as follows:
(1)
Large positive values (close to 1) indicate that there is strong (positive) autocorrelation (i.e., similar values tend to cluster together);
(2)
Large negative values (close to −1) indicate that there is strong negative autocorrelation (i.e., areas with similar values of a variable tend to repel each other; dispersion);
(3)
Values around 0 indicate that there is no spatial autocorrelation (random pattern).
In this paper, we analyzed the distribution of EV users’ residential locations based on the Jiedao unit, and further employed LISA to highlight the spatial autocorrelation, where the EV users’ dwellings cluster significantly. The calculation and mapping process are conducted with GeoDa software, version 1.18.

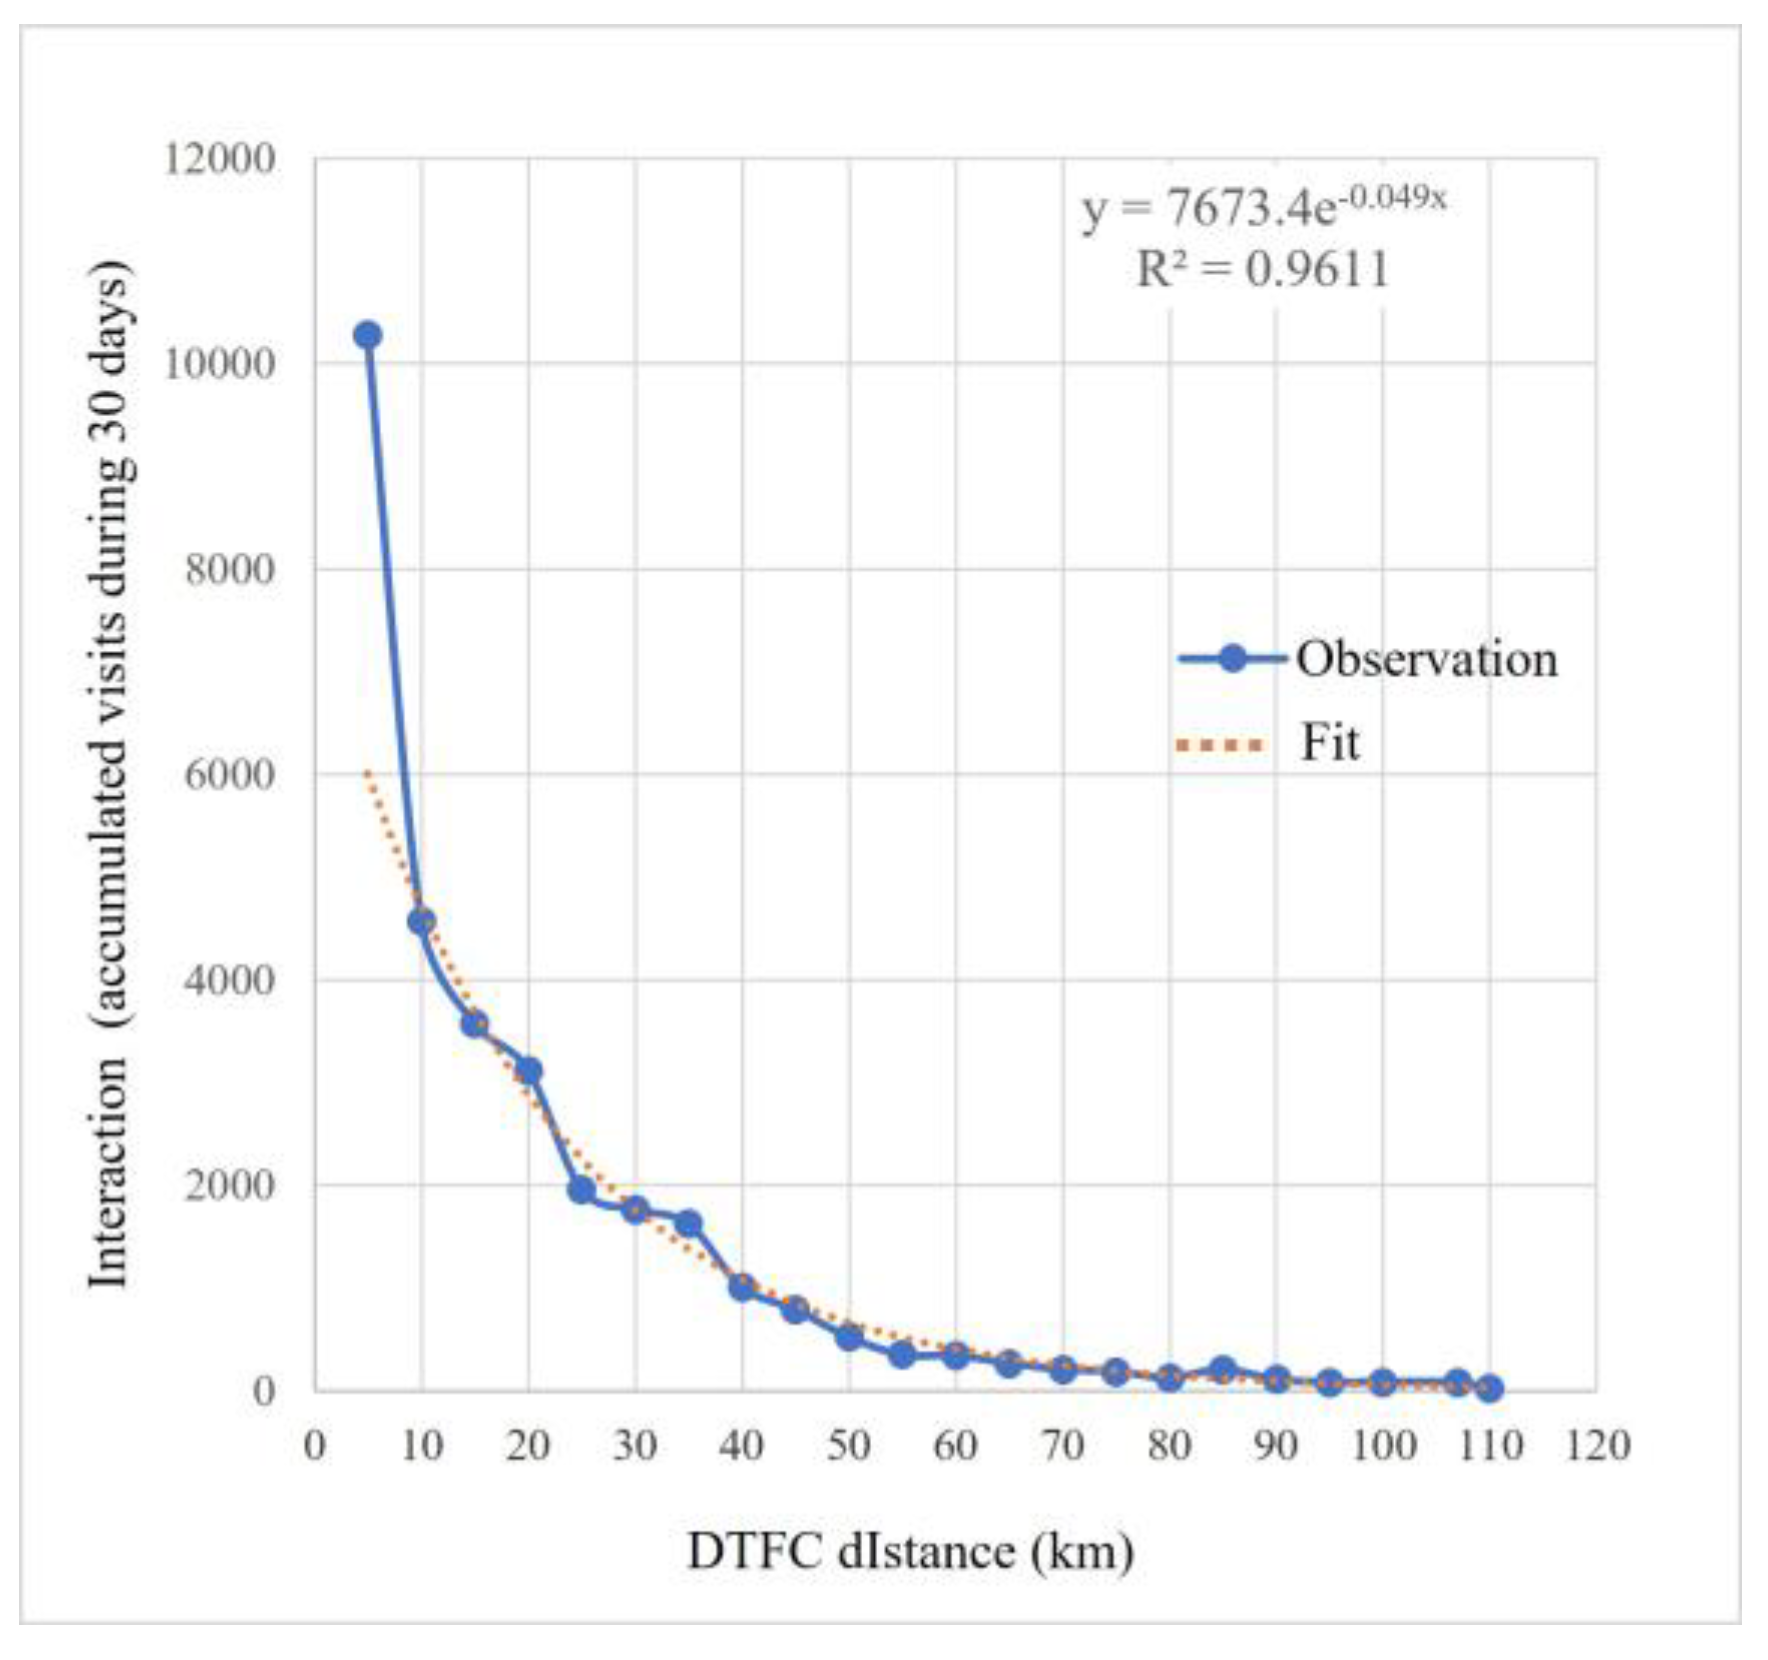
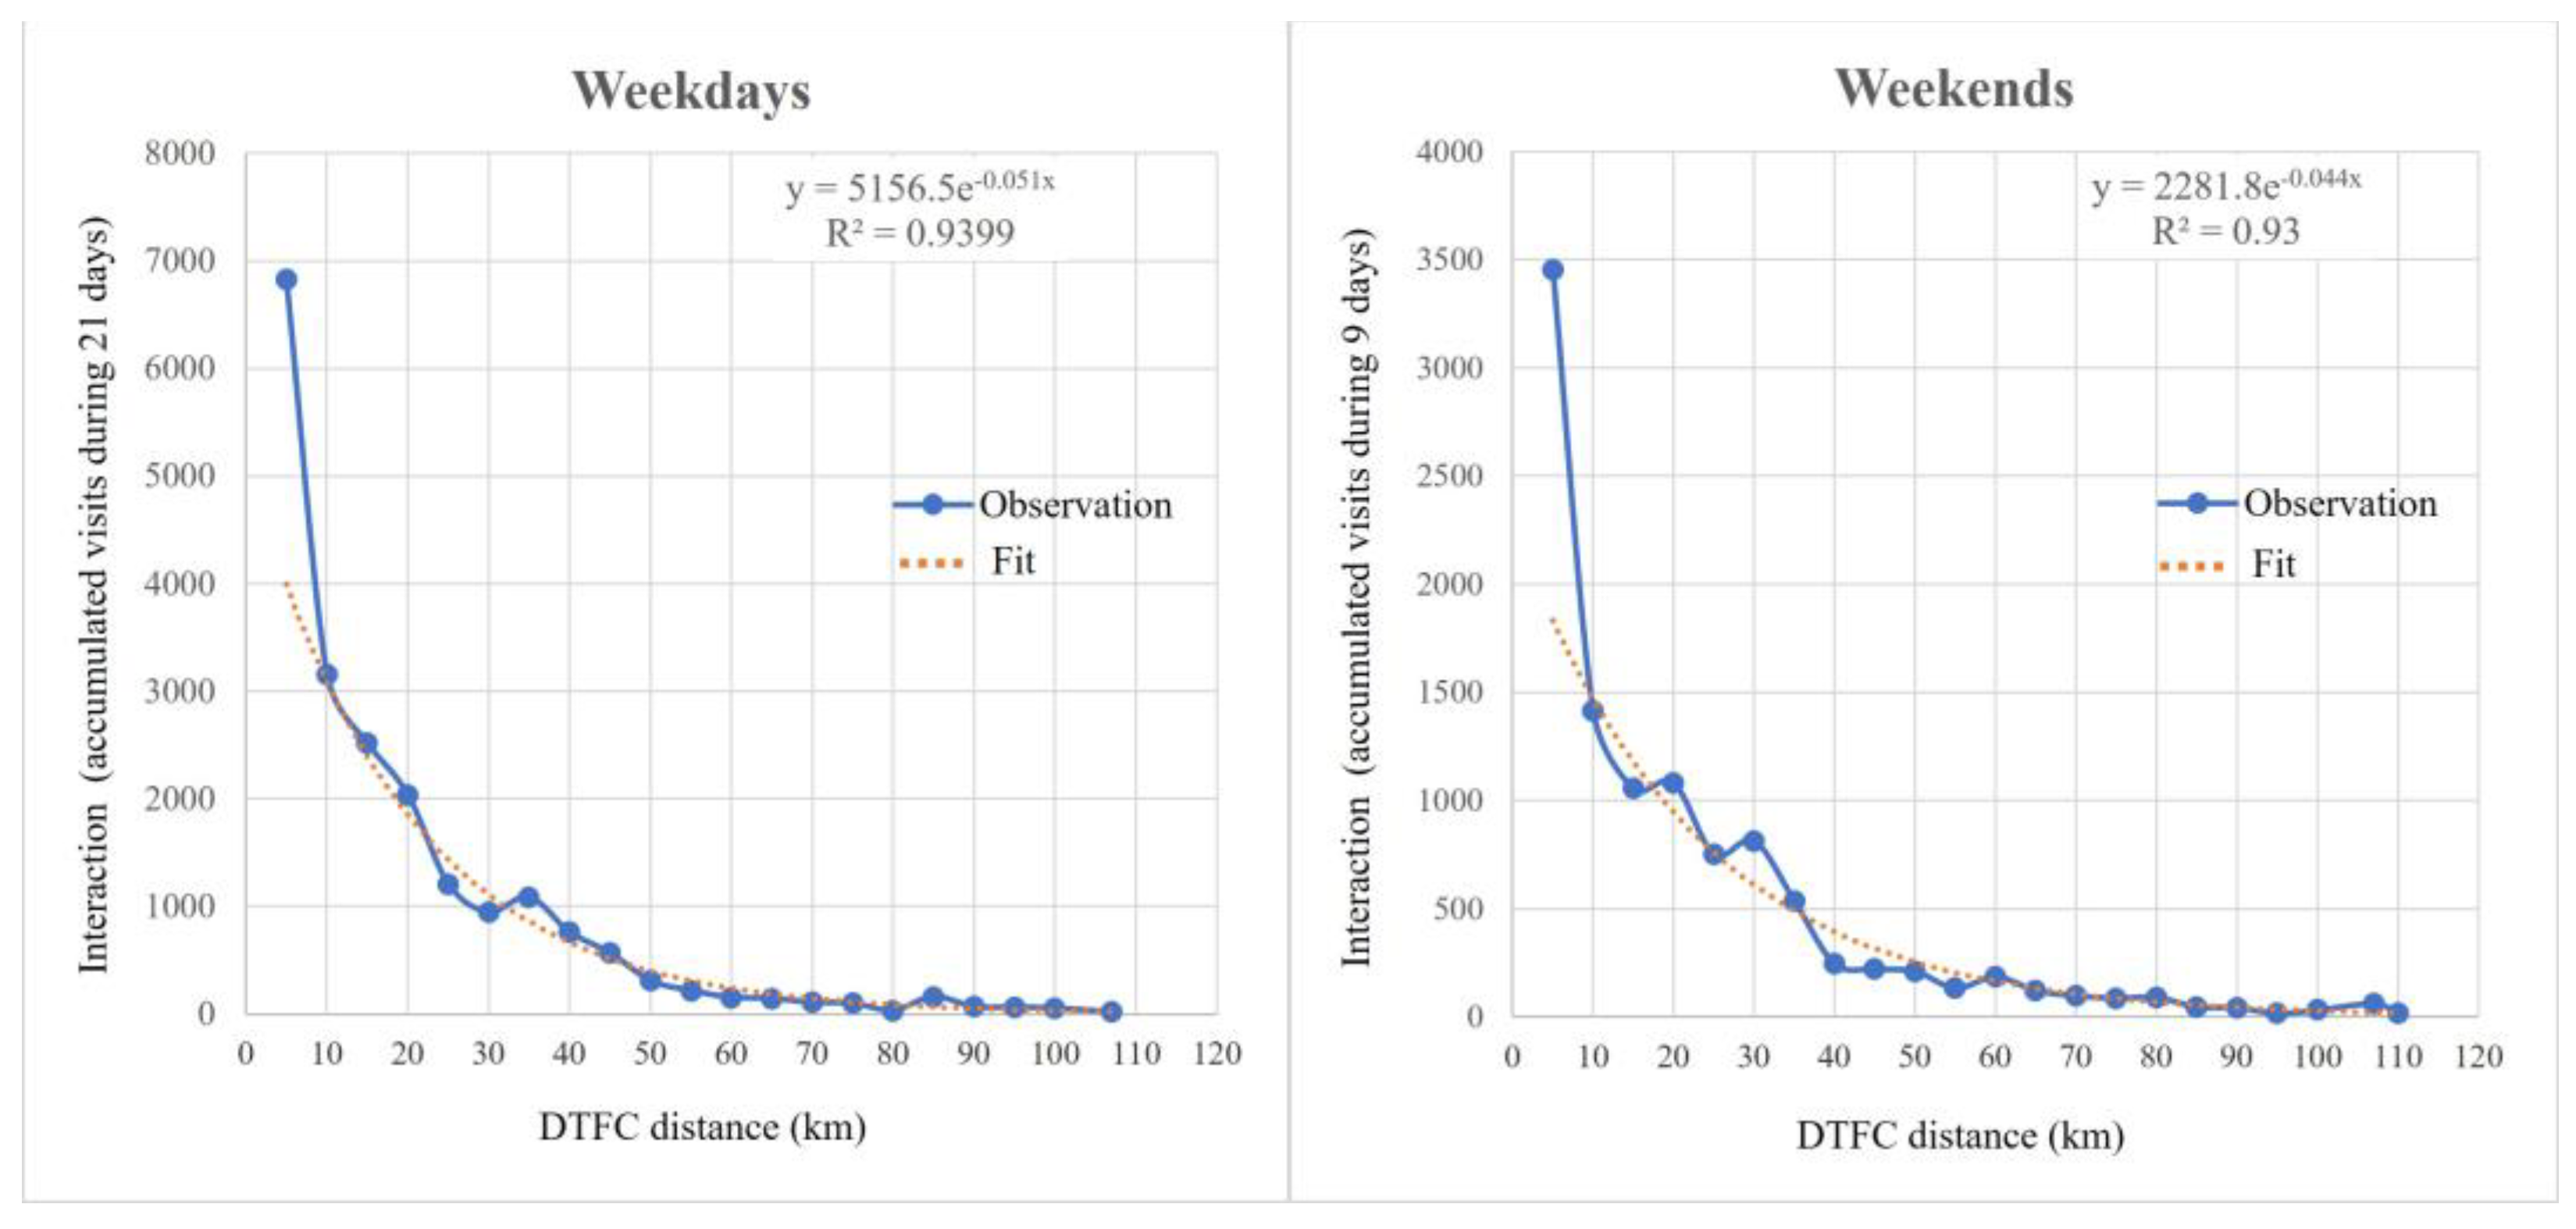
3.2. Distance Decay Modeling

The distance decay states that the spatial interaction between two spaces declines as the distance between them increase. In this study, we use the Euclidean distance between the EV users’ homes and their choice of charging location, namely the distance of DTFC. It represents the EV users’ preferences for living and charging, which can be interpreted as whether or not EV users prefer to choose areas close to their residence when they choose public charging stations. The formula of Single Exponential Function used here is
y = A 1 × e x p ( x t 1 ) + y 0
where y represents the spatial interaction intensity (that is, the number of the DTFC flow of EV users), x is the Euclidean distance between the residential location (point D) and the point of the visited charging station, A1 is the amplitude, y 0 is the positive coefficient, and 1/t1 is the attenuation coefficient. The higher the attenuation coefficient, the greater the influence of distance on the interaction strength. The abscissa represents the distance, and the ordinate represents the number of interactions. Considering the differences in travel activities over time, we used the data on weekdays and weekends for analysis. The modeling process and curve fitting graph were completed in ArcGIS Desktop 10.3 and Microsoft Excel in Office 365.

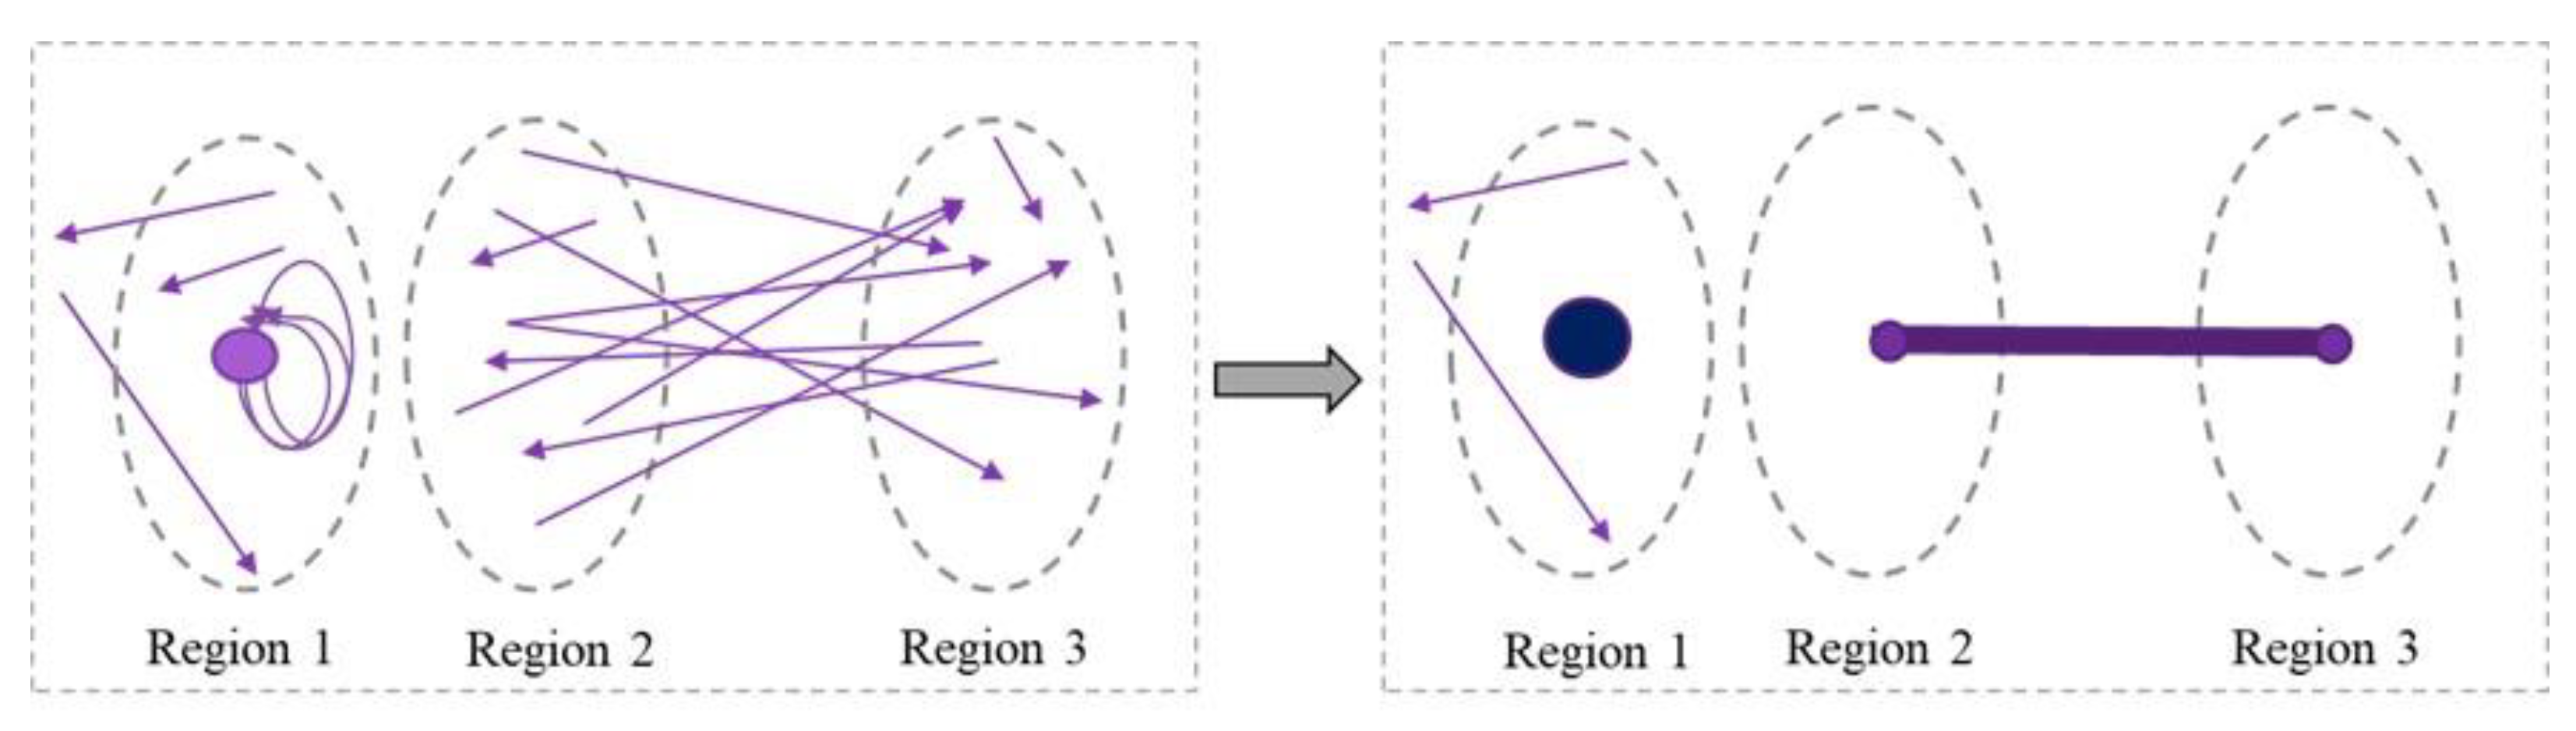
3.3. Spatial Aggregation

Urban space (using Jiedao units) interacts and connects within the city in the form of energy, human mobility, and information. This geographic process is called spatial interaction [39]. We used the spatial flow between Jiedao units driven by the user’s DTFC to characterize the interactive features of urban space. It is expected that the common geographic locations or mobility features will be discovered and spatial regions with high-density interactions will be identified. In other words, we aimed to find the places where EV owners are distributed with a high density and their charging preferences. The original DTFC flow contains more than 30,000 flow records that are highly spatially superimposed so it fails to form a directly visualization of the high density of spatial interaction. Accordingly, this study used a density-based smooth approach to highlight the spatial interactions. Specifically, we aggregated the spatial DTFC flows with the same residential unit (located in Jiedao i) and the same visited charging location (located in Jiedao j), taking the Jiedao as the basic unit of spatial aggregation. The DTFC flow direction was not considered. According to the density of spatial interaction, the DTFC flow pattern with high interaction was identified. In particular, there were zero distances of DTFC flow, which means that the EV owners lived and charged at the same Jiedao unit. These spatial self-interaction samples were represented by a point file that classified different sizes. A conceptual diagram of spatial aggregation is shown in Figure 3. This spatial aggregation process for the DTFC flow was completed in ArcGIS Desktop 10.3. Finally, combined with the land use of residential and employment areas in Figure 2, we summarized and categorized the spatial interaction features, and identified the common findings for planning future urban sustainability.

4. Results and Discussion

4.1. Distribution of EV Residential Areas

Table 2 shows that the ratio of the EV owners’ residential distribution is statistically close to the proportion of the total residents of Beijing, while significant differences exist between the fifth and the sixth ring roads, and outside the sixth ring road. This indicates that over 56% of the EV users dwell outside the fifth ring road, namely beyond the main urban areas. Forty percent of EV users are distributed between the fifth and sixth ring roads, which is a suburban area. Only 4% of EV owners are living in the urban core center—within the second ring road. When interpreted in combination with Figure 4, it can be seen that the proportion of EV owners’ housing gradually decreases towards the inner-city center. The distribution map of public charging station deployment is also shown for comparison. Notice that the charging network has basically covered all administrative areas. Most of the charging infrastructure is located within the sixth ring road, particularly in the business centers with a large amount of employment facilities, including SHD, WAJ, LGY, FTI, and YIZ.
Confirmed by the results of the LISA cluster map shown in Figure 5, there is significant spatial autocorrelation distributed in the suburban areas, namely the high–high region, between the fifth and sixth ring roads. Combined with Table 1, these areas include the large residential communities and the high-tech industrial parks. Specifically, the dwellings of EV owners are significantly clustered close to the periphery of the main urban areas. Being consistent with the general characteristics of urban areas, the clustering is distributed in the northern and eastern parts of the city areas, which carry the majority of urban vitality (as mentioned in Section 2.1). The inconsistent features show that the clustering of dwellings of EV groups are distributed in the southern and western part of the city. They are all beyond the urban center areas and refers to the newly developed high-tech industrial parks. The southern clustering corresponds to the YIZ. The western clustering corresponds to FTI, a recently developed industrial park. These residential cluster were developed due to the large-scale employment in those areas. These clustering results confirm certain international research results about the distribution of EV householders [10,11]. In general, the residential areas of EV owners in Beijing are mainly concentrated within the sixth ring road. The sub-urban areas show higher clustering features than urban center areas. Fewer EV owners live in rural areas, where there is a low–low clustering feature.

4.2. Spatial Interaction Characteristics

In this study, we used the DTFC distance of EV owners to represent their preferences of charging location when travelling or planning a trip for recharging. The results in Figure 6 show that the single exponential function fitting worked well and the value of R2 was 0.96. Thus, the interaction between spaces driven by DTFC activity decays with distance. In other words, most EV owners tend to consider the travel distance to their home when choosing a public charging station. We also considered time influences and conducted modeling on weekdays and weekends. On weekdays, EV owners usually drive different routes than that during leisure time due to different travel purposes. However, the distance decay model indicated that this travel activity shift over time do not affect people’s preferences of charging stations choice. Figure 7 shows no significant influence on the results of EV owners’ preference for charging locations near their home. The attenuation coefficient of weekdays was slightly higher compared to weekends, indicating that the spatial interaction of working days was more affected by, or sensitive to, distance.
This finding also evaluates the spatial characteristics of the public charging preferences of EV owners with Beijing’s current comprehensive charging station networks. Comparing with some results from existing simulation or models [20,21], our result highlights the geo-location in urban context that EV users choose public charging stations not far from their home. It confirms that EV owners would consider the travel distance (mainly the short-distance trips [18,19]) from home when travelling. In this research, the statistical results show that about 88% of EV owners’ DTFC distances are less than 40 km (46% within 10 km, 67% within 20 km, and 80% within 30 km).

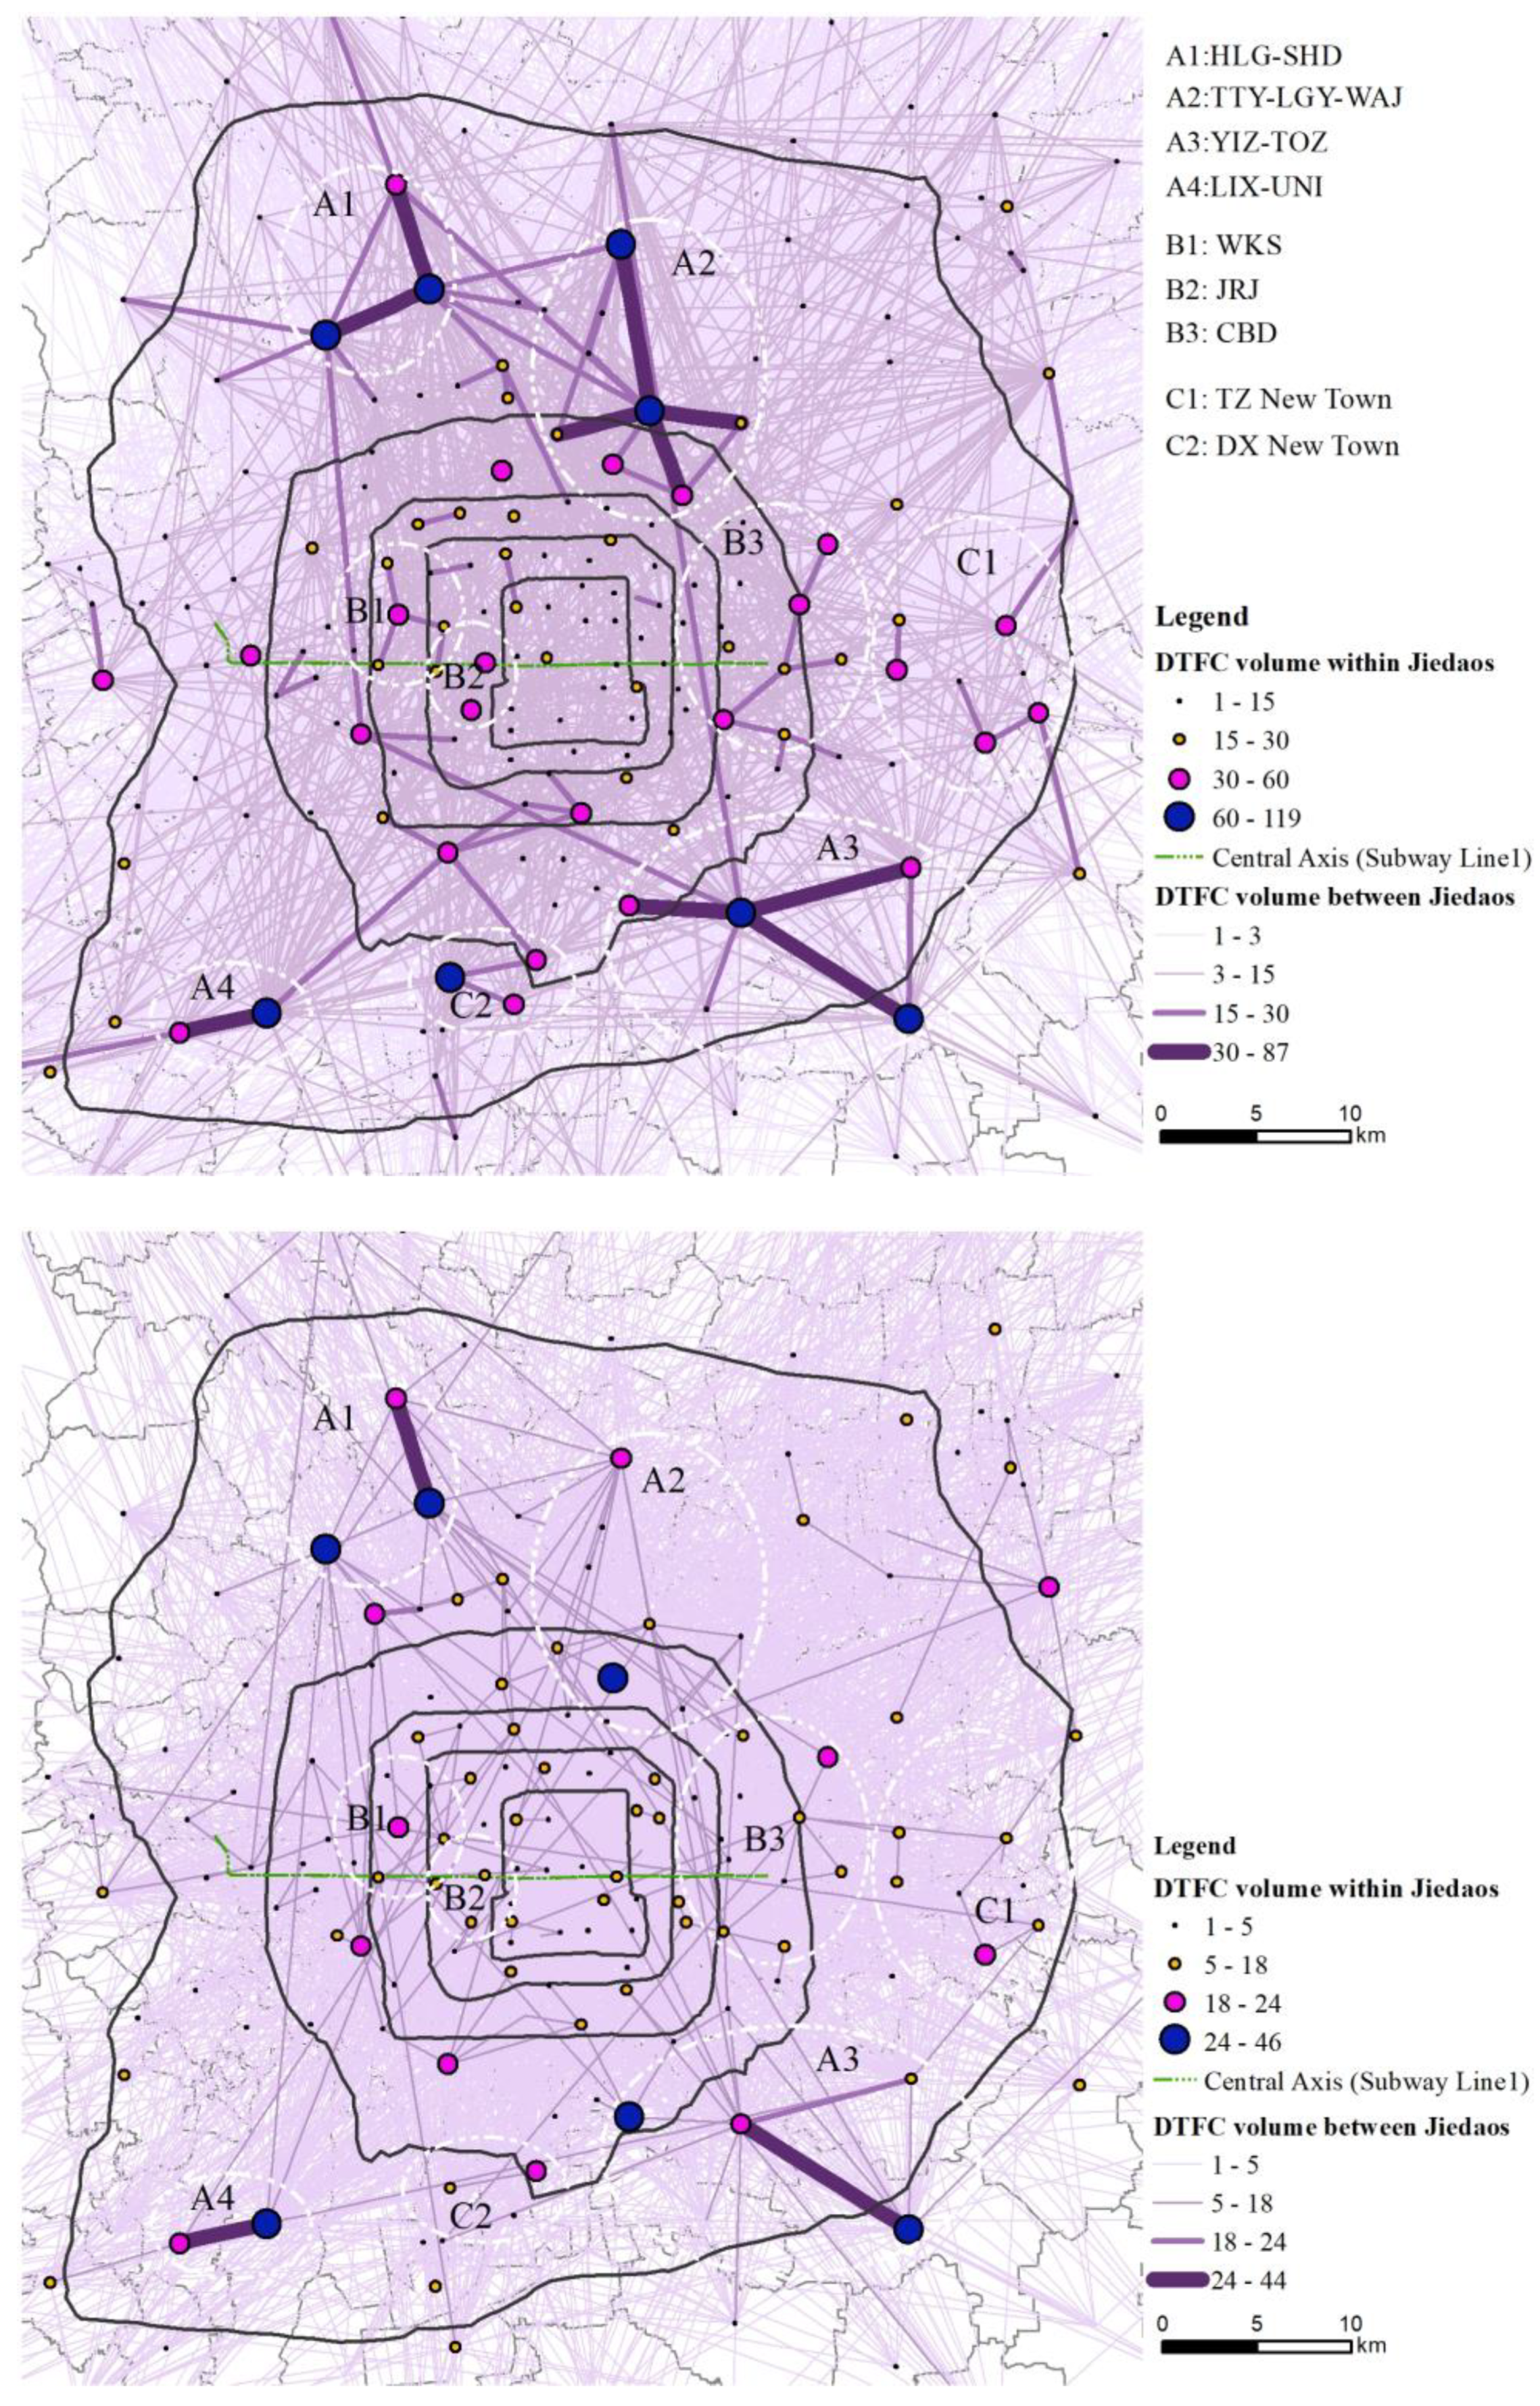
4.3. Visualization of DTFC Flow Patterns

We mapped the DTFC-driven spatial interaction features on weekdays and weekends, as shown in Figure 8. The interaction features between different spaces were classified according to the density of DTFC flow. The high-density flow represents strong interactions between places considered common. On weekdays, three categories of strong spatial interaction features were identified and are represented by A, B, and C, and their features can be summarized as follows:
(1) Category A: A1–A4 are the most high-density regions and are in suburban areas. They consist of strong interactions between large residential communities and high employment opportunity areas. These regions are located between the fifth and sixth ring roads. The community-driven mobility on weekdays that creates a strong connection pattern is significantly weakened on weekends. In Figure 1 and Figure 2, we marked specific region names. In the northern area, A1 and A2 refer to the high-tech industrial parks. In the southern area, A3 refers to economic and technological development zones, and A4 refers to the university town, which is developing rapidly. The findings of the housing clustering of EV users corresponds to the areas surrounded by a high amount of employment facilities. It is reported that the average daily travel distance and travel time for household EV drivers in Beijing was 40.0 km and 1.5 h, respectively [15]. This pattern may indicate that the households of EV drivers consider their commute when they choose their dwelling places.
(2) Category B: B1–B3 are mainly self-interaction point in the main urban area of the city, with a certain interaction with surrounding employment regions. They are located within the fifth ring road in large employment areas, including JRJ and WKS around the western second and third ring roads, and the CBD area from the eastern fourth and fifth ring roads. The distribution of this category shows a clear trend around the main road network, particularly close to the central axis of the city.
(3) Category C: C1–C2 are residential areas of newly developed areas (namely new towns) in suburban areas, without large employment regions. C1 refers to the large residential communities in TZNT, which is being rapidly developed as a suburban center of Beijing, with policy support. C2 also refers to the large residential areas in DXNT, which is being developed as a new transportation hub in the city.
In comparison, on weekends, the high density of spatial interaction (Category A) is significantly weakened, indicating the different EV groups. The DTFC characteristics of these people living in urban areas (Category B) do not show great differences between weekends and weekdays. These spatial interactions indicated EV-driven urban vitality distributions, and in particularly high-density interaction was located in the suburbs.

5. Conclusions

This study investigates the impacts of rapid-developing EVs on the city of Beijing, with a focus on the distribution of residential location and preferences for public charging locations. A new perspective generated using geography and urban space was created using LBS data to rethink EV popularity and the effects on the urban spatial pattern. We have formed the following main conclusions: (1) The residential areas of EV owners are significantly clustered in non-urban central areas. The suburban areas, between the fifth and sixth ring roads—the periphery of the main urban area—have formed a ring-like clusters with high–high spatial autocorrelations. Fewer EV owners’ dwell in the rural areas of the city. (2) EV users are more likely to choose a short DTFC distance (88% within 40 km). This distance attenuation characteristics is not significantly affected by the time factor, although people usually have different travels between weekdays and weekends. This short-distance DTFC determines that their activities are mainly within the urban limits (within the six ring road, radius of 40 km), while a long-distance travel to rural areas is a minority. (3) The different patterns of spatial interaction on weekdays and weekends indicate the different EV users that are affected by time. Some high-densities patterns with short-distance (interaction between adjacent Jiedao units) are discovered during workdays, indicating that a type of EV owners have fixed travel pattern due to commuting. This interaction was significantly weakened on weekends, although the average visits to charging stations on weekends were higher than that on weekdays.
We summarize the contributions made by this paper corresponding to the above three conclusions: (1) In terms of the impacts of EVs on urban forms, it partly supports the previous research discussions from other related studies—will EV drive people live beyond the city and EV owners who live in non-urban areas benefit more? Beijing case study show EV dwell in suburban with higher clustering than both urban center and rural areas. (2) It enables in-depth spatial analysis of the charging-preferences of EV users with respect to housing location. This fills the research gaps to draw a clear picture of geo-locations in an urban context, in terms of existing results from simulations or models on EV charging at “origin or destination” point [20] or charging choice behavior [21]. (3) The temporal (working or non-working days) and spatial (short-distance commuting) characteristics, as well as the high-density interactive between urban space, could inform some recommendations for decision makers. For example, when there is concentrated charging at night in a certain Jiedao, it may have pressure on the electric power grid. As such, it is recommended that charging stations in residences and employment centers can set up incentives such as adaptive charging prices at different time periods to balance the city’s electric energy and improve the utilization rate of each charging station.
With urbanization, suburban areas have been the main dwelling places of EV owners. The common features of these clustered residential areas are that they are near the surrounding large-scale employment locations. These employment facilities mainly refer to the high-tech or high-education locations, which may drive the emerging job-housing pattern of EV owners. Regarding the limitations of the data applicable in Beijing, the workflow for data mining and the acquisition of observational data needs to be redesigned in accordance with the policies and regulations in other regions around the world.
In addition, this study still has some areas that need to be further explored. Specifically, the main factors that affect spatial-temporal patterns and EV owners’ choices of home location need to be identified. Nevertheless, we must also claim the limitation of this research results. EV development in cities and people’s lifestyles will differ with time, regional space, and local policies. Therefore, we propose to develop structured data-driven method to create realistic scenarios for how these emerging and rapid electrification transportation effects may play out in China and other cities around the world. This novel data mining strategy of identifying EV groups based on LBS network is expected to understand EV owners from an urban geographical perspective.

Author Contributions

Conceptualization, Jing Kang, Zhongjie Lin, and Changcheng Kan; Methodology, software, and writing—original draft preparation, Jing Kang; Resources, data curation, and validation, Changcheng Kan; Writing—review and editing, Jing Kang and Zhongjie Lin; Visualization, Jing Kang; Supervision, project administration, and funding acquisition, Zhongjie Lin. All authors have read and agreed to the published version of the manuscript.

Funding

This research is supported by National Natural Science Foundation of China General Program (No. 51878428), University of Pennsylvania China Research & Engagement Fund, and the USDOT Tier 1 University Transportation Center “Cooperative Mobility for Competitive Megaregions” (CM2) (USDOT Award No. 69A3551747135).

Data Availability Statement

People can email the authors for our research data products. Since the original data involves the interests of third-party companies—Badu as well as sensitive information, we have no right to release the original data directly. All the datasets shared in this research can be only used for scientific research. Researchers can obtain more details about the data products on https://huiyan.baidu.com/contact.

Acknowledgments

We thanks Baidu for providing data of this research.

Conflicts of Interest

The authors declare no conflict of interest.

References

  1. IEA. Global EV Outlook. 2019. Available online: https://www.iea.org/reports/global-ev-outlook-2019 (accessed on 31 May 2019).
  2. Stanford Precourt Institute for Energy. EV50: Enabling Beyond 50 Percent Adoption of Electric Vehicles, EV50 Program White Paper, Stanford University. 2019. Available online: https://stanford.app.box.com/s/fn9whj74lpng4bi0tv0ifh66mwh5tnad (accessed on 31 October 2019).
  3. Liang, X.; Zhang, S.; Wu, Y.; Xing, J.; He, X.; Zhang, K.M.; Wang, S.; Hao, J. Air quality and health benefits from fleet electrification in China. Nat. Sustain. 2019, 2, 962–971. [Google Scholar] [CrossRef]
  4. Ke, W.; Zhang, S.; He, X.; Wu, Y.; Hao, J. Well-to-wheels energy consumption and emissions of electric vehicles: Mid-term implications from real-world features and air pollution control progress. Appl. Energy 2017, 188, 367–377. [Google Scholar] [CrossRef]
  5. Romero Lankao, P.; Wilson, A.; Sperling, J.; Miller, C.; Zimny-Schmitt, D.; Bettencourt, L.; Wood, E.; Young, S.; Muratori, M.; Arent, D.; et al. Urban Electrification: Knowledge Pathway Toward an Integrated Research and Development Agenda. In Mansueto Institute for Urban. Innovation Research Paper; The University of Chicago: Chicago, IL, USA, 2019. [Google Scholar] [CrossRef]
  6. Ip, A.; Fong, S.; Liu, E. Optimization for allocating BEV recharging stations in urban areas by using hierarchical clustering. In Proceedings of the IEEE 6th International Conference on Advanced Information Management and Service, Seoul, Korea, 30 November–2 December 2010; pp. 460–465. [Google Scholar]
  7. Neubauer, J.; Wood, E. The impact of range anxiety and home, workplace, and public charging infrastructure on simulated battery electric vehicle lifetime utility. J. Power Source 2014, 257, 12–20. [Google Scholar] [CrossRef]
  8. Newman, D.; Wells, P.; Donovan, C.; Nieuwenhuis, P.; Davies, H. Urban, sub-urban or rural: Where is the best place for electric vehicles? Int. J. Automot. Technol. Manag. 2014, 14, 306–323. [Google Scholar] [CrossRef]
  9. Ioannides, D.; Wall-Reinius, S. Sustainable Mobility in the Periphery: Are Electric Vehicles the Answer? Review of International Literature on Electric Vehicles and Ideas for Further Research; European Tourism Research Institute: Mittuniversitetet, Sweden, 2015; Available online: http://worldcat.org/isbn/9789188025296 (accessed on 31 May 2015).
  10. Kester, J.; Sovacool, B.K.; Noel, L.; de Rubens, G.Z. Rethinking the spatiality of Nordic electric vehicles and their popularity in urban environments: Moving beyond the city? J. Transp. Geogr. 2020, 82, 102557. [Google Scholar] [CrossRef]
  11. Plötz, P.; Schneider, U.; Globisch, J.; Dütschke, E. Who will buy electric vehicles? Identifying early adopters in Germany. Transp. Res. Part A Policy Pract. 2014, 67, 96–109. [Google Scholar] [CrossRef]
  12. Li, W.B.; Long, R.Y.; Chen, H.; Geng, J.C. A review of factors influencing consumer intentions to adopt battery electric vehicles. Renew. Sustain. Energy Rev. 2017, 78, 318–328. [Google Scholar] [CrossRef]
  13. Fornahl, D.; Wernern, N. New Electric Mobility in Fleets in the Rural Area of Bremen/Oldenburg; E-Mobility in Europe, Green Energy and Technology; Springer: Cham, Switzerland, 2015; pp. 237–251. [Google Scholar] [CrossRef]
  14. Zhang, R.; Zhang, J.; Long, Y.; Wu, W.; Liu, J.; Jiang, Y. Long-term implications of electric vehicle penetration in urban decarbonization scenarios: An integrated land use–transport–energy model. Sustain. Cities Soc. 2021, 68, 102800. [Google Scholar] [CrossRef]
  15. Tu, W.; Santi, P.; Zhao, T.H.; He, X.Y.; Li, Q.Q.; Dong, L.; Wallington, T.J.; Ratti, C. Acceptability, energy consumption, and costs of electric vehicle for ride-hailing drivers in Beijing. Appl. Energy 2019, 250, 147–160. [Google Scholar] [CrossRef]
  16. Guo, F.; Yang, J.; Lu, J. The battery charging station location problem: Impact of users’ range anxiety and distance convenience. Transp. Res. Part E Logist. Transp. Rev. 2018, 114, 1–18. [Google Scholar] [CrossRef]
  17. Azadfar, E.; Sreeram, V.; Harries, D. The investigation of the major factors influencing plug-in electric vehicle driving patterns and charging behaviour. Renew. Sustain. Energy Rev. 2015, 42, 1065–1076. [Google Scholar] [CrossRef]
  18. Labeye, E.; Hugot, M.; Brusque, C.; Regan, M.A. The electric vehicle: A new driving experience involving specific skills and rules. Transp. Res. Part F Traffic Psychol. Behav. 2016, 37, 27–40. [Google Scholar] [CrossRef] [Green Version]
  19. Langbroek, J.H.; Franklin, J.P.; Susilo, Y.O. Electric vehicle users and their travel patterns in Greater Stockholm. Transp. Res. Part D Transp. Environ. 2017, 52, 98–111. [Google Scholar] [CrossRef]
  20. Yang, Y.; Yao, E.; Yang, Z.; Zhang, R. Modeling the charging and route choice behavior of BEV drivers. Transp. Res. Part C Emerg. Technol. 2016, 65, 190–204. [Google Scholar] [CrossRef]
  21. Schmidt, M.; Staudt, P.; Weinhardt, C. Evaluating the importance and impact of user behavior on public destination charging of electric vehicles. Appl. Energy 2020, 258, 114061. [Google Scholar] [CrossRef]
  22. Luo, L.; Gu, W.; Zhou, S.; Huang, H.; Gao, S.; Han, J.; Wu, Z.; Dou, X. Optimal planning of electric vehicle charging stations comprising multi-types of charging facilities. Appl. Energy 2018, 226, 1087–1099. [Google Scholar] [CrossRef]
  23. Namdeo, A.; Tiwary, A.; Dziurla, R. Spatial planning of public charging points using multi-dimensional analysis of early adopters of electric vehicles for a city region. Technol. Forecast. Soc. Chang. 2014, 89, 188–200. [Google Scholar] [CrossRef] [Green Version]
  24. De Gennaro, M.; Paffumi, E.; Martini, G. Customer-driven design of the recharge infrastructure and Vehicle-to-Grid in urban areas: A large-scale application for electric vehicles deployment. Energy 2015, 82, 294–311. [Google Scholar] [CrossRef]
  25. Csiszár, C.; Csonka, B.; Földes, D.; Wirth, E.; Lovas, T. Urban public charging station locating method for electric vehicles based on land use approach. J. Transp. Geogr. 2019, 74, 173–180. [Google Scholar] [CrossRef]
  26. Funke, S.Á.; Sprei, F.; Gnann, T.; Plötz, P. How much charging infrastructure do electric vehicles need? A review of the evidence and international comparison. Transp. Res. Part D Transp. Environ. 2019, 77, 224–242. [Google Scholar] [CrossRef]
  27. Baouche, F.; Billot, R.; Trigui, R.; Faouzi, N.E. Efficient allocation of electric vehicles charging stations: Optimization model and application to a dense urban network. IEEE Intell. Transp. Syst. Mag. 2014, 6, 33–43. [Google Scholar] [CrossRef]
  28. Hardman, S.; Shiu, E.; Wilckens, R.S. Comparing high-end and low-end early adopters of battery electric vehicles. Transp. Res. Part A Policy Pract. 2016, 88, 40–57. [Google Scholar] [CrossRef] [Green Version]
  29. Helmus, J.R.; Lees, M.H.; Hoed, R. A data driven typology of electric vehicle user types and charging sessions. Transp. Res. Part C Emerg. Technol. 2020, 115, 102637. [Google Scholar] [CrossRef]
  30. Lu, Y.M.; Liu, Y. Pervasive location acquisition technologies: Opportunities and challenges for geospatial studies. Comput. Environ. Urban Syst. 2012, 36, 105–108. [Google Scholar] [CrossRef]
  31. Ganapati, S. Mobile Location-Based Service (LBS) Apps for the Public Sector: Prospects and Challenges. In Routledge Handbook on Information Technology in Government; Routledge: New York, NY, USA, 2017; pp. 128–143. [Google Scholar] [CrossRef]
  32. Zhang, P.; Zhou, J.; Zhang, T. Quantifying and visualizing jobs-housing balance with big data: A case study of Shanghai. Cities 2017, 66, 10–22. [Google Scholar] [CrossRef] [Green Version]
  33. Qi, G.; Li, X.; Li, S.; Pan, G.; Wang, Z.; Zhang, D. Measuring social functions of city regions from large-scale taxi behaviors. In Proceedings of the IEEE International Conference on Pervasive Computing and Communications Workshops, Seattle, WA, USA, 21–25 March 2011; pp. 384–388. [Google Scholar] [CrossRef]
  34. Zhi, Y.; Li, H.; Wang, D.; Deng, M.; Wang, S.; Gao, J.; Duan, Z.; Liu, Y. Latent spatio-temporal activity structures: A new approach to inferring intra-urban functional regions via social media check-in data. Geo Spat. Inf. Sci. 2016, 19, 94–105. [Google Scholar] [CrossRef]
  35. Khan, N.U.; Wan, W.; Yu, S. Location-based social network’s data analysis and spatio-temporal modeling for the mega city of Shanghai, China. ISPRS Int. J. Geo Inf. 2020, 9, 76. [Google Scholar] [CrossRef] [Green Version]
  36. Gong, L.S.; Jin, M.H.; Liu, Q.; Gong, Y.; Liu, Y. Identifying Urban Residents’ Activity Space at Multiple Geographic Scales Using Mobile Phone Data. ISPRS Int. J. Geo Inf. 2020, 9, 241. [Google Scholar] [CrossRef]
  37. Yuan, J.; Zheng, Y.; Xie, X. Discovering regions of different functions in a city using human mobility and POIs. In Proceedings of the 18th ACM SIGKDD international conference on Knowledge discovery and data mining, Beijing, China, 14–19 August 2012; pp. 186–194. [Google Scholar] [CrossRef]
  38. Liu, X.; Kang, C.; Gong, L.; Liu, Y. Incorporating spatial interaction patterns in classifying and understanding urban land use. Int. J. Geogr. Inf. Sci. 2016, 30, 334–350. [Google Scholar] [CrossRef]
  39. Cheng, J.; Liu, J.J.; Gao, Y. Analyzing the spatio-temporal characteristics of Beijing’s OD trip volume based on time series clustering method. J. Geo Inf. Sci. 2016, 18, 1227–1239. [Google Scholar]
  40. Pagany, R.; Ramirez Camargo, L.; Dorner, W. A review of spatial localization methodologies for the electric vehicle charging infrastructure. Int. J. Sustain. Transp. 2019, 13, 433–449. [Google Scholar] [CrossRef] [Green Version]
  41. Weldon, P.; Morrissey, P.; Brady, J.; O’Mahony, M. An investigation into usage patterns of electric vehicles in Ireland. Transp. Res. Part D Transp. Environ. 2016, 43, 207–225. [Google Scholar] [CrossRef]
  42. Pan, Y.; Tian, S.; Liu, D.; Fang, Y.; Zhu, X.; Zhang, Q.; Zheng, B.; Michalski, G.; Wang, Y. Fossil Fuel Combustion-Related Emissions Dominate Atmospheric Ammonia Sources during Severe Haze Episodes: Evidence from 15N-Stable Isotope in Size-Resolved Aerosol Ammonium. Environ. Sci. Technol. 2016, 50, 8049–8056. [Google Scholar] [CrossRef] [PubMed] [Green Version]
  43. Beijing Transport Institute. Beijing Transport Annual Report; Beijing Transport Institute: Beijing, China, 2020; Available online: http://www.bjtrc.org.cn/List/index/cid/7.html (accessed on 7 May 2021).
  44. Yang, J.; Yi, D.; Qiao, B.; Zhang, J. Spatio-temporal change characteristics of spatial-interaction networks: Case study within the sixth ring road of Beijing, China. ISPRS Int. J. Geo Inf. 2019, 8, 273. [Google Scholar] [CrossRef] [Green Version]
  45. Ming, Y.; Zhang, J.; Qi, J.; Liao, T.; Wang, M.; Zhang, L. Prediction and Analysis of Chengdu Housing Rent Based on XGBoost Algorithm[C]. In Proceedings of the 2020 3rd International Conference on Big Data Technologies, Qingdao, China, 18–20 September 2020; pp. 1–5. [Google Scholar] [CrossRef]
  46. Feng, D.; Tu, L.; Sun, Z. Research on Population Spatiotemporal Aggregation Characteristics of a Small City: A Case Study on Shehong County Based on Baidu Heat Maps. Sustainability 2019, 11, 6276. [Google Scholar] [CrossRef] [Green Version]
  47. Shen, Z.; Li, M. (Eds.) Big Data Support of Urban Planning and Management: The Experience in China; Springer: Berlin/Heidelberg, Germany, 2017. [Google Scholar] [CrossRef]
  48. Guo, S.H.; Yang, G.G.; Pei, T.; Ma, T.; Song, C.; Shu, H.; Du, Y.Y.; Zhou, C.H. Analysis of factors affecting urban park service area in Beijing: Perspectives from multi-source geographic data. Landsc. Urban Plan. 2019, 181, 103–117. [Google Scholar] [CrossRef]
  49. Phithakkitnukoon, S.; Horanont, T.; Di Lorenzo, G.; Shibasaki, R.; Ratti, C. Activity-Aware Map: Identifying Human Daily Activity Pattern Using Mobile Phone Data; International Workshop on Human Behavior Understanding; Springer: Berlin/Heidelberg, Germany, 2010; pp. 14–25. [Google Scholar]
  50. Tobler, W. On the first law of geography: A reply. Ann. Assoc. Am. Geogr. 2004, 94, 304–310. [Google Scholar] [CrossRef]
  51. Anselin, L. Local indicators of spatial association—LISA. Geogr. Anal. 1995, 27, 93–115. [Google Scholar] [CrossRef]
Figure 1. Research areas overlaid on satellite images from Google Earth. The urban core center named Tian’anmen Square is marked by the yellow star. The regions R1–R3 regions are located within the Fifth Ring Road, representing the high-density built-up areas with high density population and employment centers (R1R3). R4–R7 are located between the fifth and sixth ring roads, as suburban areas (R4R7). R5 is the sub-center of the city supported by the local policy, namely Tongzhou New Town. R4 is a high-tech industrial park with a large number of employment facilities (R5). R6 and R7 are large residential areas with a single type of land use (R6,R7).
Ijgi 10 00320 g001
Figure 2. Distribution of residential and employment areas within the sixth ring road of Beijing. The main high density residential and employment areas are marked and circled with red and bluelines.
Ijgi 10 00320 g002
Figure 3. Spatial aggregation of “Dwelling–Travelling for Charging” (DTFC) flow based on the town-neighborhood unit (Jiedao).
Ijgi 10 00320 g003
Figure 4. Distribution of public charging stations and EV users’ residential areas at the town-neighborhood level. The majority of EV users live between the fourth and sixth ring roads, especially in the northern and southern regions. In contrast, the deployment of public charging stations shows partly consistency with this pattern, regarding it indicates a certain correlation with large employment areas.
Ijgi 10 00320 g004
Figure 5. LISA cluster map and LISA significance map (weights: Queen Weights): the high–high cluster is highlighted in red, and the corresponding significance results highlight in green. It shows an obvious clustering trend beyond the urban core areas but along with the fifth and sixth ring roads. Clearly, the rural areas outside the sixth ring road show low-low cluster features.
Ijgi 10 00320 g005
Figure 6. Interaction strength with the DTFC distance distribution of EV owners’ charging-trips. The blue curve represents the observation data, and the yellow curve show the fitted results. There was a significant turning point at 10 km. Besides, it can be seen that a peak appears at the 20 km and 35 km point respectively.
Ijgi 10 00320 g006
Figure 7. Influences by time factors: no significant influence on weekdays and weekends. Nevertheless, there are statistical differences between workdays and non-workdays. For weekdays, there are drop and peak at 30 km and 35 km point respectively; in contrast, the curve over the weekends show more fluctuates, with two peaks both at 20 km and 30 km point.
Ijgi 10 00320 g007
Figure 8. DTFC flow patterns on weekdays and weekends. Three categories, namely A, B, C, are identified by high volumes or densities, representing the main interaction mode between urban units—Jiedaos. Each category has a spatial correlation with housing or employment places, based on Table 2.
Ijgi 10 00320 g008
Table 1. Overview of electric vehicle (EV) groups derived from location-based service (LBS) data (collection and description).
Weekdays 1Weekends 2
MondayTuesdayWednesdayThursdayFridaySaturdaySunday
Count4048404740144145509761154602
Mean1012101210041036101912231150
Total21,35110,717
Total mean10171191
1 21 days; 2 9 days.
Table 2. Descriptive statistics of the job-housing proportion of the ring roads.
Region Residential pp (%)High
Density Areas
Employment pp (%)High
Density Areas
EV Residential(%)
Within 2nd
(urban central area)
5%N3RR, S3RR,
SIH, WAJ
7%CBD, ZGC, JRJ,
WAJ, WKS, FTP
4%
2–39%11%9%
3–413%15%13%
4–5
(Urban area)
16%16%17%
5–6
(Suburban)
36%HLG, TTY, QIH, DFZ, TZNT30%SHD, LGY, YIZ40%
Outside of 6th ring road22% 21% 16%
(Rural)
2nd = second ring road, 2–3 = region between the second and third ring road; 3–4 = region between the third and fourth ring roads; 4–5 = region between the fourth and fifth ring roads; 5–6 = region between the fifth and sixth ring roads.
Publisher’s Note: MDPI stays neutral with regard to jurisdictional claims in published maps and institutional affiliations.

