1. Introduction
The “UN 2030 Agenda for sustainable development”, approved by the United Nations General Assembly, and in which are pointed out goals for pursuing sustainable development in cities all over the world, sets out among the main goals the accessibility to a more sustainable transport system. Due to the necessity of reducing the negative impacts of the actual mobility habits in society, especially those such as atmospheric and acoustic pollution, the reduction of the excessive number of cars on roads and the pursuing of transport cost reductions are hence the main problems that municipalities have to deal with. Finding the best strategies and the right tools to achieve these goals is quite a challenge. Among the possible strategies, cities are adopting measures to promote walking, cycling, and also public transport services.
Relying on public transport systems is surely one of the most effective strategies to guide people towards more sustainable transport modes. An adequate public transport network, supported by an efficient transport service for users, can guide people towards this type of mass transit system by resorting to less usage of private vehicles for daily travels, both for commuting and leisure trips. Fewer cars on roads, in fact, can significantly contribute to lowering air pollution, as can notably be observed from the environmental data published in recent months when movement restrictions of people occurred because of the spread of the COVID-19 pandemic [
1,
2,
3,
4].
Among public transport systems, railway services show great performances. Running on their own rail tracks, separately from other vehicles and with high commercial speed, they allow people to reach distant destinations in a very short time. However, some areas of cities have railway stations that are distant from each other, resulting in poor accessibility to the transport system. One of the possible strategies to enhance railway system accessibility is making first- and last-mile trips faster, using mobility solutions in place of walking to reach public transport stops or the desired destinations. An example spread all around the world is cycling, enjoying adequate cycle infrastructures with private bikes or using shared mobility services like bike-sharing systems [
5,
6].
Moreover, active modes of transport such as cycling and its combination with rail transport systems can be the best solution to reduce high vehicular flows in the morning peak hours, in particular with reference to home-to-school journeys. Students, in fact, often go to school accompanied by their parents by car, with a consequent increase in traffic jams and atmospheric and noise pollution. Multimodal transport may be an ideal solution for this type of user, also because bicycles are an active mode of transport often used by youth. Moreover, the spread of the coronavirus pandemic has highlighted even more the need to adopt more sustainable, eco-friendly and individual modes of transport, such as bicycles, as an alternative to private cars. Thus, realising a bike-sharing program addressed to schools might be crucial, because students and young people need to be encouraged to use more environmentally friendly mobility systems. Realising cycle routes might also be a valid measure to promote active and sustainable mobility over private cars and traditional public transport services. Some tools are needed to evaluate the effectiveness of these measures; one of the possible tools for this is GIS-based analyses.
The present paper aims to develop a GIS-based methodology supporting public administrations in assessing whether the introduction of new bike lanes, depending on the selected tracks, is able to increase the potential number of users of this transport alternative. Moreover, the possible multimodality between cycle mobility and rail transport services has been examined. It has been verified that users can reach different destinations thanks to multimodality instead of private cars or low-frequency and unreliable public transport services. Hence, this tool could be helpful to municipalities to provide access to safe, affordable, accessible, and sustainable transport systems, increasing the proportion of the population that has convenient access to public transport (Target 11.2, 2030 Agenda for Sustainable Development). To achieve this goal, we took into account three neighbourhoods of the city of Palermo as a case study. In particular, we considered the new bike lanes determined by AMAT Palermo S.p.A. (the municipal company that manages public transport services, shared mobility and also the realisation of cycle routes) as part of the new “Go2School” bike-sharing program, geared toward high school students.
Hence, it was determined the population potentially attracted by these cycle mobility projects and check whether and how much multimodality between bicycle and rail transport will rise.
Once the potential user demand served by cycle and rail infrastructures was found, we adopted a modal choice model, calibrated for the “Go2School” project thanks to a questionnaire submitted to high school students.
Chapter 2 describes the benefits of cycle mobility for better transport sustainability and how GIS can be a valuable tool to support policymakers in programming transport sustainability policies. Chapter 3 shows the study area of the three neighbourhoods of Palermo with their current transport services. In Chapter 4, the analysis run on GIS is presented, and Chapter 5 shows the results of a Multinomial Logit model to evaluate the propensity of high school students to use their own bikes or a shared bike for home-to-school trips. Finally, in Chapter 6, we present the conclusions of our paper.
2. Background
Recent years have seen a growing interest in cycling as an alternative to the usual modes of transport. Moreover, municipalities in several states have pushed people even more towards cycling, adopting policies in favour of cyclability and discouraging the use of other modes of transport, especially private cars [
7,
8,
9].
People who cycle use a zero-impact vehicle and also improve their quality of life, enjoying the health benefits provided by this active mode of transportation [
10,
11,
12,
13]. However, the main problem for cyclists is safety, because bikers and pedestrians—the so-called “vulnerable road users” (VRU)—ask for more secure infrastructures because of their higher risk of being severely injured in collisions than motorised vehicle drivers [
14,
15,
16,
17,
18].
The possible impacts of bicycle usage in combination with public transport means on users’ modal choice have been studied for a long time, because cycling could be an effective first- and last-mile solution [
19,
20,
21].
The actions focused on more sustainable mobility can be assessed through the use of tools such as GIS. Several studies in the literature highlight how GIS has been a useful tool in supporting transport sustainability policies.
D’Orso and Migliore [
22], for example, developed a methodology in a GIS environment to help policymakers identifying the arcs of a pedestrian network that need a prioritised action. Additionally, Lee et al. [
23] addressed the issue of walkability in a GIS environment: thanks to a street audit tool and GIS, indeed, the authors evaluated the impact of the built environment on children’s walking to school in an area up to 2 km radius around some elementary schools in Seattle. This allowed the authors to deduce a “Walkability Index”, analysing where to enact adequate measures to improve its level.
Using GIS software, Ak et al. [
24] realised a risk map of the Istanbul metropolitan area associated with hazardous materials transportation and ran several routing scenarios. The scenarios allow the researchers to highlight the most convenient routes for hazmat transportation, taking into account the economic point of view and the reduced impacts on health. Macharis and Pekin [
25] used a GIS-based methodology to assess several strategies in order to stimulate intermodal transport in Belgium, such as adding new terminals or introducing subsidies. Yona et al. [
26] showed how a GIS environment was helpful to highlight the spatiotemporal distribution of public transport service user complaints. The result was a map that could help transport authorities to find the transport network points in which to improve the service.
Moreover, Giuffrida et al. [
27] illustrated how the combined use of a Public Participatory GIS (PPGIS) and Volunteered Geographic Information (VGI) could be a valuable tool for choosing the best transport practices, but also a supporting tool for the overall transportation planning process and the evaluation of the project scenarios. Furthermore, Domenech and Gutierrez [
28] developed a methodology for evaluating the effectiveness and spatial coverage of the public transport service in tourist cities. Using GIS, in fact, the researchers created a system of territorial indicators that correlate the public transport network with the territorial distribution of the population, also including tourists. This system allowed them to identify the urban areas in which the public transport service coverage and the service accessibility were lower than in other areas.
GIS software has also been used in connection with bicycle usage and policies regarding cycle mobility.
Aultman-Hall et al. [
29], for example, running an analysis in a GIS environment about the urban bicycle routes in Guelph, Canada, obtained results that provided useful information for transportation planners and engineers in order to evaluate where users chose to travel. Their results also suggested measures focused on improving cycling conditions throughout the road network, such as realising wider curb lanes or providing actuated traffic signal detectors able to recognise the presence of bicycles.
Moreover, as demonstrated by Winters et al. [
30], thanks to GIS software and a multilevel logistic model, the built environment strongly influences cycling. In particular, the authors found high probabilities of cycling to be associated with several characteristics of the built environment, such as less hilliness, presence of bicycle signage, traffic calming, cyclist-activated traffic lights, high population density, and greater neighbourhood commercial, education, and industrial land use. Furthermore, Moudon et al. [
31], from an analysis run in King County, Washington, suggested that there were other significant environmental variables, such as proximity to trails and the presence of agglomerations of offices, clinics, hospitals, and fast-food restaurants. However, it appears that cycling is an individual modal choice independent from environmental support and moderately related to the neighbourhood environment.
Another interesting study involving GIS usage to evaluate cycle networks was performed by Amoroso et al. [
32] in the city of Palermo, Italy. In their work, the authors identified the lack of parking spaces for bicycles as one of the main issues many cities have to face. For this reason, they proposed a step-by-step analysis using open-source GIS software to find the best locations for bike stations in the old town of Palermo in order to optimise the whole urban system and the transport supply.
This paper proposes a GIS-based approach to evaluate the attractiveness of current and future cycle paths in Palermo, aiming to enhance multimodal transport by combining cycling with rail transport services.
3. Study Area
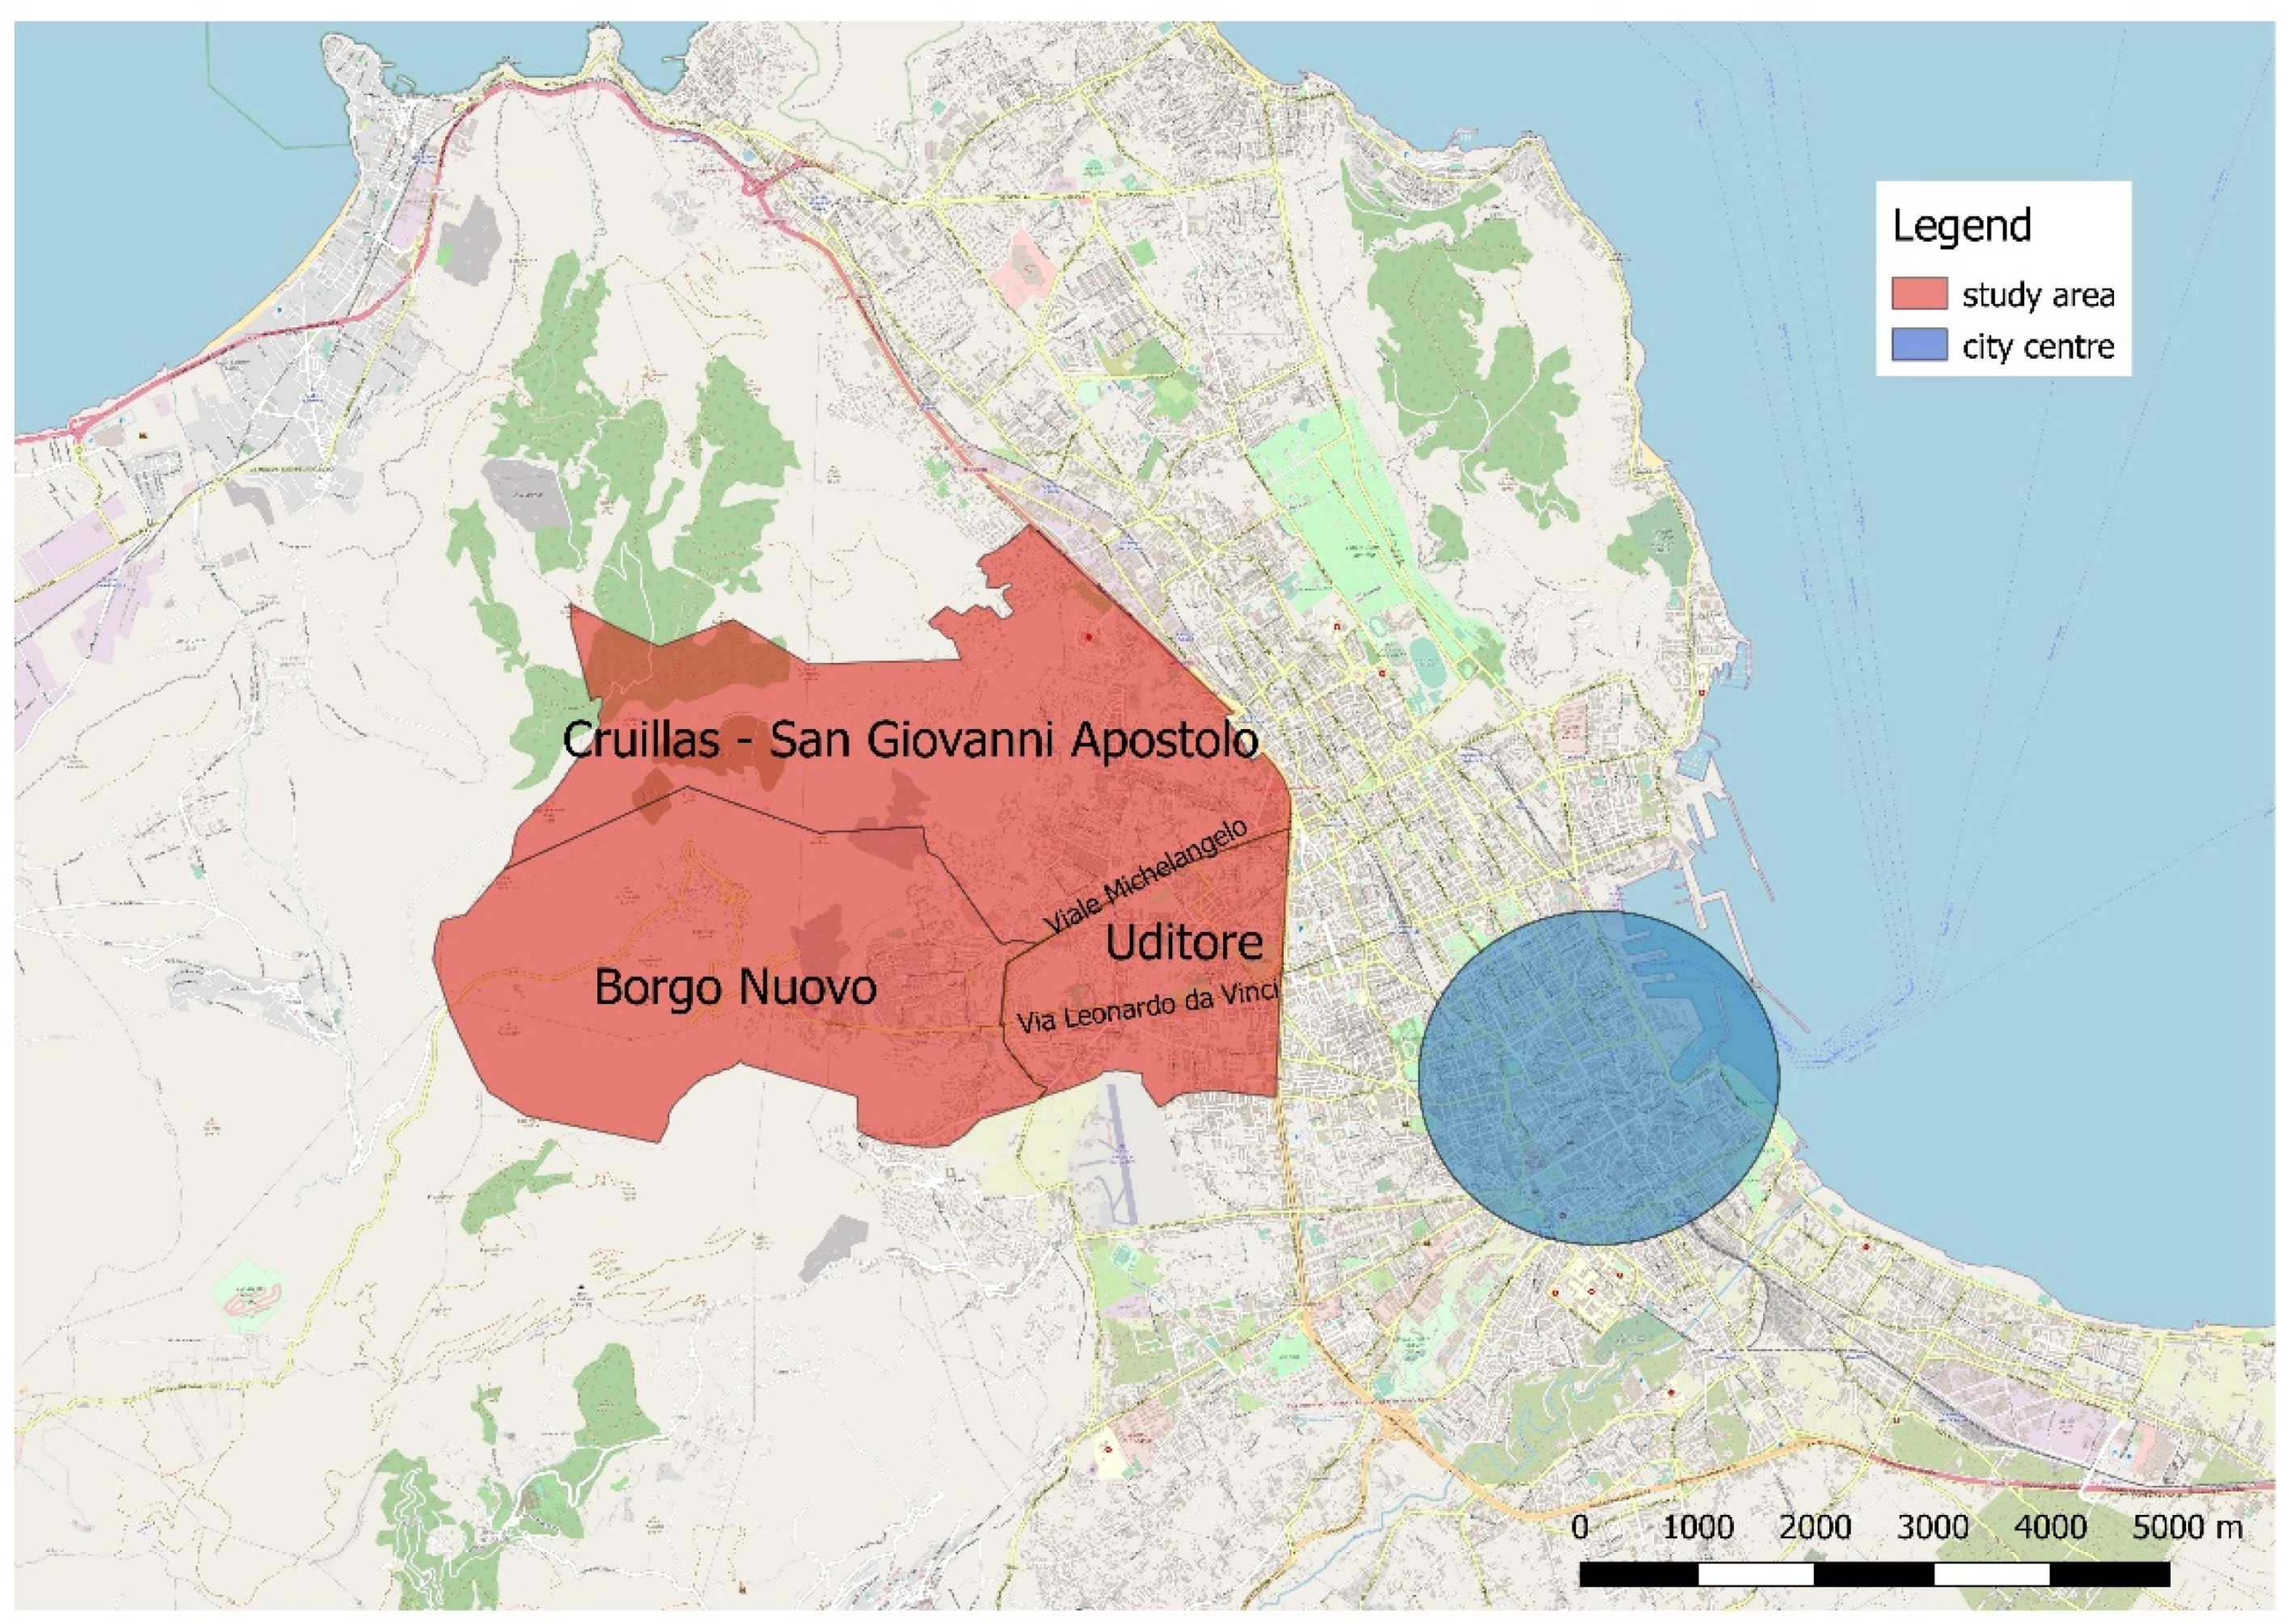
The study area chosen for this research includes three neighbourhoods around Viale Michelangelo: the “Cruillas-San Giovanni Apostolo”, “Borgo Nuovo”, and “Uditore” neighbourhoods. The study area is presented in
Figure 1.
These three neighbourhoods are located on the outskirts of the city of Palermo, and they are residential areas with several trip attractors, such as the “La Torre” shopping centre, the “Vincenzo Cervello” hospital and the headquarters of the Revenue Agency.
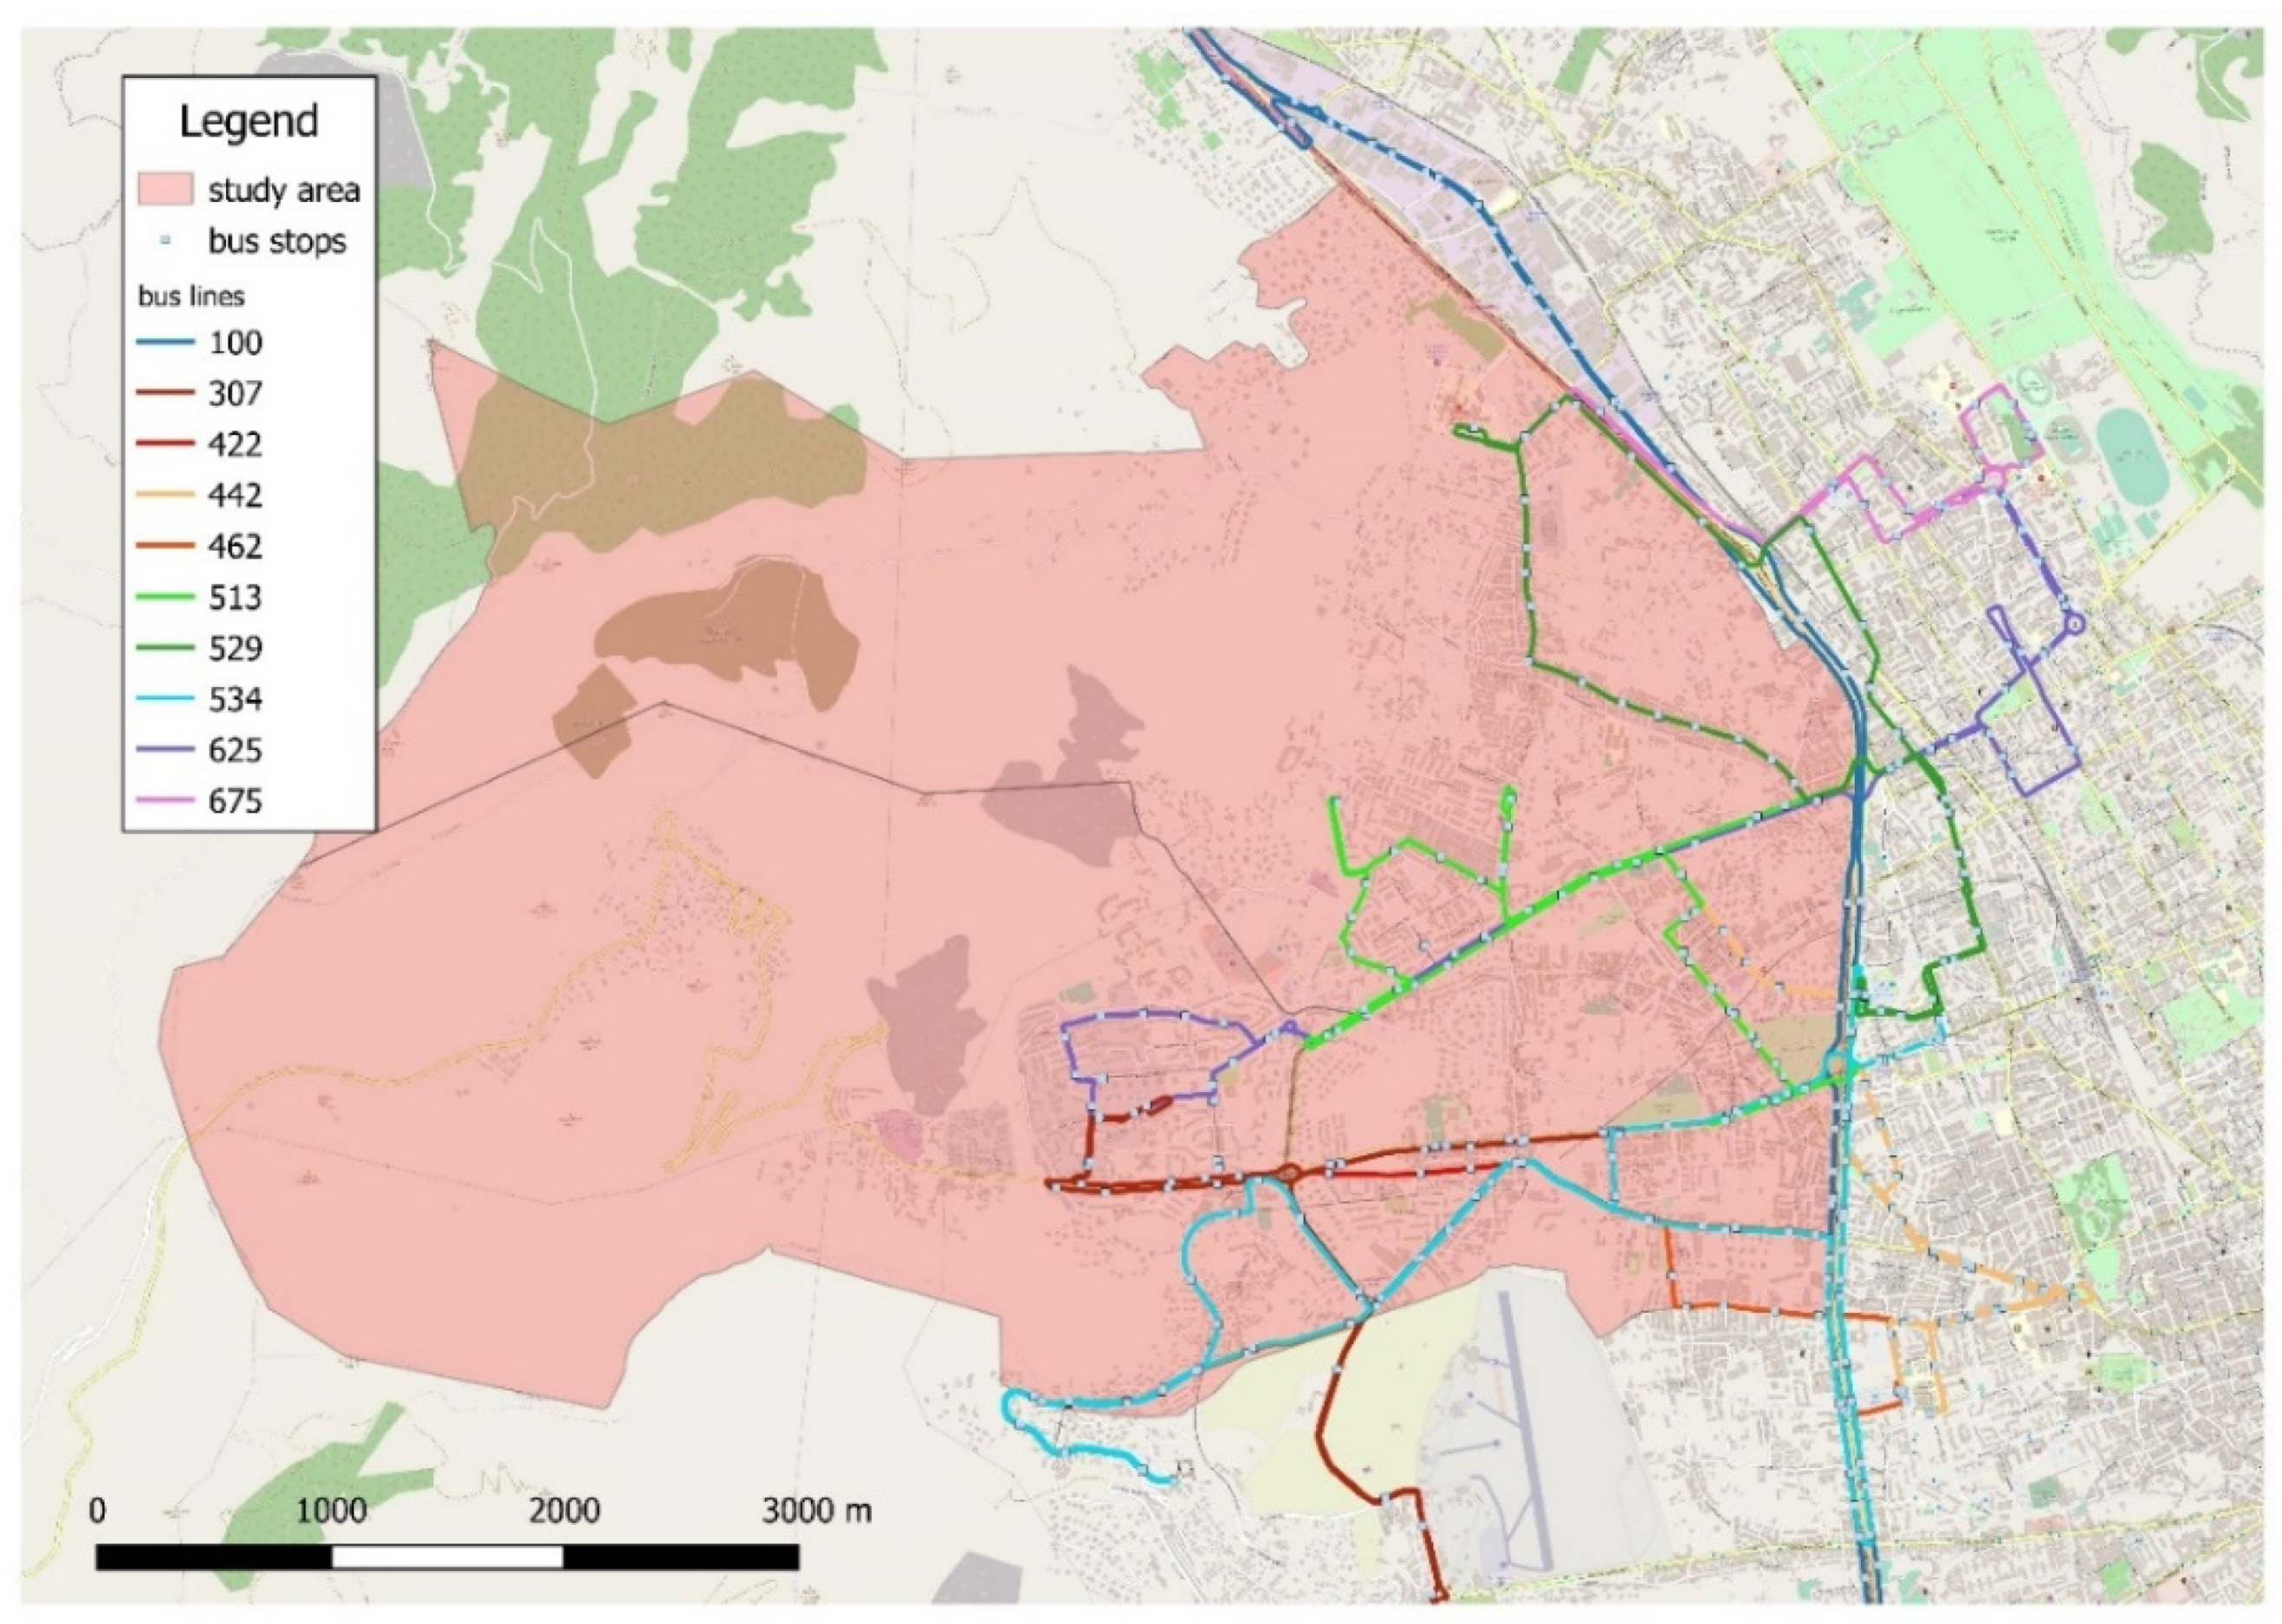
The study area is served by low-frequency and not very regular public transport services, which mainly consist of the bus service and two tram lines, both managed by AMAT Palermo S.p.A., the main public transport company of the city of Palermo. The bus and tram lines serving the study area are shown in the following
Table 1, with their frequencies.
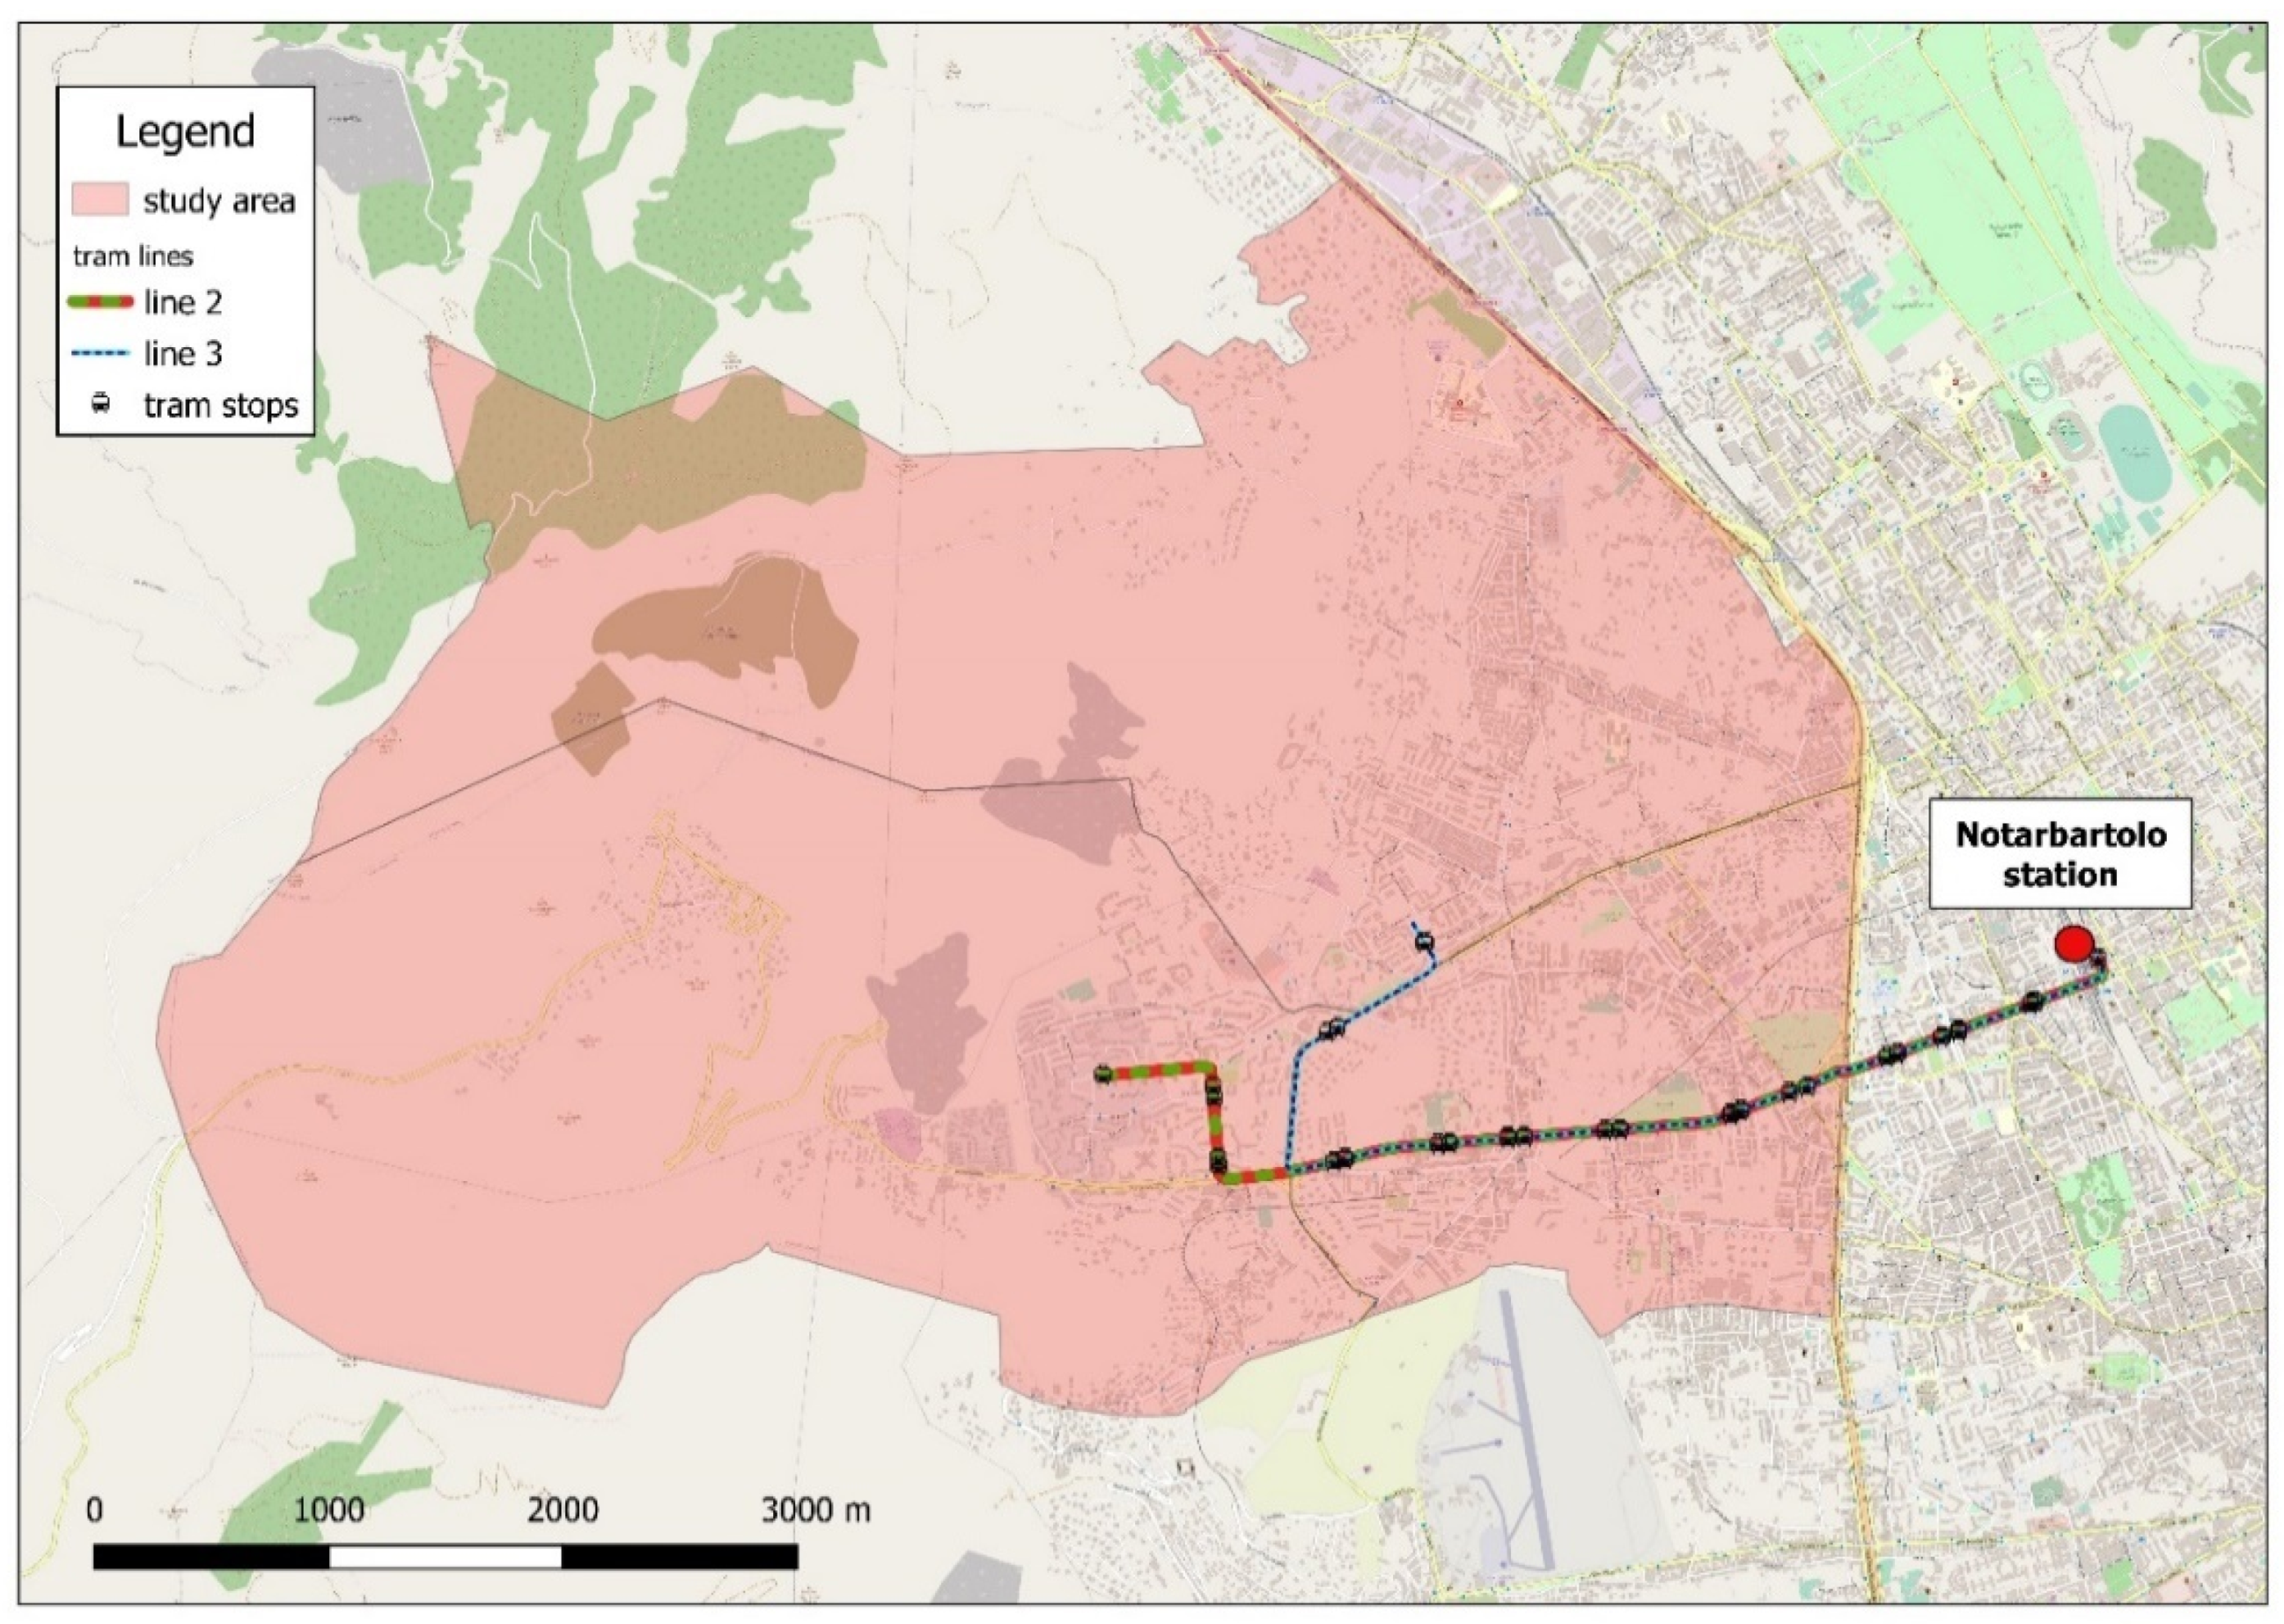
Figure 2 and
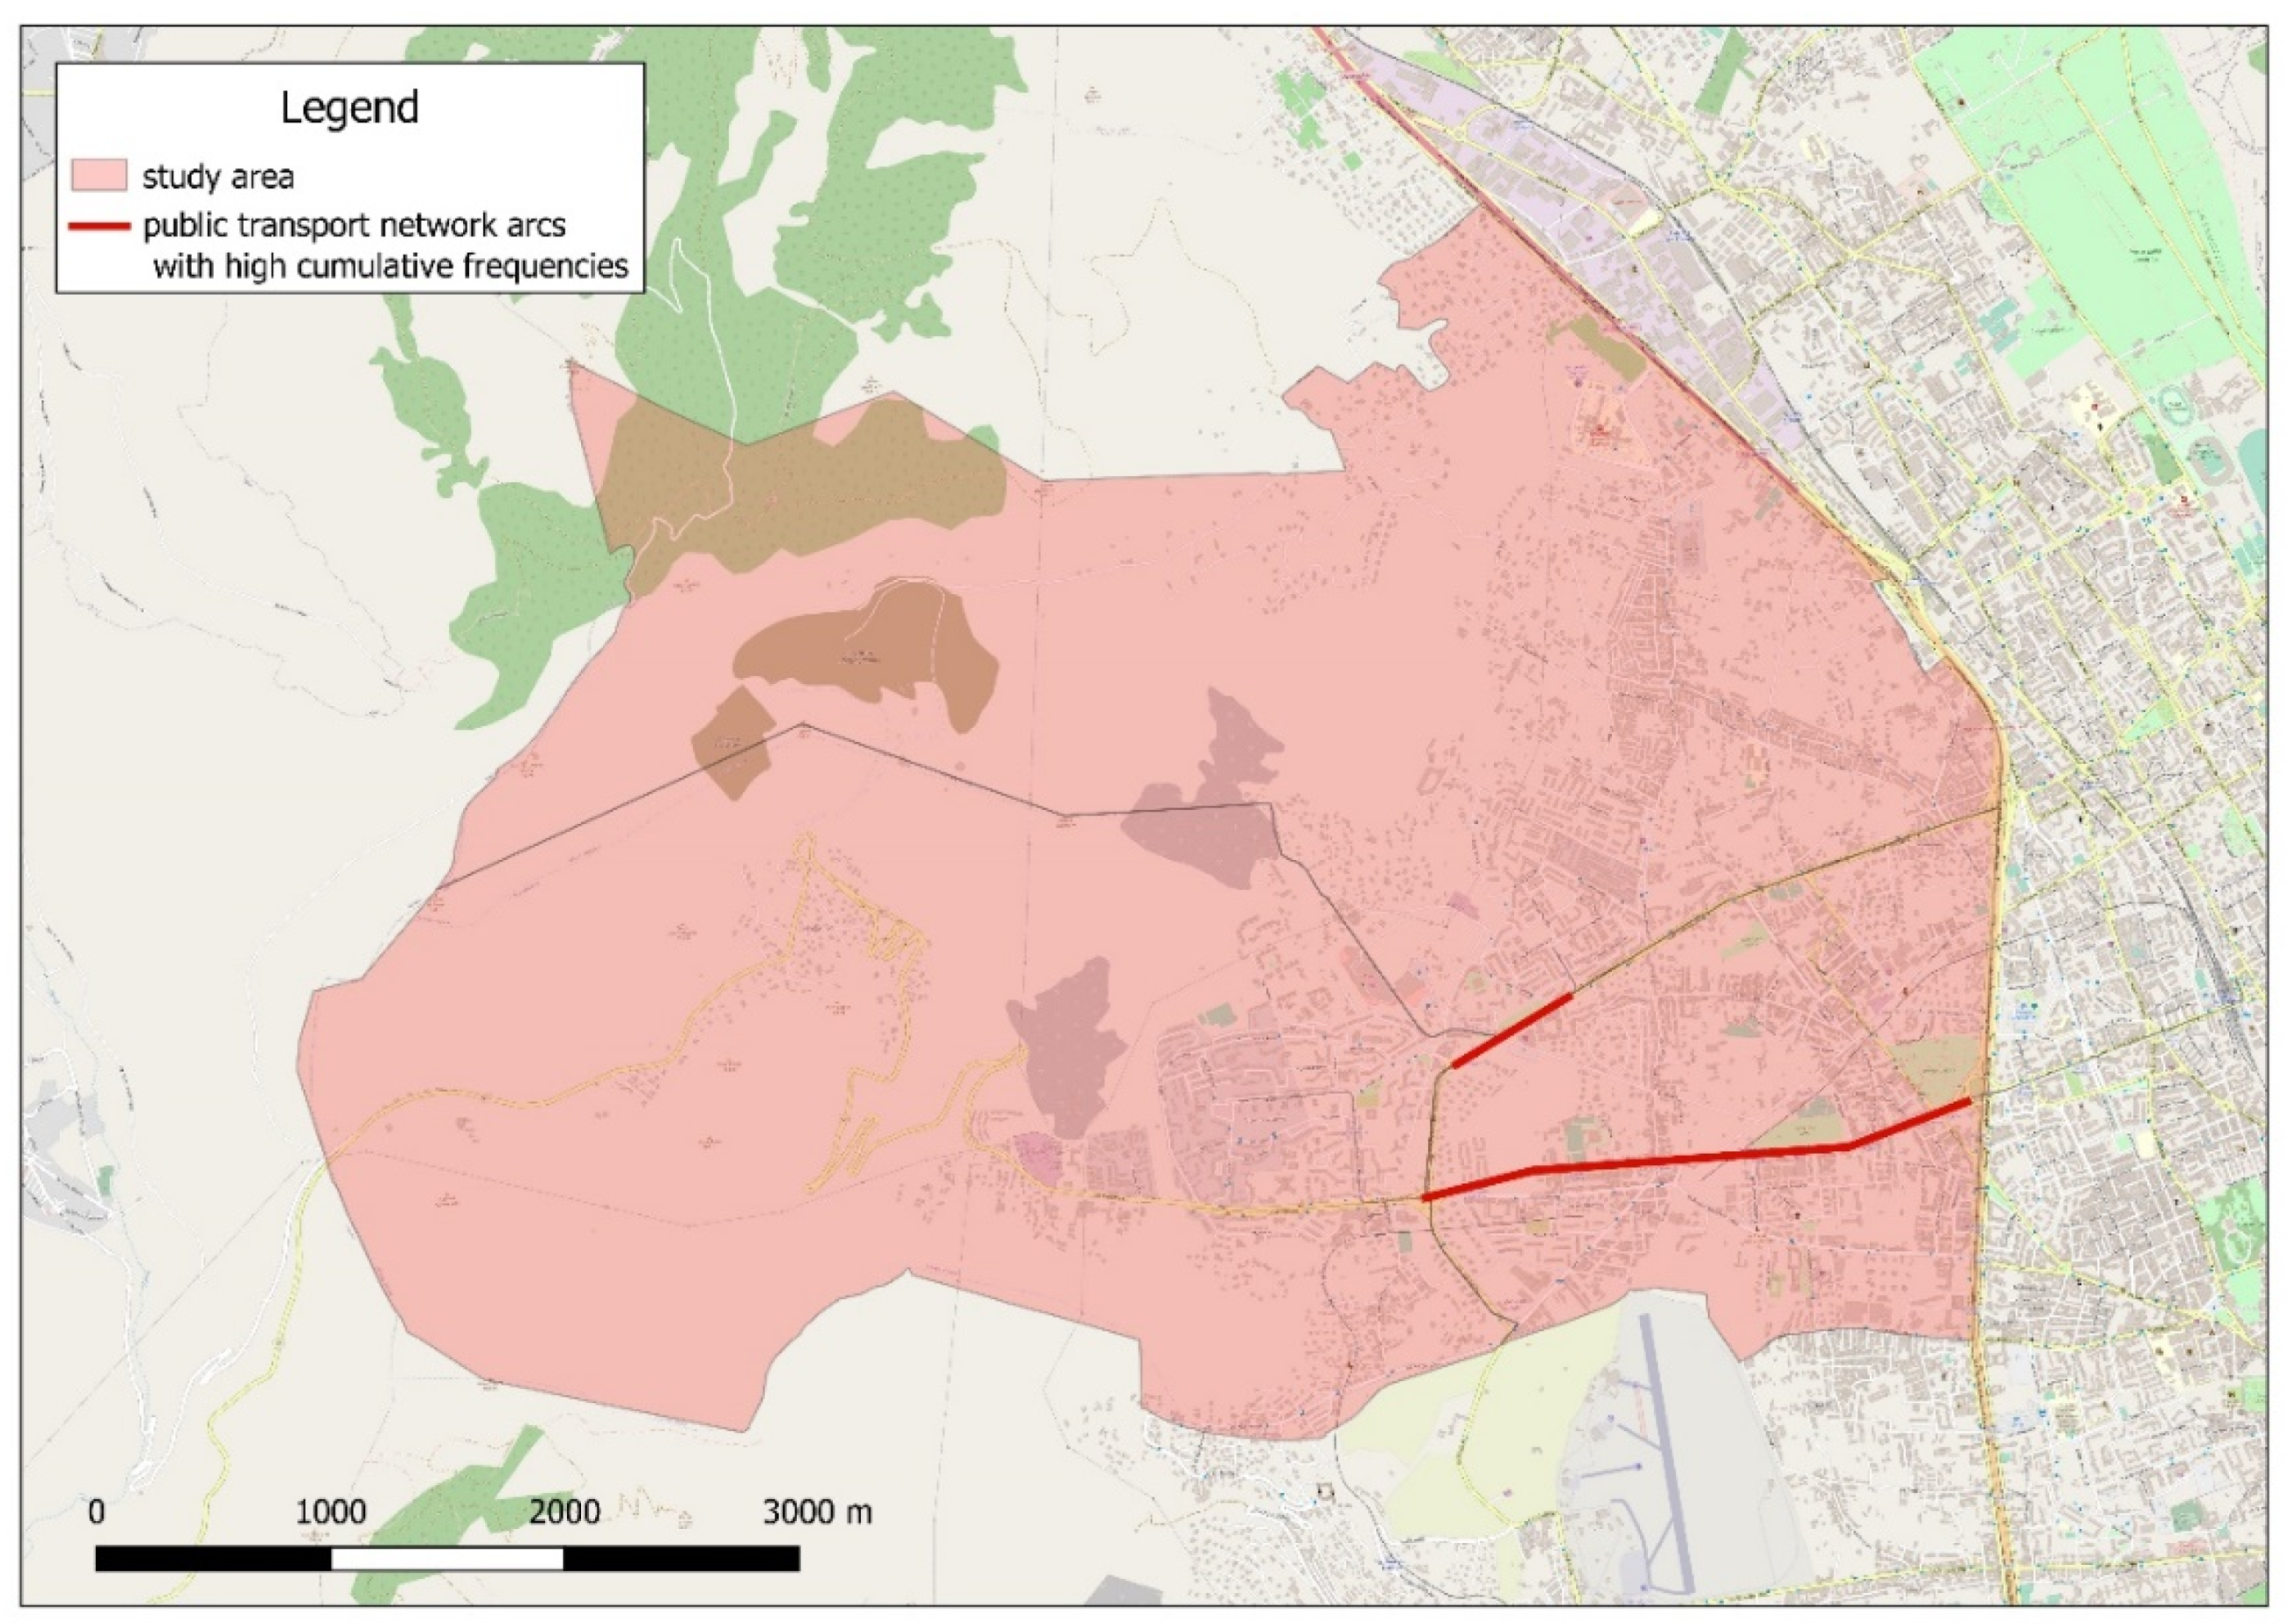
Figure 3 show all the bus and tram lines in the study area and also the location of the stops. As can be noted, the spatial accessibility to the system is good because there are many stops where users can wait for the bus service. However, temporal constraints affect this accessibility; low frequencies, low regularity, and low punctuality strongly influence the possibility of using this mode of transport, especially for commuting trips. Problems related to the mandatory activities a person undertakes and the time availability of users often make these waiting times unreasonable. Considering only the road segments in which the waiting time falls below 10 min due to the presence of multiple lines, the result is the map in
Figure 4; there is a frequent public transport service only in Via Leonardo da Vinci and in a small segment of Viale Michelangelo, thanks to the presence of two tram lines and bus lines.
Furthermore, the three neighbourhoods are rather isolated from the main nodes of the rail transport network. To access the nearest railway station, the “Palermo Notarbartolo” station, users have only two tram lines available. This occurrence, in some cases, significantly increases both their route and their travel time.
Cycling is not very common in the three neighbourhoods because of safety issues. There are no cycle paths or bike-sharing docks to date, so residents are motivated to use mainly their private vehicle or are forced to wait a long time at the stops because of the poor efficiency of public transport.
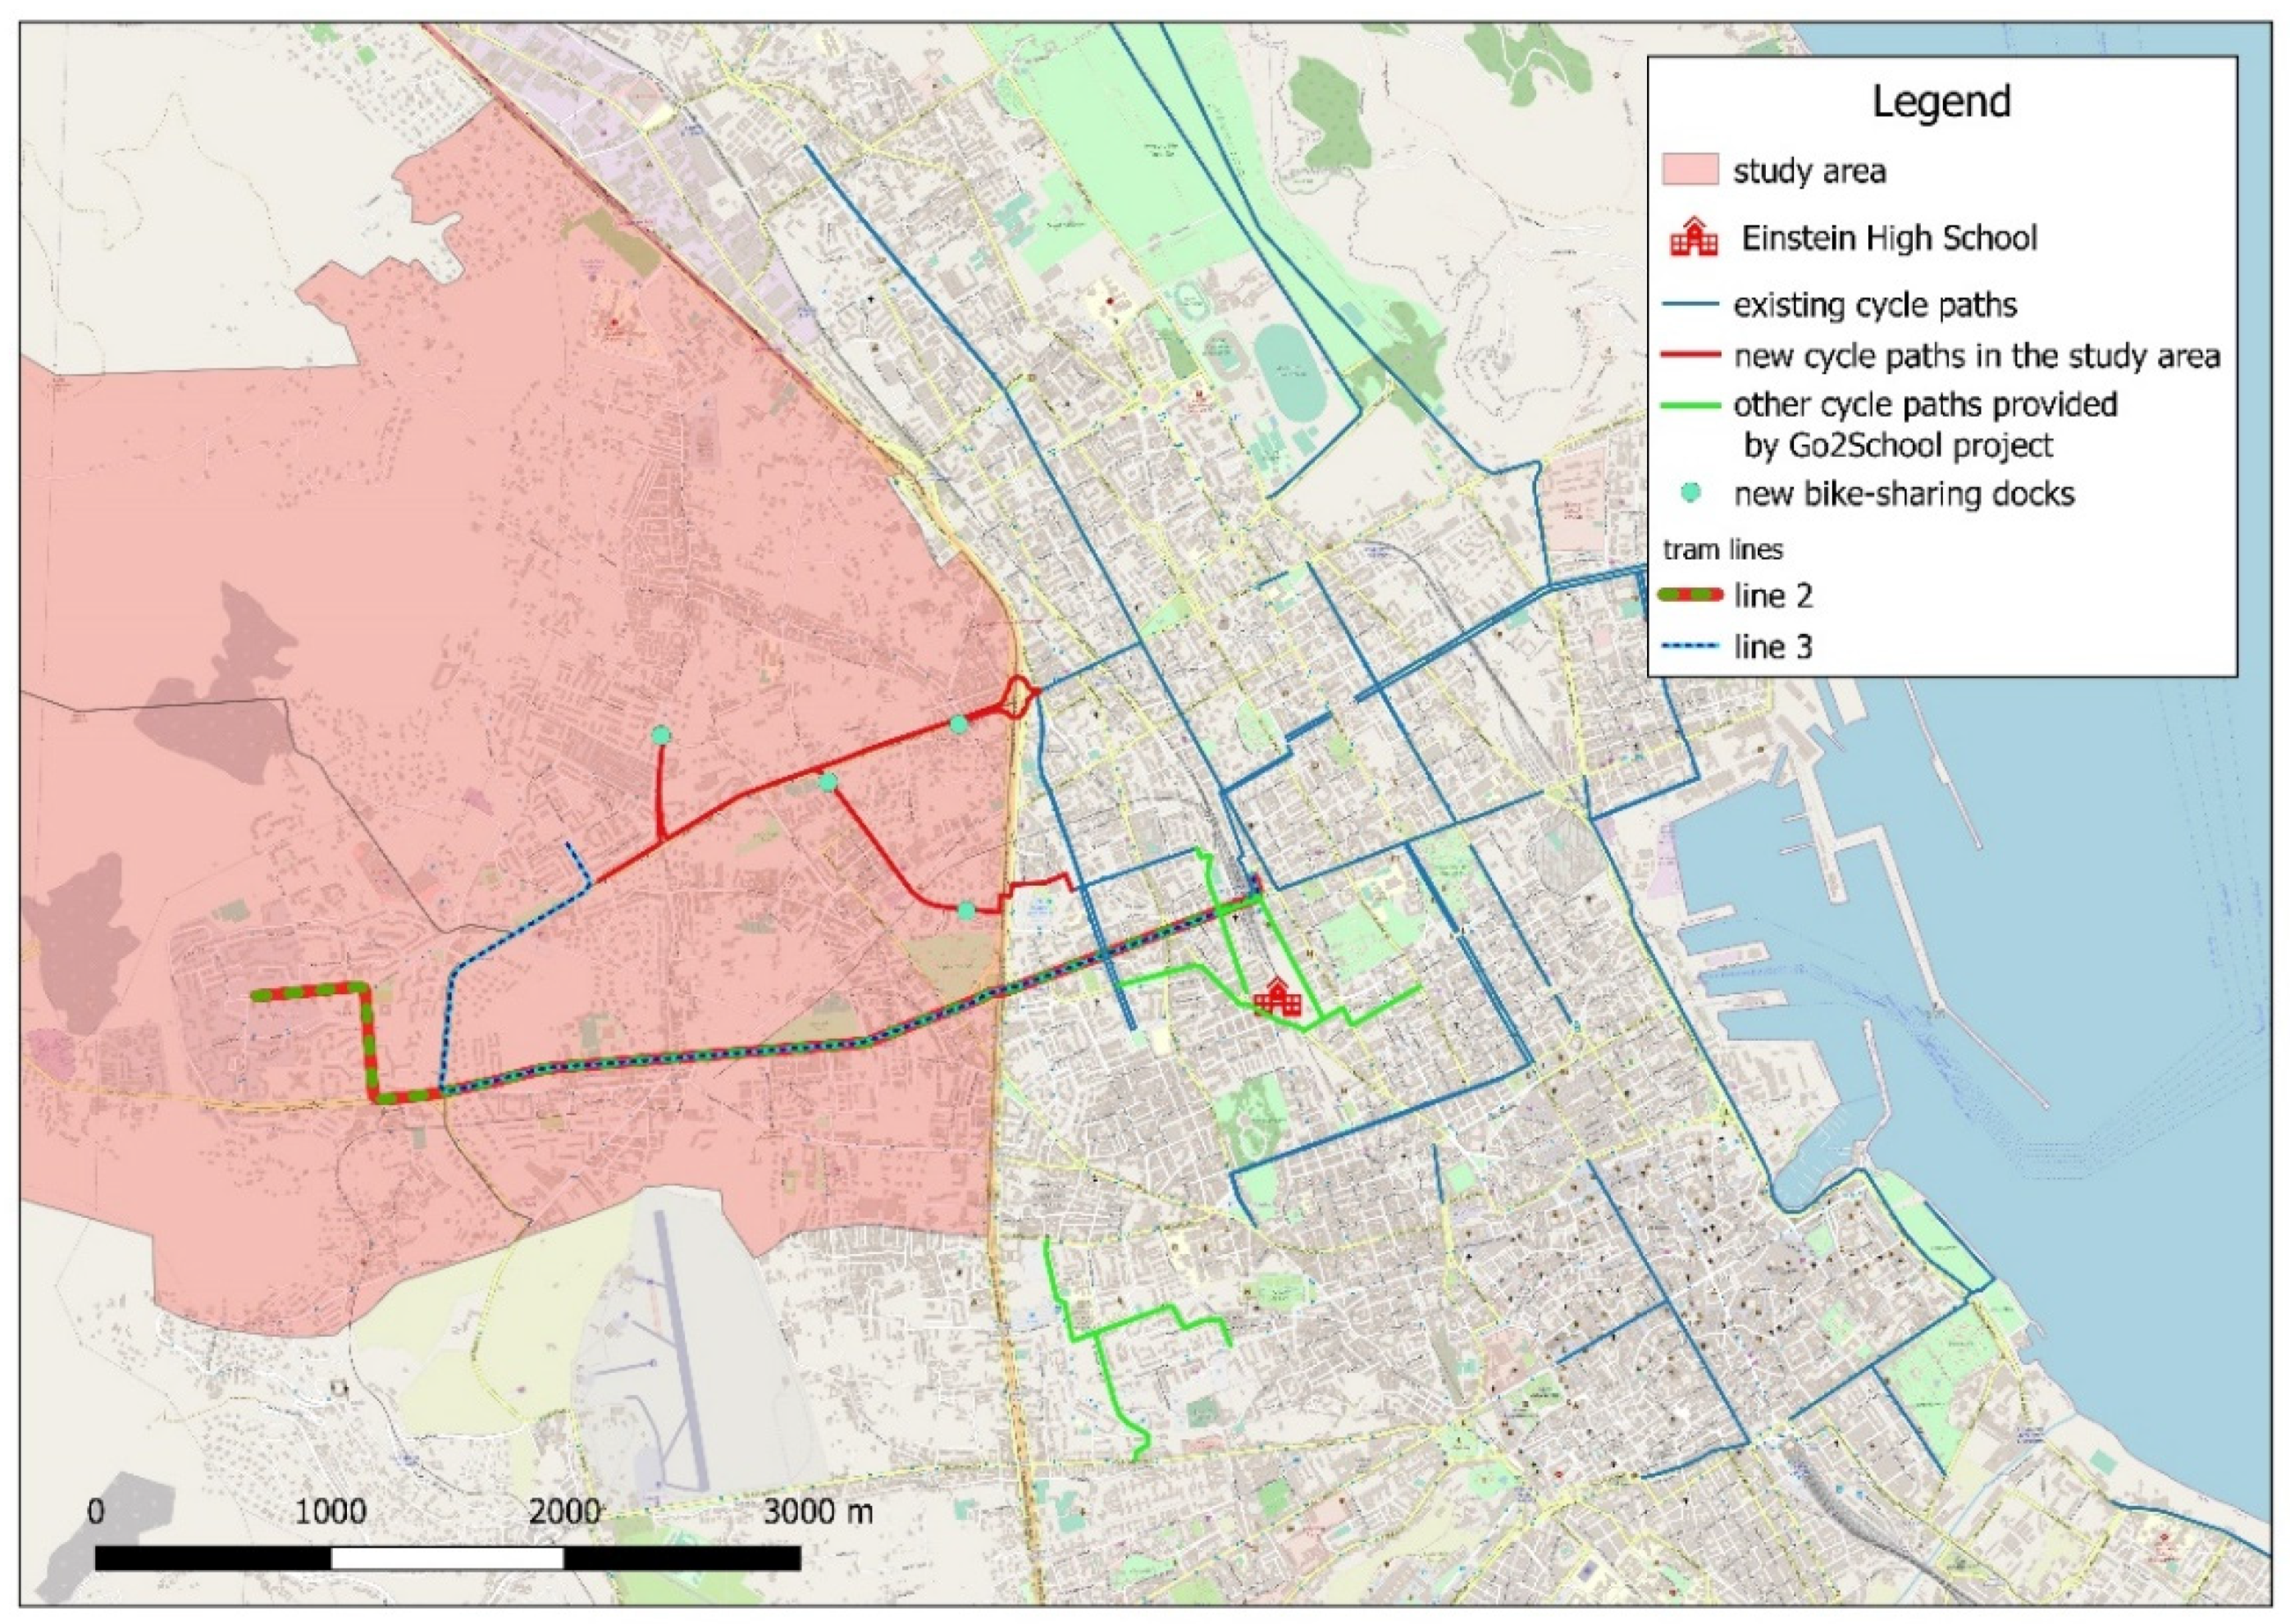
However, the AMAT company has planned, as part of the “Go2School” bike-sharing project, the construction of some cycle paths along the main roads of these neighbourhoods (Viale Michelangelo, Via Brunelleschi and Via Bernini) in the near future, as well as the installation of four bike-sharing docks.
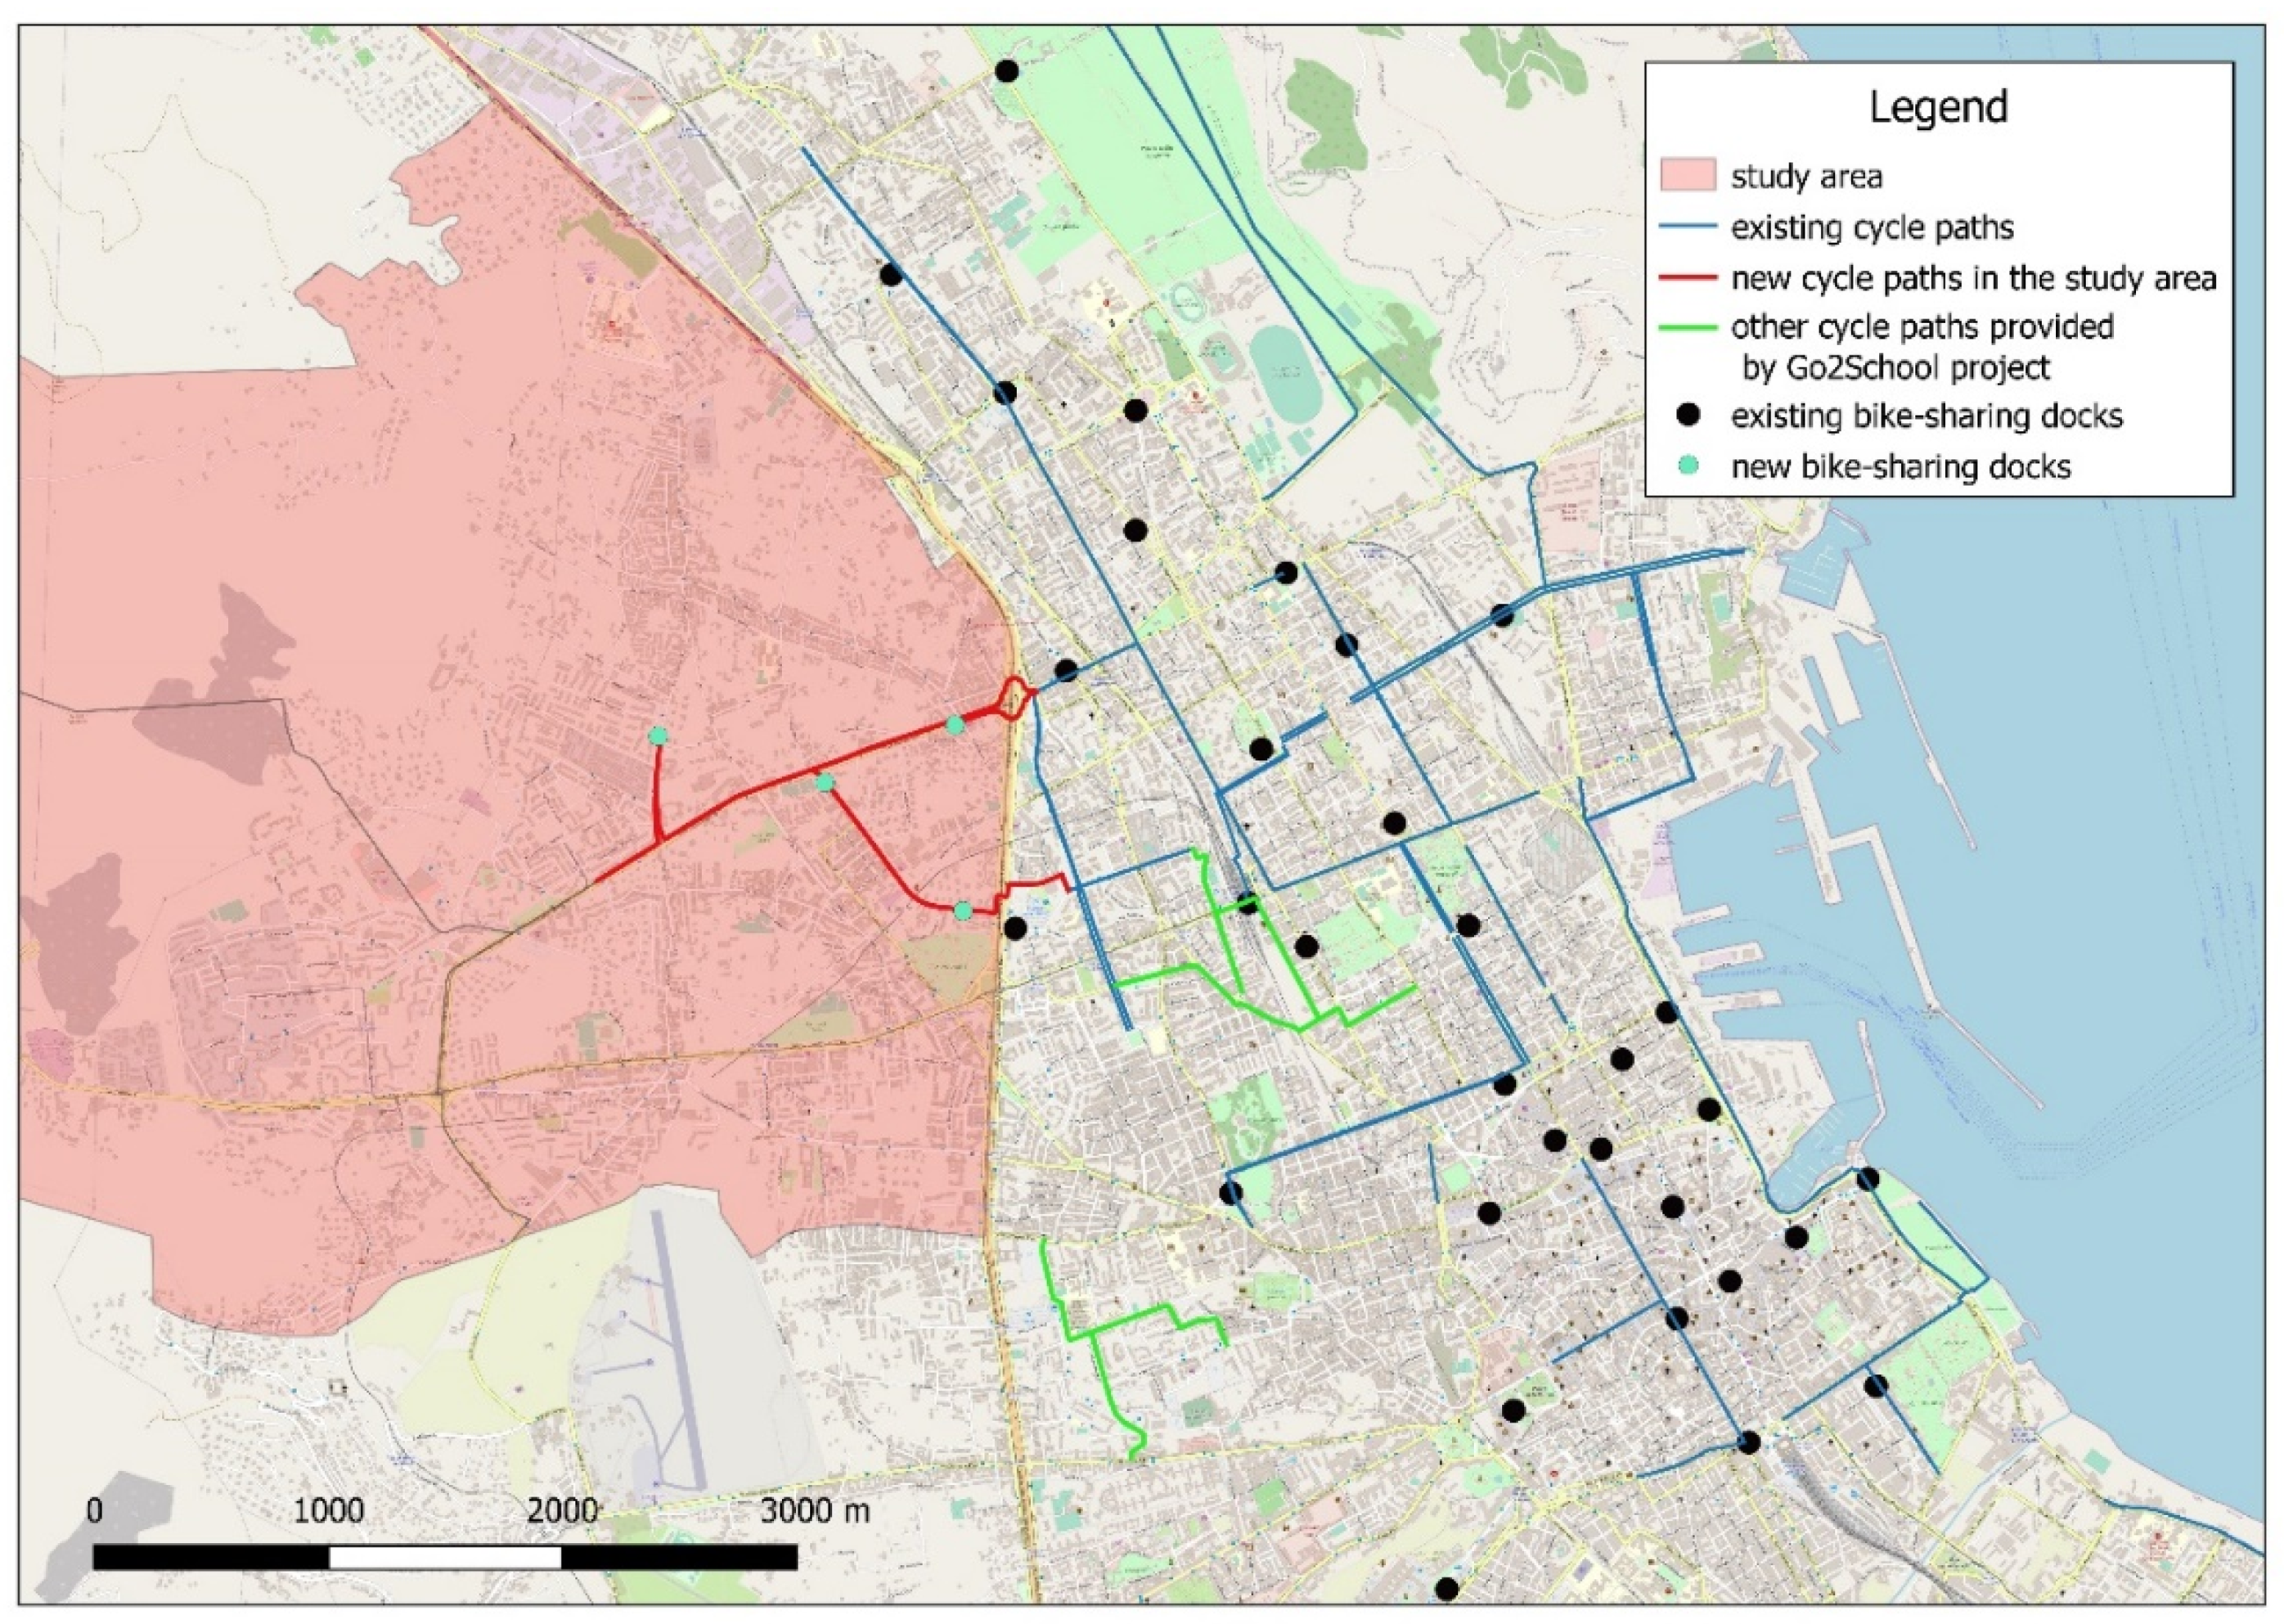
Figure 5 and
Figure 6 show the new cycle paths in the study area and the location of the bike-sharing docks. The new cycle paths form a continuous network with the existing cycle paths and the other paths foreseen by the Go2School project.
The design of the new cycle paths took into account the following factors to trace the routes that the new cycle paths must follow: technical constraints (roads with insufficient width, roads with high traffic flows, absence of safe cycle crossings, topography); the interaction with the vehicular flow, trying to locate the cycle paths in road axes in which the vehicular flow was not disturbed; the demand to be served, trying to connect the bike-sharing stations with the schools following the shortest route; and multimodality, considering the presence of cycle paths near the most important intermodal nodes, such as railway stations and tram stops, where bike-sharing docks are already located. Particular attention was paid to the safety of the cycle paths.
The Go2School project will expand the offer of bike-sharing in the city, which already has 39 cycle parks throughout the urban area and a fleet of 400 bicycles. In fact, 15 new cycle docks will be installed, and 200 pedal-assisted two-seater bicycles will be gradually added to the current fleet. Moreover, the new bike-sharing stations will accommodate 12 up to 15 bikes in relation to their locations and potential usage. The AMAT company will also provide coupons for home-to-school and home-to-work trips.
The rate of the new shared-bike service will be the same of the current bike-sharing system. The bike-sharing system in Palermo is free for the first 30 min of use: the service certainly meets the needs of the poorest segments of the population and is useful especially for making short- or medium-distance trips. After the first 30 free minutes, the fare gradually increases: it is 0.50 cents for every half hour up to 2 h of total use, then 1 euro every half hour. This fare makes this mobility service competitive with respect to public transport and private vehicles.
4. Analysis
To assess the effects of the introduction of cycle paths and the bike-sharing system in the study area, we carried out accessibility analyses using QGIS, an open-source GIS software package.
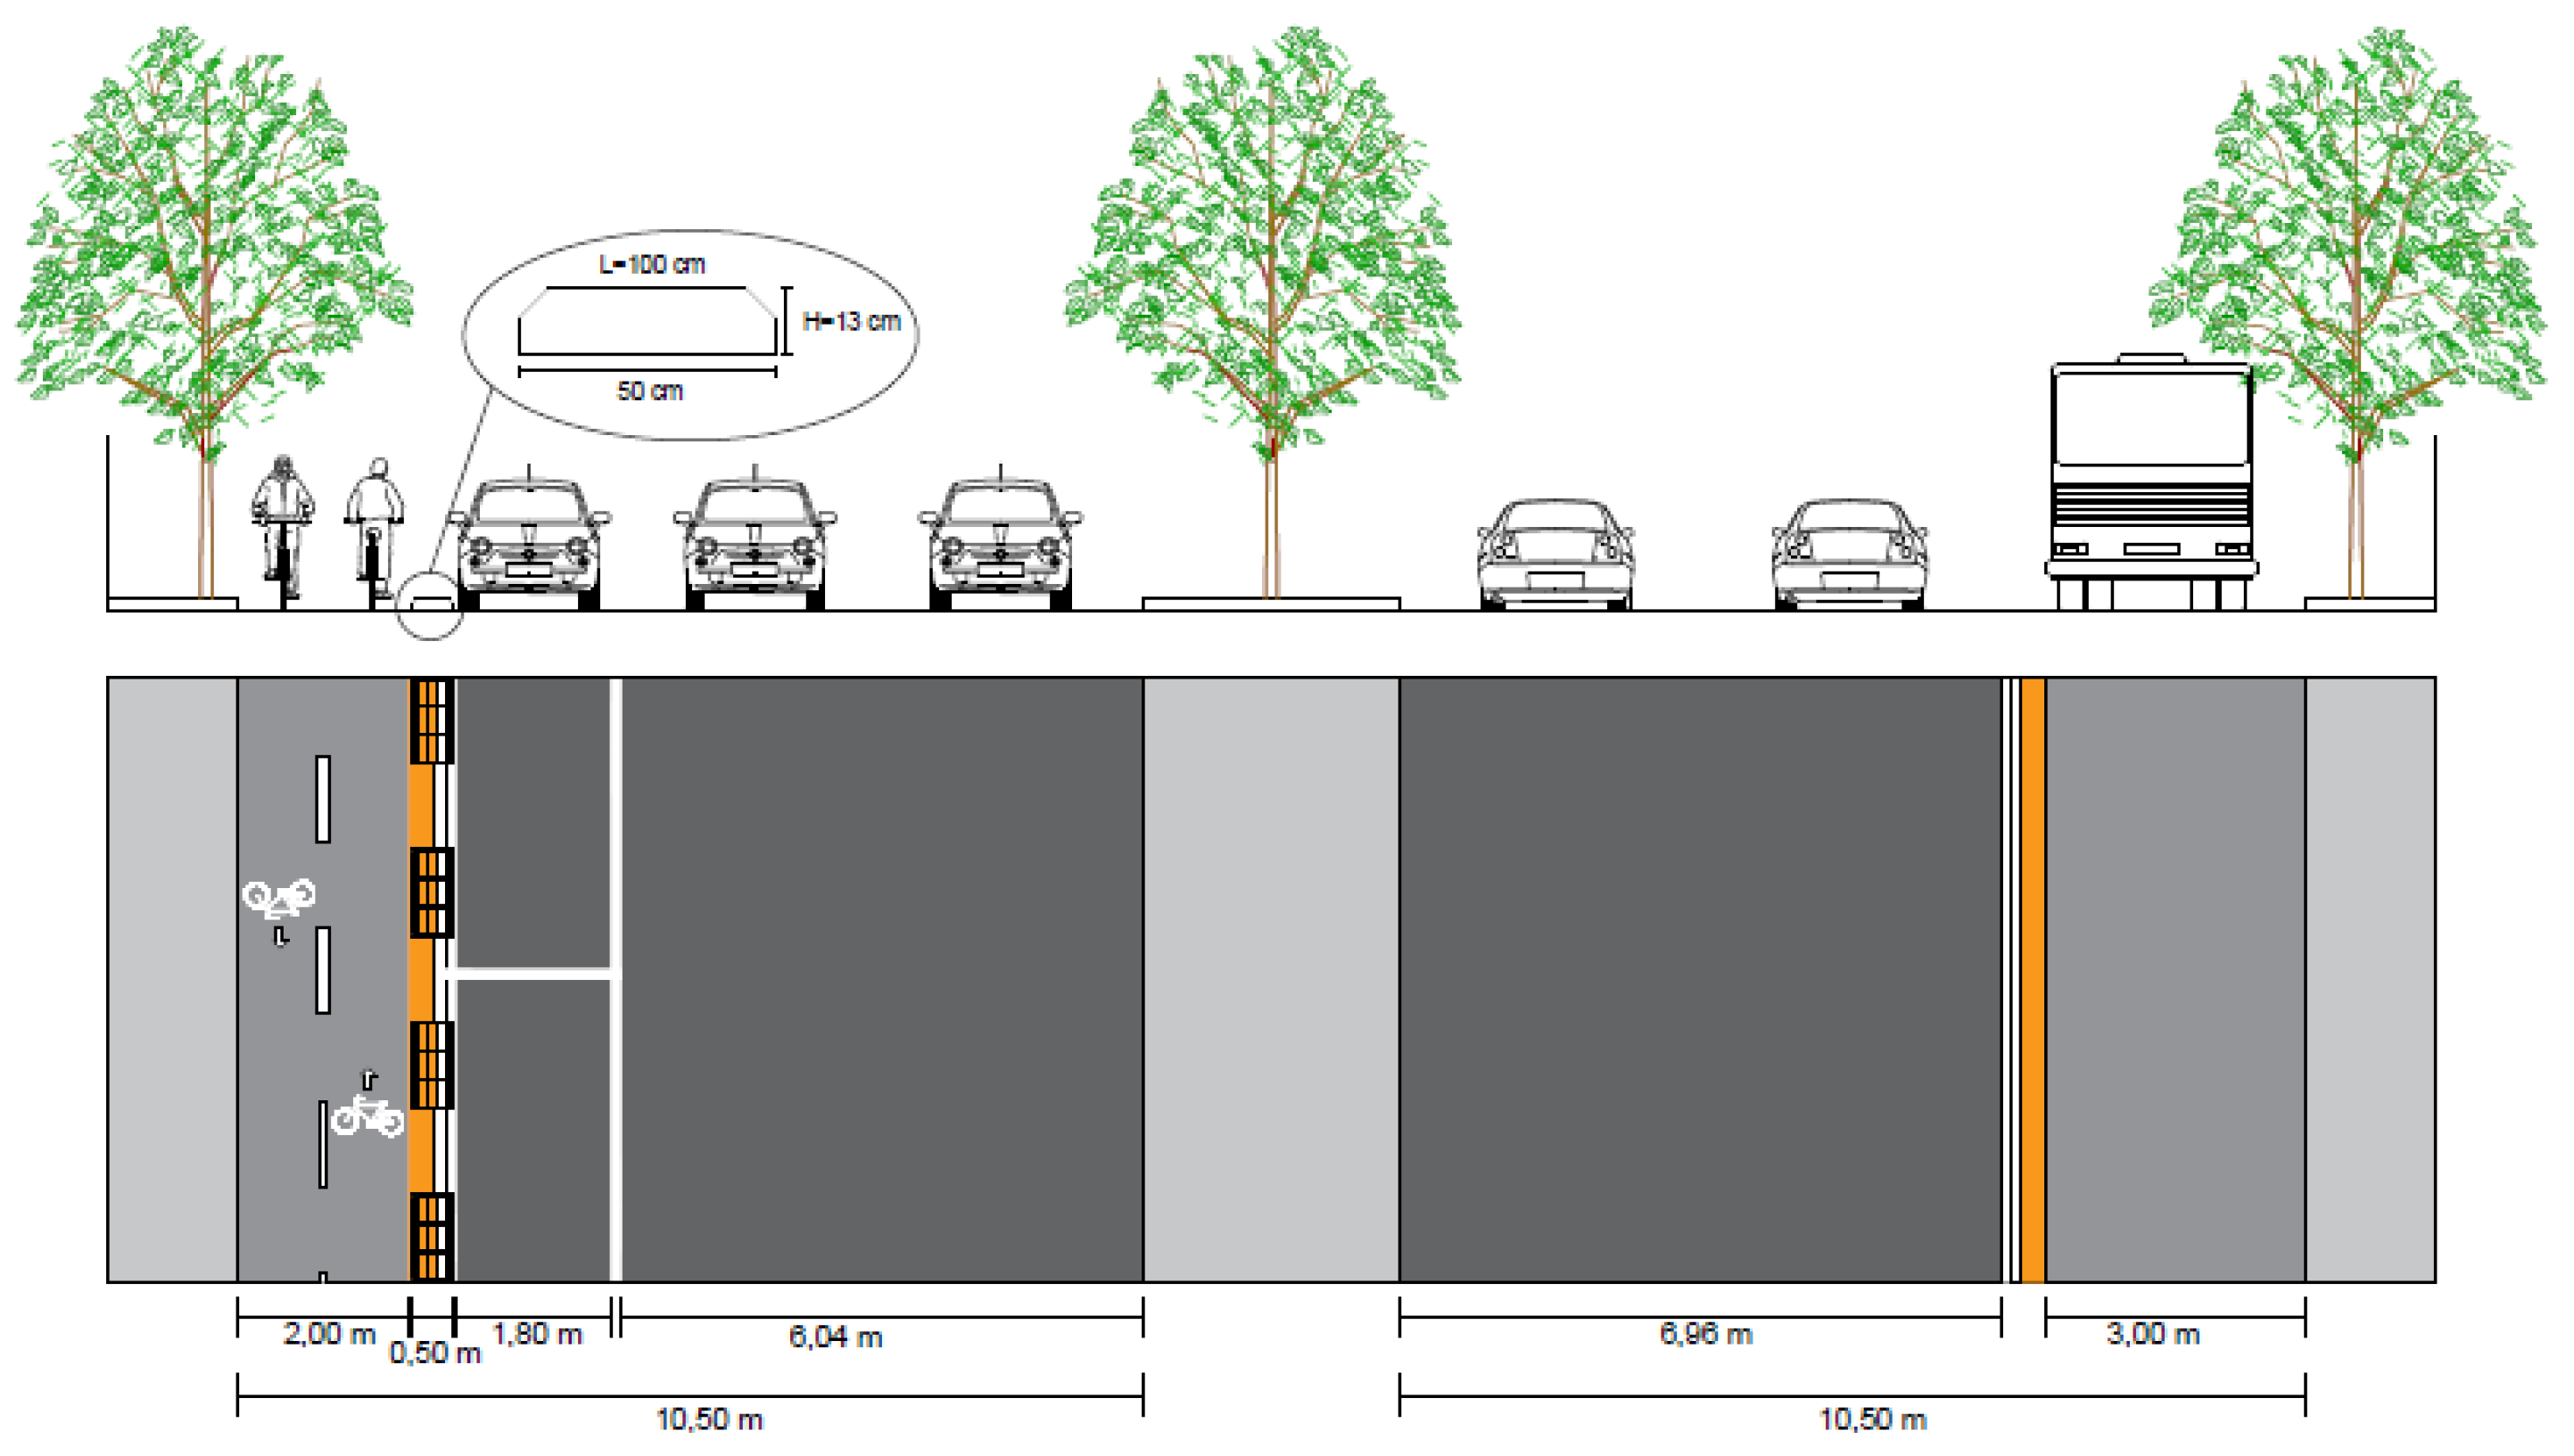
In the first analysis, it was evaluated whether the designed bike lanes inside our study area were built on road axes able to receive those new infrastructures. Therefore, the following parameters have been considered: road width, slope, parking spaces and dangerousness. As can be observed on GIS, all the roads in which bike lanes will be built respect the desired characteristics. They have an adequate width (greater than 10 m), little slope (because of the flatness of Palermo municipality), and there is no need to remove parking places. Moreover, bike paths will be protected and physically separated from motorized traffic by a vertical barrier.
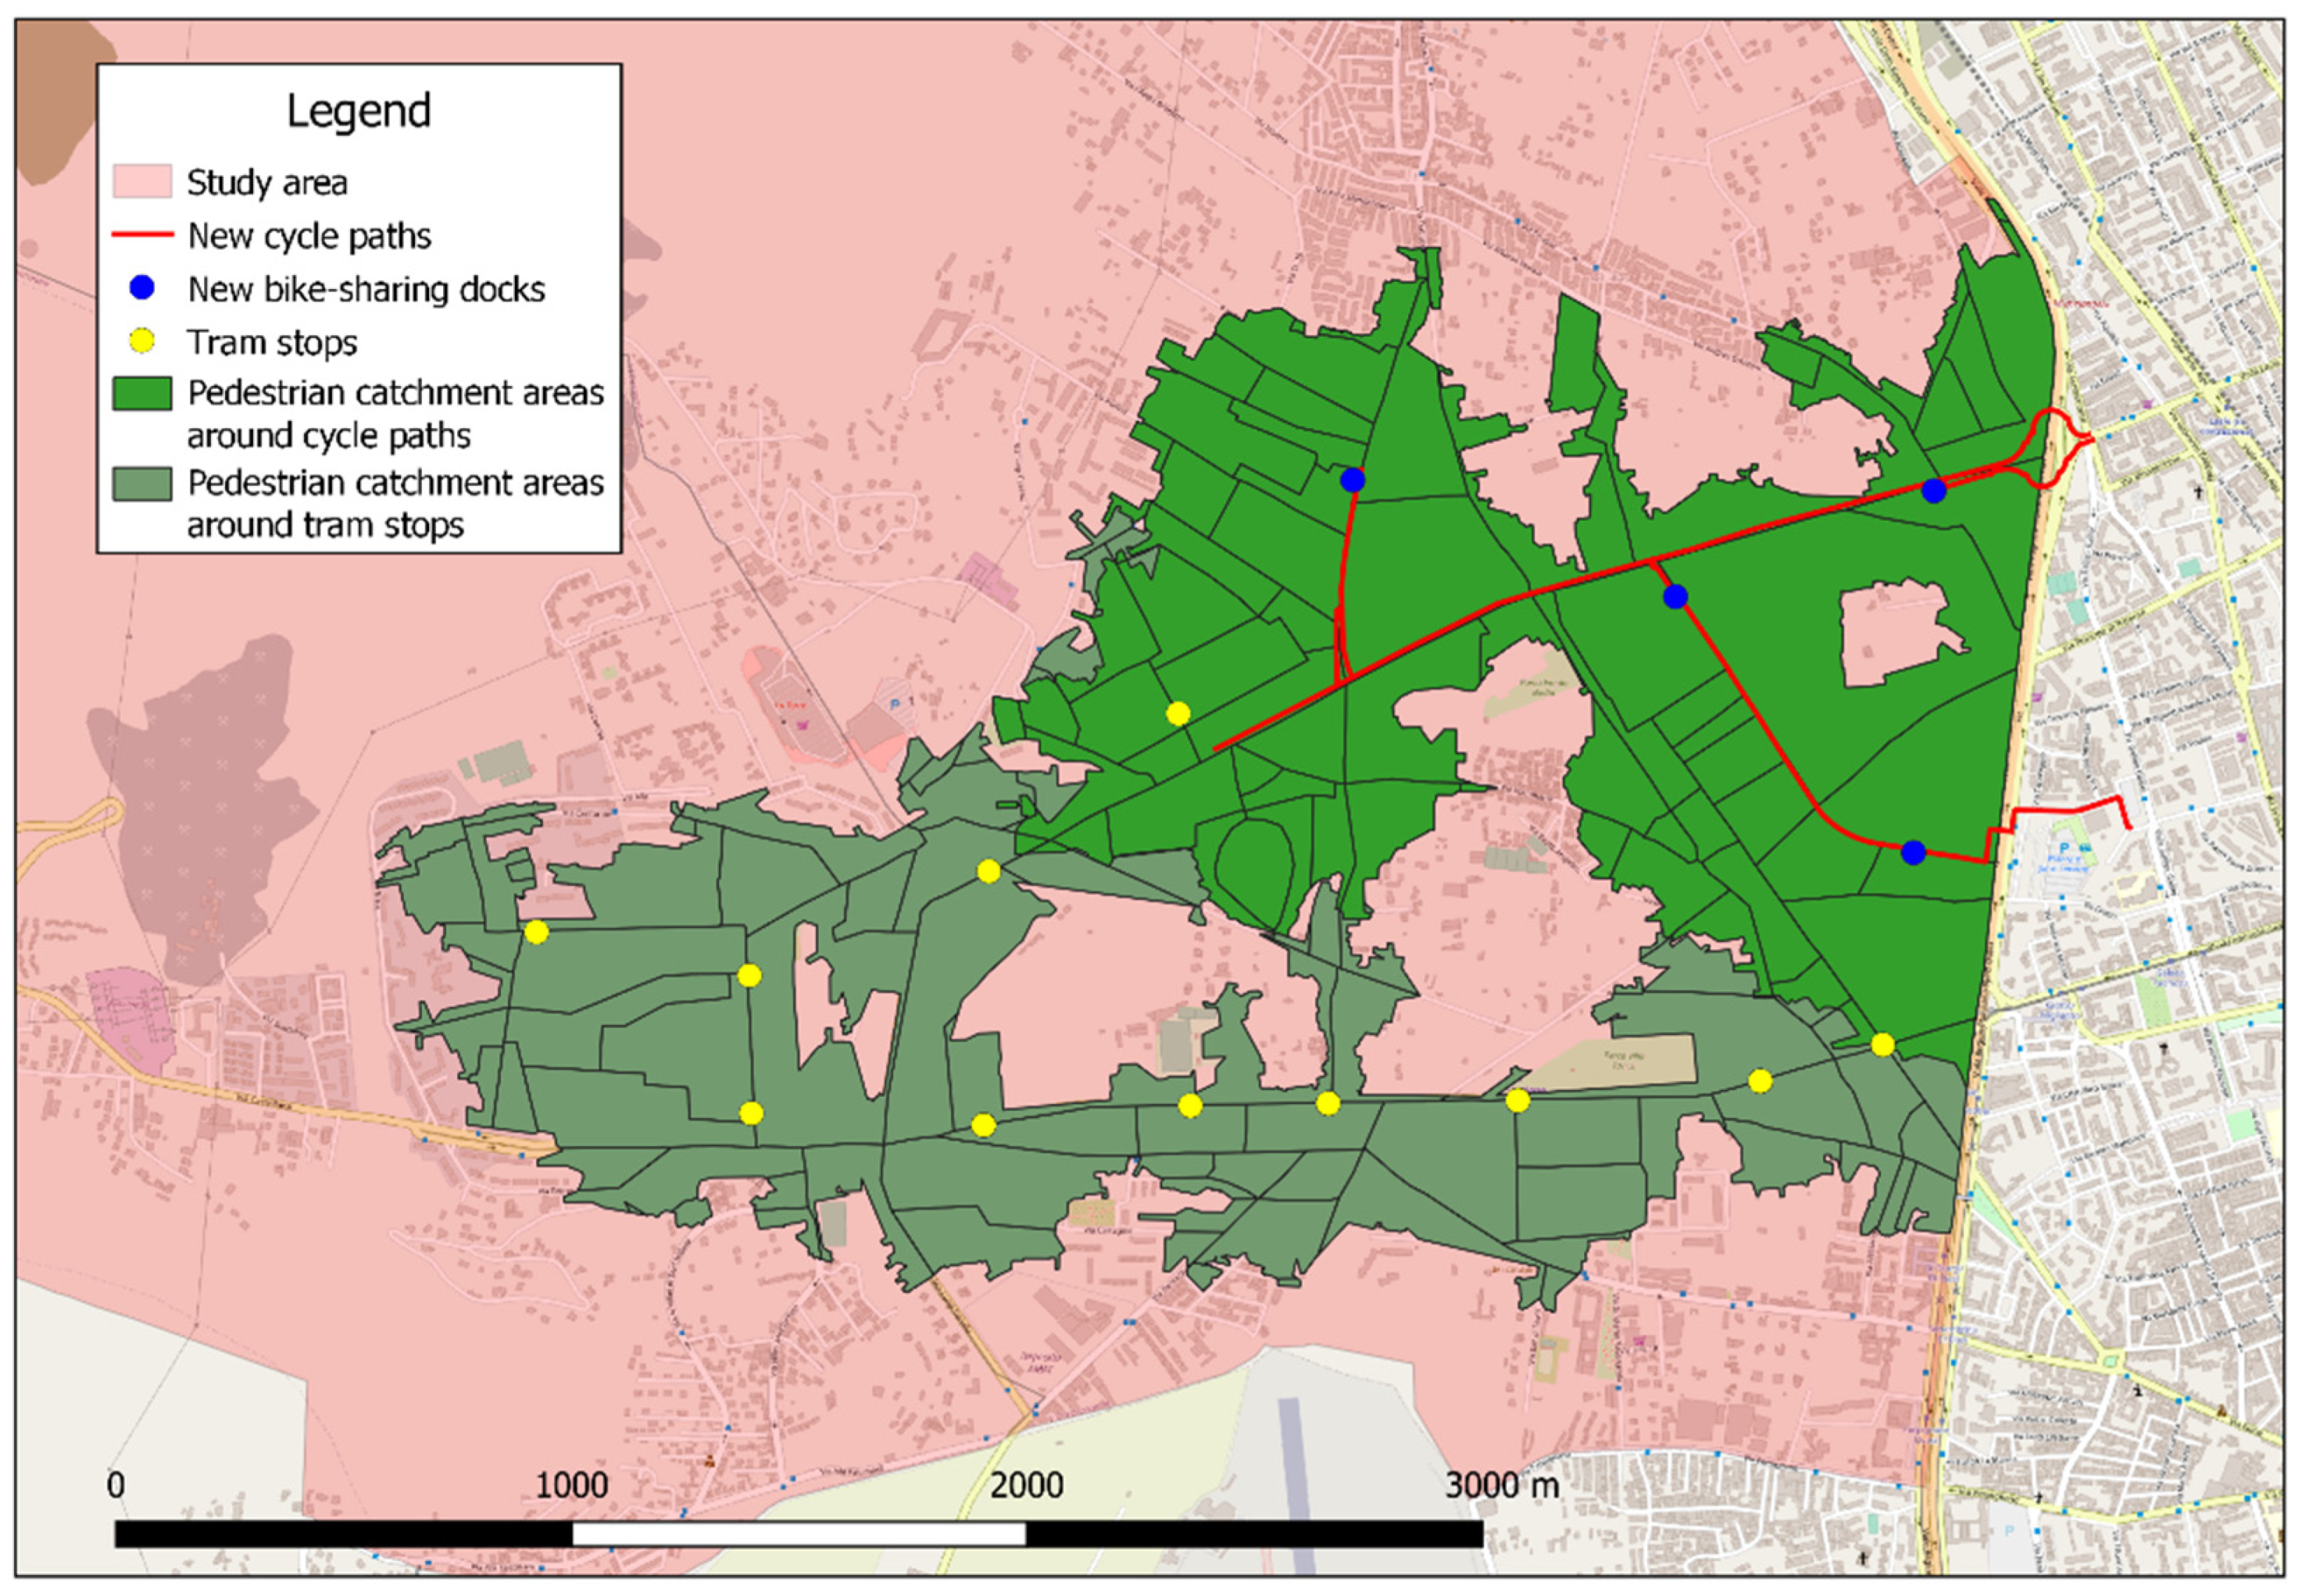
Then, we ran the GIS analysis, creating 500-metre buffers (built on the pedestrian network) around the bike lanes, the new bike-sharing docks, and the tram stops in our study area. The results are shown in
Figure 7.
Through a GIS-based analysis like the one used by D’Orso and Migliore [
33], the spatialization of the population census data (2018) was possible. The percentage of citizens that live within walking distance of the new bike-sharing docks was estimated to evaluate how many residents can potentially use the shared mobility service.
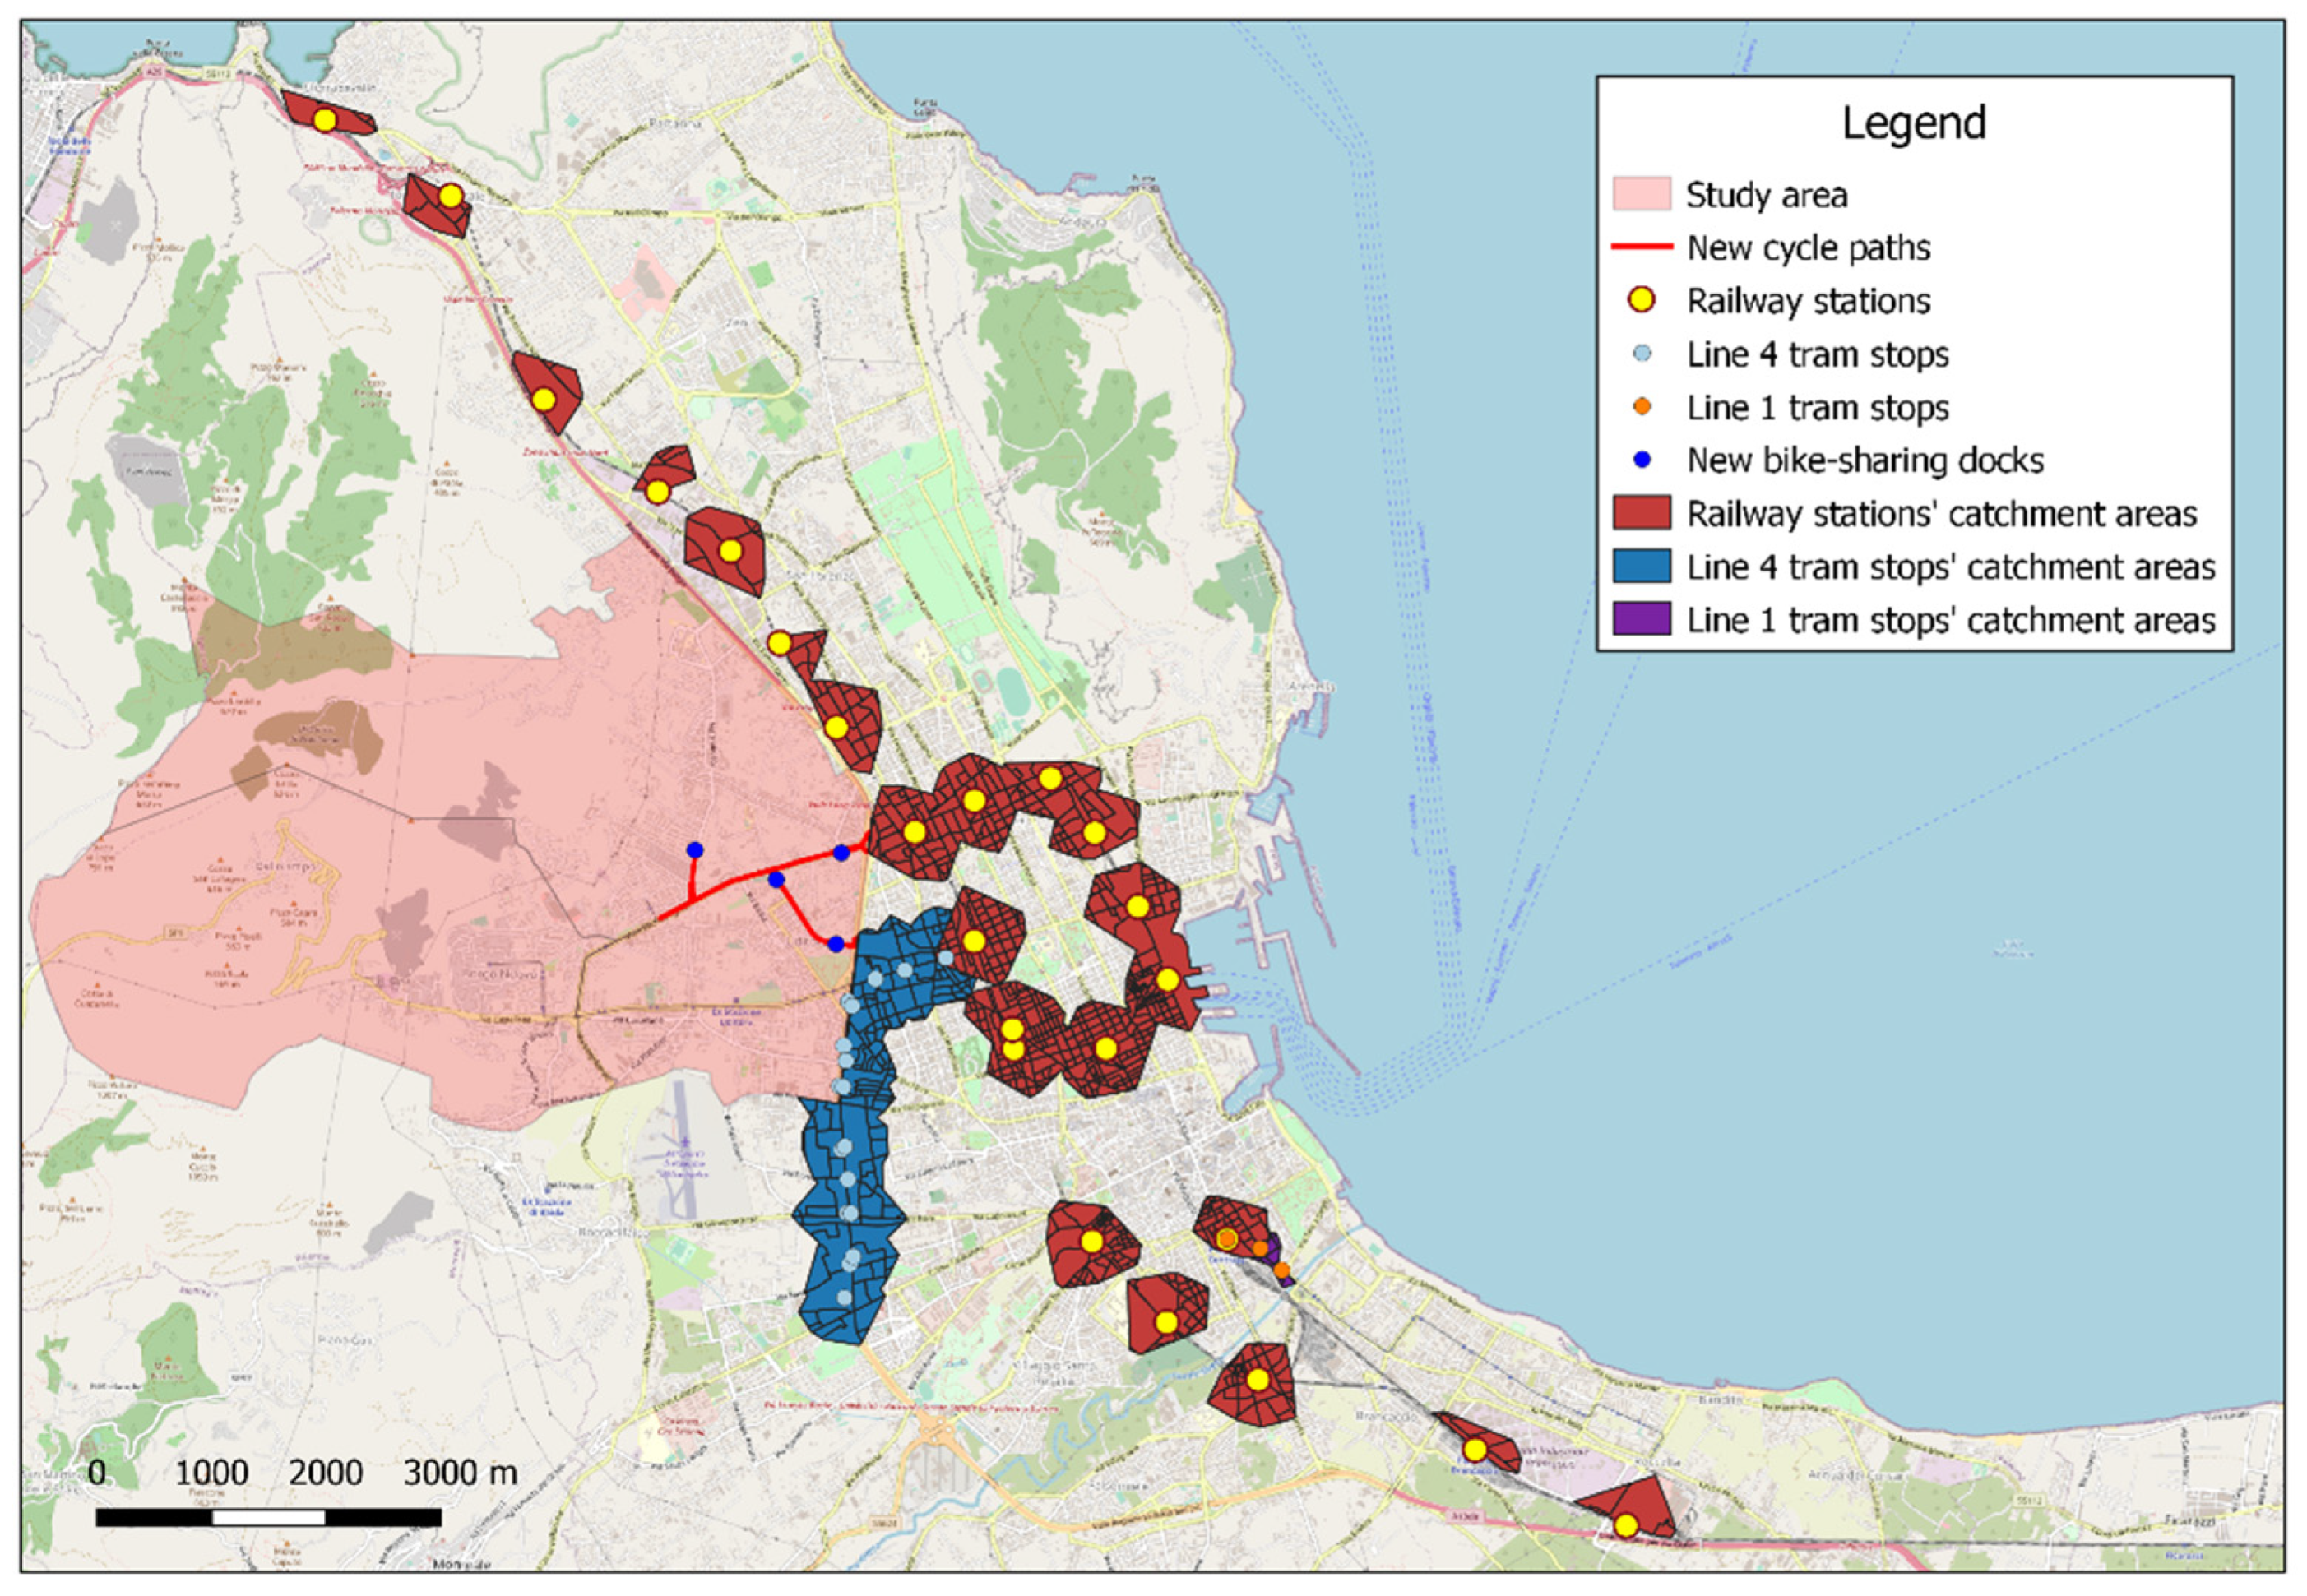
Furthermore, the realisation of cycle paths represents an opportunity not only for bike-sharing users but also for those who have a private bicycle. The cycle paths will be able to safely connect the residents of the three neighbourhoods with the rail transport network (urban rail transit), which is a low-frequency (two trains/h) but very regular service. The new cycle lanes will widen the range of destinations reachable by those who live in the study area in less than an hour and at a low cost (only the cost of train season tickets). Furthermore, tram line 4 can also be easily reached using shared bikes. Therefore, we estimated the potential workplaces reachable by users with multimodal trips, using a combination of bicycles and rail. The physical integration between the bike-sharing system and public transport service is achieved thanks to bike-sharing docks near the railway stations. Moreover, a physical integration between private bikes and rail transport services already exists. In fact, rail commuters can carry their bikes on trains and lock them on racks installed onboard.
The data of the last Census of Industry and Services (2011) was used.
Figure 8 shows the places spatially accessible within 500 m on foot of the tram stops of Line 4, the stations of the Palermo railway line, and the Palermo Rail Ring. We considered all the urban stations envisaged by the projects for doubling the railway line and completing the Rail Ring, including the stations that have not yet been built in 2020.
Results of GIS-Based Analysis
Table 2 shows the percentage of the active population living within 500 m of the new bike-sharing docks and the public transport services with high cumulative frequency.
As can be noted, considering the autonomous and active population, i.e., citizens aged between 15 and 70, 11.6% of the active residents of the three neighbourhoods live within 500 m of the new bike-sharing docks. Despite the small number of cycle docks to be installed, this value is high. This is mainly due to the population density, which is higher in the areas where the cycle docks will be installed compared to other areas of the same neighbourhoods. Indeed, considering trips with private bikes and the new cycle paths, the active population living within 500 m of these cycle routes percentage rises to 26% of the total active population of the study area, more than doubling the previous percentage calculated for the bike-sharing docks only. Furthermore, the new bike-sharing docks and the designed bike paths arise in an area still not served by an efficient public transport service. Considering also citizens who live within 500 m of tram stops, the introduction of bike-sharing stations and bike routes allows serving 48.6% of the active population of the study area. Therefore, almost 50% of the active population of the study area can enjoy transport services that allow them to move quickly to the main transport nodes.
Table 3 summarises the number of workplaces reachable with the integrated transport system (bike-sharing/private bike and railway/tram lines 1 and 4).
The analysis carried out on QGIS shows that 35.7% of the work activities outside the study area are reachable using the railway system or the tram line 4. Therefore, many workplaces and job opportunities will become reachable in less than an hour for the study area residents who decide to use the bicycle to reach the “Palermo Notarbartolo” station.
This feature is an obvious advantage for those who live within the potential catchment area of cycle paths and bike-sharing docks. In fact, the distance between the most distant new bike-sharing docks and the “Palermo Notarbartolo” station is 3.6 km, which can be covered in just 14 min by bicycle, assuming an average speed of 15 km/h. This time falls within the free half-hour usage time; therefore, the only cost to be addressed will be the train season ticket. It also underlines the possible competitiveness of cycling and bike-sharing compared to the tram system because there is no fare integration between trams and trains.
5. A Further Analysis on High School Students
It was evaluated whether the bike-sharing system and new cycle paths could significantly affect the mode choice of a particular category of users, i.e., the high school students, whose mobility habits were known thanks to a stated-preference survey carried out within the Go2School project throughout 2019. In particular, this survey was conducted among the students of four high schools in Palermo. One of these schools is the Einstein High School, whose location is represented in
Figure 9.
An online questionnaire was submitted to the students to be completed in the computer lab during school hours. Students’ mobility habits and propensity to use bike-sharing following the realization of the new cycle paths and bike-sharing docks were investigated. The structure of the questionnaire and the survey results for the four schools were widely discussed by D’Orso et al. [
34] and D’Orso and Migliore [
35]. Thanks to the answers to the questionnaire, it was possible to calibrate a mode choice model—a multinomial logit model—and estimate the modal shift that students will make in the future.
Here, the results of the calibration (shown in
Table 4) and the utility formulas for the different modes of transport considered by D’Orso et al. are summarised [
34].
The variable “Time” is the travel time spent from the origin to the destination. The attributes “ASCbike” and “ASCmotorcycle” are the alternative specific constants for the bicycle and the motorcycle. “Cycle Infrastructure” is the variable relating to the construction of the new cycle path along the Origin–Destination travel. The variables “Agemotorcycle” and “Agecar” are the age of the respondents for respectively the motorcycle and the car alternatives. Lastly, “Genderbike” and “Gendercar” are binary variables related to the gender of the respondents for the bicycle alternative and the car alternative (0 for males and 1 for females).
The number of Einstein students who answered the survey and living in the study area was quantified (66) in order to evaluate the effects that the new cycle paths and bike-sharing docks can exert on the mobility of the residents of the study area and in particular on high school students. Among these, five experimental observations were discarded because these students provided contradictory answers; therefore, the number of Origin–Destination pairs considered, in which the destination was the Einstein High School, was 61. The modal shares for the modes of transport considered (walking, cycling, motorcycle, car as passenger, and public transport) were obtained thanks to the calibration and the application of a mode choice model.
Results of the Calibrated Mode Choice Model
Table 5 shows the mobility habits declared by the students and the future modal shares predicted by the model.
Thanks to the construction of cycle paths and bike-sharing stations, the percentage of students who cycle using their own bicycles or the bike-sharing system increases from 1.5% to 10.1%. There is a sharp modal shift from walking and private vehicles to cycling. In particular, the usage of the car as a passenger drops from 21% to 15.7%. There is also an increase in public transport, which grows from 44.6% to 50%; this increase is due to the fact that multimodal trips, using a combination of public transport (trams and buses) and bicycles, are included in public transport modal share. Therefore, the increase in the use of the bicycle also affects the increase in the use of public transport.
Therefore, the introduction of the new cycle paths and the bike-sharing system in the study area leads to an increase in the number of students who will use the bike or a modal combination between the bicycle and public transport to make their home-to-school trips.
6. Discussion and Conclusions
As highlighted, the use of GIS shows great potential in assessing the attractiveness of the new cycling infrastructures and their combination with public transport systems (railway and tram). As presented in Chapter 4, the analysis run on the GIS environment let us determine not only the potential mobility demand around the new cycle paths, the designed bike-sharing docks and the actual tram stops, but also the workplaces reachable in a given period of time (put equal to 60 min). The latter result can explain how the multimodality between bikes and railway systems can motivate users to get rid of their private cars and adopt more healthy and sustainable mobility.
Therefore, the realisation of a bike-sharing system and new safe cycle routes can increase the potential mobility demand in the suburbs where low-frequency and not very regular public transport services are present, providing a better connection of these neighbourhoods to the city centre and one of the most important public transport nodes. However, to date, the COVID-19 pandemic has slowed the growth of multimodal mobility; a large portion of the population associates transit with medium to extremely high exposure risks, opting to use other modes perceived as safer alternatives, such as walking, biking, and using scooters and private cars [
36,
37]. Nevertheless, policymakers are hugely encouraging the use of bicycles in this period affected by the COVID-19 pandemic. This promotion is due to the lower risk of contagion that cycling guarantees users because it can allow users to avoid crowded public transport vehicles, where the spread of the virus would be easier.
The paper presents the discussion of a case study. A large urban area of Palermo was analysed, which groups together three residential suburbs. The analysis confirms that users could benefit from a clear improvement in the accessibility to railway stations by introducing the bike-sharing service and safe cycle paths in the area. In this way, users can enjoy high-regularity service. In fact, users can reduce travel times by taking advantage of a possible combination of the bicycle with the rail system. This reduction will allow the community to quickly reach different urban areas, which were previously difficult to get to in a short time and at a low cost. Furthermore, in the next few years, two additional railway stations (“Lazio” station—the closest to the context analysed—and “Belgio” station) will be built. These new railway stations will further bring the residents of this peripheral area closer to rail transport. Moreover, fare integration between bike-sharing service and rail transport system could be provided through mobility bundles to promote multimodal trips and encourage people to use the bike-sharing service even more. Our findings also highlight that, especially during the COVID-19 pandemic, municipalities could conveniently finance the introduction of new safe cycle paths and the promotion of the integration between rail transport system and bike-sharing service instead of subsidising low-frequency bus lines in peripheral areas. In fact, the promotion of bicycles as a feeder system to urban rail transport service instead of crowded bus helps to pursue the goals of safety and financial sustainability of the urban public transportation system.
To verify how much the introduction of bike-sharing and the improvement of cycle mobility with new safe bike lanes in the area will affect the lives of residents, we decided to interview students from a high school which has a large number of students and which is not very far from the study area. It has been seen that many students living in the study area are likely to use public bicycles or their own bike when the cycle paths and the bike-sharing service are introduced. After the calibration, the model estimated that there will be an increase in the use of the bicycle and public transport; the latter is also enhanced by the possibility of carrying out multimodal trips, parking the shared bikes at the nearest bike-sharing dock or carrying their own bike on board. It was also found that females are less likely to cycle than males, preferring to be accompanied by car. This result is in line with scientific literature about gender differences in attitudes towards cycling: Lidbe et al. [
38] found that the propensity to cycle for home-to-school trips is greater for male students than for female ones. This result could be justified since women show higher discomfort and report higher perception risk than men [
39]. Moreover, our findings on cycling as a feeder mode alternative are in accordance with Ji et al. [
40]. In fact, they observed that rail commuters making school-related trips were more likely to use public bicycles to access rail transit, except for females, who were less willing to cycle to access rail transit.
Students’ propensity to use this sustainable mobility system will need to be verified through surveys based on real data as soon as the system is launched. SP surveys, in fact, in contrast to RP (Revealed Preference) surveys, are based on hypothetical scenarios. The actual attitude towards adopting such a service will depend on the difference between the hypothetical scenario submitted to the respondents and the real future scenario.
Further studies involving different categories of users will be carried out. In fact, young people are generally more likely to use bicycles. Further studies will need to determine whether people belonging to other age groups will show the same propensity for bike-sharing and cycle mobility. Moreover, future works will also explore whether people with low income and low education level will consider the service an effective and convenient alternative mode of transportation.


