Article

Detecting Urban Events by Considering Long Temporal Dependency of Sentiment Strength in Geotagged Social Media Data

1
School of Geography and Tourism, Anhui Normal University, Wuhu 241003, China
2
Engineering Technology Research Center of Resource Environment and GIS, Wuhu 241003, China
3
Key Laboratory of Virtual Geographic Environment, Nanjing Normal University, Nanjing 210023, China
4
State Key Laboratory of Information Engineering in Surveying, Mapping and Remote Sensing, Wuhan University, Wuhan 430079, China
5
Collaborative Innovation Center of Geospatial Technology, Wuhan 430079, China
6
Faculty of Geomatics, East China University of Technology, Nanchang 330013, China
*
Author to whom correspondence should be addressed.
ISPRS Int. J. Geo-Inf. 2021, 10(5), 322; https://0-doi-org.brum.beds.ac.uk/10.3390/ijgi10050322
Submission received: 7 April 2021 / Revised: 2 May 2021 / Accepted: 6 May 2021 / Published: 10 May 2021
(This article belongs to the Special Issue Geovisualization and Social Media)

Abstract

:
The development of location-based services facilitates the use of location data for detecting urban events. Currently, most studies based on location data model the pattern of an urban dynamic and then extract the anomalies, which deviate significantly from the pattern as urban events. However, few studies have considered the long temporal dependency of sentiment strength in geotagged social media data, and thus it is difficult to further improve the reliability of detection results. In this paper, we combined a sentiment analysis method and long short-term memory neural network for detecting urban events with geotagged social media data. We first applied a dictionary-based method to evaluate the positive and negative sentiment strength. Based on long short-term memory neural network, the long temporal dependency of sentiment strength in geotagged social media data was constructed. By considering the long temporal dependency, daily positive and negative sentiment strength are predicted. We extracted anomalies that deviated significantly from the prediction as urban events. For each event, event-related information was obtained by analyzing social media texts. Our results indicate that the proposed approach is a cost-effective way to detect urban events, such as festivals, COVID-19-related events and traffic jams. In addition, compared to existing methods, we found that accounting for a long temporal dependency of sentiment strength can significantly improve the reliability of event detection.

1. Introduction

Urban events occur more frequently with the rapid development of a city. There are different types of urban events, such as local festivals, natural disasters, terrorist acts, or disease outbreaks [1,2]. Some events may cause inconvenience, or even worse, physical threats to the people in the city [3]. Urban event detection can provide detailed information regarding events for devising more effective response strategies. Therefore, detecting urban events is a major concern for intelligent governance and is of great significance for the sustainable development of cities and society [4,5], especially in the context of epidemic transmission.
The appearance of big location data (such as mobile phone location data, taxi trajectory data, and geotagged social media data) offers great new opportunities for detecting urban events [6,7,8]. In most event detection studies, urban events refer to anomalies that deviate significantly from the prediction [5,9]. The long-term location data are historic records and can reflect peoples’ spatiotemporal behavior and attention. The volume of location data in a spatial area will follow temporal patterns, such as deterministic trend and periodicity, when no event happens [1]. As soon as some events come out within this spatial area, collective attention is attracted or the crowd gathered. These events will cause the explosive growth of location data. Compared with the volume of location data, analyzing the dynamic of positive and negative sentiment strength in social media data may increase the reliability of event detection [10]. For example, in the context of COVID-19 (Corona Virus Disease 2019) transmission, a confirmed case of COVID-19 is a local event and causes panic to the people who live close to this case. These people will express their sentiment on social media platforms, and then the negative sentiment in social media data will significantly increase. Therefore, the abnormal sentiment strength can be detected as possible urban events.
Numerous methods based on social media data exist for modeling patterns of urban dynamics and extracting urban events [11,12]. These methods include term-interestingness-based approaches, topic-modelling-based approaches and incremental-clustering-based approaches [13,14]. Previous studies have applied these methods to effectively detect several urban events such as crowd gatherings [9], the examination of traffic anomalies [15], and the detection of responses to natural disasters [5,16]. However, existing detection methods cannot capture the long temporal dependency of sentiment strength in location data, so it is difficult to further improve the reliability of detection results. Here, long temporal dependency refers to the relationship between sentiment strengths in different time steps that are far apart. Accounting for long temporal dependencies of positive and negative sentiment strength in geotagged social media data is very important for modeling urban dynamics and detecting urban events [17].
In this paper, we proposed an improved method for detecting urban events by combining a sentiment analysis method and the long short-term memory (LSTM) neural network, a special type of recurrent neural network (RNN). The positive and negative sentiment strength of social media users were evaluated by applying a dictionary-based method. Then, the study area was divided into regular grids. For each spatial grid, temporal sequences were extracted using statistics on the daily positive and negative sentiment strength in geotagged social media data. The sequences were inputted into LSTM to address the long temporal dependency between sentiment strength in different time steps [18]. Considering long temporal dependency, the daily positive and negative sentiment strengths in each grid were predicted, and the prediction results were treated as deterministic components. Finally, anomalies were extracted as urban events, and event-related information was obtained by exploring social media texts. In this case, we collected geotagged data from Sina Weibo, one of the largest social media platforms in China, for 31 months in Beijing to detect urban events. Our results demonstrate that the proposed approach is a cost-effective method for detecting urban events, such as festivals, colloquia and COVID-19-related events. In addition, we found that accounting for long temporal dependency can significantly improve the reliability of event detection compared with existing methods.

2. Background

2.1. Urban Events Detection Method

A variety of methods for detecting urban events from location data have been extensively discussed, such as spatiotemporal clustering, traditional RNN, the seasonal-trend decomposition procedure based on loess smoothing (STL), and the autoregressive integrated moving average model (ARIMA). Spatiotemporal clustering methods were developed from density-based clustering. These methods extract clusters of location data as spatiotemporal anomalies or urban events [9,19,20]. Tao and Thomas [9] proposed a new method for identifying clusters within a social media dataset in London across both space and time. Their results revealed that the significant spatiotemporal clusters were strongly related to urban events. Kong et al. [19] applied a spatiotemporal clustering algorithm for detecting urban events from geotagged Twitter data in Mexico. Based on the clustering results, outbreaks of civil unrest could be located, and the spatial distribution patterns of these events could be captured. Spatiotemporal clustering methods can fuse the temporal attribution and the spatial attribution of location data in an effective way. However, these methods assume that the spatiotemporal distribution of location data is nearly uniform. Their detection results are not reliable when the location data is unevenly distributed.
STL and ARIMA, two traditional statistical models, are widely applied in studies of urban event detection [1,9,21]. STL is a nonparametric regression model which considers a time series as the sum of a trend component, a seasonal component, and a remainder [22]. Based on STL, Xi and Guo [1] decomposed time series for given locations into deterministic and residual components. They extracted events from residual components and mapped urban events at different temporal resolutions. ARIMA is a statistical analysis model which can predict future trends in time series data [23]. This model can adequately represent the underlying process that originally generated the time series [23]. Bianco et al. [21] estimated ARIMA model parameters by data fitting and then applied the estimation model to identify anomalies from long-term location data. Traditional statistical models have proven to be effective in detecting urban events in some cases. However, these models have some prior assumptions regarding input variables and are very sensitive to the missing and noisy data [24,25].
Traditional RNN is a class of powerful deep neural networks that use internal memory units with loops to manage spatiotemporal sequence data [26,27]. Traditional RNN is suitable for capturing the temporal and spatial evolution of location data and can detect spatiotemporal anomalies [28,29]. Hawkins et al. [29] applied RNN in different multivariate databases to measure the “outlyingness” of data records. Their studies demonstrated the effectiveness of RNN for outlier detection in some publicly available databases. Williams et al. [28] compared RNN with some traditional statistical models and revealed that RNN has a better performance in event detection. Traditional RNN exhibits a superior ability to process missing and noisy data [26]. However, owing to the vanishing gradient and exploding gradient problems, traditional RNN is not able to construct long temporal dependencies among location data.
Temporal dependency refers to the correlation between time step t and n historical time steps. Based on the correlation, the value in time step t can be predicted by using the values from historical time step t–n to time step t–1. The value of time lag n determines the type of temporal dependency. Based on previous studies, the traditional RNN with more than 5 time lags has proven to be difficult to train [18]. Therefore, the correlation between different time steps can be considered as the long temporal dependency when n is more than 5 [30]. The long temporal dependency can exist in many types of long time-series data, such as traffic speed data [30], trajectory data [31] and geotagged social media data [32].
To date, no existing method has considered how to capture the long temporal dependency of sentiment strength in big location data for improving the reliability of event detection. Our research addresses this problem and provides a practical solution.

2.2. Event Detection Studies Based on Social Media Data

With the development of mobile communication equipment, social media services have been widely used by urban residents. A large number of social media users can be considered as “social sensors” with the ability to generate social media data [14,33]. These data can reflect the complex relationship between users in the virtual space and the spatiotemporal behavior of users in the real space. Compared with other types of big location data, such as taxi trajectory data and mobile phone location data, geotagged social media data is more suitable for analyzing the dynamics, events, and spatiotemporal trends of the urban social landscape [32,34]. By predicting the deterministic trend of the volume of social media data, the abnormal volume that deviates significantly from the prediction can be identified as possible urban events. Social media texts can reflect event-related information. Based on the text analysis, we can obtain detailed information for each event and identify the types of events.
Nowadays, the methods of detecting events based on social media data can be broadly classified into three categories: term-interestingness-based approaches, topic-modelling-based approaches and incremental-clustering-based approaches [12]. Term-interestingness-based approaches rely on tracking the terms (from the social media data stream) likely to be related to an event. These approaches mainly include the methods taken to determine term interestingness, clustering techniques used to group the tweets related to an event and the techniques employed to rank the events that were detected by an event detection system [35]. Based on the term-interestingness-based approach, Li et al. [36] extracted continuous and non-overlapping words from each tweet. By using the frequency pattern of words related to events and a newsworthiness score, urban events can be detected. Marcus et al. [37] developed an event detection method that applied event-related keywords to track an event. Their method started logging tweets that match the user-specified keywords and detected spikes in tweet data as sub-events.
Topic-modelling-based approaches are dependent on the probabilistic topic models to detect urban events by identifying latent topics from the social media data stream [38]. The topic-modelling-based approaches generate a probability distribution over different topics to detect semantic structures as urban events by exploring the texts of social media data. The sophisticated model for inferring latent topics is the core of these approaches. Ritter et al. [39] constructed a structured representation of urban events extracted from social media data by applying an open-domain calendar for important events. Their study adopted a latent variable model to discover the types of hidden urban events [39]. You et al. [40] proposed the General and Event-related Aspects Model which was developed based on a hierarchical Bayesian model and Latent Dirichlet allocation. The proposed model can extract the time, locations and entities of urban events, effectively [40].
The incremental-clustering-based approaches mainly include the methods taken to determine the term weights to generate a tweet vector, methods applied along with the incremental clustering to group event-related tweets, and the techniques employed to rank events that were detected by an event detection system [41,42]. By using incremental-clustering-based approaches, Hasan et al. [43] detected urban events with two steps. They first captured a burst in the volume of social media data related to target events. Then, the social media data which discussed the same event were clustered [43]. Petrovic et al. [44] developed a First Story Detection (FSD) system based on an adapted variant of the locality sensitive hashing technique. This system provided a cost-effective way to identify the novelty of the social media data which can be considered as a newly created cluster. By exploring the texts of the cluster, the information of the significant events can be obtained.
In recent years, some studies focused on detecting events by analyzing the dynamic of sentiment strength in social media data [45,46,47,48]. Salas et al. [49] classified the texts of traffic-related tweets into positive, negative, or neutral. Based on the analysis of the spatiotemporal pattern of sentiment strength, they can identify traffic congestions. Zou et al. [50] proposed a new model which utilizes sentiment analysis for Chinese bursty event detection. Their study can detect bursty events with higher accuracy in a shorter time. Yu et al. [51] explored the daily sentiment distribution of news and public opinion on Weibo that refers to the keyword COVID-19. By analyzing the sentiment trend of Weibo, the events related to COVID-19 can be detected effectively. To date, no existing method has considered how to capture the long temporal dependency of sentiment strength in social media data. Therefore, it may be difficult to improve the reliability of detection results much further.

2.3. Sina Weibo

Sina Weibo is one of the largest social media platforms in China. As the “Chinese Twitter,” Sina Weibo is very popular among Chinese people, especially young people. By 31 March 2018, the active users of Sina Weibo reached 411 million monthly. The Sina Weibo platform allows users to update brief content called “microblogs” or “Weibos” in the form of short sentences, individual images, web page links, or video links. In addition, the Sina Weibo platform also provides a set of application programming interfaces (APIs) to meet different demands for data collection from third parties. For example, the API “statuses/user_timeline” and the API “place/nearby_timeline” can be used to collect microblogs posted by specific users and microblogs within specific spatial areas, respectively. In this study, based on Sina Weibo APIs, we obtained geotagged Sina Weibo data and applied these data for urban event detection.

3. Study Area and Data
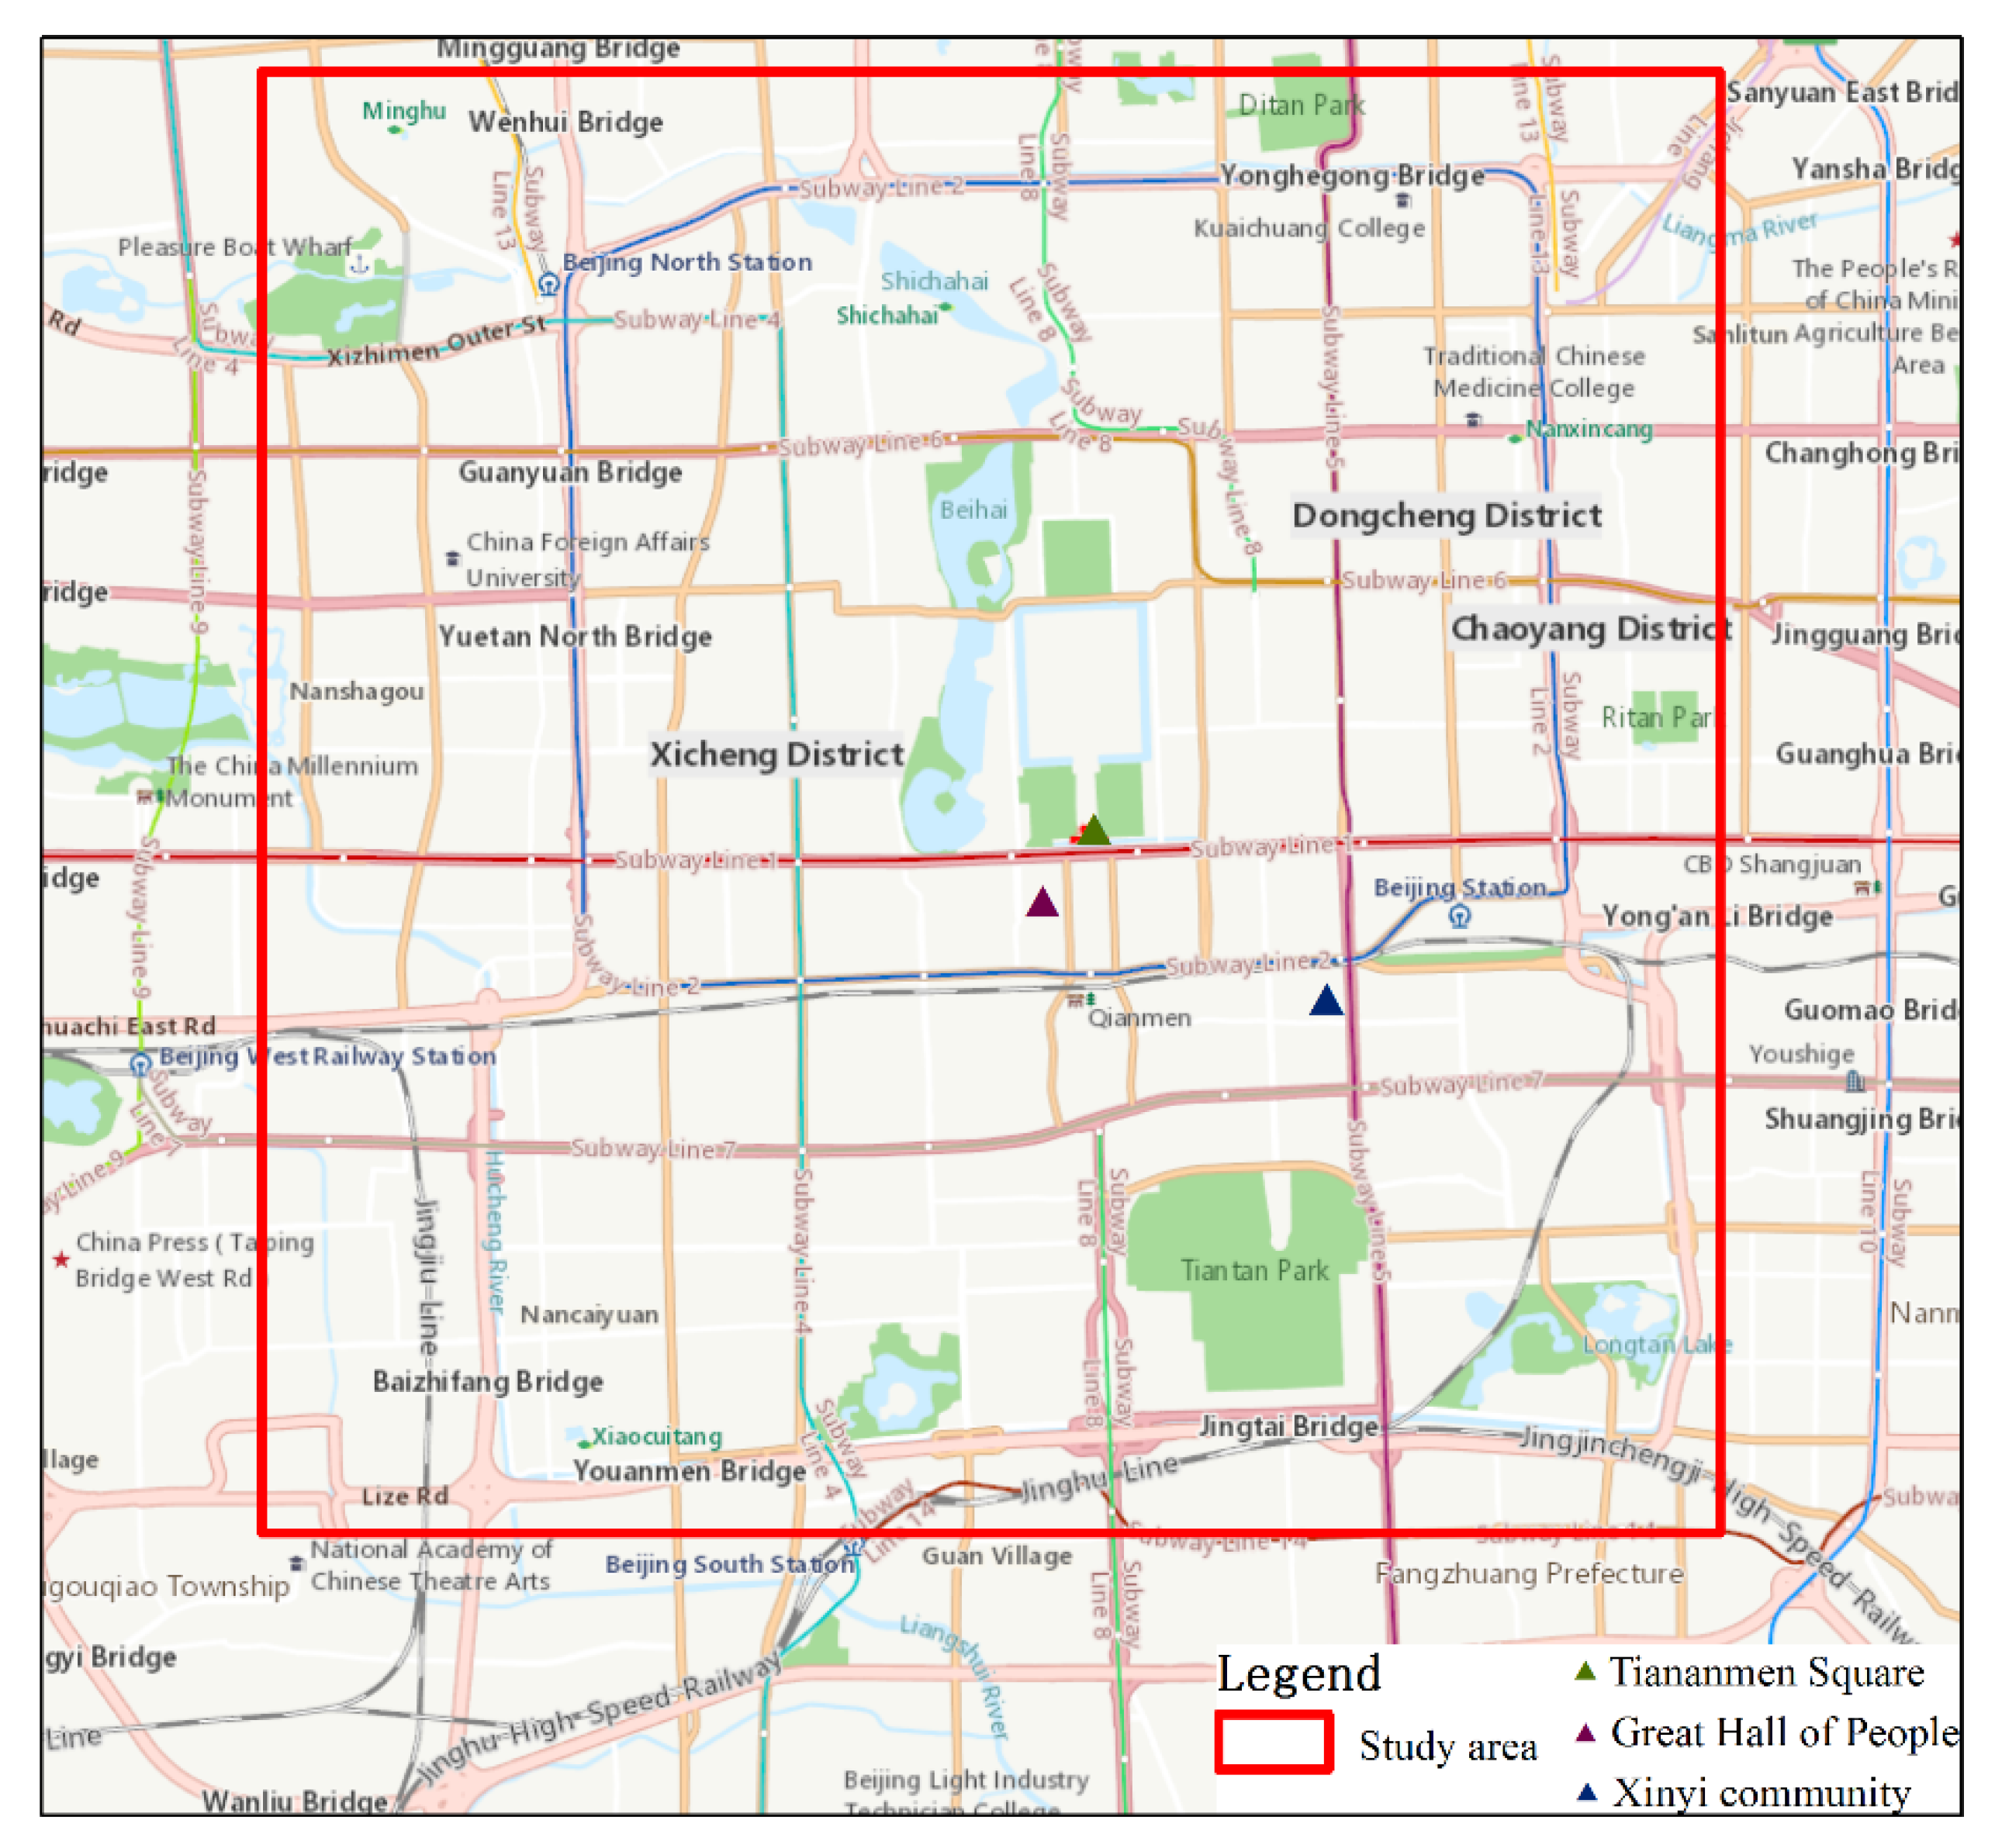
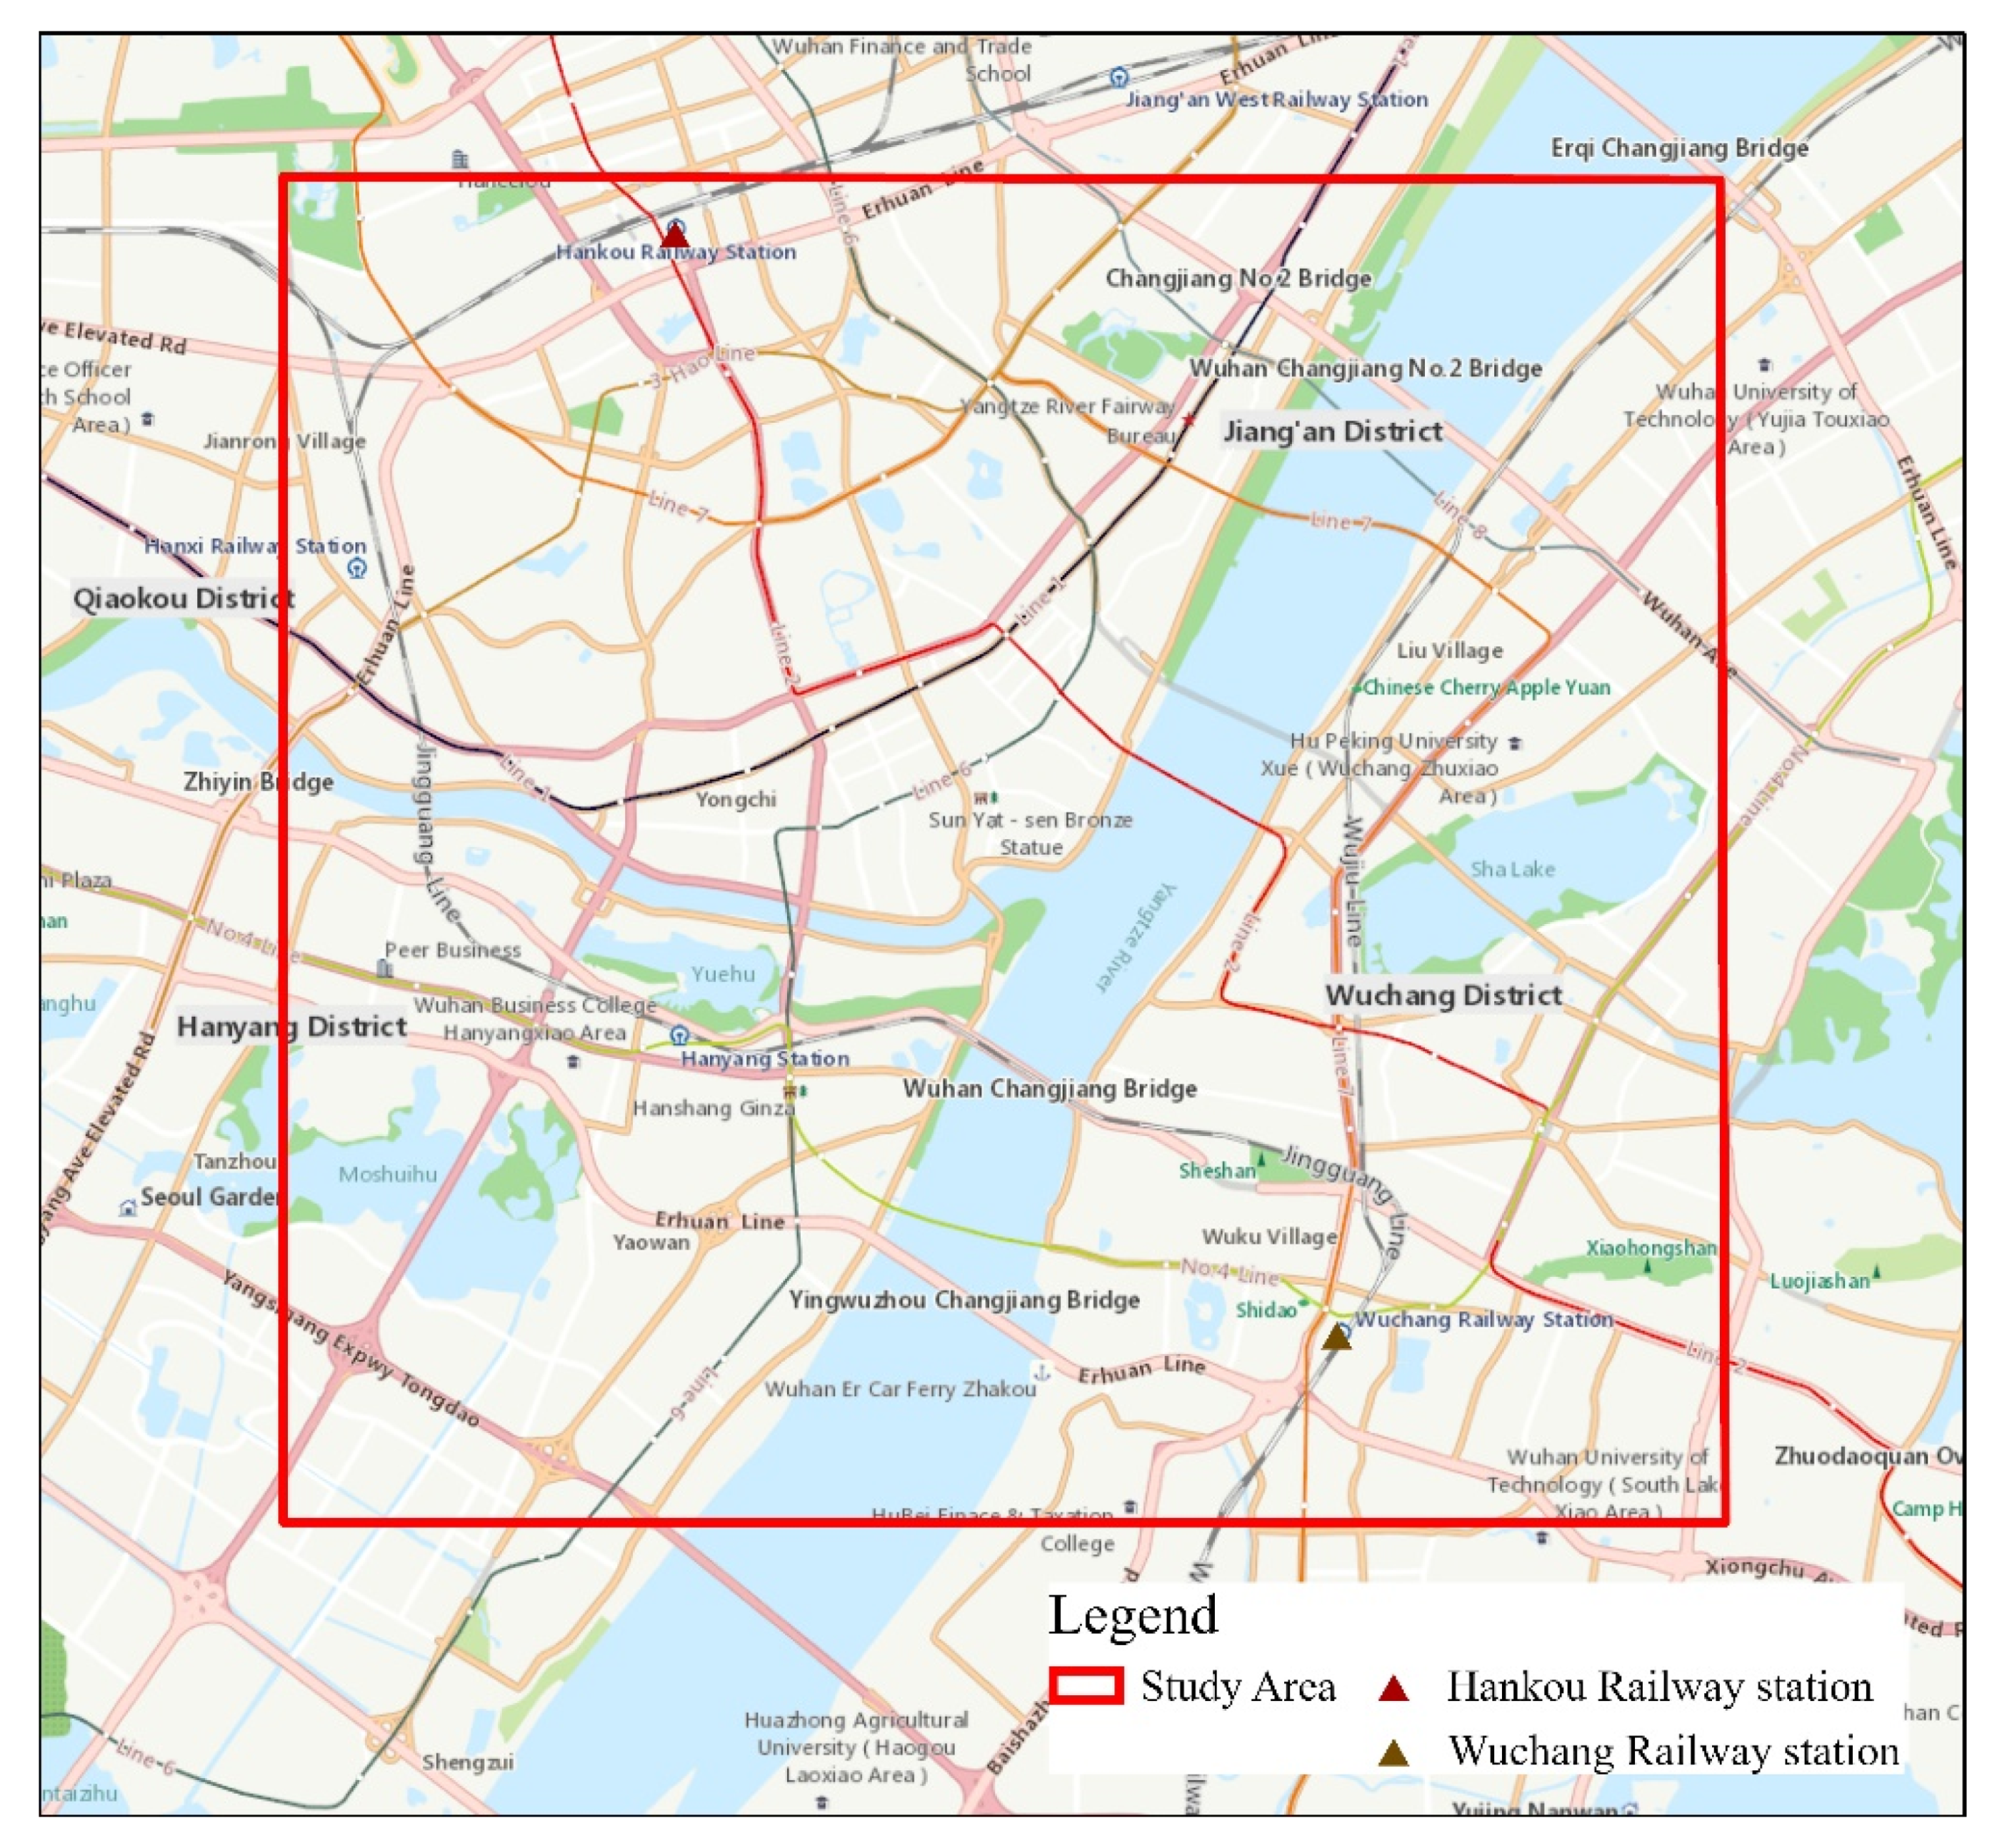
3.1. Study Area

Beijing is located in the eastern part of China and is the second-largest city in terms of area. In this study, we use Beijing as a case study and the study area covered the core area of Beijing, as shown in Figure 1. The longitude of the study area ranged from 116.331° to 116.448° and the latitude ranged from 39.866° to 39.956°. In Figure 1, Tiananmen Square, the Great Hall of the People and the Xinyi community were marked: (1) Tiananmen Square is the largest city square in the world and attracts a large number of tourists each year; (2) the Great Hall of the People is located in the western section of Tiananmen Square. It is the meeting place for the supreme state power organ of China, the National People’s Congress; (3) the Xinyi is a residential community and was built in 2008. In this study, the area containing Tiananmen Square and the Great Hall of the People is considered as the tourist area. The area containing the Xinyi district is considered as the residential area. To expand our data set, we also collected geotagged social media data in Wuhan, the largest city in the middle part of China. The spatial area where we collected data is shown in Figure 2.

3.2. Data Collection and Pre-Processing
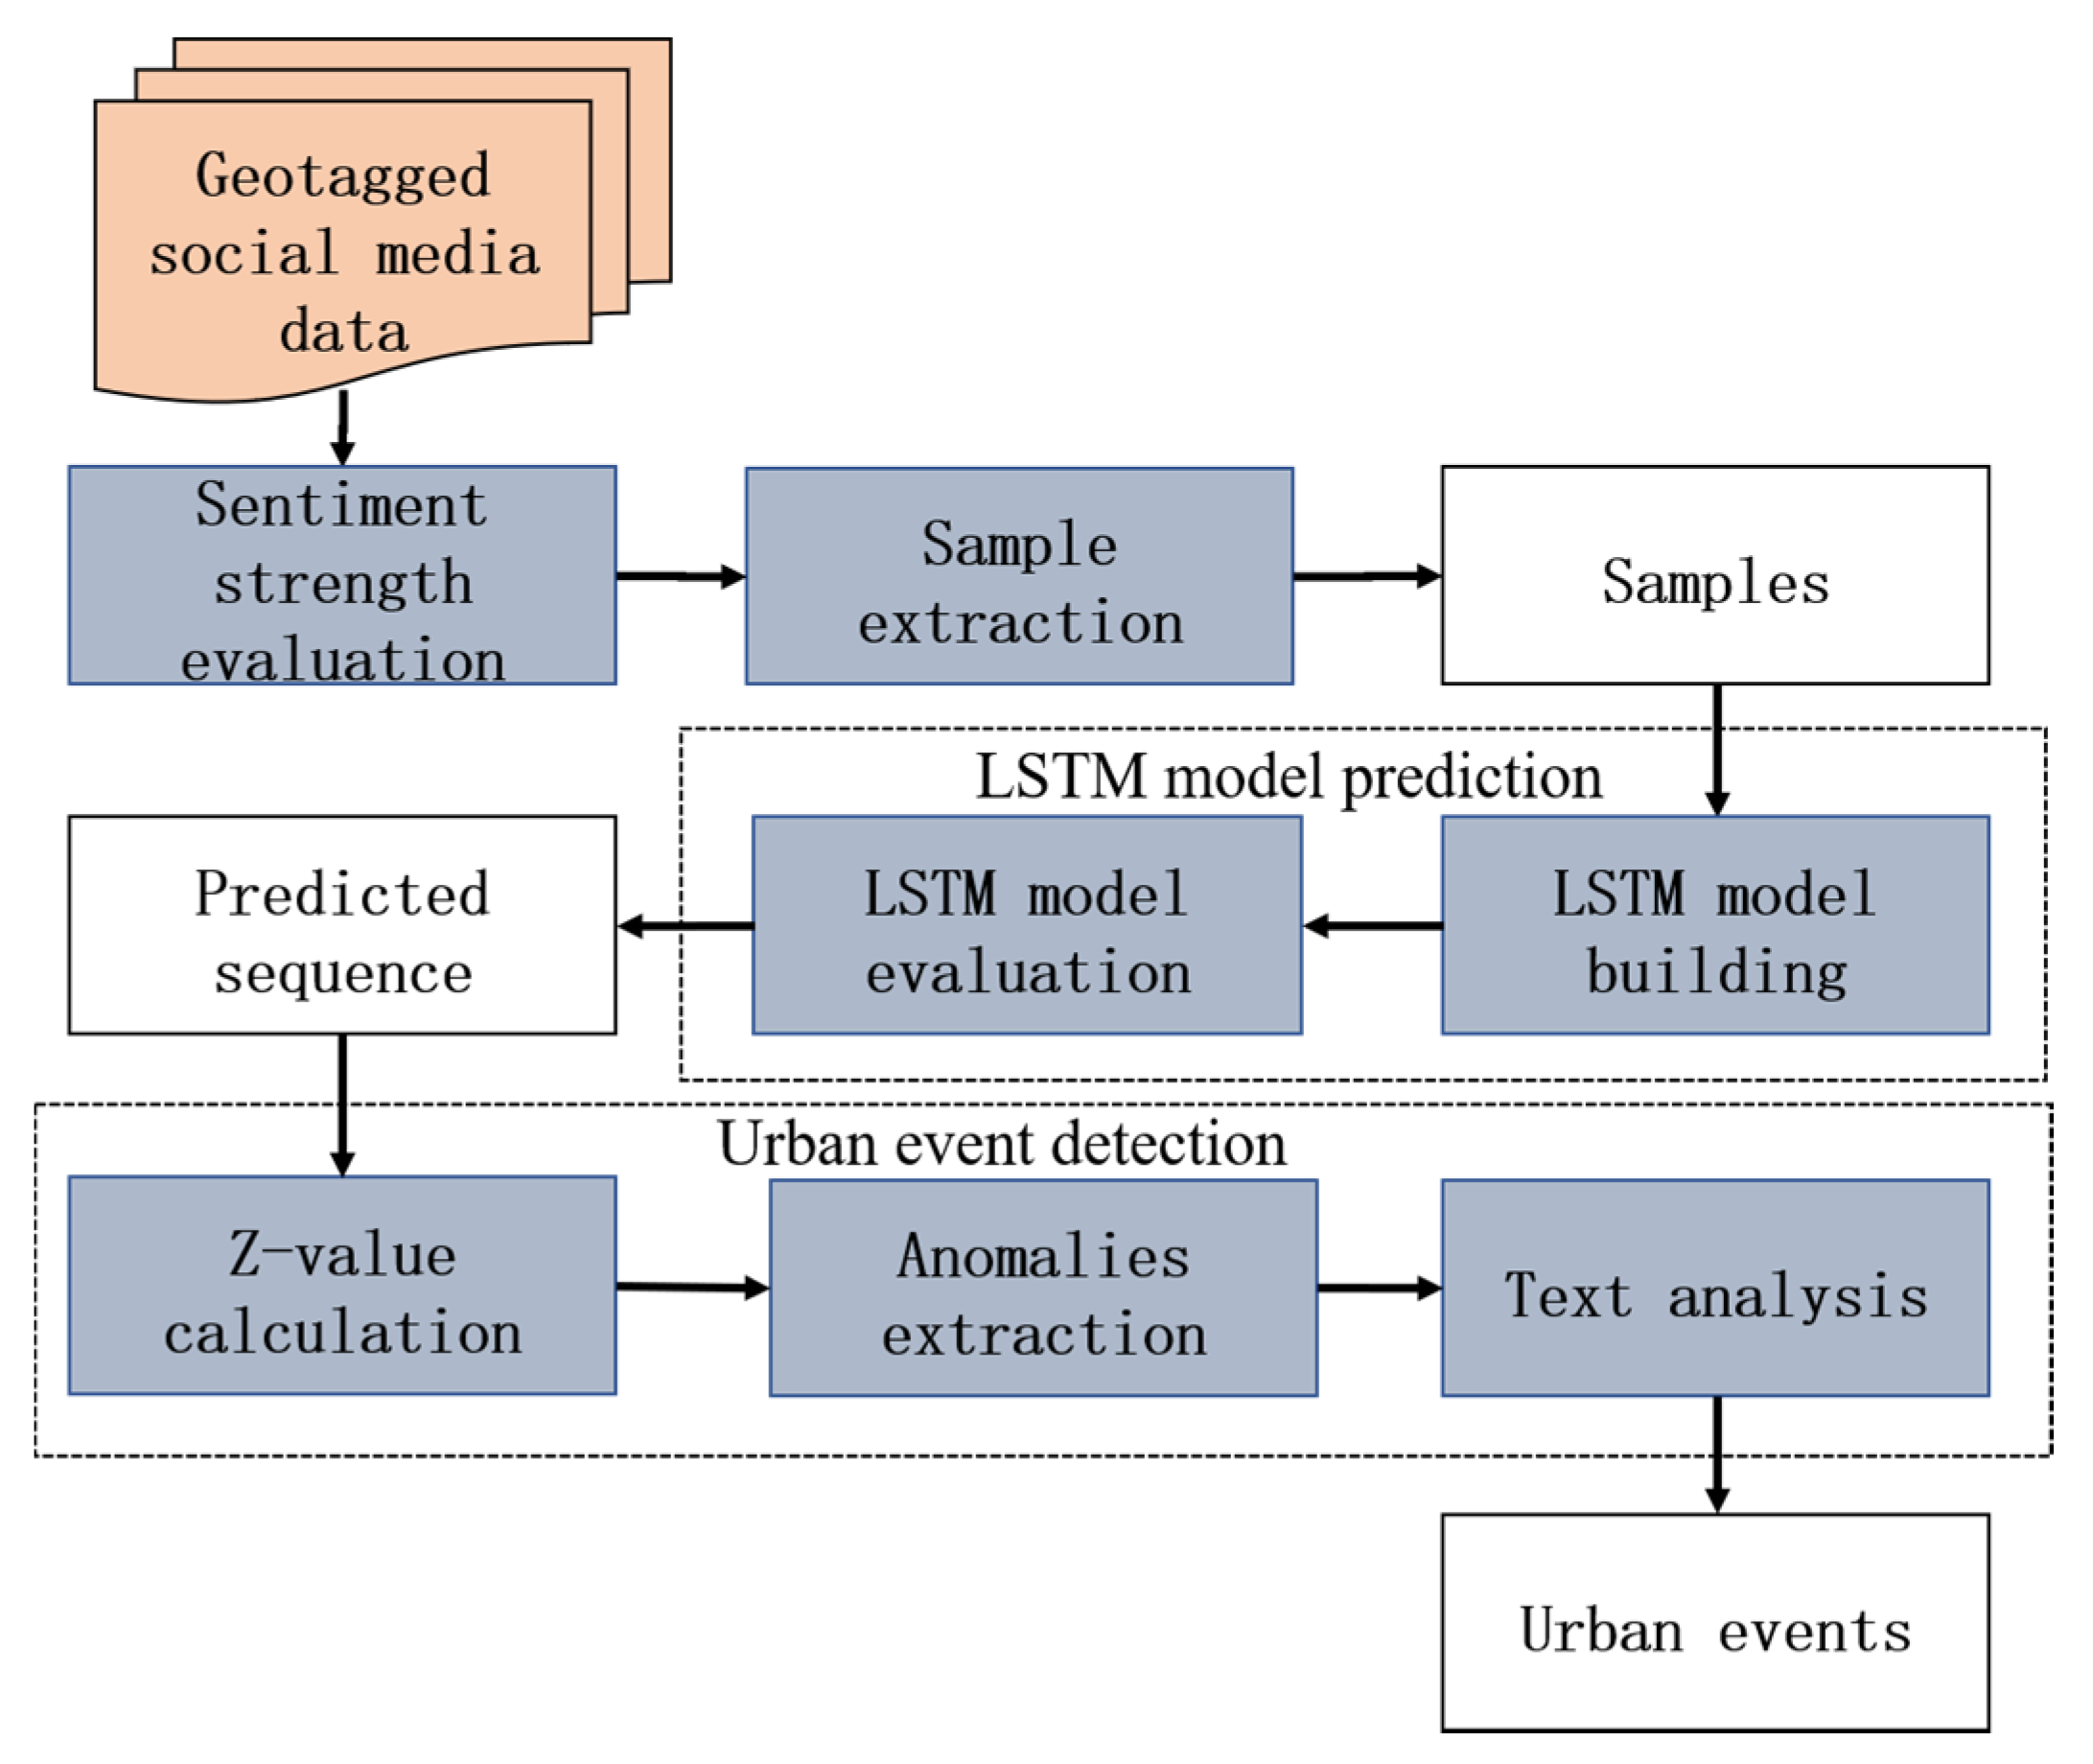
In this study, we collected Sina Weibo data using APIs and then filtered out the noise. Based on the API named “place/nearby_timeline,” we obtained geotagged Sina Weibo data generated within the study area. This API is provided by Sina Weibo to collect data posted within given circles. The centers of the circles can be located anywhere and the radius can be set to any value less than 10 km. In this case, we set the radius as 1 km, and a set of circles were generated to cover the study area. Owing to overlapping regions between the circles, some data were collected and stored more than once. By removing duplicate data we collected 4,278,607 Sina Weibo microblogs posted between 1 July 2017 and 31 March 2020 in Beijing and 2,779,926 Sina Weibo microblogs posted between 1 January 2018 and 30 April 2020 in Wuhan. Geotagged social media data only account for 1% of all social media data [9]. Based on a previous study, geotagged social media data were strongly related to the changes in the real world around users [52].
Samples of geotagged Sina Weibo microblogs are shown in Table 1. Each microblog contains many attributes, some of which are as follows: (1) “ID” and “User_ID” refer to the identification of the microblog and user, respectively; (2) “Created_at” refers to the posting time of the microblog; (3) “Geo” indicates the latitude and longitude of the posting location; (4) “Source” refers to the name of the application or phone model used to post the microblogs.
Through data pre-processing, the noise in the Sina Weibo microblogs were filtered out. Here, the noise mainly refers to advertisements and microblogs from non-human sources, namely bots [53,54]. A large amount of noise is reposted microblogs (similar to retweets) [52]. As reposted microblogs cannot be attached to location information, geotagged Sina Weibo microblogs have much less noise as compared with microblogs without location information. Samples of noise in geotagged microblogs are represented in Table 1. By applying the pre-processing method proposed by Jiang et al. [52], we removed the microblogs with particular “sources”, such as “unapproved application,” and the microblogs with some particular symbols in their texts, such as “【】.” After filtering out the noise, 7,034,683 Sina Weibo microblogs were retained for further analysis.

4. Method

In this section, we provide a detailed discussion of our method for detecting urban events with geotagged social media data. The method framework is shown in Figure 3. First, the positive and negative sentiment strength of users were quantified by applying a dictionary-based method. Then, we divided the study area into regular grids. Samples were extracted from the temporal sequence of the sentiment strength in each grid. Third, training samples were inputted into the LSTM network to account for long temporal dependency. The dynamics of the positive and negative sentiment strength were predicted based on the long temporal dependency, and the prediction results were evaluated. Finally, by applying Z-score values, we identified the anomalies from the residual components between the observed and predicted values as urban events. Information related to each event was explored from Sina Weibo texts.

4.1. Sentiment Strength Evaluation

Social media text is a reliable data source for evaluating users’ sentiment strength. The dictionary-based method is widely used to quantify the sentiment strength of texts in many research fields, such as event detection and tourist sentiment evaluation [45,50,55,56]. The results in existing studies have proved the effectiveness of the dictionary-based method. In this study, we applied a dictionary-based method proposed by Jiang et al. [57]. Their method constructed a new sentiment dictionary and then evaluated the sentiment strength by considering the influence of degree adverbs, negative adverbs, and adversative conjunctions in Chinese texts. Specifically, the new sentiment dictionary is built by expanding the Chinese dictionary named “HowNet”. The “HowNet” dictionary is one of the widely used Chinese sentiment dictionaries. In this dictionary, each sentiment word was labeled as positive or negative. The “HowNet” dictionary did not contain emoji and some words which were commonly used in social media texts. After manual identification, 204 new words and all emoji were added to the HowNet dictionary to construct a new sentiment dictionary. The constructed sentiment dictionary contained 6778 sentiment words and 98 sentiment emoji.
To consider the impacts of adverbs and conjunctions, Jiang et al. [57] constructed grammatical rules for degree adverbs, privative words, and adversative conjunctions that embody grammatical conventions for emphasizing or weakening sentiment strength. Based on the sentiment dictionary and grammatical rules, we can calculate the positive and negative sentiment strength in each social media text. The daily positive and negative sentiment strength is 5107.9 and 1262.0, respectively; this indicates that social media users tend to post positive sentiment in the texts.

4.2. Sample Extraction

The temporal sequences of the sentiment strength served as the basis of sample extraction. We first obtained temporal sequences for different spatial units. Regular grids are widely used in the studies of event detection [1,33]. In addition, the average size of the community in Beijing is near 1 km × 1 km [58]. Based on the characteristics of urban spatial structure, some previous studies have applied the spatial units with 1 km × 1 km to explore the urban problems in Beijing [59,60]. Therefore, 1 km × 1 km regular grids were used to divide the study area in Beijing into 100 units. The data in Wuhan is treated as a training sample to detect urban events in Beijing. To ensure the sample’s structure in Wuhan is the same as Beijing, 1 km × 1 km regular grids were also applied to divide Wuhan into 173 units.
For each unit, we obtained statistics on the daily positive and negative sentiment strength of geotagged social media data. Using the statistics, 200 temporal sequences in Beijing and 346 temporal sequences in Wuhan were obtained. Each sequence in Beijing includes 1005 consecutive time steps, and one unit of a time step was one day. The temporal sequence of positive and negative sentiment strength in grid s can be represented as Pos s = [ pos s 1 , pos s 2 pos s 1005 ] and Neg s = [ neg s 1 , neg s 2 neg s 1005 ] .
Training and testing samples were extracted from the sequences. In our study, by considering the long temporal dependency, the daily positive and negative sentiment strength at time step t within grid s ( pos s t and neg s t ) was assumed to be decided by a sequence of daily sentiment strength with g historical time steps; this sequence can be characterized as a vector Pos s t = [ pos s t g , pos s t g + 1 pos s t 1 ] and Neg s t = [ neg s t g , neg s t g + 1 neg s t 1 ] . In this regard, determining the number of time lags or historical time steps, i.e., g, is an important step for sample extraction. Some previous studies have demonstrated that the daily volume of geotagged social media data follows a 7-day cycle [61,62]. Therefore, the cycle of sentiment strength in social media data may also be 7-day. In this study, the number of time lags was set as 7 (covering one historical cycle). After determining the number of time lags, each sample was extracted as a 1-dimensional vector with 7 historical time steps. The sample size was calculated as follows:
Num = Num Beijing + Num Wuhan = 390 , 044
Num Beijing = ( 1005 ( day ) 7 ) × 100 × 2 ( sentiment   polarity )
Num Wuhan = ( 1005 ( day ) 7 ) × 173 × 2 ( sentiment   polarity )
The extracted samples were divided into a training set and a testing set. The samples extracted from the temporal sequences ranging from 1 July 2017 to 31 December 2019 in Beijing were treated as the training set. In addition, all samples extracted from the Wuhan data set were also treated as a training set. The size of the training samples was calculated as follows:
Num train = Num tBeijing + Num tWuhan = 390 , 044
Num tBeijing = ( 549 ( day ) 7 ) × 100 × 2 ( sentiment   polarity )
Num tWuhan = ( 821 ( day ) 7 ) × 173 × 2 ( sentiment   polarity )
The rest of the samples were treated as the testing set. The size of the testing samples was as follows:
Num test = Num Num train = 91 , 200
Based on testing samples, the prediction of social media data was from 1 January 2019 to 31 March 2020 in Beijing.

4.3. Modeling Long Temporal Dependency

Modeling long temporal dependency is very important for extracting the deterministic components of sentiment strength in geotagged social media data and identifying anomalies from massive data. Many previous studies have demonstrated that the LSTM approach can provide better results in capturing long temporal dependencies than most other machine learning methods [17,63,64,65]. Therefore, an LSTM architecture is used to capture the long temporal dependency between sentiment strengths at different time steps.
The LSTM architecture applied in our case is composed of one input layer, one hidden layer, and one output layer, as shown in Figure 4. The hidden layer is the core of the LSTM model and is also called the LSTM cell. The input of the LSTM cell is the positive or negative sentiment strength at time step t, pos t or neg t , and the output is h t . Three cell states are considered by the LSTM cell: the cell input state C ~ t , the cell output state C t , and the previous cell output state C t 1 . In addition, an input gate, an output gate, and a forget gate are included in an LSTM cell. The gated structure of the cell enables the LSTM model to construct long temporal dependencies. The input gate and output gate can be considered as the activation into the cell. The forget gates are used to set the bounds for the internal cell values when dealing with sequences [66,67]. As shown in Figure 4, the outputs of the input gate, output gate, and forget gate are denoted as i t , o t , and f t , respectively. These outputs, and the cell input state, are depicted as below:
f t = σ ( W fx x t + U fh h t 1 + b f )
i t = σ ( W ix x t + U ih h t 1 + b i )
o t = σ ( W ox x t + U oh h t 1 + b o )
C t ~ = tan h ( W cx x t + U ch h t + b c )
Here, W fx , W ix , W ox , and W cx represent the weight matrices connecting the input of the LSTM cell to the forget gate, input gate, output gate, and the cell input state, respectively. U fh , U ih , U oh , and U ch are the weight matrices connecting the cell’s previous state to the three gates and the cell input state. Here, b f , b i , b o , and b c refer to bias vectors. The gate activation function in the LSTM cell is denoted as σ. Meanwhile, tanh refers to a hyperbolic tangent function that can map values to the range of 0 to 1. Based on the obtained i t , o t , f t , and C ~ t , the cell output state C t and the cell output h t can be calculated by the following equations:
C t = f t C t 1 + i t   C ~ t
h t = o t tan h ( c t )
For each input training sample or testing sample with n historical time steps, Pos t = [ pos t g , pos t g + 1 , pos t 1 ] or Neg t = [ neg t g , neg t g + 1 , neg t 1 ] , the final output of LSTM model is a vector, Y t = [ h t g , h t g + 1 , h t 1 ] . The last element of the output vector, h t 1 , is the predicted value of the social media volume at the next time step t, namely pos ^ t = h t 1 or neg ^ t = h t 1 .
In this study, an LSTM model with three layers was built using Keras. Keras is an open-source machine learning framework written in Python and can provide technical support for fast experimentation with deep neural networks. Based on Keras, we initially added 10 hidden neurons to the hidden layer and set the activation function of the LSTM cell as a linear function. Then, the objective function of the model was set as the mean squared error (MSE). The “RMSProp” optimizer was used to optimize the objective function. Last, to avoid the over-fitting problem, a dropout mechanism was applied to the LSTM. The core idea of a dropout mechanism is to drop units randomly from a neural network in the training process; this mechanism added the dropout rate q to the LSTM model. We set q as 0.5 following the previous study of Srivastava, Hinton, Krizhevsky, and Sutskever [66]. After building the LSTM model, the training samples were fed to the LSTM model to account for the long temporal dependency. The complexity of our method is calculated as O ( n 2 ) , n refers to the number of input samples.

4.4. Model Evaluation

Based on the modeled long temporal dependency, testing samples were inputted to the trained LSTM model to predict the daily positive and negative sentiment strength in social media data from 1 January 2019 to 30 March 2020. The prediction results were evaluated using the mean absolute percentage error (MAPE) and root mean square error (RMSE).
The MAPE is a simple and effective measurement of the accuracy of a prediction result. It uses a percentage to present the variance between predicted and observed values. MAPE is a relative error, and can be depicted as below:
MAPE = 100 % N i 1 N | x ^ i x i x i |
In the above, x ^ i and x i are the predicted and observed values, respectively; and N is the number of predicted values. The RMSE is used to measure the average values of the squares of the errors. The RMSE is an absolute error and can be calculated by the following equation:
RMSE = 1 N i = 1 N ( x ^ i x i ) 2
A lower value of RMSE or MAPE indicates a higher accuracy of the prediction result. The prediction result is treated as a deterministic or predictable component. Based on the deterministic component, the residual component, which is the divergence between observed and predicted values, can be extracted and can then be applied for event detection, as described in the next section.

4.5. Event Detection

Urban events were detected from the residual components and two methods were applied to extract them. Then, event-related information was obtained through text analysis. Based on the Tukey’s range test, the anomalies or urban events in the residual components refer to values outside the defined range [1]. The range can be defined as follows:
[ Q 1 k ( Q 3 Q 1 ) , Q 3 + k ( Q 3 Q 1 ) ]
Here, Q 1 and Q 3 are the lower and upper quartiles of the group, respectively; k is defined as a value from 1.5 to 3. To further quantify events accurately, a modified Z-score was calculated for each value in the residual component [67]. The Z-score can be depicted as follows:
Z i = 0.6745 ( R i μ ) / MAD
In the above, R i is the ith value in the residual component; μ is the median of the group; MAD is the median of the absolute deviation to the median.
After detecting urban events, the texts of geotagged social media data were explored to reveal event-related information. A Chinese word segmentation algorithm was applied for social media text analysis. Stop words or pointless words were removed. Previous studies applied word clouds to reflect event-related information [2,9]. Based on the experiences of previous studies, we generated a word cloud for each detected event. By identifying the information in word clouds manually, the event type and event occasion can be recognized.

5. Results and Analysis

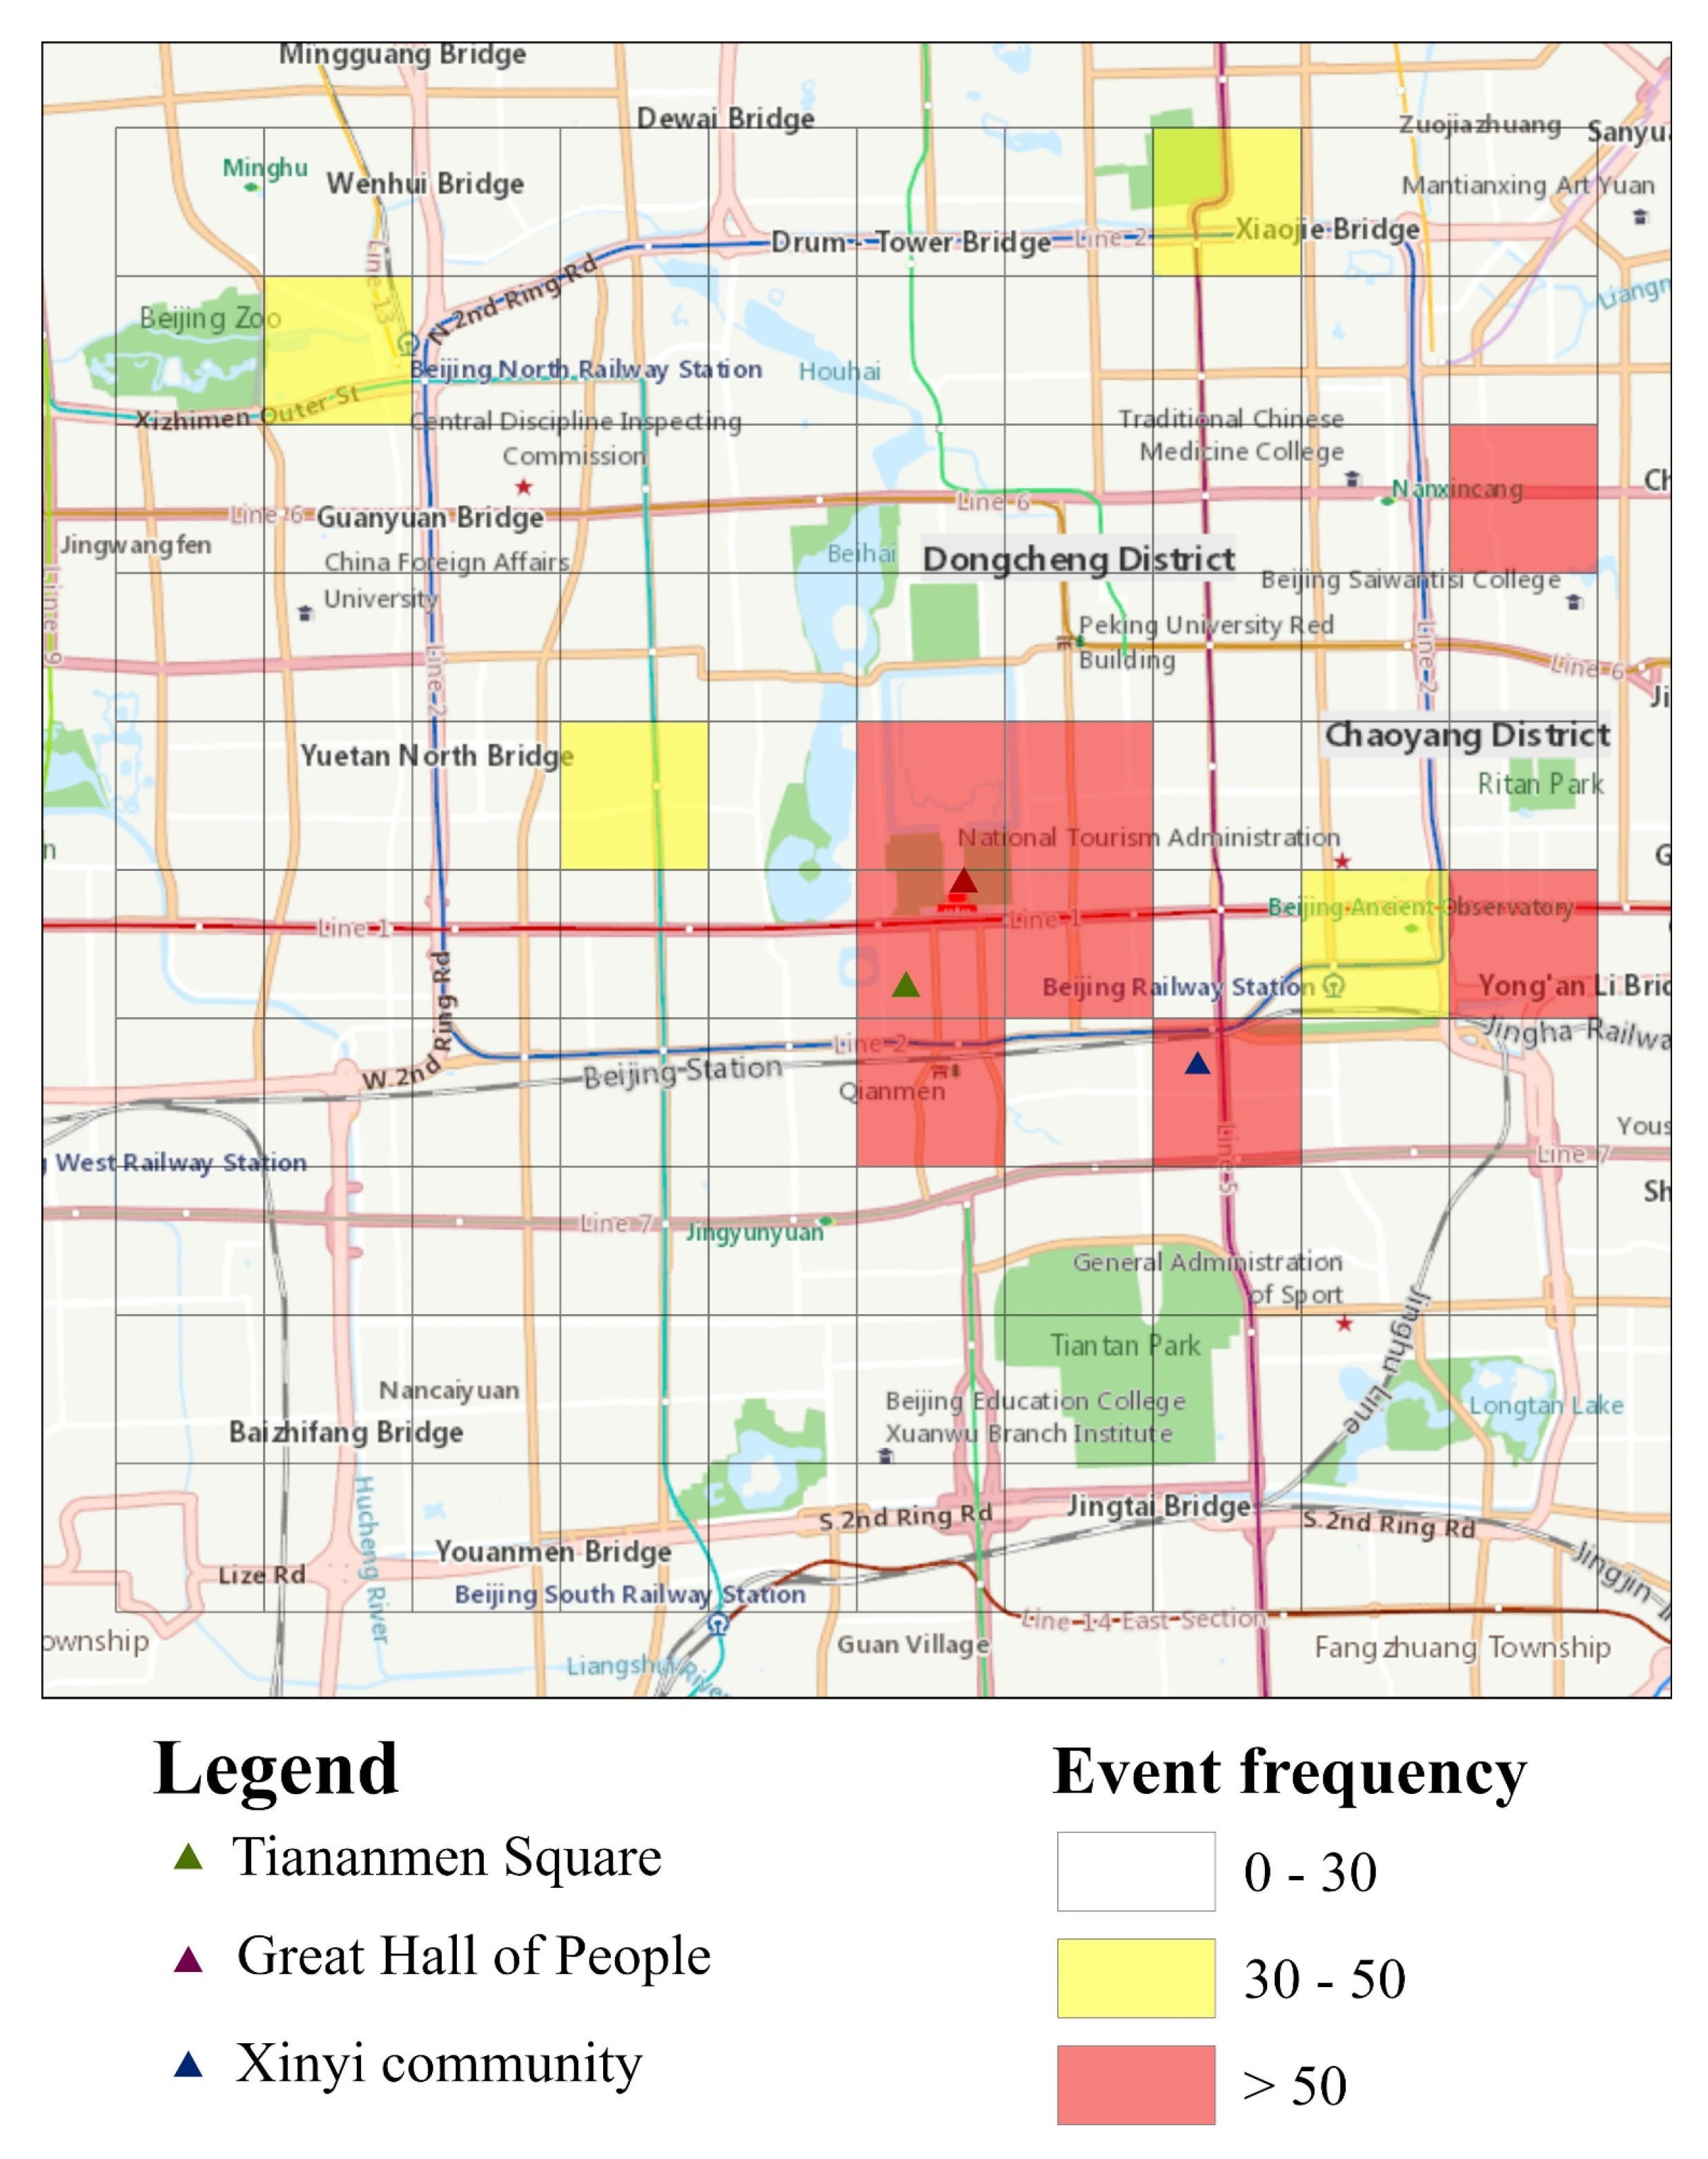
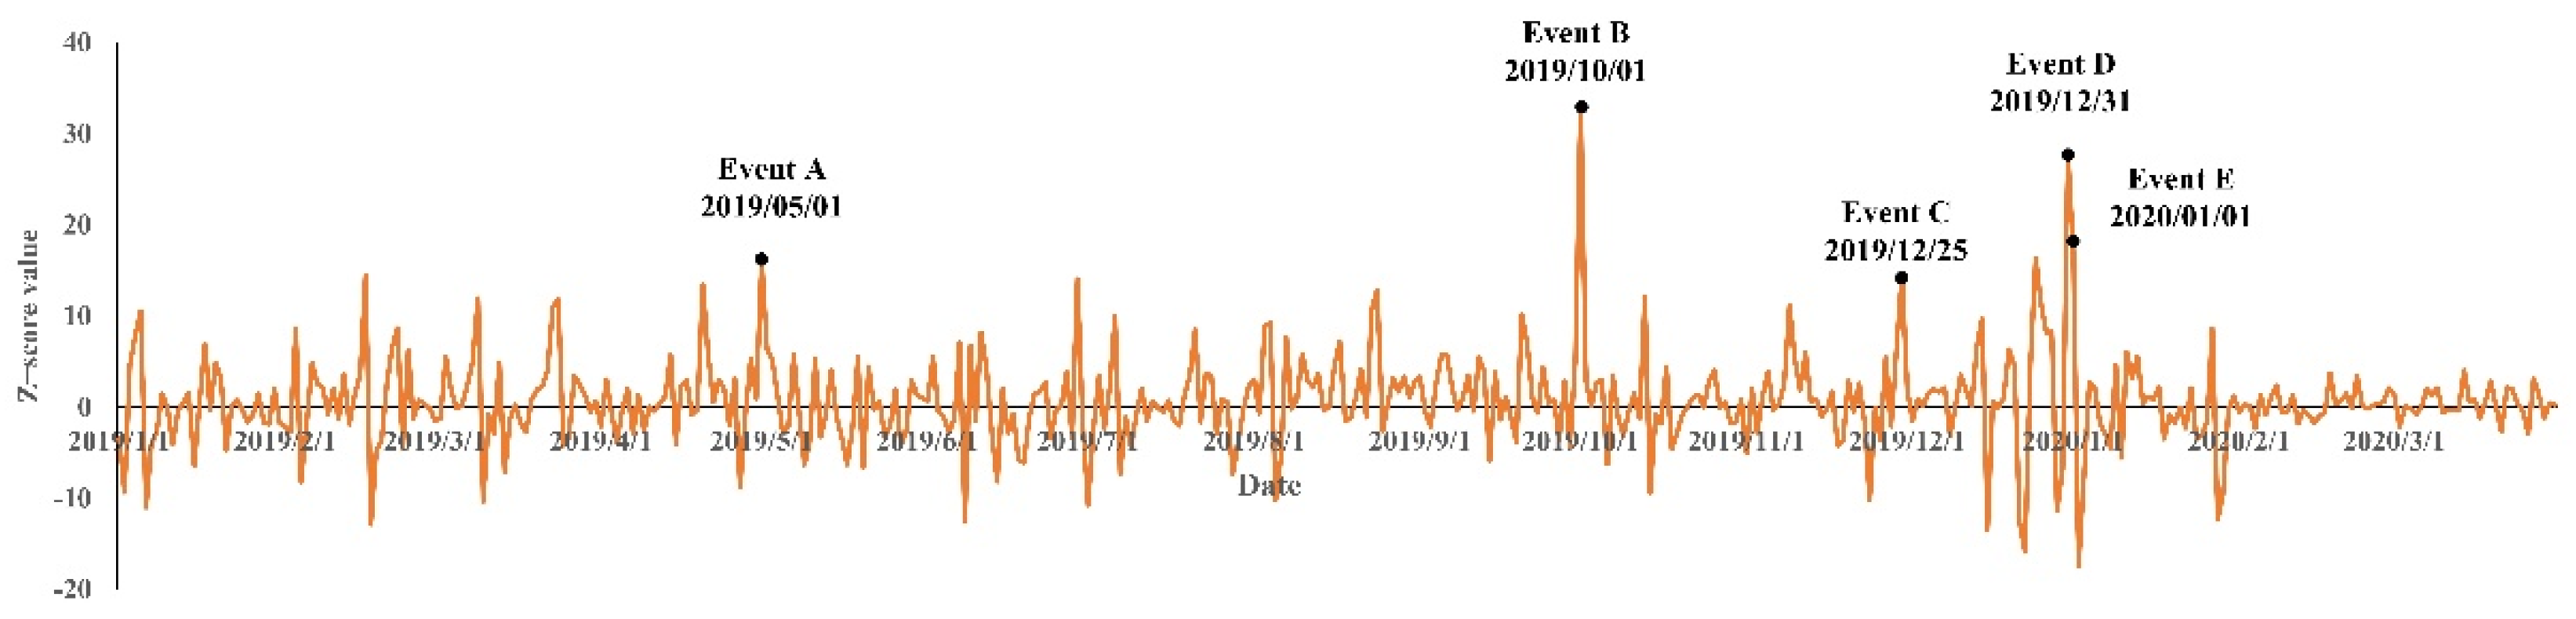
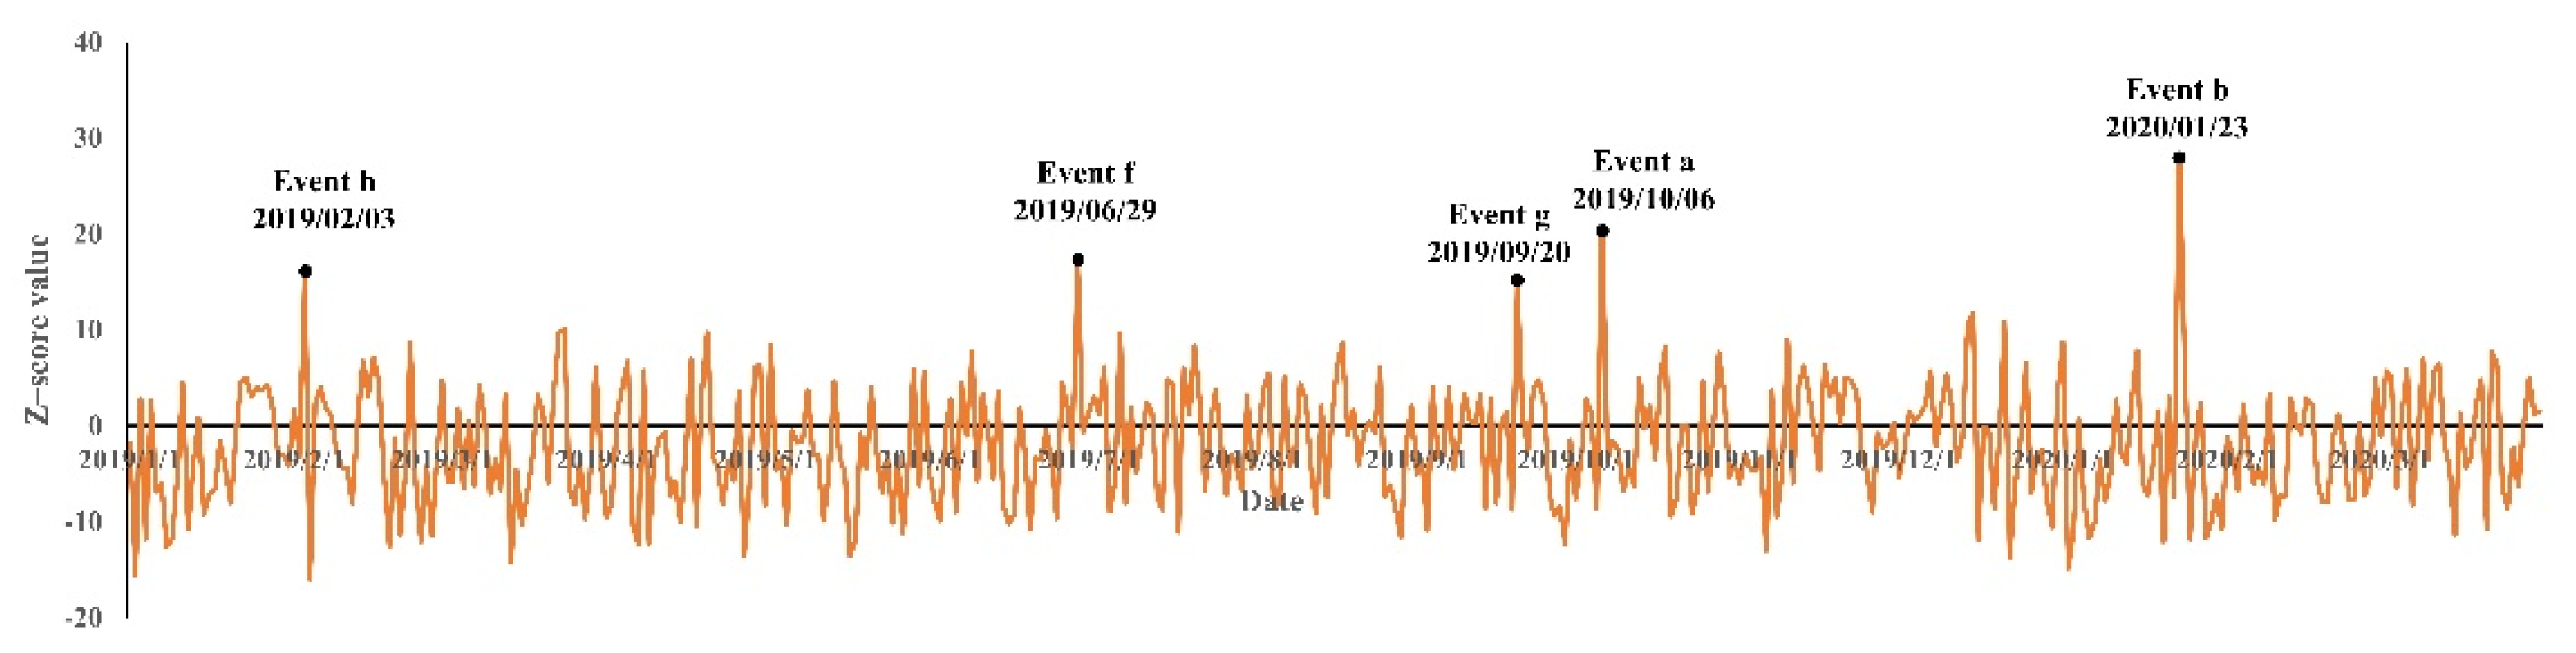
5.1. Analysis of Detection Results of LSTM
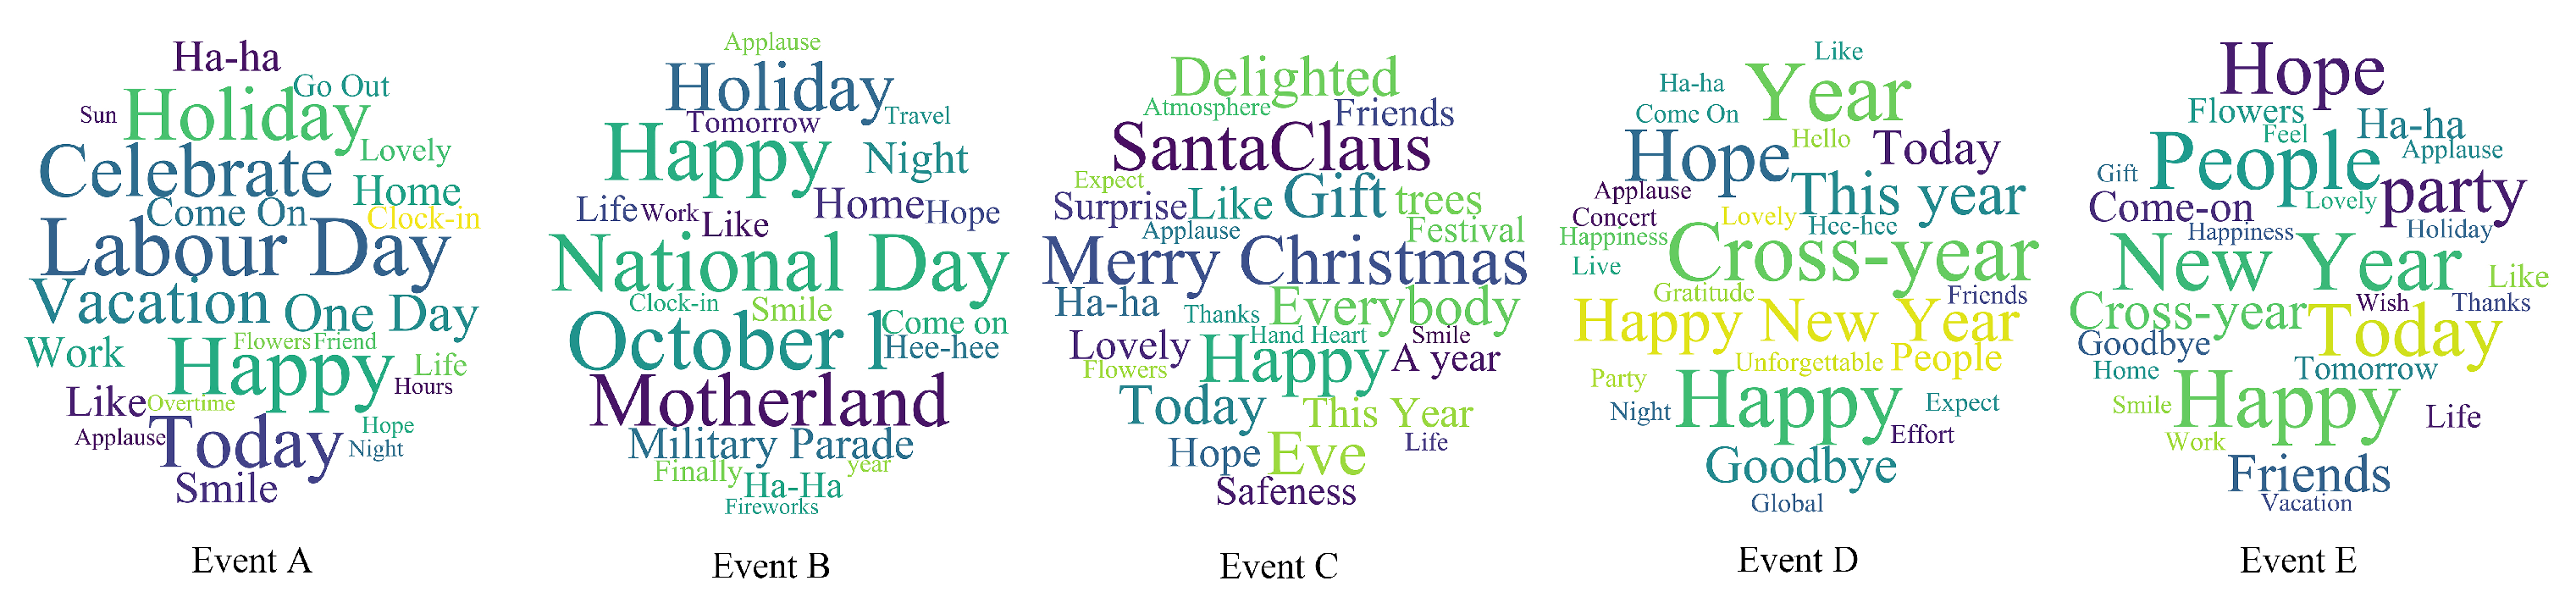
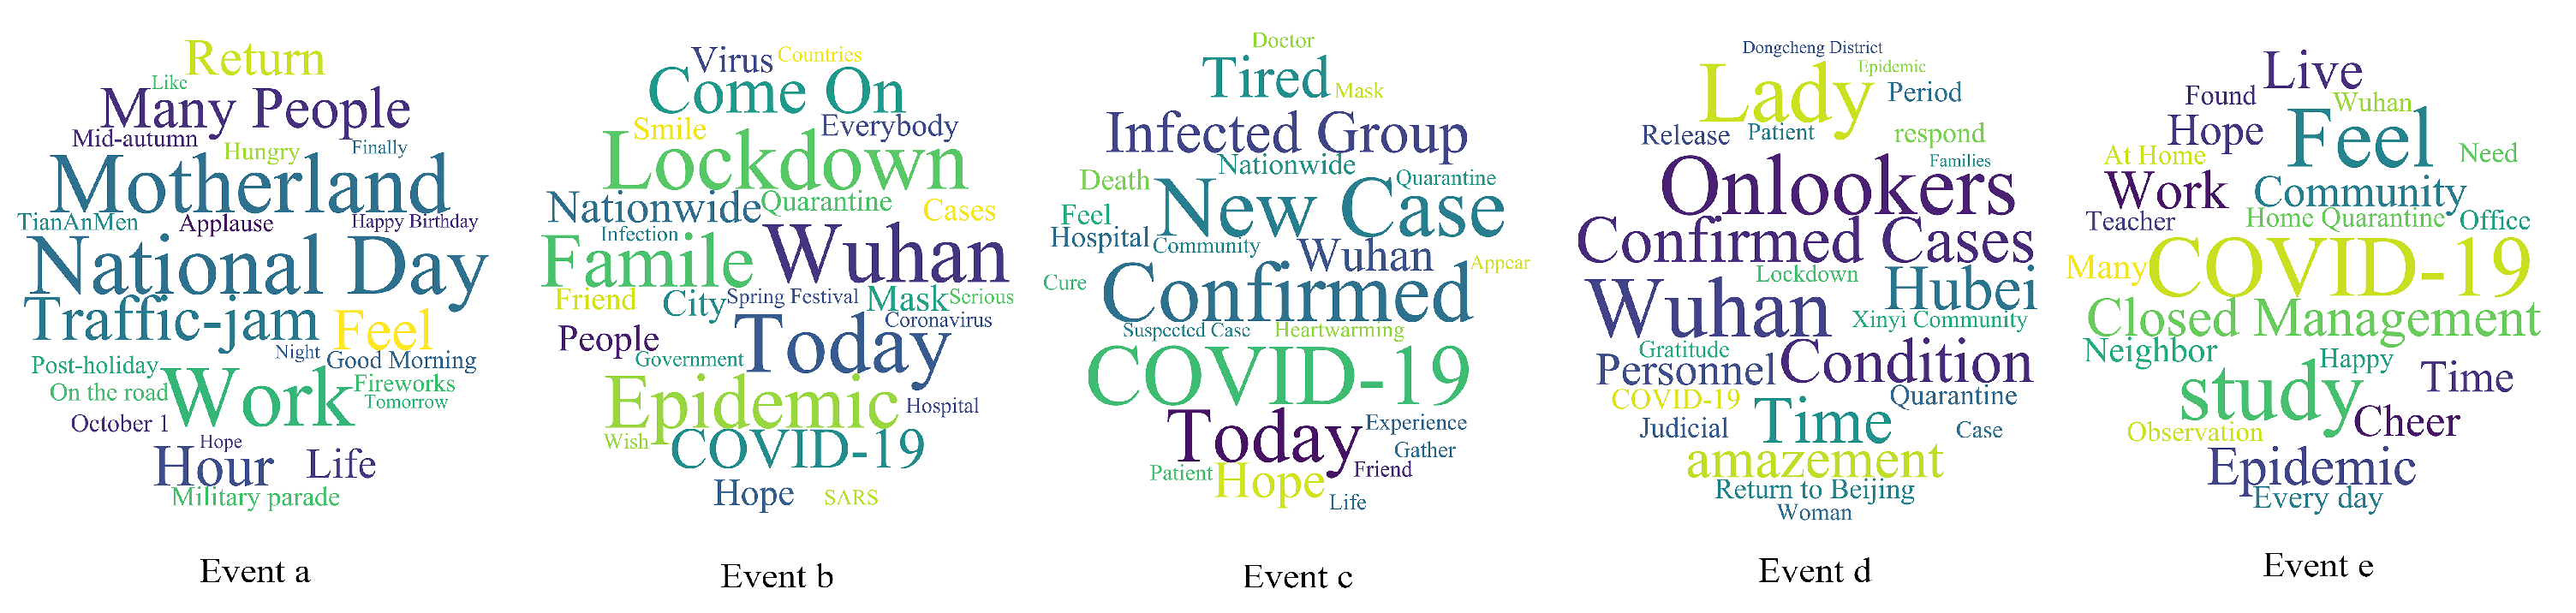
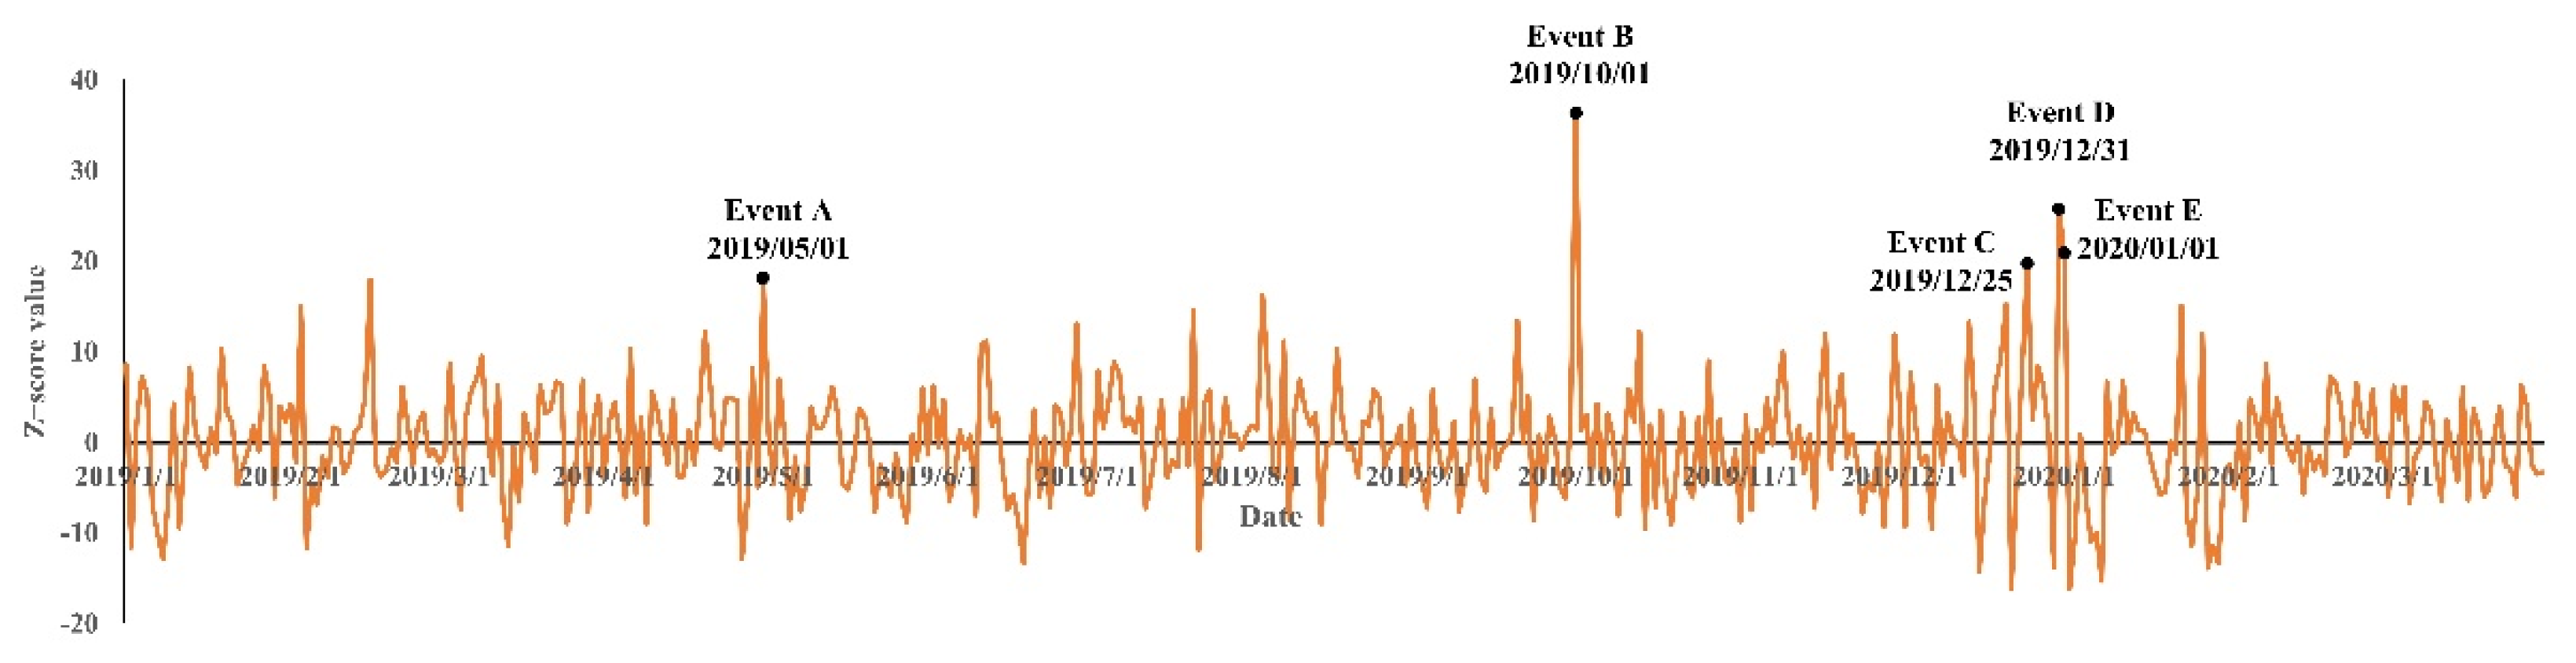
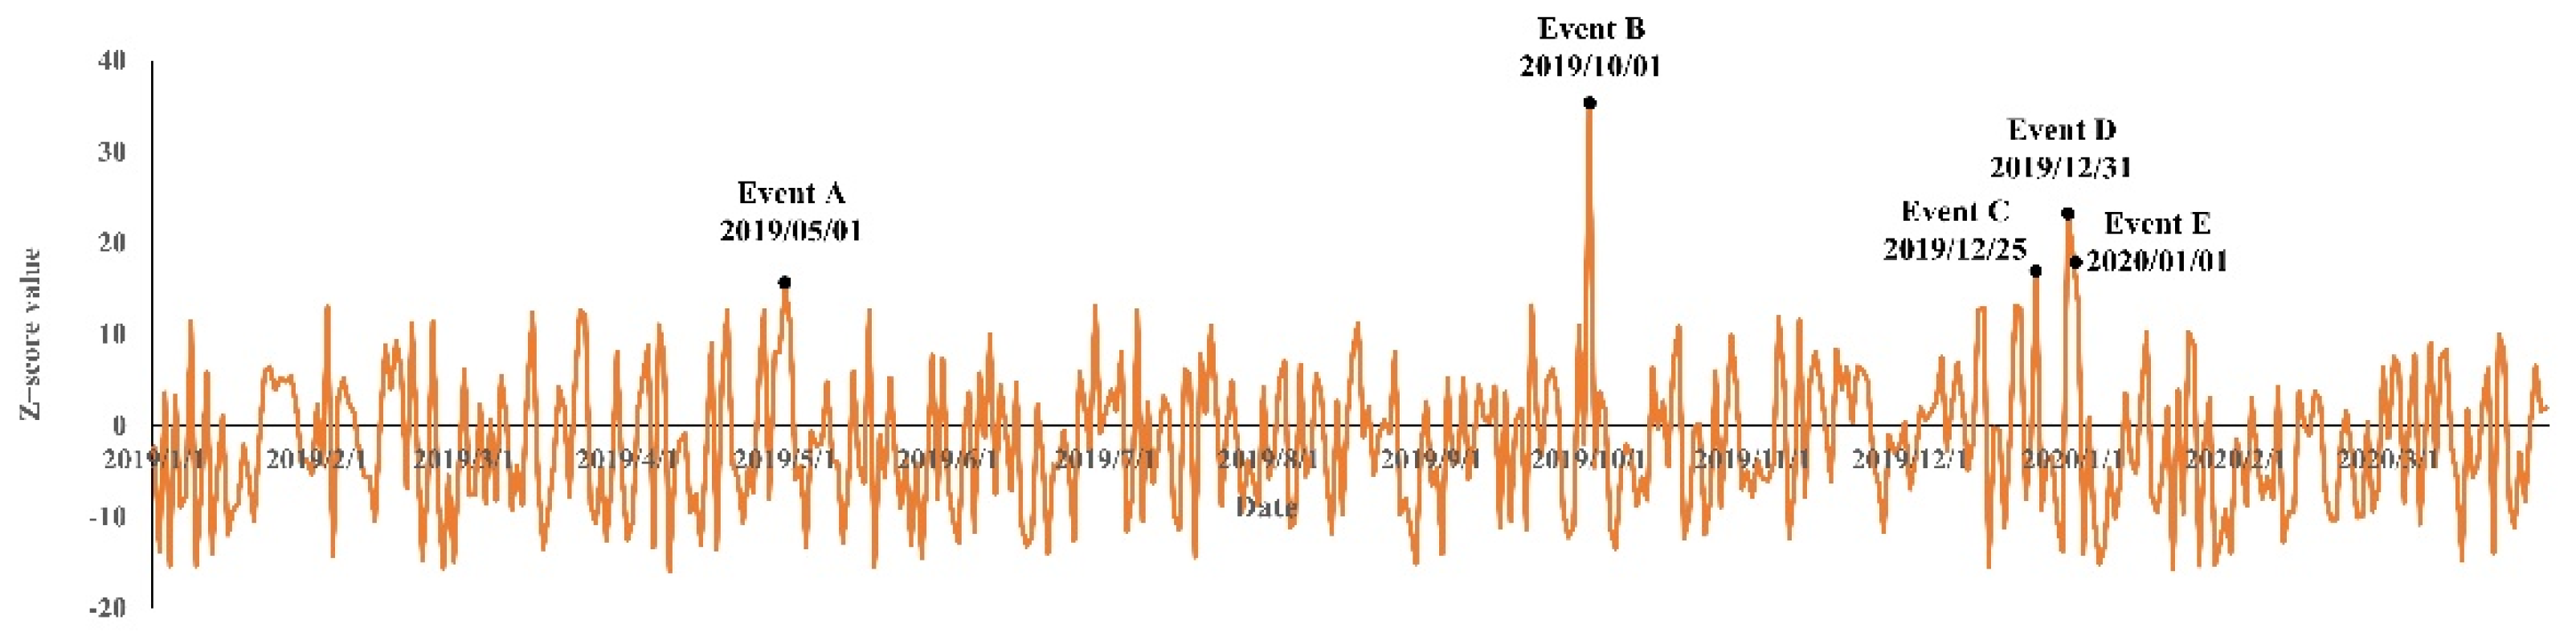
Based on the residual component of LSTM, we identified urban events and mapped them to reveal the spatial areas with high event frequencies. The spatial distribution of the positive and negative urban events occurring from 1 January 2019 to 30 March 2020 are shown in Figure 5 and Figure 6. The distribution of positive events was similar to the negative events. The positive or negative event frequencies of most grids were lower than 30. This indicates that most spatial areas have relatively few events. The grids which contained more than 50 positive or negative events are mostly located in the central area of Beijing. These grids contain many landmarks, such as Tiananmen Square and the Great Hall of the People, and are important tourist areas. In this study, the grid which contains the Xinyi community, a residential area, is called Grid A.
To further extract event-related information, social media texts were explored. In this study of 5 positive events and 5 negative events, those with the top 5 Z-scores of positive and negative sentiment in Grid A were used as case studies. The Z-score values of positive and negative sentiment in this grid are shown in Figure 7 and Figure 8, respectively. For each event, a corresponding word cloud is shown in Figure 9 and Figure 10. Based on word clouds, the information regarding the positive and negative events can be summarized as follows:
  • Event A Labor Day.
  • Event B Nation Day.
  • Event C Christmas Day.
  • Event D New Year’s Eve.
  • Event E New Year’s Day.
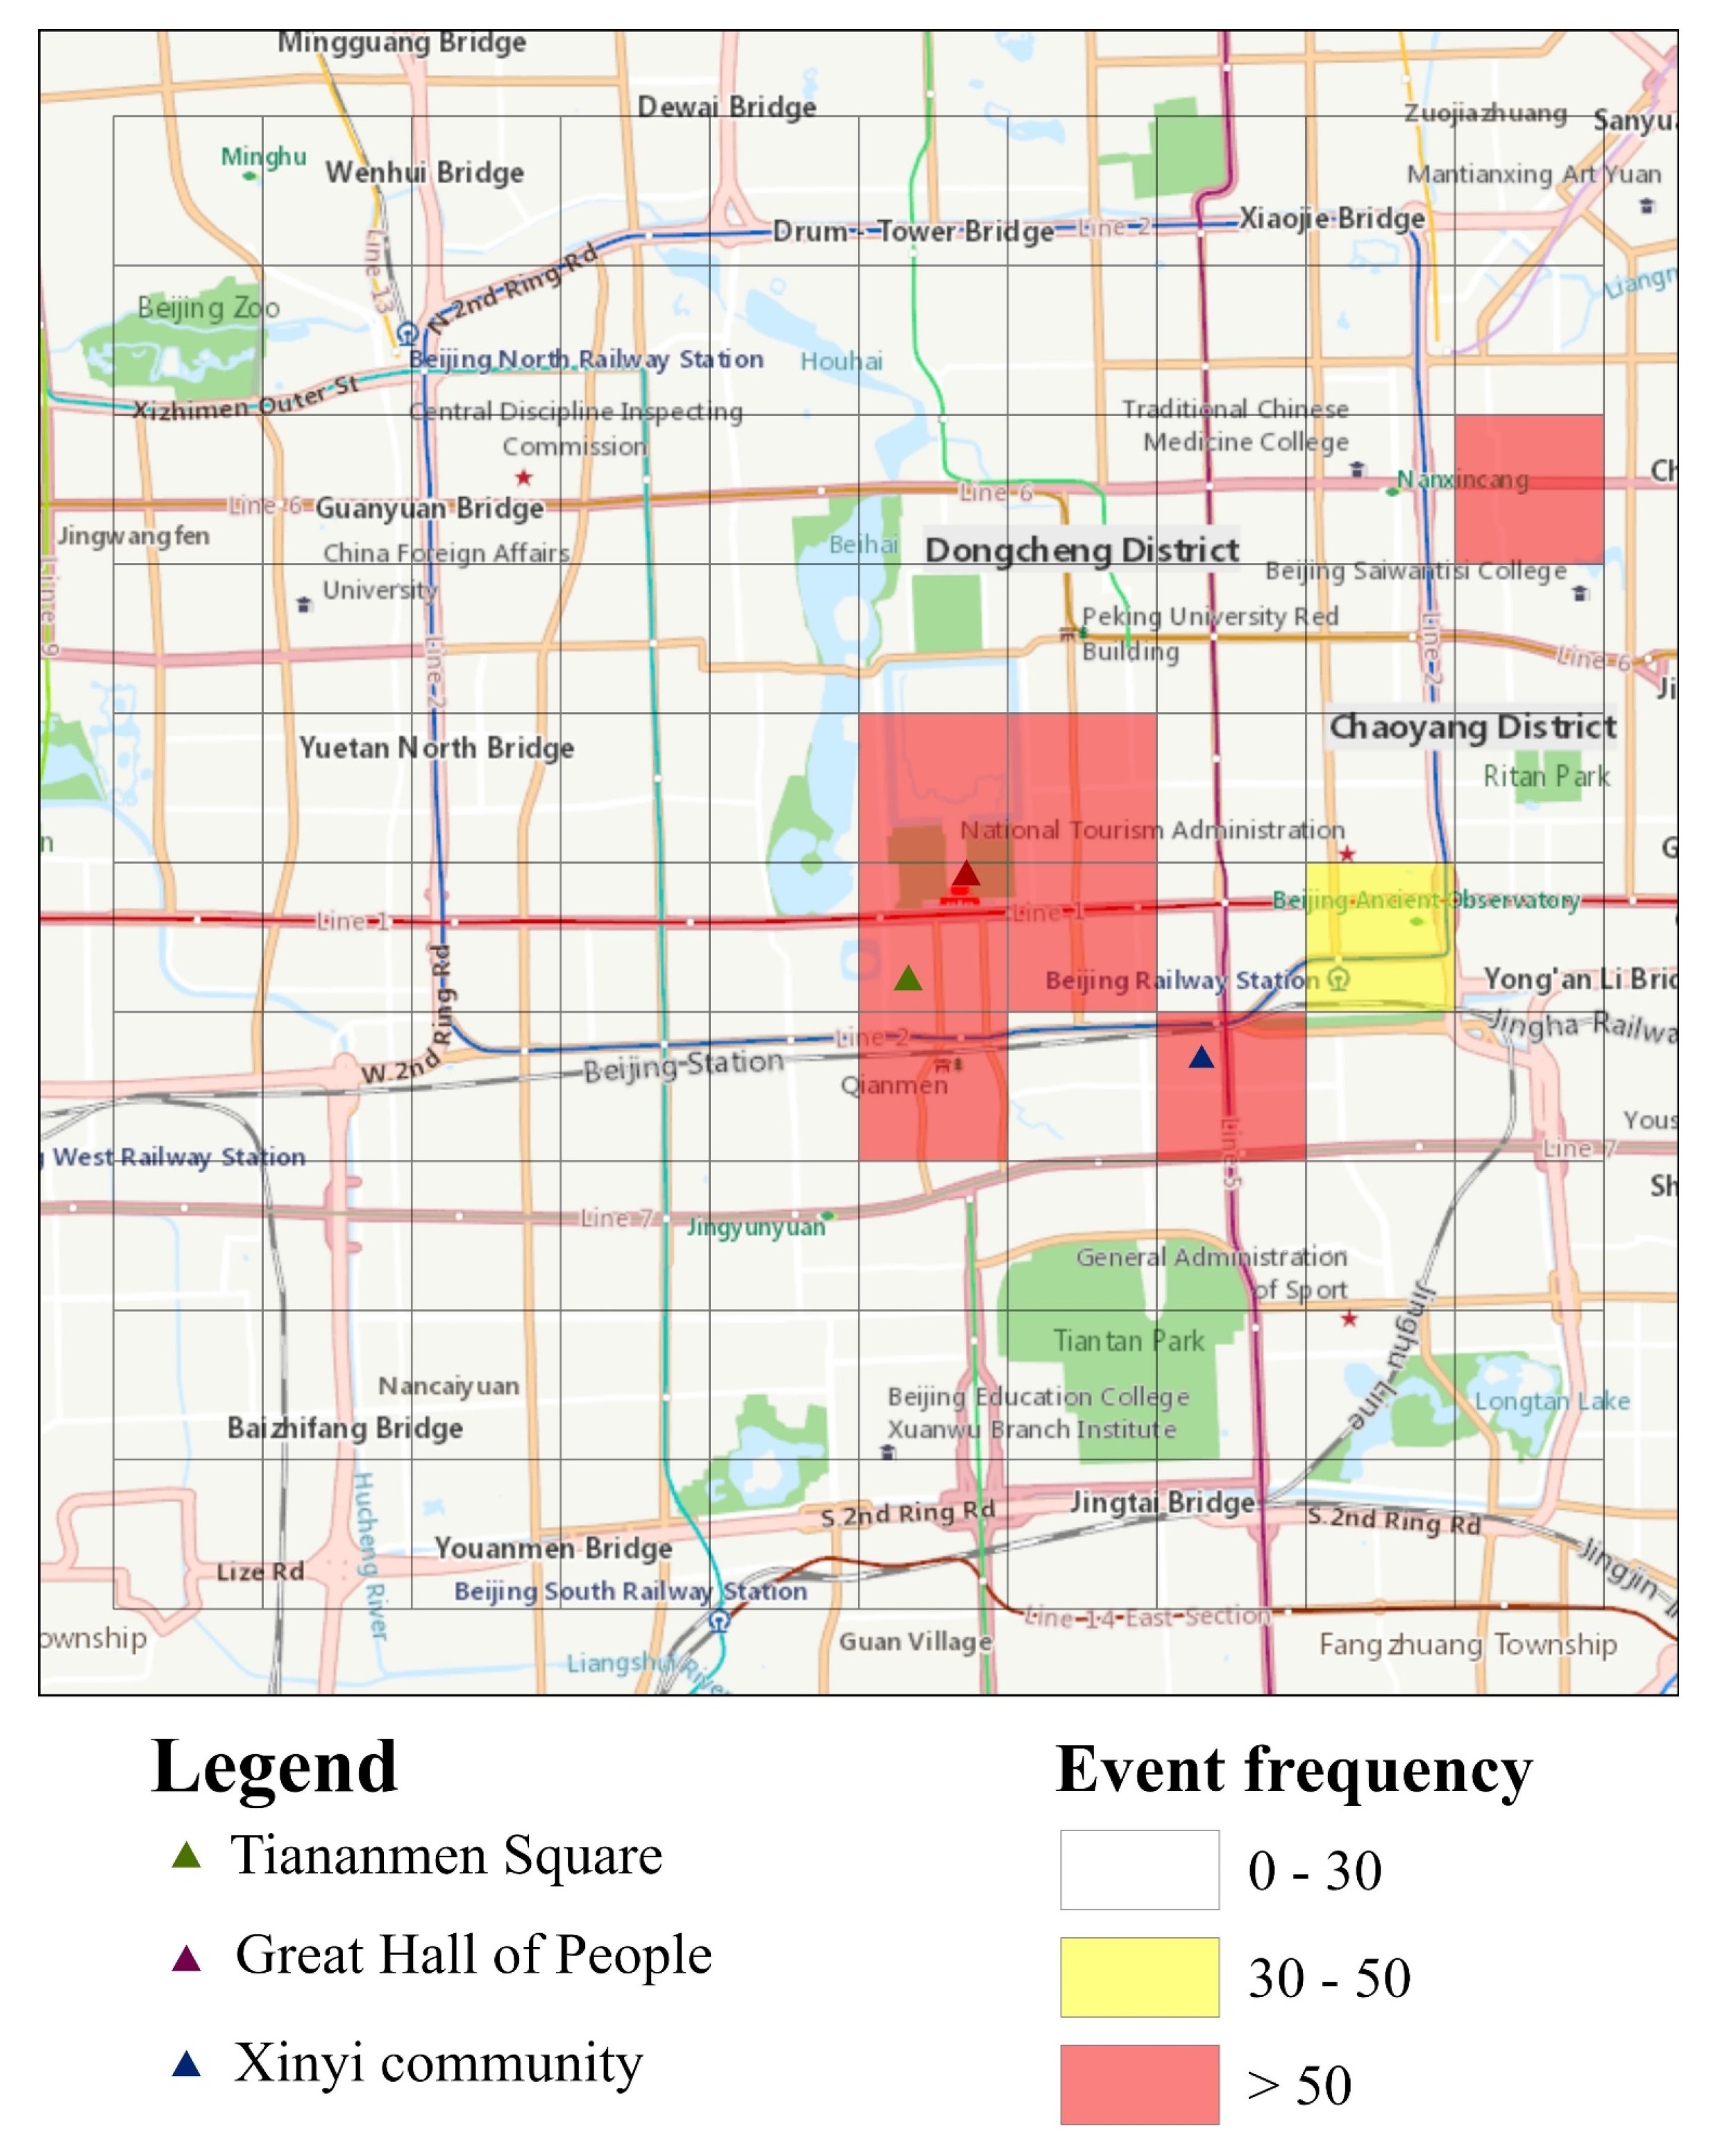
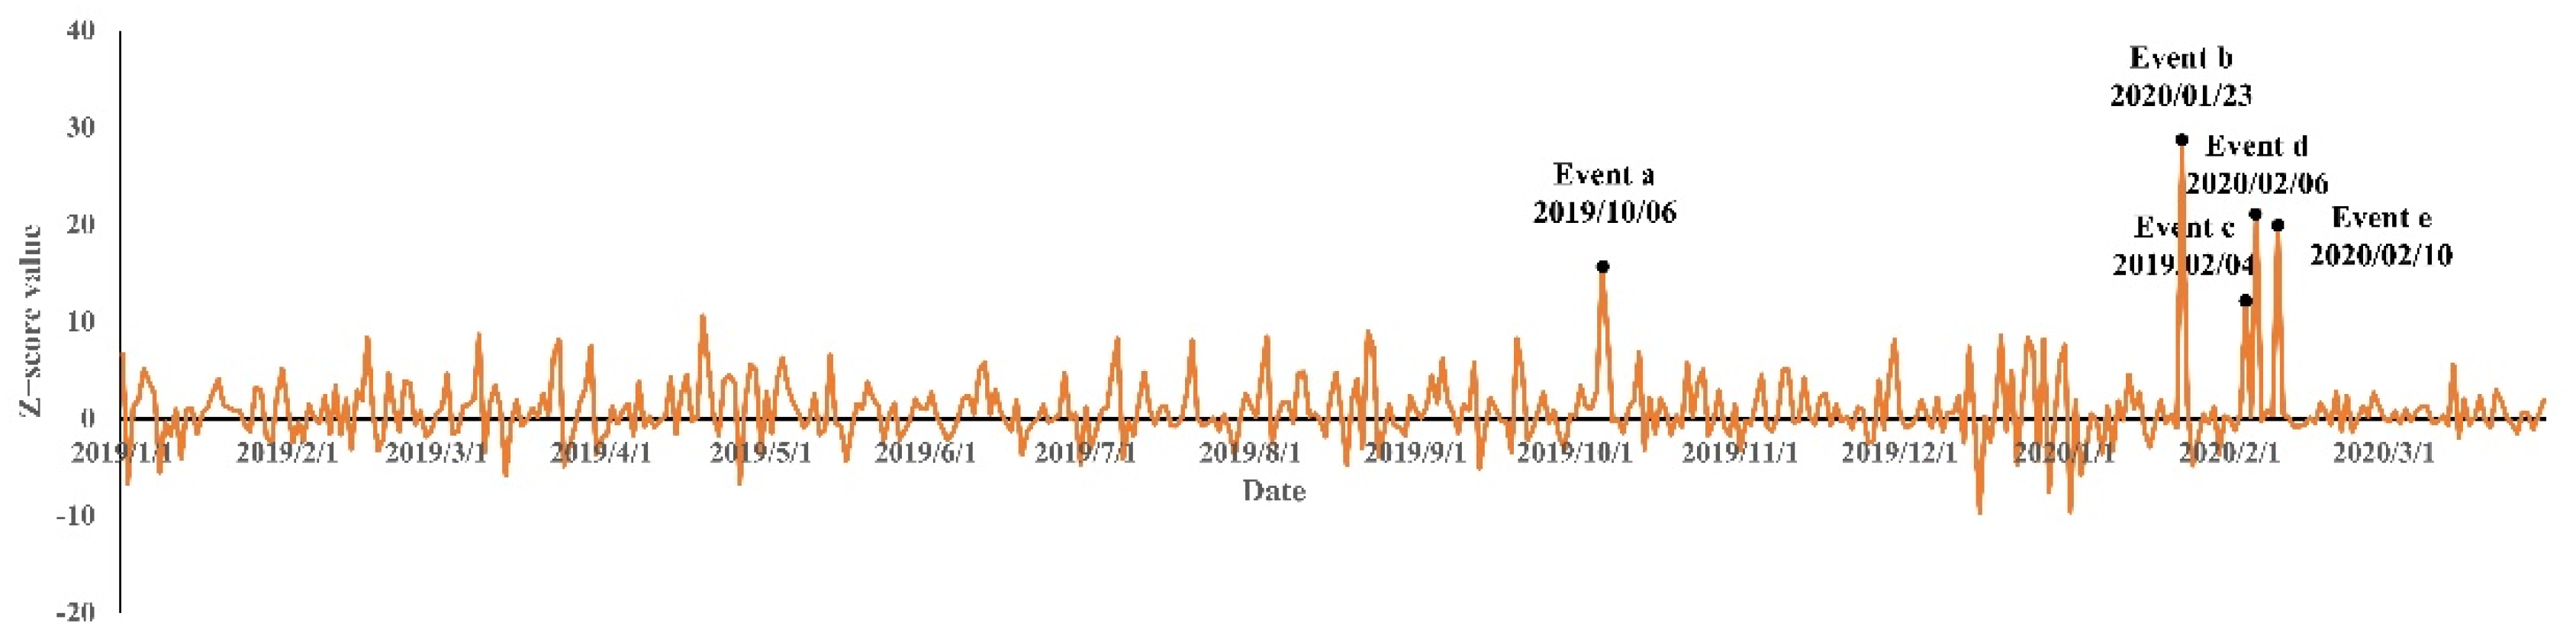
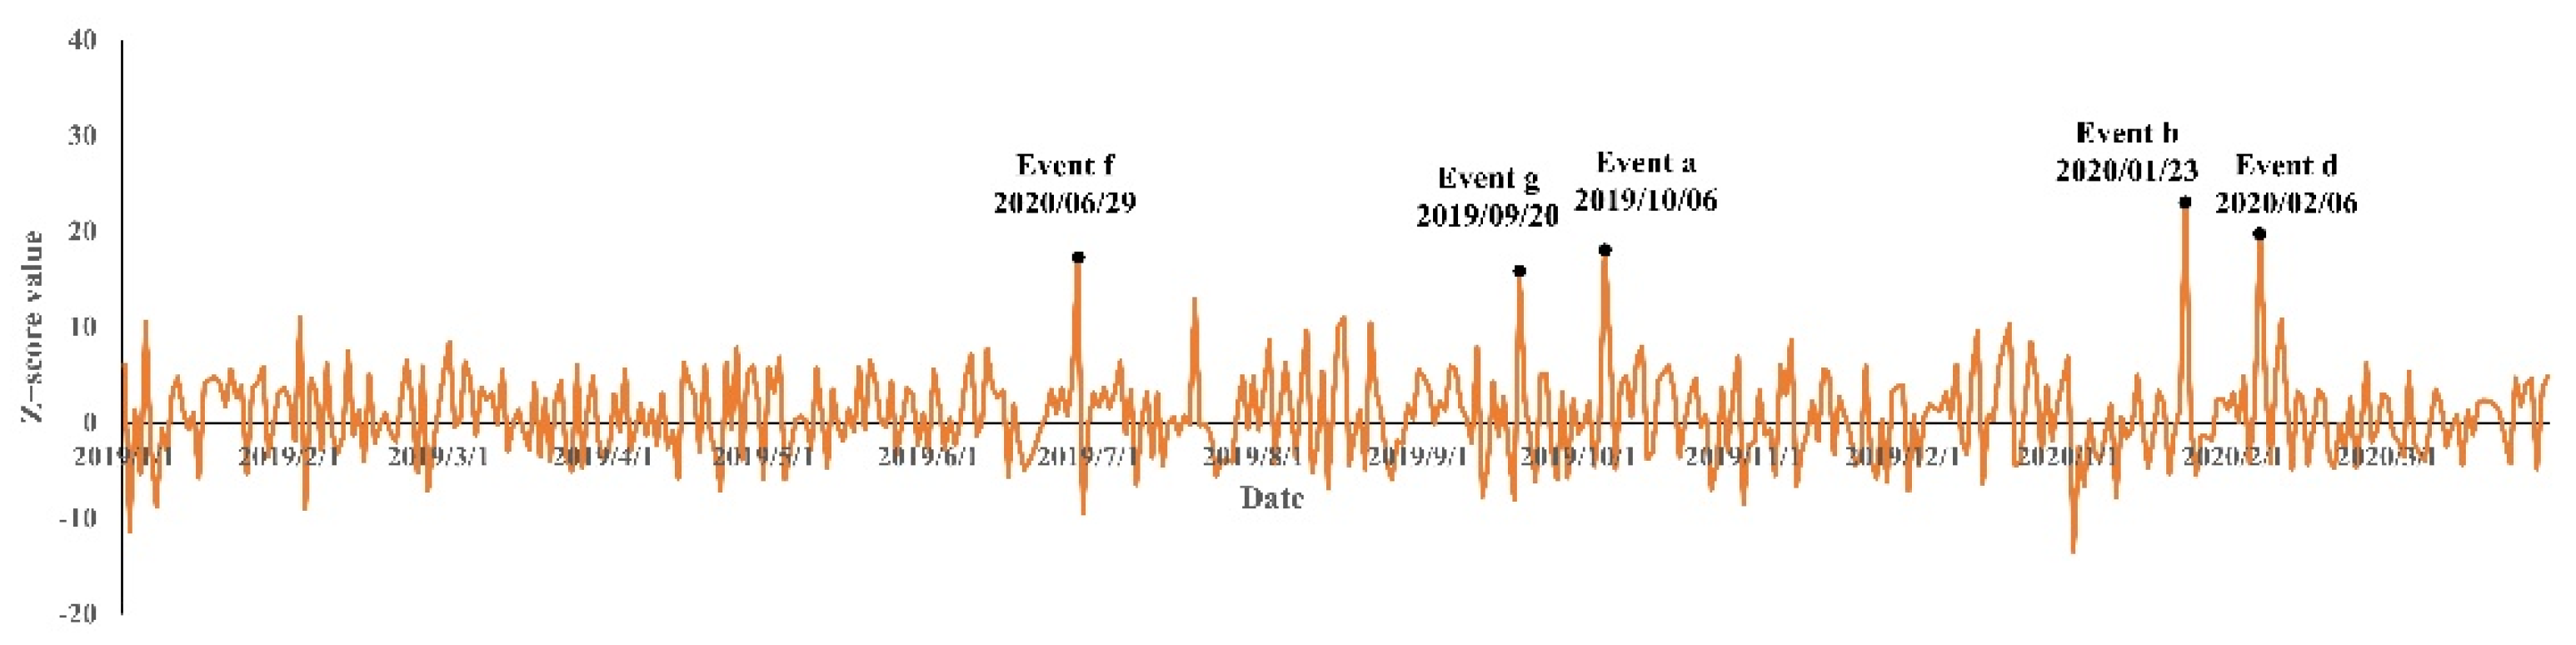
  • Event a The traffic jam. As many people returned to Beijing on the last day of the Nation Day holiday, the traffic within Beijing significantly increased. The traffic jam in the road in Grid A prompted people to post negative sentiment on social media platforms.
  • Event b Wuhan lockdown. Due to the Epidemic of COVID-19, Wuhan city was put into lockdown. The event of the Wuhan lockdown also shocked the residents in Beijing. Most residents express their best wishes to Wuhan. For example, they posted “Wuhan, come on!” on social media platforms.
  • Event c Infected group. Some people who lived near Xinyi community were confirmed to be infected by COVID-19. This infected group caused panic within residents in Grid A.
  • Event d Confirmed cases of COVID-19 within the community. On 6 February 2020, a lady was confirmed to be infected by COVID-19. This lady returned to Beijing from Wuhan and is the first confirmed case within Xinyi community.
  • Event e The closed management of the community. Owing to the COVID-19 epidemic, the manager of Xinyi community started to close the community on 23 January 2020. All outsiders, including employees of express, were not allowed to enter the community.
From the detection results above, we found that our approach can accurately detect a collection of urban events, ranging from regional events such as festivals and the Wuhan lockdown, to local events such as infected groups and a traffic jam. Our approach was proven to be an effective method for detecting COVID-19-related events, such as the closed management of a community and confirmed cases of COVID-19 within a community. In addition, the texts of social media data were proved to be a reliable data resource for extracting detailed event-related information.

5.2. Comparative Analysis of Detection Results

To explore the impact of considering long temporal dependency on event detection, the detection results of LSTM were compared with those of Elman NN and ARIMA. The time lag of the Elman NN was set as 7 days. The parameters in ARIMA were determined on the basis of autocorrelation functions (ACF) and partial autocorrelation functions (PACF). The 5 major positive and 5 major negative events detected by the ARIMA and Elman NN in Grid A are shown from Figure 11, Figure 12, Figure 13 and Figure 14.
From Figure 11 and Figure 12, we can find that the major positive events detected by Elman NN and ARIMA are the same as the LSTM, while there are significant differences between the detection results of negative events. Based on Figure 13, Elman NN cannot detect an infected group (Event c) and the confirmed cases of COVID-19 within a community (Event d). In Figure 14, ARIMA cannot detect any local COVID-19-related events (Events c, d and e). In addition, the Events g, f and h detected by Elman NN and ARIMA could not be identified as an actual urban event based on text analysis.
Based on the comparative analysis of the detection results, we can find the events detected by LSTM were more reliable than those from ARIMA and Elman NN. The method based on LSTM has a stronger ability to detect negative events. This demonstrated that considering long temporal dependency of sentiment strength can significantly improve the reliability of event detection.

6. Conclusions

The development of location technology provides considerable opportunities for applying geotagged social media data to investigate urban-related issues. In this study, we presented an improved approach for using geotagged social media data to detect urban events. The results indicated that (1) our approach can detect urban events in a cost-effective way, (2) considering long temporal dependency of sentiment strength in social media data can significantly improve the reliability of event detection, (3) social media texts can be a reliable data resource for extracting event-related information. Based on our study, administrators can develop more effective strategies to monitor a city. For example, for spatial areas with high event frequencies, more surveillance equipment can be placed to monitor the dynamics of crowds attracted by events. Furthermore, our results can provide more useful information regarding the urban events to thereby optimize event responses from government departments, especially in the context of epidemic transmission.
Although our study suggests a promising method for detecting urban events, the detection result based on social media data does not contain the Spring Festival, the biggest urban event in China. This is because the number of social media users within the study area significantly decreased during the Spring Festival. The proportion of floating population in Beijing is more than 30%. During the Spring Festival, most of the floating population left Beijing and returned to their hometown. Owing to the decline of social media users, the Spring Festival cannot attract enough attention within the study area and is difficult to detect.
Our method combined sentiment analysis and LSTM to predict the dynamic of positive and negative sentiment strength in social media data. In some areas, such as tourist attractions, users were prone to sharing their sentiment on social media platforms; both the negative and positive sentiment strength kept to a high level. In our study, urban events refer to anomalies that deviate significantly from the prediction of sentiment strength. The proposed method can predict the high value of sentiment strength and capture the anomalies of urban events in these areas effectively.
The event detection research based on social media data can be broadly classified into two categories: targeted domain studies, and general domain studies [1,47]. In this study, we introduced a new method of detecting events in general domains. Compared with targeted-domain methods, our method may be suitable for detecting urban events in more domains or contexts. The proposed method in our study is data-driven. This method greatly depends on the availability of data and the fact that users decide to share posts about certain events. The quality of social media data can significantly influence the results of our method. First, our method cannot detect any events whose information was not posted by social media users. If users do not express their sentiment related to the target event on the social media platform, our method doesn’t have the ability to detect this target event. Second, users tend to post positive sentiments on social media platforms. This tendency can increase the statistical result regarding positive sentiment strength. Our method takes anomalies in the trend of sentiment strength as urban events. Therefore, our method may be more sensitive to the positive event and the reliability of the detection result of a negative event may be relatively low.
In future studies, we need to focus on the potential problems in practical applications of social media data and the proposed method. The following problems should be addressed:
  • Data resource. Our method depends on the amount and quality of shared information through social media. The majority of social media users were young people. In addition, users are more prone to post positive sentiment on social media platforms. Therefore, social media data does have some disadvantages in urban event detection. In future, more reliable data resources, such as videos and questionnaires, will be introduced to correct the bias of social media data.
  • Data set size. Although we combined the data in Beijing and Wuhan, the data set is not large enough for evaluating the scalability of our method. In the future, we will expand our data set by collecting more Chinese social media data and applying available and open-source data sets.
  • Spatial units. In our case, 1 km × 1 km regular grids were applied as spatial units to divide the study area and the daily positive and negative sentiment strengths in each grid were counted. Different units can generate different detection results. Our research team will pay more attention to the effect of the spatial scales and shapes of units on urban event detection, and then obtain the best-fit spatial units.
  • The types of events. Urban events can be divided into different types, such as festivals, traffic accidents and disease outbreaks. In this study, we mainly focused on the detection method based on geotagged social media data. The detected events were classified and named, manually. In future, we will develop an identification method for events.
  • Sentiment strength evaluation. The sentiment strength in social media data is related to the geographic area and application domain. In this study, we applied a dictionary-based method proposed by a previous study. Without considering the impact of geographic area and application domain, the evaluation accuracy of sentiment strength is relatively low. In future, we will focus on studying the method of quantifying the sentiment strength with high accuracy.

Author Contributions

Conceptualization, Wei Jiang and Yandong Wang; Data curation, Zhengan Xiong; Formal analysis, Yandong Wang; Funding acquisition, Yandong Wang; Investigation, Weidong Cao; Methodology, Xiaoqing Song; Project administration, Yandong Wang; Resources, Wei Jiang; Software, Zhengan Xiong and Xiaoqing Song; Supervision, Yi Long; Validation, Wei Jiang, Xiaoqing Song and Yi Long; Visualization, Zhengan Xiong; Writing—original draft, Wei Jiang; Writing—review & editing, Yandong Wang. All authors have read and agreed to the published version of the manuscript.

Funding

This research was funded by the Nature Science Foundation of Anhui province, China, Grant No. 1908085QD165; the Open Fund of State Laboratory of Information Engineering in Surveying, Mapping and Remote Sensing, Wuhan University, Grant No. 20I04; the National Key Research and Development Program of China, Grant No. 2016YFB0501403; the National Natural Science Foundation of China, Grant No. 41271399; the China Special Fund for Surveying, Mapping and Geoinformation Research in the Public Interest, Grant No. 201512015; and the Undergraduate Innovation and Entrepreneurship Training Program of Anhui Normal University, Grant No. 202010370188.

Institutional Review Board Statement

Not applicable.

Informed Consent Statement

Not applicable.

Data Availability Statement

Restrictions apply to the availability of these data. Data was obtained from SINA and are available https://open.weibo.com/ (accessed on 8 May 2021) with the permission of SINA.

Acknowledgments

The authors would like to thank the anonymous reviewers and the editors for their valuable comments and suggestions on earlier versions of the manuscript.

Conflicts of Interest

The authors declare no conflict of interest.

References

  1. Xi, Z.; Guo, D. Urban event detection with big data of taxi OD trips: A time series decomposition approach. Trans. GIS 2017, 21, 560–574. [Google Scholar] [CrossRef]
  2. Shi, X.; Xue, B.; Tsou, M.-H.; Ye, X.; Spitzberg, B.; Gawron, J.M.; Corliss, H.; Lee, J.; Jin, R. Detecting events from the social media through exemplar-enhanced supervised learning. Int. J. Digit. Earth 2019, 12, 1083–1097. [Google Scholar] [CrossRef]
  3. Wang, Y.; Wang, T.; Ye, X.; Zhu, J.; Lee, J. Using Social Media for Emergency Response and Urban Sustainability: A Case Study of the 2012 Beijing Rainstorm. Sustainability 2015, 8, 142–143. [Google Scholar] [CrossRef]
  4. Calabrese, F.; Colonna, M.; Lovisolo, P.; Parata, D.; Ratti, C. Real-Time Urban Monitoring Using Cell Phones: A Case Study in Rome. IEEE Trans. Intell. Transp. Syst. 2011, 12, 141–151. [Google Scholar] [CrossRef]
  5. Sasahara, K.; Hirata, Y.; Toyoda, M.; Kitsuregawa, M.; Aihara, K. Quantifying Collective Attention from Tweet Stream. PLoS ONE 2013, 8, e61823. [Google Scholar] [CrossRef]
  6. Hua, T.; Chen, F.; Zhao, L.; Lu, C.T.; Ramakrishnan, N. Automatic targeted-domain spatiotemporal event detection in twitter. Geoinformatica 2016, 20, 765–795. [Google Scholar] [CrossRef]
  7. Shi, Y.; Deng, M.; Yang, X.; Gong, J. Detecting anomalies in spatio-temporal flow data by constructing dynamic neighbourhoods. Comput. Environ. Urban Syst. 2018, 67, 80–96. [Google Scholar] [CrossRef]
  8. Xu, S.; Li, S.; Wen, R. Sensing and detecting traffic events using geosocial media data: A review. Comput. Environ. Urban Syst. 2018, 72, 146–160. [Google Scholar] [CrossRef]
  9. Tao, C.; Thomas, W. Event detection using Twitter: A spatio-temporal approach. PLoS ONE 2014, 9, e97807. [Google Scholar] [CrossRef]
  10. Wang, M.; Wu, H.; Zhang, T. Identifying critical outbreak time window of controversial events based on sentiment analysis. PLoS ONE 2020, 15, e0241355. [Google Scholar] [CrossRef]
  11. Yu, M.; Bambacus, M.; Cervone, G.; Clarke, K.; Duffy, D.; Huang, Q.; Li, J.; Li, W.; Li, Z.; Liu, Q.; et al. Spatiotemporal event detection: A review. Int. J. Digit. Earth 2020, 1–27. [Google Scholar] [CrossRef] [Green Version]
  12. Nazir, F.; Ghazanfar, M.A.; Maqsood, M. Social media signal detection using tweets volume, hashtag, and sentiment analysis. Multimed. Tools Appl. 2019, 78, 3553–3586. [Google Scholar] [CrossRef]
  13. Hasan, M.; Orgun, M.A.; Schwitter, R. A survey on real-time event detection from the Twitter data stream. J. Inf. Sci. 2016, 44, 443–463. [Google Scholar] [CrossRef]
  14. Weiler, A.; Grossniklaus, M.; Scholl, M.H. Survey and Experimental Analysis of Event Detection Techniques for Twitter. Comput. J. 2017, 60, 329–346. [Google Scholar] [CrossRef] [Green Version]
  15. Liu, Y.; Sui, Z.; Kang, C.; Gao, Y. Uncovering Patterns of Inter-Urban Trip and Spatial Interaction from Social Media Check-In Data. PLoS ONE 2014, 9, e86026. [Google Scholar] [CrossRef] [PubMed]
  16. Kent, J.D.; Capello, H.T. Spatial patterns and demographic indicators of effective social media content during theHorsethief Canyon fire of 2012. Cartogr. Geogr. Inf. Sci. 2013, 40, 78–89. [Google Scholar] [CrossRef]
  17. Greff, K.; Srivastava, R.K.; Koutnik, J.; Steunebrink, B.R.; Schmidhuber, J. LSTM: A Search Space Odyssey. IEEE Trans. Neural Netw. Learn. Syst. 2017, 28, 2222–2232. [Google Scholar] [CrossRef] [Green Version]
  18. Hochreiter, S.; Schmidhuber, J. Long Short-Term Memory. Neural Comput. 1997, 9, 1735–1780. [Google Scholar] [CrossRef] [PubMed]
  19. Kong, X.; Xu, Z.; Shen, G.; Wang, J.; Yang, Q.; Zhang, B. Urban traffic congestion estimation and prediction based on floating car trajectory data. Future Gener. Comput. Syst. 2016, 61, 97–107. [Google Scholar] [CrossRef]
  20. Telang, A.; Deepak, P.; Joshi, S.; Deshpande, P.; Rajendran, R. Detecting localized homogeneous anomalies over spatio-temporal data. Data Min. Knowl. Discov. 2014, 28, 1480–1502. [Google Scholar] [CrossRef] [Green Version]
  21. Bianco, A.M.; Ben, M.G.; Martínez, E.J.; Yohai, V.J. Outlier Detection in Regression Models with ARIMA Errors using Robust Estimates. J. Forecast. 2001, 20, 565–579. [Google Scholar] [CrossRef]
  22. Cleveland, R.B.; Cleveland, W.S.; McRae, J.E.; Terpenning, I. STL: A seasonal trend decomposition procedure based on loess. J. Off. Stat. 1990, 6, 3–73. [Google Scholar]
  23. Chang, I.; Tiao, G.C.; Chen, C. Estimation of Time Series Parameters in the Presence of Outliers. Technometrics 1988, 30, 193–204. [Google Scholar] [CrossRef]
  24. Karlaftis, M.G.; Vlahogianni, E.I. Statistical methods versus neural networks in transportation research: Differences, similarities and some insights. Transp. Res. Part C Emerg. Technol. 2011, 19, 387–399. [Google Scholar] [CrossRef]
  25. Vlahogianni, E.I.; Golias, J.C.; Karlaftis, M.G. Short-term traffic forecasting: Overview of objectives and methods. Transp. Rev. 2004, 24, 533–557. [Google Scholar] [CrossRef]
  26. Lint, J.W.C.V.; Hoogendoorn, S.P.; Zuylen, H.J.V. Accurate freeway travel time prediction with state-space neural networks under missing data. Transp. Res. Part C Emerg. Technol. 2005, 13, 347–369. [Google Scholar] [CrossRef]
  27. Stathopoulos, A.; Karlaftis, M.G. A multivariate state space approach for urban traffic flow modeling and prediction. Transp. Res. Part C 2003, 11, 121–135. [Google Scholar] [CrossRef]
  28. Williams, G.; Baxter, R.; He, H.; Hawkins, S.; Gu, L. A Comparative Study of RNN for Outlier Detection in Data Mining. In Proceedings of the 2002 IEEE International Conference on Data Mining, Maebashi City, Japan, 9–12 December 2002; pp. 709–712. [Google Scholar] [CrossRef]
  29. Hawkins, S.; He, H.; Williams, G.; Baxter, R. Outlier Detection Using Replicator Neural Networks. In Proceedings of the 4th International Conference on Data Warehousing and Knowledge Discovery, Aix-en-Provence, France, 4–6 September 2002; pp. 170–180. [Google Scholar] [CrossRef]
  30. Ma, X.; Tao, Z.; Wang, Y.; Yu, H.; Wang, Y. Long short-term memory neural network for traffic speed prediction using remote microwave sensor data. Transp. Res. Part C 2015, 54, 187–197. [Google Scholar] [CrossRef]
  31. Wu, H.; Chen, Z.; Sun, W.; Zheng, B. Modeling trajectories with recurrent neural networks. In Proceedings of the 26th International Joint Conference on Artificial Intelligence, Melbourne, Australia, 19–25 August 2017; pp. 3083–3090. [Google Scholar] [CrossRef] [Green Version]
  32. Kanwar, S.; Mangal, N.; Niyogi, R. Event Detection over Twitter Social Media. In Proceedings of the First International Conference on Intelligent Computing and Communication, Bhubaneswar, India, 16–17 September 2016; pp. 177–185. [Google Scholar] [CrossRef]
  33. Comito, C. NexT: A framework for next-place prediction on location based social networks. Knowl.-Based Syst. 2020, 204, 106205. [Google Scholar] [CrossRef]
  34. Sakaki, T.; Okazaki, M.; Matsuo, Y. Tweet Analysis for Real-Time Event Detection and Earthquake Reporting System Development. IEEE Trans. Knowl. Data Eng. 2012, 25, 919–931. [Google Scholar] [CrossRef]
  35. Parikh, R.; Karlapalem, K. ET: Events from tweets. In Proceedings of the 22nd International Conference on World WideWeb, Rio de Janeiro, Brazil, 13–17 May 2013; pp. 613–620. [Google Scholar] [CrossRef]
  36. Li, C.; Sun, A.; Datta, A. Twevent: Segment-based event detection from Tweets. In Proceedings of the ACM International Conference on Information and Knowledge Management, Maui, HI, USA, 29 October–2 November 2012; pp. 155–164. [Google Scholar] [CrossRef]
  37. Marcus, A.; Bernstein, M.S.; Badar, O. TwitInfo: Aggregating and visualizing microblogs for event exploration. In Proceedings of the SIGCHI Conference on Human Factors in Computing Systems, Vancouver, BC, Canada, 7–12 May 2011; pp. 227–236. [Google Scholar] [CrossRef] [Green Version]
  38. Xie, R.; Zhu, F.; Ma, H. CLEar: A real-time online observatory for bursty and viral events. Proc. VLDB Endow. 2014, 7, 1637–1640. [Google Scholar] [CrossRef]
  39. Ritter, A.; Mausam, E.O.; Clark, S. Open domain event extraction from Twitter. In Proceedings of the 18th ACM SIGKDD International Conference on Knowledge Discovery and Data Mining, Beijing, China, 12–16 August 2012; pp. 1104–1112. [Google Scholar] [CrossRef] [Green Version]
  40. You, Y.; Huang, G.; Cao, J. GEAM: A general and event-related aspects model for Twitter event detection. In Proceedings of the International Conference on Web Information Systems Engineering, Nanjing, China, 13–15 October 2013; pp. 319–332. [Google Scholar] [CrossRef]
  41. Mehrotra, R.; Sanner, S.; Buntine, W.; Xie, L. Improving LDA topic models for microblogs via tweet pooling and automatic labeling. In Proceedings of the 36th International ACM SIGIR Conference on Research and Development in Information Retrieval, Dublin, Ireland, 28 July–1 August 2013; pp. 889–892. [Google Scholar] [CrossRef] [Green Version]
  42. Tan, P.N.; Steinbach, M.; Kumar, V. Introduction to Data Mining; Addison-Wesley Longman Publishing: Boston, MA, USA, 2005. [Google Scholar]
  43. Hasan, M.; Orgun, M.A.; Schwitter, R. TwitterNews+: A framework for real time event detection from the Twitter data stream. In Proceedings of the 8th International Conference on Social Informatics, Bellevue, WA, USA, 11–14 November 2016; pp. 224–239. [Google Scholar] [CrossRef]
  44. Petrovic, S.; Osborne, M.; Lavrenko, V. Streaming first story detection with application to Twitter. In Proceedings of the Annual Conference of the North American Chapter of the Association for Computational Linguistics: Human Language Technologies, Los Angeles, CA, USA, 1–6 June 2010; pp. 181–189. [Google Scholar]
  45. Ouyang, Y.; Guo, B.; Zhang, J. SentiStory: Multi-grained sentiment analysis and event summarization with crowdsourced social media data. Pers. Ubiquitous Comput. 2017, 21, 97–111. [Google Scholar] [CrossRef]
  46. Zhang, Y.; Chen, N.; Du, W. A New Geo-Propagation Model of Event Evolution Chain Based on Public Opinion and Epidemic Coupling. Int. J. Environ. Res. Public Health 2020, 17, 9235. [Google Scholar] [CrossRef]
  47. Jiang, D.; Luo, X.; Xuan, J. Sentiment Computing for the News Event Based on the Big Social Media Data. IEEE Access 2017, 99, 2373–2382. [Google Scholar] [CrossRef]
  48. Nuaimi, A.A.; Shamsi, A.A.; Shamsi, A.A. Social Media Analytics for Sentiment Analysis and Event Detection in Smart Cities. In Proceedings of the 4th International Conference on Natural Language Computing (NATL 2018), Dubai, United Arab Emirates, 28–29 April 2018. [Google Scholar]
  49. Salas, A.; Georgakis, P.; Ammari, A. Traffic Event Detection Framework Using Social Media. In Proceedings of the 2017 International Conference on Smart Grid and Smart Cities, Singapore, 23–26 July 2017. [Google Scholar]
  50. Zou, X.; Jing, Y.; Zhang, J. Sentiment-based and hashtag-based Chinese online bursty event detection. Multimed. Tools Appl. 2018, 77, 21725–21750. [Google Scholar]
  51. Yu, X.; Zhong, C.; Li, D. Sentiment analysis for news and social media in COVID-19. In Proceedings of the SIGSPATIAL ‘20: 28th International Conference on Advances in Geographic Information Systems, Seattle, WA, USA, 3–6 November 2020. [Google Scholar]
  52. Jiang, W.; Wang, Y.; Dou, M.; Liu, S.; Shao, S.; Liu, H. Solving Competitive Location Problems with Social Media Data Based on Customers’ Local Sensitivities. ISPRS Int. J. Geo-Inf. 2019, 8, 202. [Google Scholar] [CrossRef] [Green Version]
  53. Hosseini, M.; Diraby, T.; Shalaby, A. Supporting sustainable system adoption: Socio-semantic analysis of transit rider debates on social media. Sustain. Cities Soc. 2018, 38, 123–136. [Google Scholar] [CrossRef]
  54. Rzeszewski, M.; Beluch, L. Spatial Characteristics of Twitter Users—Toward the Understanding of Geosocial Media Production. ISPRS Int. J. Geo-Inf. 2017, 6, 236. [Google Scholar] [CrossRef] [Green Version]
  55. Manoharan, S.; Ammayappan, S. Geospatial Social Media Analytics for Emotion Analysis of Theme Park Visitors using Text Mining and GIS. J. Inf. Technol. Digit. World 2020, 2, 100–107. [Google Scholar] [CrossRef]
  56. Chiu, C.; Chiu, N.H.; Sung, R.J. Opinion mining of hotel customer-generated contents in Chinese weblogs. Curr. Issues Tour. 2015, 18, 477–495. [Google Scholar] [CrossRef]
  57. Jiang, W.; Xiong, Z.; Su, Q.; Long, Y.; Song, X.; Sun, P. Using Geotagged Social Media Data to Explore Sentiment Changes in Tourist Flow: A Spatiotemporal Analytical Framework. ISPRS Int. J. Geo-Inf. 2021, 10, 135. [Google Scholar] [CrossRef]
  58. Liu, Z.; Wang, X.; Ma, J. The influence of public spaces on neighborhood social interaction in transitional urban Beijing: Comparing local residents and migrants. Sci. Geogr. Sin. 2020, 40, 69–78. [Google Scholar]
  59. He, Y.; Chen, Y.; Li, Z. Analysis on spatial structural characteristics of land use of Beijing City. Trans. Chin. Soc. Agric. Eng. 2010, 26, 313–318. [Google Scholar]
  60. Dong, C.; Zhao, R.; Liu, J.-P.; Wang, G.-X.; Xu, X.-Z. Application of geographical parameter database to establishment of unit population database. Chin. Geogr. Sci. 2003, 1, 36–40. [Google Scholar] [CrossRef]
  61. Hung, C.C.; Peng, W.C. A regression-based approach for mining user movement patterns from random sample data. Data Knowl. Eng. 2011, 70, 1–20. [Google Scholar] [CrossRef]
  62. Wang, Y.; Teng, W.; Tsou, M.-H. Mapping Dynamic Urban Land Use Patterns with Crowdsourced Geo-Tagged Social Media (Sina-Weibo) and Commercial Points of Interest Collections in Beijing, China. Sustainability 2016, 8, 1202. [Google Scholar] [CrossRef] [Green Version]
  63. Schmidhuber, J.; Gers, F.; Eck, D. Learning nonregular languages: A comparison of simple recurrent networks and LSTM. Neural Comput. 2002, 14, 2039–2041. [Google Scholar] [CrossRef] [PubMed]
  64. Zhou, Y.; Huang, C.; Hu, Q.; Jia, Z.; Yong, T. Personalized learning full-path recommendation model based on LSTM neural networks. Inf. Sci. 2018, 444, 135–152. [Google Scholar] [CrossRef]
  65. Gers, F.A.; Schmidhuber, J.; Cummins, F. Learning to forget: Continual prediction with LSTM. Neural Comput. 2000, 12, 2451–2471. [Google Scholar] [CrossRef]
  66. Srivastava, N.; Hinton, G.; Krizhevsky, A.; Sutskever, I. Dropout: A simple way to prevent neural networks from overfitting. J. Mach. Learn. Res. 2014, 15, 1929–1958. [Google Scholar]
  67. Crosby, T. How to Detect and Handle Outliers. Technometrics 1994, 36, 315–316. [Google Scholar] [CrossRef]
Figure 1. The distribution of the study area.
Ijgi 10 00322 g001
Figure 2. The spatial area where we collected data in Wuhan.
Ijgi 10 00322 g002
Figure 3. The method framework for detecting urban events with geotagged social media data.
Ijgi 10 00322 g003
Figure 4. Long short-term memory (LSTM) architecture.
Ijgi 10 00322 g004
Figure 5. The spatial distribution of positive events.
Ijgi 10 00322 g005
Figure 6. The spatial distribution of negative events.
Ijgi 10 00322 g006
Figure 7. The Z−score values and 5 major positive events in Grid A.
Ijgi 10 00322 g007
Figure 8. The Z−score values and 5 major negative events in Grid A.
Ijgi 10 00322 g008
Figure 9. The word cloud for each major positive event.
Ijgi 10 00322 g009
Figure 10. The word cloud for each major negative event.
Ijgi 10 00322 g010
Figure 11. The 5 major positive events detected by Elman NN in Grid A.
Ijgi 10 00322 g011
Figure 12. The 5 major positive events detected by ARIMA in Grid A.
Ijgi 10 00322 g012
Figure 13. The 5 major negative events detected by Elman NN in Grid A.
Ijgi 10 00322 g013
Figure 14. The 5 major negative events detected by ARIMA in Grid A.
Ijgi 10 00322 g014
Table 1. Sina Weibo data samples.
IDUser_IDUser_
Gender
Created_atTextGeoPOI_IDPOI_TitleSource
XXXXMale11:06:53
28 August 2017
【助我赢取77.77元现金大奖。】骑ofo小黄车集齐5种七夕卡,赢77.77元现金大奖。(【Help me win a prize of RMB 77.77.】Collect 5 kinds of cards by riding shared bikes.)116.447613; 39.951815NullNullPP时光机 (PPP time machine)
XXXXMale22:23:14
22 September 2017
187音频[音乐]承接大小录音棚,MIDI教室,工作室等等。 ([Music] The company of 187 Music undertakes following businesses: recording studio, MIDI classroom, music studio and so on)116.320648; 39.912772NullNull未通过审核的应用 (unapproved application)
XXXXFemale19:23:19
24 December 2017
羽泉演唱会还有十分钟开始!!(There are 10 min before Quan Yu’s concert starts!!)116.441803; 39.932159XX北京工人体育馆 (Beijing Worker Gymnasium)Samsung Galaxy S8
XXXXMale10:50:49
1 January 2018
在这里祝福大家2018年身体健康,万事如意!开心每一天! (Wish everyone good health and good luck in 2018! Happy every day!)116.397659; 39.906021XX天安门广场(Tiananmen Square)HUAWEI Mate 8
XXXXMale12:10:20
19 April 2018
后海附近马路着火了,堵车了。[允悲]希望无人员受伤。(There is a traffic jam caused by the fire on the road near Houhai. [Sad]. Hope no one gets hurt.)116.385483; 39.942132XX后海公园 (Houhai Park)iPhone 7 Plus
Publisher’s Note: MDPI stays neutral with regard to jurisdictional claims in published maps and institutional affiliations.

