
A Quantitative Analysis of Factors Influencing Organic Matter Concentration in the Topsoil of Black Soil in Northeast China Based on Spatial Heterogeneous Patterns

 , ,
, ,
Abstract
:1. Introduction
2. Materials and Methods
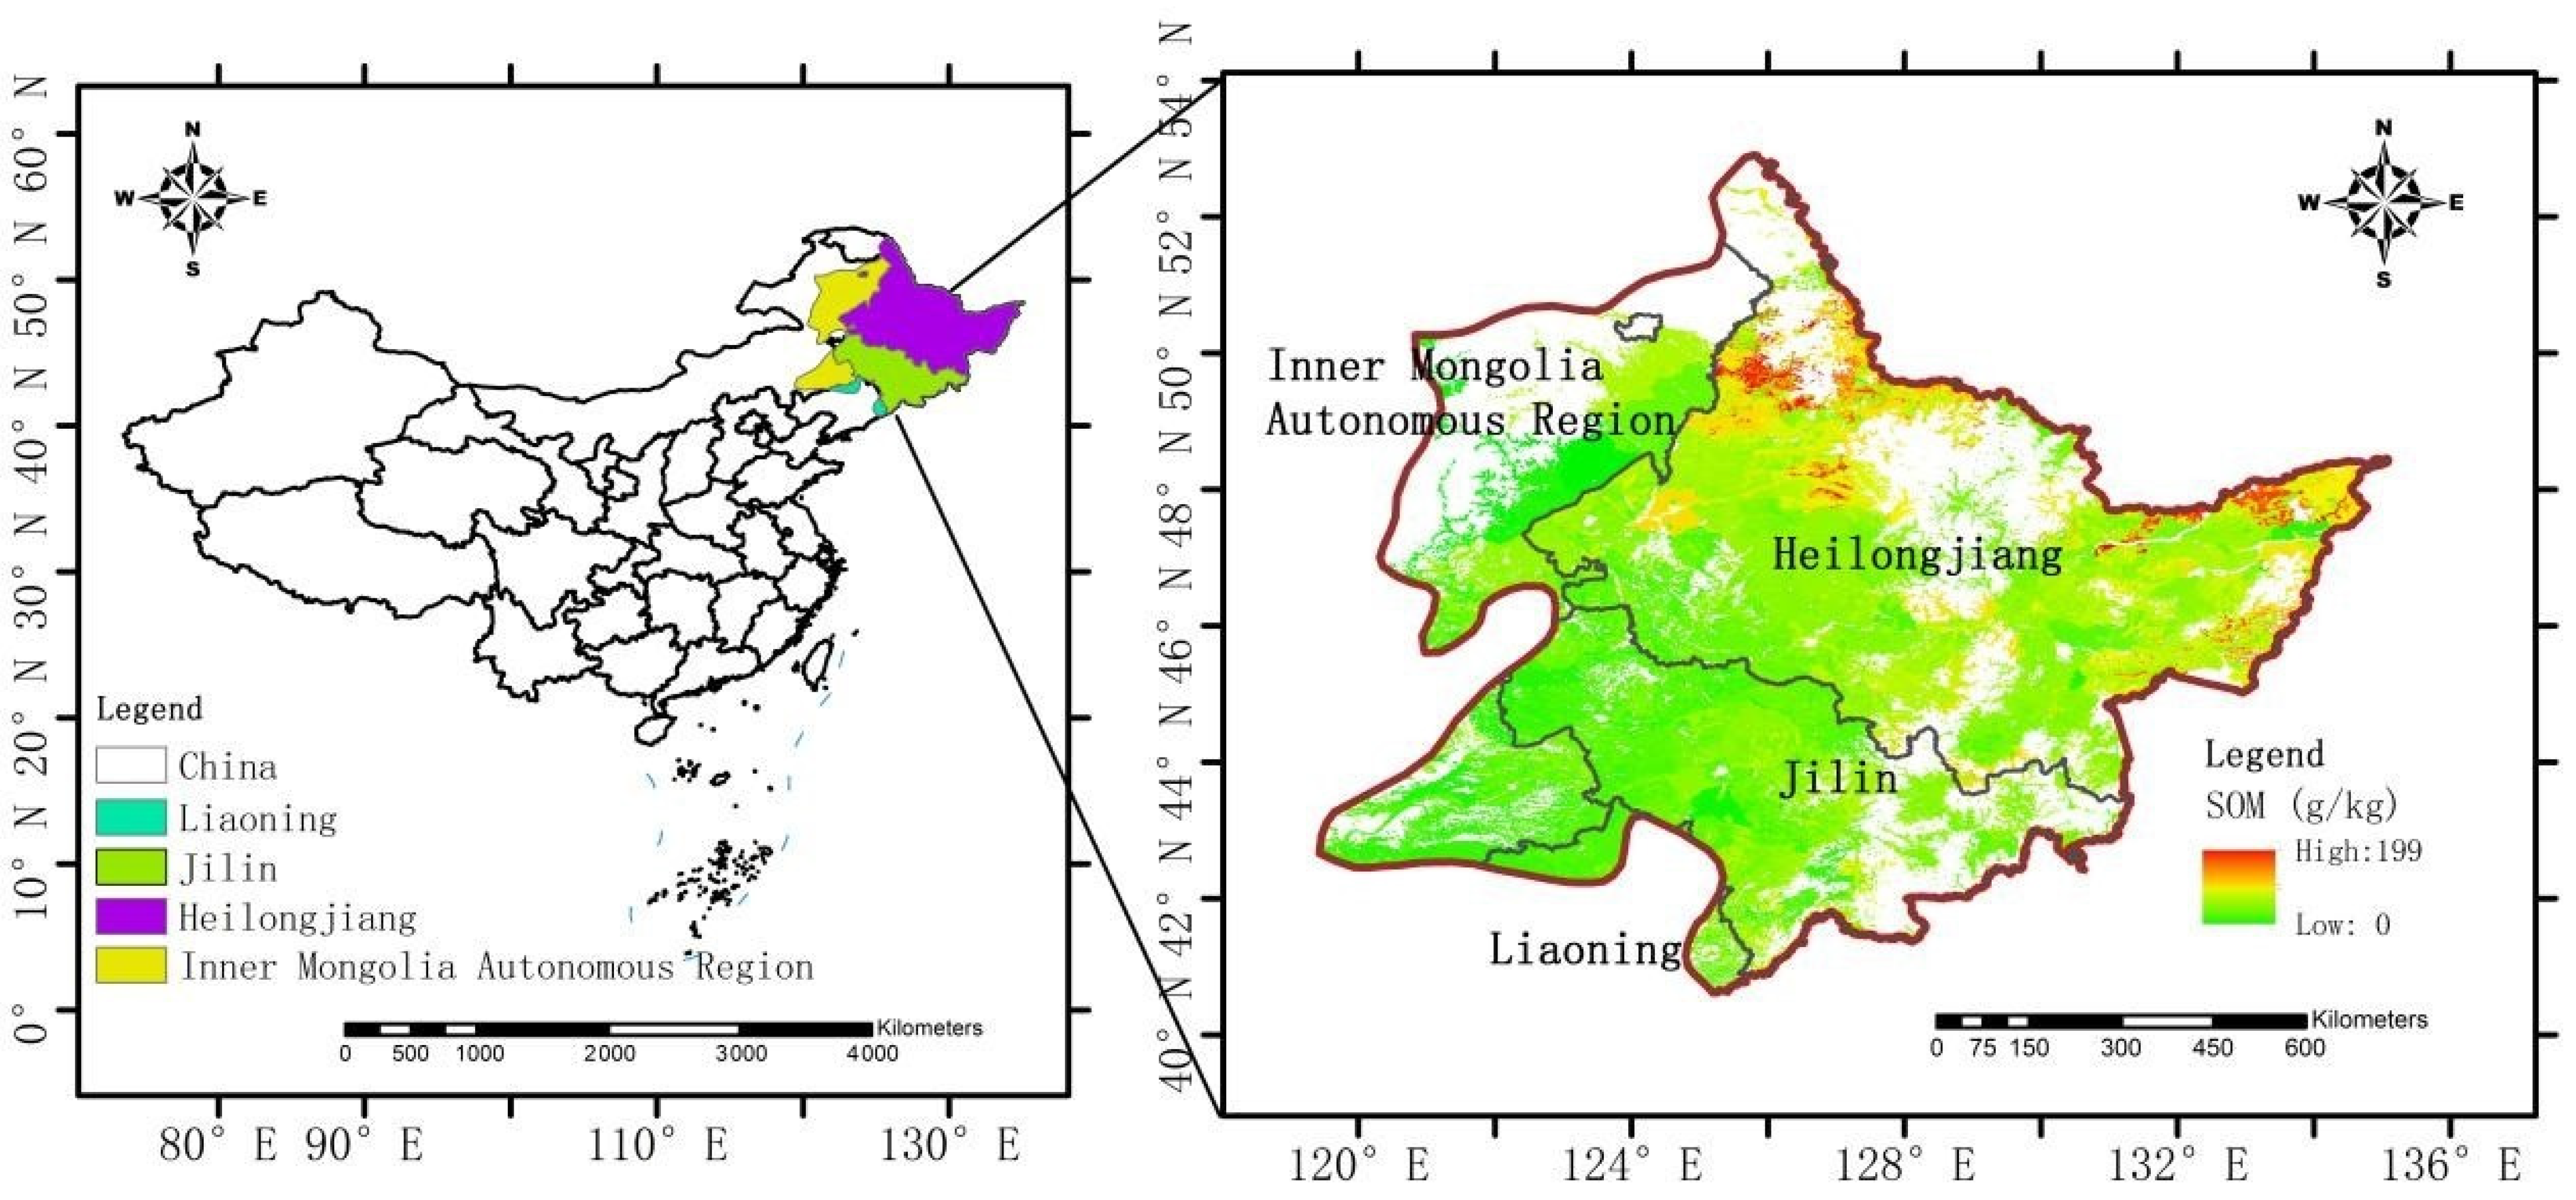
2.1. Study Area
2.2. Data Sources
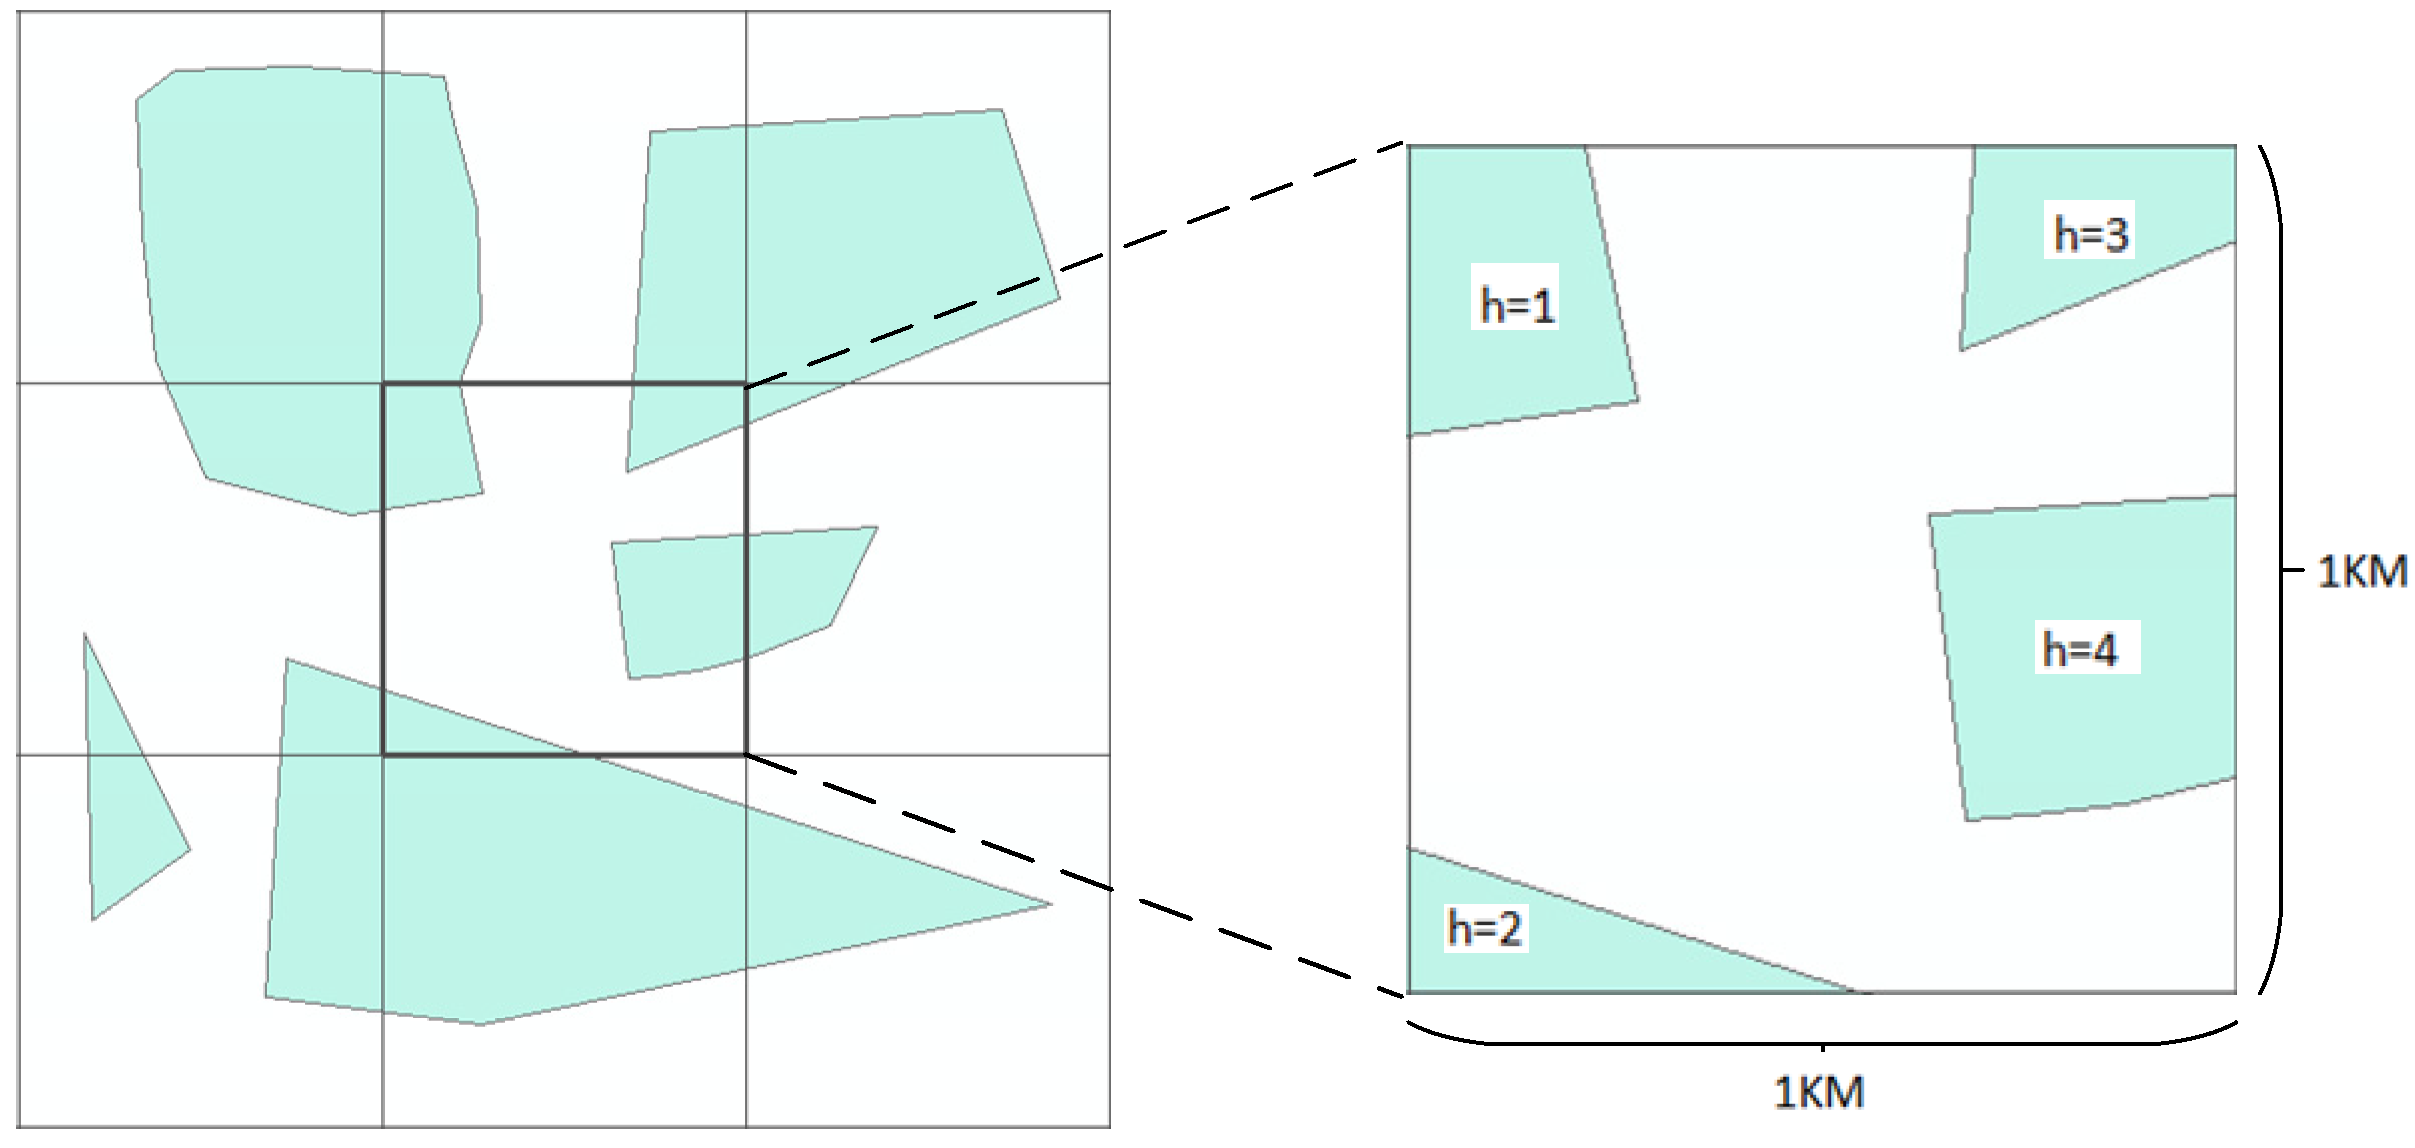
2.2.1. SOM Data
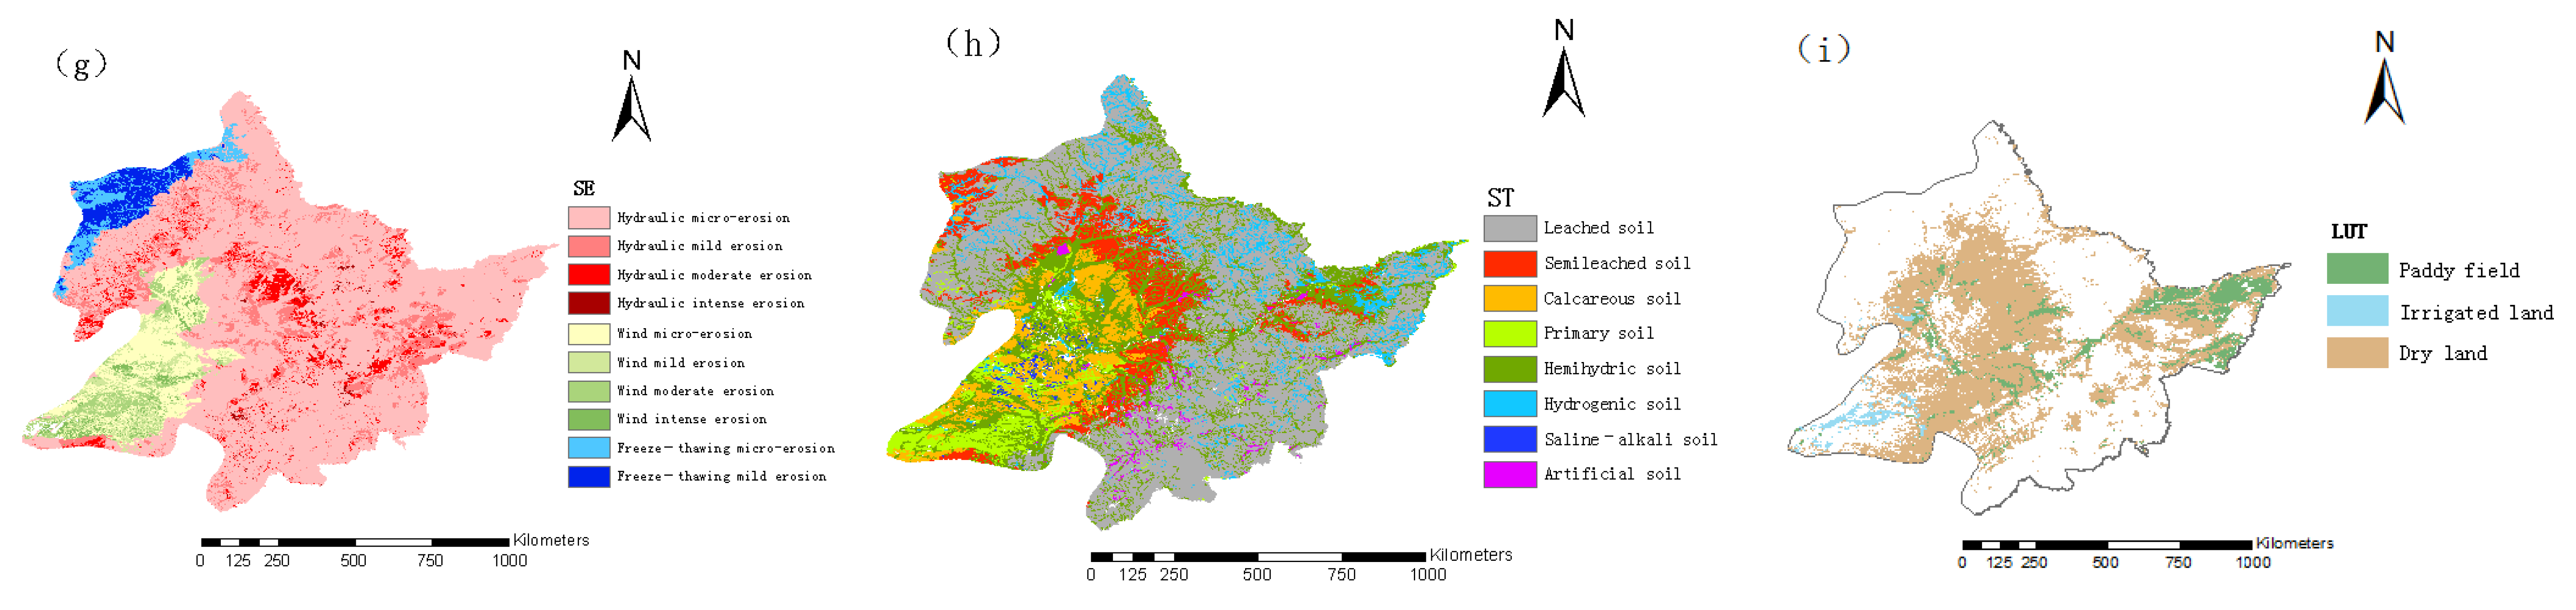
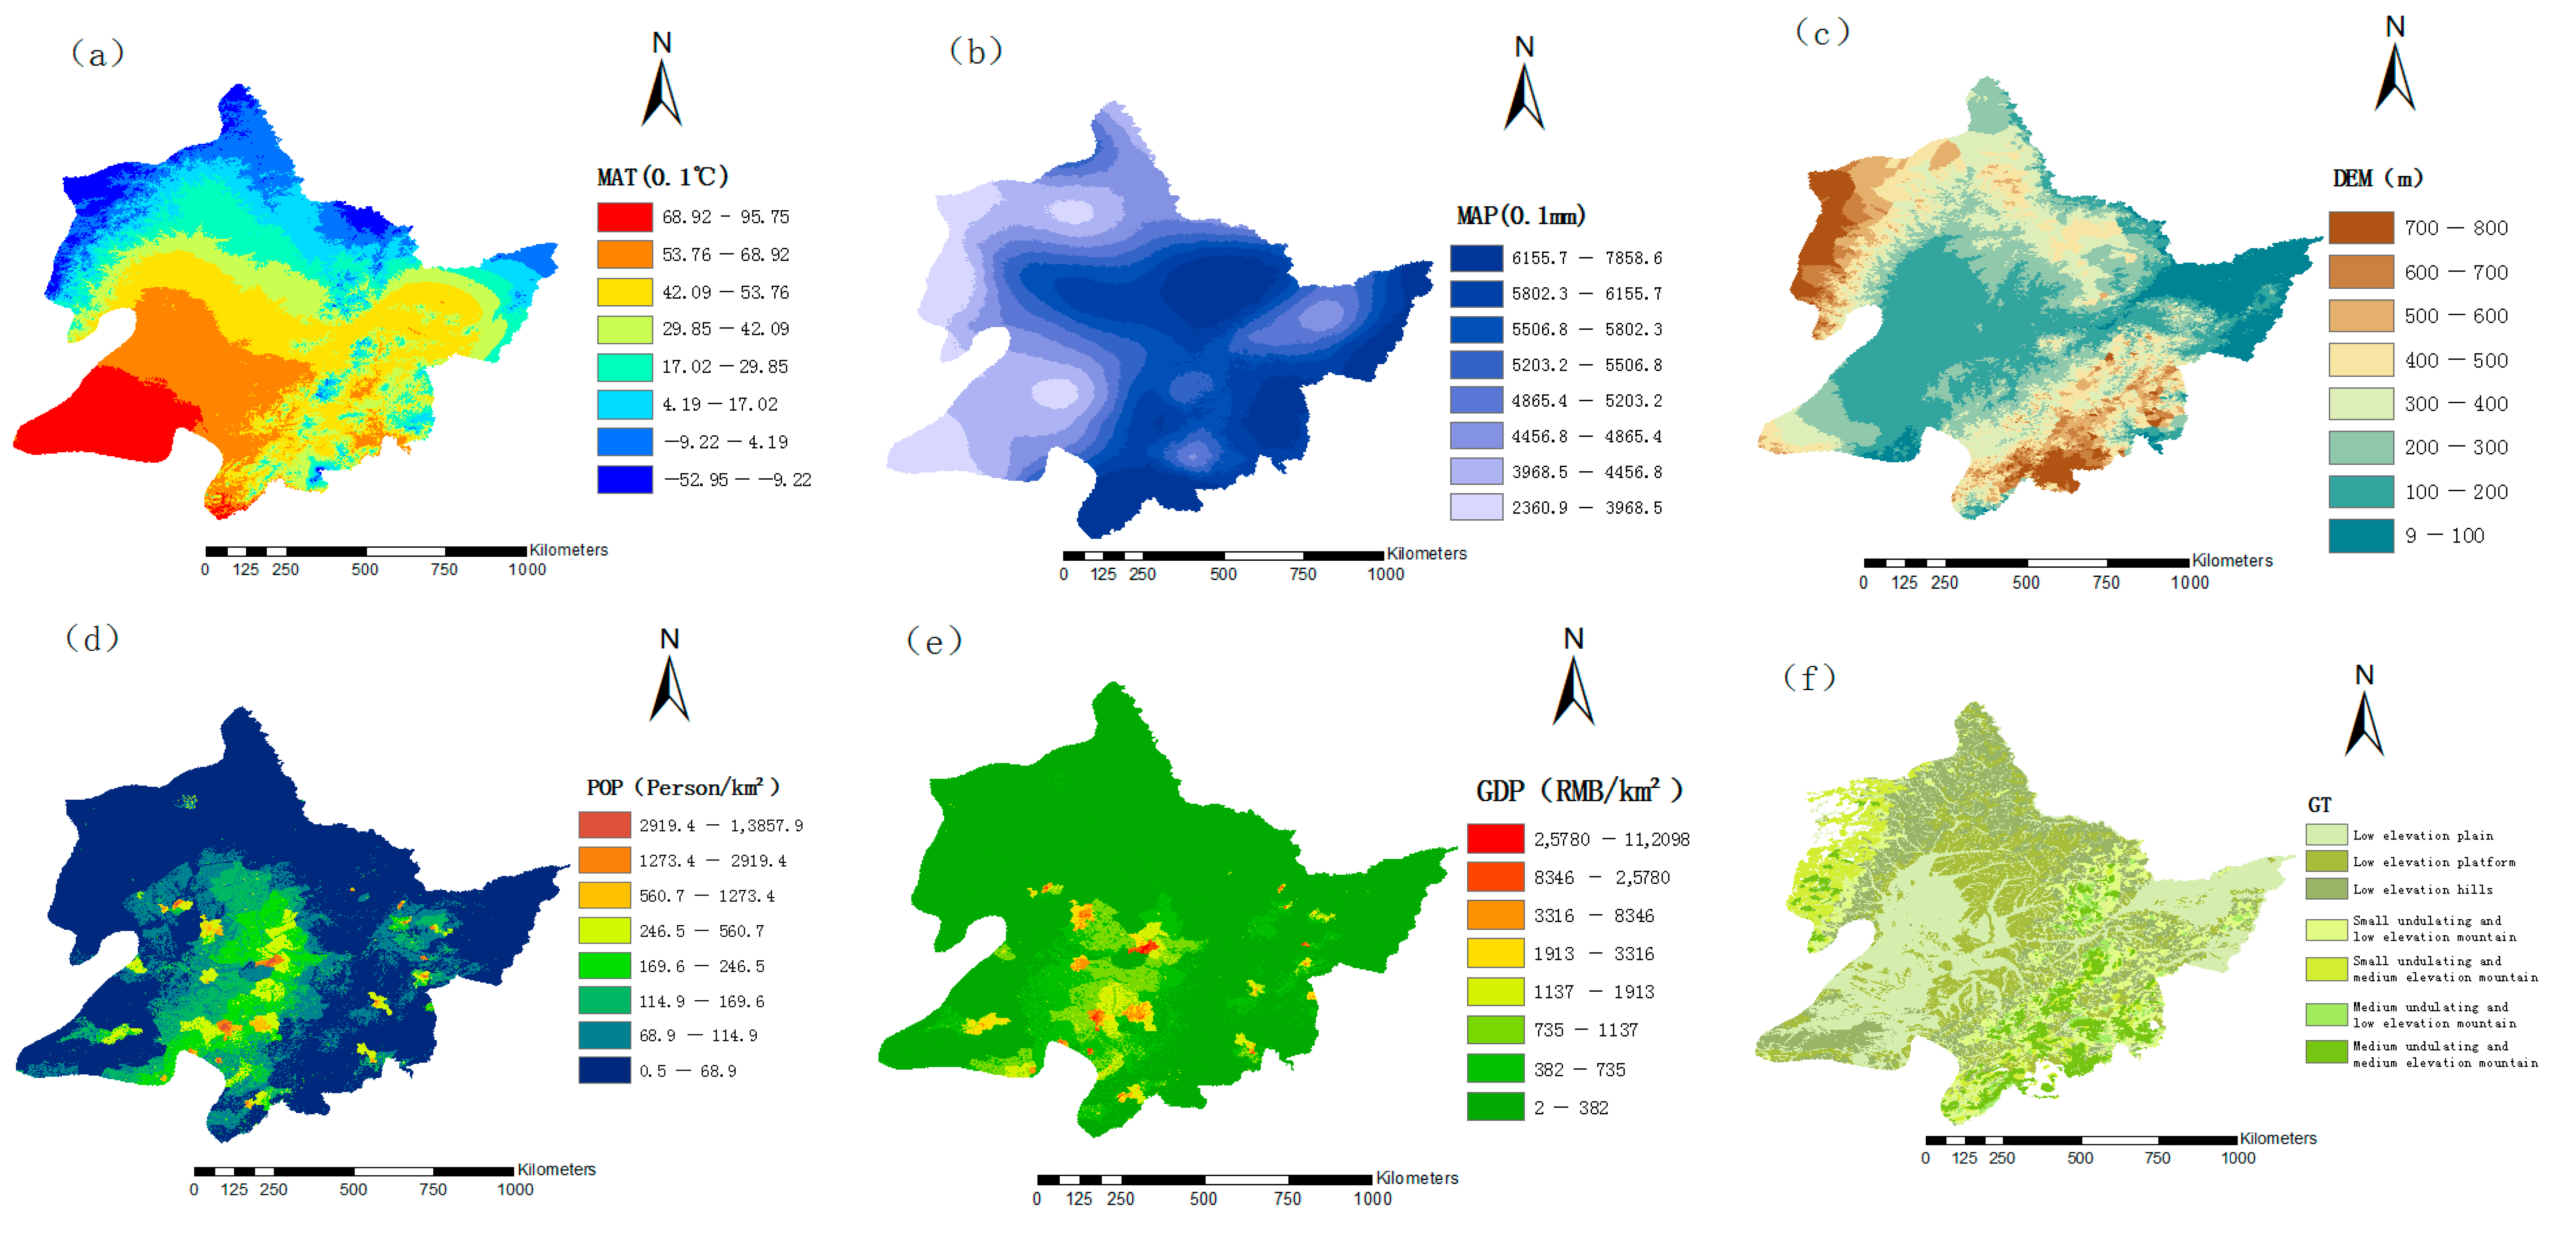
2.2.2. Influencing Factors
2.3. Method
2.3.1. The Factor Detector
2.3.2. The Interaction Detector
- If q (X1∩X2) < min (q (X1), q (X2)), the influences of two factors on SOM weaken each other nonlinearly.
- If min (q (X1), q (X2)) < q (X1∩X2) < max (q (X1), q (X2)), the influence of one factor on SOM is weakened.
- If q (X1∩X2) > max (q (X1), q (X2)), the influences of two factors on SOM are mutually enhanced.
- If q (X1∩X2) = q (X1) + q (X2), two factors are independent of each other.
- If q (X1∩X2) > q (X1) + q (X2), the influences of two factors on SOM are nonlinearly enhanced.
2.3.3. Impact Analysis
3. Results
3.1. Factor Detector Results
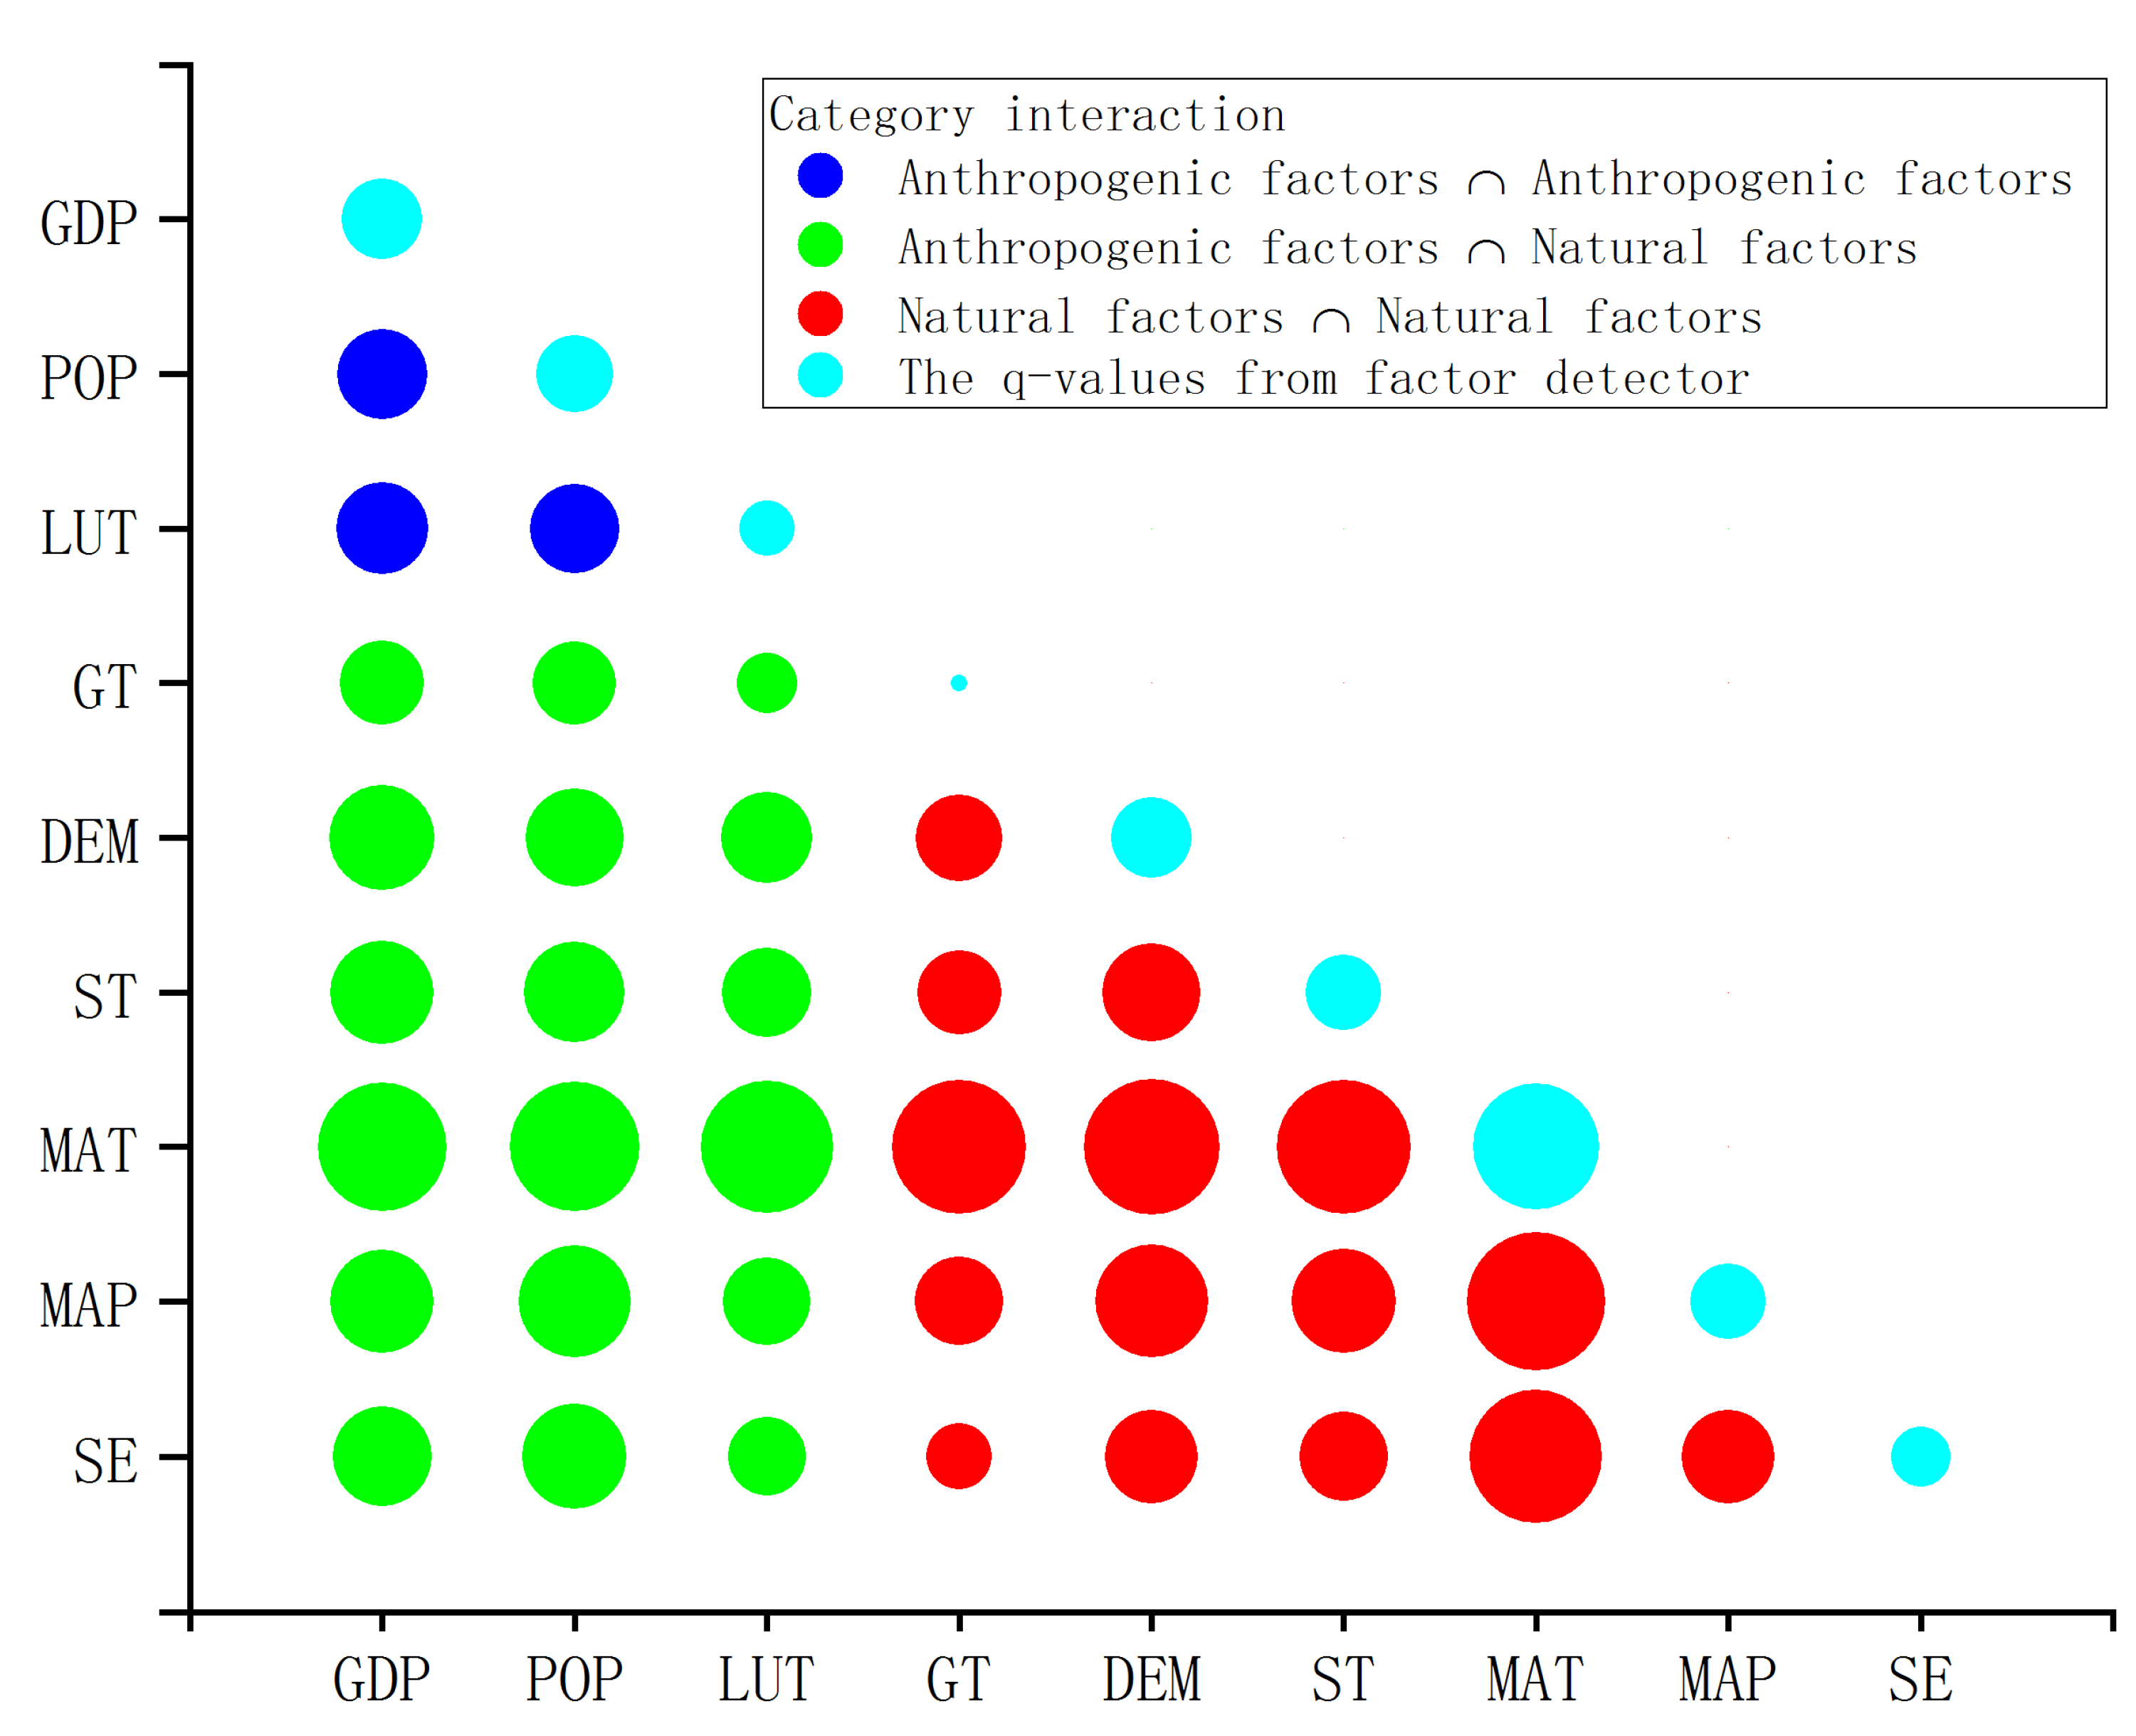
3.2. The Interaction of Detector Results
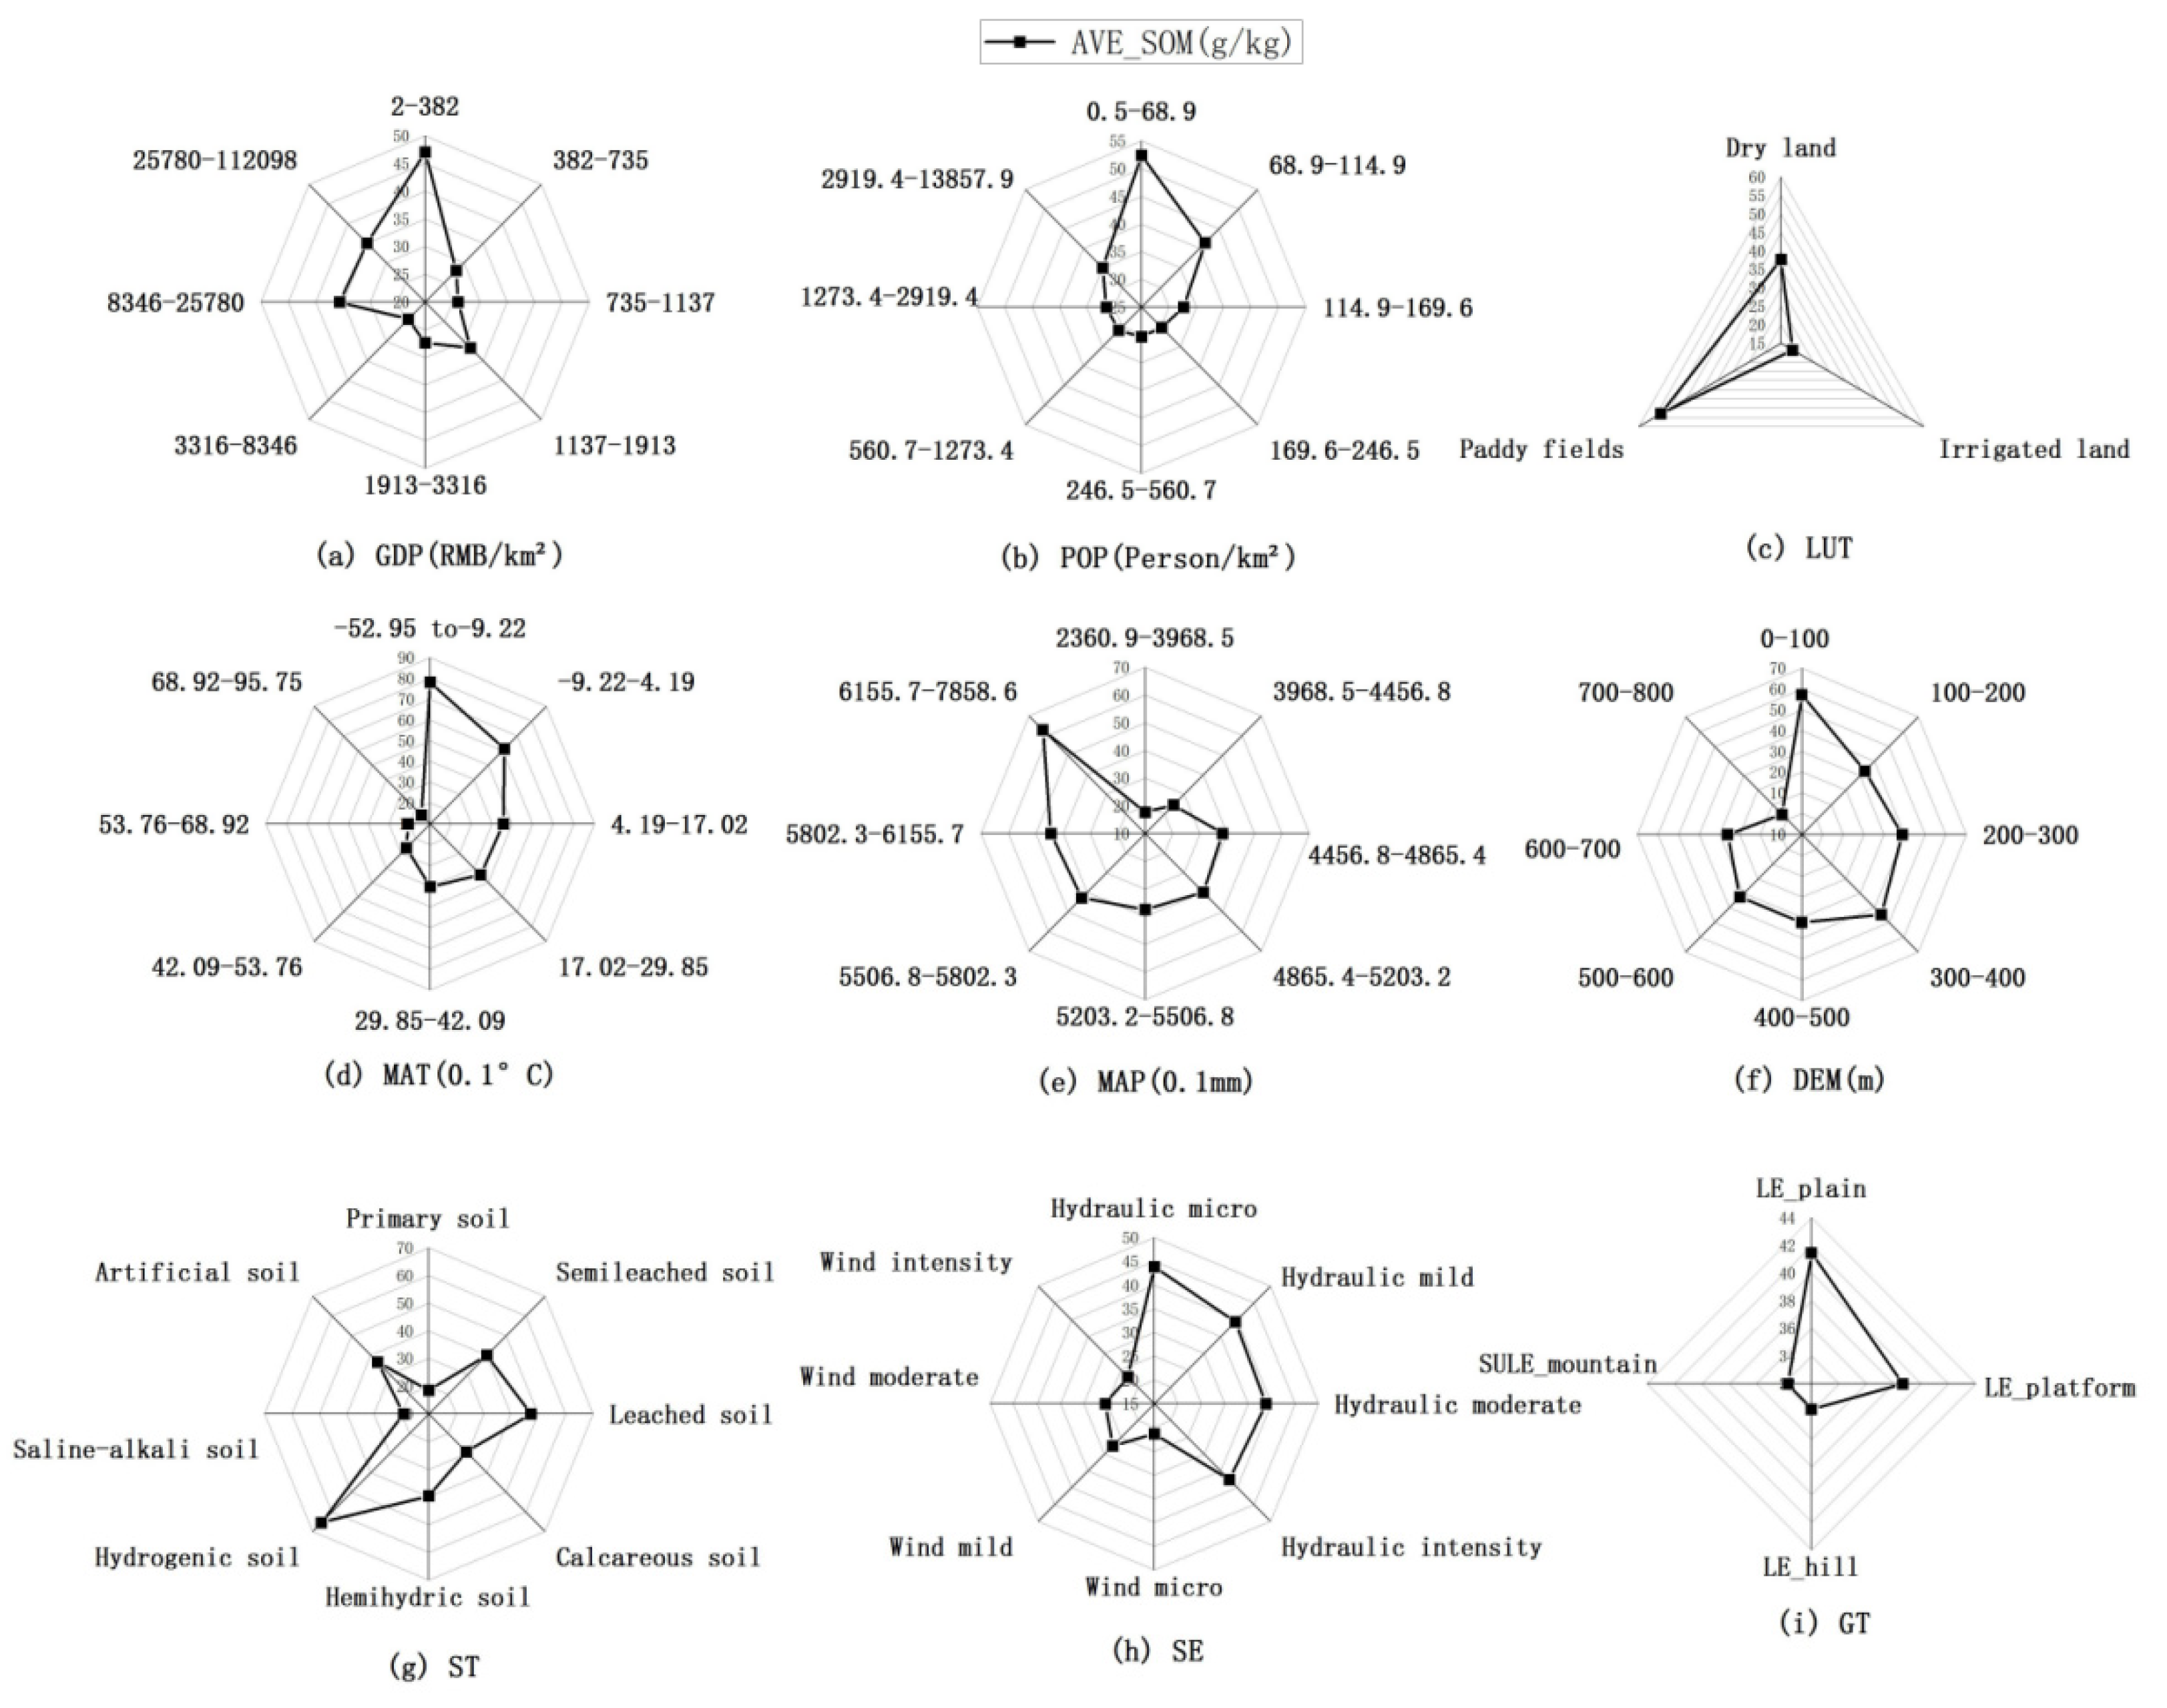
3.3. Impact Analysis Results
4. Discussion
5. Conclusions
- The nine factors analyzed have a significant relationship with the SOM content. In descending order of intensity, those factors include temperature, GDP, elevation, population, soil type, precipitation, soil erosion, land-use type, and geomorphic type.
- The interaction of any two factors enhanced their influence on SOM content; the most influential combinations include MAT + MAP (q = 0.43), DEM + MAT (q = 0.41), MAT + GT (q = 0.40), MAT + ST (q = 0.40), and MAT + LUT (q = 0.39).
- With increases in MAT, POP, SE, DEM, and terrain undulation, SOM content decreases. At the same time, SOM content is positively affected by MAP. Wind erosion has more significant impacts on SOM content than water erosion in the study area. When GDP is less than 1137, it is negatively related to SOM content. However, when GDP is greater than 1173, the correlation is positive. SOM content varies by soil type, following the principle of soil genesis, which is related to other natural factors, such as topography, parent material, climate, organism and age of soil. Hydromorphic soil, leached soil, and semi-leached soil are fertile. Among the three types of tillage, SOM content declines from high to low in paddy fields, dry land, and irrigated land.
Author Contributions
Funding
Institutional Review Board Statement
Informed Consent Statement
Acknowledgments
Conflicts of Interest
References
- Xie, H.; Shi, F.U.; Zhang, X.; Wang, J. Review on Characterization of SOM Stabilization and Affecting Factors. Chin. J. Soil Sci. 2003, 34, 459–462. [Google Scholar]
- He, Y.; Zhang, B.; Li, F.; Ma, C. The problems of agro-ecological environment and the countermeasures in black soil zone in Northeast China. Agric. Res. Arid Areas 2004, 22, 191–194. [Google Scholar]
- Guo, W. Establishing “special zone for cultivated land protection” and rationally developing and utilizing black soil layer. Land Resour. Inf. 2007, 12, 35–38. [Google Scholar]
- Moeckel, C.; Nizzetto, L.; Guardo, A.D.; Steinnes, E.; Freppaz, M.; Filippa, G.; Camporini, P.; Benner, J.; Jones, K.C. Persistent organic pollutants in boreal and montane soil profiles: Distribution, evidence of processes and implications for global cycling. Environ. Sci. Technol. 2008, 42, 8374–8380. [Google Scholar] [CrossRef]
- Chen, T.; Chang, Q.; Liu, J.; Clevers, J.G. Spatio-temporal variability of farmland soil organic matter and total nitrogen in the southern Loess Plateau, China: A case study in Heyang County. Environ. Earth Sci. 2016, 75, 28. [Google Scholar] [CrossRef]
- Barre, P.; Durand, H.; Chenu, C.; Meunier, P.; Montagne, D.; Castel, G.; Billiou, D.; Soucemarianadin, L.; Cecillon, L. Geological control of soil organic carbon and nitrogen stocks at the landscape scale. Geoderma 2017, 285, 50–56. [Google Scholar] [CrossRef]
- Singh, N.J.; Kudrat, M.; Jain, K. Effect of Land Use and Topography on Spatial Distribution of Soil Organic Carbon in Semi-arid Subtropical Ecosystems in Uttar Pradesh, India. Int. J. Ecol. Environ. Sci. 2014, 40, 189–197. [Google Scholar]
- Yu, H.; Zha, T.; Zhang, X.; Nie, L.; Pan, Y.J.C. Spatial distribution of soil organic carbon may be predominantly regulated by topography in a small revegetated watershed. Catena 2020, 188, 104459. [Google Scholar] [CrossRef]
- Shevtsova, L.; Romanenkov, V.; Sirotenko, O.; Smith, P.; Rodionova, V. Effect of natural and agricultural factors on long-term soil organic matter dynamics in arable soddy-podzolic soils—Modeling and observation. Geoderma 2003, 116, 165–189. [Google Scholar] [CrossRef]
- Dai, W.; Huang, Y. Relation of soil organic matter concentration to climate and altitude in zonal soils of China. Catena 2006, 65, 87–94. [Google Scholar] [CrossRef]
- Jiménez-González, M.A.; Lvarez, A.M.; Carral, P.; Almendros, G.J.C. Influence of soil forming factors on the molecular structure of soil organic matter and carbon levels. Catena 2020, 189, 104501. [Google Scholar] [CrossRef]
- Yang, L.; Shen, F.; Zhang, L.; Cai, Y.; Zhou, C. Quantifying influences of natural and anthropogenic factors on vegetation changes using structural equation modeling: A case study in Jiangsu Province, China. J. Clean. Prod. 2021, 280, 124330. [Google Scholar] [CrossRef]
- Lorenz, M.; Sören, T.B. Tree species affect soil organic matter stocks and stoichiometry in interaction with soil microbiota. Geoderma 2019, 353, 35–46. [Google Scholar] [CrossRef]
- Resende, T.M.; Rosolen, V.; Bernoux, M.; Moreira, M.Z.; da Conceição, F.T.; Govone, J.S. Dynamics of soil organic matter in a cultivated chronosequence in the Cerrado (Minas Gerais, Brazil). Soil Res. 2017, 55, 750–757. [Google Scholar] [CrossRef]
- Kong, X.S.; Luan, R.J.; Miao, Y.; Qi, S.H.; Li, F. Polycyclic aromatic hydrocarbons in sediment cores from the Dashiwei Tiankeng reach in the Bailang underground river, South China. Environ. Earth Sci. 2015, 73, 5535–5543. [Google Scholar] [CrossRef]
- Fan, M.; Lal, R.; Zhang, H.; Margenot, A.J.; Wu, J.; Wu, P.; Zhang, L.; Yao, J.; Chen, F.; Gao, C. Variability and determinants of soil organic matter under different land uses and soil types in eastern China. Soil Tillage Res. 2020, 198, 104544. [Google Scholar] [CrossRef]
- Wang, T.; Camps-Arbestain, M.; Hedley, C.J.A.E. Factors influencing the molecular composition of soil organic matter in New Zealand grasslands. Agric. Ecosyst. Environ. 2016, 232, 290–301. [Google Scholar] [CrossRef]
- Schulp, C.J.E.; Veldkamp, A. Long-term landscape—Land use interactions as explaining factor for soil organic matter variability in Dutch agricultural landscapes. Geoderma 2008, 146, 457–465. [Google Scholar] [CrossRef]
- Schillaci, C.; Acutis, M.; Lombardo, L.; Lipani, A.; Fantappie, M.; Märker, M.; Saia, S. Spatio-temporal topsoil organic carbon mapping of a semi-arid Mediterranean region: The role of land use, soil texture, topographic indices and the influence of remote sensing data to modelling. Sci. Total Environ. 2017, 601–602, 821–832. [Google Scholar] [CrossRef]
- Hu, K.; Wang, S.; Li, H.; Huang, F.; Li, B. Spatial scaling effects on variability of soil organic matter and total nitrogen in suburban Beijing. Geoderma 2014, 226–227, 54–63. [Google Scholar] [CrossRef]
- Costa, E.M.; Tassinari, W.D.; Pinheiro, H.S.; Beutler, S.J.; Dos Anjos, L.H. Mapping Soil Organic Carbon and Organic Matter Fractions by Geographically Weighted Regression. J. Environ. Qual. 2018, 47, 718–725. [Google Scholar] [CrossRef]
- Zeng, C.; Yang, L.; Zhu, A.X.; Rossiter, D.G.; Liu, J.; Liu, J.; Qin, C.; Wang, D.J.G. Mapping soil organic matter concentration at different scales using a mixed geographically weighted regression method. Geoderma 2016, 281, 69–82. [Google Scholar] [CrossRef]
- Hu, K.; Li, H.; Li, B.; Huang, Y. Spatial and temporal patterns of soil organic matter in the urban–rural transition zone of Beijing. Geoderma 2007, 141, 302–310. [Google Scholar] [CrossRef]
- Wang, J.-F.; Zhang, T.-L.; Fu, B.-J. A measure of spatial stratified heterogeneity. Ecol. Indic. 2016, 67, 250–256. [Google Scholar] [CrossRef]
- Zhao, Y.; Deng, Q.; Lin, Q.; Zeng, C.; Zhong, C.J.E.P. Cadmium source identification in soils and high-risk regions predicted by geographical detector method. Environ. Pollut. 2020, 263, 114338. [Google Scholar] [CrossRef] [PubMed]
- Su, Y.; Li, T.; Cheng, S.; Wang, X.J.E.E. Spatial distribution exploration and driving factor identification for soil salinisation based on geodetector models in coastal area. Ecol. Eng. 2020, 156, 105961. [Google Scholar] [CrossRef]
- Qiao, P.; Yang, S.; Lei, M.; Chen, T.; Dong, N. Quantitative analysis of the factors influencing spatial distribution of soil heavy metals based on geographical detector. Sci. Total Environ. 2019, 664, 392–413. [Google Scholar] [CrossRef]
- Tao, H.; Liao, X.; Li, Y.; Xu, C.; Zhu, G.; Cassidy, D.P. Quantifying influences of interacting anthropogenic-natural factors on trace element accumulation and pollution risk in karst soil. Sci. Total Environ. 2020, 721, 137770. [Google Scholar] [CrossRef]
- Cheng, H.; Qiong, X.U.; University, H.N. Study on the Coupling Relationship of Urbanization-Tourism-Ecology in China Based on Geographical Detector. J. Zhongzhou Univ. 2019, 36, 21–27. [Google Scholar]
- He, J.; Pan, Z.; Liu, D.; Guo, X. Exploring the regional differences of ecosystem health and its driving factors in China. Sci. Total Environ. 2019, 673, 553–564. [Google Scholar] [CrossRef]
- Fan, H.; Wang, J.; Hu, M.; Li, Z.; Jiang, X.; Wang, J. Spatiotemporal assessment of marine environmental monitoring programme based on DIN concentration in the Yangtze River estuary and its adjacent sea. Sci. Total Environ. 2020, 707, 135527. [Google Scholar] [CrossRef] [PubMed]
- Lin, H.Y.; Tseng, Y.H.; Hsieh, C.F.; Hu, J.M. Geographical distribution of dioecy and its ecological correlates based on fine-scaled species distribution data from a subtropical island. Ecol. Res. 2019, 35, 170–181. [Google Scholar] [CrossRef]
- Liu, Z.; Wang, S.; Zhang, Y.; Xiang, J.; Tong, M.X.; Gao, Q.; Zhang, Y.; Sun, S.; Liu, Q.; Jiang, B.J.E.S.; et al. Effect of temperature and its interactions with relative humidity and rainfall on malaria in a temperate city Suzhou, China. Environ. Sci. Pollut. Res. 2021, 28, 16830–16842. [Google Scholar] [CrossRef] [PubMed]
- Jiang, Y.; Yin, X.; Wang, X.; Zhang, L.; Chen, F.J.A.J. Impacts of global warming on the cropping systems of China under technical improvements from 1961 to 2016. Agron. J. 2020, 113, 187–199. [Google Scholar] [CrossRef]
- Zhao, W.; Hu, Z.; Guo, Q.; Wu, G.; Chen, R.; Li, S. Contributions of climatic factors to inter-annual variability of vegetation index in northern China grasslands. J. Clim. 2019, 33, 175–183. [Google Scholar] [CrossRef]
- Fang, F.; Ma, L.; Fan, H.; Che, X.; Chen, M. The spatial differentiation of quality of rural life based on natural controlling factors: A case study of Gansu Province, China. J. Environ. Manag. 2020, 264, 110439. [Google Scholar] [CrossRef]
- Raposo, V.; Ferreira, P.; Tavares, A. Differences in Portuguese primary care quality: An analysis using geographical and patient satisfaction data. Eur. J. Public Health 2019, 29, ckz034.018. [Google Scholar] [CrossRef]
- Huang, R.; Ning, H.; He, T.; Bian, G.; Hu, J.; Xu, G. Impact of PM 10 and meteorological factors on the incidence of hand, foot, and mouth disease in female children in Ningbo, China: A spatiotemporal and time-series study. Environ. Sci. Pollut. Res. 2019, 26, 17974–17985. [Google Scholar] [CrossRef] [PubMed]
- Zhang, X.X.; Xu, C.D.; Xiao, G.X. Spatial heterogeneity of the association between temperature and hand, foot, and mouth disease risk in metropolitan and other areas. Sci. Total Environ. 2020, 713, 136623. [Google Scholar] [CrossRef]
- Xu, C.; Zhang, X.; Xiao, G. Spatiotemporal decomposition and risk determinants of hand, foot and mouth disease in Henan, China. Sci. Total Environ. 2019, 657, 509. [Google Scholar] [CrossRef] [PubMed]
- Wu, L.; Cai, Z. The Relationship between the Spatial Scale and the Variation of Soil Organic Matter in China. Adv. Earth Sci. 2006, 21, 965–972. [Google Scholar]
- Yang, S.P.; Han, H.D. Quantitative analysis of NDVI driving factors in Gansu Province based on geodetector. J. Gansu Agric. Univ. 2019, 54, 115–123. [Google Scholar]
- Wang, J.F.; Hu, Y. Environmental health risk detection with GeogDetector. Environ. Model. Softw. 2012, 33, 114–115. [Google Scholar] [CrossRef]
- Wang, J.F.; Li, X.H.; Christakos, G.; Liao, Y.L.; Zhang, T.; Gu, X.; Zheng, X.Y. Geographical Detectors-Based Health Risk Assessment and its Application in the Neural Tube Defects Study of the Heshun Region, China. Int. J. Geogr. Inf. Sci. 2010, 24, 107–127. [Google Scholar] [CrossRef]
- Shuqin, S.; Qiwen, C.; Zhengguo, L.I.; Hengzhou, X.U.; Management, S.O.; University, T.P. Influence of spatial heterogeneity of climatic and socio-economic factors on soil organic matter—A case study of the central Heilongjiang Province, China. Chin. J. Eco-Agric. 2014, 22, 1102–1112. [Google Scholar]
- Li, Q.; Cheng, X.; Luo, Y.; Xu, Z.; Xu, L.; Ruan, H.; Xu, X. Consistent temperature sensitivity of labile soil organic carbon mineralization along an elevation gradient in the Wuyi Mountains, China. Appl. Soil Ecol. 2017, 117–118, 32–37. [Google Scholar] [CrossRef]
- Fan, Z.; Peng, C.; Jin, R.; Wu, H. Main Soil Types in Northeast China and Fertility Index Correlation with Meteorological Factors. J. Maize Sci. 2018, 26, 140–146. [Google Scholar]
- Wiesmeier, M.; Urbanski, L.; Hobley, E.U.; Lang, B.; Kgel-Knabner, I. Soil organic carbon storage as a key function of soils—A review of drivers and indicators at various scales. Geoderma 2019, 333, 149–162. [Google Scholar] [CrossRef]
- Dongmin, D. Adding energy and momentum for the high quality development of agricultural mechanization—Written on the occasion of the release of the “northeast black soil conservation tillage action plan”. Agric. Mach. Qual. Superv. 2020, 184, 9–10. [Google Scholar]
- Miao, X.; Ye, S.; Han, Z.; Ding, X.; Yuan, H.; Zhao, G.; Jin, W. Research Review of the Effect for Carbon Sequestration Under No-tillage Agriculture. Chin. Agric. Sci. Bull. 2014, 030, 32–39. [Google Scholar]
- Xu, X.; Sui, Y.; Zhang, Y.; Wang, Y.; Liu, M.; Liu, Y. Effects of different tillages on the soil and water conservation benefits in Northeast black soil area of China. Sci. Soil Water Conserv. 2013, 11, 12–16. [Google Scholar]
- Wang, R.; Zhang, J.; Dong, S.; Liu, P. Present situation of maize straw resource utilization and its effect in main maize production regions of China. Chin. J. Appl. Ecol. 2011, 22, 1504–1510. [Google Scholar]
- Minasny, B.; Malone, B.P.; Mcbratney, A.B.; Angers, D.A.; Winowiecki, L.A. Soil Carbon 4 per mille. Geoderma 2017, 292, 59–86. [Google Scholar] [CrossRef]


| Strata No. | Soil Erosion Type | Digital Elevation Model (m) | Geomorphic Types | Mean Annual Precipitation (0.1 mm) | Mean Annual temperature (0.1 °C) | Soil Type | Population Distribution Data (Person/km2) | GDP Data (RMB/km2) | Land Use Type |
|---|---|---|---|---|---|---|---|---|---|
| 1 | Hydraulic micro-erosion | 0–100 | Low elevation plain (LE_plain) | 2360.9–3968.5 | (−52.95)–(−9.22) | Primary soil | 0.5–68.9 | 2–382 | Dry land |
| 2 | Hydraulic mild erosion | 100–200 | Low elevation platform (LE_platform) | 3968.5–4456.8 | (−9.22) to 4.19 | Semileached soil | 68.9–114.9 | 382–735 | Irrigated land |
| 3 | Hydraulic moderate erosion | 200–300 | Low elevation hill (LE_hill) | 4456.8–4865.4 | 4.19–17.02 | Leached soil | 114.9–169.6 | 735–1137 | Paddy fields |
| 4 | Hydraulic intense erosion | 300–400 | Small undulating and low elevation mountain (SULE_mountain) | 4865.4–5203.2 | 17.02–29.85 | Calcareous soil | 169.6–246.5 | 1137–1913 | |
| 5 | Wind micro-erosion | 400–500 | 5203.2–5506.8 | 29.85–42.09 | Hemihydric soil | 246.5–560.7 | 1913–3316 | ||
| 6 | Wind mild erosion | 500–600 | 5506.8–5802.3 | 42.09–53.76 | Hydrogenic soil | 560.7–1273.4 | 3316–8346 | ||
| 7 | Wind moderate erosion | 600–700 | 5802.3–6155.7 | 53.76–68.92 | Saline–alkali soil | 1273.4–2919.4 | 8346–25780 | ||
| 8 | Wind intense erosion | 700–800 | 6155.7–7858.6 | 68.92–95.75 | Artificial soil | 2919.4–13,857.9 | 25,780–112,098 | ||
| 9 | Freeze–thaw micro-erosion | ||||||||
| 10 | Freeze–thaw mild erosion |
| Influencing Factor | q-Value | p-Value | |
|---|---|---|---|
| Natural factors | MAT | 35.6% | 5.49 × 10⁻¹⁰ |
| DEM | 14.4% | 3.47 × 10⁻¹⁰ | |
| ST | 12.6% | 4.55 × 10⁻¹⁰ | |
| MAP | 12.5% | 1.91 × 10⁻¹⁰ | |
| SE | 8.0% | 2.94 × 10⁻¹⁰ | |
| GT | 0.6% | 2.57 × 10⁻¹⁰ | |
| Anthropogenic factors | GDP | 14.6% | 6.16 × 10⁻¹⁰ |
| POP | 13.2% | 7.82 × 10⁻¹⁰ | |
| LUT | 7.5% | 2.71 × 10⁻¹⁰ |
| GT | DEM | GDP | POP | ST | MAT | MAP | LUT | SE | |
|---|---|---|---|---|---|---|---|---|---|
| GT | Nonl-En | Nonl-En | Nonl-En | Nonl-En | Nonl-En | Nonl-En | Nonl-En | Nonl-En | |
| DEM | 16.88% | Bi-En | Bi-En | Bi-En | Bi-En | Bi-En | Bi-En | Bi-En | |
| GDP | 15.74% | 24.59% | Bi-En | Bi-En | Bi-En | Bi-En | Bi-En | Bi-En | |
| POP | 15.46% | 21.57% | 18.01% | Bi-En | Bi-En | Nonl-En | Bi-En | Nonl-En | |
| ST | 15.68% | 21.28% | 24.01% | 22.56% | Bi-En | Bi-En | Bi-En | Bi-En | |
| MAT | 39.87% | 41.13% | 37.15% | 37.57% | 39.82% | Bi-En | Bi-En | Bi-En | |
| MAP | 17.52% | 28.4% | 23.96% | 28.07% | 24.04% | 42.74% | Bi-En | Bi-En | |
| LUT | 8.92% | 18.16% | 19.91% | 18.49% | 17.74% | 38.62% | 16.83% | Bi-En | |
| SE | 9.67% | 19.16% | 22.01% | 24.1% | 17.34% | 39.11% | 19.18% | 13.5% |
Publisher’s Note: MDPI stays neutral with regard to jurisdictional claims in published maps and institutional affiliations. |
© 2021 by the authors. Licensee MDPI, Basel, Switzerland. This article is an open access article distributed under the terms and conditions of the Creative Commons Attribution (CC BY) license (https://creativecommons.org/licenses/by/4.0/).
Share and Cite
Du, Z.; Gao, B.; Ou, C.; Du, Z.; Yang, J.; Batsaikhan, B.; Dorjgotov, B.; Yun, W.; Zhu, D. A Quantitative Analysis of Factors Influencing Organic Matter Concentration in the Topsoil of Black Soil in Northeast China Based on Spatial Heterogeneous Patterns. ISPRS Int. J. Geo-Inf. 2021, 10, 348. https://0-doi-org.brum.beds.ac.uk/10.3390/ijgi10050348
Du Z, Gao B, Ou C, Du Z, Yang J, Batsaikhan B, Dorjgotov B, Yun W, Zhu D. A Quantitative Analysis of Factors Influencing Organic Matter Concentration in the Topsoil of Black Soil in Northeast China Based on Spatial Heterogeneous Patterns. ISPRS International Journal of Geo-Information. 2021; 10(5):348. https://0-doi-org.brum.beds.ac.uk/10.3390/ijgi10050348
Chicago/Turabian StyleDu, Zhenbo, Bingbo Gao, Cong Ou, Zhenrong Du, Jianyu Yang, Bayartungalag Batsaikhan, Battogtokh Dorjgotov, Wenju Yun, and Dehai Zhu. 2021. "A Quantitative Analysis of Factors Influencing Organic Matter Concentration in the Topsoil of Black Soil in Northeast China Based on Spatial Heterogeneous Patterns" ISPRS International Journal of Geo-Information 10, no. 5: 348. https://0-doi-org.brum.beds.ac.uk/10.3390/ijgi10050348