
A GIS Assessment of the Suitability of Tilapia and Clarias Pond Farming in Tanzania


1
Department of Physical Geography, Stockholm University, 106 91 Stockholm, Sweden
2
Kigoma Centre, Tanzania Fisheries Research Institute, Kigoma P.O. Box 90, Tanzania
*
Author to whom correspondence should be addressed.
ISPRS Int. J. Geo-Inf. 2021, 10(5), 354; https://0-doi-org.brum.beds.ac.uk/10.3390/ijgi10050354
Submission received: 2 March 2021
/
Revised: 2 May 2021
/
Accepted: 8 May 2021
/
Published: 20 May 2021
(This article belongs to the Special Issue GIS-Based Analysis for Quality of Life and Environmental Monitoring)
Abstract
:Aquaculture production in Tanzania has increased in recent years, responding to an increased demand for fish, but the scale and productivity of smallholder aquaculture remains below the level needed to support significant sector growth in Tanzania. This study assesses, through geospatial analyses, the suitability for freshwater pond farming of Oreochromis niloticus and Clarias gariepinus in Tanzania, by assessing the geographical distribution of seven criteria (water availability, water temperature, soil texture, terrain slope, availability of farm inputs, potential farm-gate sales, and access to local markets) identified as important for fish pond farming. The criteria were developed and standardized from 15 sub-criteria, which were classified into a four-level suitability scale based on physical scores. The individual weights of the different criteria in the overall GIS suitability assessment were determined through a multi-criteria evaluation. The final results were validated and compared through field observations, interviews with 89 rural and 11 urban aquaculture farmers, and a questionnaire survey with 16 regional fisheries officers. Our results indicate that there is a good potential for aquaculture in Tanzania. Almost 60% of Tanzania is assessed as being suitable and 40% as moderately suitable for small-scale subsistence pond farming, which is the dominating fish farming practice currently. The corresponding figures for medium-scale commercial farming, which many regions expect to be the dominating farming method within ten-years, were 52% and 47% respectively. The availability of water was the most limiting factor for fish pond farming, which was confirmed by both farmers and regional fisheries officers, and assessed as being “suitable” in only 28% of the country. The availability of farm-gate sales and local markets were “moderate suitable” to “suitable” and were seen as a constraint for commercial farms in rural areas. The availability of farm inputs (agriculture waste and manure) was overall good (26% very suitable and 32% suitable), but high-quality fish feed was seen as a constraint to aquaculture development, both by farmers and regional fisheries officers. Soil, terrain, and water temperature conditions were assessed as good, especially at low altitudes and in regions close to the sea and south of Lake Victoria.
1. Introduction
Aquaculture has a significant potential to contribute to the Sustainable Development Goals, such as reduced hunger, poverty, and improved human health and wellbeing [1,2,3,4,5]. Fish provides 19% of the animal protein intake to people in Africa, and plays a unique role in providing a range of micronutrients and essential fatty acids [2]. About 37% of Africa has been estimated to be suitable for rural fish farming and 43% for commercial fish production [6].
Still, aquaculture production in Africa is very low compared to the other regions of the world, and contributed only with 2.5% of the global aquaculture production in 2016 [2,7,8], and the slow progress of aquaculture development in Africa is something of a mystery [1]. Despite extensive research and investments by governments and donors in the past five decades, aquaculture development in Sub-Saharan Africa (SSA) has had only limited success, and is still struggling to realize its high potential [1,2].
Local government’s efforts to develop and implement sustainable and profitable aquaculture is constrained by large challenges, such as a lack of improved fish breeds, feeds, technical training, weak research capacity, inadequate human and financial resources, poor market infrastructure and access, and weak governance and regulations [1,2,4,7].
However, aquaculture in SSA is currently undergoing an exciting phase of growth after numerous false starts, perhaps as a reaction to the high incidence of poverty, malnutrition, and unemployment [8]. Also, stagnating catches of wild fish and an increasing food demand from a growing population have created a potential for aquaculture to supply the market with more fish [2,4].
African aquaculture output has doubled in the past seven years and has experienced accelerated growth at 10% annually in the past decade (2006–2016) [2]. Still, the current production of fish through aquaculture in Africa is low, and even an optimistic aquaculture growth scenario falls short of the trend for increasing demand of fish [2].
Tanzania is the biggest fish consumer in East Africa (8.6 kg/capita and year) and fish is the main source of protein to nearly one-third of the country’s population [4,7]. People derives more than 20% of their total animal protein intake from fish and seafood (2.2 g/capita/day) [4]. Tanzania is currently mainly relying on inland fisheries from Lake Victoria (85%) and marine fisheries (14%) for its supply of fish. Only around 3%, or 10,000 tons of fish, is produced by aquaculture [7]. Current trends indicate that fish catches from Lake Victoria are declining, and in order to maintain the present levels of fish consumption in Tanzania, considerable additional quantities of fish are required, either through increased aquaculture production or imports [4,7,9,10].
Tanzania has great potential for aquaculture production [6,7]. Its climate is overall good for farming of warm water fish species, including tilapia and African catfish, being the favored species for Tanzania’s lower- and middle-income classes [4,7,9,11].
Considering the recent expansion of aquaculture in Tanzania and the expected increased demand for fish [9], this study aims to make a first order assessment of the potential for freshwater fish farming activities in Tanzania. The study combines GIS spatial modelling with multi-criteria evaluation (MCE), and build on large quantitative datasets as well as more qualitative inputs from fish farmers and regional fisheries officers, to assess the opportunities and constraints for fresh water pond farming of fish in Tanzania.
The first continental assessment of aquaculture suitability in Africa incorporating a GIS methodology was developed by Kapetsky in 1994 [12], which later was followed-up by a similar study in 1998 [6]. In this study the suitability of two aquaculture models, representing small-scale and commercial pond farming of fish was assessed. This was done by assigning weights to selected criteria by pairwise comparing the criteria following the approach by Eastman et al. [13], which built on the Analytical Hierarchy Process (AHP) developed by Saaty [14]. Ssegane et al. [15] did a similar aquaculture suitability assessment for Uganda, combining GIS spatial modelling and multi-criteria evaluation, including seven criteria. The assessment by Ssegane et al. [15] followed a methodology similar to those found in Kapetsky [12], Kapetsky and Nath [16], and Aguilar-Manjarrez and Nath [6], including criteria classification by thresholds into four suitability levels, and weight production following the AHP methodology by Saaty [14].
Although our study builds on the overall methodology framework used in the studies above, our study provides the first assessment of the potential for fish pond farming in Tanzania combining GIS spatial modelling and stakeholder consultations.
The overall vision of the Ministry of Livestock and Fisheries in Tanzania is to develop an aquaculture sector that is commercially run, vibrant, diversified, and sustainable, using highly productive resources to ensure food security and nutrition, employment and improved income for the households and nation at large, while conserving the environment [17]. Our study indicates that this can be achieved if Tanzania takes advantage of its diverse social-ecological conditions and identifies appropriate farming methods that meet the local conditions, in such a way that it promotes sustainable development, equity, and resilience of interlinked social and ecological systems. We think our study provide useful insights on this by combining GIS analyses with surveys or fish farmers and fisheries officers perceptions.
Study Area
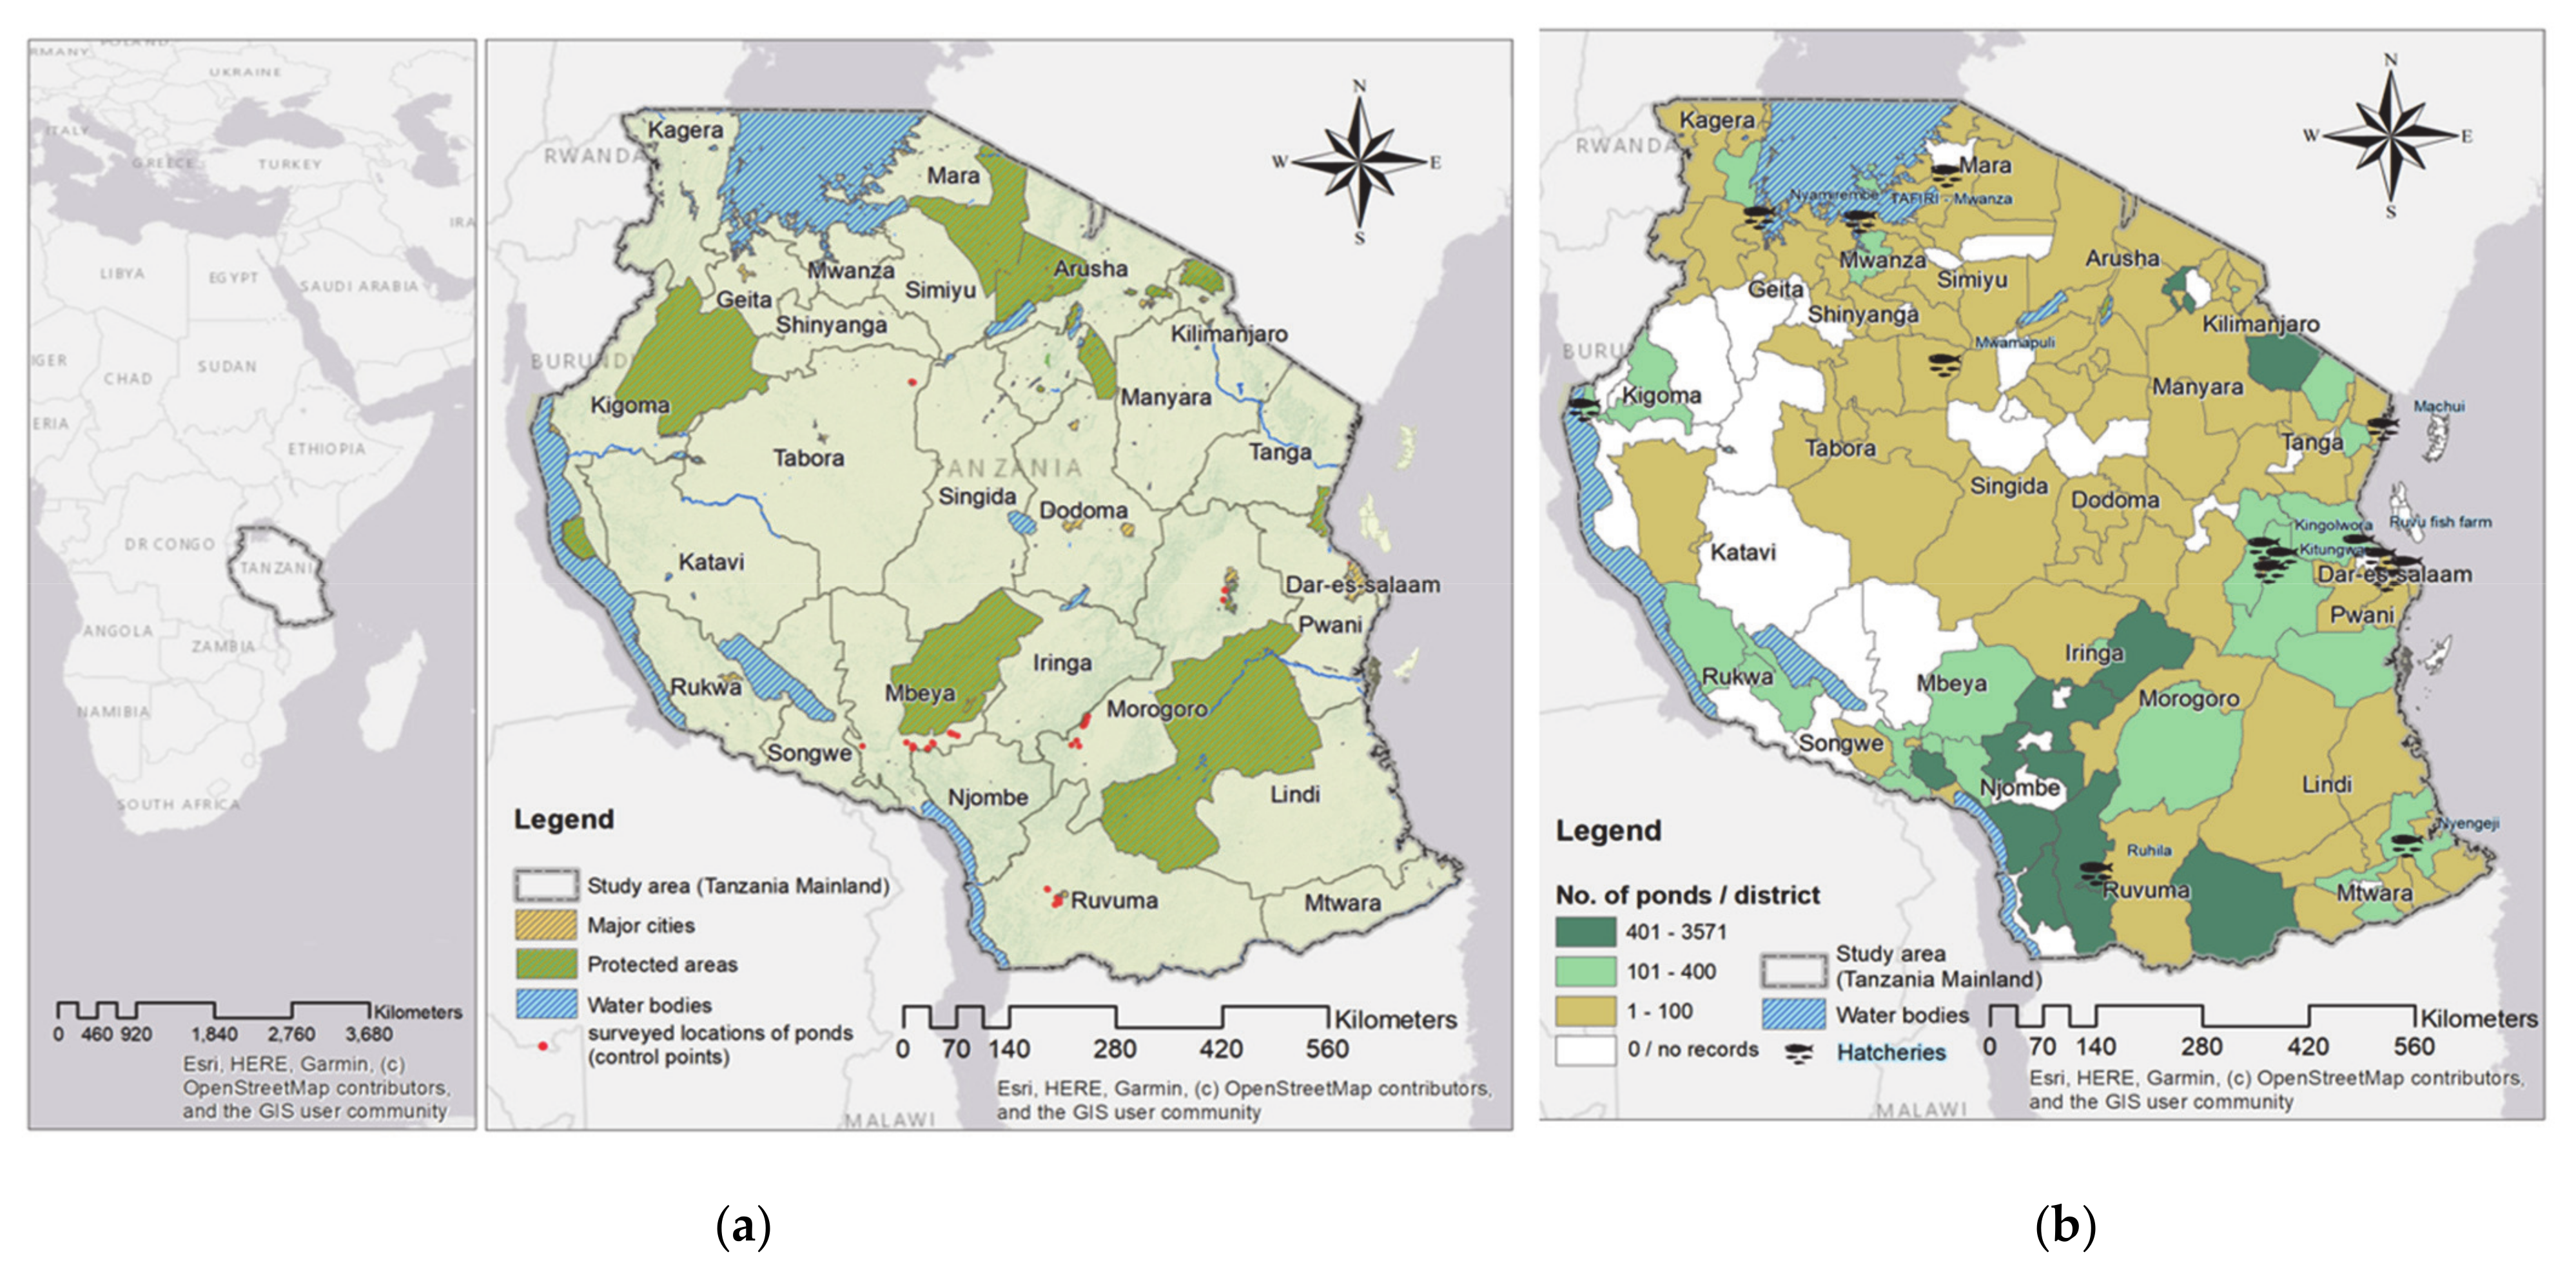
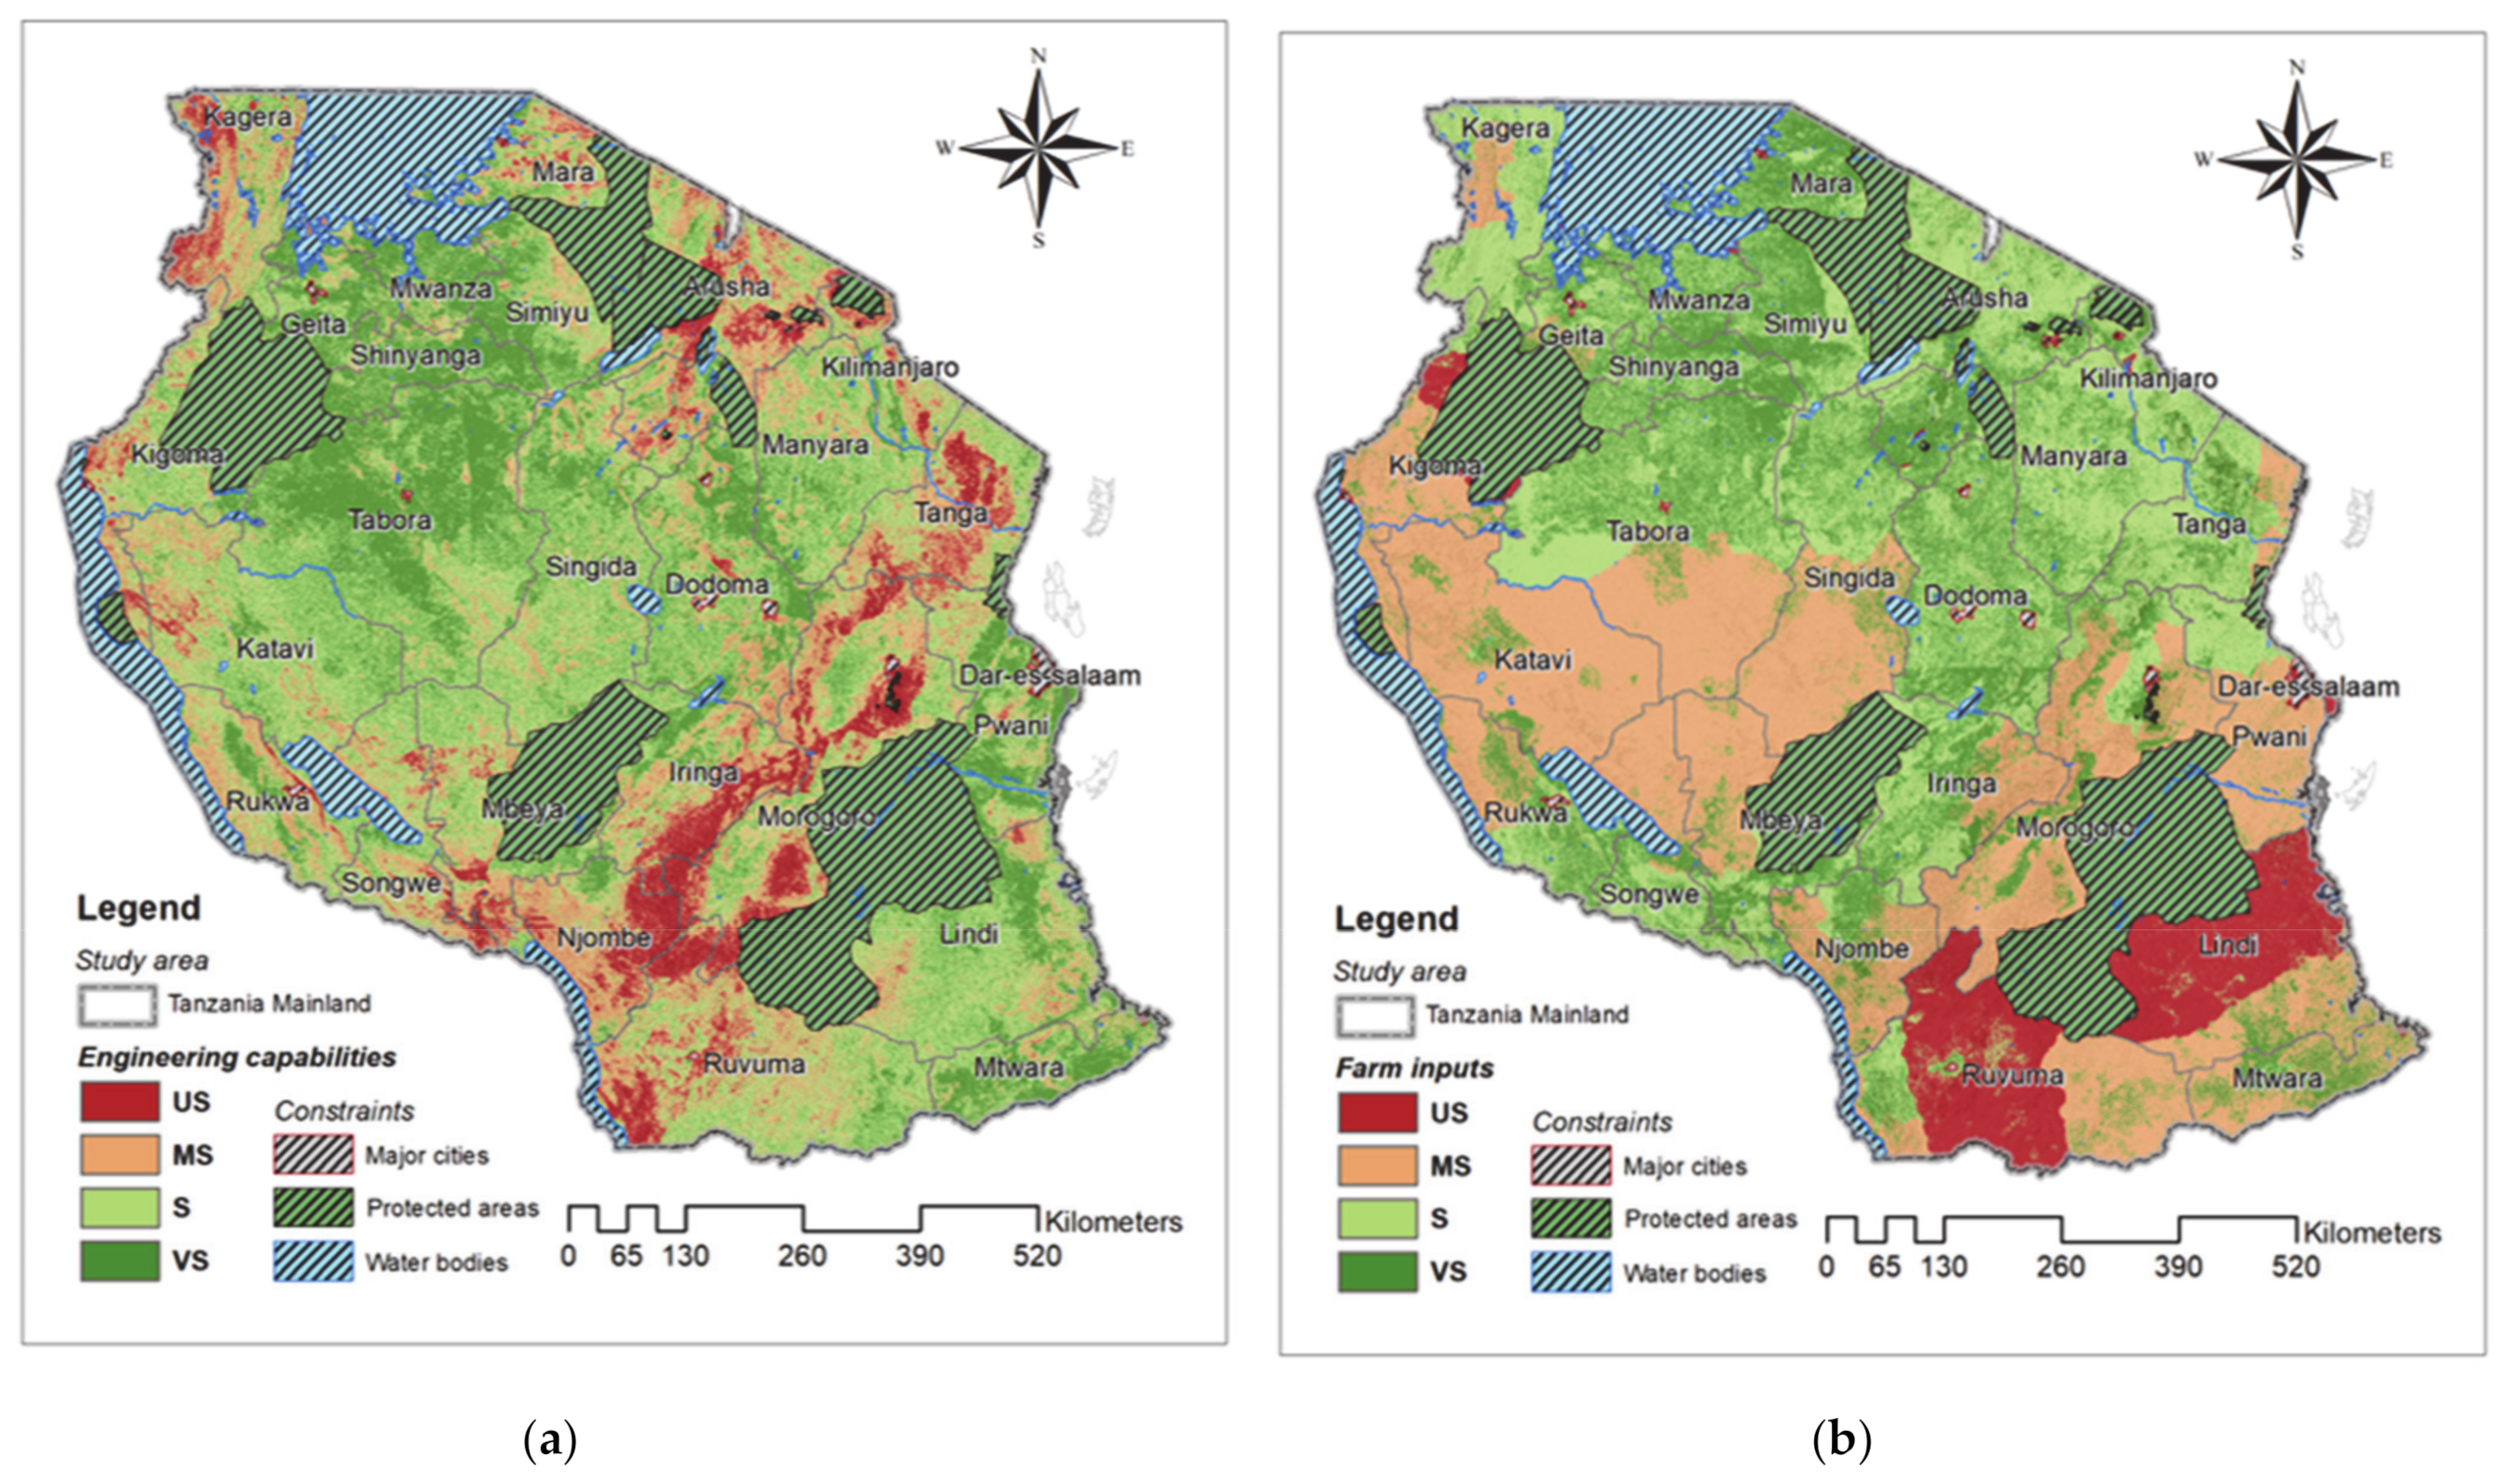
The study is delimited to mainland Tanzania (Figure 1a), which is located just below the equator in East Africa, having a total land area of 947,303 km2 and a 1424 km long coastline [18]. A larger part of the mainland is covered by an extensive plateau, with an altitude ranging between 1000 and 2000 m above mean sea level (MAMSL). The northern coast and southern part of the mainland is however characterized with a considerably flatter terrain, with an approximate altitude gradient between 50 and 500 MAMSL [19]. Inland lakes have a total coverage of 59,000 km2 [18].
Tanzania’s total population was about 58 million people in 2019, with 65.5% living in rural areas and where small-scale agriculture is the major livelihood activity [20]. Economic growth has contributed significantly to poverty reduction in recent years, although 28% of Tanzanians still remain below the nationally determined poverty line [21]. In 2019, the country average annual temperature varied between 19.2 °C and 29.3 °C with an annual average total rainfall of 1284 mm [22]. The amount of annual rainfall varies spatially, where the highest rate is found in the northern regions around Lake Victoria, with approximately 2500 mm, while the Central part is characterized by lower rates, approximately 550 mm [19]. One-third of the crop land is devoted to maize, which accounts for 40% of caloric intake nationally [21]. While increasing temperatures may benefit rainfed maize in the highlands, national production is projected to decrease 8–13% by 2050, due to increased heat stress, drying, erosion, and flood damage. Bean, sorghum, and rice yield projections follow similar trends, with decreases of 5–9% by 2050 [21].
Aquaculture in Tanzania is currently mostly a small-scale activity and usually not practiced as a stand-alone economic activity, but rather as subsistence farming integrated with agricultural activities and rearing of livestock ([7,23,24], Figure 1b).
In Tanzania the aquaculture sector consists of roughly 19,000 small-scale freshwater farmers and 1600 marine fish farmers (excluding seaweed farms) [4,7]. Although the production of this practices is relative low, they are important in terms of food security and provide complementary animal protein and important nutrients [24]. The low production makes it possible to rely on local resource as feed for the fish. Use of manure and agriculture waste help to increase the productions efficiency and enhance the fish yield without any increased production costs [11].
International evidence also suggests that small-scale aquaculture can play a significant role in parallel to the development of commercial production that will catalyze the sector [25]. Development of a viable smallholder sector has the potential to greatly improve livelihoods in the industry [3]. In recent years there has been an increased demand for high-quality fish feeds and seeds, and there are now a small, but growing number of farmers, that operate their farms on a more commercial basis and are reaching high levels of production [7]. In addition, cage farming in Lake Victoria has taken off, although at modest levels compared to the neighboring countries [7].
Considering the recent expansion of aquaculture in Tanzania and the expected increased demand for fish [9], this study makes a first order assessment of the suitability for freshwater aquaculture activities in Tanzania, with an aim to provide guidance on how aquaculture could be developed in Tanzania for an optimized and sustainable production of fish.
2. Methods
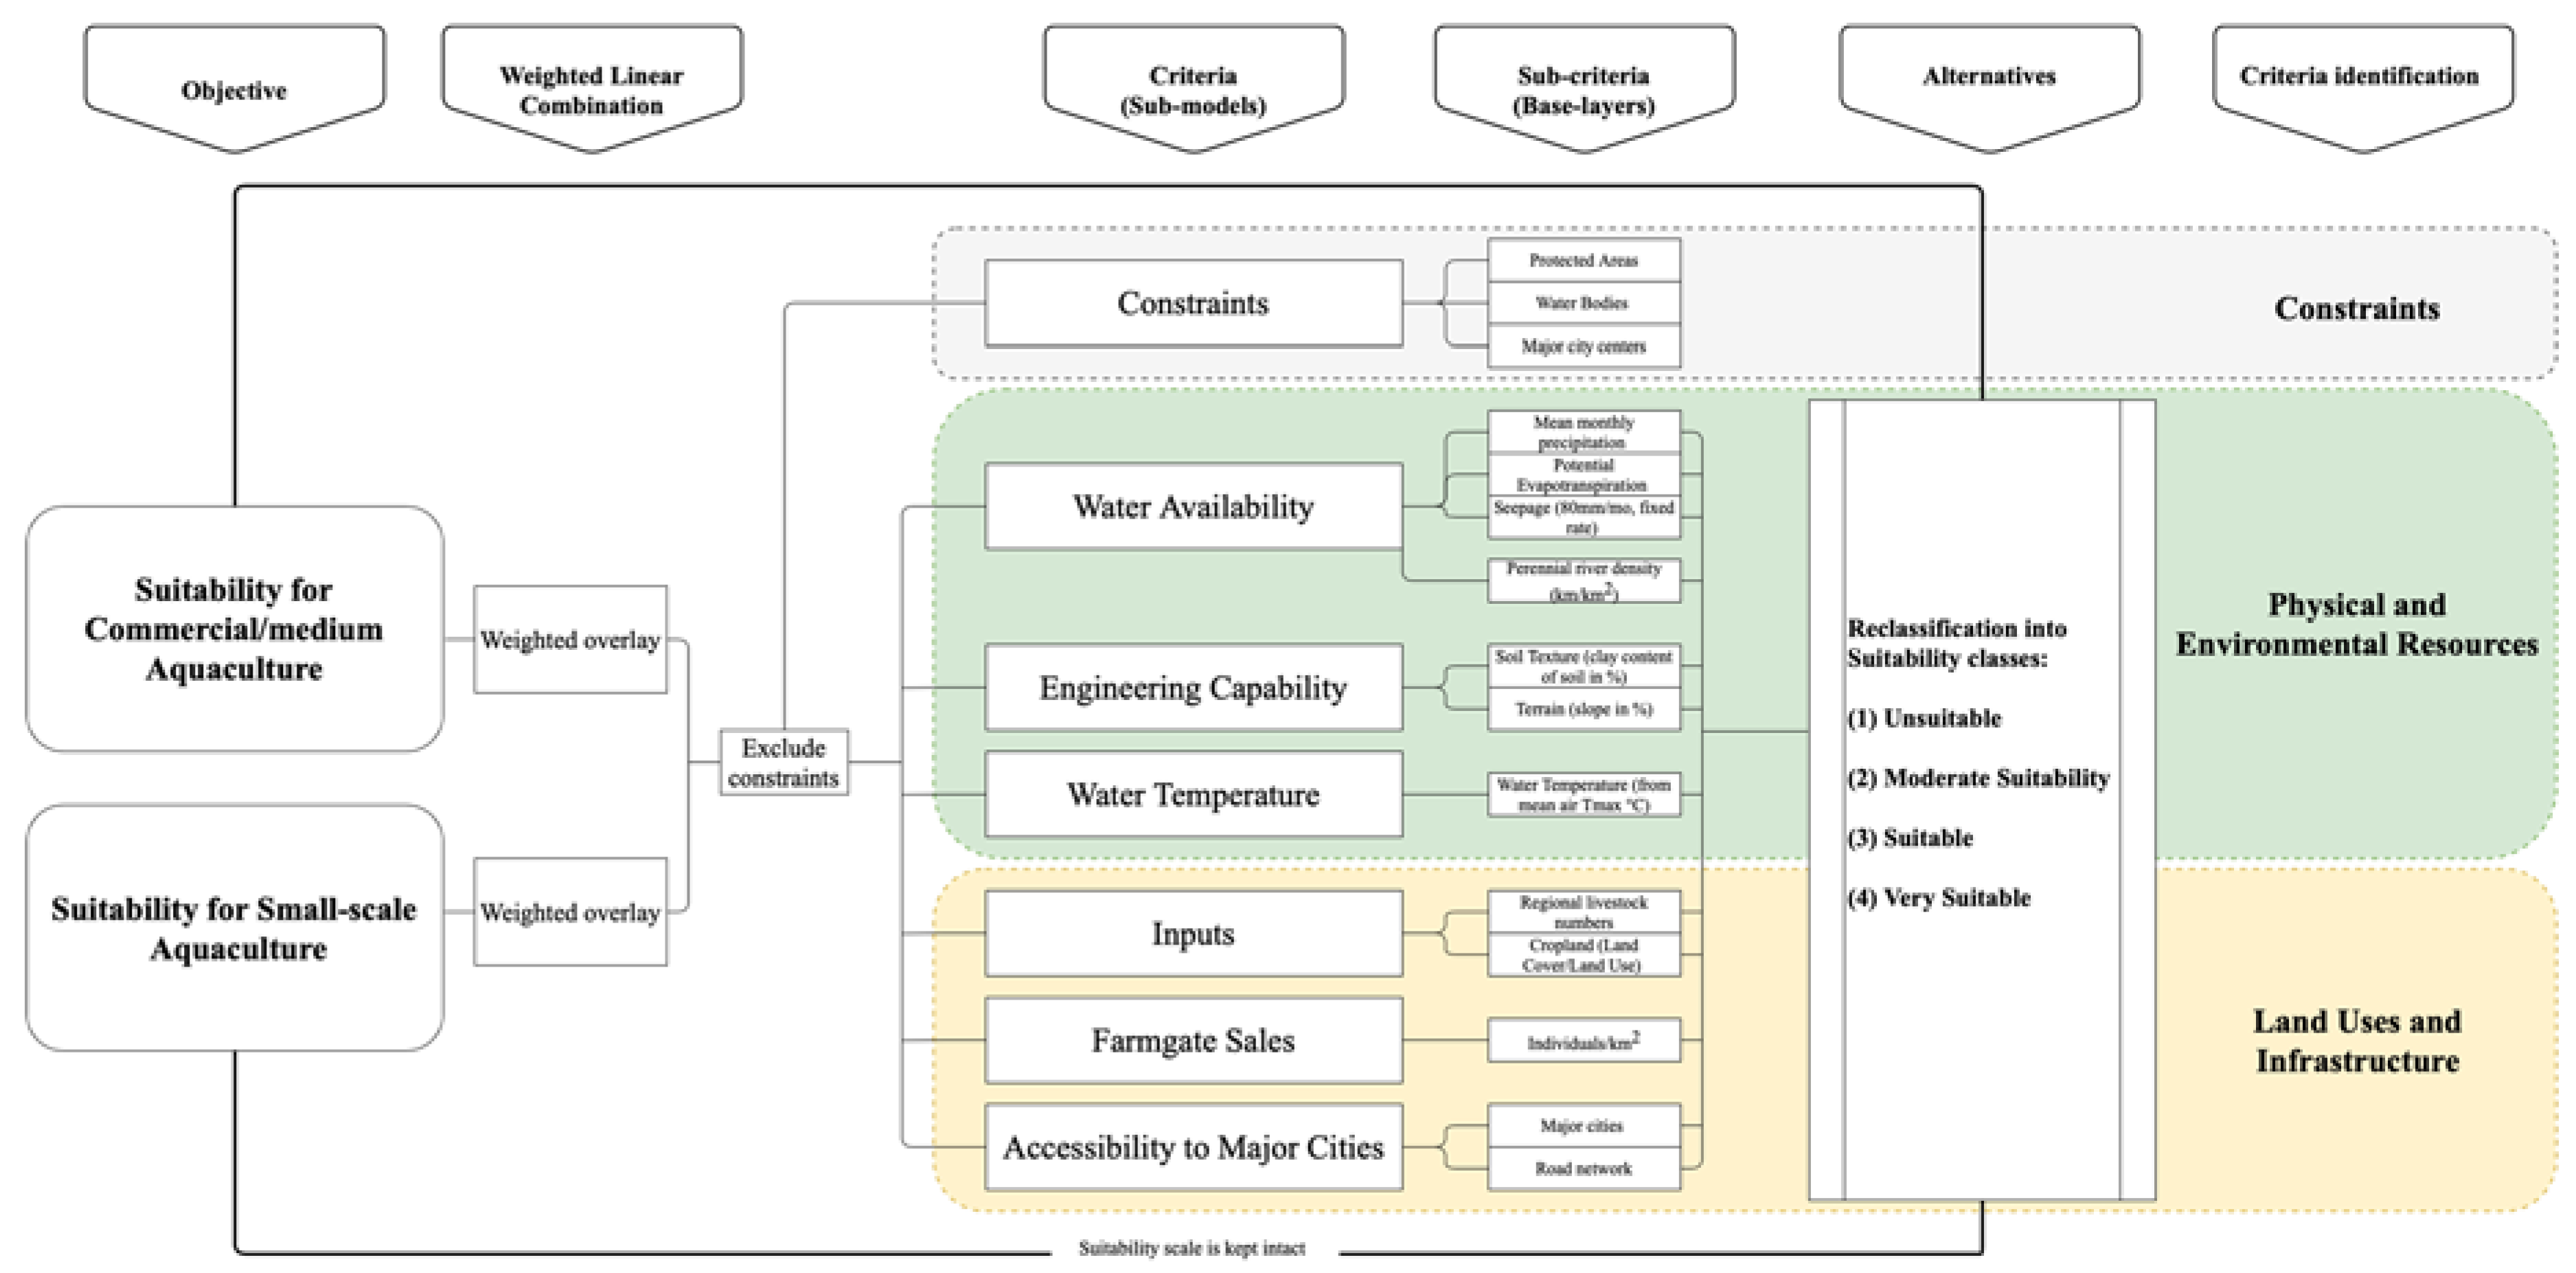
The methods used in this study are divided into three major sections; (1) A GIS environment spatial analysis, including data identification, collection, standardization, and development of criteria; (2) a weight assessment using a multi-criteria evaluation (MCE) approach including an analytical hierarchy process (AHP); and (3) a field survey including interviews and questionnaire with fish farmers and regional fisheries officers (Figure 2).
2.1. GIS Environment Spatial Analysis
Seven criteria were used to assess the site suitability for small-scale and commercial fish pond farming in Tanzania focusing on the two most commonly grown freshwater fish species in Tanzania, Nile tilapia (Oreochromis niloticus) and African catfish (Clarias gariepinus) (Figure 2 and Figure 3). For each criterion, the corresponding data are presented as basic map themes under Section 3.
The criteria were grouped into three categories. The first category corresponded to the constraints. The second category concerned physical and environmental factors, and the third category was related to the suitability of land uses and infrastructure for small-scale and commercial fish pond farming (Figure 3).
The criteria were developed and standardized in a GIS environment. This involved revising relevant available spatial datasets and processing them and associated raw data into 15 sub-criteria (i.e., base layers that were ultimately developed into “sub-models”) (Figure 3).
Each sub-criterion (except the layers representing constraints) was classified into a four-level suitability scale (alternatives) based on a physical score, that was assigned based on its relation to the activity under consideration [6] (Figure 3). The thresholds for the suitability levels were based on levels used in earlier studies, but should still be seen as subjective. For example, in the case of engineering capability outlined below, soil properties were assigned a coefficient, which was 1.5 times higher than the value for slope, based on the study by Aguilar-Manjarrez and Nath [6], reflecting that soil properties are more critical than the slope in site selection for ponds. The relationship between these sub-criterion is complex and contains some uncertainty, which should be kept in mind when interpreting the results.
The four-level scale was applied for all spatial assessments, allowing for the final combined overlay assessments of small-scale and commercial fish pond farming potential in Tanzania. The scoring levels (4 to 1) were: very suitable (VS), suitable (S), moderately suitable (MS), and unsuitable (US).
All spatial data considered in this study were analyzed in ArcGIS, standardized into a raster format, resampled into 250 m resolution, projected as Arc 1960 UTM 37 South coordinate system, and delineated to only include regions within the Tanzania mainland. The resolution was set to 250 m to minimize false accuracy in the overlaid output, which was based on a compromise between the layers and their original resolution. However, as the WorldClim-data had the original resolution of 1 km, some potential false accuracy was still accepted. The standardization was implemented to generate a common unit for measurement. As the data considered for the GIS-procedure were in raster-, vector, or tabular format, further representing various spatial phenomena, these properties were accounted for in the standardization process. See Table 1 for thresholds and Appendix A for details on input data. For example, non-GIS data such as data on agriculture and livestock were spatially joined with polygon features (.shp-format) representing regions in Tanzania, before analyzing the suitability (in this case based on animals per km2). As the standardization involved conversion into a common resolution raster, aspects in resampling methods were also considered, where continuous data such as percentage clay, slope (engineering capability), mean monthly precipitation, potential evapotranspiration (water availability), and air temperature (water temperature) were all resampled with the “bilinear approach.” Categorical data, such as the ESA LC dataset, and in the conversion of vector to raster (e.g., administrative boundaries and water bodies) were interpolated with “nearest neighbor.” The following sections below contain a more detailed description on how the different criteria and sub-criteria were assessed.
2.1.1. Constraints
Protected areas, water bodies, and major cities were assessed as areas where there could be no fish pond farming and defined as “constraint areas.” Data on protected areas and water bodies were collected as a vector layer from OpenStreetMap (OSM) [28]. Waterbodies smaller than 62,500 m2 were excluded as these were evaluated as insignificant due to the resolution of 250 × 250 m in the final overlay.
Cities with a population size of at least 100,000 inhabitants in Tanzania mainland was geographically identified in OSM. Within these areas, a feature layer for constraints was created by extracting wards with a population density of >300 inhabitants/km2. These areas were assessed as constraints to aquaculture as they were assumed to be too expensive, and too densely populated to be used for fish farming [16].
2.1.2. Water Availability
Water availability was assessed by two models; (1) Annual water balance of ponds, based on the annual net balance of precipitation, seepage, and potential evaporation [6,16]; and (2) availability of perennial streams and rivers [12,26,27]. Monthly data on precipitation (mm/month) were obtained between 1970 and 2000 from WorldClim version 2.1, with a spatial resolution of 30 s (~1 km) [29]. Water seepage rate was assumed to be primarily influenced by soil composition and structure [30,31]. As the suitability of soil composition and structure for fish pond farming was assessed as a separate suitability score (see Section 2.1.4 below), a conservative estimate of water seepage of 80 mm/month from Kapetsky and Nath [16] was used to avoid double accounting for the effect of soil composition and structure on the overall suitability of fish pond farming in Tanzania. As indicated by the results below, the soil condition overall is quite good in Tanzania. Still, 80 mm/month is a “lower end” estimate [16,30], which indicates that the estimated water availability could be lower if no measures are taken by the farmer to improve the water-holding capacity of the pond.
Water loss to the atmosphere was estimated from the “FAO-56 Method” [32], where the estimated evapotranspiration (ET0) was multiplied with a compensatory coefficient of 1.3, to adjust the equation to the physical properties of a shallow pond [6]. Based on the descriptions above, water availability was finally estimated by the following equation:
where, as explained by Aguilar-Majarrez and Nath [6], the coefficient 1.1 accounts for the runoff from the sides of the pond, and 1.3 compensates for a higher evaporation from a free pond surface. The seepage coefficient represents a general rate of 80 mm/month.
Water balance of ponds (mm)= (WorldClim precipitation [mm] × 1.1) − (potential evapotranspiration [mm] × 1.3 − Seepage [80 mm/month].
In addition to the above assessment, water availability from perennial streams and rivers was assessed by measuring the density of rivers per surface area following the same approach as by Kapetsky [12] and Assefa and Abebe [26]. Finally, the two models were each classified into a 4-interval suitability scale (US-VS) and combined by following the methodology by Kapetsky [12], where the value of the net annual water balance-model was given a higher importance and weighted more than streams and rivers as outlined in the matrix in Table 2 [12]. This was done because the water balance was perceived as the most critical factor for pond farming, whereas streams and rivers were primarily perceived as a complementary sources of water. This is reflected in the matrix where streams and rivers only supplement to a higher suitability score if highly sufficient. Similarly, a low suitability of streams and rivers does not decrease the water balance’s suitability score.
2.1.3. Water Temperature
Water temperatures were estimated using a mean monthly water temperature model (Equation (2)) that correlates the mean water temperatures measured in small fish ponds (7 m2 with a mean depth of 1 m) with air Tmax temperatures from the Kunduchi Ward in Dar es Salaam, taken from the WorldClim version 2.1 data set, for 5 months (July–November 2018) [29]. Mean monthly water temperatures for the period were calculated from 120 measurements taken at 10 am and 4 pm at the Tanzania Fisheries Research Station at Kinondoni In Dar-es-Salaam (6° 39′51.57″ S and 39°12′45.32″ E, at an elevation of 10 m above sea level). A Spearman’s rank-order correlation was run to determine the relationship between the air Tmax temperature and pond water temperature. There was a strong positive correlation between air tmax temperature and pond water temperature, which was statistically significant (rs = 0.969, p = 0.0007), and described by the following equation:
Water temperature = 0.682 × air Tmax + 6.278
The water temperature suitability was classified into four classes (Table 1) following the methodology by Kapetsky [12]. It was based on the temperature requirements for Nile tilapia (Oreochromis niloticus) and African sharptooth catfish (Clarias gariepinus), whose optimal temperature ranges, are 27–30 °C and 25–27 °C, respectively.
Thus, water temperatures above 26 °C for 12 months were assessed as very suitable and would allow two crops of fish per year provided that other criteria, such as feed inputs are adequate. Temperatures below 22 °C inhibit the growth and reproduction for tilapias. Temperatures above 22 °C for 12 months was therefore regarded as suitable, allowing natural reproduction. Areas with a minimum of eight consecutive months with temperatures above 22 °C and remaining months with temperature above 14 °C were assessed as sufficient to ensure growth and a harvestable crop in one season and assessed as moderate suitable. Areas with temperature below 22 °C for more than 4 months were assessed as unsuitable. No upper limit was set due to the assumption that in these extreme conditions, the ponds would have been dried out, and the overall conditions are unsuitable in either case.
2.1.4. Engineering Capability
Engineering capability was assessed by evaluating the slope of the terrain together with the soil structure. A finely grained clayey soil of the pond bottom has a good water-holding capacity, especially when further saturated with the process of puddling [33]. Clay is also considered a stable construction material of, for example, pond embankments, but if the content is too high, additional management is likely required as it will lead to cracking [15,34]. A 250-m resolution raster image of clay content in soil was obtained from the ISRIC data hub [35]. The raster was produced from the global gridded soil database “SoilGrids” with a predicted clay content (%) at the depth interval of 100–200 cm. Soil texture suitability was assessed and classified from the percent clay content in soil following ratings by Yoo and Boyd [30] and modified by Ssegane et al. [15].
Topography is another important factor to consider in minimizing construction cost, where relevant properties of a moderate slope provide efficient drainage and conveyance of water to and from the ponds [6]. On the contrary, a high slope could have negative side effects on the construction, such as potential erosion of soils [15]. The classification of the slopes was based on the methods by Aguilar-Majarrez and Nath [6] and ICLARM and GTZ [36], where small ponds (0.01–0.05 ha) are recommended not to be located at a topography of more than 5% slope and large ponds (1–5 ha) should not exceed 1–2% [6]. Based on a survey of fish pond farming production in Tanzania, the majority of current ponds within the study area were classified “small” with an average size of 0.04 ha [24]. The slope image was produced from a 30-m resolution digital elevation model (SRTM) of Tanzania derived from the RCMRD Geoportal [37]. The image was then classified into suitable thresholds of slopes (%) as shown in Table 1 based on as approached by Aguilar-Majarrez and Nath [6]. According to Aguilar-Majarrez and Nath [6], soil texture is more limiting in comparison to slopes, and the clay content was thereby given a higher weight when integrating the two criteria as following:
Engineer capability = (1.5 × soils texture score) + slope score
2.1.5. Farm Inputs
The suitability in terms of farm inputs for fish feed was evaluated from the presence of cropland and livestock numbers [6], as these imply the presence of “know-how,” developed infrastructure, availability of agriculture waste and manure from livestock, that is an important pond fertilizer and subsequently source for fish feed, especially for smallholder farmers [6,16,38,39].
Following the method by Aguilar-Majarrez and Nath [6], the areas of agricultural land were derived by extracting pixels classified as cropland from a land cover map of Africa (ESA CCI LC 2016) [40]. Cropland was assigned with the value of “4” (very suitable), and non-cropland areas as “0” (unsuitable) [6] (Table 1). Although the suitability of crop waste as supplementary fish feed differs between crops, this level of details was not taken into account in this analysis but could be considered in more detailed analysis.
The amount of manure produced was estimated from the regional distribution of animal species and their combined live weight and a species-specific multiplicative factor obtained from FAO [6,33] (Table 3).
The final combined suitability score for cropland and manure availability were estimated as farm inputs by the method of Aguilar-Majarrez and Nath [6], where manure was evaluated as the more important component, thus assigned a higher weight (Table 1):
Farm Inputs = (manure score × 1.5) + cropland score
2.1.6. Farm-Gate Sale
This criterion was included to evaluate the opportunity for the farmer to sell (or barter) the excess fish yield directly to the consumer. According to Kapetsky [12], trading the surplus production as farm-gate sales is mainly done by small-scale or subsistence farmers [12].
The model was based on population density (individuals (i)/km2) as an indicator of the potential for farm-gate sales [6]. The thresholds for population densities were derived from an aquaculture suitability assessment in Latin America by Kapetsky and Nath [16], where the range of 150–300 i/km2 was evaluated to have the highest potential. However, if numbers were any higher, the competition of land was expected to influence the price, which could make the desired level of aquaculture non-profitable. Similarly, but for a different reason, a low population density might have more affordable land but less potential for farm-gate sales. As for these reasons, population density numbers with less than 1 i/km2, as well as numbers of more than 300 i/km2 were both regarded as unsuitable [16].
As the smallest administrative structure in Tanzania are wards, these were derived as a feature layer to visually and spatially represent the population density zones. A ward level census data table (2012) was joined with the feature layer, where i/km2 was developed by dividing the ward population number with the corresponding area in km2. The output was then classified into the suitability scale as developed by Kapetsky and Nath [16].
2.1.7. Market Accessibility
The potential of market accessibility was defined by time proximity to urban centers, following the same thresholds and approach used by Ssegane et al. [15], where larger cities were defined as cities with 50,000 inhabitants or more. A cost distance surface was developed from an OpenStreetMap (OSM) road network map, including attributes on road types and speed limits (see Table 1 and Appendix A) [41]. Roads were classified according to estimated travel speeds, where areas outside the road network were classified with a pedestrian velocity of 5 km/h [15]. The accessibility to markets was assessed by a low cost-distance function, where each cell was analyzed and given a value corresponding to the nearest large city along the least time-costly route [41]. The output from this analysis is expressed as travel hours, classified following the approach by Ssegane et al. [15] (Table 1).
2.2. Weight Assessment through an Analytical Hierarchy Process (AHP)
The weight of the different criteria used for the overall assessment of the suitability for aquaculture was obtained following an analytic hierarchy process (AHP) developed by Saaty [14]. This technique is useful when making assessments of the relative importance between alternatives of diverse characteristics [42].
The aim of the weight assessment was to establish a qualitative, but objective, weight of the importance of the different criteria for small-scale subsistence and commercial fish pond farming. The weight factors for the two models were derived as a group decision by three experts with a good insight and understanding of the aim of the study. The results from the questionnaire with regional fisheries officers from 16 regions in Tanzania (Section 2.3), displaying their perceptions on the importance of the different criteria, were used as a background for the AHP assessment, with the objective to reduce subjectivity in the weighting process and strengthen the connection to the study area. Each expert made an AHP-pairwise comparison using the AHP software tool (AHP-OS), following the AHP-methodology described by Goepel [43]. Additional to the quantification of criteria weights and the consistency ratio (CR), the tool was utilized to retrieve a measure of the consensus between the respondents. This methodology was developed by Goepel [44] and base the calculations of consensus on Shannon α and β-entropy [44]. The partly subjective, and complex nature of the AHP, implies that another group of assessors could have produced a different outcome, but the final weights were similar to earlier studies making similar rankings [c.f. 6, 15] and to the regional officers ranking of factors critical for pond farming of fish. The final weights of the AHP assessment for the different criteria are presented in Table 4.
2.3. Field Observations and Questionnaires
Field observations, semi-structured interviews, and questionnaires were made by visiting 11 urban (Dar es Salaam) and 89 rural (Mbeya, Morogoro, Ruvuma and Tabora) aquaculture farmers. Also, regional fisheries officers representing 16 of Tanzania’s 31 regions responded to an Internet-based survey/questionnaire consisting of 30 questions related to opportunities and constraints for aquaculture development in Tanzania. This was seen as an important complement to the GIS analyses and also as a way to validate the GIS results. Details for the survey with the 89 rural farmers are presented in Mulokozi et al. [11,24].
2.4. Field Validation of the GIS analysis
The field observations, interviews, and questionnaires described under Section 2.3 were used to validate the GIS analysis. A total of 84 field observations of pond farms in four different regions in Tanzania in 2016 were used to generate an average suitability score from the GIS model based on their location (Figure 1a). This average score was compared using Welch Two Sample t-test with 1000 randomly distributed points in Tanzania, where a statistically significant higher suitability score for the observed ponds would indicate that the GIS model made sound predictions. An accuracy assessment was also done for all ponds, estimating how many were located in areas classified as suitable (true positive). Moreover, the actual distribution of aquaculture ponds in Tanzania (Figure 1b) was correlated (Spearman’s rank-order correlation) against the suitability score for the criteria above, where a positive correlation, especially for the most significant criteria (e.g., water), would indicate a sound prediction of the model, under the assumption that farmers make informed and rational decisions about the location of their ponds. However, there are many factors affecting farmers’ choice on where to locate their ponds and it must be remembered that although our model tried to estimate an overall suitability score for ponds based on seven criteria, these may not represent the most critical criteria perceived by the farmers.
3. Results
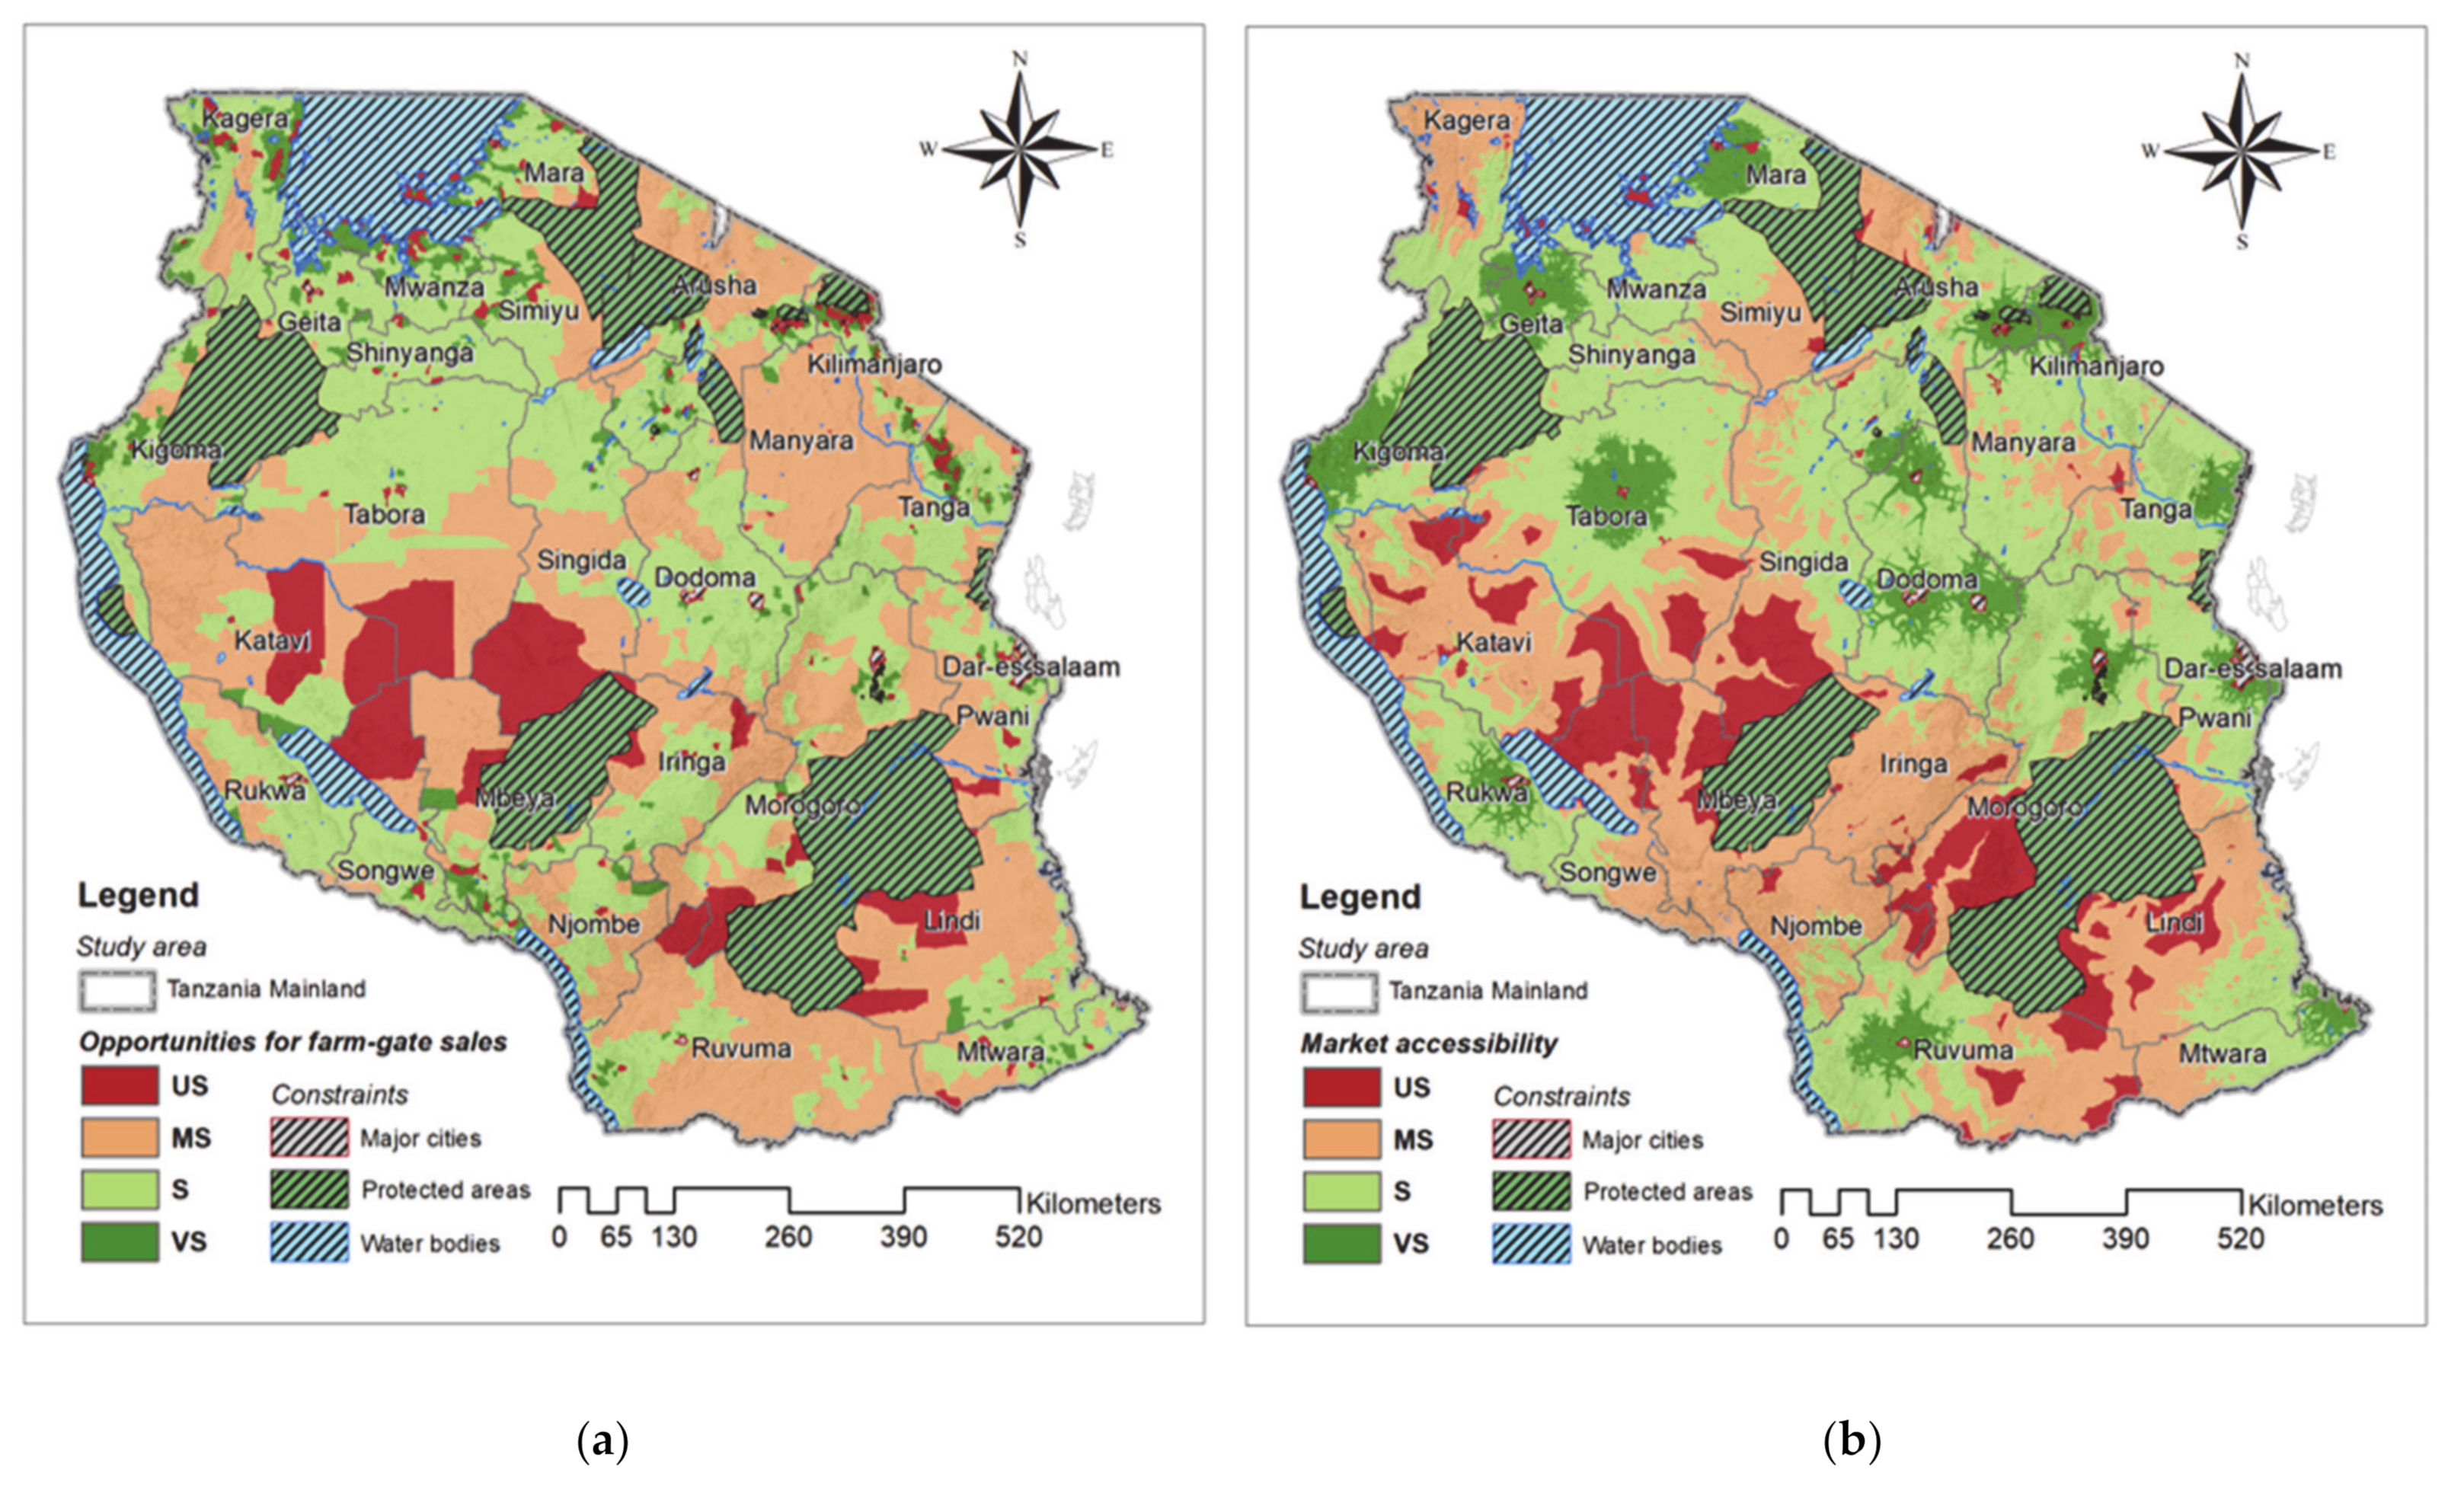
Below is a short presentation of the results from the GIS analyses, interviews, and questionnaires. The current distribution of fish ponds in Tanzania is shown in Figure 1b. Figure 1a indicates the constraint areas, which has been excluded from the analysis and corresponds to 20% of the Tanzania mainland, dominated by protected areas and water bodies. Table 5 outlines areas in Tanzania that are assessed to be very suitable, suitable, moderately suitable, and unsuitable for small-scale subsistence and commercial fish pond farming and for criteria perceived as important for these aquaculture activities. The areas are also presented in the maps under each section below.
3.1. Suitability Scores for Selected Criteria
3.1.1. Water Availability
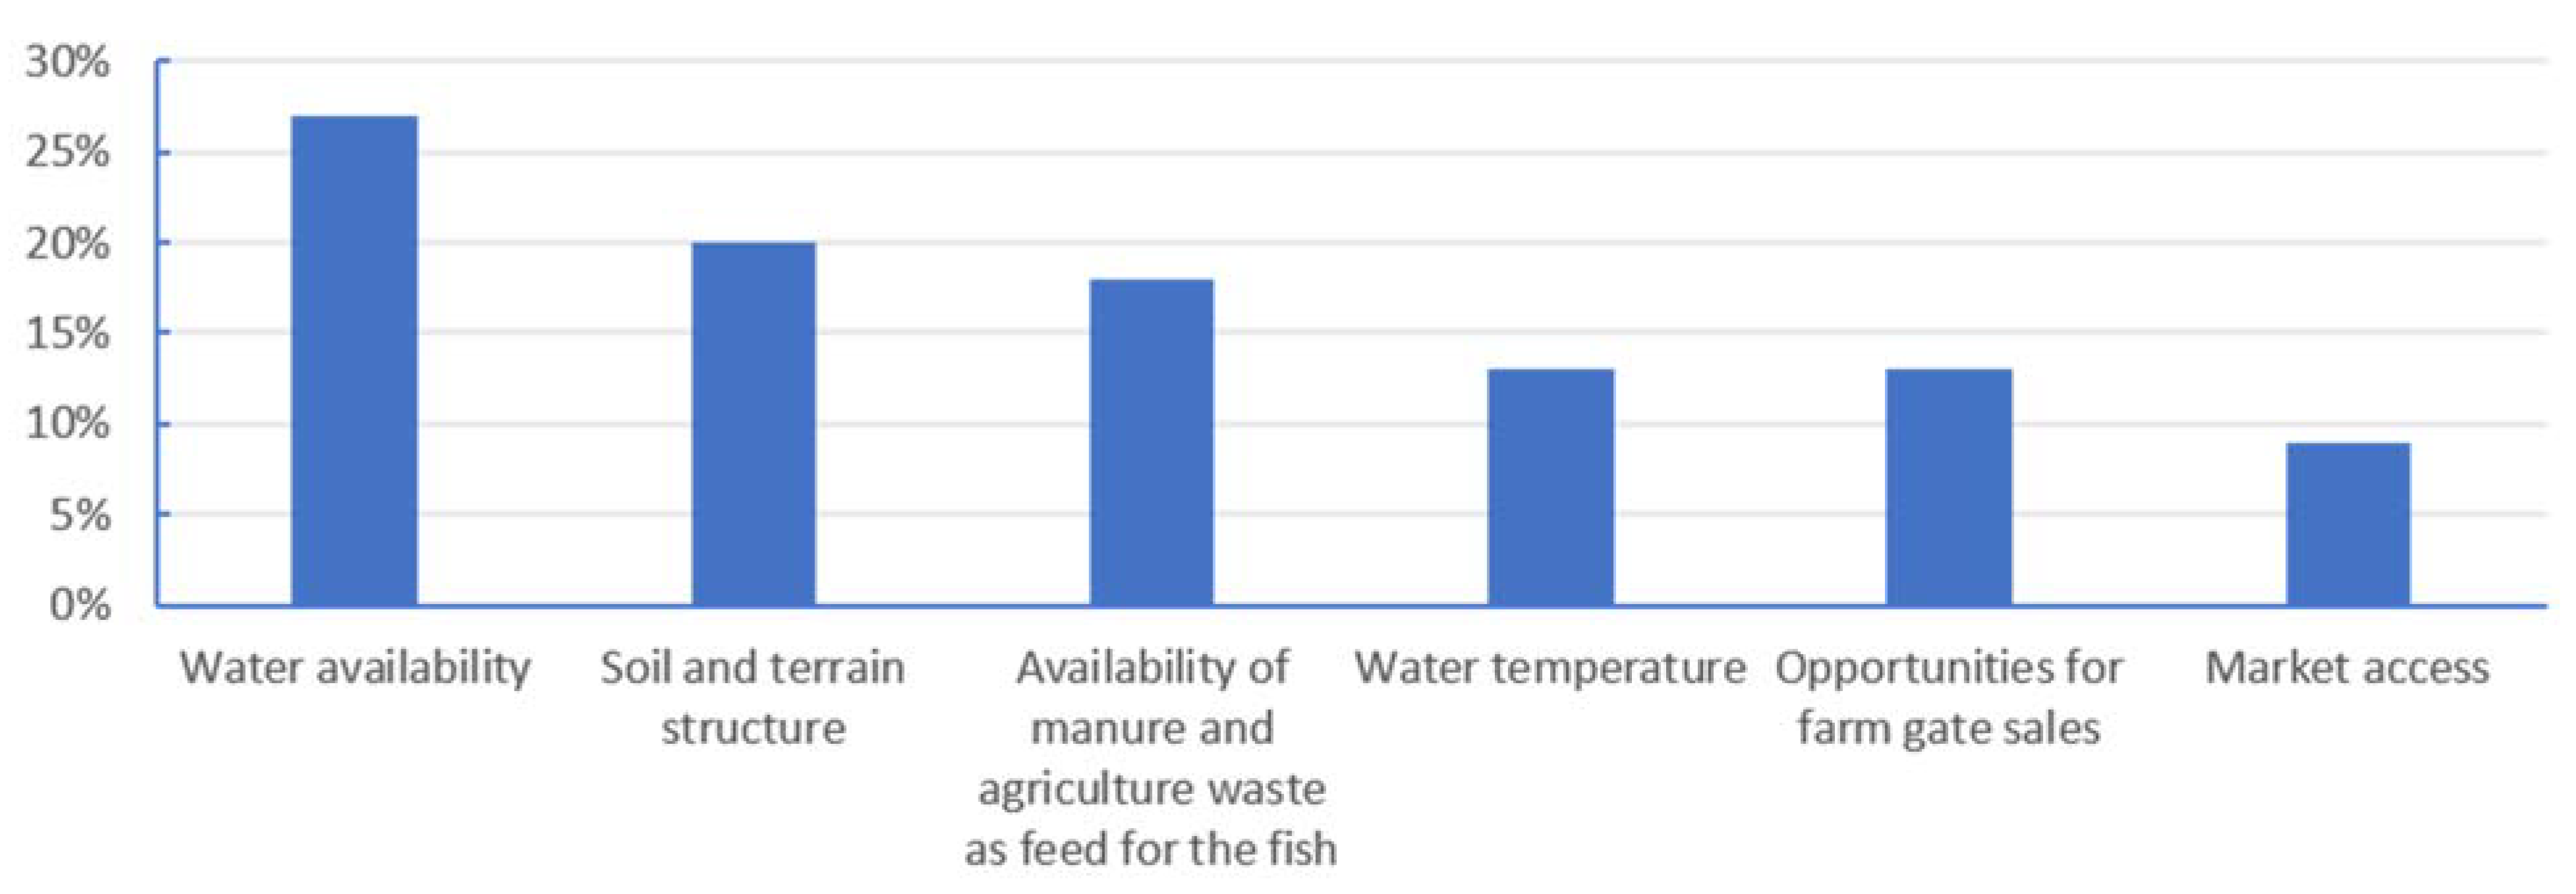
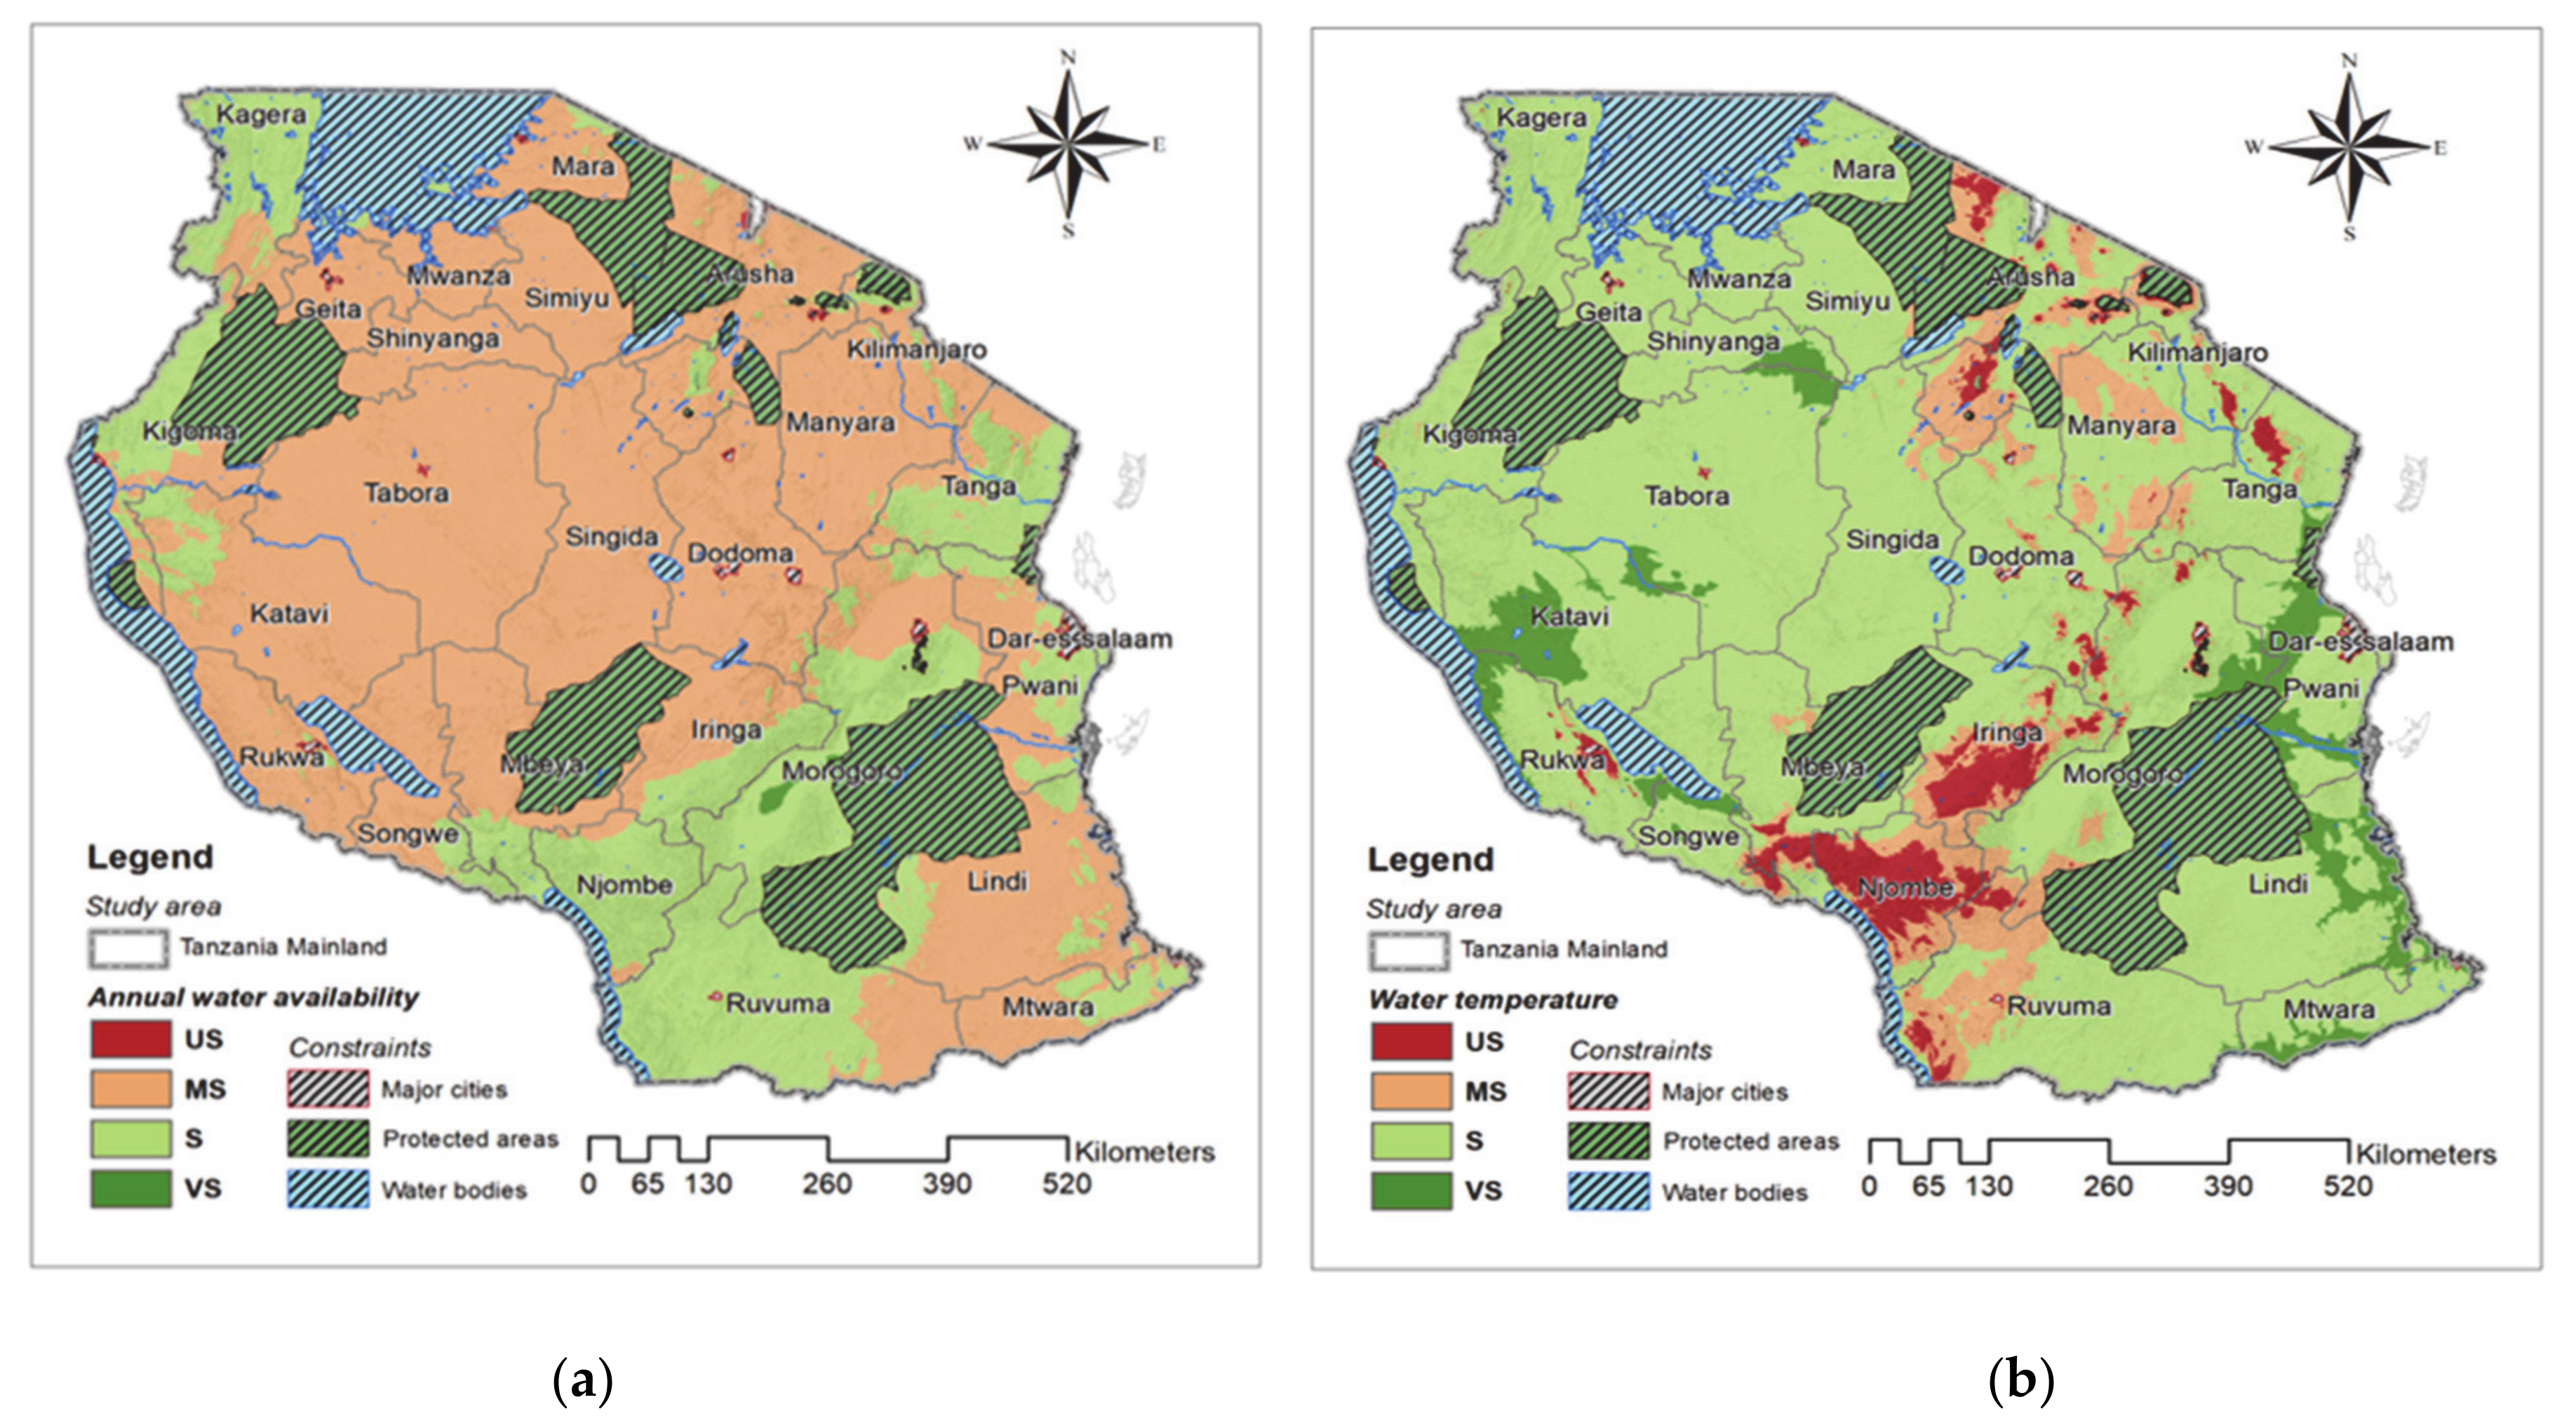
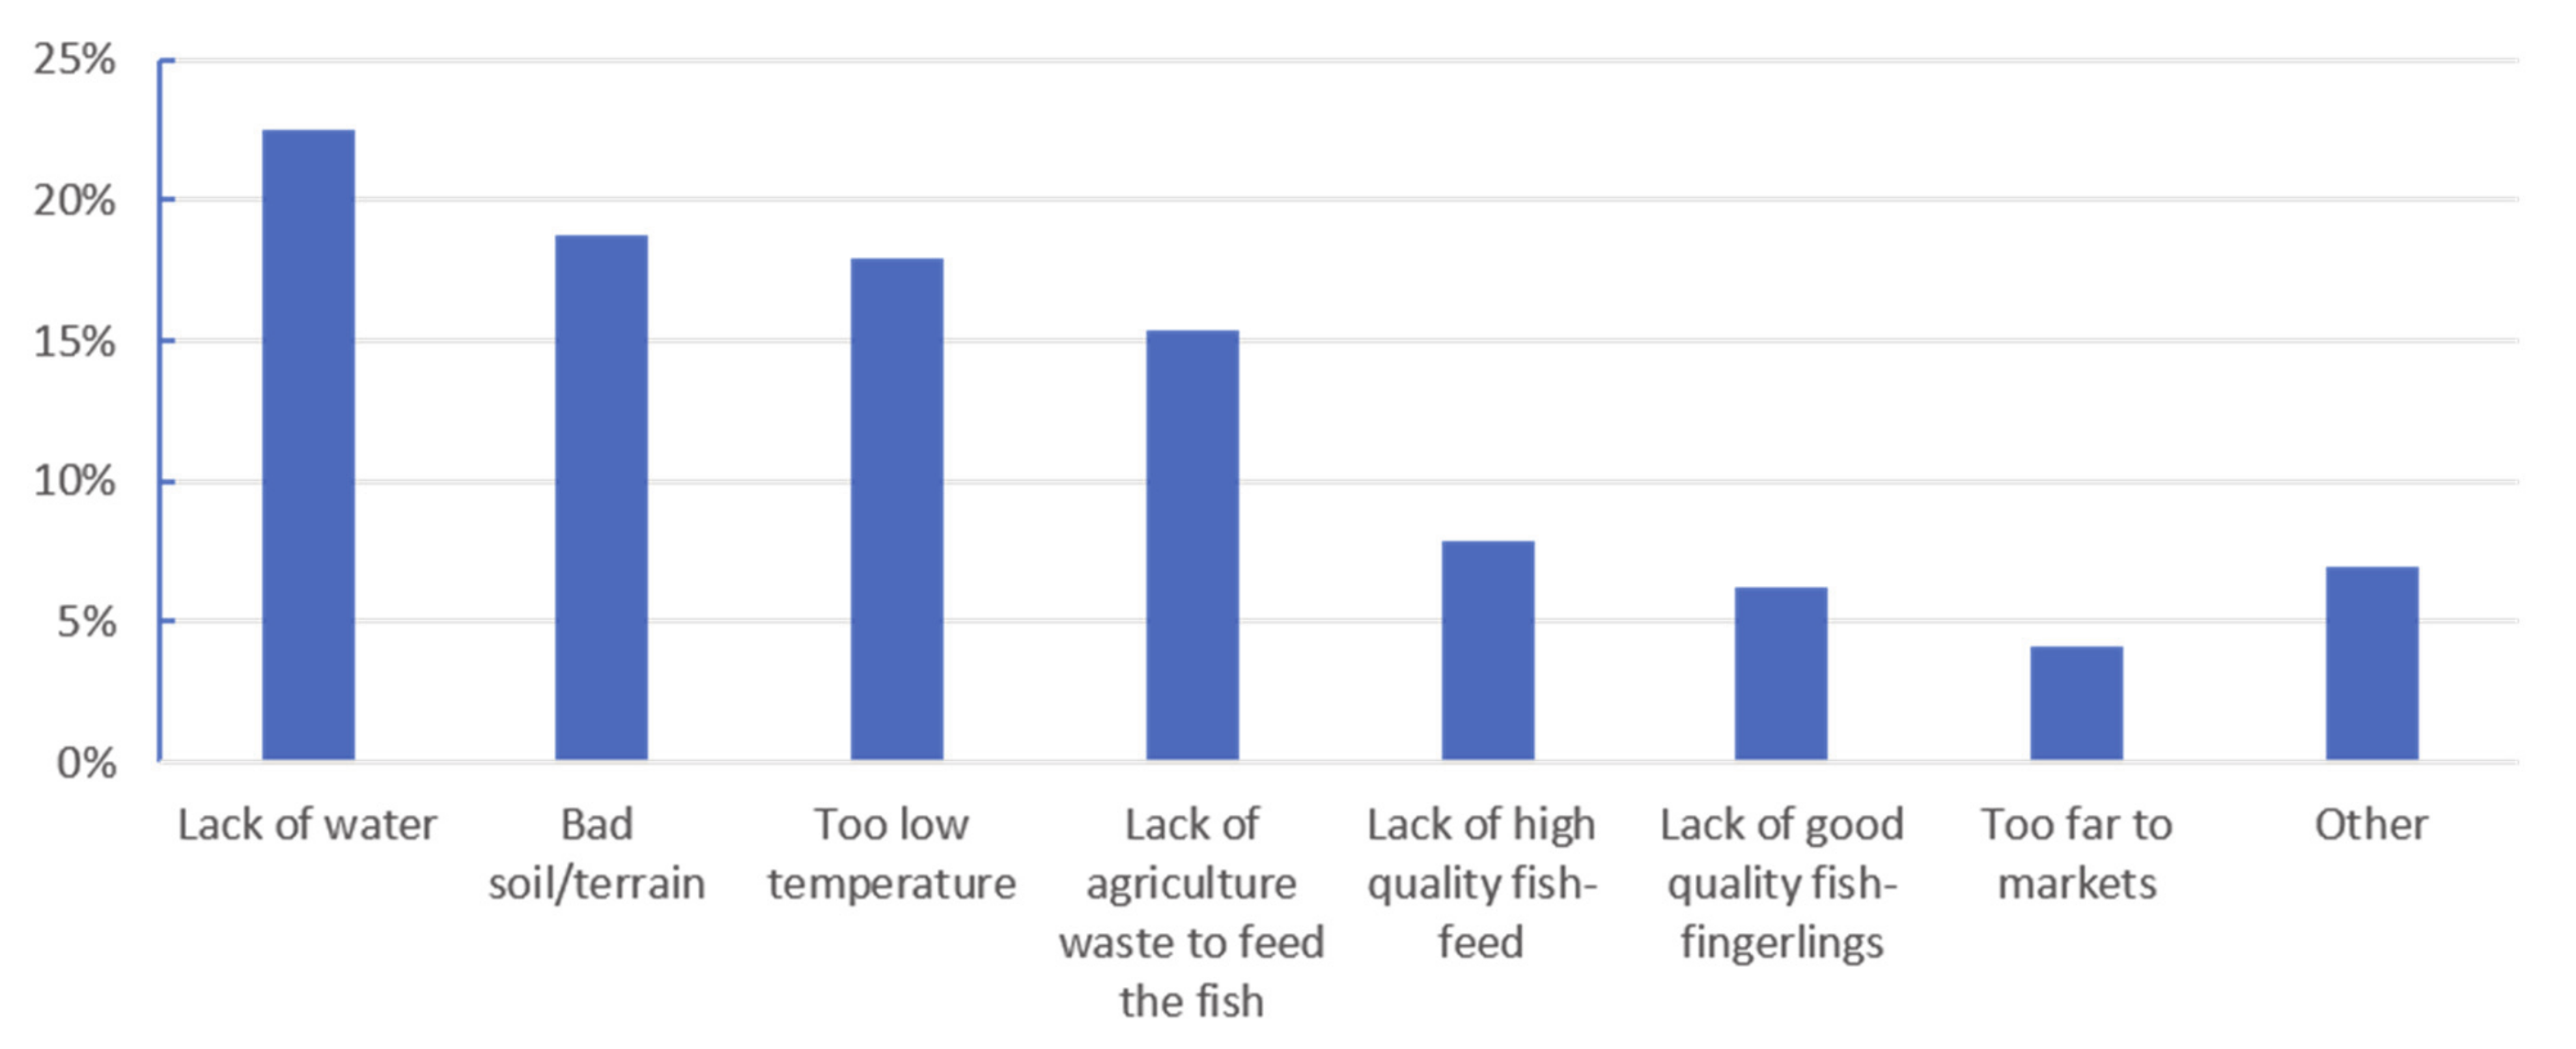
Only a very small area was assessed as very suitable for fish pond farming in Tanzania in terms of water availability (Table 5). Almost 30% of Tanzania was assessed as suitable, while about 70% was assessed to be only moderate suitable for fish pond farming (Table 5). Thus, there is a risk for lack of water, which was confirmed by the fisheries officers, who saw water availability as the most important factor influencing on the fish pond farming in the regions and also on the location of ponds within the regions (Figure 4).
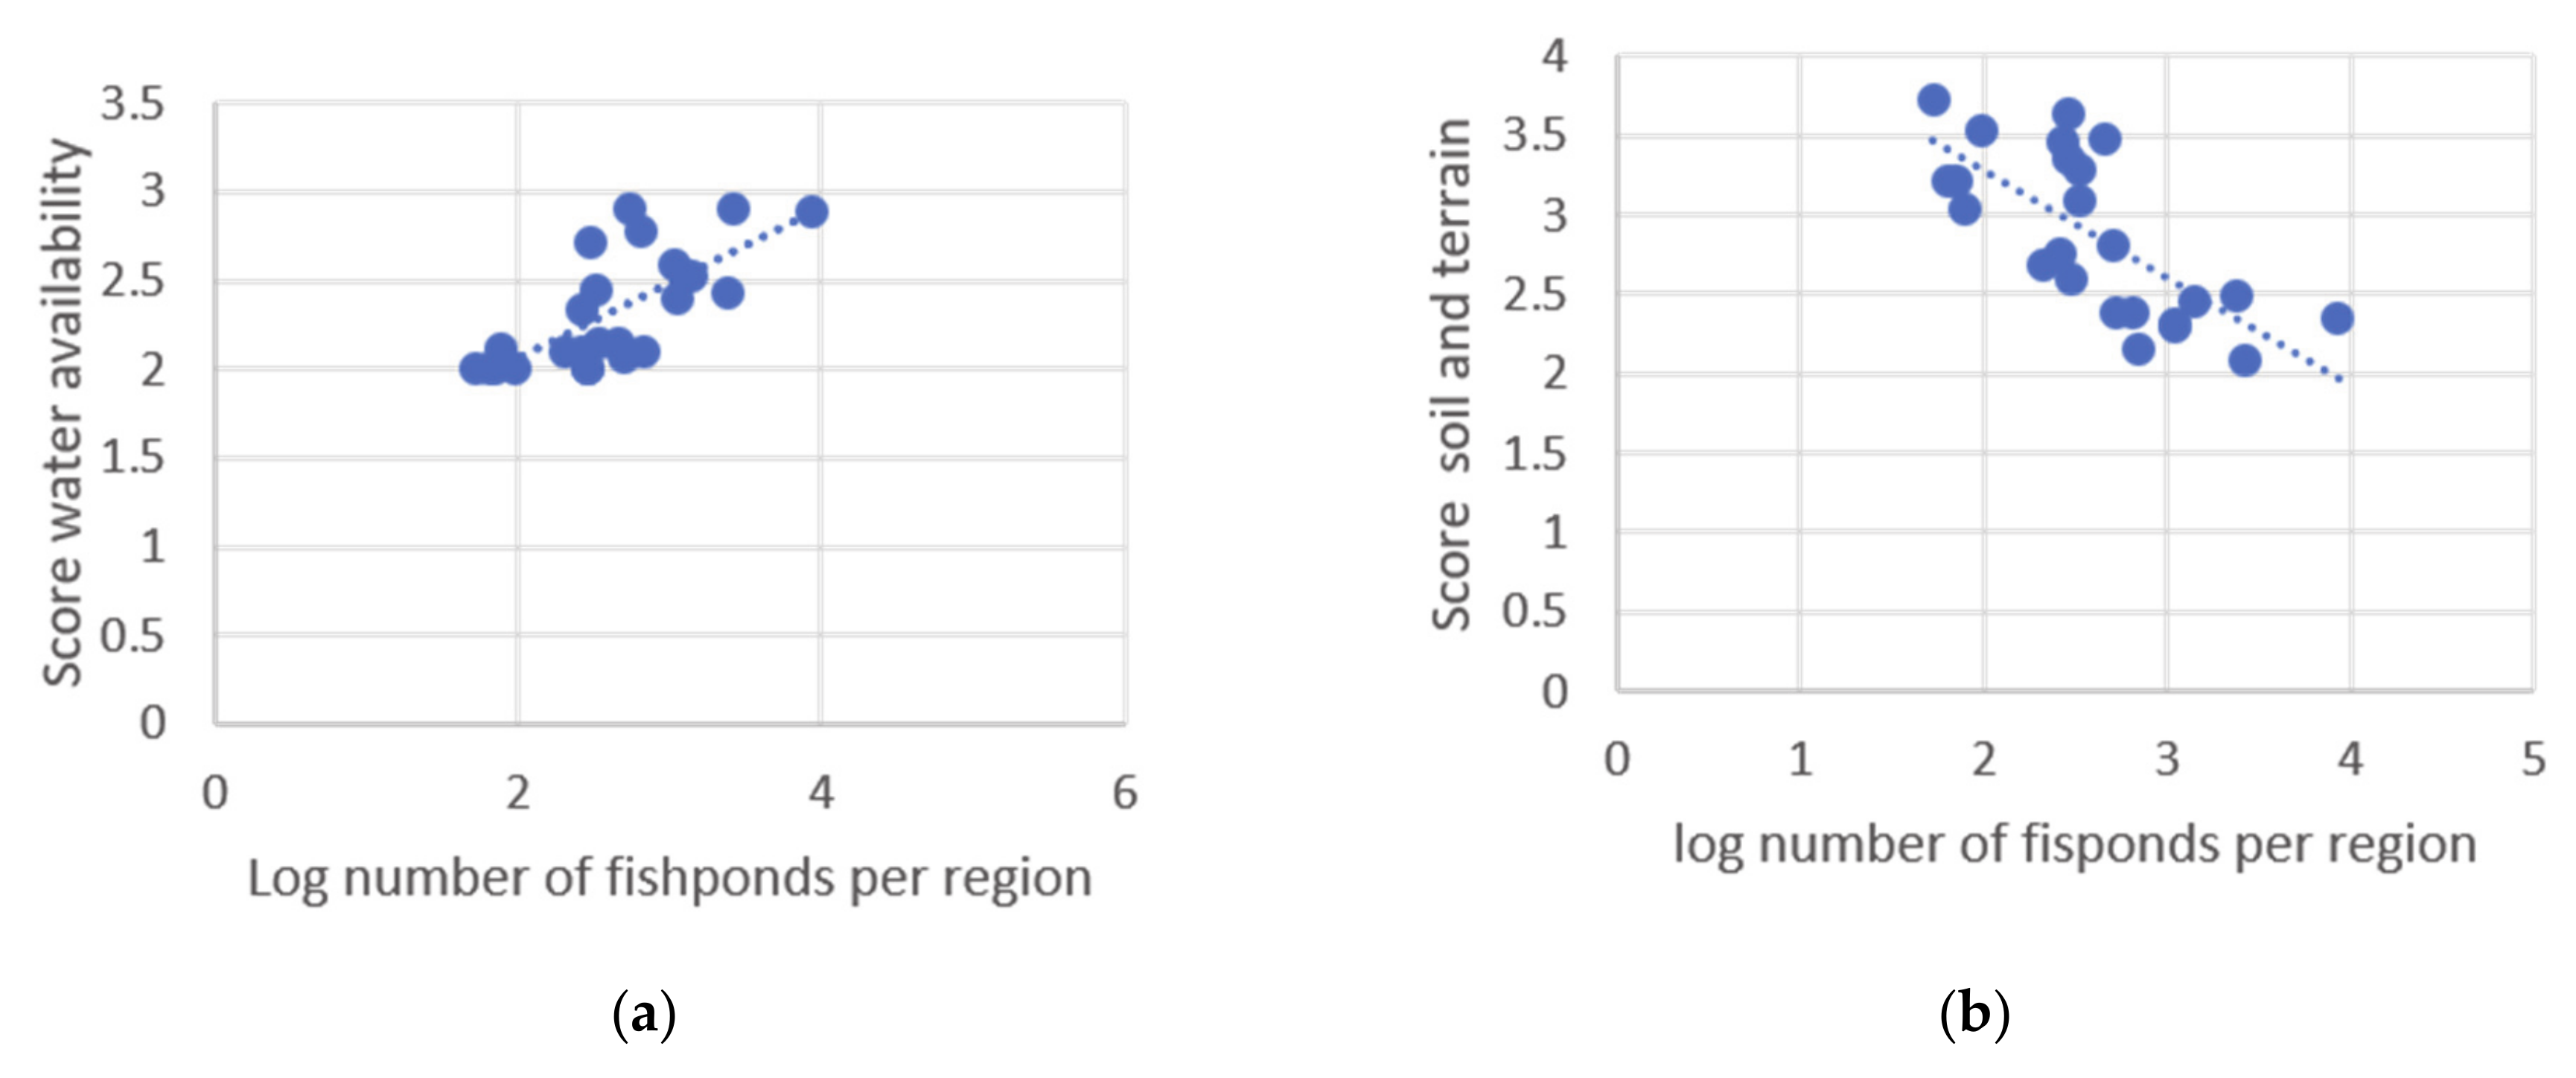
The most suitable regions in terms of water included Njombe, Ruvuma, Kagera, and Tanga (Figure 5a). The two first regions also had the highest number of fish farmers and fish ponds in Tanzania (Figure 1b). Overall there was a positive correlation between the suitability score for water availability and number of fish ponds (Figure 6a), indicating the importance of water availability for fish pond farming in Tanzania.
3.1.2. Water Temperature
Although Tanzania is located close to the equator, the regional fisheries officers considered low water temperature as an important factor affecting the farming of warm water species such as Nile Tilapia and African Catfish (Figure 7). About 80% of Tanzania was assessed to be suitable and 10% as moderately suitable for fish pond farming in terms of water temperature (Table 5 and Figure 5b). The most suitable regions were those along the Indian Ocean and included Lindi, Mtwara, and Pwani. Overall inland regions at high altitudes were the least suitable areas in terms of temperature. Several regional fisheries officers mentioned that climate change had led to lower temperatures during the dry season, which had affected the fish growth negatively (Table 6).
3.1.3. Engineering Capability
Almost 70% of Tanzania was assessed to be either very suitable (28%) or suitable (40%) in terms of soil and terrain for fish pond farming (Table 5, Figure 8a), and these physical factors were of less concern than water availability. There was a negative correlation between the soil and terrain suitability and the number of pond farms (Figure 6b), indicating that farmers pay less attention to these conditions compared to the availability of water. Still the regional fisheries officers saw this as the second most important factor influencing fish pond farming in the regions, and saw this as a constraining factor for the development and location of fish ponds (Figure 4 and Figure 7). The most suitable regions in terms of soils and terrain conditions included Shinyanga, Tabora, and Geita, which are among the least suitable regions in terms of water availability (Figure 5a and Figure 8a).
3.1.4. Farm Inputs
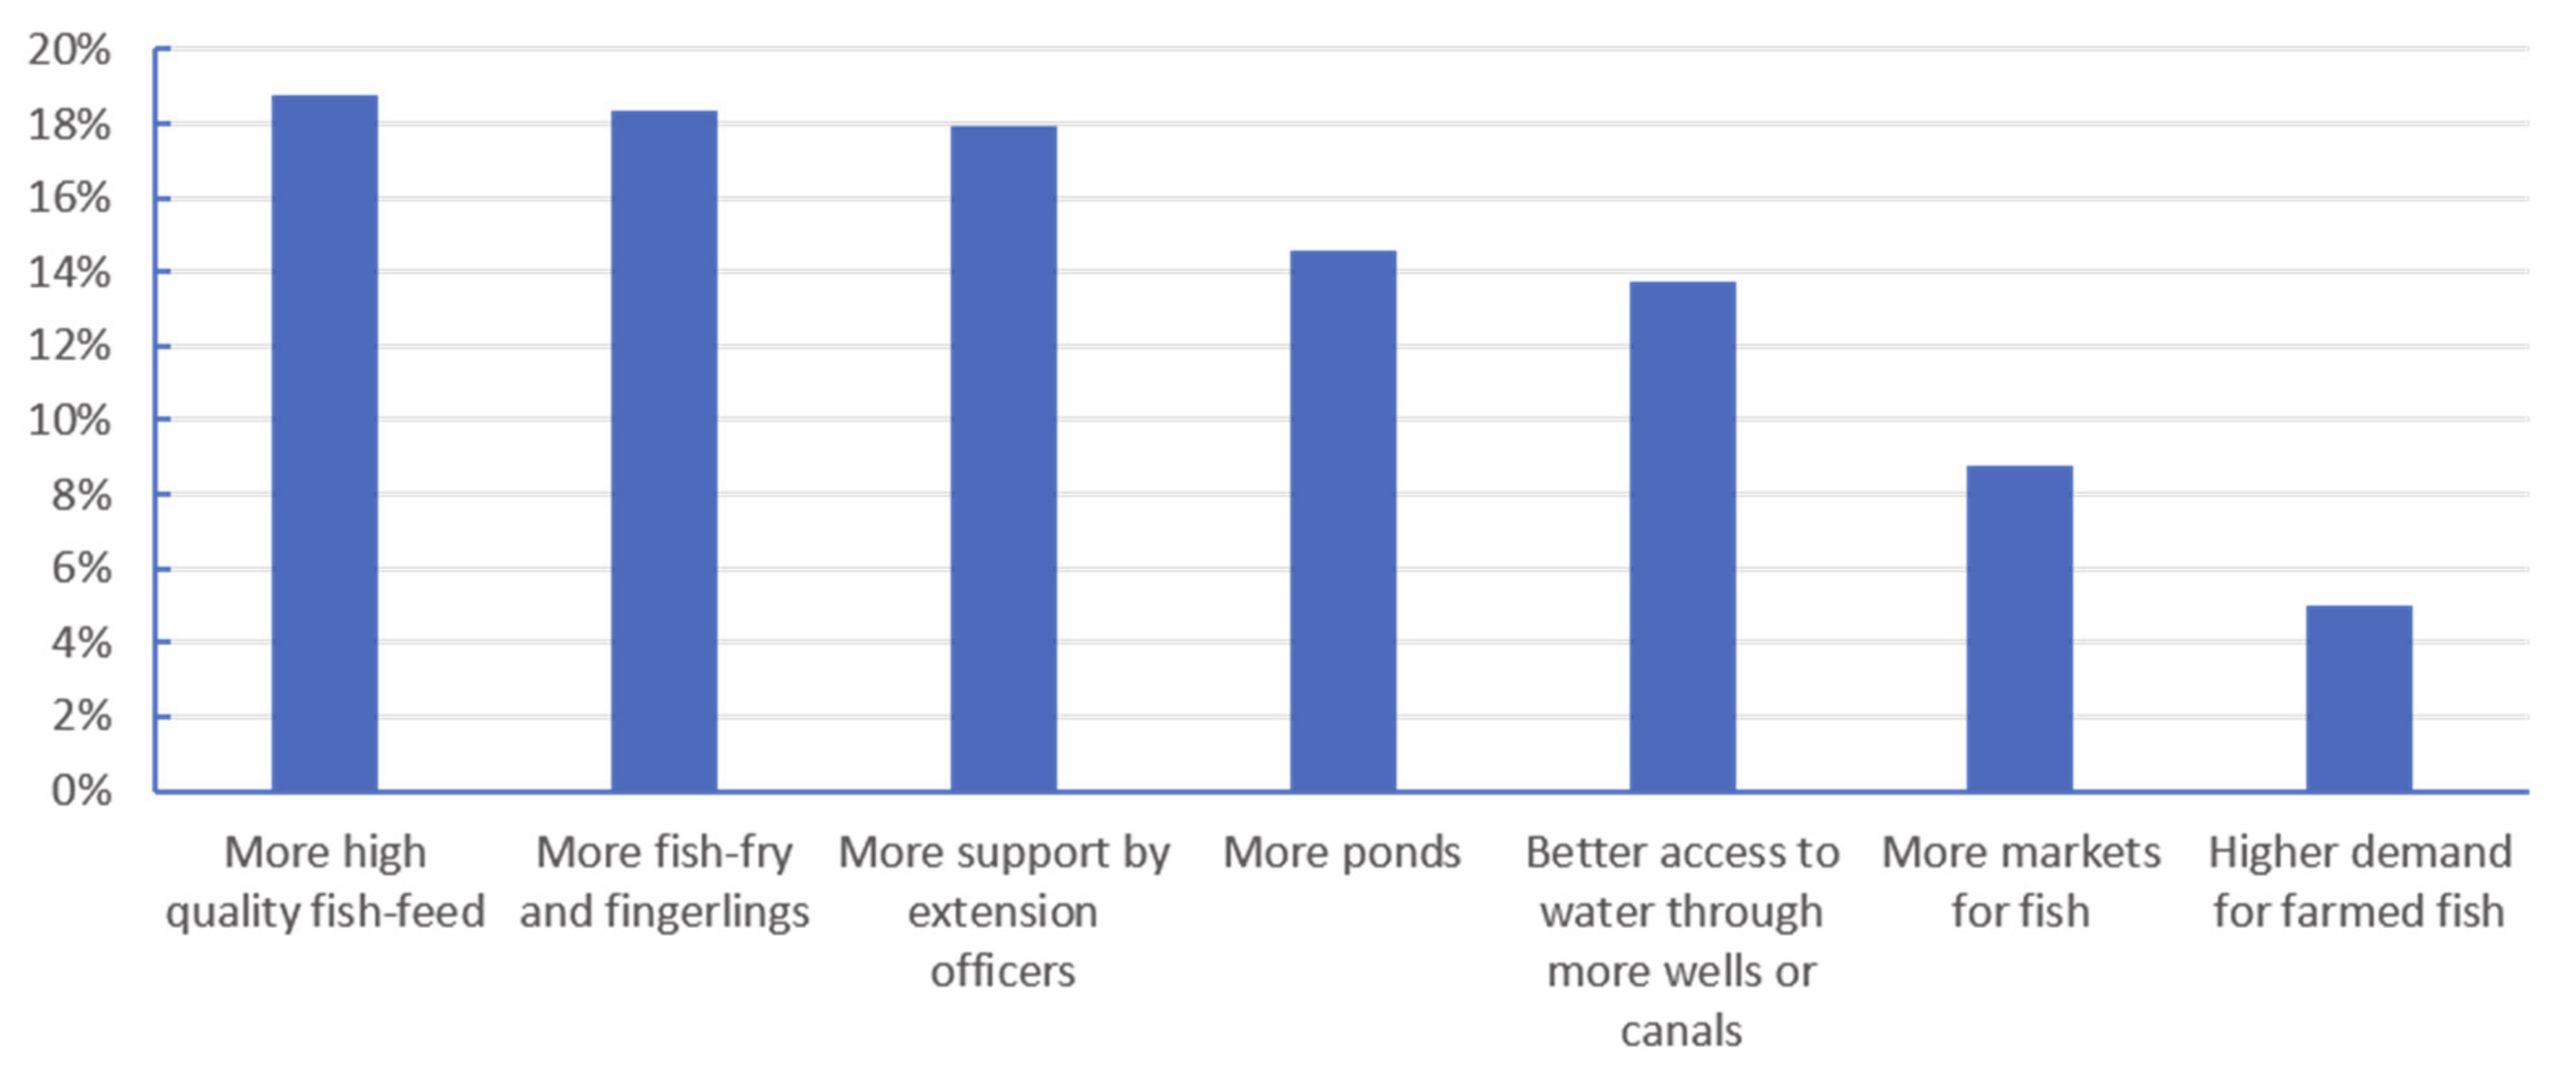
Almost 60% of Tanzania was assessed to be very suitable (26%) or suitable (32%) in terms of availability of farm inputs to be used as feed for the fish (Table 5). The most suitable regions overlapped to some extent with the regions that had suitable soil and terrain conditions, and included Mara, Shinyanga, and Mwanza (Figure 8b). Although almost all rural farmers rely on agriculture waste to feed the fish (Table 7), farm inputs are often not the most critical factor limiting fish pond farming, as most farmers who practice fish pond farming often have agriculture and/or animal husbandry as their main activities [24]. This ensures that agriculture waste and manure are available to feed the fish, even if some regions are less densely covered by agriculture activities. Still the regional fisheries officers indicated that agriculture waste was an important factor for current pond farming activities (Figure 4), and they emphasized that the low availability of high-quality fish feeds was a constraint to aquaculture development and must be improved to be able to expand aquaculture in the future (Figure 7 and Figure 9). This was also mentioned by some of the interviewed farmers [11].
3.1.5. Farm-Gate Sales
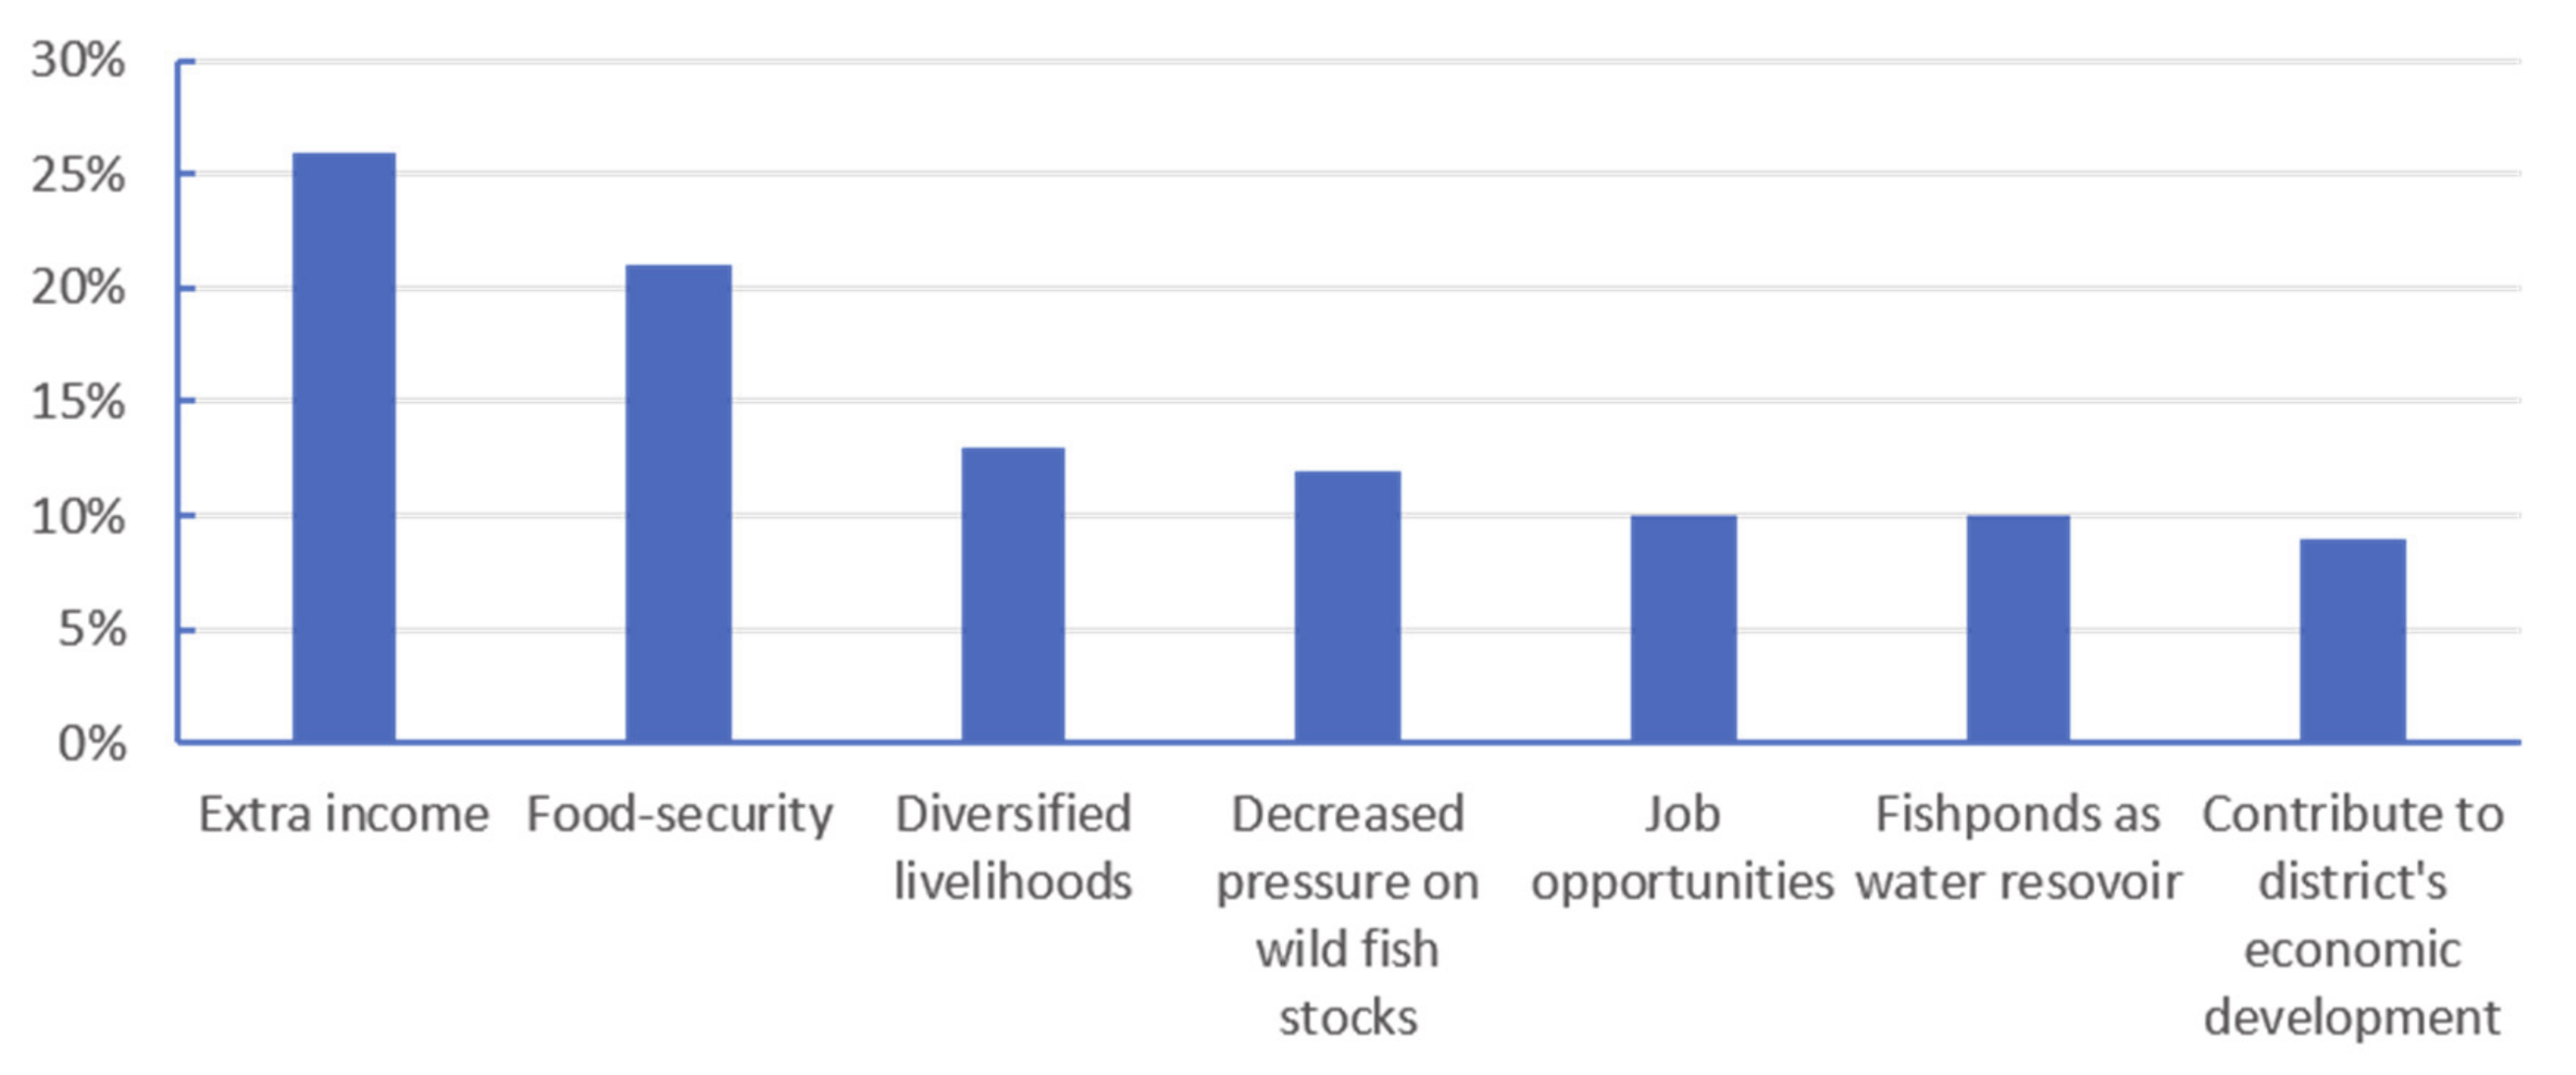
Almost 50% of Tanzania was very suitable (5%) or suitable (43%) in terms of farm-gate sales (Table 5) and was, by default of the method, closely linked to the population density. However larger urban areas were seen as unsuitable as fish markets were assumed to outcompete farm-gate sales in these areas. The most suitable regions in terms of farm-gate sale opportunities included Shinyanga Simiyu, Geita, and Kagera (Figure 10a). However, as indicating by the regional fisheries officers, subsistence fish farmers were less dependent on this factor as a large part of the fish is consumed at home [24], contributing to an increased food security. Still, the extra cash generated from selling fish was seen as a major benefit from current aquaculture activities (Figure 11). In urban areas, where most fish are farmed to improve the income, farm-gate sales and access to markets become increasingly important to cover for the higher costs of more commercial farming methods (c.f. Table 7).
3.1.6. Market Accessibility
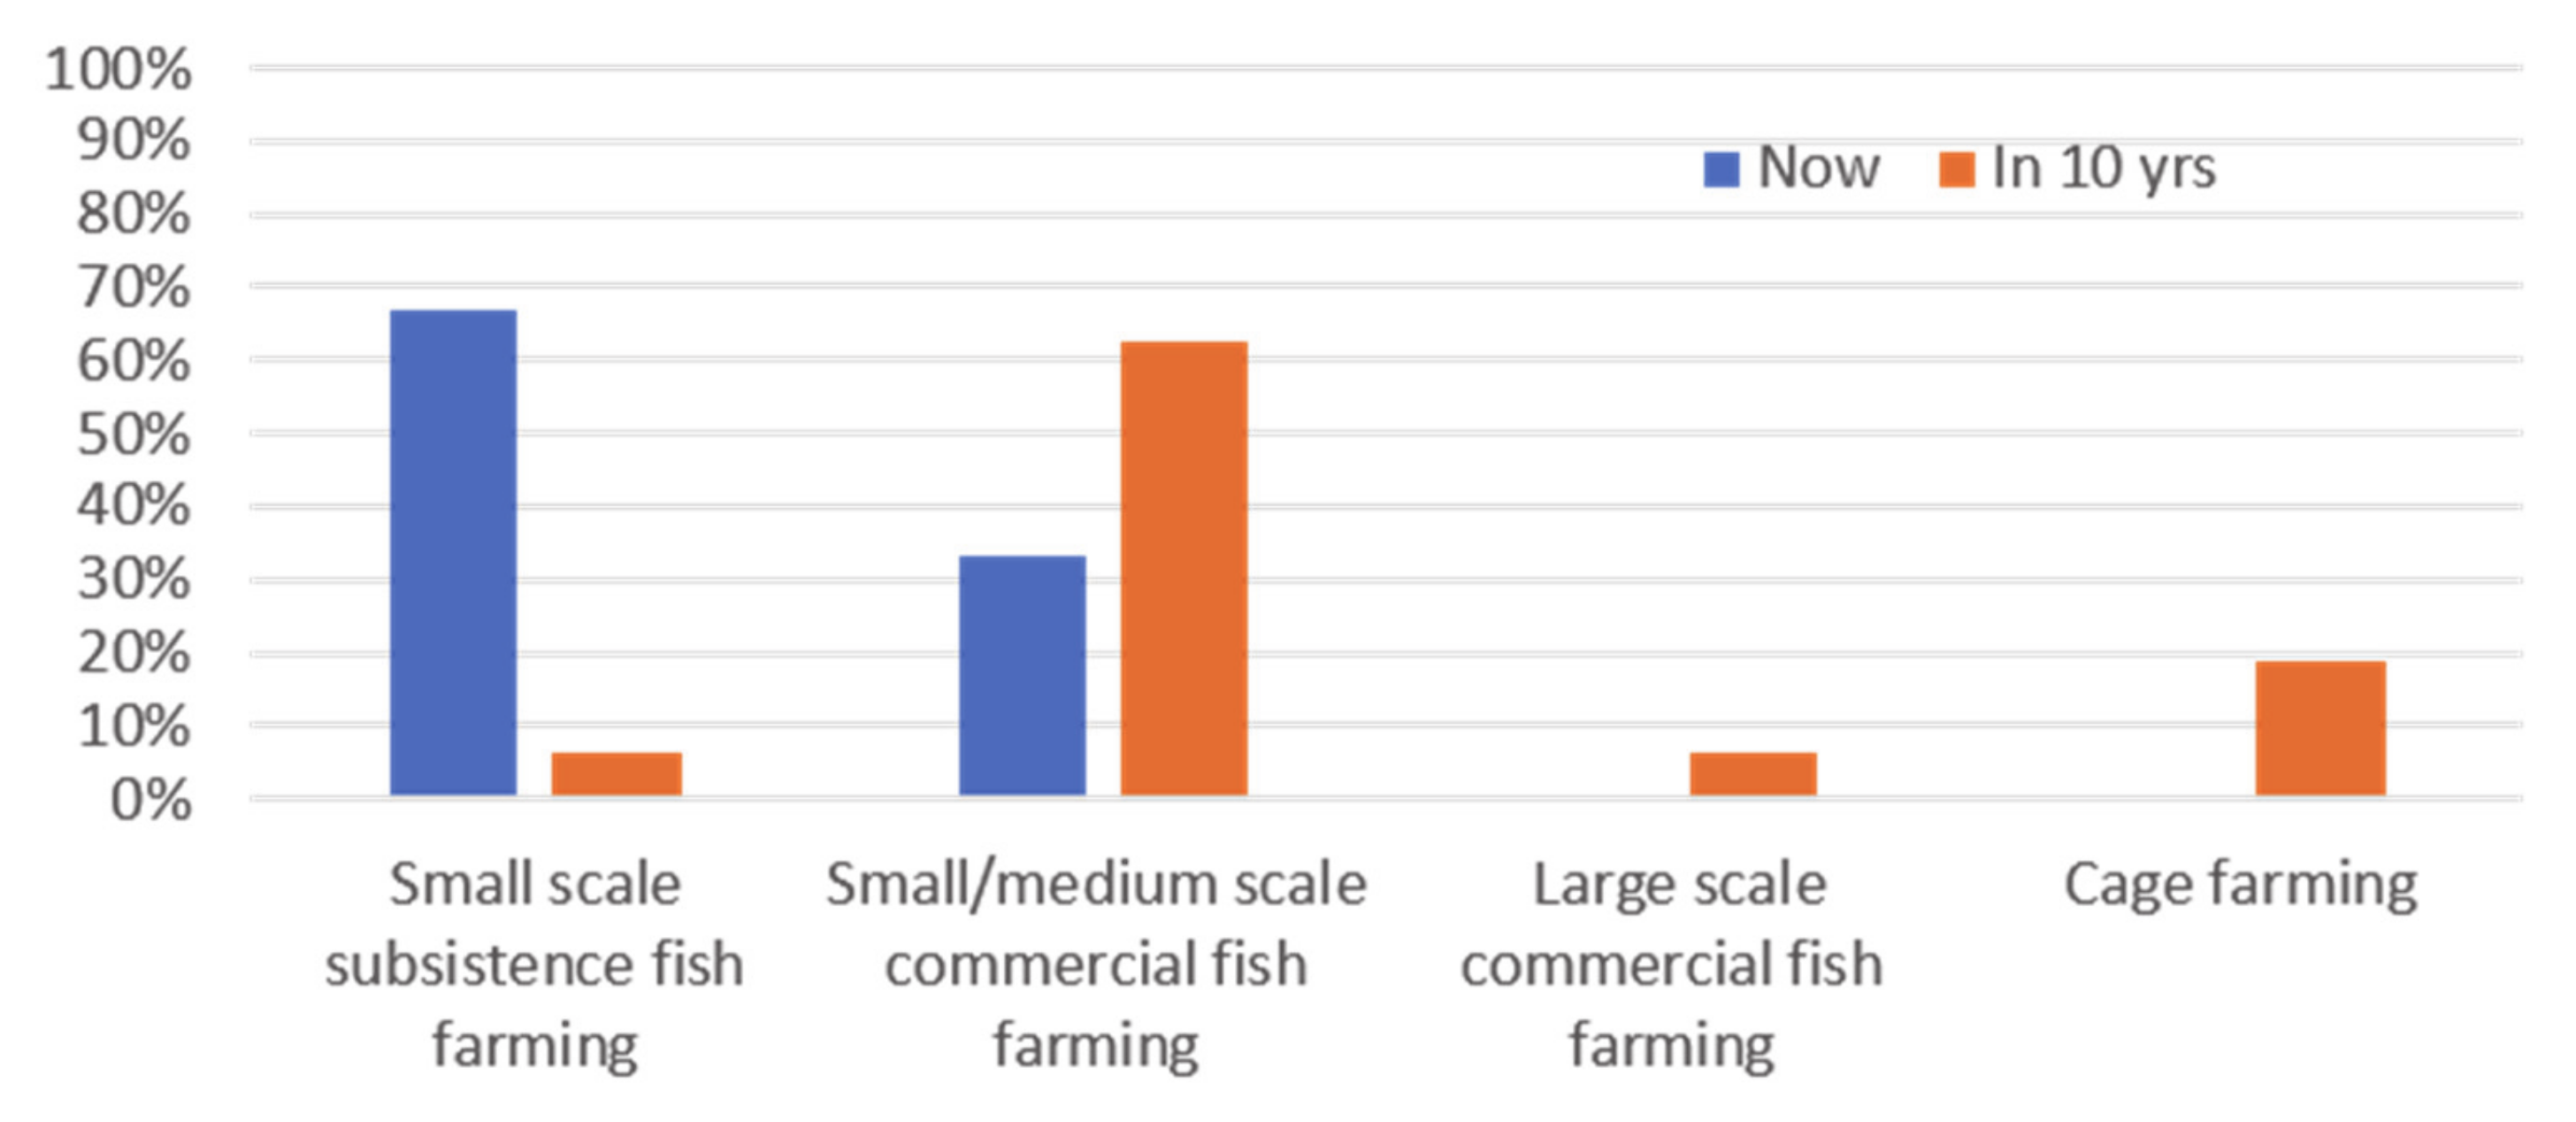
Market accessibility is, compared to farm-gate sales, more dependent on urban centers and good road-networks and these criteria do not directly overlap, although both are influenced by the population densities (Figure 10b). About 10%, primarily close to urban areas, were very suitable and 43% were suitable in terms of market accessibility (Table 5). Under current aquaculture practices, which are dominated by small-scale subsistence fish farming according to the regional fisheries officers, market accessibility is seen to only be of minor importance (Figure 7, Figure 9, and Figure 12). However, the regional fisheries officers expected that within 10-years that medium-scale commercial fish farming would be the dominating aquaculture practice (Figure 12). These practices rely on a good access to markets, infrastructure, and high quality of fish feeds and fingerlings (Table 7), and the map indicates that the most suitable areas for these forms of aquaculture will be close to more densely populated areas with comparatively good infrastructure (Figure 10b).
These farming practices are increasingly being applied in urban areas, such as Dar es Salaam, Arusha, and Mwanza cities. As indicated in Table 7, they differ from small-scale subsistence farming activities in many aspects, as they focus more on a higher production in both quality and quantity, aimed primarily at commercial fish production for markets. They often require a different skill set compared to the rural aquaculture and most commercial farmers have higher education than rural farmers (Table 7). They require higher investments and the ponds are often made of concrete. High-quality fish fingerlings are stocked at higher densities and fed commercial fish feeds, resulting in substantially higher yields. The higher investments involve higher risks, but can also generate higher revenues and overall urban farmers seem to be at least as positive to aquaculture as rural farmers and more farmers seem to be willing to expand their activities (Table 7).
3.2. Overall Suitability Assessment of the Fish pond Farming Potential in Tanzania
About 81% of the regional fisheries officers perceived that the aquaculture production had increased during the last 10 years in Tanzania, with an estimated increase of 45%, and they believed that fish farming would continue to increase in the coming 10 years (Table 6). This was due to many different factors, including an increased number of fish farmers, improved farming skills, and also an increased willingness among farmers to diversify their livelihoods. Around 88% of the regional fisheries officers thought that the demand for farmed fish also would continue to increase in the future, because of an increasing human population, decreasing catches of wild fish, and because an increasing number of people realize that fish provide nutritional food and contribute to food security (Table 6). The regional fisheries officer felt that the overall attitude to aquaculture among farmers was positive and that the majority either wanted to expand or continue to farm fish (Table 6), which also was confirmed in the field survey with the fish farmers ([11], Table 7).
Almost all (94%) of the regional fisheries officers thought that future aquaculture practices would be more commercial and primarily be done to generate a good income and profit (Figure 12, Table 7). This implies a major transformation of current aquaculture practices in Tanzania, which currently are dominated by small-scale subsistence farming, and would require improved know-how through more extension services and improved inputs, such as high-quality fish feeds and fingerlings (Figure 7, Figure 9, and Figure 12, Table 7). Our survey showed that almost 80% of the regions in Tanzania had at least one fish hatchery, but only 38% had fish feed producers (Table 6).
Based on the fisheries officers’ perception it is likely that future aquaculture activities in Tanzania will continue to include small-scale subsistence pond-farming, and also more commercially oriented aquaculture (Figure 12). The suitability of these two types of farming practices is analyzed further in the sections below, by weighing together the criteria described above in Section 3.1.
3.2.1. Potential for Small-Scale Subsistence Fish Pond Farming
About 60% of Tanzania was assessed as being suitable and 40% as moderately suitable for small-scale subsistence pond farming of Nile tilapia and African sharptooth catfish, combining all criteria considered in this study. The most suitable regions included those around Lake Victoria, such as Shinyanga, Mwanza, Simiyu, and Geita, primarily because of good soil and terrain conditions, availability of agriculture inputs for fish feed and farm-gate sales (Figure 13a). Also coastal areas such as Mtwara, Pwani, and Tanga were suitable, primarily because of good access to water, suitable temperature, and soil conditions. Some of the least suitable regions included Katavi, Arusha, and Lindi (Figure 13a).
The suitability score for 84 observed ponds (2.82, Figure 1a) was statistically significantly higher (p < 0.001) than the suitability score from 1000 randomly distributed points (2.70), validating the results from the GIS model used for small-scale pond farming. 100% of the observed ponds where also located in areas classified as suitable, showing a 100% accuracy (true positive) of the model prediction. There was also a statistically significant positive correlation (p = 0.001) between the distribution of ponds and the suitability score for water (Figure 6a), which was seen as the most significant factor influencing on the distribution of ponds by the fisheries officers (Figure 4).
3.2.2. Potential for Medium-Scale Commercial Fish Pond Farming in Tanzania
About 53% of Tanzania was estimated to be suitable and 47% moderately suitable for commercial fish pond farming. Compared to subsistence fish pond farming, the suitable areas were similar, but more concentrated to urban centers with good infrastructure and markets. In areas with good conditions for commercial aquaculture, such as Tanga, Kigoma, Pwani, and Geita, most fisheries officer reported that small-scale subsistence farming still was the dominating farming activity, but with a production mainly targeting local markets (Figure 13b). Both the production and demand of fish had increased in the last ten years. The fisheries officers believed that there would be a future expansion and intensification of aquaculture in these areas for the coming ten years (commercial fish farming including cage farming), and that this should be encouraged with support from more extension services and cooperation from private enterprises, that could provide high-quality fish feeds and fish seeds. As seen from the survey with fish farmers, small-scale commercial farmers in Dar es Salaam primarily produced fish to be sold at the market for an increased income. They relied to a large extent on fish fingerlings from hatcheries, which they stocked in concrete ponds at a high density compared to the rural farmers (Table 7). They only used pellets to feed the fish and often relied on ground water that they needed to pump to the ponds. Thus, their production cost was comparatively high, which needed to be compensated by a high yield of fish.
The suitability scores for the 84 observed ponds (2.83) were statistically significantly higher (p < 0.001) than the suitability score from 1000 randomly distributed points (2.62), validating the results from the used GIS model for commercial fish farming. About 80% of the observed ponds where located in areas classified as suitable, indicating 80% accuracy (true positive) of the model prediction. As the observed reference ponds primarily were located in rural areas, it was expected that some ponds would not meet the suitability criteria for commercial small-scale farming and a false negative of 20% felt as a reasonable deviation.
4. Discussion
Our results indicate that there is a good potential for fish pond farming in Tanzania, but the sector, particularly commercial aquaculture, is still in its infancy, especially compared to countries in Asia, but also compared to countries like Egypt, Uganda, and Nigeria [1,2,3,4,23,45]. Still, this only shows that the aquaculture experience from these countries could provide valuable guidance on how to further develop aquaculture in Tanzania. Some 80% of the regional fisheries officers said that fish farming had increased during the last 10 years, and that it was likely to expand in the coming 10 years, and overall the attitude among regional fisheries officers and local farmers to aquaculture was positive (Table 6 and Table 7, [24]). As the majority of the fish in Tanzania currently comes from Lake Victoria, with stagnating or even declining fish catches, partly due to overfishing and pollution, it can be expected that the demand for farmed fish will increase in the future [4,46], which was confirmed by many of the regional fisheries officers. Still, even with an expansion in aquaculture it would be difficult to keep the currently low, but nutritionally important, per capita fish consumption in Tanzania at the same level as today [2,4,9]. With a per capita fish consumption of 8.6 kg per year and a population growth of 3% [20], the additional fish production required to maintain 2018′s level of fish consumption, would be some 110,000 tons in 2025. If only coming from aquaculture, this would imply a 10-fold increase of the current combined yield of marine and freshwater aquaculture or a 20-fold increase of the freshwater fish production. With a yield of 2–4 tons of fish per ha and year in extensive pond farming (cf. Table 7, [11]) this would require an additional area of 27,000–55,000 ha for pond farming.
Although this would be a major expansion of the aquaculture activities in Tanzania and require considerable investments in aquaculture [c.f. 4] the availability of suitable land would certainly not be a constraint according to our results. Around 60% of Tanzania, or 450,600 km2, is suitable for fish pond farming. The challenge would rather be to find ways to support an expansion that are designed to fit local conditions and that ensures a sustainable and efficient production of fish.
In terms of physical conditions water availability is the most limiting factor and assessed as being “suitable” in less than 30% of the country. This is much less than the almost 50% estimated by Manjarrez and Nath [6], and may become even a more critical factor in the future with the ongoing impact from climate change [47]. In the field survey of 89 small-scale farmers, water scarcity was seen as a serious problem among 45% of the farmers, and almost 30% of the farmers felt that the availability of water limited the adoption rate of fish pond farming [24]. Moreover, more than 80% of the regional fisheries officers perceived water availability as the most important factor influencing on fish pond farming, and that water scarcity was a difficult challenge for current farming activities and for the future expansion of aquaculture (Figure 7 and Figure 9). The majority of the officers felt that the availability of water was affected negatively by climate change and that this problem would increase in the coming 10 years (Table 6). According to the regional fisheries officers the majority of the farmers currently extract their water from rivers (c.f. [11], Table 7), and more wells or canals were seen as an important way to expand aquaculture in the future ([24], Figure 9).
The correlation between water availability and number of fish ponds in the regions of Tanzania (Figure 6a) confirms that water availability is an important factor determining the distribution of fish ponds. The highest number of fish farmers and ponds is found in Ruvuma, Njombe, Iringa, and Mbeya, which have suitable water conditions, despite they have some areas with suboptimal conditions in terms of soil, terrain, and temperature. Overall, one could expect that with increasing altitude the conditions for water availability improves, while the conditions for soil, terrain, and temperature get worse. Thus, in many cases farmers need to make a trade-off between these factors, and it seems as water is of highest priority, which could explain why the distribution of ponds was negatively correlated with the suitability score for soil and terrain (Figure 6b). Still 70% Tanzania was estimated to have very suitable or suitable soil and terrain conditions. The corresponding estimate by Aguilar-Manjarrez and Nath [6] was 90%, and these physical factors seem to be of less concern than water availability.
Some regions south of Lake Victoria were assessed as suitable for most of the criteria except water, and overall our results indicate that these regions are some of the most suitable areas for fish pond farming in Tanzania. Still, the current number of fish ponds in these regions (e.g., Shinyanga, Geita, Tabora and Simuyo) are low compared to the other regions (cf. Figure 1b), which could be because fish catches from Lake Victoria have satisfied the demand for fish, or because of the suboptimal water conditions in these regions. However, with declining catches of wild fish, the fish demand could be expected to increase in the future, and some of these regions have extensive areas of small water bodies, which potentially could be used for irrigation and aquaculture purposes. Thus, with an improved access to water, these regions could provide potential areas for future aquaculture expansion. Overall, the irrigation potential in Tanzania is estimated at 29.4 million hectares [48] and Tanzania is endowed with a high number of small natural and man-made lakes, rivers, and wetlands with a total area of 64,300 km2 [9], indicating considerable opportunities to expand aquaculture in areas with suboptimal rainfall.
Some of these regions, including Shinyanga, Tabora, Mwanza, Mbeya, and Rukwa, are also the most important rice-farming areas in Tanzania [48], and a potential way to increase aquaculture in areas with limited access to water for ponds, could be to integrate rice farming with fish farming [49,50]. Tanzania is the second largest producer of rice in Eastern and Southern Africa after Madagascar [51]. In 2017/18, rice was cultivated on 1.1 million ha, and the area targeted for rice cultivation in 2030 is 2.2 million ha [48].
Egypt has applied rice-fish farming successfully for many years, and fish production from rice field has been reported to contribute substantially to the country’s total aquaculture production [45,49]. Integrated rice-fish farming experiments in Kenya with mixed sex tilapia (Oreochromis niloticus) stocked at low densities (6000 fingerlings/ha) and African catfish, (Clarias gariepinus) stocked at high densities (60,000 fingerlings/ha) resulted in average fish yields of 130 and 3370 kg/ha, respectively [49,50]. Using a conservative low yield of 130 kg fish/ha and assuming that 30% of the 1.1 million ha of the rice fields in Tanzania would be converted to rice-fish farming practices, these rice fields could produce 43,000 tons of fish per year. This is four times higher than the current total production of fish from aquaculture and could help to supply a significant part of Tanzania’s fish demand in the future. A yield of 130 kg fish/ha is very similar to the reported catch of wild aquatic animals from rice fields in Cambodia [52], and as indicated by the experiments in Kenya, the yield could probably be substantially higher with an increased fish stocking density.
Most farmers in Tanzania, view aquaculture as a low investment, low-risk complement to agriculture, and the cost of constructing earthen fish ponds is seen as a major constraint to fish pond farming by many farmers [24]. Raising fish in rice fields would however minimize the investment costs, and could provide an attractive alternative for the farmers to diversify their crop production. Fish from the rice fields would increase the availability of animal protein and improve the nutrition of the rural population.
As most farmers practice small-scale farming and use manure and agriculture waste to enhance the pond productivity and feed the fish (Table 7), the availability of manure and agriculture waste could be a critical factor for a sustained fish production. Still our analysis shows that this probably is not a major constraint in large parts of Tanzania, which is similar to the results by Aguilar-Manjarrez and Nath [6], who estimated that 70% of Tanzania was either very suitable (40%) or suitable (30%) in terms of availability of agriculture inputs. However, the availability of high-quality fish feed was seen as a major challenge for a further expansion of aquaculture, as most fisheries officers expected that future aquaculture would increasingly target commercial fish production for markets rather than for home consumption.
A recent survey of small-scale pond farmers showed that approximately 40% of their production were used for home consumption and that 60% were sold [24]. This corresponds well with the regional fisheries officers’ view that the main benefits from aquaculture are that it provides an extra income and food security to the farmers (Figure 11). The survey with 89 farmers showed that poor fish farmers consumed a larger proportion of their pond harvest compared to better-off farmers, indicating that fish farming contributes more to food security in low-income households as compared to high-income households [24]. The sold fish can provide some important cash and also create an incentive for some famers to transform into more business-oriented aquaculture [cf. 1]. These small-scale entrepreneurs could play an important role in helping to expand aquaculture production in Tanzania, by for example creating an increased demand for high-quality fish seeds and feeds [23].
Similar to the findings by Aguilar-Manjarrez and Nath [6], most of Tanzania was either suitable or moderately suitable in terms of farm-gate sales. According to our analysis farm-gate sales are higher in rural areas with high population densities, such as the regions around Lake Victoria, than in less densely populated areas, such as central and southern Tanzania. Thus, a moderate suitability in terms of water availability in some of these northern regions, could tentatively be compensated by a slightly more commercially oriented aquaculture targeting local markets and farm-gate sales, where an increased income could help farmers to afford pumping water to their ponds.
The northern parts have also a more developed infrastructure, which further would enhance the access to local markets. The fish from Lake Victoria over the years has helped to develop markets and, as indicated by the regional fisheries officers, the increased demand for fish in combination with declining catches of fish in these areas, could help in the establishment of more commercially oriented fish farming. Although access to fish markets was not seen as a critical factor for current fish farming activities, dominated by small-scale subsistence pond farming, regional fisheries officers believed that this would be more important in coming years, when small-scale commercial fish farming would become more common (Figure 12).
Combining all criteria considered in this study, 46% and 54% of Tanzania was assessed to be suitable and moderately suitable for small-scale subsistence fish pond farming, respectively. The regions that were most suitable were located around Lake Victoria and along the coast, and were in general not those areas that currently have most fish farms. One reason for this could be that the fish demand in these regions has been satisfied with wild fish from the ocean and Lake Victoria. However, declining catches of wild fish followed by an increased demand for fish could stimulate an expansion of aquaculture activities. Aguilar-Manjarrez and Nath [6] estimated that 93% of Tanzania was either very suitable (43%) or suitable (50%) for subsistence fish pond farming and there are many regions with a good combination of the criteria included in our analysis, but with slightly different comparative strength. This provides an opportunity to design future aquaculture activities in Tanzania, that builds on and meets the local conditions and demands of the different regions.
More remote rural areas with suitable environmental conditions, but less direct access to markets and road networks, such as parts of Katavi, Iringa, Mbeya Njombe, Singida, and Lindi, could be well suited for upgraded small-scale subsistence aquaculture, which, according to the regional fisheries officers, currently is applied by the majority of the aquaculture farmers in Tanzania [7,9]. Although these systems often have a low productivity, they are important in terms of food security and provide complementary animal protein and important nutrients ([1,24], Figure 5). The low scale of production and comparatively low production costs make these systems less dependent on well-established fish-markets and infrastructure. Although only half of the crop is sold, either due to lack of access to wealthier markets or out of a need to meet more local food security priorities, it generates a small, but important amount of cash for emergencies, school fees, etc., [1,24].
As they operated on a low scale, they can rely on local available resources and are often integrated with the other agriculture activities [11]. Use of manure and agriculture waste to provide feed to the fish increases the recycling within the system, and has in many studies shown to increase the production efficiency and enhance the fish yield, without any increased production costs [10,11,24,53]. The fish pond provides nutrients and water to the crops and provide a buffer against periods of droughts, which could expect to increase with future climate change.
Thus, small-scale integrated fish farming, such as integrated rice-fish or vegetable-fish farming, could be an important way to increase fish production and the diversity of local farming activities in rural areas of Tanzania [cf. 10, 11, 45]. Diversification of crops and secured water, would help small-scale farmers to become more resilient to environmental change by for example balancing economic losses on seasonal cropland. They provide a design that can operate in more remote areas, and has been shown to enhance poor farmers’ livelihoods for decades. They have very low or even positive environmental impact and have often a positive social impact through enhanced food security, water availability, and poverty alleviation, and should therefore continue to be an important part of Tanzania’s future aquaculture portfolio, even if there are other aquaculture methods that could provide higher financial gains and export earnings.
Although only a minority of the small-scale farmers may have the means or skills to transform into more business-oriented aquaculture, these farmers can still play an important role in the future expansion of the aquaculture sector in Tanzania. International evidence suggests that small-scale aquaculture can catalyze the sector [7] in parallel to the development of larger commercial production, and according to Hishamunda and Ridler [25], small-scale farmers will be critical in contributing to an economic growth of the aquaculture sector in Sub-Saharan countries such as Tanzania. These farmers already have a practical experience of aquaculture operations, which still is scarce in Tanzania. They influence on other farmers and help create an increased demand for improved quality of fish seeds and feeds. This demand creates incitements to establish fish hatcheries and feed factories, which according to the fisheries officers currently are increasing in numbers in Tanzania in areas with available infrastructure and markets, such as around Dar es Salaam, Pwani, Mwanza, Ruwuma, and Mbeya [c.f. 9]. Areas similar to these are likely to become important hubs for a transformative change of the aquaculture sector in Tanzania in the future.
About 82% of the regional fisheries officers thought that small-scale commercial aquaculture production or cage farming would be the dominant farming practice in the coming 10 years (Figure 12), and the opportunities for an increased profit was seen as an important reason for an expansion in aquaculture production, boosted by increasing demands for fish and declining yields of wild fish (Figure 11). With an increased cash flow, these farmers will be better suited to overcome some physical constraints, such as water shortage and non-optimal soil conditions, by for example pumping water and building concrete ponds. This may make the farmers less vulnerable to environmental changes, but at the same time more dependent on a stable cash flow, which also means that these farms need to be situated close to fish markets and in areas with good infrastructure, including road networks. These farmers become increasingly constrained by high costs for feed, fingerlings, and transportation and lack of marketing infrastructure [1]. Thus, a decreased vulnerability to environmental conditions could easily be substituted for an increased vulnerability to financial market fluctuations, which in a way would make aquaculture operations more complex, demanding a good understanding of both farming techniques and financial management, which would exclude many local farmers. These challenges were confirmed by both farmers and regional fisheries officers, who said that improved extension services and better technical know-how were among the most important factors to facilitate an expansion of aquaculture in the future ([24], Figure 9). The presence of aquaculture expertise and previous development projects on aquaculture were also seen as main reasons, by the regional fisheries officers, why certain regions, despite suboptimal conditions for some of the suitability criteria for fish farming, such as soil and terrain in Ruvuma and Njombe, had more aquaculture farms than others.
According to our analysis urban and semi-urban areas would be the most suitable areas for this kind of more business-oriented aquaculture, which currently is happening in for example Dar es Salaam. Our field survey showed that pond farming in Dar es-Salaam was conducted in concrete ponds, fish fingerlings were stocked in comparatively high stocking densities and most fish farmers used commercial fish feeds and hired labor (Table 7). Thus, compared to more remote and rural areas these farms are operated in a more business-oriented manner, which requires a different set of skills as compared to subsistence farming, and where most of the yield are sold for cash. Our survey shows that 70% of the fish farmers in Dar es Salaam, while less that 20% of the rural fish farmers had more than 14 years of education, respectively (Table 7). Moreover, the motivation to farm fish differed, where small-scale subsistence farmers primarily sought food security and farm diversification, while the commercial farmers sought cash, often at the expense of diversity and, sometimes, sustainability [1].
Also regions around Lake Victoria could be well suited for more business-oriented aquaculture. Fish from the lakes have created fish markets, and the declining catches of wild fish could potentially increase the demand for farmed fish [4,46]. The lakes also provide opportunities to establish fish cage farming, which now is quite common in Lake Victoria and has also been introduced since a few years back in Lake Tanganyika. According to the regional fisheries officers, cage farming was believed to become the dominant future aquaculture systems in some regions around Lake Victoria (Mwanza, Mara and Geita), and in Ruvuma, probably because of the comparatively high availability of fish feed producers, hatcheries, and experienced fish farmers. Fish cage farming tend to be more capital demanding than pond farming and is often not an option for local farmers. They are often run as large-scale business operations, where the produced fish primarily target urban and international markets. Thus, the demand for good infrastructure and for high-quality input of fish fry and commercial fish feed is high for these activities and they aim for a high production, which could generate a high revenue and contribute to an economic growth in Tanzania.
However, there is a need to be cautious as an increased scale of production often is followed by an increased risk to exceed the carrying capacity of the supporting environment. If this happens it could easily be followed by environment and social impacts. Much fish feed, feces, and antibiotics are lost from fish cages, directly into the lake environment, which could contribute to an increased pollution of the aquatic environment. Lake Victoria is already suffering from many pollutants and any additional pollution load should be minimized [46]. Also escapes of fish from the cages could have negative impact on the native fish populations, which was seen as the main environmental drawback from aquaculture by the regional fisheries officers (Table 6). Local farmers are often excluded from these operations and the fish are often sold far from the production site, creating fewer local benefits while still potentially creating negative local impacts. Thus, it is important that social and environmental consequences of these activities are closely monitored to ensure a sustainable and equity production of fish that contribute to both economic growth, social justices, and environmental qualities.
5. Conclusions
Increased aquaculture production could provide a potential solution to declining catches of wild fish and increased demand for fish in Tanzania. In this study we have assessed the suitability for subsistence and commercial fish pond farming, which are the dominant fish farming practices in Tanzania, by applying a combination of GIS spatial modeling with multi-criteria evaluation. GIS modeling made it possible to use large spatial data sets to analyze how a combination of criteria, related to the environment, land uses, and infrastructure, affected the suitability for fish pond farming in different parts of Tanzania. The importance of these criteria was decided through multi-criteria evaluations and analytical hierarchy processes, building on field interviews and questionnaires with fish farmers and fisheries officers, which provided means to include different stakeholders’ knowledge in the overall GIS assessments, and also to validate the GIS spatial modelling results. The combination of GIS modeling and stakeholder consultations, building on both quantitative and qualitative data, helped to provide policy-relevant results, such as maps and compilation of stakeholder’s perceptions. Still aquaculture involves a diverse set of biological, environmental, and socioeconomic parameters, and an assessment of the suitability of aquaculture is a complex task, with several factors potentially affecting the results, and our study should be seen as a first-order assessment that hopefully can provide some guidance for the future development of aquaculture in Tanzania.
Our results indicate that there is a good potential for aquaculture in Tanzania. About 60% of Tanzania was assessed as being suitable and 40% as moderately suitable for small-scale subsistence pond farming. The corresponding figures for medium-scale commercial farming, which most regional fisheries officers saw as the dominating farming method in ten years, were 53% and 47% respectively
In terms of physical conditions water availability was the most limiting factor for pond farming, which was confirmed by both farmers and regional fisheries officers, and assessed as being “suitable” in only 28% of the country. This area is likely to become smaller in the future, due to climate change.
Around 80% of Tanzania was seen as either very suitable or suitable in terms of water temperature, soil, and terrain and the most suitable conditions were found south of Lake Victoria and along the coast in eastern Tanzania, while the least suitable conditions were found at high altitudes.
The availability of farm inputs (agriculture waste and manure) for small-scale pond farming was overall good (26% very suitable and 32% suitable), but high-quality fish feed was seen as a constraint to aquaculture development, both by farmers and regional fisheries officers.
The suitability in terms of farm-gate sales and local markets was overall good, and primarily located in areas with high population densities. Overall, the market potential for fish in Tanzania was high. This is mainly due to the fast-growing Tanzanian population and increased buying power combined with decreasing supply of wild fish.
Currently small subsistence pond farming is the dominating aquaculture practice in Tanzania. Although these systems often have a low productivity, they have very low or even positive environmental impact and have often a positive social impact through enhanced food security, water availability, and poverty alleviation. If integrated with other crops they provide means for livelihood diversification and water security and can help farmers to become more resilient to environmental change, including climate change. The low scale of production and comparatively low production costs make these systems less dependent on well-established fish-markets and infrastructure, and they provide a design that can operate in more remote areas, and we believe that that these systems should continue to be an important part of Tanzania’s aquaculture portfolio.
Still the majority of the regional fisheries officers saw medium-scale commercial farming as the dominating fish farming method in ten years. An expansion of these activities could certainly make a significant contribution to the aquaculture development in Tanzania, not only providing financial gains and export earnings, but also stimulating the production of high-quality fish feeds and seeds. With increased access to high-quality fish seeds, feeds, and markets, more people, including local fish-farmers, could see aquaculture as a business opportunity, tentatively contributing to a transformative change of the aquaculture sector in Tanzania.
We believe that such a change should meet the vision of The Ministry of Livestock and Fisheries and be developed in the context of local conditions, where aquaculture is seen as a part of an integrated social ecological system. Our analysis shows that conditions in Tanzania vary and that this provides opportunities to develop aquaculture in Tanzania sustainably, by encouraging farming practices that are designed to fit local conditions and to meet local demands. In this way aquaculture could be developed to contribute to both economic growth, social justices, and environmental qualities.
Author Contributions
Conceptualization, Håkan Berg; formal analysis, Håkan Berg and Lars Udikas; investigation, Deogratias Mulokozi and Lars Udikas; methodology, Håkan Berg, Deogratias Mulokozi and Lars Udikas; supervision, Håkan Berg and Deogratias Mulokozi; validation, Lars Udikas, Håkan Berg, Deogratias Mulokozi; writing—original draft, Håkan Berg. All authors have read and agreed to the published version of the manuscript.
Funding
This research was funded by the Swedish International Development cooperation agency (Sida). Bilateral Marine Science Program [grant No. 51170071].
Acknowledgments
We are thankful to the fish farmers and the 16 regional fisheries officers who participated in the surveys and responded to the questionnaires. Valuable help was also provided by Amon Shoko, Gloria Yona and Mary-Kishe Machumu from the Tanzania Fisheries Research Institute (TAFIRI). Three anonymous reviewers provided valuable comments.
Conflicts of Interest
The authors declare no conflict of interest.
Appendix A

Table A1.
Compilation of the input data derived for the spatial analysis.
| Base Layer | Format Feature Type | Resolution | Source | Info |
|---|---|---|---|---|
| Mean monthly precipitation(mm). 12 images | Raster (.tif) | 30 arc seconds (~1 km at the equator) | WorldClim version 2.1 | Precipitation for 12 months. WorldClim version 2.1 climate data for 1970–2000. version was released in January 2020 |
| Potential Evapotranspiration | Raster (.tif) | 30 arc seconds (~ 1 km at the equator) | CGIAR Platform for Big Data in Agriculture and WorldClim 2.0 | ET0 average for 12 months. Version 3 released in January 2019. Based on WorldClim v2-data. |
| Soil texture | Raster (.tif) | 250 m | ISRIC—World Soil Information | Clay content (0–2 micrometer) in g/100 g (w%) at 1–2 m depth predicted using two sets of Africa soil profiles data. |
| Terrain | Raster (.tif) | 30 m | RCMRD GeoPortal | Digital Elevation Model (DEM) from Shuttle Radar Topography Mission (SRTM). Released April 2015. |
| Land Cover (crops) | Raster (.tif) | 20 m | European Space Agency | LC map at 20 m over Africa based on 1 year of Sentinel-2A observations |
| Tmax °C WorldClim version 2.1 (July–August, October–December 2018) | Raster (.tif) | 2.5 min (~ 4.5 km at the equator) | WorldClim version 2.1 | Regression analysis with pond temperature observation (2018) |
| Tmax °C WorldClim version 2.1 (1970–2000) | Raster (.tif) | 30 arc seconds (~ 1 km at the equator) | WorldClim version 2.1 | Converted into pond water temp with factor derived from the 2018 regression analysis |
| Agriculture, Livestock and fish farming data | Tabular data (.xlsx) | - | United Republic of Tanzania (URT) | Total Number of Cattle, Goats, Sheep and Poultry by region as of 26 August 2012 |
| Agricultural statistics 2014–2015 | Table (.xlsx) | - | URT | Number of Pigs by Type of Pigs and Region as of 1 October 2015 |
| Protected areas | Vector, Polygon (.shp) | - | OpenStreetMap and Geofabrik | Export from Geofabrik.de (2020) |
| Large inland waters | Vector, Polygon (.shp) | |||
| Rivers and streams | Vector, Lines (.shp) | |||
| Road network | Vector, lines (.shp) | |||
| Cities (Including census data) | Vector, Point (.shp) | |||
| Administrative boundaries | Vector, Polygon (.shp) | - | Humanitarian OpenStreetMap Team and URT | This dataset contains Tanzania administrative boundaries including Regions, Districts and Wards updated during the 2012 national census. |
References
- Brummett, R.E.; Lazard, J.; Moehl, J. African aquaculture: Realizing the potential. Food Policy 2008, 33, 371–385. [Google Scholar] [CrossRef]
- Chan, C.Y.; Tran, N.; Pethiyagoda, S.; Crissman, C.C.; Sulser, T.B.; Phillips, M.J. Prospects and challenges of fish for food security in Africa. Glob. Food Secur. 2019, 20, 17–25. [Google Scholar] [CrossRef]
- Duijn, A.P.; Heijden, P.G.M.; Bolman, B.; Rurangwa, E. Review and Analysis of Small-Scale Aquaculture Production in East Africa: Summary and Recommendations; Wageningen Centre for Development Innovation: Wageningen, The Netherlands, 2018. [Google Scholar]
- Rothuis, A.; Turenhout, M.; van Duijn, A.; Roem, A.; Rurangwa, E.; Katunzi, E.; Shoko, A.; Kabagambe, J.B. Aquaculture in East Africa; University & Research Centre: Wageningen, The Netherlands, 2014. [Google Scholar]
- Villasante, S.; Rodríguez, S.R.; Molares, Y.; Martínez, M.; Remiro, J.; García-Díez, C.; Lahoz, C.; Omar, I.; Bechardas, M.; Elago, P.; et al. Are provisioning ecosystem services from rural aquaculture contributing to reduce hunger in Africa? Ecosyst. Serv. 2015, 16, 365–377. [Google Scholar] [CrossRef]
- Aguilar-Manjarrez, J.; Nath, S.S. A Strategic Reassessment of Fish Farming Potential in Africa; CIFA Technical Paper 32; Food and Agriculture Organization of the United Nations: Rome, Italy, 1998. [Google Scholar]
- Heijden, P.G.M.; Shoko, A.P. Review and Analysis of Small-Scale Aquaculture Production in East Africa; Wageningen University & Research: Wageningen, The Netherlands, 2018. [Google Scholar]
- Munguti, J.M.; Kim, J.-D.; Ogello, E.O. An Overview of Kenyan Aquaculture: Current Status, Challeng-es, and Opportunities for Future Development. Fish. Aquat. Sci. 2014, 17, 1–11. [Google Scholar] [CrossRef] [Green Version]
- Rukanda, J.J. Evaluation of Aquaculture Development in Tanzania. 2018. Available online: http://www.unuftp.is/static/fellows/document/janeth16aprf.pdf (accessed on 20 September 2020).
- Shoko, A.; Limbu, S.; Lamtane, H.; Kishe-Machumu, M.; Sekadende, B.; Ulotu, E.; Masanja, J.; Mgaya, Y. The role of fish-poultry integration on fish growth performance, yields and economic benefits among smallholder farmers in sub-Saharan Africa, Tanzania. Afr. J. Aquat. Sci. 2019, 44, 15–24. [Google Scholar] [CrossRef]
- Mulokozi, D.P.; Berg, H.; Onyango, P.; Lundh, T.; Tamatamah, R. Assessment of pond and integrated aquaculture (IAA) systems in selected districts. Tanzan. Accept. J. Agric. Rural Dev. Trop. Subtrop. 2021.
- Kapetsky, J.M. A Strategic Assessment of Warm-Water Fish Farming Potential in Africa; CIFA Technical Paper 27; Food and Agriculture Organization of the United Nations: Rome, Italy, 1994. [Google Scholar]
- Eastman, J.R.; Jin, W.; Kyem, P.A.K.; Toledano, J. Raster Procedure for Multi-Criteria/Multi-Objective Decisions. Photogramm. Eng. Remote Sens. 1995, 61, 539–547. [Google Scholar]
- Saaty, T.L. A scaling method for priorities in hierarchical structures. J. Math. Psychol. 1977, 15, 234–281. [Google Scholar] [CrossRef]
- Ssegane, H.; Tollner, E.W.; Veverica, K. Geospatial Modeling of Site Suitability for Pond-Based Tilapia and Clarias Farming in Uganda. J. Appl. Aquac. 2012, 24, 147–169. [Google Scholar] [CrossRef]
- Kapetsky, J.M.; Nath, S.S. A Strategic Assessment of the Potential for Freshwater Fish Farming in Latin America; COPESCAL Technical Paper No. 10; FAO: Rome, Italy, 1997; p. 128. Available online: http://www.fao.org/3/W5268E/W5268E01.htm (accessed on 20 September 2020).
- United Republic of Tanzania Ministry of Livestock and Fisheries Development, Fisheries Sector. National Fisheries Policy of 2015; 2015. Available online: http://extwprlegs1.fao.org/docs/pdf/tan168881.pdf (accessed on 9 September 2020).
- United Republic of Tanzania. Basic Facts and Figures on Human Settlements, in Tanzania. Mainland; Tanzania National Bureau of Statistics: Dodoma, Tanzania; Ministry of Finance: Dar es Salaam, Tanzania, 2012. Available online: https://www.nbs.go.tz/index.php/en/census-surveys/environmental-statistics/75-basic-facts-and-figures-on-human-settlements-2012-tanzania-mainland (accessed on 20 September 2020).
- National Bureau of Statistics (NBS). National Environment Statistics Report, 2017 Tanzania Mainland (NESR, 2017); National Bureau of Statistics: Dar es Salaam, Tanzania, 2017.
- World Bank. 2020. Available online: https://data.worldbank.org/country/tanzaniaWBstatistics (accessed on 9 September 2020).
- Irish Aid. Climate Change in Tanzania: Country Risk Profile Fact Sheet. Irish Aid, Resilience and Economic Inclusion Team: Dublin, Ireland, 2018; p. 5. Available online: https://www.climatelearningplatform.org/sites/default/files/resources/tanzania_country_climate_risk_assessment_report_-final_version.pdf (accessed on 20 September 2020).
- Tanzania Meteorological Authority. Statement on the Status of Tanzania Climate in 2019; Tanzania Meteorological Authority: Dar es Salaam, Tanzania, 2019. Available online: http://meteo.go.tz/uploads/publications/sw1586868749-Climate_statement_2019.pdf (accessed on 20 September 2020).
- Mwaijande, F.; Lugendo, P. Fish farming value chain analysis: Policy implications for transfor-mations and robust growth in Tanzania. J. Rural Community Dev. 2015, 10, 47–62. [Google Scholar]
- Mulokozi, D.P.; Mmanda, F.P.; Onyango, P.; Lundh, T.; Tamatamah, R.; Berg, H. Rural aquaculture: Assessment of its contribution to household income and farmers’ perception in selected districts, Tanzania. Aquac. Econ. Manag. 2020, 24, 387–405. [Google Scholar] [CrossRef]
- Hishamunda, N.; Ridler, N.B. Farming fish for profits: A small step towards food security in sub-Saharan Africa. Food Policy 2006, 31, 401–414. [Google Scholar] [CrossRef]
- Assefa, W.W.; Abebe, W.B. GIS modeling of potentially suitable sites for aquaculture development in the Lake Tana basin, Northwest Ethiopia. Agric. Food Secur. 2018, 7, 72. [Google Scholar] [CrossRef] [Green Version]
- Salam, A. The Potential of Geographical Information System-Based Modelling for Aquaculture Development and Management in South Western Bangladesh. Ph.D. Thesis, University of Stirling, Stirling, UK, 2000. [Google Scholar]
- Open Street Map. 2020. Available online: https://www.openstreetmap.org/about (accessed on 29 September 2020).
- Worldclim. Historical Climate Data. 2020. Available online: https://www.worldclim.org/data/worldclim21.html (accessed on 1 October 2020).
- Yoo, K.H.; Boyd, C.E. Hydrology and Water Supply for Pond Aquaculture; Springer: Berlin/Heidelberg, Germany, 1994. [Google Scholar]
- Coche, A.G.; Van der Wal, H. Water for Freshwater Fish Culture; FAO Training Series; FAO: Rome, Italy, 1981; p. 111. Available online: https://www.worldcat.org/title/water-for-freshwater-fish-culture/oclc/12667806 (accessed on 20 September 2020).
- Allen, R.G. Crop Evapotranspiration-Guidelines for Computing Crop Water Requirements-FAO Irrigation and Drainage Paper 56; FAO: Rome, Italy, 1998. [Google Scholar]
- Coche, A.G.; Muir, J.F.; Laughlin, T. Simple Methods for Aquaculture: Management for Freshwater Fish Culture Ponds and Water Practices. FAO Training Series; FAO: Rome, Italy, 1996; Volume 21, pp. 70–81. [Google Scholar]
- Coche, A.G. Soil and Freshwater Fish Culture: Simple Methods for Aquaculture; FAO Training Series; FAO: Rome, Italy, 1985; Volume 6. [Google Scholar]
- ISRIC World Soil Information. 2020. Available online: https://www.isric.org/about (accessed on 9 October 2020).
- ICLARM. The context of small-scale integrated agriculture-aquaculture systems in Africa: A case study of Malawi; ICLARM: Manila, Philippines, 1991. [Google Scholar]
- RCMRD. The Regional Centre for Mapping of Resources for Development. 2020. Available online: https://www.rcmrd.org/about-us (accessed on 9 October 2020).
- Mmanda, F.P.; Mulokozi, D.P.; Lindberg, J.E.; Haldén, A.N.; Mtolera, M.; Kitula, R.; Lundh, T. Fish farming in Tanzania: The availability and nutritive value of local feed ingredients. J. Appl. Aquac. 2020, 32, 341–360. [Google Scholar] [CrossRef] [Green Version]
- Boyd, C.E. Aquaculture pond fertilization. CAB Rev. Perspect. Agric. Veter Sci. Nutr. Nat. Resour. 2018, 13, 1–12. [Google Scholar] [CrossRef]
- European Space Agency. Prototype Land Cover 20m map of Africa 2016. 2017. Available online: http://2016africalandcover20m.esrin.esa.int/download.php (accessed on 9 October 2020).
- Pozzi, F.; Robinson, T.; Nelson, A. Accessibility Mapping and Rural Poverty in the Horn of Africa. 2009. Available online: https://www.semanticscholar.org/paper/Accessibility-mapping-and-rural-poverty-in-the-horn-Pozzi-Robinson/c113f96f6c3c564894b6106972cca36eaabd5960 (accessed on 9 October 2020).
- Olson, D.L. Decision Aids for Selection Problems; Springer: Berlin/Heidelberg, Germany, 1996. [Google Scholar]
- Goepel, K.D. Implementation of an Online Software Tool for the Analytic Hierarchy Process (AHP-OS). Int. J. Anal. Hierarchy Process. 2018, 10, 469–487. [Google Scholar] [CrossRef] [Green Version]
- Goepel, K.D. Implementing the Analytic Hierarchy Process as a Standard Method for Multi-Criteria Decision Making in Corporate Enterprises—A New AHP Excel Template with Multiple Inputs. 2013. Available online: https://bpmsg.com/wordpress/wp-content/uploads/2013/06/ISAHP_2013-13.03.13.Goepel.pdf (accessed on 9 October 2020).
- Kaleem, O.; Sabi, A.-F.B.S. Overview of aquaculture systems in Egypt and Nigeria, prospects, potentials, and constraints. Aquac. Fish. 2020. [Google Scholar] [CrossRef]
- Omwoma, S.; Owuor, P.O.; Ongeri, D.M.-K.; Umani, M.; Lalah, J.O.; Schramm, K.-W. Declining commercial fish catches in Lake Victoria’s Winam Gulf: The importance of restructuring Kenya’s aquaculture programme. Lakes Reserv. Res. Manag. 2014, 19, 206–210. [Google Scholar] [CrossRef]
- Adeleke, M.L.; Al-Kenawy, D.; Nasr-Allah, A.M.; Murphy, S.; El-Naggar, G.O.; Dickson, M. Fish Farmers’ Perceptions, Impacts and Adaptation on/of/to Climate Change in Africa (The Case of Egypt and Nigeria). In Climate Change Management; Springer: Berlin/Heidelberg, Germany, 2018; pp. 269–295. [Google Scholar]
- Ministry of Agriculture. National Rice Development Strategy Phase ii (NRDS ii) 2019–2030; The United Republic of Tanzania: Dodoma, Tanzania, 2019. Available online: https://www.kilimo.go.tz/uploads/dasip/NATIONAL_RICE_DEVELOPMENT_STRATEGY_PHASE_II.pdf (accessed on 9 October 2020).
- Rasowo, J.; Auma, E.O. On–Farm Trials with Rice-Fish Cultivation in the West Kano Rice Irrigation Scheme, Kenya. NAGA. World Fish. Cent. Q. 2006, 29, 1–2. [Google Scholar]
- Rasowo, J.; Auma, E.; Ssanyu, G.; Ndunguru, M. Does African catfish (Clarias gariepinus) affect rice in in-tegrated rice-fish culture in Lake Victoria Basin, Kenya? Afr. J. Environ. Sci. Technol. 2008, 2, 336–341. [Google Scholar]
- IRRI. International Rice Institute. 2021. Available online: https://www.irri.org/where-we-work/countries/tanzania (accessed on 16 February 2021).
- Freeda, S.; Kura, Y.; Sean, V.; Mith, S.; Cohen, P.; Kim, M.; Thay, S.; Chhy, S. Rice field fisheries: Wild aquatic species diversity, food provision services and contribution to inland fisheries. Fish. Res. 2020, 229, 105615. [Google Scholar] [CrossRef]
- Limbu, S.M.; Shoko, A.P.; Lamtane, H.A.; Kishe-Machumu, M.A.; Joram, M.C.; Mbonde, A.S.; Mgana, H.F.; Mgaya, Y.D. Fish polyculture system integrated with vegetable farming improves yield and economic benefits of small-scale farmers. Aquac. Res. 2016, 48, 3631–3644. [Google Scholar] [CrossRef]
Figure 1.
(a) Map of Tanzania showing constraint areas (major cities, protected areas and water bodies), that not were included in the analysis, and ponds observed in the field (84). (b) Distribution of fish ponds and main hatcheries in Tanzania in 2016 (pers. com. Ministry of Livestock and Fisheries development).

Figure 2.
Schematic overview of the procedures integrating GIS and MCE to assess the suitability of small-scale and commercial fish pond farming in Tanzania.
Figure 2.
Schematic overview of the procedures integrating GIS and MCE to assess the suitability of small-scale and commercial fish pond farming in Tanzania.
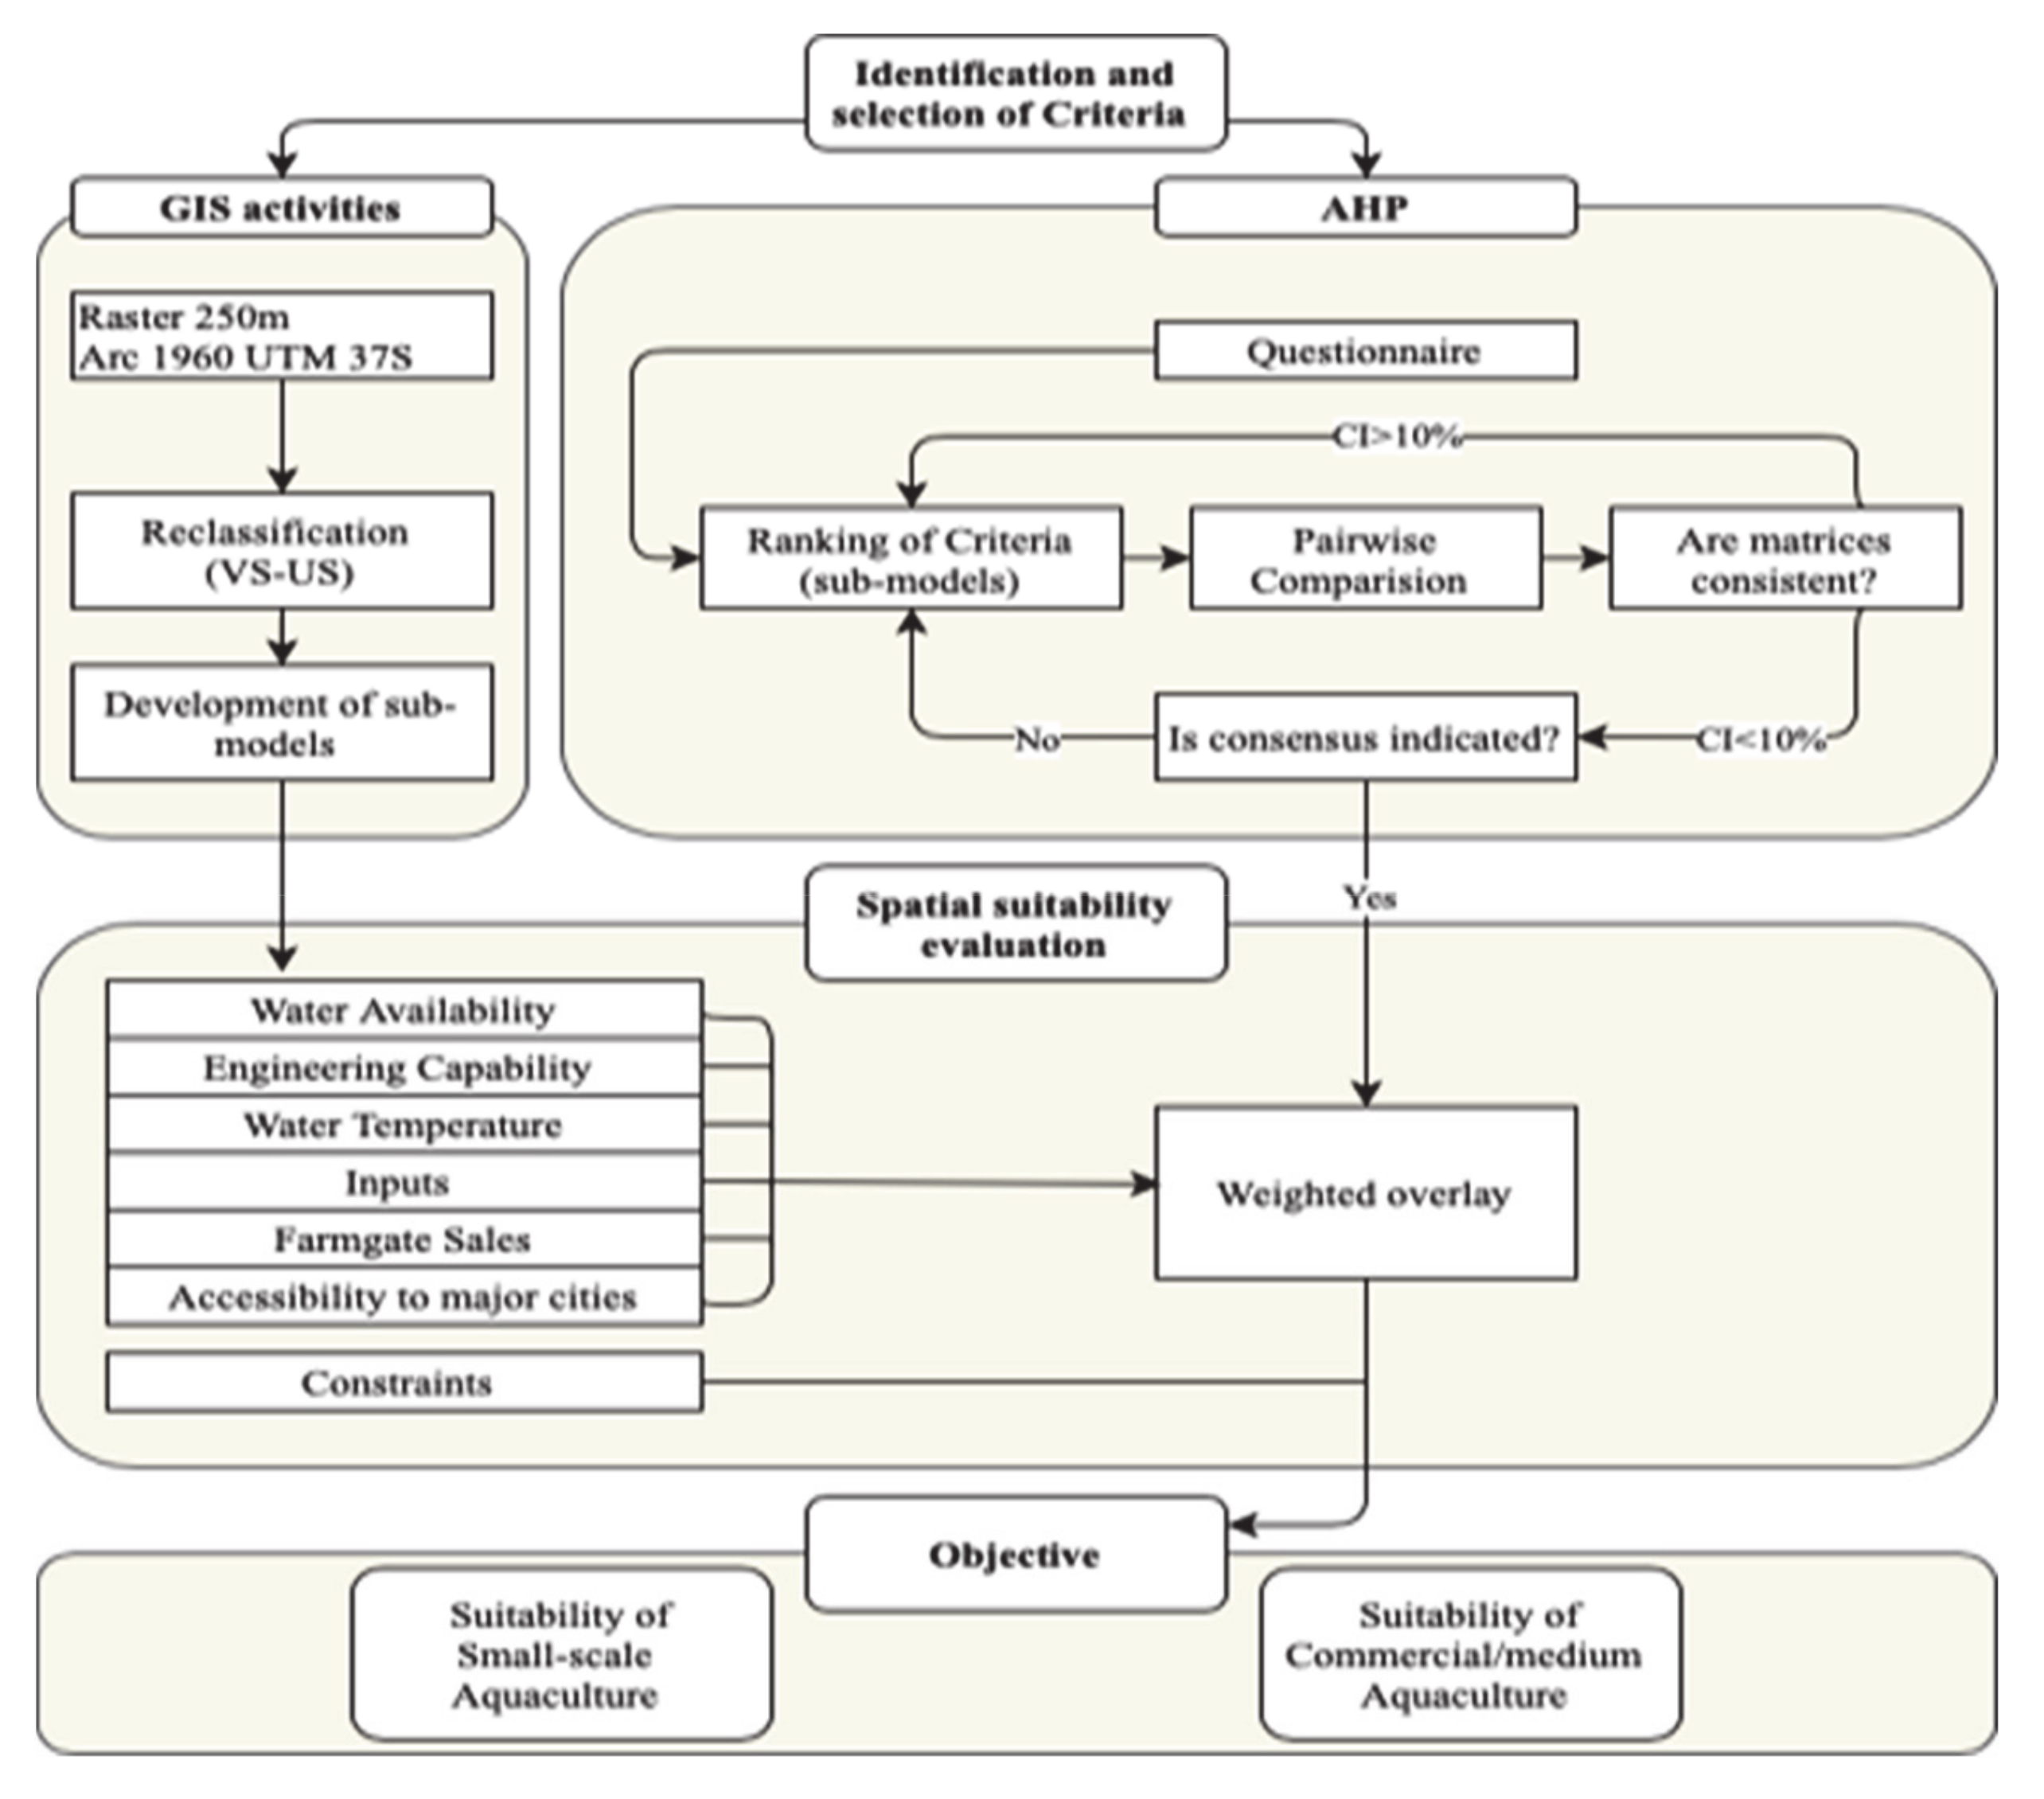
Figure 3.
Structure of the GIS spatial analysis.

Figure 4.
The relative importance of factors influencing on fish pond farming as ranked by 16 regional fisheries officers in Tanzania.
Figure 4.
The relative importance of factors influencing on fish pond farming as ranked by 16 regional fisheries officers in Tanzania.

Figure 5.
The distribution of suitability scores for; (a) annual water availability and (b) water temperature.
Figure 5.
The distribution of suitability scores for; (a) annual water availability and (b) water temperature.

Figure 6.
Spearman’s rank-order correlations showing: (a) A positive correlation between the log number of fish ponds per region in 2016 and the suitability score for water availability, which was statistically significant (rs(22) = 0.623, p = 0.001); (b) and a negative correlation between the log number of fish ponds per region in 2016 and the suitability score for engineering capabilities (soil and terrain), which was statistically significant (rs(22) = −0.746, p < 0.001).

Figure 7.
The relative importance of different constraints to development of fish pond farming as ranked by 16 regional fisheries officers in Tanzania.
Figure 7.
The relative importance of different constraints to development of fish pond farming as ranked by 16 regional fisheries officers in Tanzania.

Figure 8.
The distribution of suitability scores for; (a) engineering capabilities (soil texture and terrain) and; (b) availability of farm inputs (agriculture waste and manure).
Figure 8.
The distribution of suitability scores for; (a) engineering capabilities (soil texture and terrain) and; (b) availability of farm inputs (agriculture waste and manure).

Figure 9.
The relative importance of factors for expanding fish pond farming as ranked by 16 regional fisheries officers in Tanzania.
Figure 9.
The relative importance of factors for expanding fish pond farming as ranked by 16 regional fisheries officers in Tanzania.

Figure 10.
The distribution of suitability scores for (a) farm-gate sales and; (b) market accessibility.
Figure 10.
The distribution of suitability scores for (a) farm-gate sales and; (b) market accessibility.

Figure 11.
The relative importance of benefits from fish pond farming as ranked by 16 regional fisheries officers in Tanzania.
Figure 11.
The relative importance of benefits from fish pond farming as ranked by 16 regional fisheries officers in Tanzania.

Figure 12.
Regional fisheries officers perception of the dominant aquaculture system in their region now and in the 10-years time in Tanzania.
Figure 12.
Regional fisheries officers perception of the dominant aquaculture system in their region now and in the 10-years time in Tanzania.

Figure 13.
The distribution of suitability scores for; (a) small-scale subsistence fish pond farming and; (b) medium-scale commercial fish pond farming in Tanzania.
Figure 13.
The distribution of suitability scores for; (a) small-scale subsistence fish pond farming and; (b) medium-scale commercial fish pond farming in Tanzania.
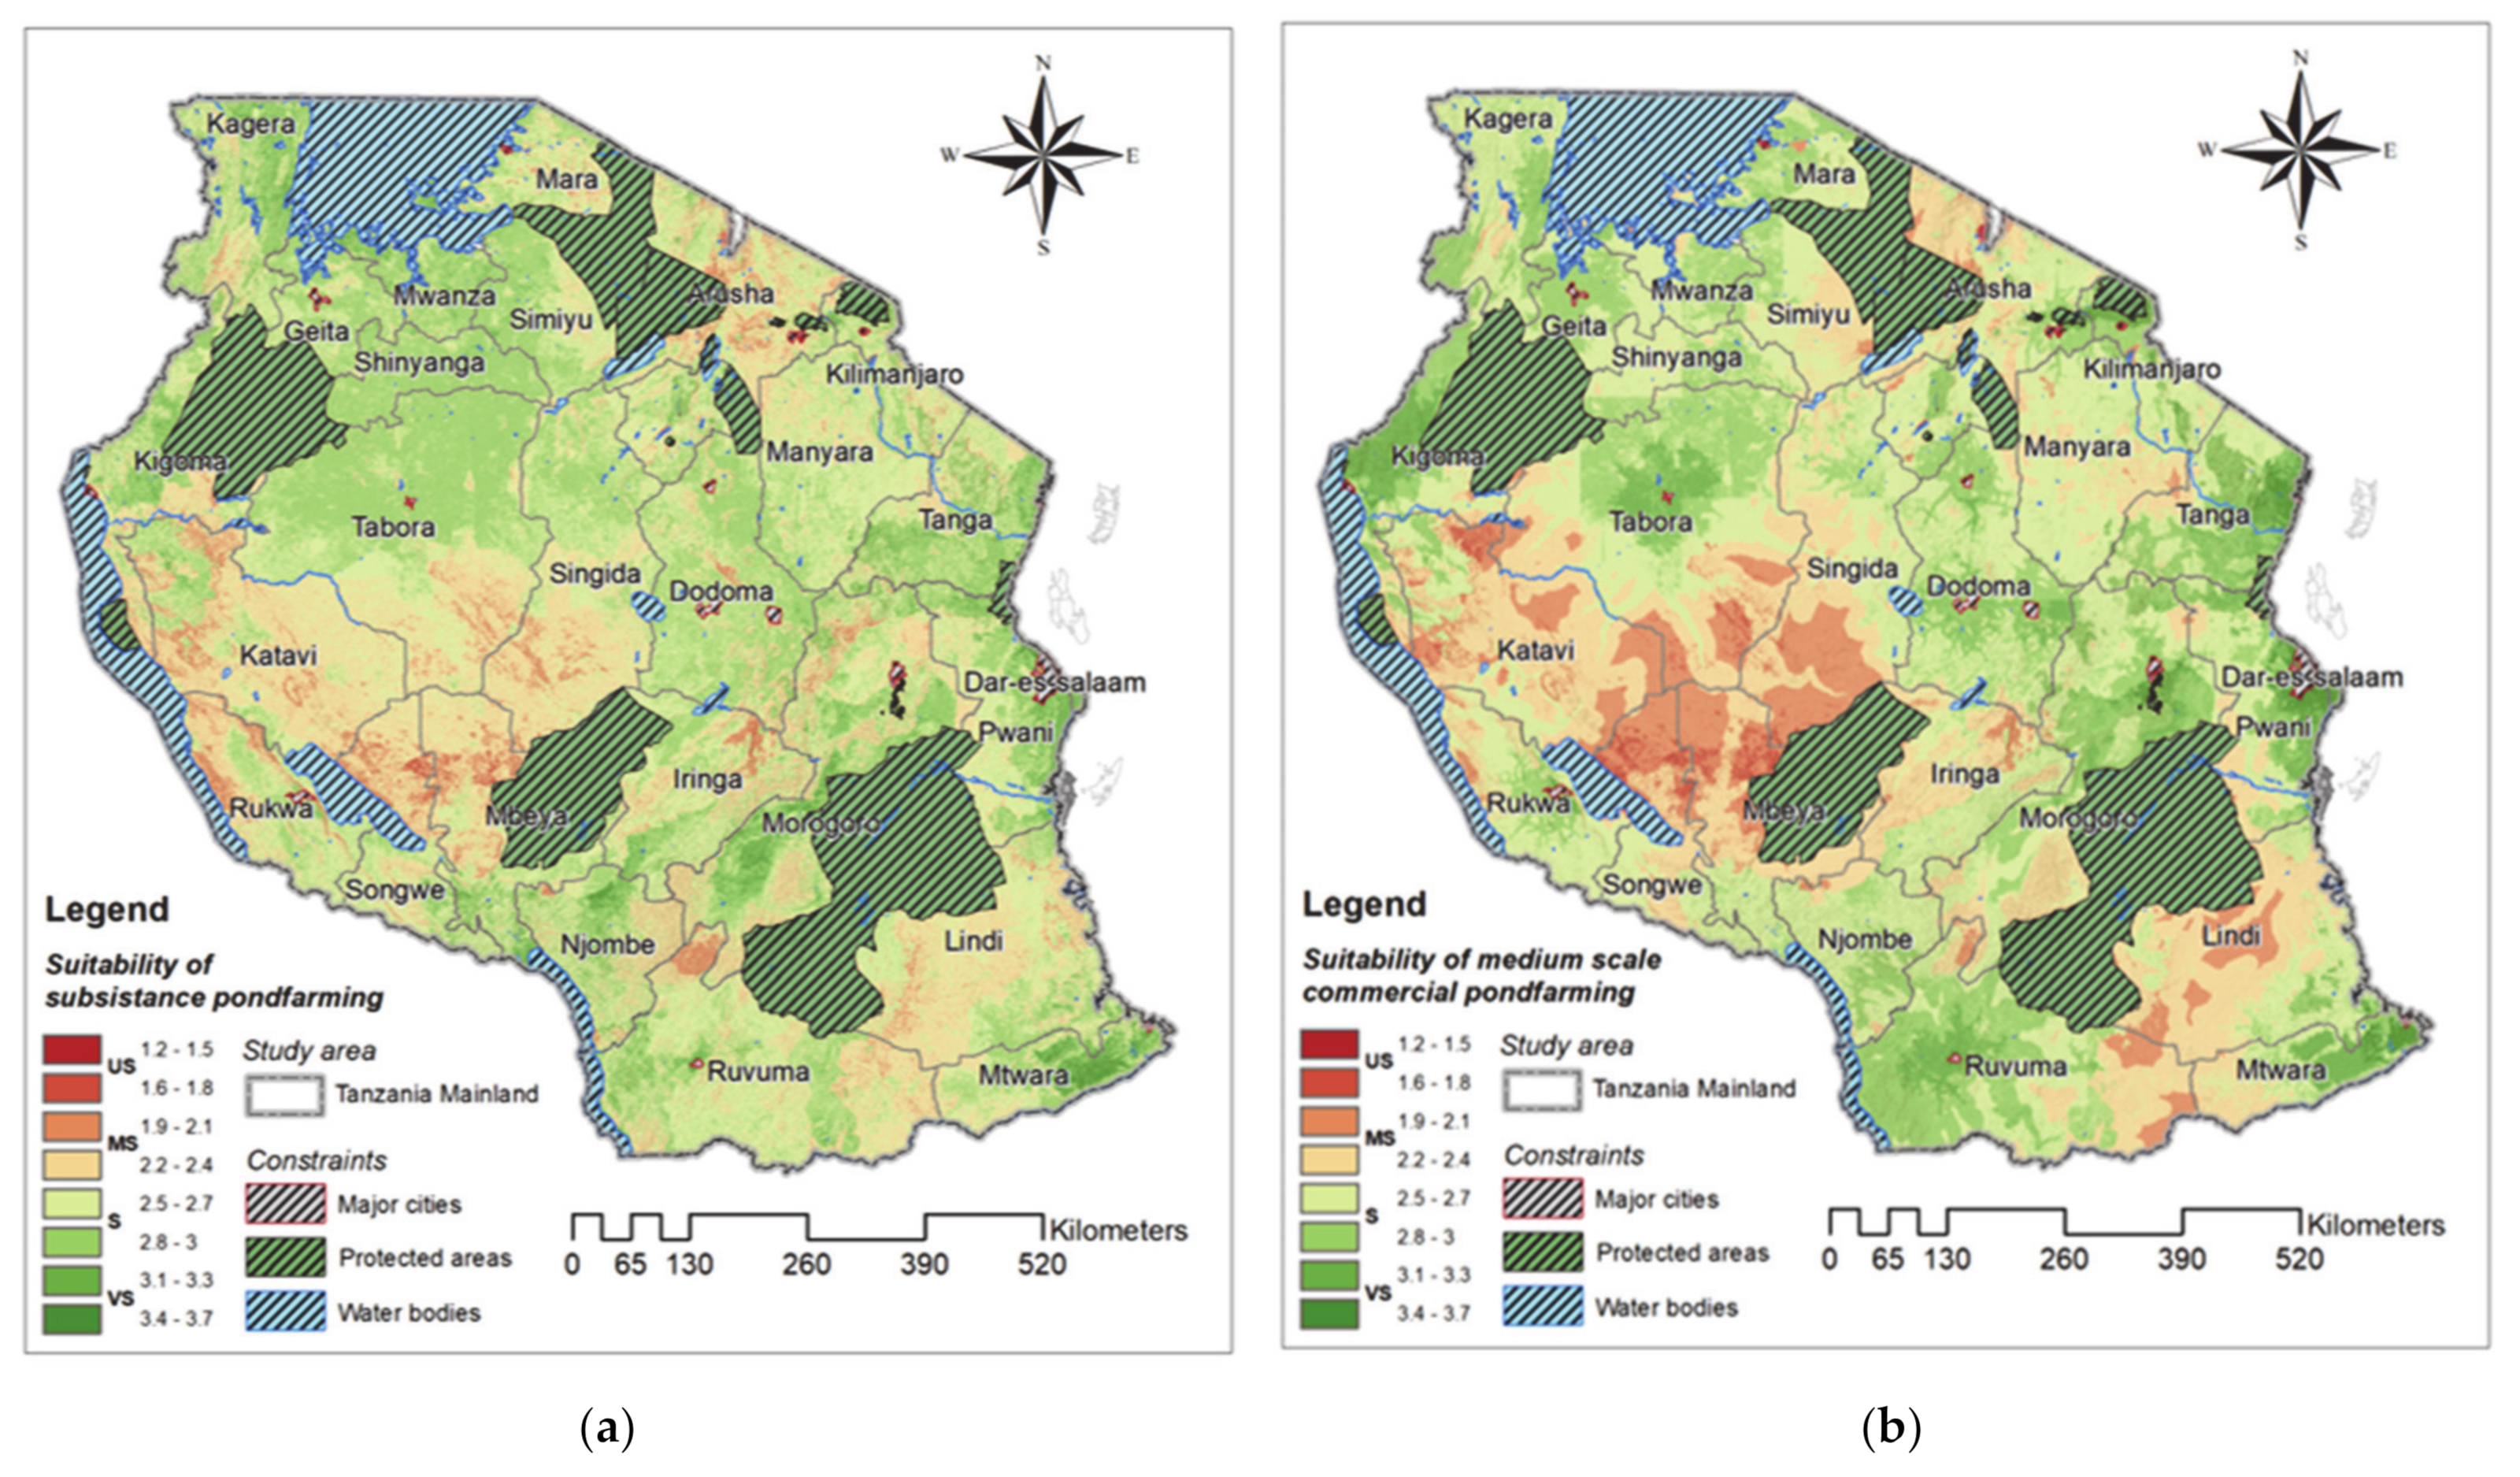
Table 1.
Summary for criteria and sub-criteria with classification by thresholds into Very Suitable (VS), Suitable (S), Moderate Suitability (MS), and Unsuitable (NS).
Table 1.
Summary for criteria and sub-criteria with classification by thresholds into Very Suitable (VS), Suitable (S), Moderate Suitability (MS), and Unsuitable (NS).
| Criteria (Sub-Models) | Sub-Criteria (Base-Layers) | Classification of Criteria | References | |||
|---|---|---|---|---|---|---|
| Very Suitable | Suitable | Moderately Suitable | Unsuitable | |||
| Annual water balance of ponds (mm) | (=precipitation [mm] × 1.1) − (potential evapotranspiration [mm] × 1.3 − 960 [mm Seepage] | >0 | −1 to −2000 | −2000 to −3500 | <−3500 | [6,12] |
| Water Availability from Perennial Streams and Rivers | Perennial river density (km/km2) | ≥0.36 | 0.2–0.35 | 0.04 to 0.20 | <0.04 | [12,26] |
| Water Temperature (°C) | Monthly mean air Tmax (°C) where: Twater = 0.682 × air Tmax + 6.278 | ≥26 °C for 12 months | ≥22 °C for 12 months | ≥22 °C for 8 months and ≥14 °C for 4 months | <22 °C for 4 months | [6,27] |
| Engineering Capability (Terrain and Soil Texture) | Soil texture (% clay content of soil) | 15–30 | 10–15 or 30–40 | 5–10 or 40–50 | <5 or >50 | [6,15] |
| Slope (%) | <2 | 2–5 | 5–8 | >8 | ||
| Sum score * | (1.5 x Soil texture) + Slope | 7.5–10 | 6.0–7.5 | 4.5–6.0 | <4.5 | |
| Farm Inputs | Manure (tons/yr) | 100,000 | 30,000–100,000 | 2000–30,000 | <2000 | [6] |
| Crops | Crops | No crops | ||||
| Sum score * | (1.5 x Manure) + Crops | 7–10 | 5–7 | 3–5 | 1.5–3 | |
| Farm-gate sales | Inhabitants/km2 | 150–300 | 25–149 | 1–24 | 1< and >300 | [6,16] |
| Market accessibility | Travel hours with motorized vehicle to nearest city with >50,000 inhabitants | <1 | 1–3 | 3–6 | >6 | [15] |
* The “sum score” was calculated as the score of the first sub-criterion × 1.5 + the score of the other sub-criterion. For example, a soil with 20% clay and 1% slope would get a score of 4 × 1.5 + 4 = 10, which would thus correspond to a suitability score of 4 (very suitable) for the “sum score.”
Table 2.
Matrix for the combined suitability classification of water availability from the “Annual water balance” and “Rivers and Streams” classified into the suitability scale 1–4.
Table 2.
Matrix for the combined suitability classification of water availability from the “Annual water balance” and “Rivers and Streams” classified into the suitability scale 1–4.
| Annual Water Balance | |||||
|---|---|---|---|---|---|
| US (1) | MS (2) | S (3) | VS (4) | ||
| Rivers | US (1) | 1 | 2 | 3 | 4 |
| MS (2) | 2 | 2 | 3 | 4 | |
| S (3) | 2 | 2 | 3 | 4 | |
| VS (4) | 3 | 3 | 4 | 4 | |
Table 3.
Estimated weight of animals and their production of manure expressed as% of body weight.
| Livestock | Live Weight in kg | Total Fresh Manure (% Live Weight)/Day |
|---|---|---|
| Cattle | 210 | 6 |
| Goat | 30 | 7 |
| Sheep | 30 | 7 |
| Poultry | 1.6 | 7 |
| Pigs | 63 | 6 |
Table 4.
Consolidated AHP-decision matrix with derived weights (DW) in percentage.
| Small-Scale Subsistence Fish Pond Farming | |||||||
|---|---|---|---|---|---|---|---|
| WA | EC | FI | WT | FG | AC | DW (%) | |
| WA | 1.00 | 2.52 | 4.48 | 5.52 | 6.07 | 8.32 | 43.7% |
| EC | 0.40 | 1.00 | 2.88 | 3.68 | 4.16 | 6.35 | 24.9% |
| FI | 0.22 | 0.35 | 1.00 | 2.62 | 2.92 | 5.01 | 13.8% |
| WT | 0.18 | 0.27 | 0.38 | 1.00 | 2.29 | 4.31 | 8.7% |
| FG | 0.16 | 0.24 | 0.34 | 0.44 | 1.00 | 3.42 | 6.0% |
| MA | 0.12 | 0.16 | 0.20 | 0.23 | 0.29 | 1.00 | 2.9% |
| Consistency ratio (CR) | 0.052 | ||||||
| Group Consensus | 96.2% | ||||||
| Medium-Scale Commercial Fish Pond Farming | |||||||
| WA | AC | WT | EC | FI | FG | DW (%) | |
| WA | 1.00 | 2.00 | 5.31 | 6.60 | 7.61 | 9.00 | 43.6% |
| MA | 0.50 | 1.00 | 3.63 | 4.93 | 6.95 | 8.32 | 29.5% |
| WT | 0.19 | 0.28 | 1.00 | 1.59 | 3.63 | 5.94 | 11.5% |
| EC | 0.15 | 0.20 | 0.63 | 1.00 | 2.62 | 5.19 | 8.4% |
| FI | 0.13 | 0.14 | 0.28 | 0.38 | 1.00 | 2.88 | 4.4% |
| FG | 0.11 | 0.12 | 0.17 | 0.19 | 0.35 | 1.00 | 2.5% |
| Consistency ratio (CR) | 0.050 | ||||||
| Group Consensus | 97.7% | ||||||
Acronym-key: WA water availability, EC engineering capability, FI farm inputs, WT water temperature, FG opportunities for farm-gate sales, MA market accessibility, DW (%) derived weight in percentage.
Table 5.
Distribution of suitability scores for small-scale subsistence and commercial fish pond farming in mainland Tanzania and for criteria of importance to these activities.
Table 5.
Distribution of suitability scores for small-scale subsistence and commercial fish pond farming in mainland Tanzania and for criteria of importance to these activities.
| Very Suitable | Suitable | Moderate Suitable | Unsuitable | Overall Suitability Score | |||||
|---|---|---|---|---|---|---|---|---|---|
| Criteria/Sub-group | km2 | % | km2 | % | km2 | % | km2 | % | |
| Water Availability | 1179 | 0.2 | 214,241 | 28.3 | 540,851 | 71.5 | 711 | 0.1 | 2.29 |
| Engineering Capability | 212,133 | 28.0 | 304,742 | 40.3 | 179,952 | 23.8 | 60,156 | 8.0 | 2.88 |
| Water Temperature | 48,189 | 6.4 | 596,905 | 78.9 | 77,768 | 10.3 | 33,929 | 4.5 | 2.87 |
| Availability of farm inputs and manure | 194,581 | 25.7 | 239,205 | 31.6 | 261,370 | 34.5 | 61,828 | 8.2 | 2.75 |
| Farm-gate sales | 36,103 | 4.8 | 322,124 | 42.6 | 325,846 | 43.1 | 72,911 | 9.6 | 2.42 |
| Market accessibility | 76,532 | 10.1 | 328,913 | 43.5 | 269,864 | 35.7 | 81,674 | 10.8 | 2.53 |
| Subsistence fish pond farming | 232 | 0.0 | 450,416 | 59.5 | 306,015 | 40.4 | 84 | 0.0 | 2.61 |
| Commercial fish pond farming | 97 | 0.0 | 399,532 | 52.8 | 356,851 | 47.2 | 267 | 0.0 | 2.56 |
Table 6.
Regional fisheries officers (16) perception on aquaculture related issues in Tanzania.
| Regions with fish feed froducer (%) | 38 |
| Regions with fish hatcheries (%) | 79 |
| Average number of fish hatcheries per region | 2 |
| Regions with increased aquaculture production during the last 10 years (%) | 81 |
| Average increased production the last 10 years (%) | 45 |
| Regions with increased demand for farmed fish the last 10 years (%) | 88 |
| Regions expecting an increased aquaculture production the coming 10 years (%) | 88 |
| Use of farmed fish (%): | |
| Sold at markets | 67 |
| Home consumption | 33 |
| Attitude to aquaculture among fish farmers in the region (%): | |
| Overall positive and willing to expand | 56 |
| Neutral and mainly seen as supplementary income to agriculture | 44 |
| Potential problems with aquaculture: | |
| They can introduce new species to the environment | 56 |
| They compete for water | 33 |
| They can pollute the environment | 11 |
| Climate change impact on aquaculture: | |
| Water shortage | 47 |
| Destructive floods | 32 |
| Change in temperature | 21 |
Table 7.
Characteristics of urban (commercial, 11) and rural (subsistence, 89) pond farming in Tanzania.
Table 7.
Characteristics of urban (commercial, 11) and rural (subsistence, 89) pond farming in Tanzania.
| Rural (89) | Urban (11) | ||
|---|---|---|---|
| Education Level | ≥14 yrs (%) | 19 | 69 |
| Pond structure | Size (m2) | 399 | 494 |
| Concrete (%) | 4 | 84 | |
| Earthen (%) | 96 | 11 | |
| Lined (%) | 0 | 5 | |
| Pond age | Before 2010 (%) | 53 | 0 |
| After 2010 (%) | 47 | 100 | |
| Water source | Surface water (%) | 65 | 15 |
| Ground-water (%) | 35 | 85 | |
| Fish seed sources | Hatchery (%) | 42 | 79 |
| Wild (%) | 10 | 21 | |
| Neighbor (%) | 31 | 0 | |
| Restarting (%) | 17 | 0 | |
| Fish pond fertilization | Yes (%) | 96 | 63 |
| No (%) | 4 | 37 | |
| Fish managment | Stocking density (fish/m2) | 4.3 | 10.5 |
| Fish yield (ton/ha) | 2 | 16.3 | |
| Fish pellets (%) | 0 | 100 | |
| Agriculture waste (%) | 100 | 0 | |
| Fish sold | 62 | 95 | |
| Fish consumed | 36 | 5 | |
| Fish given away | 2 | 0 | |
| Purpose | Improve income | 31 | 83 |
| Protein source/food security | 48 | 8 | |
| Other | 21 | 5 | |
| Future plans | Continue | 64 | 31 |
| Expand | 15 | 54 | |
| Discontinue | 9 | 7 | |
| Undecided | 12 | 8 |
Publisher’s Note: MDPI stays neutral with regard to jurisdictional claims in published maps and institutional affiliations. |
© 2021 by the authors. Licensee MDPI, Basel, Switzerland. This article is an open access article distributed under the terms and conditions of the Creative Commons Attribution (CC BY) license (https://creativecommons.org/licenses/by/4.0/).
Share and Cite
MDPI and ACS Style
Berg, H.; Mulokozi, D.; Udikas, L. A GIS Assessment of the Suitability of Tilapia and Clarias Pond Farming in Tanzania. ISPRS Int. J. Geo-Inf. 2021, 10, 354. https://0-doi-org.brum.beds.ac.uk/10.3390/ijgi10050354
AMA Style
Berg H, Mulokozi D, Udikas L. A GIS Assessment of the Suitability of Tilapia and Clarias Pond Farming in Tanzania. ISPRS International Journal of Geo-Information. 2021; 10(5):354. https://0-doi-org.brum.beds.ac.uk/10.3390/ijgi10050354
Chicago/Turabian StyleBerg, Håkan, Deogratias Mulokozi, and Lars Udikas. 2021. "A GIS Assessment of the Suitability of Tilapia and Clarias Pond Farming in Tanzania" ISPRS International Journal of Geo-Information 10, no. 5: 354. https://0-doi-org.brum.beds.ac.uk/10.3390/ijgi10050354
Note that from the first issue of 2016, this journal uses article numbers instead of page numbers. See further details here.