1. Introduction
Route planning functionality is common in modern web mapping tools and in navigation systems in smart devices. Although many programming solutions exist [
1], there are still challenges in the development of route planners to support navigation for certain means of transport (e.g., cycling, walking) and target groups (e.g., the elderly, tourists) in specific environmental conditions (e.g., heavy rain, snowy roads).
Route planners are typically intended to support drivers in finding fastest connections and to avoid, for instance, road obstacles such as traffic jams [
2,
3,
4]. Route planners that support other means of transport have attracted less attention in the literature [
5]. Moreover, previously developed solutions for specific users, such as those with physical disabilities, typically have limited applicability due either to sophisticated methods or to lack of easily available data and technology [
6]. As a result, some route planners exist as proof-of-concept implementations limited to certain areas and specific conditions. Therefore, any attempts to make rare routing solutions more available are appreciated by practitioners. Supporting pedestrians in route planning in urban environments is timely, as urban populations are growing and urban citizens are particularly exposed to extreme weather-related events such as high temperatures and pluvial floods. Therefore, route planners can be of value to individual citizens, especially pedestrians and those vulnerable with limited mobility and health problems [
6].
The study on which this paper is based constitutes part of overarching efforts under the umbrella of the CitizenSensing project [
7]. The efforts are to support pedestrian navigation in adverse environmental conditions. This study contributes to these efforts with an empirical examination of a pedestrian routing functionality implemented in the WayFinder web tool [
8] that helps to navigate in urban areas with accumulated surface water. Accordingly, in this study we wanted to gain insight into user perspectives on the WayFinder routing tool to verify to what extent users find such tools of value to their needs. Our contribution to the field of GIScience is of an operational nature with applicable suggestions. We also identified some essential issues regarding the expectations and perspectives of citizens who are likely to use pedestrian routing tools.
2. Related Research
2.1. Route Planners
Route planners have been found to be useful for various user groups. Hence, they are commonly used in various map-based applications such as scenic route planners [
9,
10,
11], route planners for cyclists [
12], and route planners for specific places [
13] or for use during specific events [
14]. Route planners are also used in crisis and emergency management such as traffic evacuation [
15]. Regardless of their main purposes, route planners have one feature in common, they all suggest routes based on multivariate optimization, taking into account specific conditions that directly concern the route to be passed (e.g., route length, time distance) and those that concern the environment (physical context, for example, land cover, steepness) through which the route is to pass. The information about the environment can concern its present state, as well as its historical or predicted future characteristics such as weather-related adverse conditions.
2.2. Walkability and Pedestrian Navigation in Exposed Areas
The assessment of the built environment in terms of being conducive to walkability emerges as a core challenge of planning urban areas [
16]. Walkability concerns flow capacity and perceives an urban space as more or less convenient for pedestrians if they can move in an unimpeded manner without obstacles and with as much space as possible [
17]. As Lo claims [
17], pedestrian transportation is addressed in the scientific literature with far less intensity than motorized vehicular modes. However, there are studies that employ walkability indices as a basis for comparing different cities around the world and to create walking friendly cities [
18]. Such indices use various variables [
16], for instance, measures of permanent and temporary obstacles on walking paths to describe the convenience and attractiveness of an urban space.
A large body of scientific literature reports studies by architects and urban planners on mapping areas that are either recommended or excluded for use by pedestrians or other users of public spaces during specific extreme events, for example, [
6,
19,
20] such as high temperatures [
21] and pluvial flooding [
22]. The former (i.e., heat) can cause risk to human health and well-being. However, extreme heat can occur over large areas and can, in combination with other factors such as humidity, air pressure and air pollution, increase the risk of negative health impacts and death [
23]. Therefore, public urban spaces can be only partially adapted to extreme heat and citizens also require other types of support, especially those in vulnerable groups such as the elderly or children. In such situations, there is a need for pedestrian navigation tools that facilitate the planning of daily activities during heat events [
6].
During another type of extreme event, namely pluvial flooding, the safety of citizens can be compromised when they are exposed to flows that exceed their ability to traverse flow paths [
22]. More frequently, surface water accumulated on streets leads to less extreme situations, such as when a cloudburst or meltwater creates flood conditions that block streets and sidewalks because the urban drainage system becomes filled to capacity, resulting in water flowing out into streets [
24]. Such conditions can become even worse, if there are snow and ice traces remaining on the streets. In such cases, pedestrian navigation tools can support citizens in avoiding inundated areas through displays of “blue spots.” The latter are modeled data on areas where surface water is likely to accumulate [
25]. However, it is of importance to have a good understanding of what the challenges are in terms of such tools being used by pedestrians and to gain insights into the perspectives of those who use pedestrian route planners in practice. Therefore, user studies are needed to collect necessary evidence.
2.3. Empirical Studies of Route Planners for Use by Pedestrians
Empirical studies of pedestrian route planners can be divided into two groups. The first group of studies focuses on technologies, such as algorithms for wayfinding and necessary context information for route planners. These studies also concern functionality and design of such tools. Holone et al. [
5], for example, explored the potential of a pedestrian navigation with user-generated content through a combination of fieldwork and laboratory trials, using real life data. In turn, Beeharee & Steed [
26] examined how the use of photos can facilitate wayfinding in unusual situations when the user must pass through a specific gate or along a certain path. In these cases, photographs can provide information and reassurance to support the navigation decision. More recently, Fuest et al. [
27] conducted a user study to investigate the potential of six design variants for influencing route choices.
The second group of empirical studies focuses on user perspectives and pays particular attention to criteria such as user satisfaction and the usefulness of route planning tools. For instance, Arenghi et al. [
13] carried out a usability experiment involving two versions of a mobile application for accessible wayfinding and navigation in an urban university campus. Among their identified design issues was the ability for users with physical disabilities to indicate the presence of barriers. In an earlier study, Gavalas et al. [
9] conducted a user evaluation of the scenic route planner ‘Scenic Athens’ to validate the quality of tour recommendations as well as the usability and perceived utility of the application.
3. Materials and Methods
3.1. Aim
Although available routing services and ubiquitous geographic data make context-aware routing tools feasible, we know little about pedestrians’ experiences in using such tools for navigation in exposed areas, such as regions that are likely to have surface water accumulated. Moreover, it is beneficial for navigation developers to know which routing approach pedestrians prefer—the approach that suggests routes that avoid exposed areas or the approach that displays routes that pass through such areas and provides information to the users about the risk. While the former approach suggests routes likely to be longer than those suggested by the latter one, its essential advantage is that it provides “ready-to-use” route suggestions that do not require any analytical capacity on the part of the user. Alternative route suggestions are often shorter as they pass through exposed areas. However, the user may need to analyze the situation and make their own decision regarding safety and comfort issues. For alternative route suggestions, additional information about the length of exposed areas a user needs to walk, may be essential to assess the risk of, for example, getting one’s feet wet.
3.2. Empirical Material: WayFinder and Its Data Content on “Blue Spots”
A customized prototype of WayFinder was used as the empirical material. For the purpose of the study, the prototype was equipped with additional functionality to facilitate its use for data collection.
WayFinder uses a mixed solution regarding the route planner approach [
8]. The tool works as a “passive route planner” providing a background layer with modeled areas likely to be inundated, to be visually explored by the user when searching for an “optimal” route. Furthermore, the tool also works as a context-aware “active route planner” since the mapped inundated areas are included in its routing mechanism.
3.2.1. Data Content of the WayFinder Tool: The “Blue Spots”
We tested the WayFinder prototype that used mapped representations of “blue spots” [
25,
28] as its data content. Blue spots are terrain sinks that are likely to be inundated during extreme rainfall that exceeds the capacity of the urban drainage system. However, WayFinder is a generic tool and its data content can be easily tailored to specific demands. Thus, blue spots can be replaced with zones representing other kinds of exposure, such as heat exposure, and the user can be provided with routing advices, such as where to go to escape high temperatures.
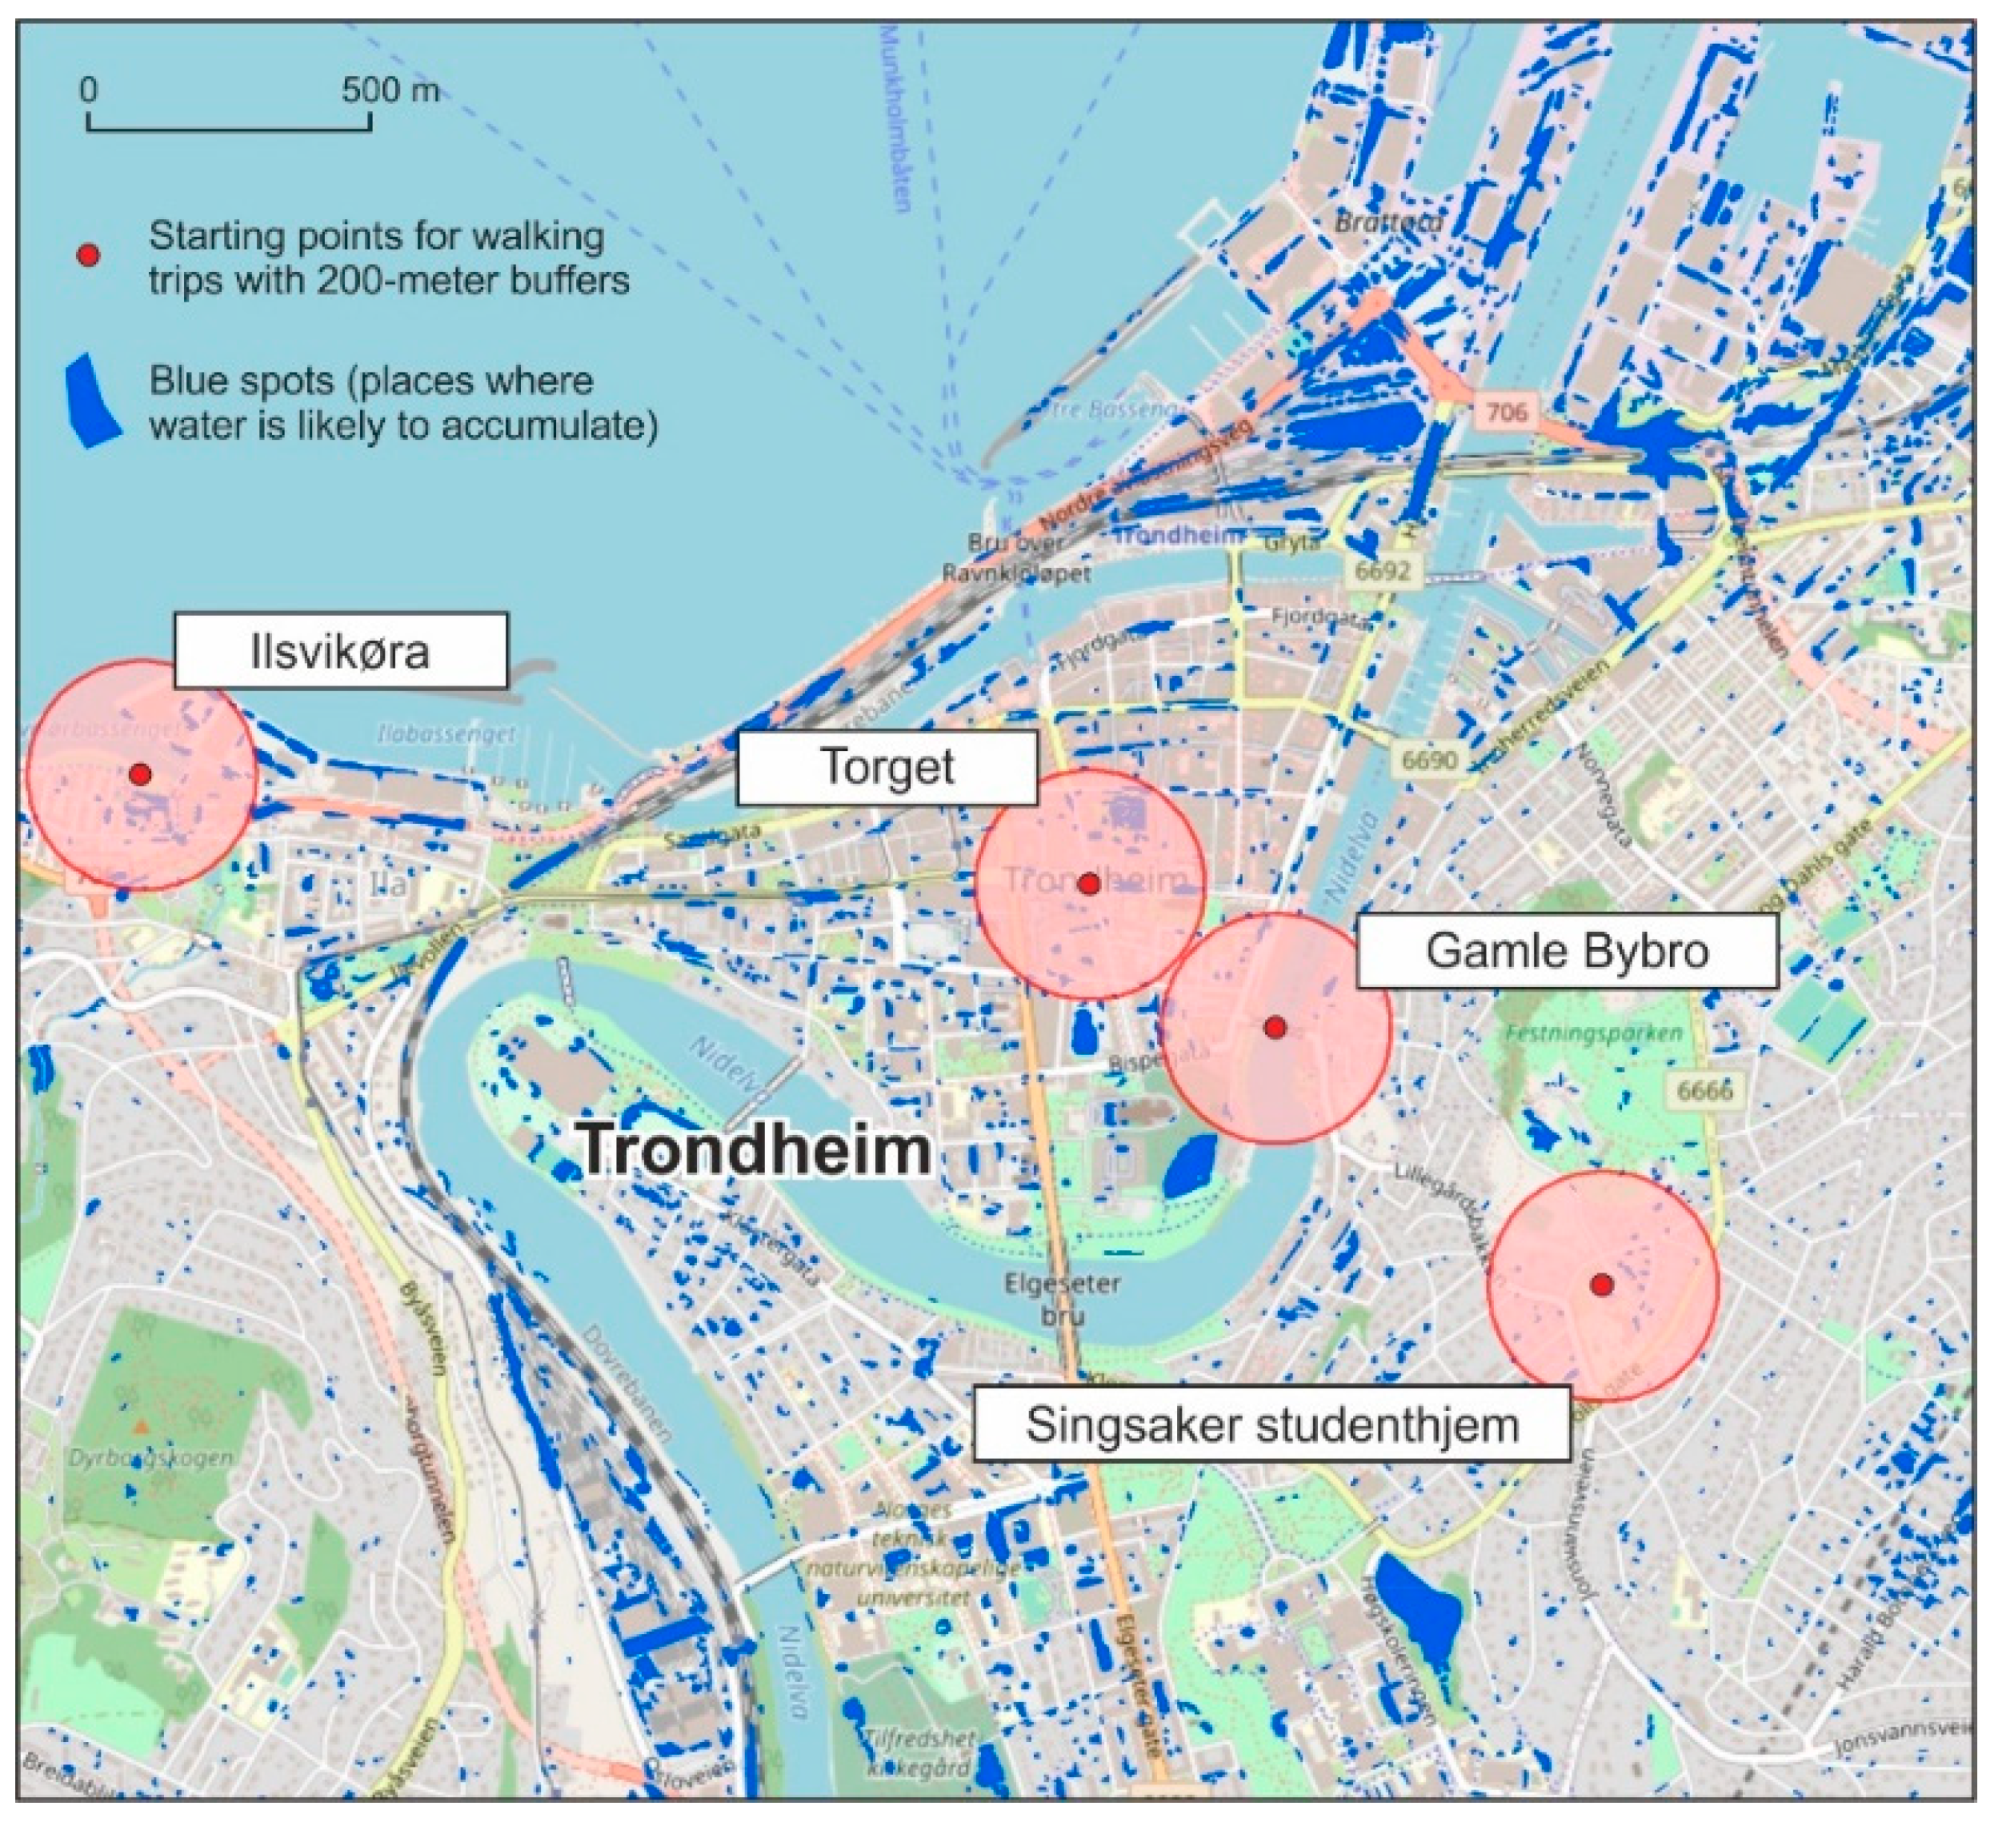
The blue spots mapping was made for the city of Trondheim using the method by Balstrøm and Crawford [
25].
Figure 1 shows the results of the blue spot mapping overlaid on the map of Trondheim downtown. There are many blue spots scattered around downtown; however, most of the potentially inundated areas are located in the Brattøra district, which is visible in the top right corner of the map. Next, blue spots represented as vector polygons were incorporated in the tool’s routing algorithm that enabled avoidance of given areas. Moreover, for the purpose of displaying the blue spots mapping in WayFinder, vector polygons were converted to a PNG file that was used in the tool as a raster overlay.
3.2.2. Functionality
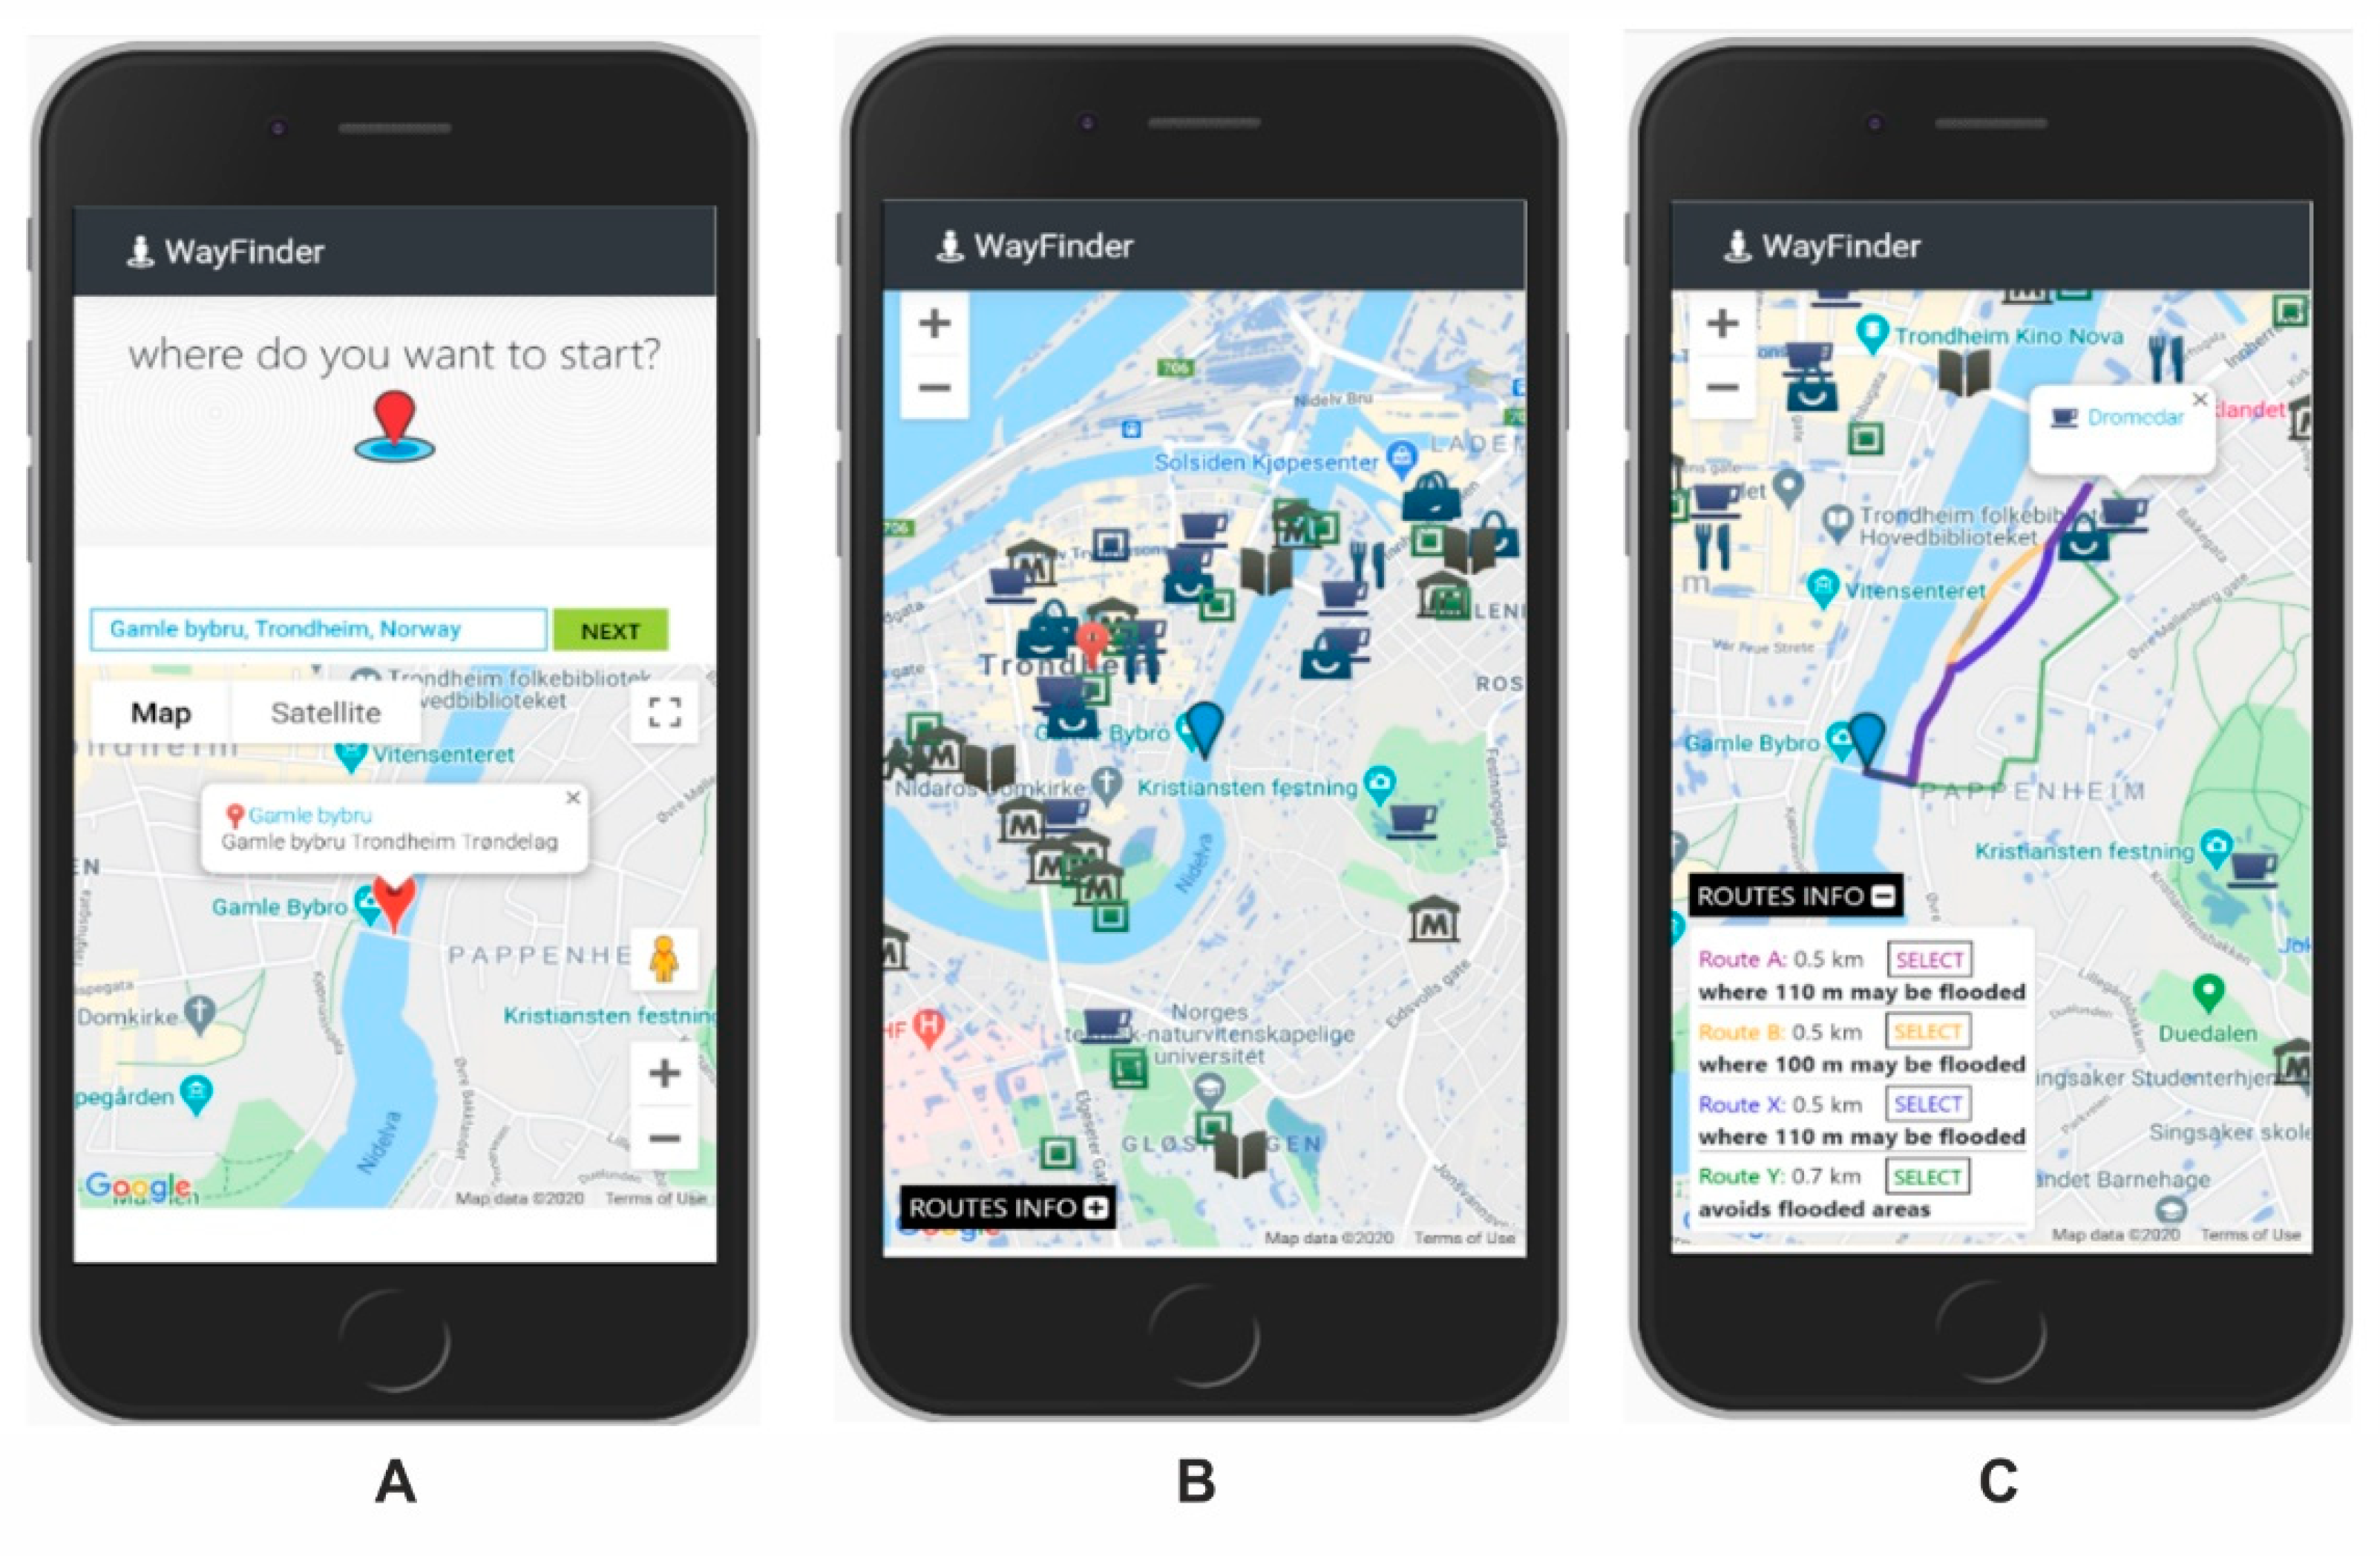
To provide participants with several routing options and let them freely choose the option that fits them best, the tool employs two routing services: Google Maps Directions API (Google, Mountain View, CA, USA) and Open Route Service API (HeiGIT gGmbH, Heidelberg Institute for Geoinformation Technology at Heidelberg University, Germany). The user’s geographic position is either retrieved from the device’s GPS receiver, or manually specified by the user (e.g., “Gamle bybro” in
Figure 2A). The user’s position is then shown on a map (the blue drop marker in
Figure 2B) along with the positions of the objects serving as alternate endpoints of walks. For the purpose of the empirical study, the objects were intentionally limited to cafés, museums, parks, libraries, and supermarkets located within a donut buffer from the user’s position (not closer than 400 m and not further away than 1000 m). Adequate map symbols were used to represent the objects’ functions (e.g., a book symbol for a library, a bag symbol for a supermarket). At this point, the user is supposed to select one of the available endpoints and in response WayFinder provides up to five alternative route suggestions (
Figure 2C shows four alternative route suggestions). Among all suggestions, only one avoids blue spots. The other suggested routes may pass through them, in which case, the total length of the parts that intersect blue spots is provided in the ROUTES INFO panel at the bottom left corner of the map display (
Figure 2C).
Next, the user selects one of the route suggestions by clicking on a corresponding SELECT button (
Figure 2C) and a dialog window appears, where the user needs to provide a username and confirm the selection. As a result, the selected route suggestion is saved as a GeoJSON file in the database and the user is taken back to the map, where only the selected route is displayed. At this point, the user starts walking and the position is tracked by WayFinder and continuously updated on the tool’s map. Hence, the user can follow the route on the map and compare it with the background blue spot mapping. After reaching the selected endpoint, the user clicks on the DONE button and is taken back to WayFinder’s opening window.
3.2.3. Implementation
The assumption was to develop WayFinder using broadly available web technologies. Therefore, its prototype was developed using the Angular open-source front-end web application framework (
https://angular.io/ accessed on 28 May 2021). Google Maps Directions API and Open Route Service have been used to retrieve route suggestions. The route suggestions from Google Maps Directions do not avoid blue spots. This may happen unintentionally, but there are no specific rules for avoiding exposed areas included in our implementation. Instead, for each of the suggestions, the share of the parts passing through blue spots is calculated and provided to the users. We used Turf.js API to calculate the lengths of the parts that intersected blue spots. In turn, Open Route Service API is the routing service that we implemented to establish “area avoid polygons” representing modeled blue spots and to search for route suggestions that avoid such areas (Route Y in
Figure 2C). Additionally, Open Route Service was used to search for one optimized route suggestion intersecting exposed areas (Route X in
Figure 2C), for which the share of the parts passing through blue spots is calculated and provided to the users.
3.2.4. Layout
WayFinder was designed for use on portable devices with small screens and its layout is therefore minimalistic. Moreover, the tool was intentionally customized for the purpose of the study, it means, to provide users with route suggestions with no extra information and with very limited auxiliary content. Therefore, WayFinder’s map display was equipped with basic interactive functions such as zooming and panning. Furthermore, the user could alter the map style between satellite image and street map only in the tool’s opening window. The opening window also allowed the user to go to the Google Street View mode to ensure that the start location of the walk was correctly registered.
3.3. Procedure and Methods
Before attending the empirical study, the participants were asked to read and sign a consent form. The form, among others, contained description about the data we were to collect, and how we planned to use the data in the study. The empirical part of the study consisted of three stages (
Figure 3). In the first stage, the participants were asked to complete the background questionnaire (Q1-BQ). Thereafter, in the second stage, the participants were asked to use WayFinder to search for a route and walk along it. While walking, the participants were asked to use a participatory web application to register at least one observation with a photo. After the walk, participants were asked to fill in the post-walk questionnaire (Q2-QW). They were encouraged to use WayFinder more than once. This meant that each time participants used WayFinder, they repeated the sub-steps of the second stage. Finally, in the third stage, after all walking trips, the participants were asked to fill in the summary questionnaire (Q3-SQ).
We used three empirical methods: (1) practical verification, (2) observations through a participatory web application, and (3) questionnaires. As complementary, the methods enabled us to collect diverse empirical data.
3.3.1. Practical Usage of WayFinder
For the best possible trial of the tool, the participants were requested to use WayFinder after heavy rainfall events, of course, with keeping safety rules. Moreover, to avoid possible inconsistent data collection, we suggested that participants should start their walks from any of the following four places in Trondheim: Ilsvikøra, Torget, Gamle Bybro and Singsaker studenthjem (
Figure 1). The selection of the four places was intended to cover locations in Trondheim that would be easily recognizable and accessible to the participants.
The use of WayFinder allowed for the collection of empirical data that concerned each route selected for a walking trip undertaken by the participants. The data contained also the name and type of the endpoint (e.g., café or library), and the submission timestamp. Each submission was saved as a unique GeoJSON file.
3.3.2. Observations through the CitizenSensing Web Application
While walking along selected routes, the participants were instructed to observe inundated places or, if they selected a route avoiding potentially inundated areas and thus, observed none of “blue spots,” they could make another observation, for example, debris or ice blocking an outlet. The participants registered their observations using the CitizenSensing web application [
8]. Each observation included a timestamp, geographical coordinates, a photo, information about an observation type (e.g., “heavy rain,” “low temperature”), and a comment. The observations were used to verify whether participants walked the routes they selected and were compared with the blue spot mapping used in the WayFinder tool.
3.3.3. Questionnaires
The background questionnaire (Q1-BQ) was completed before any walks were taken. It contained four questions with responses on a scale from 1 (poor) to 7 (very good). In the first two questions, participants were asked to rate their skills in terms of use of maps for city walks and in terms of spatial orientation in urban space, respectively. These two questions were posed to provide insights into the participants’ capabilities regarding the use of a map display providing route suggestions. Participants were in the next two questions asked to rate their familiarity with Trondheim’s topography and weather conditions. These questions were designed to verify whether place-specific knowledge influenced the study’s outcomes.
The post-walk questionnaire (Q2-QW) was completed after the end of each walk. Consequently, the number of completed post-walk questionnaires depended on the number of individual walks made by each participant. Q2-QW was composed of five questions. First, we asked whether the participant had followed one of WayFinder’s suggested routes, and if not, why not (five predefined answers included e.g., “I did not have Internet connection” and “I did not know how to use the tool”). Second, we asked participants to provide the code of the selected route and, third, we asked for their reason for selecting a specific option (four predefined answers included e.g., “to avoid potentially inundated areas”). This question was designed to validate the routes saved in GeoJSONs in WayFinder. In the fourth question, participants were asked to rate the completeness of the blue spot mapping used in the WayFinder tool. The fifth and final question was intended to generate feedback about the number of observed inundated areas that were not included in the tool’s blue spot mapping.
The summary questionnaire (Q3-SQ) was filled after all walks had been completed. It consisted of four questions about participants’ experiences when using the tool. First, a question with seven response options was used to let the participants state how useful they found the WayFinder tool. In the second question, we asked participants to identify which user type they thought would be interested in using the tool. They could select one or more predefined options, such as “Tourists” or “Elderly people.” In the third and fourth question, the participants were asked to rate their satisfaction when using the WayFinder tool and its functionality, respectively.
3.4. Participants
A total of 65 participants (40 females and 25 males) participated in the empirical study. They were all first-year undergraduate students in geography. The background questionnaire was completed by 62 participants; three participants did not respond. The participants rated their skills in the use of maps for city walks as slightly above moderate, with average score of 5.0 (on a scale from 1 to 7). The participants also reported slightly above moderate skills in spatial orientation in urban space, with average score of 5.1. Furthermore, participants reported a slightly more than moderate acquaintance with the city of Trondheim and the weather conditions in the city, with an average score of 5.2 for both aspects.
Given that the scores were slightly above moderate levels, we claim that the participants constituted a suitable sample for the empirical testing. They were able to make conscious use of WayFinder and to report on it critically.
4. Data Analysis
4.1. Data Preparation
The data collection was held from September to November 2020. Although 65 participants used WayFinder during this period, their engagement was not always in accordance with the instructions. Therefore, in the data analysis, we excluded a substantial number of the registered walked routes; we kept 133 (57%) out of the registered 234 GeoJSONs. A common mistake made by the participants was repeatedly saving the same route as they progressed along it. This resulted in data relating to the same route being saved several times. Another mistake concerned registering alternative routes without actually walking along them. Consequently, a number of routes were registered with minor delays by the same participants as reflected in the routes’ timestamps. Furthermore, we excluded participants who did not complete all required questionnaires. At the end, the final dataset consisted of the data from 56 participants (86%) for further data analysis.
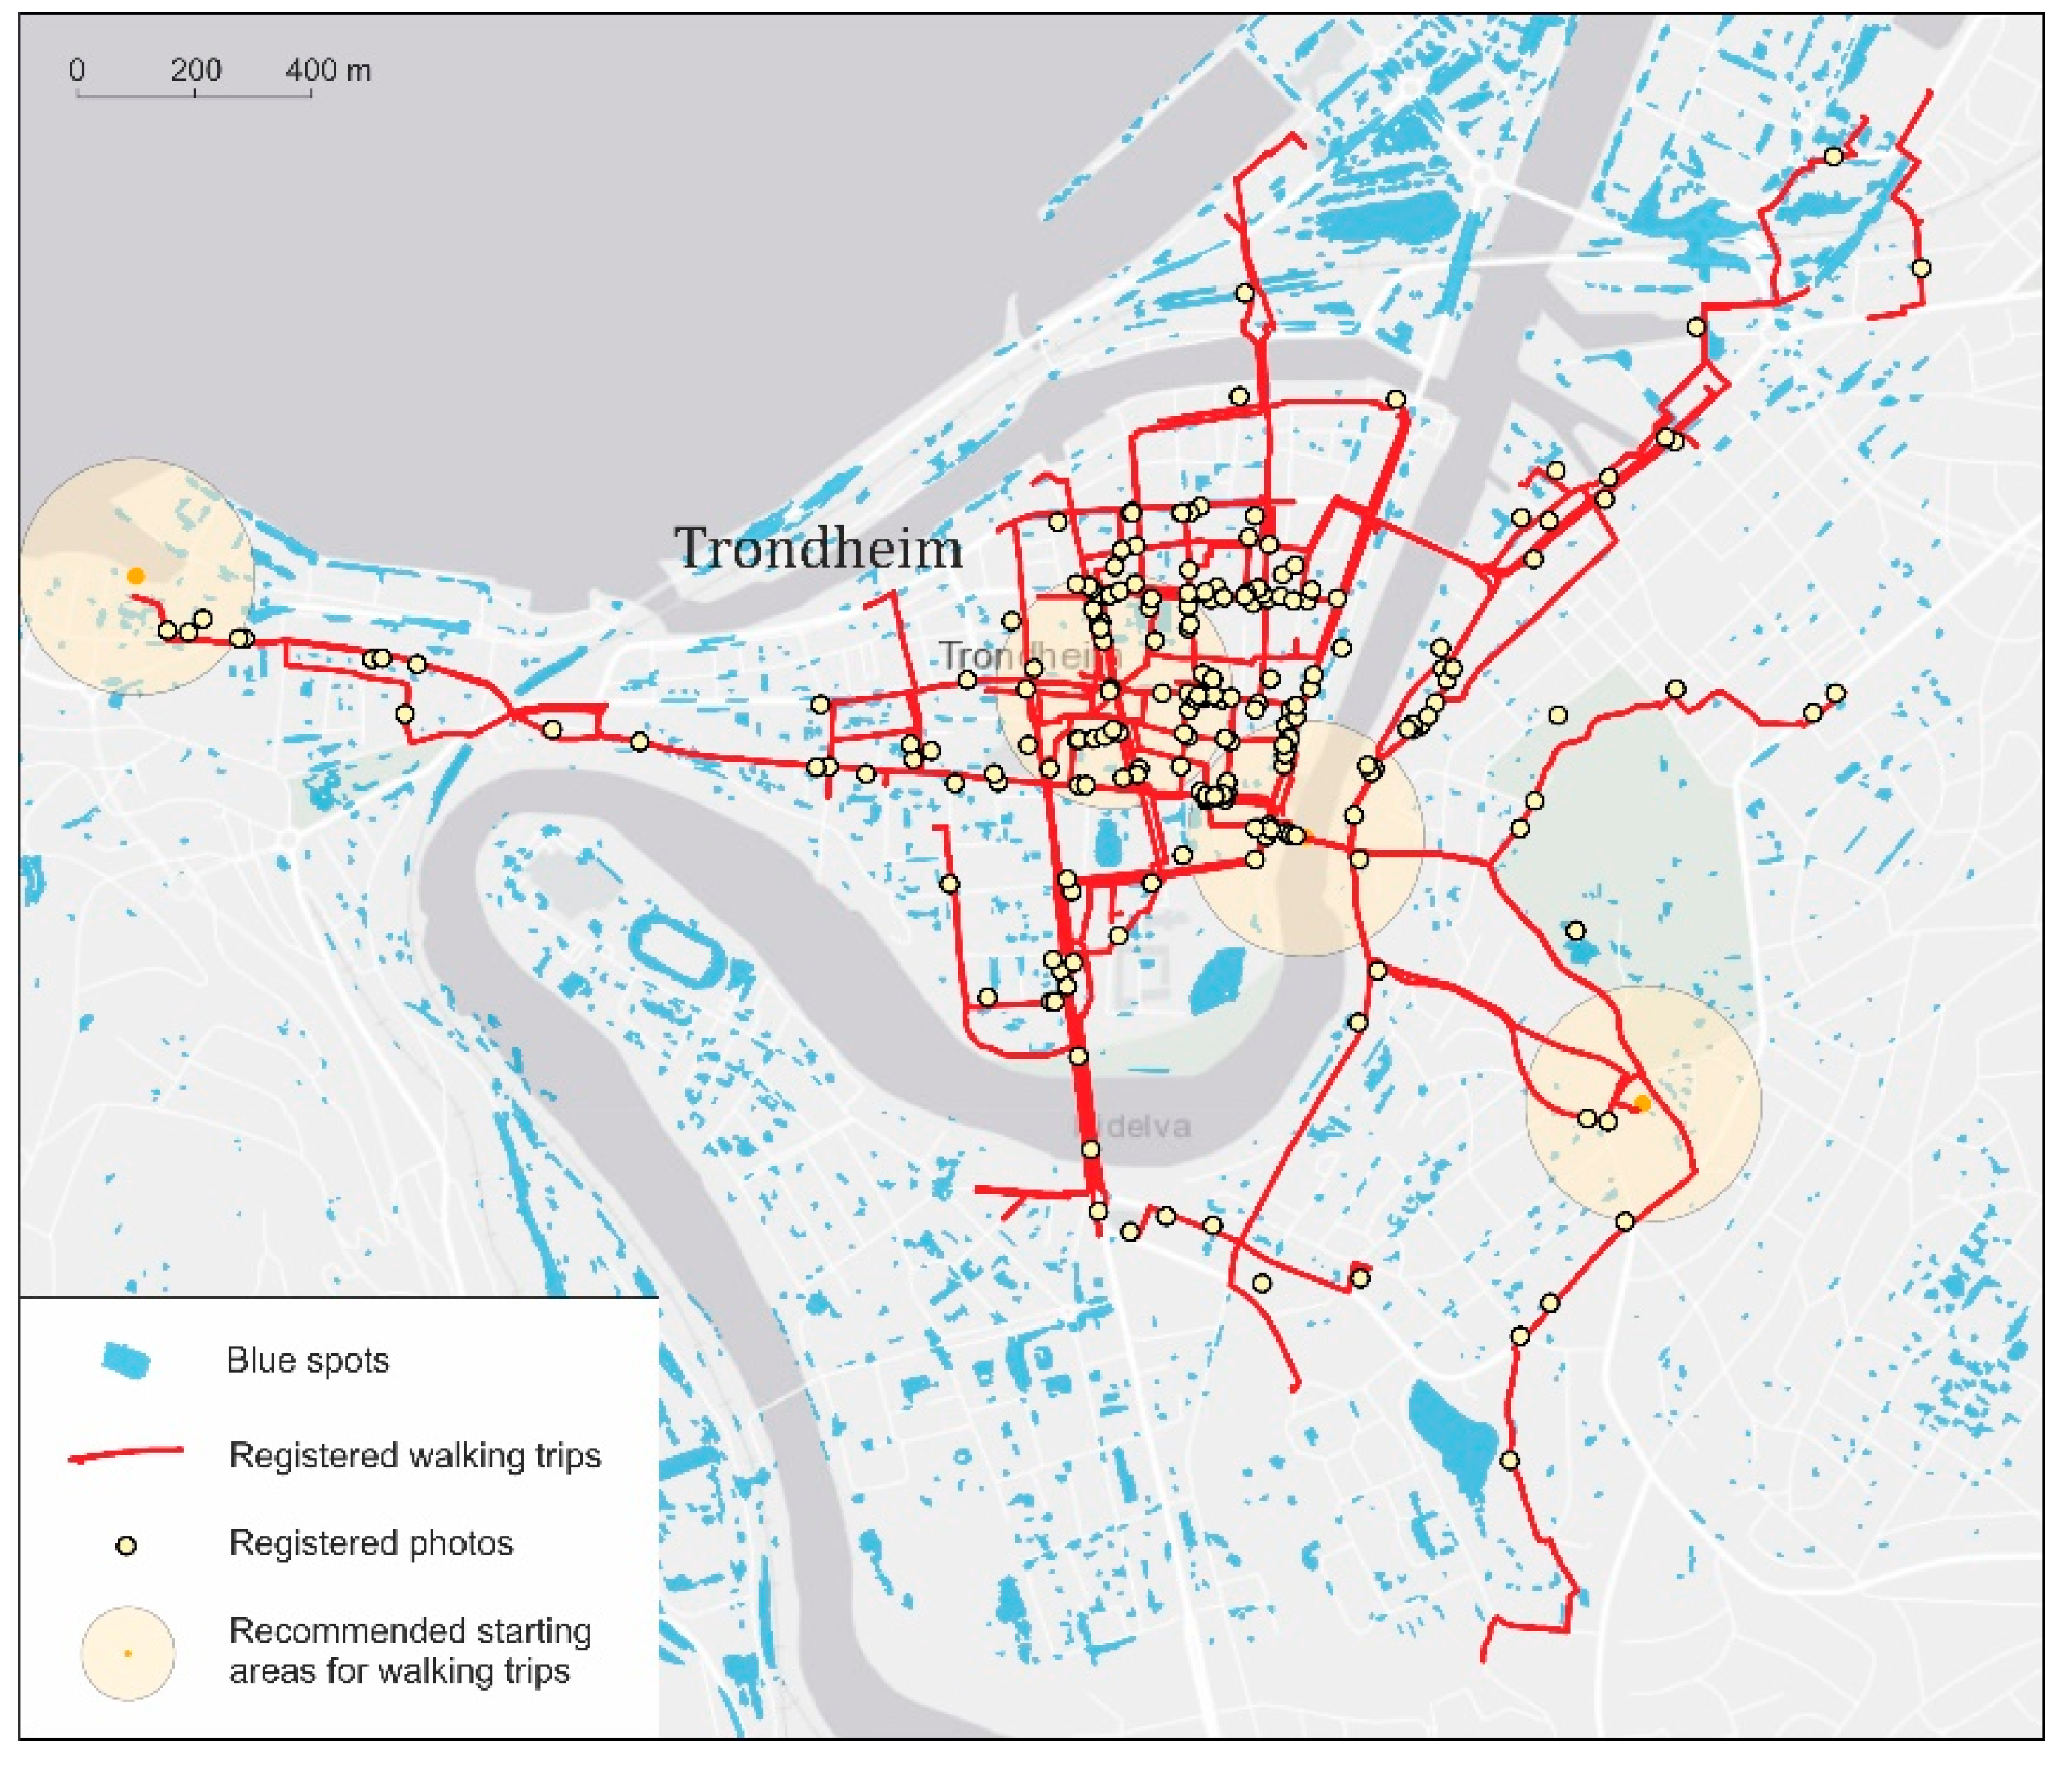
4.2. Walking Trips: Registered GeoJSONs and Completed Q2-QWs
Figure 4 shows 133 walked routes registered by the selected 56 participants. The longest route was 1308 m, while the shortest was 429 m (average 701 m). Most participants walked twice; however, for example, there were seven participants who did four walks. Although nine GeoJSONs were saved as avoiding blue spots, the intersection analysis revealed that there were 12 such routes (9.0%), meaning that in three cases also Google Maps Direction API provided routes that avoided blue spots. The destinations of the walking trips were of diverse types: 41 walks (30.8%) ended at a “restaurant, café,” 28 (21.1%) at a “supermarket, grocery, store,” 24 (18.0%) at a “tourist attraction, museum,” 16 (12.0%) at a “park,” 15 (11.3%) at a “library,” and 9 (6.8%) at an “art gallery.”
We analyzed our participants’ statements regarding the reasons for selecting specific routes, provided through Q2-QWs. The participants declared that they selected the “route with the shortest parts passing through blue spots” in 44 cases out of 133 (33.1%), the “shortest route” in 43 cases (32.3%), the “route avoiding blue spots” in 8 cases (6.0%), and “other choice” in 38 cases (28.6%). In the latter case, the participants were asked to specify the reason. Among the various explanations were “I chose a path I was not familiar with” and “I chose the one with most accumulated water.” There were minor differences between the statements in Q2-QWs and the actual route characteristics saved in GeoJSONs. For instance, in Q2-QWs, the selection of the “route avoiding blue spots” appeared eight times, whereas such a selection was saved in nine GeoJSONs.
We have also compared the lengths of selected route suggestions with the lengths of alternative suggestions. For 18 out of 133 routing requests, the routing suggestion avoiding blue spots was unavailable. Moreover, in another two routing requests, the suggestion avoiding blue spots was much longer than the selected route suggestion. If the participants selected a route suggestion other than the route avoiding blue spots, the latter (if existed and was not much longer) was on average 16.4% (SD = 22.3) longer than the selected route suggestion. Furthermore, if the participants selected the route suggestion avoiding blue spots, the latter was on average 10.5% (SD = 14.3) longer than the shortest route suggestion. In 22 cases, the selected route suggestion was longer than the suggestion avoiding blue spots (on average, 10.5% longer, SD = 5.7). Lastly, if the participants selected a route suggestion other than the shortest route or other than the route avoiding blue spots, the selected route was, on average, 10.6% (SD = 8.4) longer than the shortest available route suggestion.
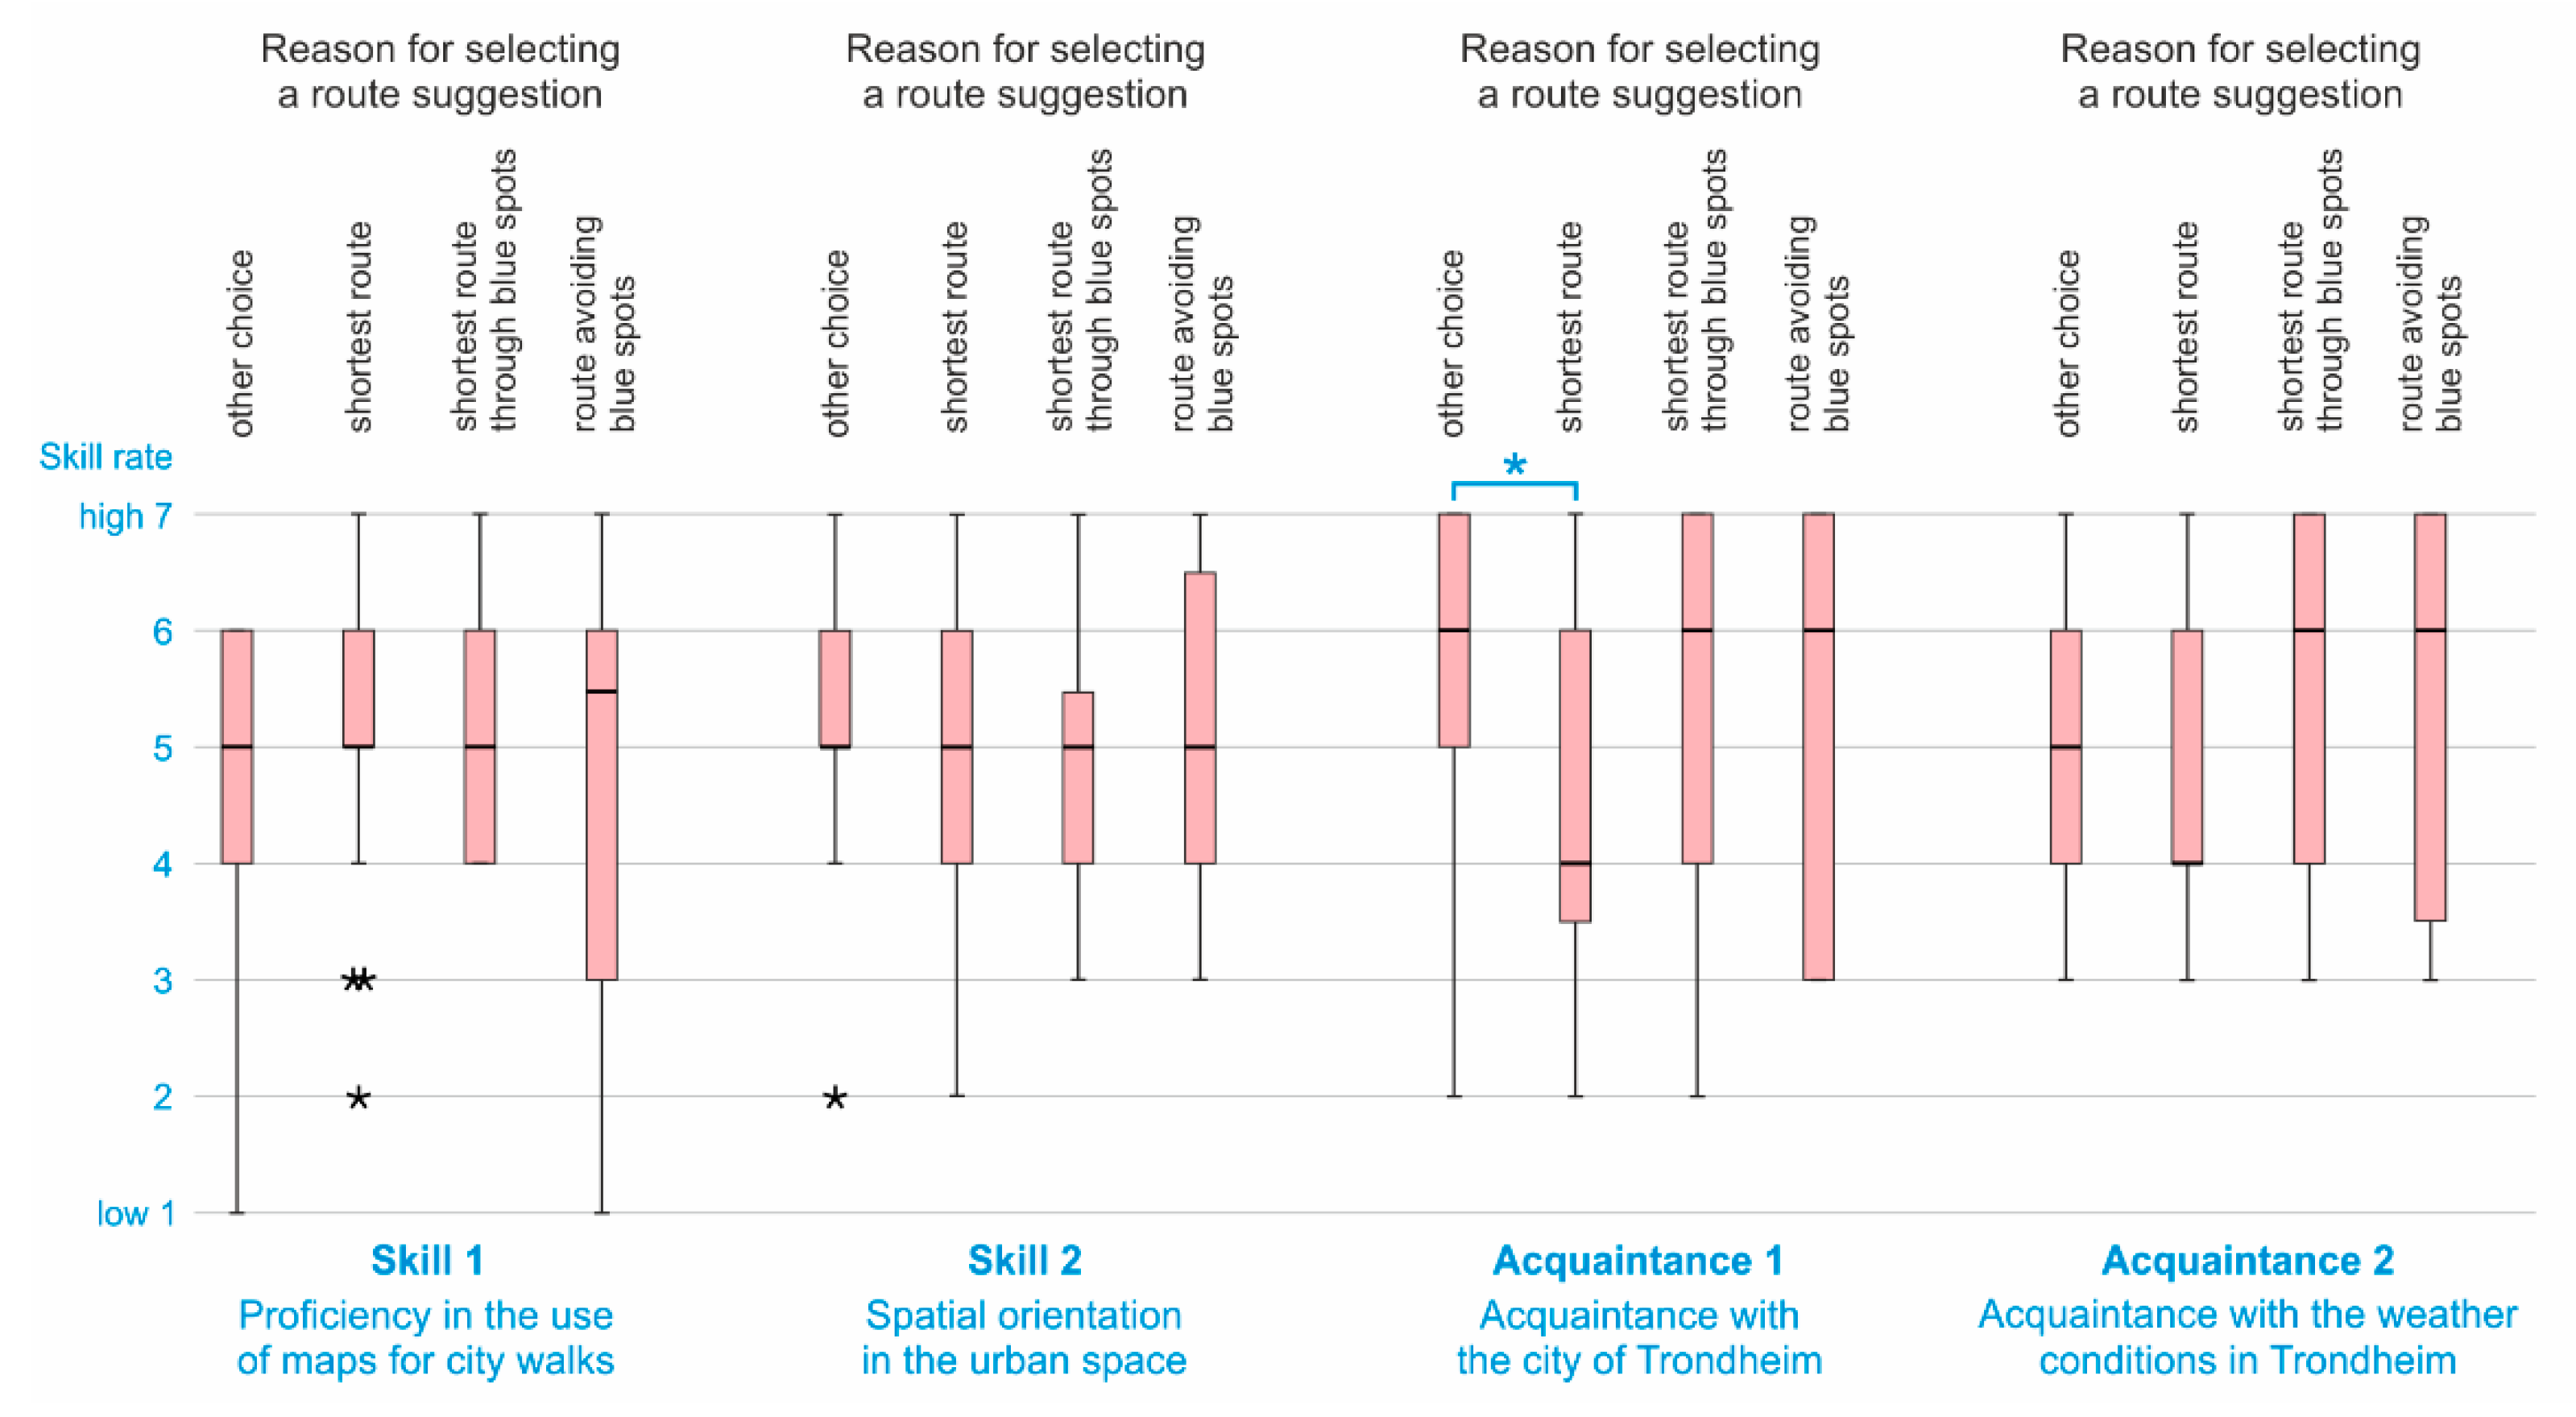
4.3. Walking Trip Choices by Participants’ Skills
We investigated whether there were statistically significant differences in the skills and acquaintances of those who declared different reasons for selecting specific route suggestions. As shown in
Figure 5, the skills and acquaintances were generally on similar level. Furthermore, for three of the considered skills and acquaintances—proficiency in the use of maps for city walks (
p = 0.691), spatial orientation in the urban space (
p = 0.641), and acquaintance with the weather conditions in Trondheim (
p = 0.083)—a Kruskal–Wallis H test did not provide any evidence of differences between any of pairs of skill rates for various reasons for selecting specific route suggestions. However, for our “Acquaintance 1” (acquaintance with the city of Trondheim), a Kruskal–Wallis test provided evidence (H (3, N = 133) = 9.580,
p = 0.022) of a difference between the mean ranks of at least one pair of provided reasons for selecting specific route suggestions. Dunn’s pairwise tests revealed evidence (marked with the blue asterisk in
Figure 5) of differences between participants who declared “other choice” and those who declared walking along the “shortest route” (
p = 0.034, adjusted using the Bonferroni correction).
4.4. Observed Places with Accumulated Surface Water
The places where 245 photos were registered through the CitizenSensing web application to document walking trips are shown in
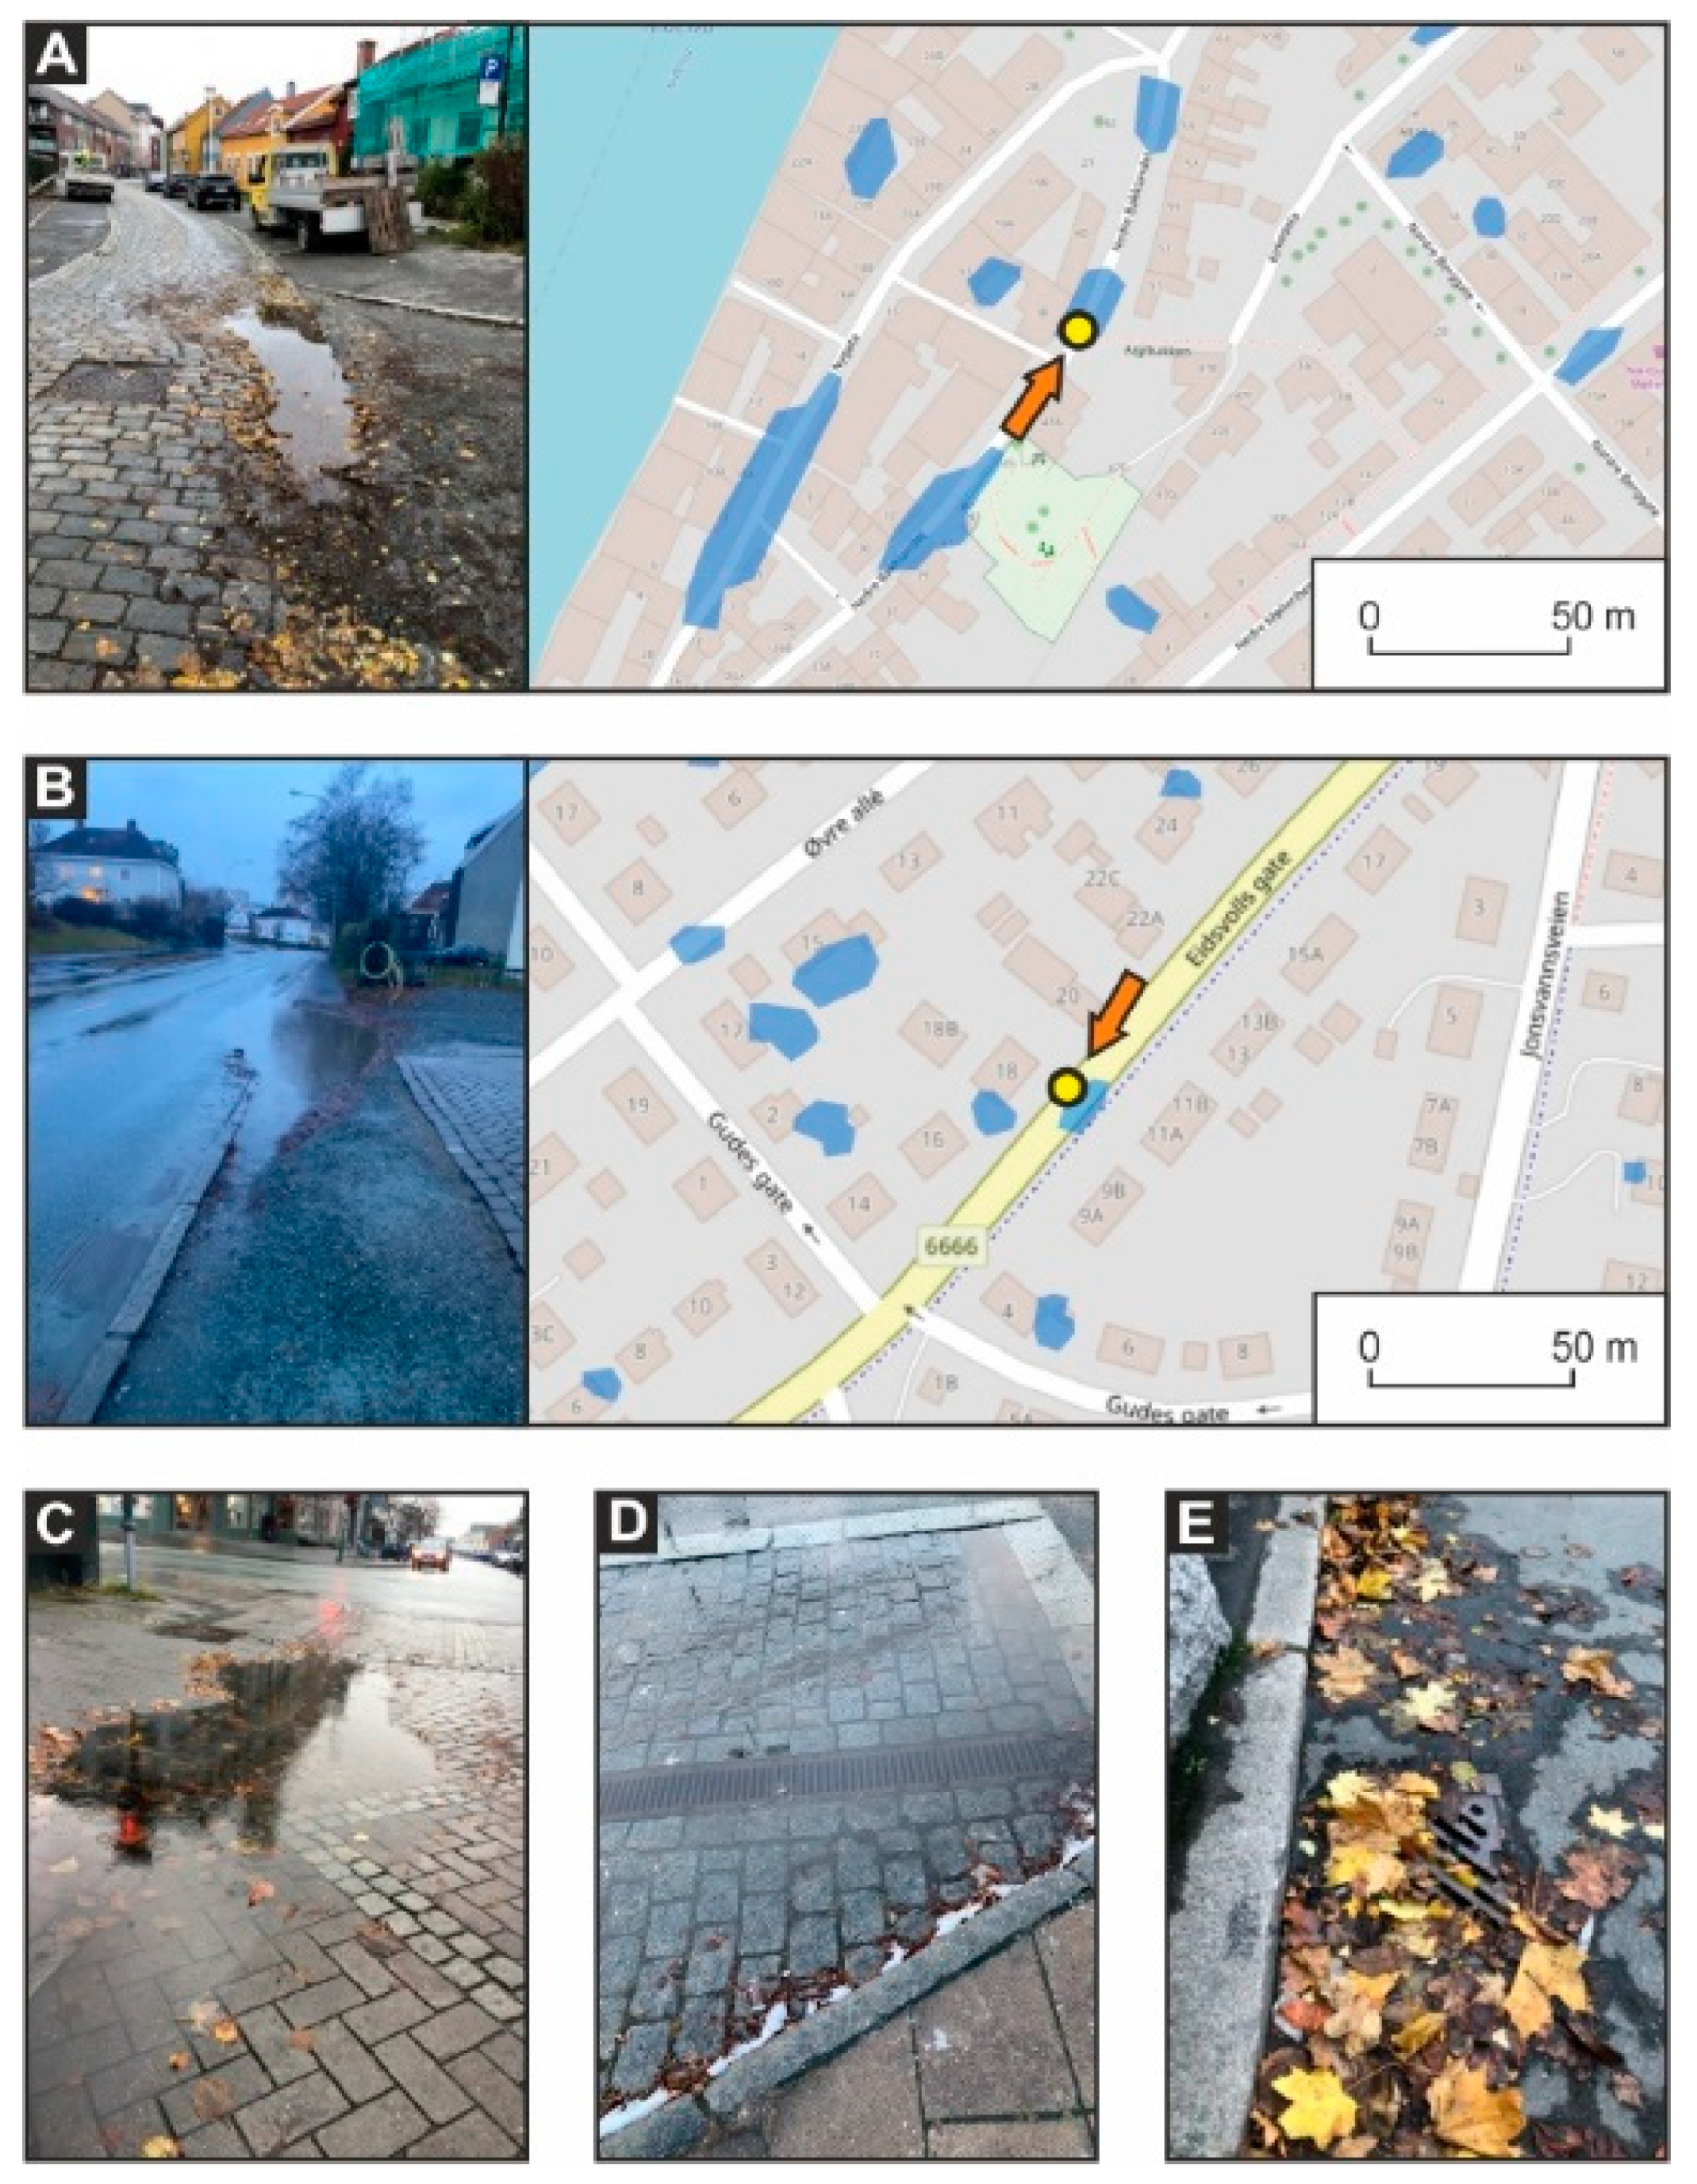
Figure 4. However, 25 out of 133 walks did not have any photos assigned to them. For the remaining 108 walks, two photos on average were registered per walk. A majority of the photos (226 or 92.2%) documented effects of heavy rainfall. Other content categories were “snowfall” (1.2%), “cold temperatures” (3.3%) and “seasonal observations” (3.3%). Most of the photos showed puddles of various size and shape, either on streets or on sidewalks, such as the puddle visible in
Figure 6C, and large puddles’ “traces,” such as those visible in
Figure 6A,B. The latter two observations are in
Figure 6A,B presented also on a map to provide a better insight into the topographic context. Regarding observations registered under types other than “heavy rainfall,” the participants observed debris or ice blocking water flows through drainage outlets. For instance, the observation in
Figure 6D was registered as “snowfall,” whereas the observation in
Figure 6E was registered as “seasonal observation.”
Most of the photos were taken at a certain distance from the objects in order to provide a view of their context, such as photo B in
Figure 6. A total of 128 (52%) out of 245 observations were made up to 20 m away from the mapped blue spots, and a further 73 photos (30%) were taken even farther away. Finally, 44 (18%) out of 245 observations were done within the mapped blue spots (e.g.,
Figure 6A).
In the post-walk questionnaire (Q2–QW), participants were asked to rate, on a scale from 1 (very incomplete) to 7 (very complete), how complete they thought the blue spots mapping was. The participants reported that the completeness was more than moderate, with an average score of 5.4. We also verified whether there were statistically significant differences in the rates of those who declared different reasons for selecting specific route suggestions. However, a Kruskal–Wallis H test (p = 0.894) did not provide evidence of differences between any of the pairs of rates for various reasons for selecting specific route suggestions.
Furthermore, in Q2–QW, the participants were asked to report on the unmapped blue spots they noted while walking. The participants reported on average 2.1 such places per walking trip. However, a Kruskal–Wallis H test (p = 0.831) did not provide evidence of differences between the numbers of reported unmapped blue spots for the various reasons for selecting specific route suggestions. We hypothesized that participants who avoided blue spots did not observe any.
4.5. The Assessment of the WayFinder Prototype Based on the Data Collected through Q3-SQ
We asked participants to rate from 1 (low usefulness) to 7 (high usefulness) how useful they found the WayFinder tool. The participants reported moderate usefulness, with an average score of 4.5. Furthermore, we wanted to know how satisfied they were when using the WayFinder tool, again on a scale from 1 (low satisfaction) to 7 (high satisfaction). They reported moderate satisfaction, with an average score of 3.8. We also asked the participants to rate from 1 (low) to 7 (high) the functionality of the tool. They reported slightly below moderate functionality, with an average score 3.4. Lastly, in the questionnaire, we asked about user groups that might be interested in using the tool. Wheelchair users, elderly people, and parents with young children in prams or strollers were identified as groups that would benefit most from using WayFinder.
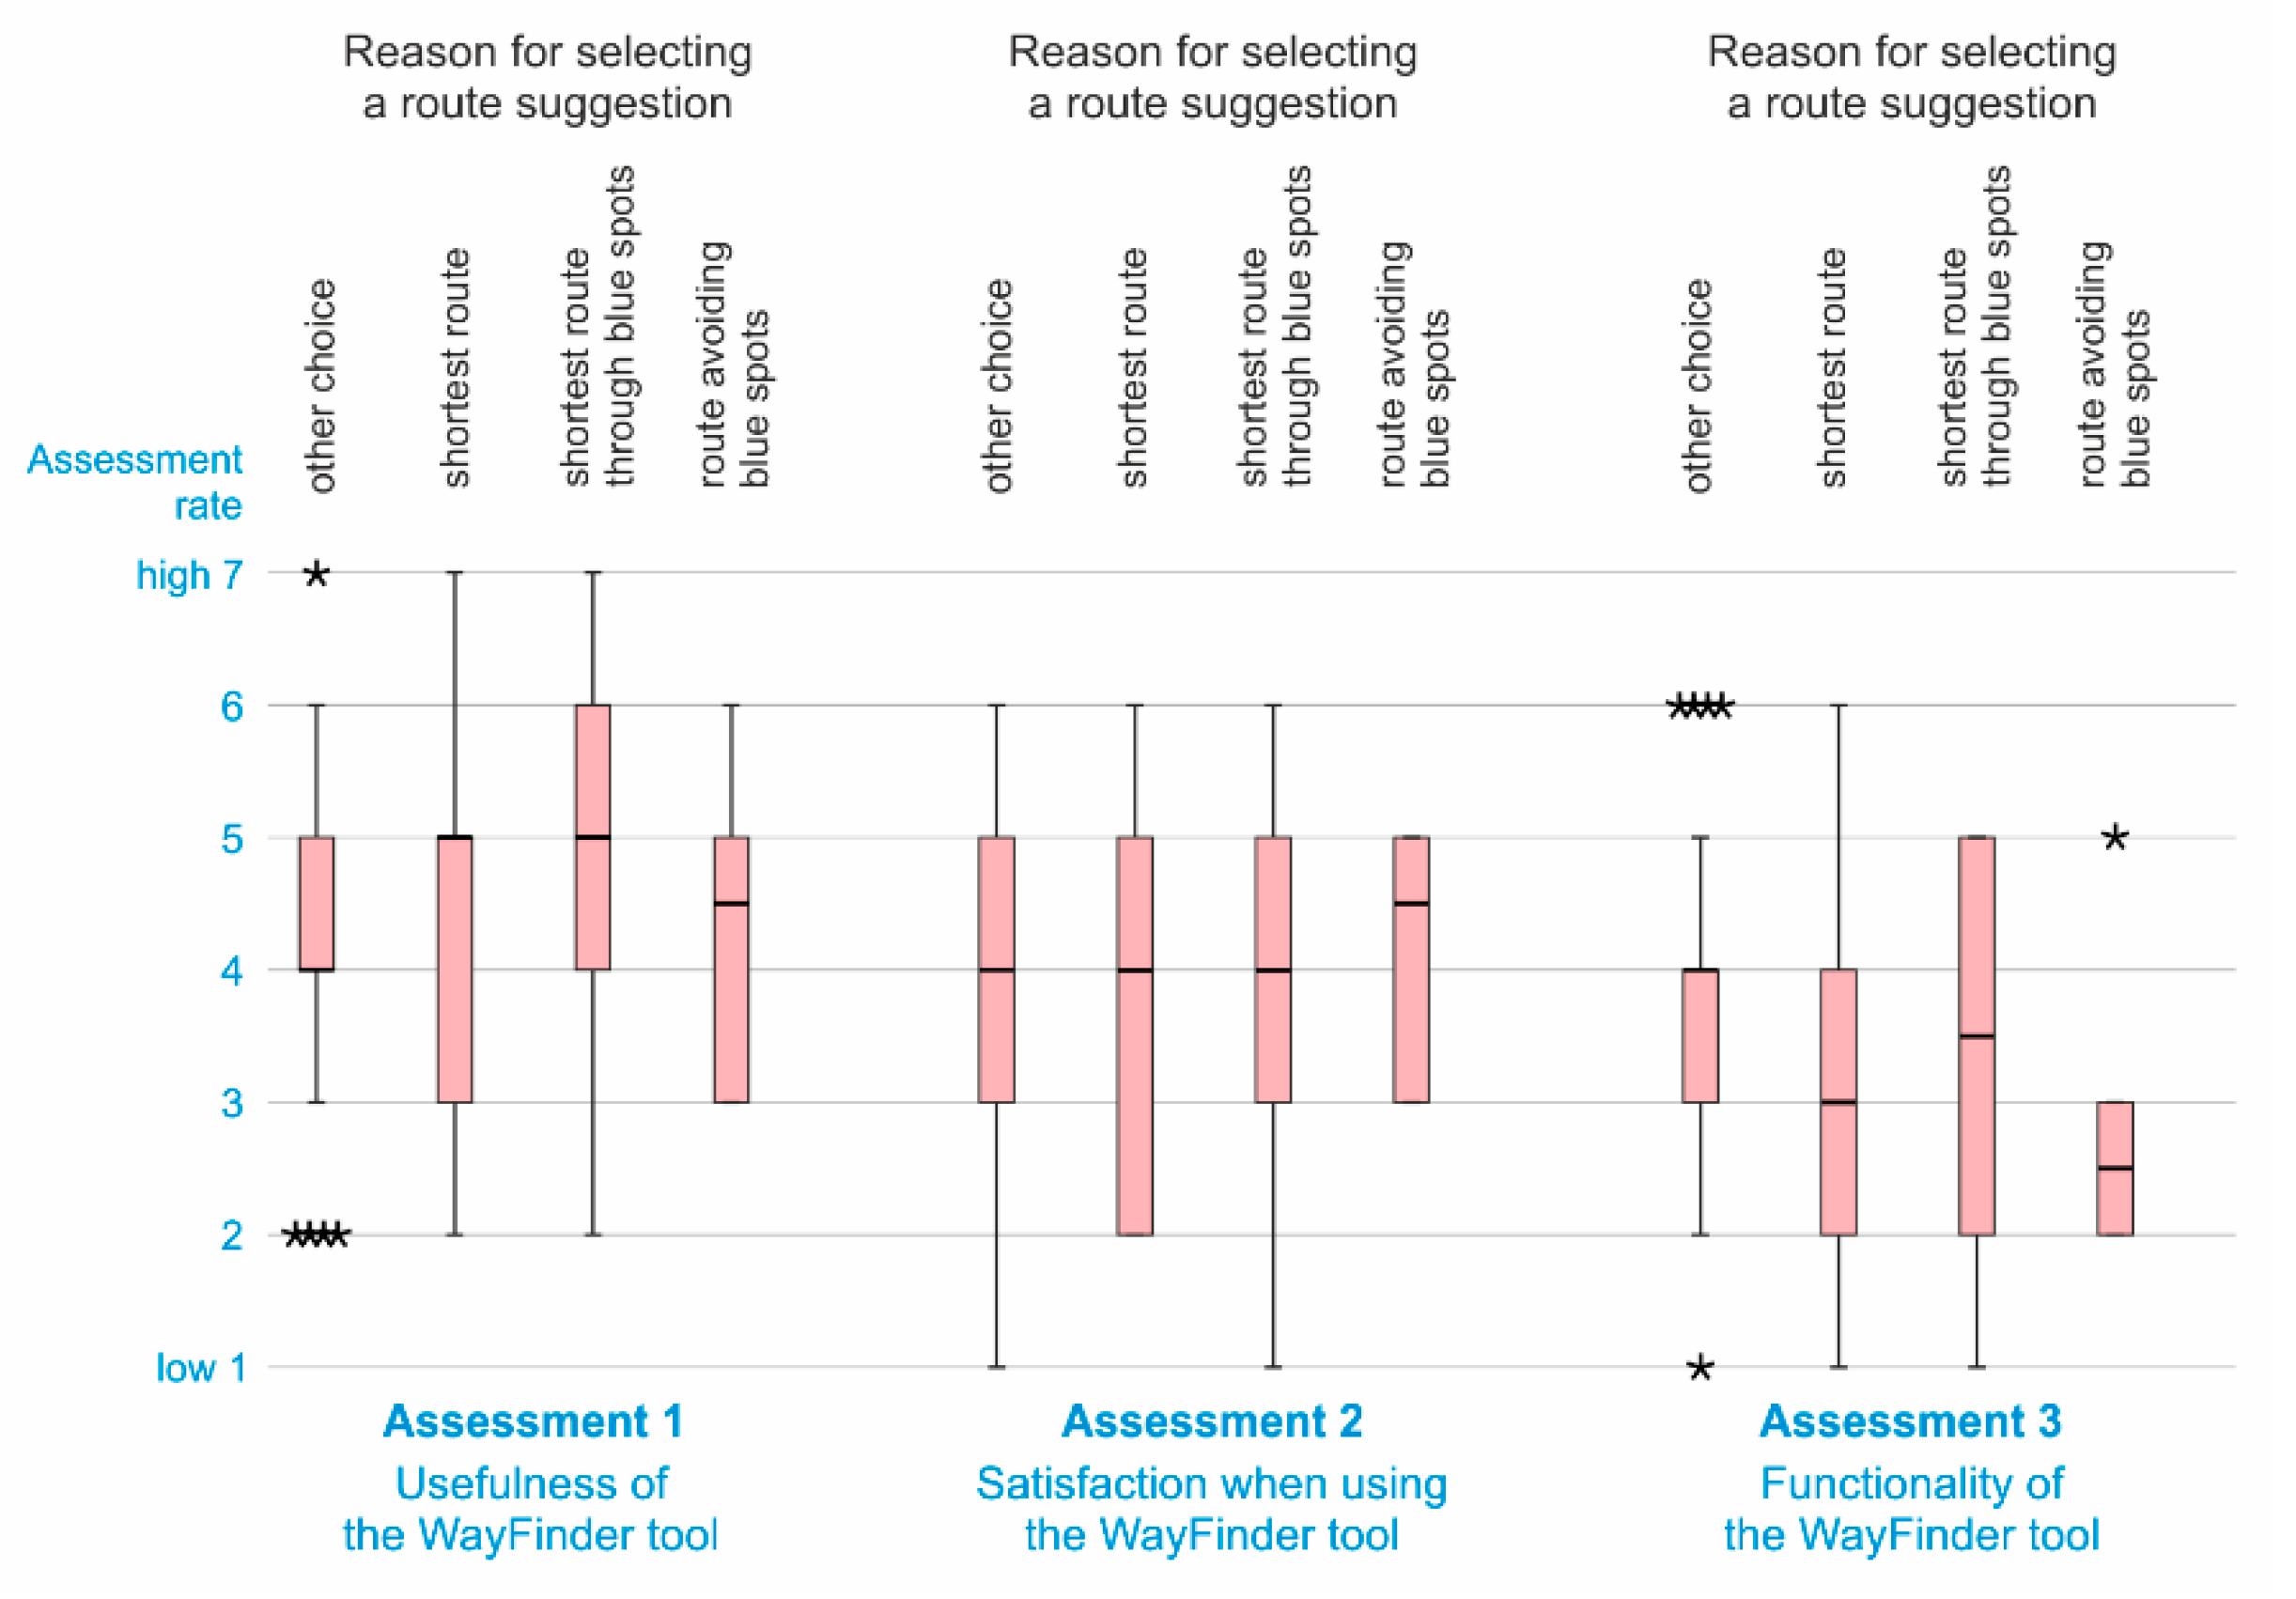
4.6. Walking Trip Choices and Assessments of the WayFinder Tool
We checked whether there were statistically significant differences in assessments of the tool given by participants who declared different reasons for selecting specific route suggestions. In general, the tool’s functionality had lower rates than the two remaining assessments (see Assessment 3 in
Figure 7). However, for the three considered assessments (i.e., usefulness of the WayFinder tool (
p = 0.204), satisfaction when using it (
p = 0.628), and functionality of the tool (
p = 0.216)), a Kruskal–Wallis H test did not provide any evidence of differences between any of pairs of assessment rates for various reasons given by participants for their selection of specific route suggestions.
4.7. Grouping Participants by Skill, Acquaintance, and Provided Assessment
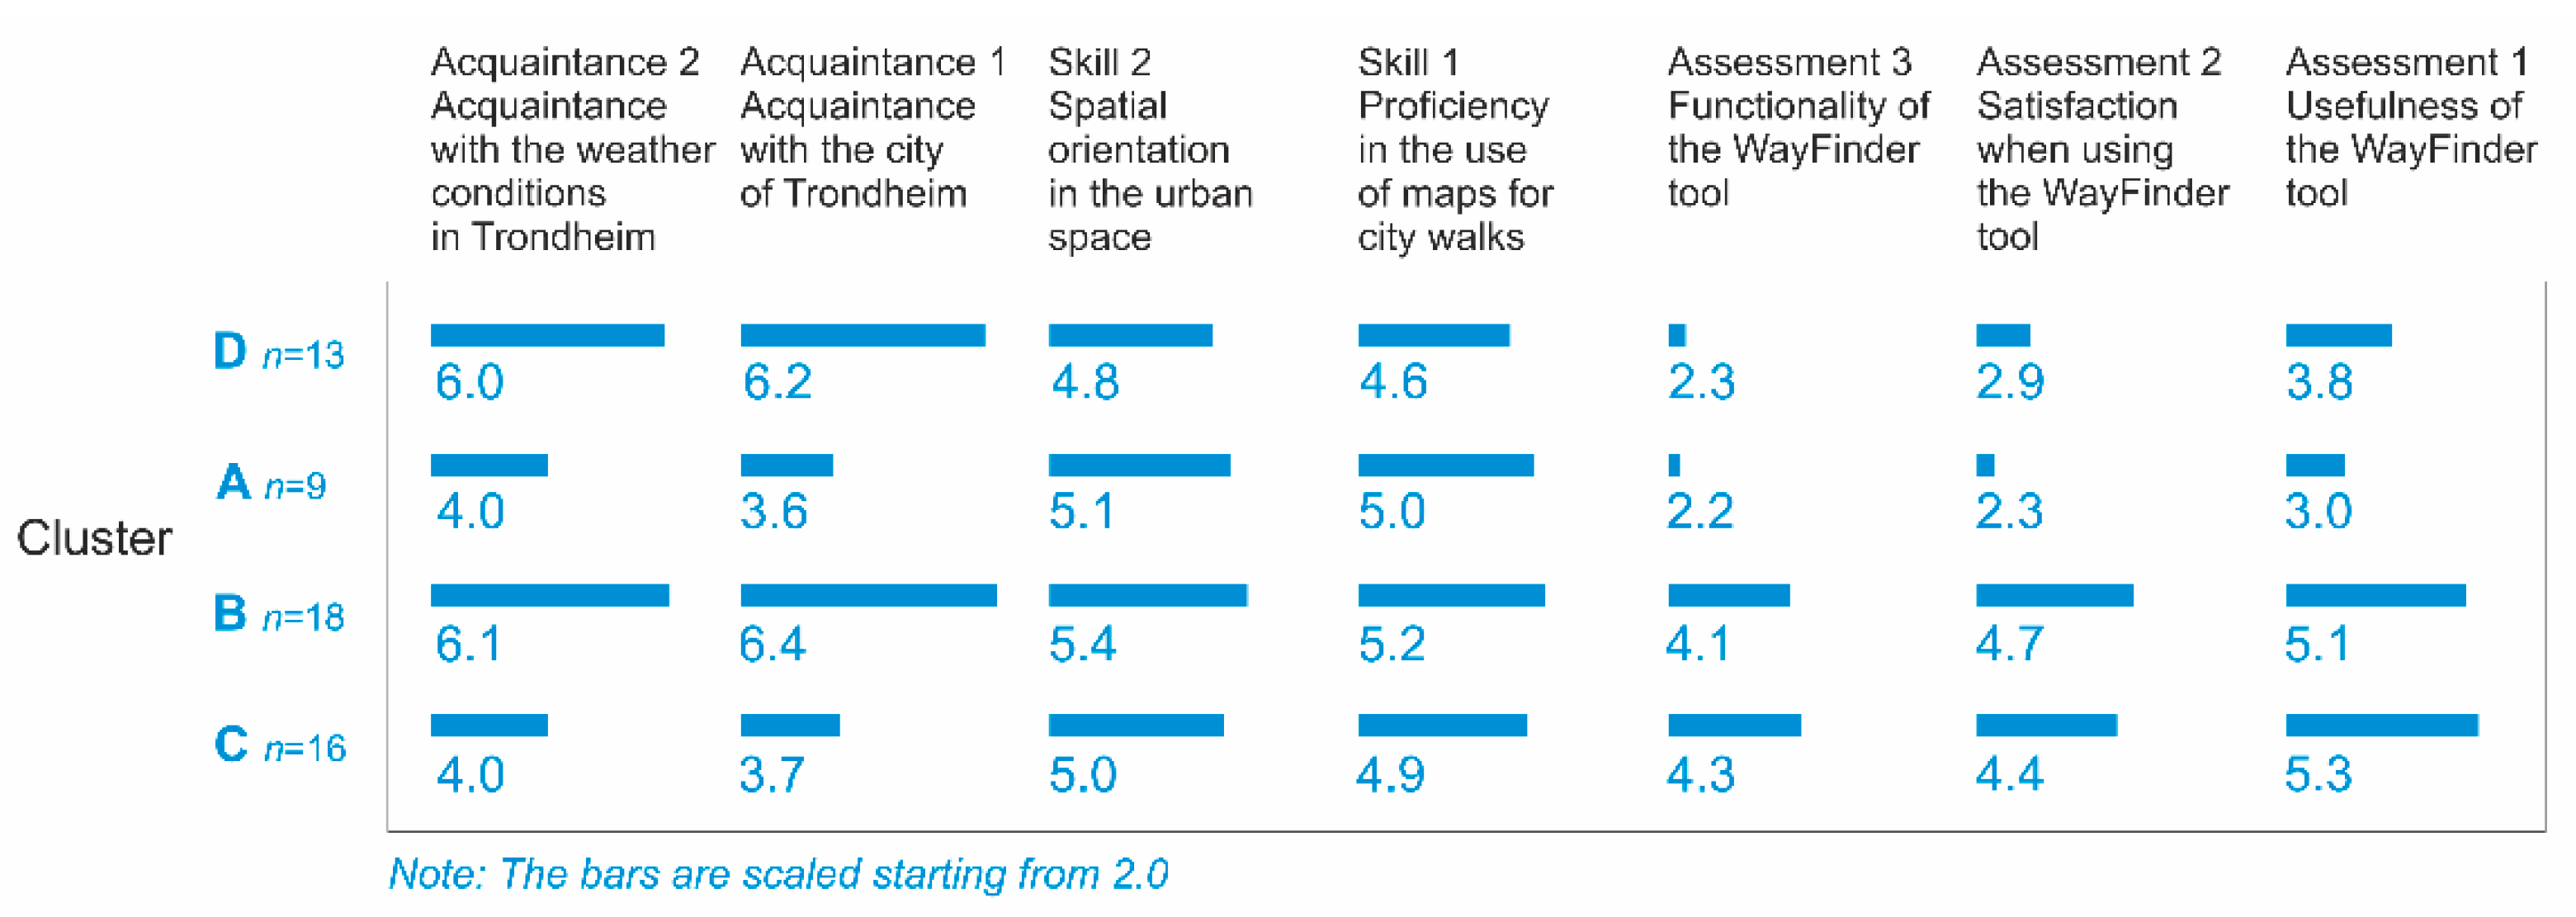
We partitioned 56 participants into groups of individuals who were similar in terms of their skills, acquaintances, and the assessments they had given. Each participant was characterized by a set of seven attributes consisting of the rates of the two skills, the two acquaintances, and the rates of the three assessments that we used in k-means clustering. The clustering analysis resulted in the partitioning that consisted of four groups A, B, C, and D, with 9, 18, 16, and 13 individuals, respectively. The clustering details with the mean values calculated based on participants’ scores are summarized in
Figure 8. Moreover, the rows and columns in
Figure 8 have been ordered so to emphasize the differences between the clusters.
Additionally, we checked the differences between the clusters in terms of the frequencies of selected route alternatives. However, a chi-square test did not reveal statistically significant association among four clusters and declared different reasons for selecting specific route suggestions (χ2 (9, N = 133) = 11.162, p = 0.265).
5. Results
The functionality of the WayFinder prototype was rated as slightly below the moderate level, regardless of the declared reasons for selecting specific route suggestions (Assessment 3 in
Figure 7). Since the prototype’s functionalities were limited to necessary interactive functions, this might have caused the provided rates. We also collected participants’ feedback on the tool’s usefulness and their satisfaction when using it. Regarding the latter, the participants reported a moderate level of satisfaction (Assessment 2 in
Figure 7) that might have been caused by using WayFinder simultaneously with the CitizenSensing tool to register observations. The usefulness of the tool was similarly rated as moderate (Assessment 1 in
Figure 7). We interpreted this feature as concerning the likelihood of the tool being used to support a specific user task, in this particular case pedestrian navigation in a city exposed to inundation. Therefore, the moderate score on usefulness was the finding of primary importance to our investigations.
The participants seldom selected a route that avoided blue spots. Selections to avoid blue spots were made in 9 out of 133 of the analyzed walks. Instead, most of the walks were taken along the route with the shortest parts intersecting blue spots or along the shortest route. Participants chose various route alternatives regardless of their capabilities in terms of their map-use skills, skills in spatial orientation, and familiarity with the weather conditions in Trondheim (
Figure 5). Furthermore, no statistically significant differences were observed for the participants’ assessments of the tool and the different reasons they gave for selecting specific routes (see
Figure 7).
The cluster analysis based on the empirical data collected from the subset of 56 participants allowed for a division into four “user profiles.” As shown in
Figure 8, all four clusters are similar in terms of map-use skills and skills in spatial orientation (for both, all mean scores were around 5). However, differences between clusters are visible for the participants’ acquaintance with Trondheim and the assessments they gave. Cluster C consists of individuals who declared a relatively low level of acquaintance with Trondheim and gave the highest scores on the assessment of the tool among the participants. In turn, cluster A consists of participants who did not know Trondheim neither and who gave the lowest ratings in the tool assessments. Further, participants who knew Trondheim well and gave relatively poor scores in their assessments of the tool constitute cluster D. Lastly, cluster B, consists of participants with the most even rates, with the best acquaintance with Trondheim, the best skills, and gave high scores in their assessment of the tool.
The data analysis revealed that both of the implemented routing APIs worked properly, without any technical failures. While the WayFinder prototype did not feature real time but only modeled data on areas likely to be inundated (i.e., “blue spots”), participants did not comment on the lack of such content and they rated the completeness of the map overlay showing the blue spots in Trondheim as slightly above the moderate level.
6. Discussion
6.1. Participants’ Perspectives on the WayFinder Routing Tool
The aim of this study was to gain participants’ perspectives on a routing tool designed to support pedestrians when navigating in potentially inundated urban areas. We hypothesized that users, especially those unfamiliar with Trondheim, would be willing to be assisted by ready-to-use and context aware route suggestions that incorporated information about either inaccessible or exposed spots. However, for the study purposes, the tested tool, WayFinder, was equipped with both a passive and active routing approach [
8]. While the former allowed users to examine (manually) suggested routes to avoid areas exposed to inundation, the latter was “automatized,” as outlined in the study by [
6], by providing context-aware routes that already avoided places likely to be inundated.
Our study reveals that participants seldom decided to walk along the route option that avoided potentially inundated areas. Instead, most of them used the passive routing approach, in which suggested routes intersected areas likely to have surface water accumulated. In fact, user photos showed puddles of various size along selected routes, none of which would seem to require re-routing by more than a few meters. However, the participants did not know about the conditions when selecting a route ahead of the walk, hence they did not know how many extra meters they would need to walk to keep they feet dry.
Since the participants were young individuals with moderate skills in terms of map use and spatial orientation, they felt confident enough to face potential difficulties. This enabled them to select potentially inundated routes and if they experienced difficulties in a certain place, they overcame them by analyzing local conditions and avoiding exposed spots. This claim can be backed up by the finding that when asked about their reason for selecting a route alternative, the participants with the highest scores on acquaintance with Trondheim more frequently selected “other choice” than “shortest route” in their responses (Acquaintance 1 in
Figure 5). This indicates that individuals who were familiar with Trondheim often decided to walk along a route they were already familiar with, e.g., “the route I usually take” or “the most favorable route on the way home.” Furthermore, we assumed that those who were unfamiliar with Trondheim would give a positive assessment of the tool. However, the cluster analysis revealed two groups of individuals unfamiliar with Trondheim, clusters A and C in
Figure 8. While cluster C consisted of individuals who gave, in fact, a positive assessment of the tool, cluster A consisted of participants who provided a negative assessment.
With respect to users’ perspectives on the WayFinder tool’s functionality, usefulness, and satisfaction—these were rated at a moderate level. The participants were generally successful in using the tool, since they all managed to register selected routes. However, some of them were not satisfied with the tool. This finding was also discovered in our cluster analysis, which revealed that two user groups (clusters A and D in
Figure 8) comprised participants who gave low ratings for the tool.
6.2. Implications of our Study to the Design of Navigation Systems for Pedestrians
The primary applicable suggestion for the design of a navigation system for pedestrians is the need of determining, which routing approach the users of the system prefer—the approach that suggests routes that avoid exposed areas or the approach that displays routes that pass through such areas and provides information to the users about the risk. Furthermore, although the participants did not provide an overly positive assessment of the WayFinder tool, several design suggestions could make the passive system more useful. For example, route suggestions symbolized as lines were sometimes displayed on the WayFinder map as superimposed. This problem needs to be addressed in the future development, since superimposed line symbols along with the small screen size of portable devices, might be experienced as uncomfortable for some individuals and therefore might cause confusion when using the tool. Moreover, route suggestions, apart from the map display, can be presented in an adjacent visual component that shows them as cross-sections of a specific attribute space, such as terrain steepness, air temperature, or noise. Generally, the functionality of a passive system depends on user capabilities. The tool can provide users with available information and can be equipped with various interaction techniques. However, it is always the user who determines whether the tool is experienced as cognitively overloaded [
29] and to what extent the provided functionality is comprehensible. In turn, if the route planner is developed based on an active routing framework, necessary data are incorporated in the route calculations. In that case, a successful functionality will depend on the algorithms being able to provide the user with a smart final routing suggestion without necessarily offering any additional background information. In practice, such background information can also be displayed. Nevertheless, as already incorporated during the algorithm formulation stage, this would not require specific attention by the users.
We were also interested in the challenges of using modeled data in navigation systems for pedestrians to show areas likely to be inundated, to enable pedestrians to avoid such areas in actual conditions. The study revealed that such data was considered complete and could well represent areas that are likely to be inundated. Our collected documentation (photos) and the assessment of the blue spot mapping suggest that such data can be valuable content in routing systems that are designed to enable users to avoid exposed areas. Although we assumed that such content would feature shortcomings and therefore crowd-generated real-time observations on inundated areas and their impacts on humans and environments would be unavoidable, the study revealed that such data can be replaced by modeled data. Therefore, in the case of uneven distribution of reported observations collected as volunteered geographic information [
30] or a possible lack of specific real-time data for certain areas, data on historical events such as floods can be a substitute and can help to determine areas that should be avoided.
6.3. Research Limitations and Future Steps
The above outcomes concern the context of our specific participants and cannot be considered for other user groups, which would require targeted user studies. Repeating the same study with vulnerable users such as wheelchair users, elderly people, and parents with young children with strollers requires different user study designs. For instance, “blue spots” are not the only obstacle for wheelchair users since also stairs and steep sidewalks may need to be included in the routing mechanism as objects to be avoided in route suggestions. In another example, exposure to heat and steep sidewalks may need to be included if a study with the elderly is to be organized. Unless, practical usage of WayFinder is replaced with other empirical methods such as interviews or focus groups that do not require conducting waking trips in exposed areas. However, then, the tool would be tested “theoretically” not “practically.” Involving young individuals as participants seems to be a good compromise to, on the one hand, skip other exposures in the study design that can influence the routing decisions, and, on the other hand, be able to test the tool practically.
It needs to be emphasized that organizing a user study of WayFinder in the conditions of a real risk to human beings, for example, during severe flooding, heavy rain, or thunderstorm, is hardly possible as human health can be endangered. Even during “moderately sever conditions”, user studies with the user groups identified to benefit most from using WayFinder such as parents with strollers, the elderly, or wheelchair users seem to be infeasible due to safety and ethical reasons. For instance, if a user would select a walkway that WayFinder presented as free of surface water, which due to specific circumstances nevertheless might be inundated, the consequence of such a misleading routing suggestion could be dramatic, especially if a user needs to quickly escape an exposed area. Therefore, this study was designed as a proxy of the conditions of environmental exposure, with the assumption that no real risk could be included in the user study and participants’ safety was prioritized.
7. Conclusions
Although context-aware routing tools are increasingly feasible, the literature largely avoids human factors in the discussion. A question arises as to what extent users find such tools of value to their needs. Why would individuals use such tools? A specific example is applications to assist pedestrians when navigating in exposed areas such as those likely to have surface water accumulated.
In our empirical study, most of the participants were successful in using the WayFinder prototype. The tool’s modeled data content on areas likely to be inundated was recognized as representing such places well. Nevertheless, our participants preferred shortest path routes regardless of modeled or real-world conditions. This implies, that the participants of this study preferred the selection of routes that passed through areas likely to be inundated and obtaining information about the risks rather than selecting a single route suggestion that already avoided exposed areas. This may suggest that when navigating through areas likely to be inundated, pedestrians assisted by a navigation tool prefer to keep control over their decisions and thus, rely on their analytical skills and local knowledge rather than to follow a specific suggestion provided by a tool.
The main contribution of our study is in demonstrating the proof-of-concept implementation of the pedestrian route planner WayFinder and testing it empirically with potential users. Moreover, since we used broadly available technologies to build our route planner for pedestrians and equipped it with modeled data on areas likely to be inundated that can be prepared also for other places, Wayfinder can be easily developed for other cities and for other adverse environmental conditions. Furthermore, the concept of the tool can be inspiring for all those who plan to develop similar tools for other user groups. In that case, it is of primary importance to mapmakers and to all those who design map-based navigation tools to obtain insights into what routing approaches are considered desirable by users—in other words, solutions that suggest routes that avoid exposed areas (“active route planners”) or those that display routes that pass through such areas and provide information about the risks involved (“passive route planners”).
Author Contributions
Conceptualization, Tomasz Opach, Carlo Navarra, Jan Ketil Rød and Tina-Simone Neset; methodology, Tomasz Opach, Jan Ketil Rød and Carlo Navarra; software, Carlo Navarra and Tomasz Opach; validation and formal analysis, Tomasz Opach and Carlo Navarra; investigation, Tomasz Opach and Carlo Navarra; resources, Carlo Navarra and Tomasz Opach; data curation, Tomasz Opach and Carlo Navarra; writing—original draft preparation, Tomasz Opach and Carlo Navarra; writing—review and editing, Jan Ketil Rød and Tina-Simone Neset; visualization, Carlo Navarra and Tomasz Opach; project administration, Tina-Simone Neset; funding acquisition, Tina-Simone Neset and Jan Ketil Rød. All authors have read and agreed to the published version of the manuscript.
Funding
This research is part of the project ‘Citizen Sensing—Urban Climate Resilience through Participatory Risk Management Systems’ that is part of ERA4CS, an ERA-NET initiated by JPI Climate, and funded by FCT (Portugal), FORMAS (Sweden, Grant no. 2017-01719), NWO (The Netherlands), and RCN (Norway, Grant 274192) with co-funding by the European Union (Grant 690462).
Institutional Review Board Statement
Informed Consent Statement
Informed consent was obtained from all subjects involved in the study.
Data Availability Statement
The data presented in this study are available on request from the corresponding author.
Conflicts of Interest
The authors declare no conflict of interest. The funders had no role in the design of the study; in the collection, analyses, or interpretation of data; in the writing of the manuscript, or in the decision to publish the results.
References
- Bauer, R.; Delling, D.; Sanders, P.; Schieferdecker, D.; Schultes, D.; Wagner, D. Combining hierarchical and goal-directed speed-up techniques for dijkstra’s algorithm. J. Exp. Algorithmics 2010, 15, 23. [Google Scholar] [CrossRef] [Green Version]
- Kanoh, H. Dynamic route planning for car navigation systems using virus genetic algorithms. Int. J. Knowl. Based Intell. Eng. Syst. 2007, 11, 65–78. [Google Scholar] [CrossRef] [Green Version]
- Kerkman, K.; Arentze, T.; Borgers, A.; Kemperman, A. Car Drivers’ Compliance with Route Advice and Willingness to Choose Socially Desirable Routes. Transp. Res. Rec. J. Transp. Res. Board 2012, 2322, 102–109. [Google Scholar] [CrossRef] [Green Version]
- Rothkrantz, L.J.M. Dynamic Routing Using the Network of Car Drivers. In Proceedings of the 2009 Euro American Conference on Telematics and Information Systems New Opportunities to Increase Digital Citizenship, EATIS ’09, Prague, Czech Republic, 3–5 June 2009; Association for Computing Machinery (ACM): New York, NY, USA, 2009. [Google Scholar] [CrossRef]
- Holone, H.; Misund, G.; Holmstedt, H. Users Are Doing It for Themselves: Pedestrian Navigation with User Generated Content. In Proceedings of the International Conference on Next Generation Mobile Applications, Services and Technologies, NGMAST 2007, Cardiff, UK, 12–14 September 2007; IEEE Computer Society: Los Alamitos, CA, USA, 2007; pp. 91–99. [Google Scholar] [CrossRef] [Green Version]
- Rußig, J.; Bruns, J. Reducing Individual Heat Stress through Path Planning. GI Forum 2017, 1, 327–340. [Google Scholar] [CrossRef] [Green Version]
- Citizen Sensing—Urban Climate Resilience through Participatory Risk Management System. Available online: http://citizensensing.eu (accessed on 28 May 2021).
- Opach, T.; Navarra, C.; Rød, J.K.; Neset, T.-S. Towards a Route Planner Supporting Pedestrian Navigation in Hazard Exposed Urban Areas. In Proceedings of the 17th International Conference on Information Systems for Crisis Response and Management, ISCRAM, Blacksburg, VA, USA, 24–27 May 2020; pp. 517–528. [Google Scholar]
- Gavalas, D.; Kasapakis, V.; Konstantopoulos, C.; Pantziou, G.; Vathis, N. Scenic route planning for tourists. Pers. Ubiquitous Comput. 2017, 21, 137–155. [Google Scholar] [CrossRef]
- Novack, T.; Wang, Z.; Zipf, A. A System for Generating Customized Pleasant Pedestrian Routes Based on OpenStreetMap Data. Sensors 2018, 18, 3794. [Google Scholar] [CrossRef] [PubMed] [Green Version]
- Teslya, N. Web mapping service for mobile tourist guide. In Proceedings of the 15th Conference of Open Innovations Association FRUCT, St. Petersburg, Russia, 21–25 April 2014; IEEE Computer Society: Los Alamitos, CA, USA, 2014; pp. 135–143. [Google Scholar] [CrossRef]
- Hochmair, H. Decision Support for Bicycle Route Planning in Urban Environments. In Proceedings of the 7th AGILE Conference on Geographic Information Science, Heraklion, Greece, 29 April–1 May 2004; Crete University Press: Heraklion, Greece, 2004; pp. 697–706. [Google Scholar]
- Arenghi, A.; Belometti, S.; Brignoli, F.; Fogli, D.; Gentilin, F.; Plebani, N. UniBS4All: A Mobile Application for Accessible Wayfinding and Navigation in an Urban University Campus. In Proceedings of the 4th EAI International Conference on Smart Objects and Technologies for Social Good, Goodtechs ’18, Bologna, Italy, 28–30 November 2018; Association for Computing Machinery (ACM): New York, NY, USA, 2018; pp. 124–129. [Google Scholar] [CrossRef]
- Yin, Y.; Xia, J.; Li, Y.; Xu, Y.; Xu, W.; Yu, L. Group-Wise Itinerary Planning in Temporary Mobile Social Network. IEEE Access 2019, 7, 83682–83693. [Google Scholar] [CrossRef]
- Tan, G.; Chan, G. Crisis Management Simulation: Traffic Evacuation. In Proceedings of the Second Asia International Conference on Modelling & Simulation (AMS), Kuala Lumpur, Malaysia, 13–15 May 2008; IEEE Computer Society: Los Alamitos, CA, USA, 2008; pp. 696–701. [Google Scholar] [CrossRef]
- Garau, C.; Annunziata, A.; Yamu, C. A walkability assessment tool coupling multi-criteria analysis and space syntax: The case study of Iglesias, Italy. Eur. Plan. Stud. 2020, 1–23. [Google Scholar] [CrossRef]
- Lo, R.H. Walkability: What is it? J. Urban. Int. Res. Placemaking Urban Sustain. 2009, 2, 145–166. [Google Scholar] [CrossRef]
- Campisi, T.; Basbas, S.; Tesoriere, G.; Trouva, M.; Papas, T.; Mrak, I. How to Create Walking Friendly Cities. A Multi-Criteria Analysis of the Central Open Market Area of Rijeka. Sustainability 2020, 12, 9470. [Google Scholar] [CrossRef]
- Martins, T.A.; Adolphe, L.; Bonhomme, M.; Bonneaud, F.; Faraut, S.; Ginestet, S.; Michel, C.; Guyard, W. Impact of Urban Cool Island measures on outdoor climate and pedestrian comfort: Simulations for a new district of Toulouse, France. Sustain. Cities Soc. 2016, 26, 9–26. [Google Scholar] [CrossRef]
- Melnikov, V.; Krzhizhanovskaya, V.V.; Sloot, P.M. Models of Pedestrian Adaptive Behaviour in Hot Outdoor Public Spaces. Procedia Comput. Sci. 2017, 108, 185–194. [Google Scholar] [CrossRef]
- Yoshida, T.; Yamagata, Y.; Murakami, D. Individual Level Heat Risk Evaluation Using GPS Towards Smart Navigation System. In Proceedings of the ICA; Copernicus GmbH: Göttingen, Germany, 2019. [Google Scholar] [CrossRef]
- Russo, B.; Gómez, M.; Macchione, F. Pedestrian hazard criteria for flooded urban areas. Nat. Hazards 2013, 69, 251–265. [Google Scholar] [CrossRef]
- Rød, J.; Maarse, M. Using Citizen Sensing to Identify Heat-Exposed Neighbourhoods. Urban Sci. 2021, 5, 14. [Google Scholar] [CrossRef]
- Skrede, T.I.; Muthanna, T.M.; Alfredesen, K. Applicability of urban streets as temporary open floodways. Hydrol. Res. 2020, 51, 621–634. [Google Scholar] [CrossRef]
- Balstroem, T.; Crawford, D. Arc-Malstrøm: A 1D hydrologic screening method for stormwater assessments based on geometric networks. Comput. Geosci. 2018, 116, 64–73. [Google Scholar] [CrossRef]
- Beeharee, A.K.; Steed, A. A Natural Wayfinding Exploiting Photos in Pedestrian Navigation Systems. In Proceedings of the 8th Conference on Human-Computer Interaction with Mobile Devices and Services, MobileHCI ’06, Espoo, Finland, 12–15 September 2006; Association for Computing Machinery (ACM): New York, NY, USA, 2006; pp. 81–88. [Google Scholar] [CrossRef]
- Fuest, S.; Grüner, S.; Vollrath, M.; Sester, M. Evaluating the effectiveness of different cartographic design variants for influencing route choice. Cartogr. Geogr. Inf. Sci. 2021, 48, 169–185. [Google Scholar] [CrossRef]
- Larsen, M.; Nielsen, N.H.; Rasmussen, S.F. The Blue Spot Model: Development of a Screening Method to Assess Flood Risk on National Roads and Highway System; Danish Road Institute Report No. 183; Road Directorate: Fløng, Denmark, 2010. [Google Scholar]
- Bunch, R.L.; Lloyd, R.E. The Cognitive Load of Geographic Information. Prof. Geogr. 2006, 58, 209–220. [Google Scholar] [CrossRef]
- Goodchild, M.F. Citizens as sensors: The world of volunteered geography. Geojournal 2007, 69, 211–221. [Google Scholar] [CrossRef] [Green Version]
| Publisher’s Note: MDPI stays neutral with regard to jurisdictional claims in published maps and institutional affiliations. |
© 2021 by the authors. Licensee MDPI, Basel, Switzerland. This article is an open access article distributed under the terms and conditions of the Creative Commons Attribution (CC BY) license (https://creativecommons.org/licenses/by/4.0/).


