
Paradigm of Geological Mapping of the Adıyaman Fault Zone of Eastern Turkey Using Landsat 8 Remotely Sensed Data Coupled with PCA, ICA, and MNFA Techniques

 ,
,  ,
,  ,
, 
Abstract
:1. Introduction
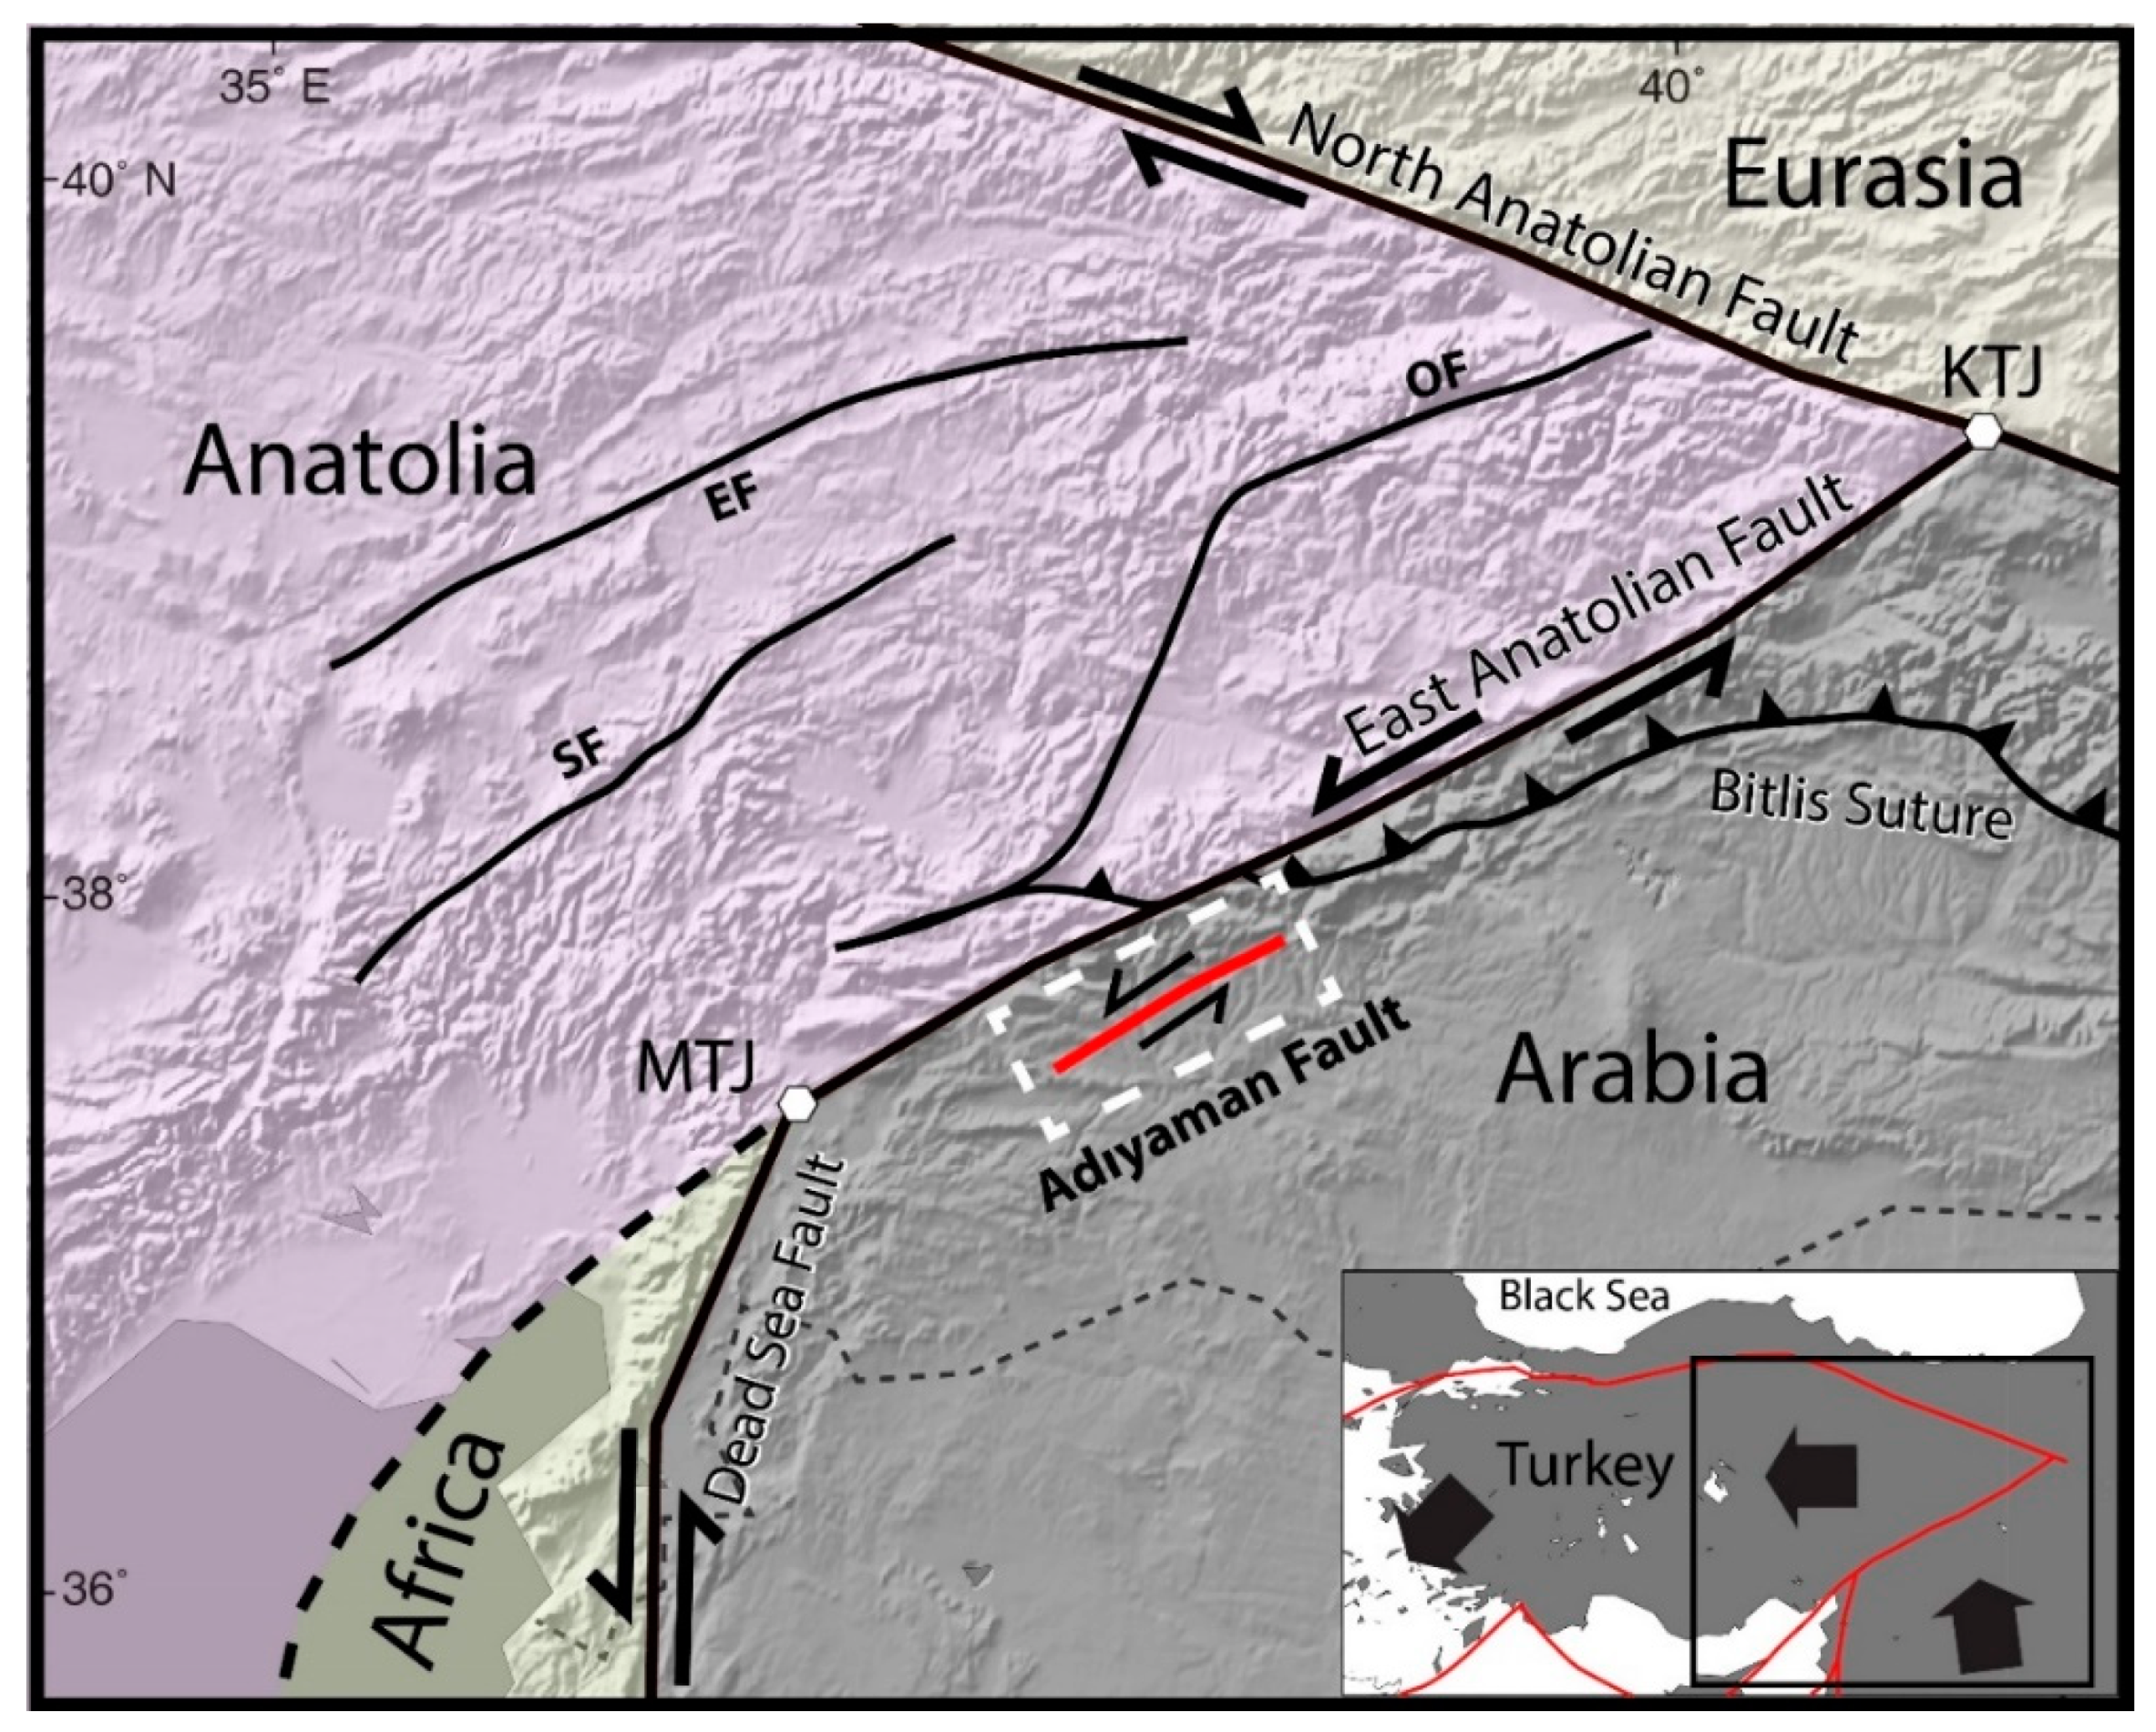
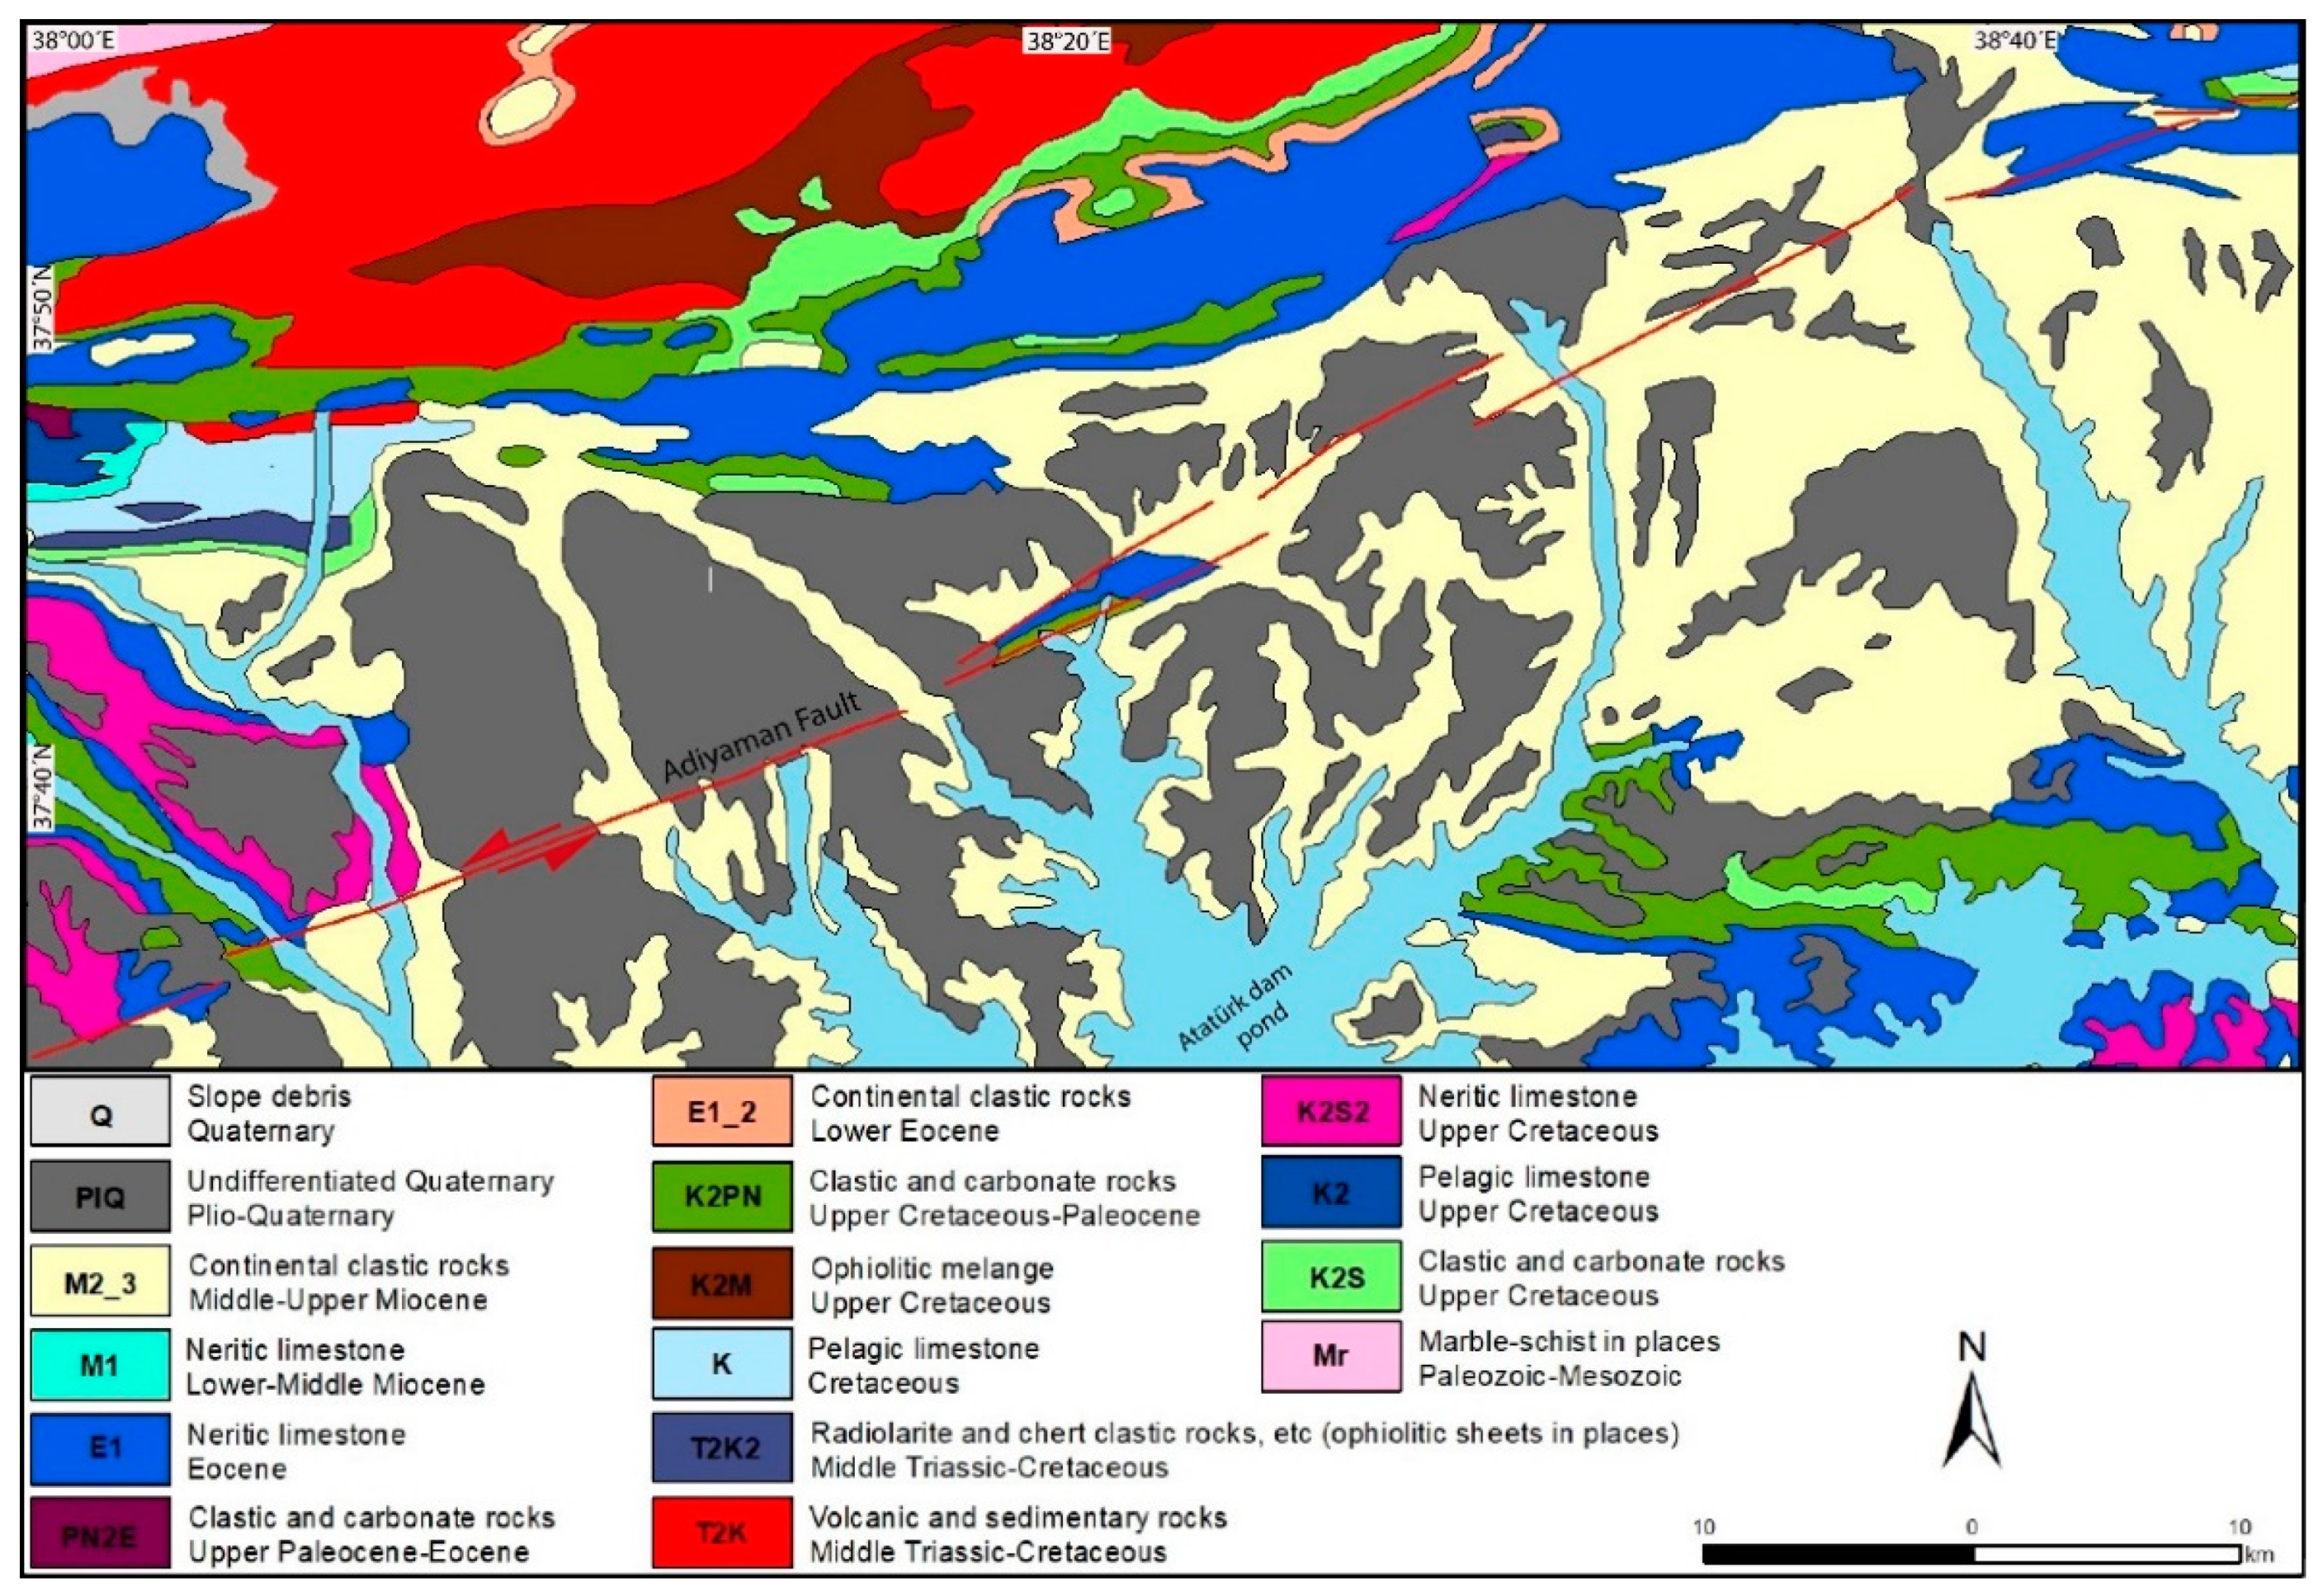
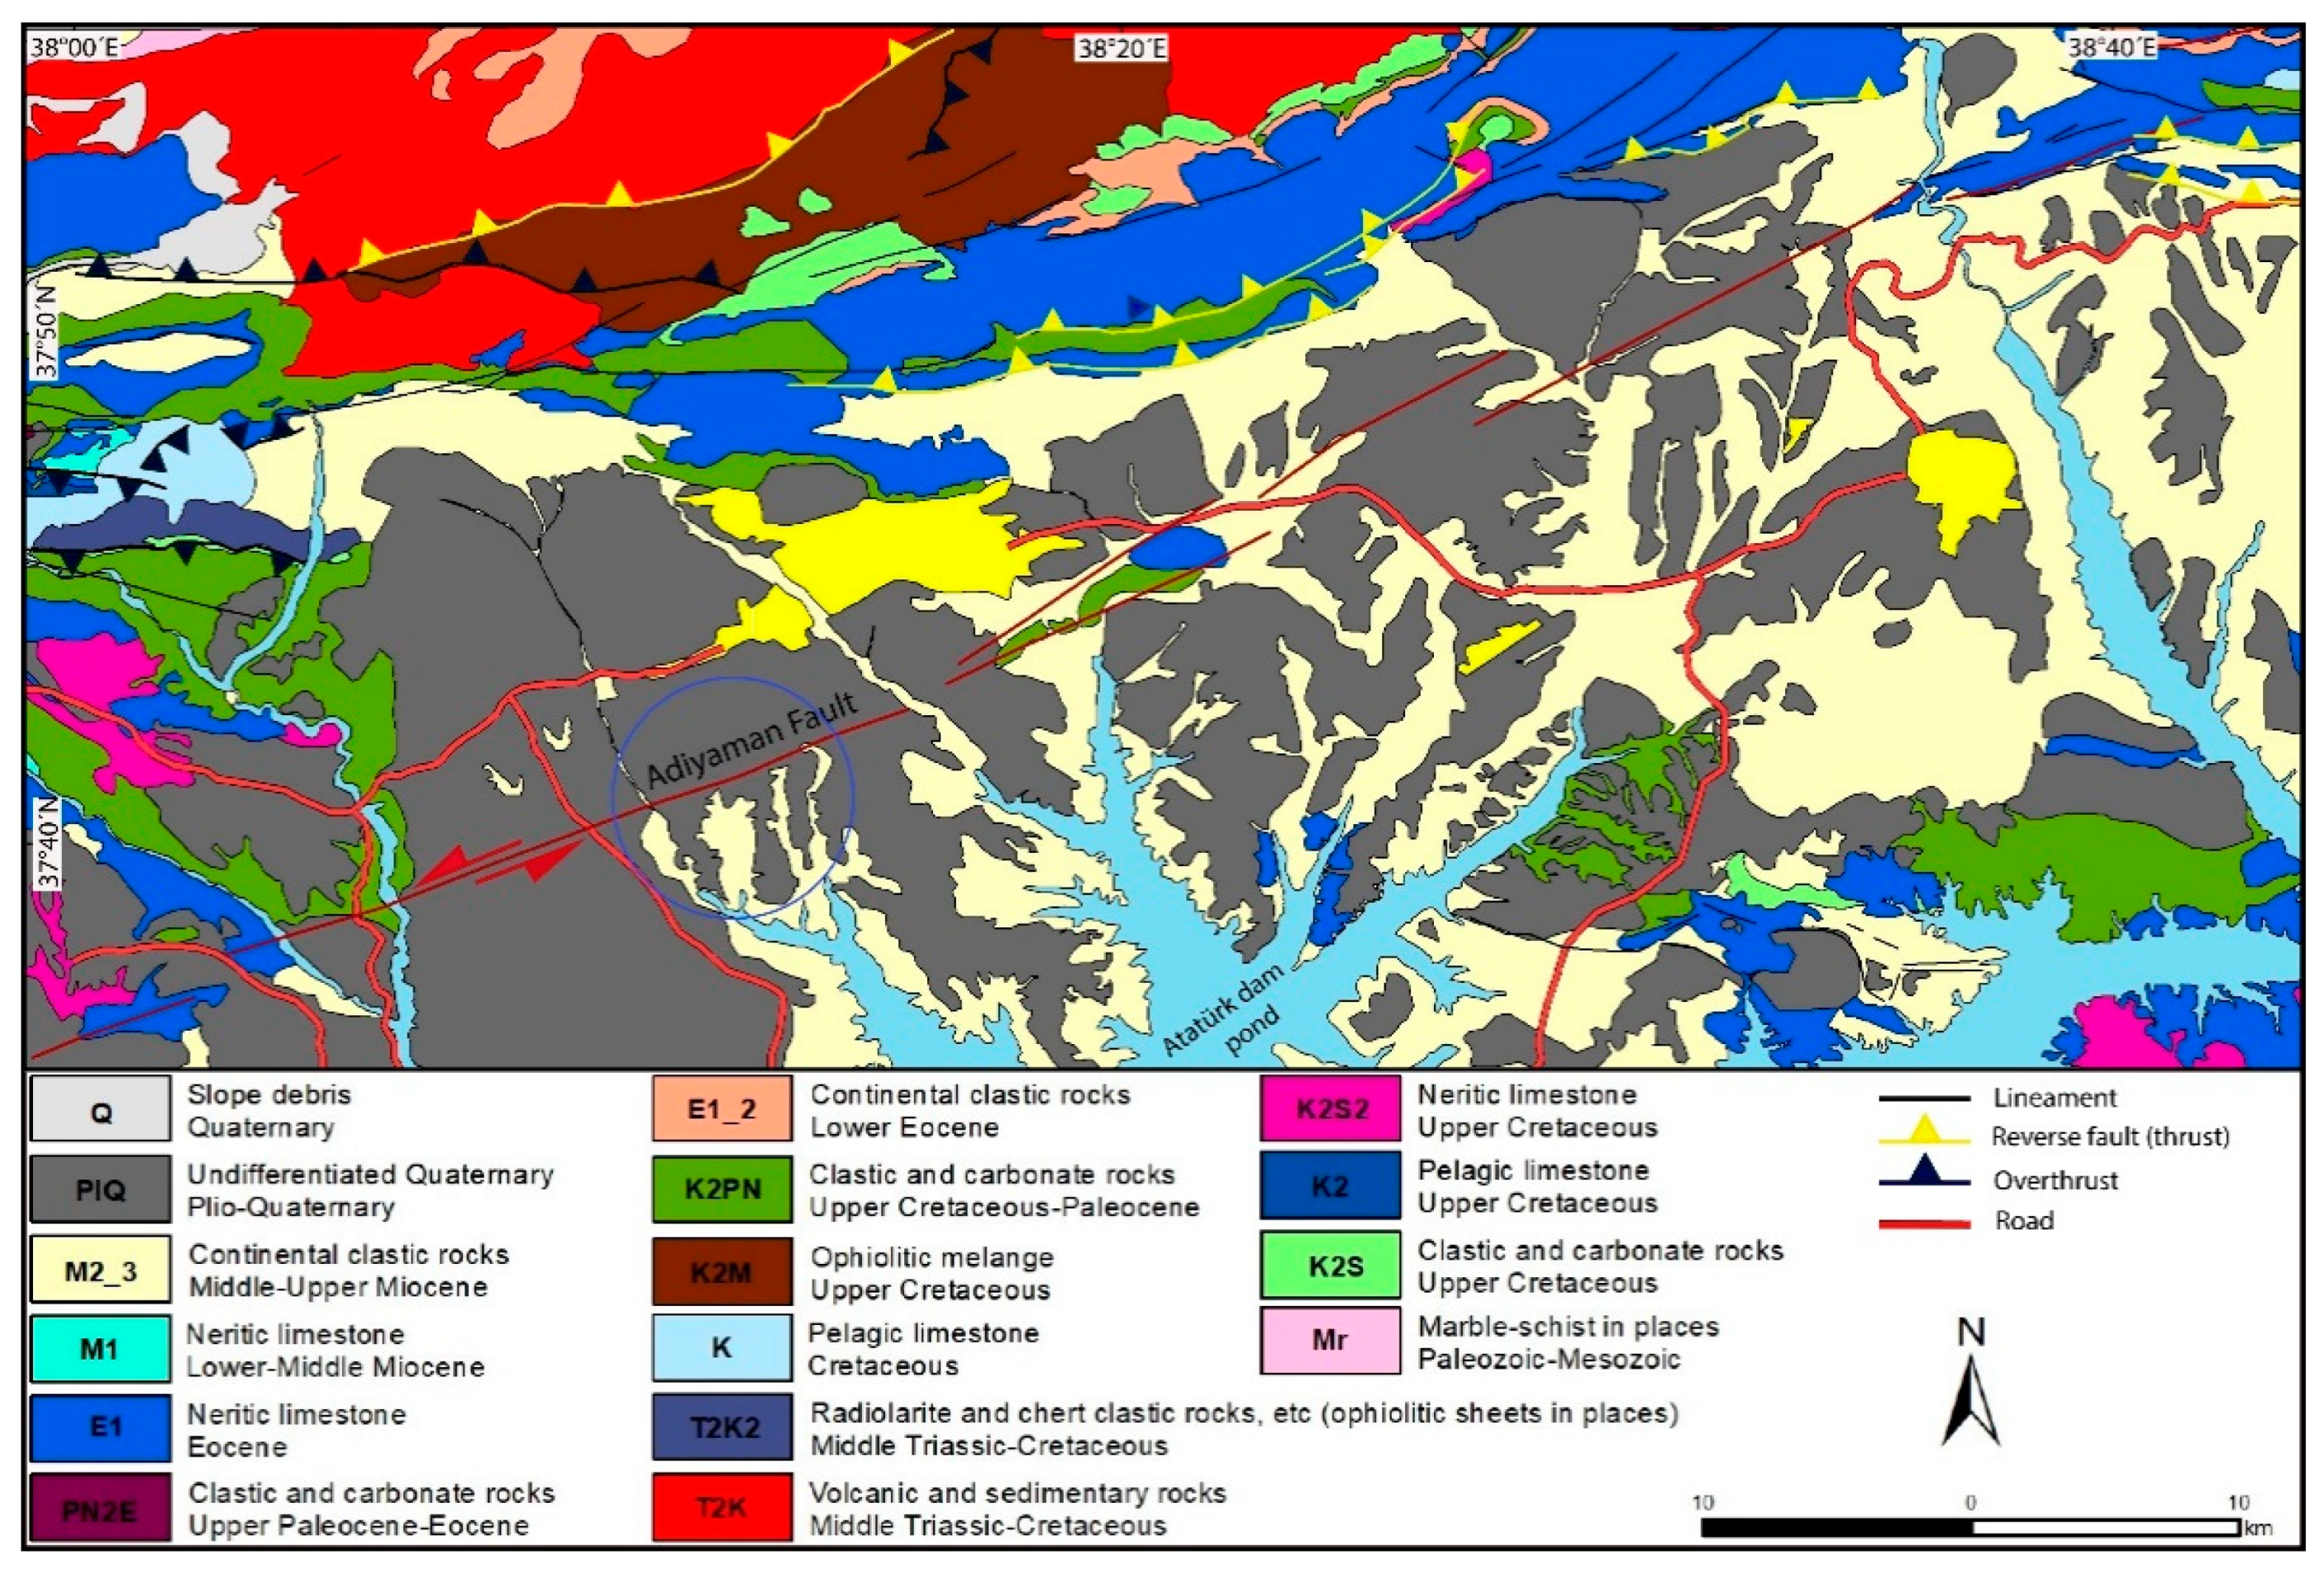
2. Geologic Setting

3. Data
4. Methodology
4.1. Image Preprocessing
4.2. Image Processing and Enhancement
4.2.1. Principal and Independent Component Analysis
4.2.2. Minimum Noise Fraction Analysis (MNFA)
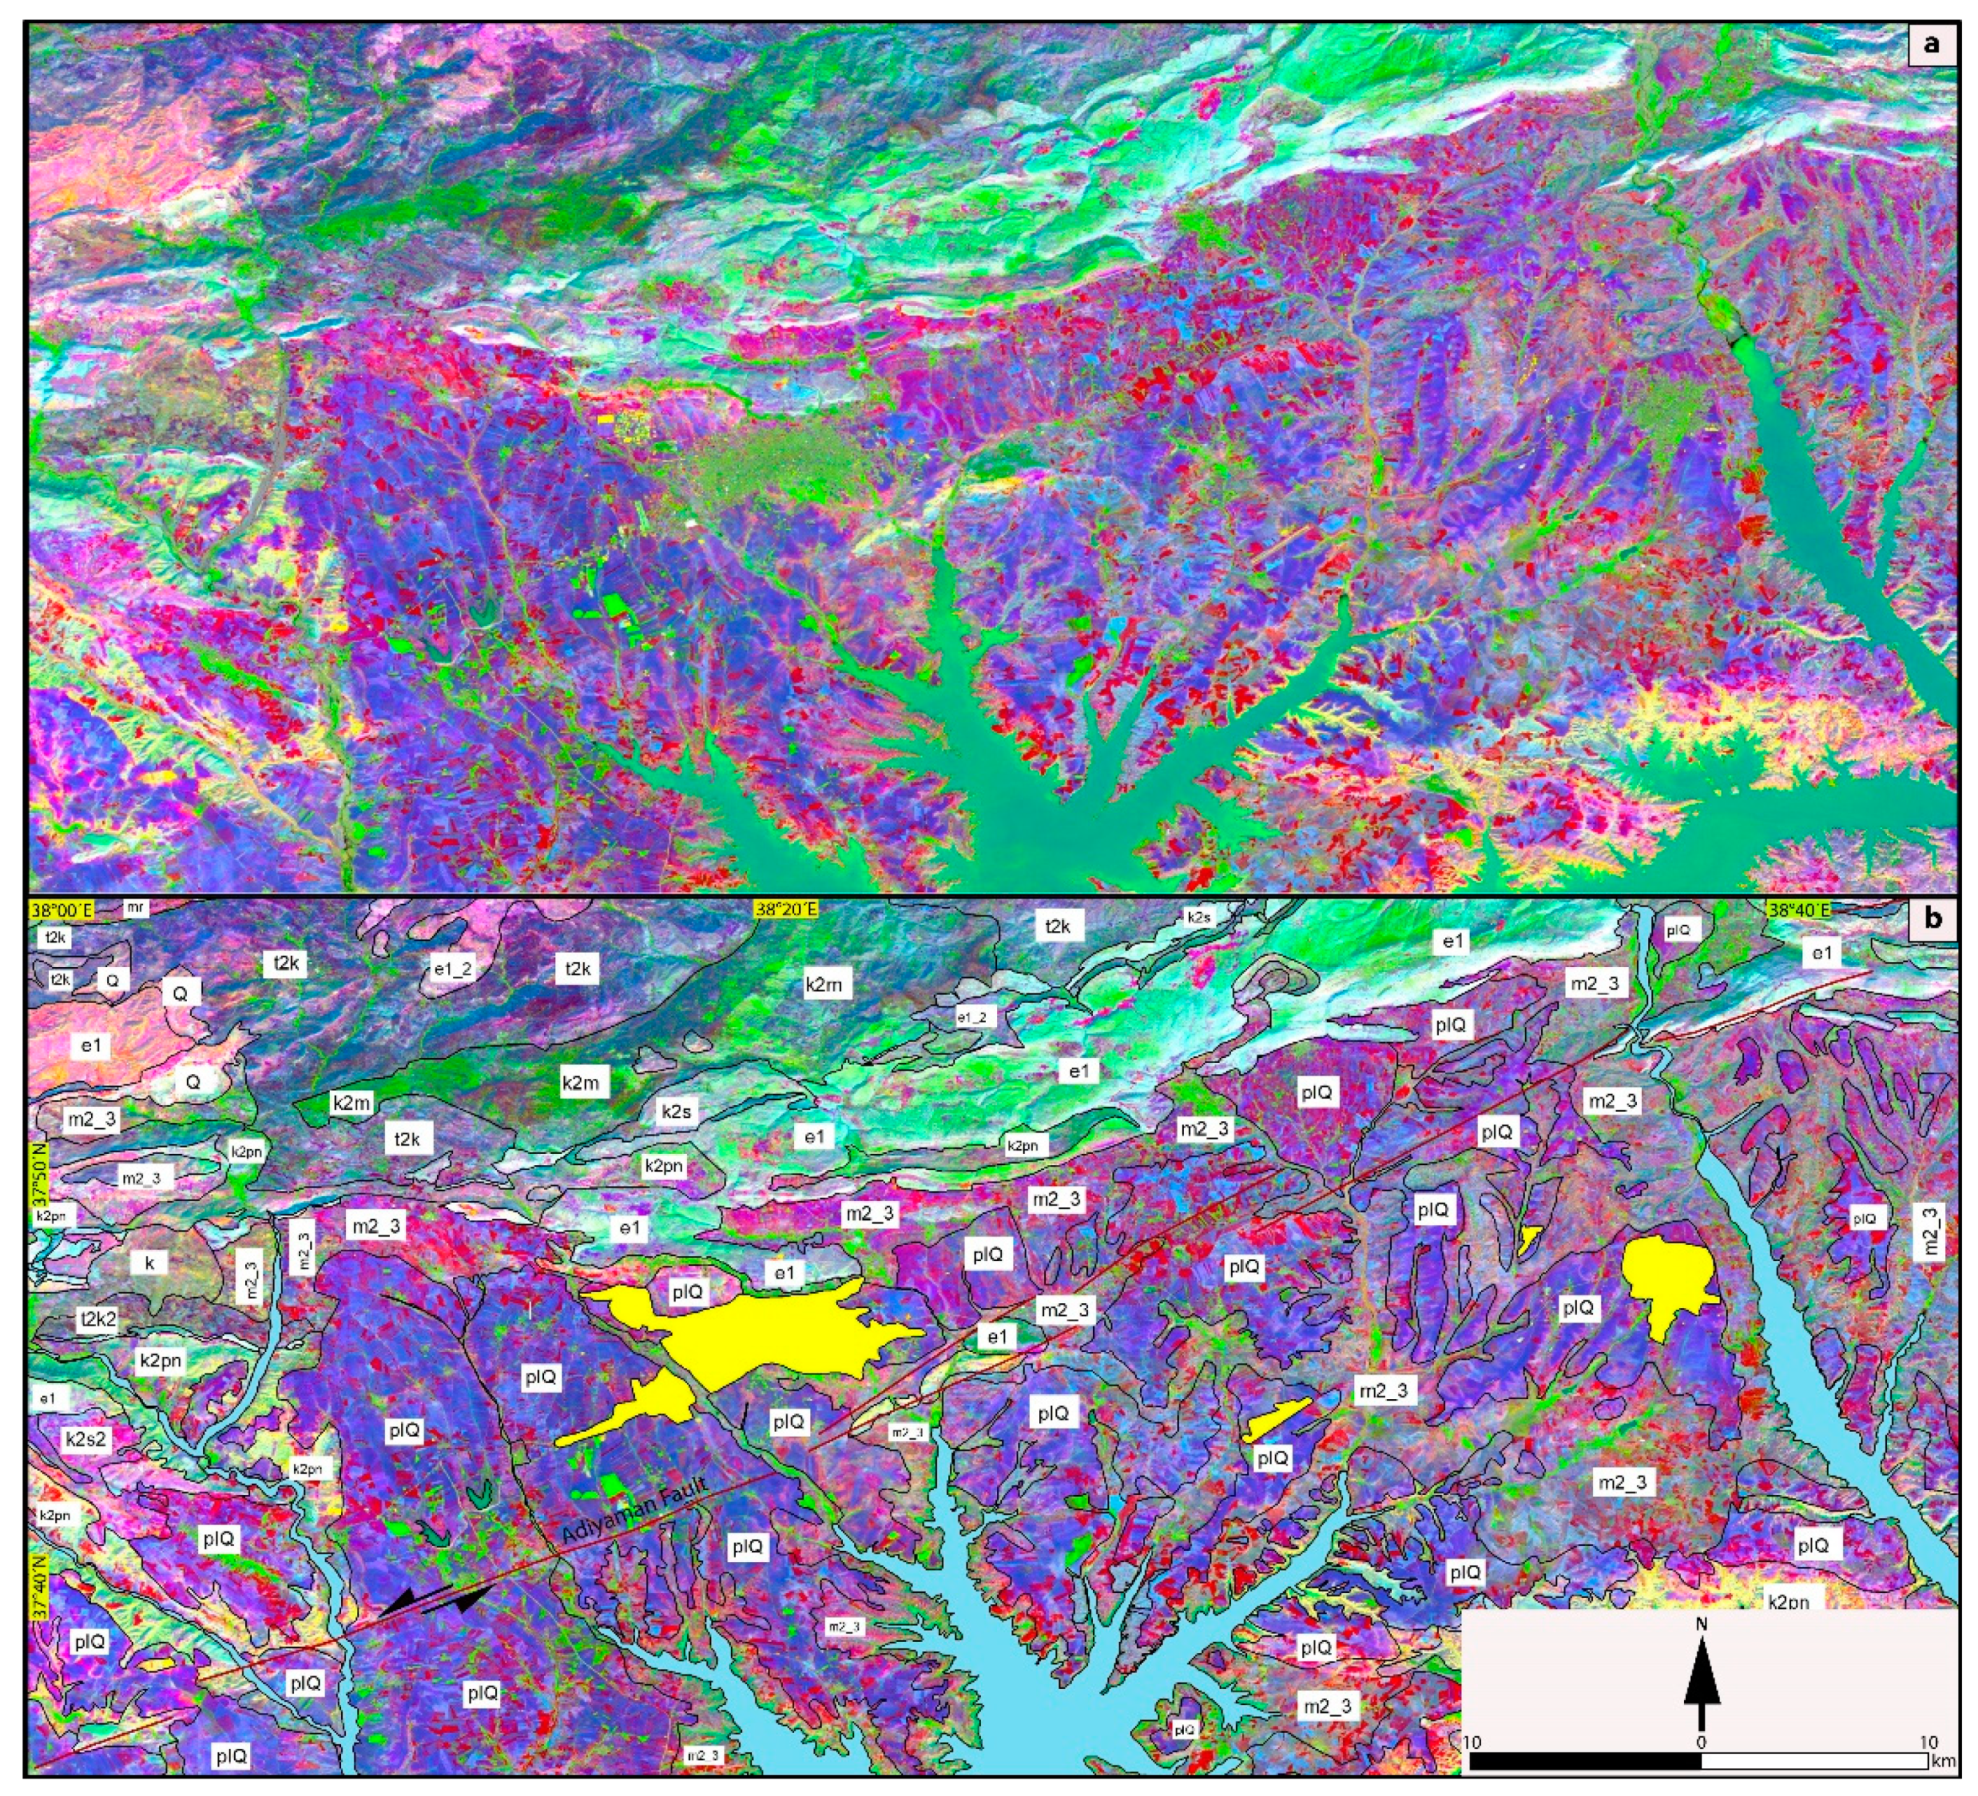
5. Results and Discussion
5.1. Landsat 8 Principal and Independent Component Analysis
5.2. Landsat 8 Minimum Noise Fraction Analysis
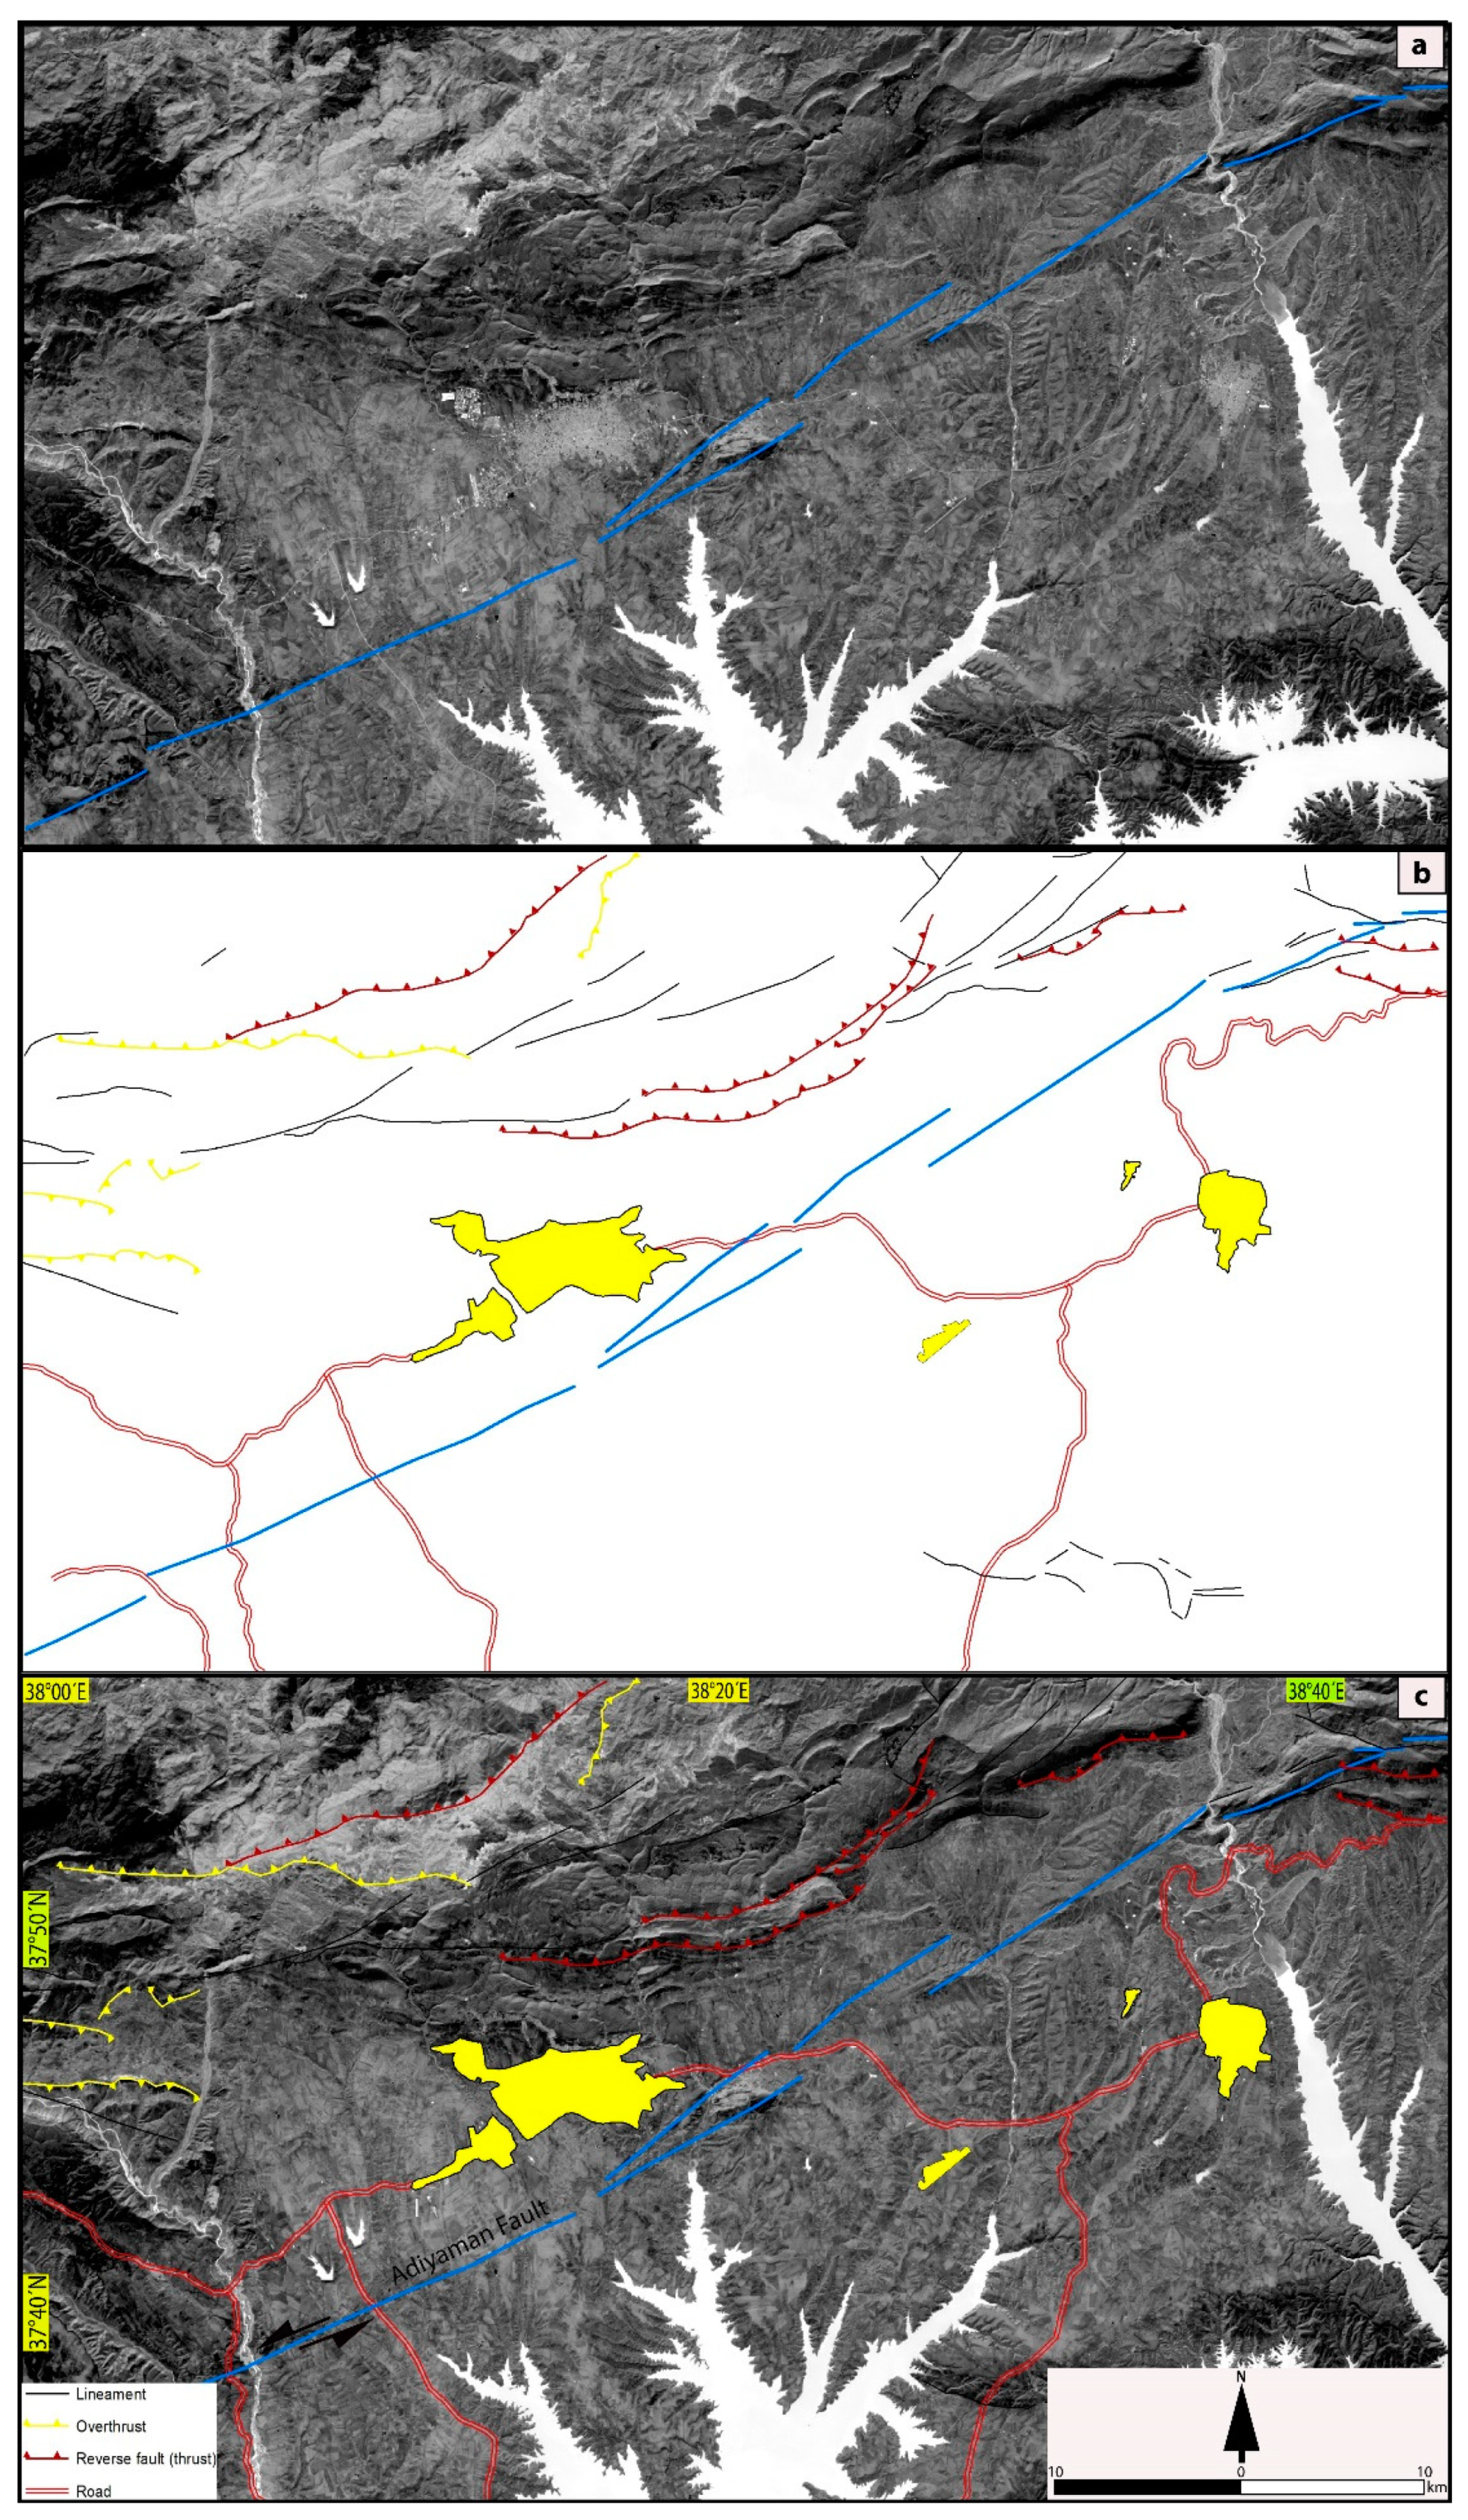
5.3. Extracted Structural Map
5.4. Improvements of the Available Lithological Map
6. Conclusions
Author Contributions
Funding
Institutional Review Board Statement
Informed Consent Statement
Data Availability Statement
Acknowledgments
Conflicts of Interest
References
- Khalifa, A.; Çakir., Z.; Owen, A.; Kaya, Ş. Evaluation of the Relative Tectonic Activity of the Adıyaman fault within the Arabian-Anatolian plate boundary (eastern Turkey). Geologicaacta 2019, 17. [Google Scholar] [CrossRef] [Green Version]
- Sabins, F. Remote Sensing Principles and Interpretation, 3rd ed.; Freeman: New York, NY, USA, 1997; 494p. [Google Scholar]
- Hamimi, Z.; Hagag, W.; Kamh, S.; El-Araby, A. Application of remote-sensing techniques in geological and structural mapping of Atalla Shear Zone and Environs, Central Eastern Desert, Egypt. Arab. J. Geosci. 2020, 13, 414. [Google Scholar] [CrossRef]
- Gad, S.; Kusky, T.M. ASTER spectral ratioing for lithological mapping in the Arabian-Nubian shield, the Neoproterozoic Wadi Kid area, Sinai, Egypt. Gondwana Res. 2007, 11, 326–335. [Google Scholar] [CrossRef]
- Mwaniki, M.W.; Moeller, M.S.; Schellmann, G. A comparison of Landsat 8 (OLI) and Landsat 7 (ETM+) in mapping geology and visualizing lineaments: A case study of central region Kenya. In Proceedings of the 36th International Symposium on Remote Sensing of Environment, Berlin, Germany, 11–15 May 2015; Volume 11, pp. 897–903. [Google Scholar]
- Abdel Gawad, A.E.; Abu Donia, A.M.; Elsaid, M. Processing of landsat 8 imagery and ground gamma-ray spectrometery for geologic mappin and dose-rate assessment, Wadi Diit along the Red Sea Coast, Egypt. Open J. Geol. 2016, 6, 911–930. [Google Scholar] [CrossRef] [Green Version]
- Ahmadirouhani, R.; Rahimi, B.; Karimpour, M.H.; Shafaroudi, A.M.; Najafi, S.A.; Pour, A.B. Fracture mapping of lineaments andrecognizing their tectonic significant using Spot-5 satellite data: A case study from the Bajestand area, Lut block, east of Iran. J. Afr. Earth Sci. 2017, 134, 600–612. [Google Scholar] [CrossRef]
- Das, S.; Pardeshi, S.D.; Kulkarni, P.P.; Doke, A. Extraction of lineaments from different azimuth angles using geospatial techniques: A case study of Pravara basin, maharashtra, India. Arab. J. Geosci. 2018, 11, 160. [Google Scholar] [CrossRef]
- Al-Djazouli, M.O.; Elmorabiti, K.; Zoheir, B.; Rahimi, A.; Amellah, O. Use of Landsat-8 data for delineating fracture systems in subsoil regions: Implications for groundwater prospection in the Waddai area, eastern Chad. Arab. J. Geosci. 2019, 12, 241. [Google Scholar] [CrossRef]
- Ourhzif, Z.; Algouti, A.; Algouti, A.; Hadach, F. Lithological mapping using Landsat 8 OLI and Aster multispectral data in Imini-Ounilla District south high Atlas of Marrakech. In Proceedings of the ISPRS Geospatial Week 2019, Enschede, The Netherlands, 10–14 June 2019. [Google Scholar]
- Khalifa, A.; Çakır, Z.; Kaya, Ş.; Gabr, S. ASTER spectral band ratios for lithological mapping: A case study for measuring geological offset along the Erkenek Segment of the East Anatolian Fault Zone, Turkey. Arab. J. Geosci. 2020, 13, 832. [Google Scholar] [CrossRef]
- Sadek, M.; El-Kalioubi, B.A.; Ali-Bik, M.W.; El Hefnawi, M.A.; Elnazer, A.A. Utilizing Landsat-8 and ASTER data in geologic mapping of hyper-arid mountainous region: Case of Gabal Batoga area, South Eastern Desert of Egypt. Environ. Earth Sci. 2020, 79, 101. [Google Scholar] [CrossRef]
- Gad, S.; Kusky, T.M. Lithological mapping in the Eastern Desert of Egypt, the Barramiya area, using Landsat thematic mapper (TM). J. Afr. Earth Sci. 2006, 44, 196–202. [Google Scholar] [CrossRef]
- Allou, G.; Ouattara, G.; Coulibaly, Y.; Bonin, B. The Landsat 7 ETM+ remote sensing imagery for lithological and structural mapping in the central Côte D’ivoire (western Africa): Case of Dabakala area. Eur. Sci. J. 2015, 11, 141–163. [Google Scholar]
- Rowan, C.; John, C. Lithologic mapping in the mountain pass, California area using advanced spaceborne thermal emission and reflection radiometer (ASTER) data. Remote Sens. Environ. 2003, 84, 350–366. [Google Scholar] [CrossRef]
- Abdeen, M.M.; Abdelghaffar, A.A. Mapping Neoproterozoic structures along the central Allaqiheiani suture, Southeastern Egypt, using remote sensing and field data. In Proceedings of the 29th Asian Conference of Remote Sensing (Abstract), Colombo, Sri Lanka, 10–14 November 2008; p. 789. [Google Scholar]
- Ramli, M.F.; Yusof, N.; Yusoff, M.K.; Juahir, H.; Shafri, H. Lineament mapping and its application in landslide hazard assessment: A review. Bull. Eng. Geol. Environ. 2010, 69, 215–233. [Google Scholar] [CrossRef]
- Marghany, M.; Hashim, M. Lineament mapping using multispectral remote sensing satellite data. Int. J. Phys. Sci. 2010, 5, 1501–1507. [Google Scholar] [CrossRef]
- Irmak, T.S.; Bulut, İ.; Doğan, B. Regional seismicity in Adiyaman—Samsat (SE Turkey). Boll. Geofis. Teor. Appl. 2020, 451, 468. [Google Scholar]
- Şengör, C.; Görür, N.; Şaroglu, F. Strike-slip faulting and related basin formation in zones of tectonic escape: Turkey as a case study. In Strike-Slip Faulting and Basin Formation; Biddle, K.T., Christie-Slick, N., Eds.; SEPM Society for Sedimentary Geology, Oklahoma, Special Publications: Broken Arrow, OK, USA, 1985; Volume 37, pp. 227–264. [Google Scholar]
- Farr, T.G.; Rosen, P.A.; Caro, E.; Crippen, R.; Duren, R.; Hensley, S.; Kobrick, M.; Paller, M.; Rodriguez, E.; Roth, L.; et al. The shuttle radar topography mission. Rev. Geophys. 2007, 45. [Google Scholar] [CrossRef] [Green Version]
- Herece, E. Atlas of the East Anatolian Fault; Special Publication Series; General Directorate of Mineral Research and Exploration (MTA): Ankara, Turkey, 2008; 359p.
- Zhang, T.; Yi, G.; Li, H.; Wang, Z.; Tang, J.; Zhong, K.; Li, Y.; Wang, Q.; Bie, X. Integrating Data of ASTER and Landsat-8 OLI (AO) for Hydrothermal Alteration Mineral Mapping in Duolong Porphyry Cu-Au Deposit, Tibetan Plateau, China. Remote Sens. 2016, 8, 890. [Google Scholar] [CrossRef] [Green Version]
- Mars, J.C.; Rowan, L.C. Spectral assessment of new ASTER SWIR surface reflectance data products for spectroscopic mapping of rocks and minerals. Remote Sens. Environ. 2010, 114, 2011–2025. [Google Scholar] [CrossRef]
- Hewson, R.; Cudahy, T. Issues Affecting Geological Mapping with ASTER Data: A Case Study of the Mt Fitton Area, South Australia. In Land Remote Sensing and Global Environmental Change; Ramachandran, B., Justice, C.O., Eds.; Series Remote Sensing and Digital Image Processing 13; Springer: New York, NY, USA, 2010; Volume 11, pp. 273–300. [Google Scholar]
- Amer, R.; Kusky, T.; Gullam, A. Lithological mapping in the Central Eastern Desert of Egypt using ASTER data. J. Afr. Earth Sci. 2010, 56, 75–82. [Google Scholar] [CrossRef]
- Kumar, C.; Shetty, A.; Raval, S.; Sharma, R.; Champati, R. Lithological discrimination and mapping using ASTER SWIR data in the Udaipur area of Rajasthan, India. Procedia Earth Planet. Sci. 2015, 11, 180–188. [Google Scholar] [CrossRef] [Green Version]
- Gurugnanam, B.; Arulbalaji, P.; Midhuna, V.; Kumaravel, S. Lithological discrimination of Anorthosite using ASTER data in Oddancehatram area, Dindigul district, tamil Nadu, India. Int. J. Adv. Eng. Manag. Sci. 2017, 3, 316–324. [Google Scholar]
- Green, A.A.; Berman, M.; Switzer, P.; Craig, M.D. A trans-formation for ordering multispectral data in terms of image quality with implications for noise removal. IEEE Trans. Geo-Sci. Remote Sens. 1988, 26, 65–74. [Google Scholar] [CrossRef] [Green Version]
- Lee, J.B.; Woodyatt, A.S.; Berman, M. Enhancement of high spectral resolution remote sensing data by a noise-adjusted principal components transform. IEEE Trans. Geosci. Remote Sens. 1990, 28, 295–304. [Google Scholar] [CrossRef]
- Bjorgan, A.; Randeberg, L.L. Real-time noise removal for line-scanning hyperspectral devices using a minimum noise fraction–based approach. Sensors 2015, 15, 3362–3378. [Google Scholar] [CrossRef] [PubMed] [Green Version]
- Nielsen, A.A. Kernel maximum autocorrelation factor and minimum noise fraction transformations. IEEE Trans. Image Process. 2011, 20, 612–624. [Google Scholar] [CrossRef] [Green Version]
- Luo, G.; Chen, G.; Tian, L.; Qin, K.; Qian, E. Minimum noise fraction versus principle component analysis as a preprocessing step for hyperspectral imagery denoising. Can. J. Remote Sens. 2016, 42, 106–116. [Google Scholar] [CrossRef]
- Hubbard, B.E.; Crowley, J.K. Mineral mapping on the Chilean-Bolivian Altiplano using co-orbital ALI, ASTER and Hyperion imagery: Data dimensionality issues and solutions. Remote Sens. Environ. 2005, 99, 173–186. [Google Scholar] [CrossRef]
- Mwaniki, M.W.; Moeller, M.S.; Schellmann, G. Application of remote sensing technologies to map the structural geology of central region of Kenya. IEEE J. Sel. Top. Appl. Earth Obs. Remote Sens. 2015, 8, 1855–1867. [Google Scholar] [CrossRef]


Publisher’s Note: MDPI stays neutral with regard to jurisdictional claims in published maps and institutional affiliations. |
© 2021 by the authors. Licensee MDPI, Basel, Switzerland. This article is an open access article distributed under the terms and conditions of the Creative Commons Attribution (CC BY) license (https://creativecommons.org/licenses/by/4.0/).
Share and Cite
Khalifa, A.; Bashir, B.; Çakir, Z.; Kaya, Ş.; Alsalman, A.; Henaish, A. Paradigm of Geological Mapping of the Adıyaman Fault Zone of Eastern Turkey Using Landsat 8 Remotely Sensed Data Coupled with PCA, ICA, and MNFA Techniques. ISPRS Int. J. Geo-Inf. 2021, 10, 368. https://0-doi-org.brum.beds.ac.uk/10.3390/ijgi10060368
Khalifa A, Bashir B, Çakir Z, Kaya Ş, Alsalman A, Henaish A. Paradigm of Geological Mapping of the Adıyaman Fault Zone of Eastern Turkey Using Landsat 8 Remotely Sensed Data Coupled with PCA, ICA, and MNFA Techniques. ISPRS International Journal of Geo-Information. 2021; 10(6):368. https://0-doi-org.brum.beds.ac.uk/10.3390/ijgi10060368
Chicago/Turabian StyleKhalifa, Abdelrahman, Bashar Bashir, Ziyadin Çakir, Şinasi Kaya, Abdullah Alsalman, and Ahmed Henaish. 2021. "Paradigm of Geological Mapping of the Adıyaman Fault Zone of Eastern Turkey Using Landsat 8 Remotely Sensed Data Coupled with PCA, ICA, and MNFA Techniques" ISPRS International Journal of Geo-Information 10, no. 6: 368. https://0-doi-org.brum.beds.ac.uk/10.3390/ijgi10060368