
Synchronising Spatial Metadata Records and Interfaces to Improve the Usability of Metadata Systems


Abstract
:1. Introduction
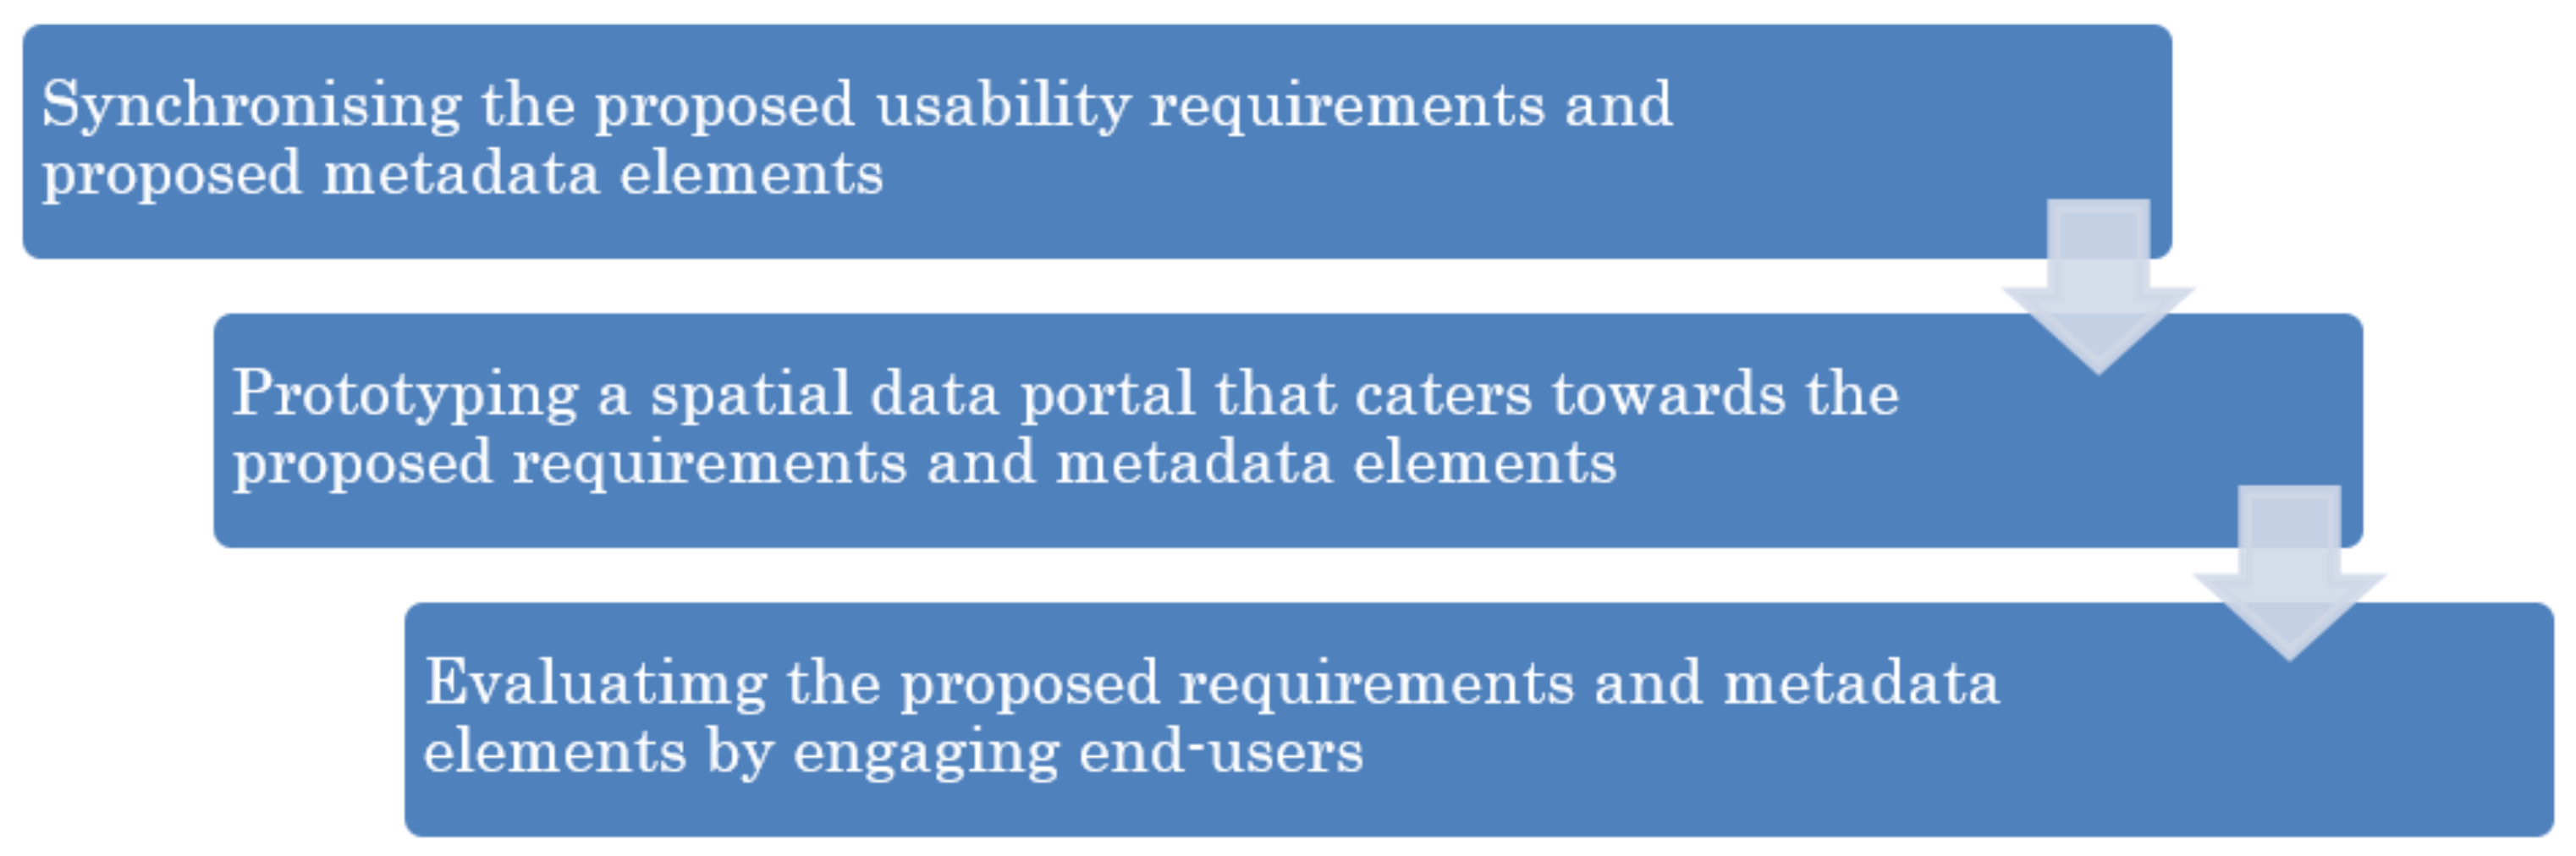
2. Methodology
2.1. Synchronising
2.2. Prototyping
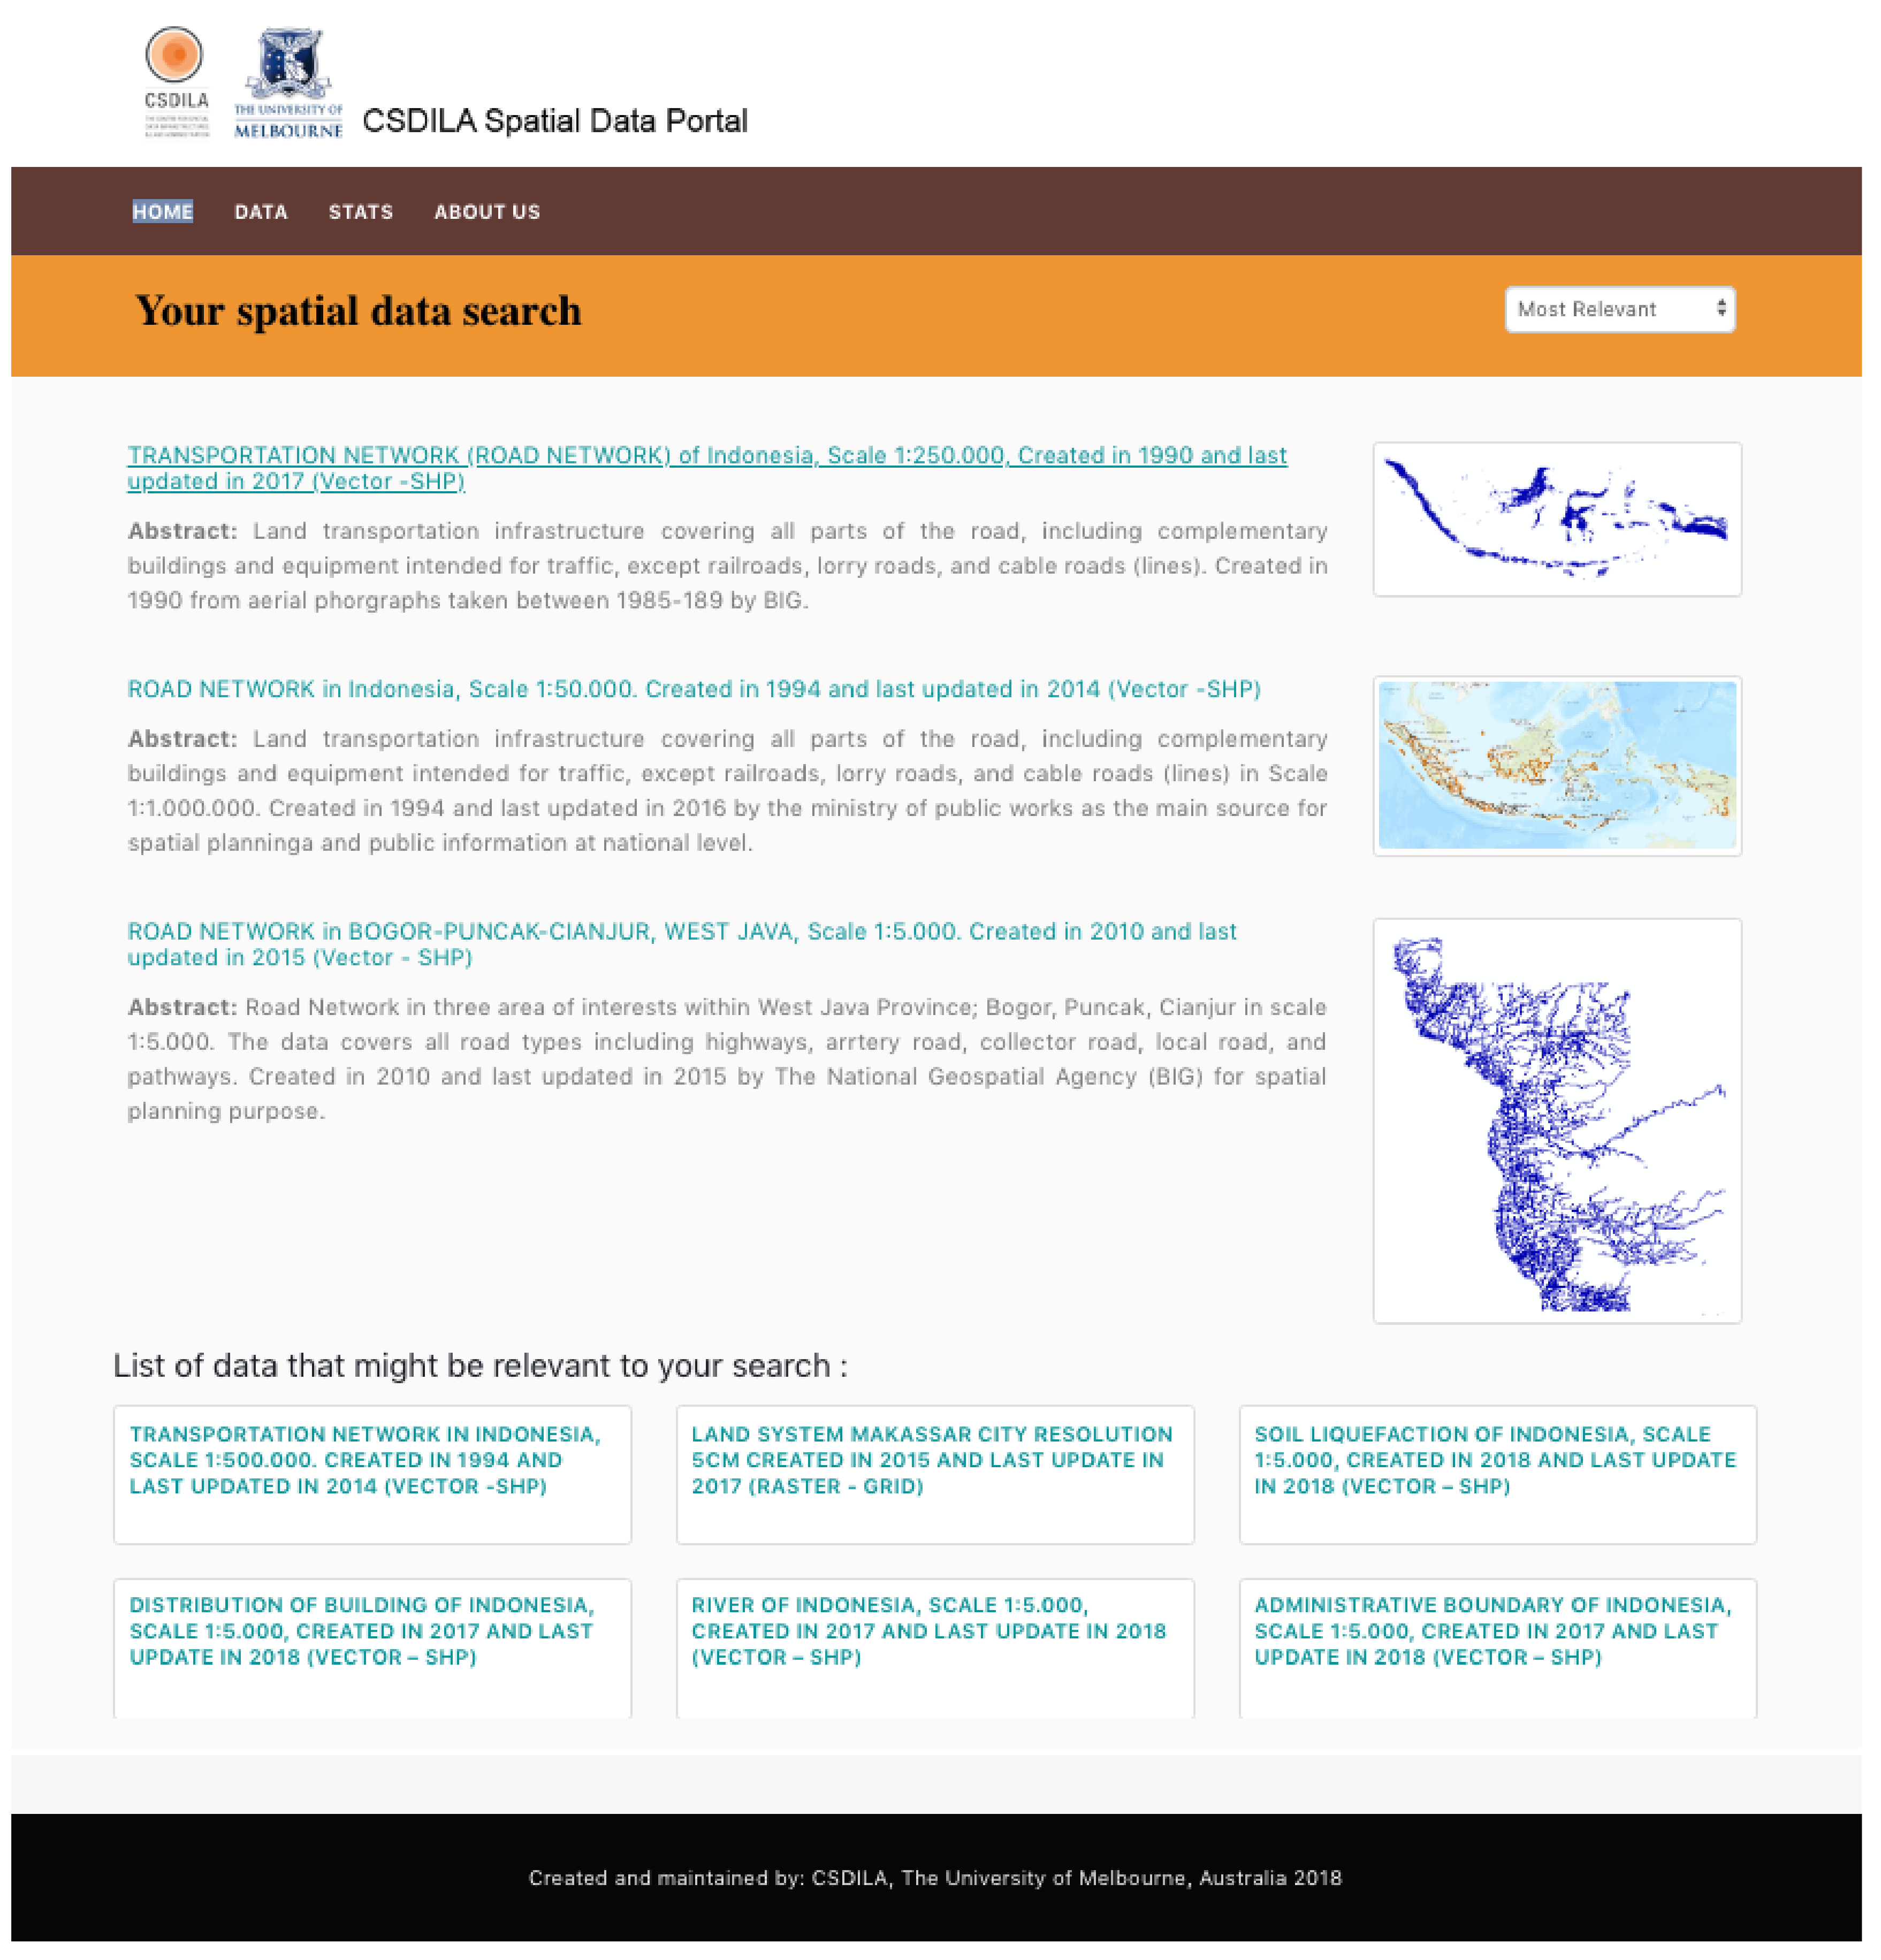
2.2.1. Search Page
2.2.2. Search Results Page
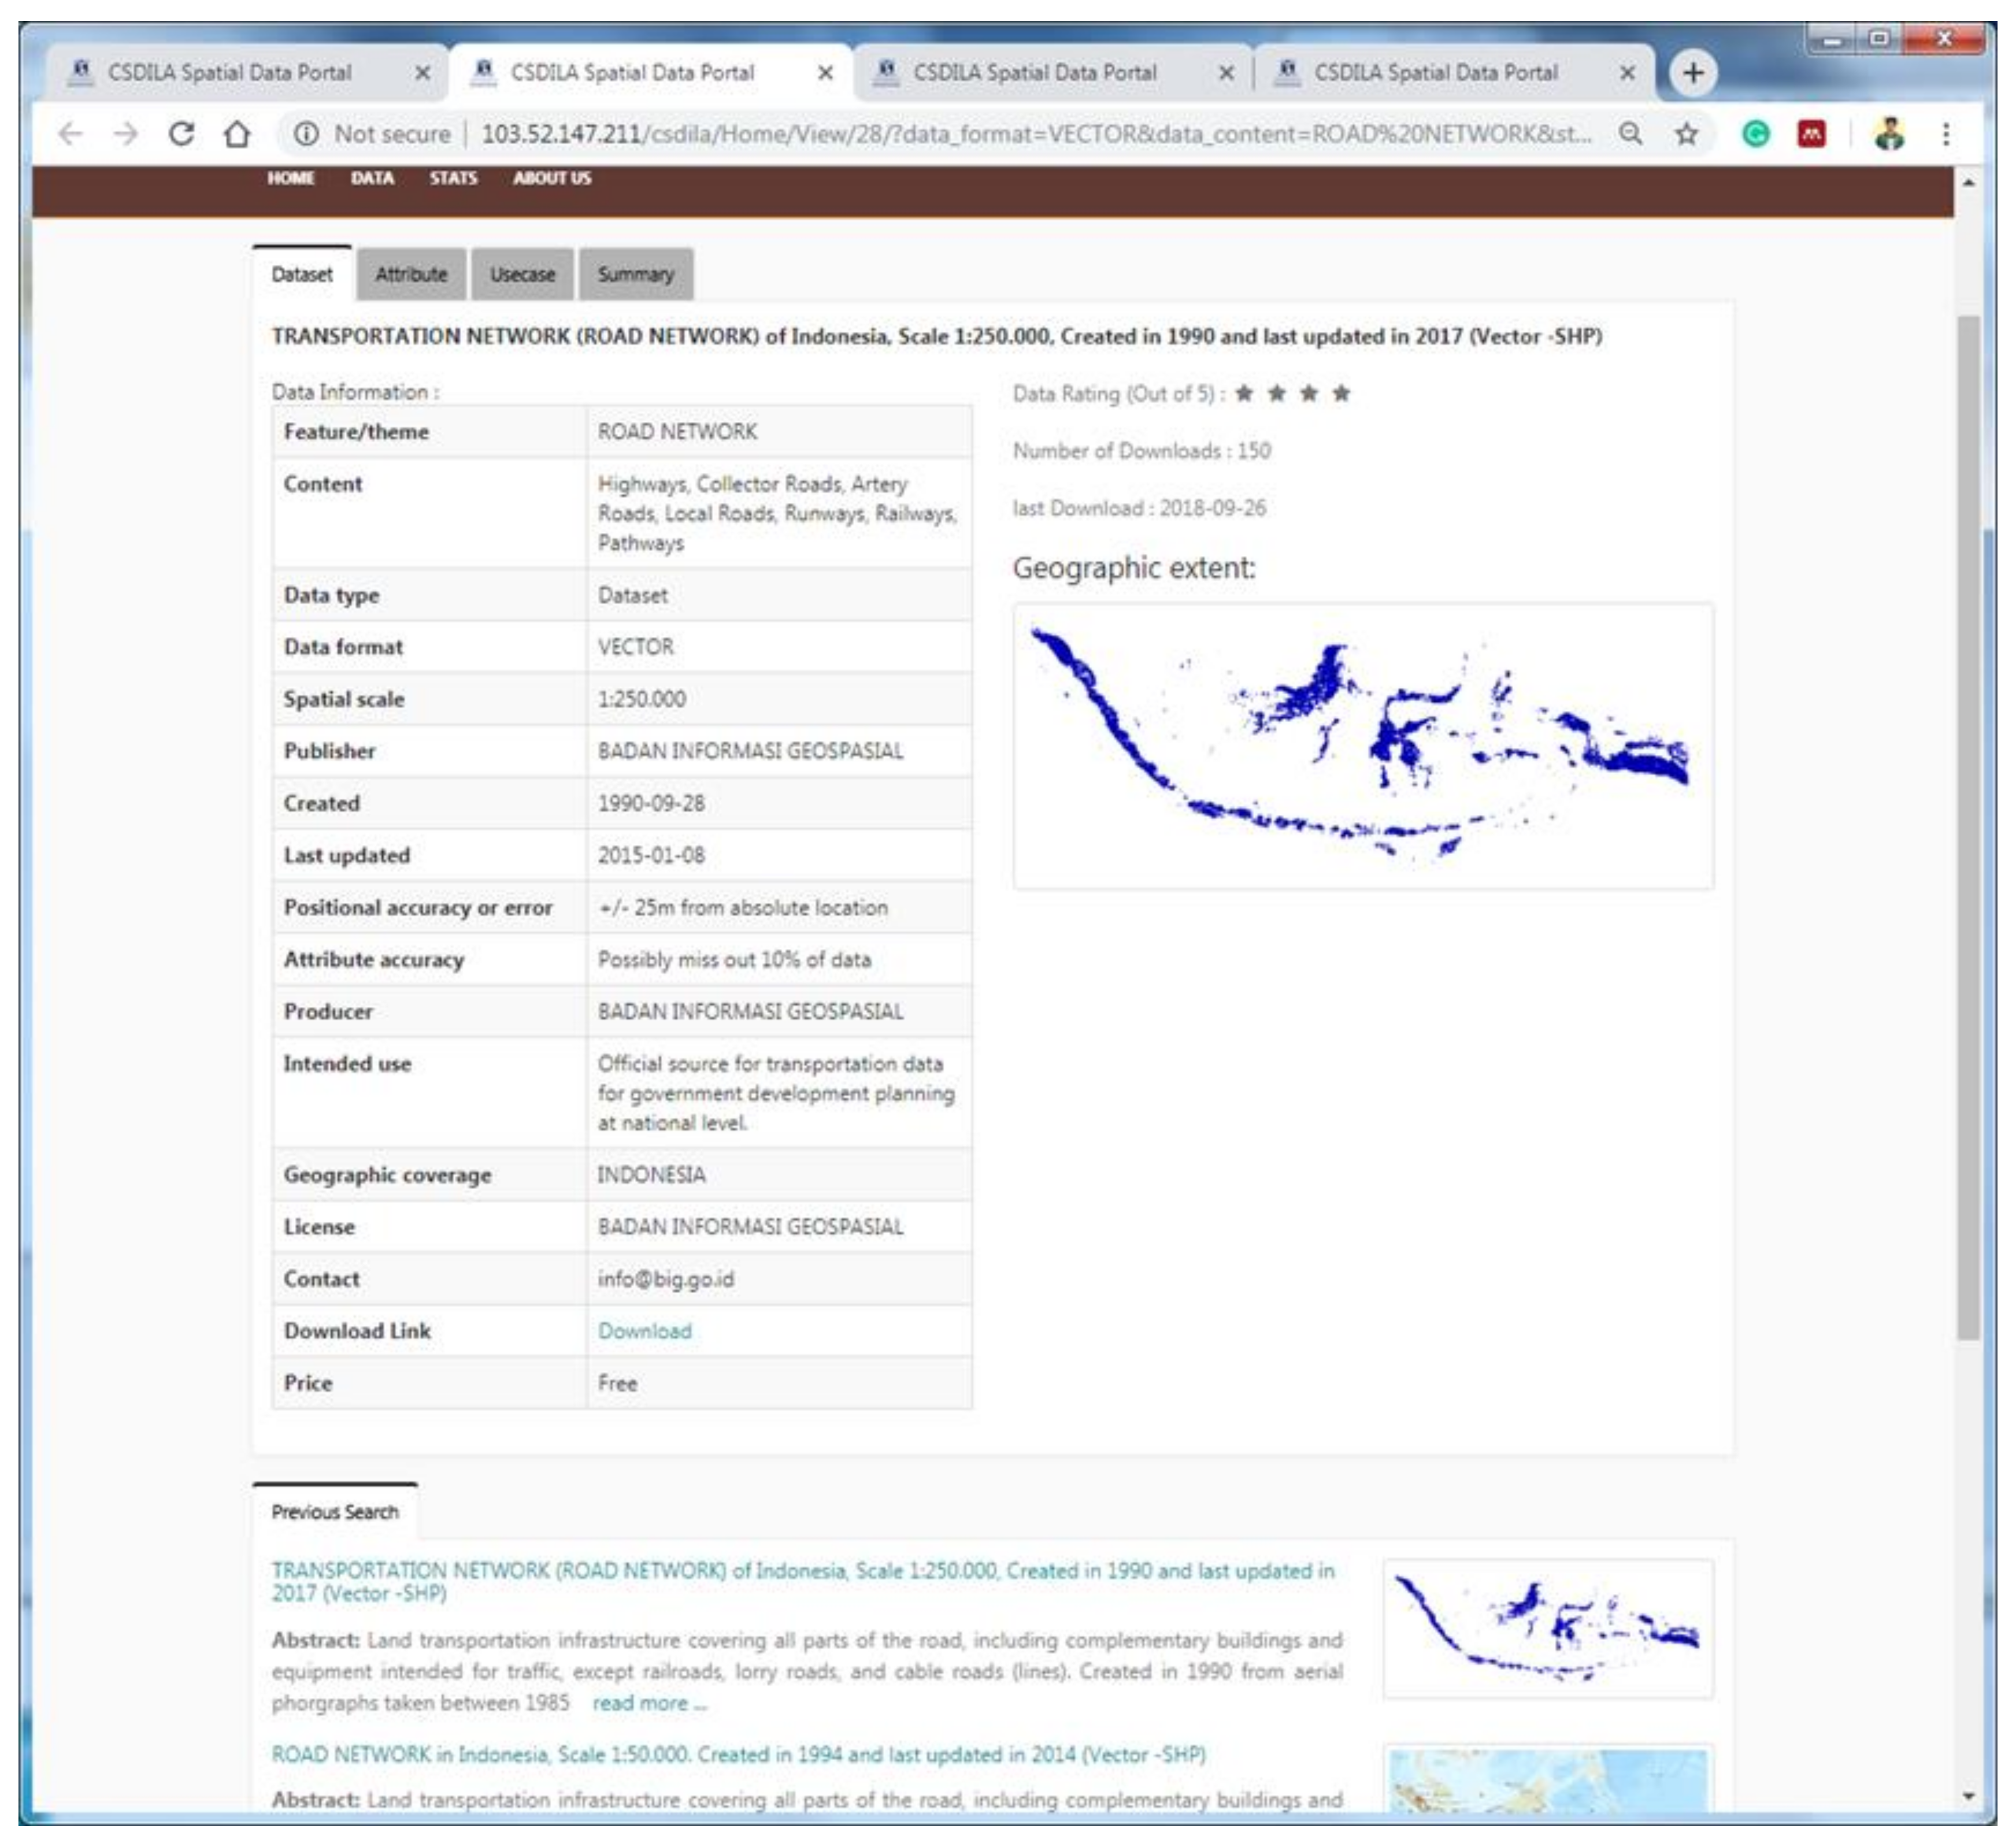
2.2.3. Dataset Metadata Page
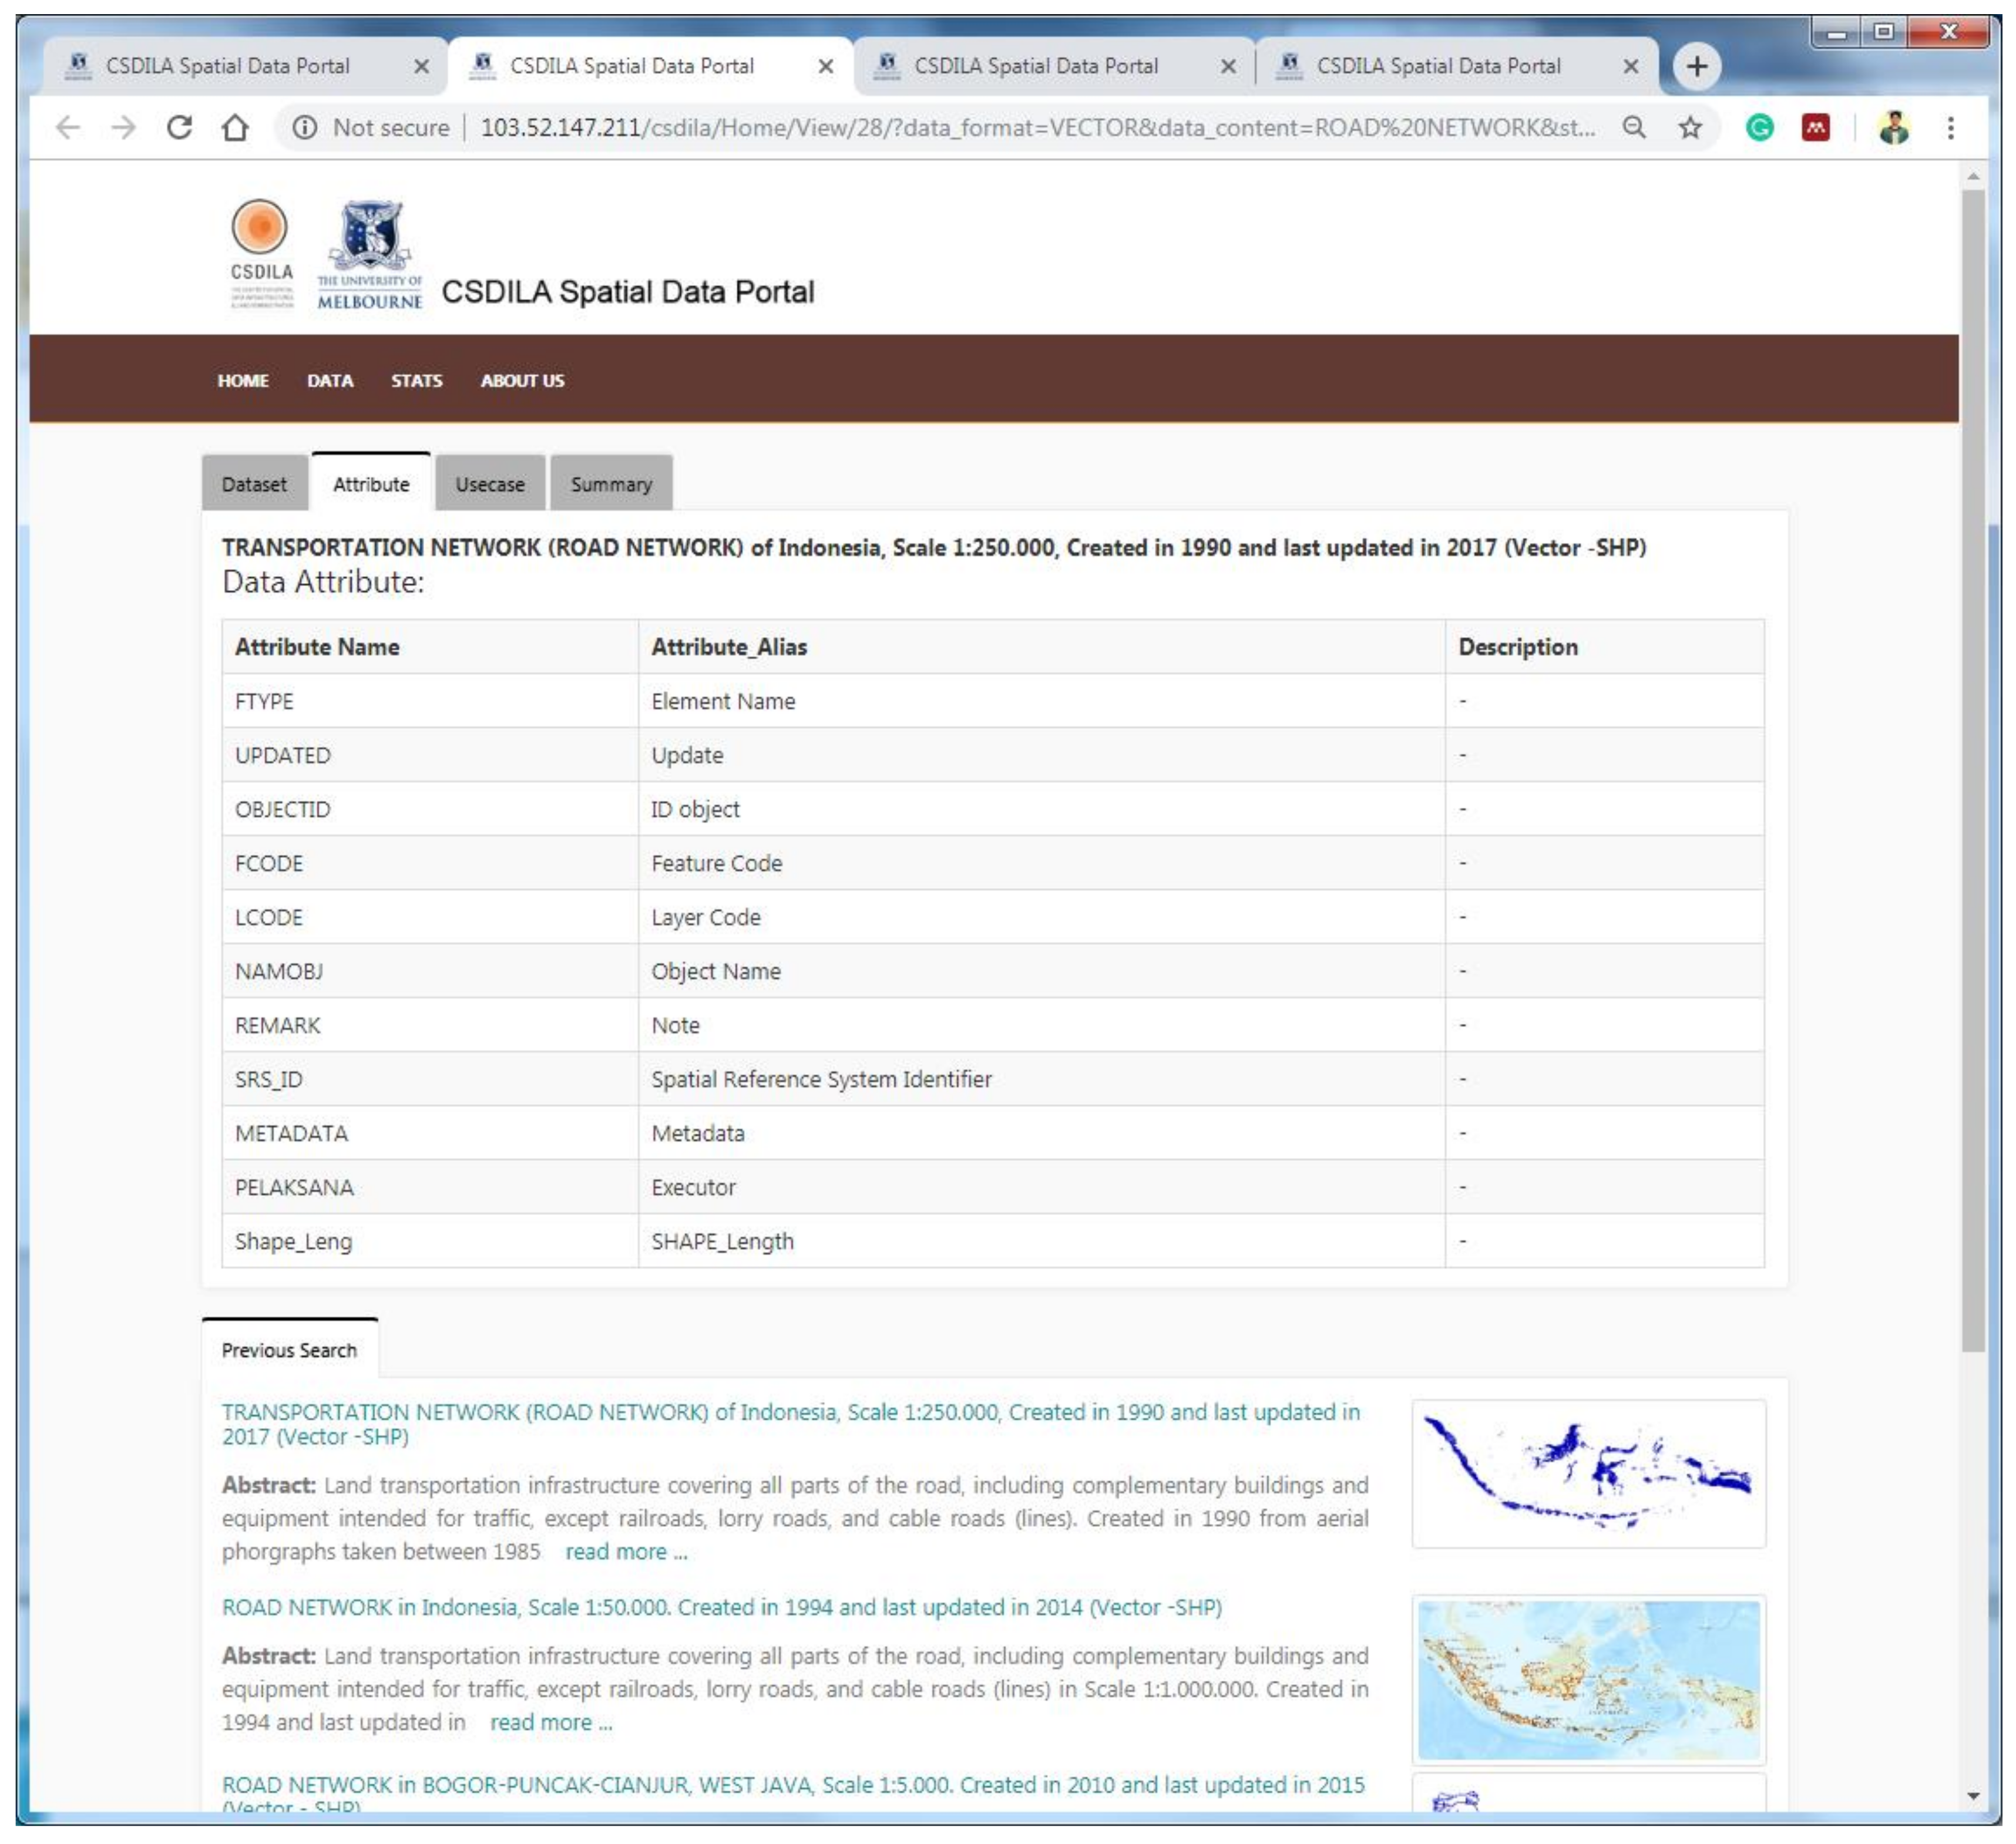
2.2.4. Attribute Metadata Page
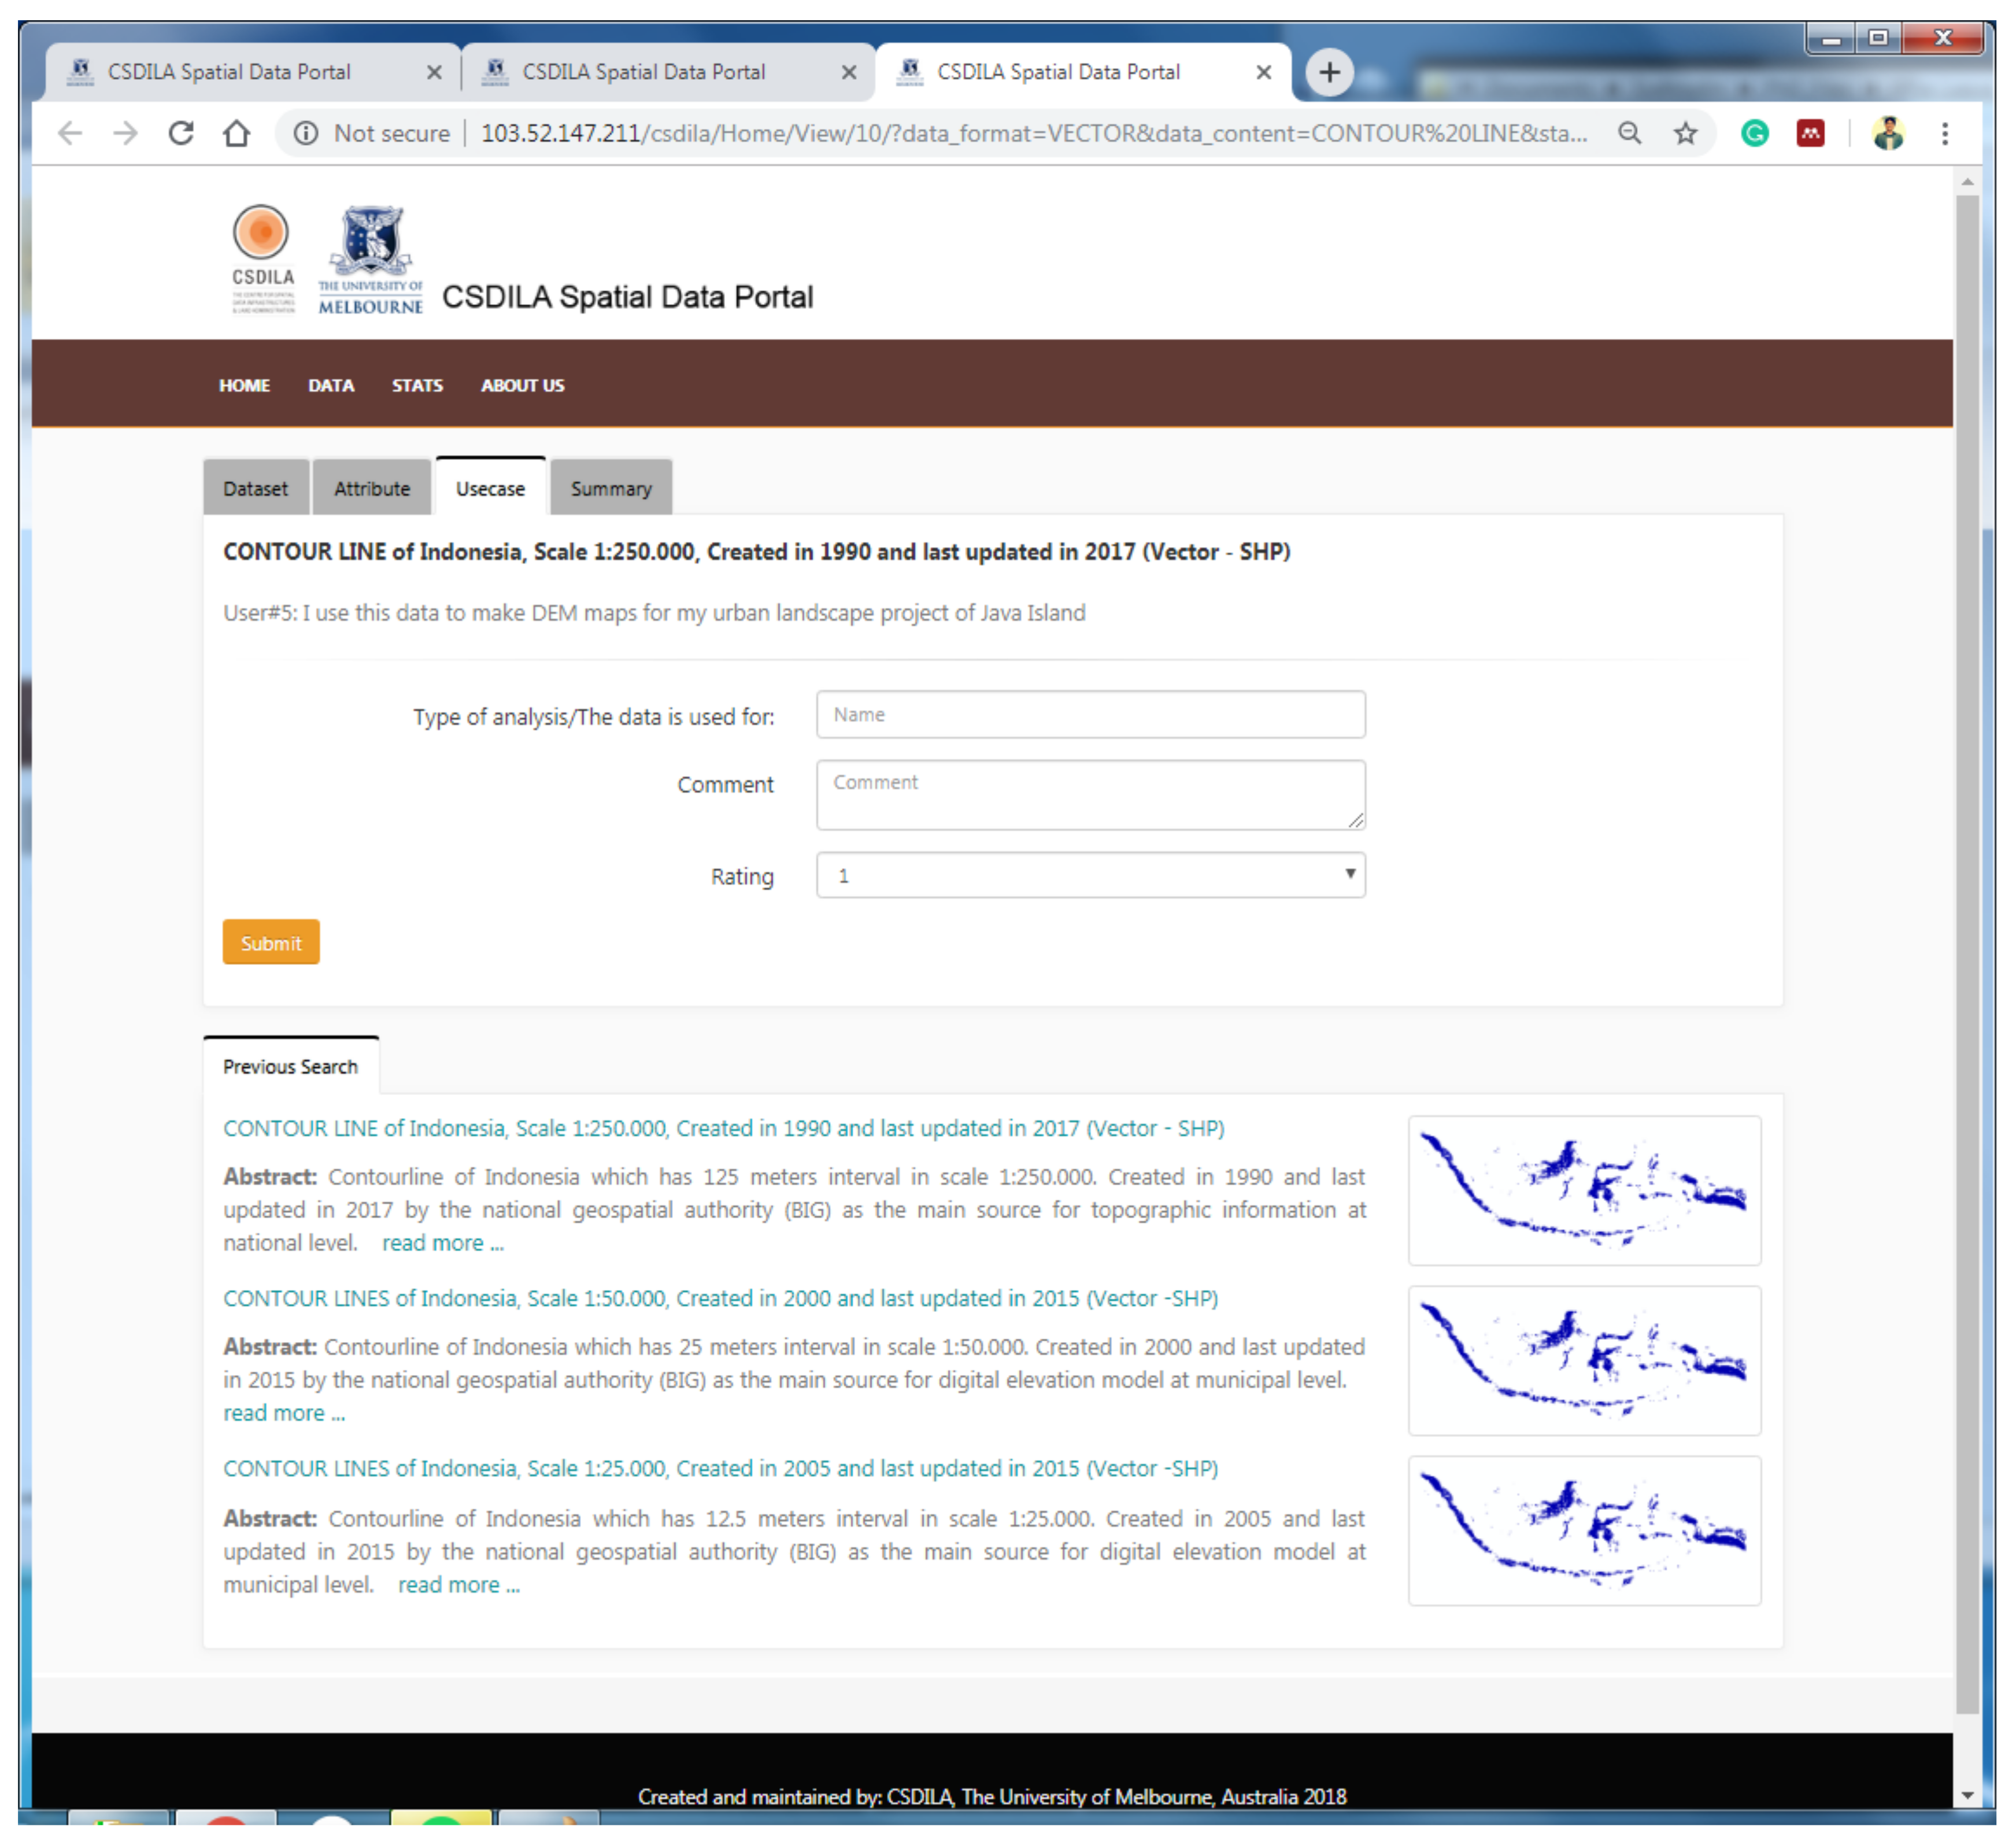
2.2.5. Usecase Metadata Page
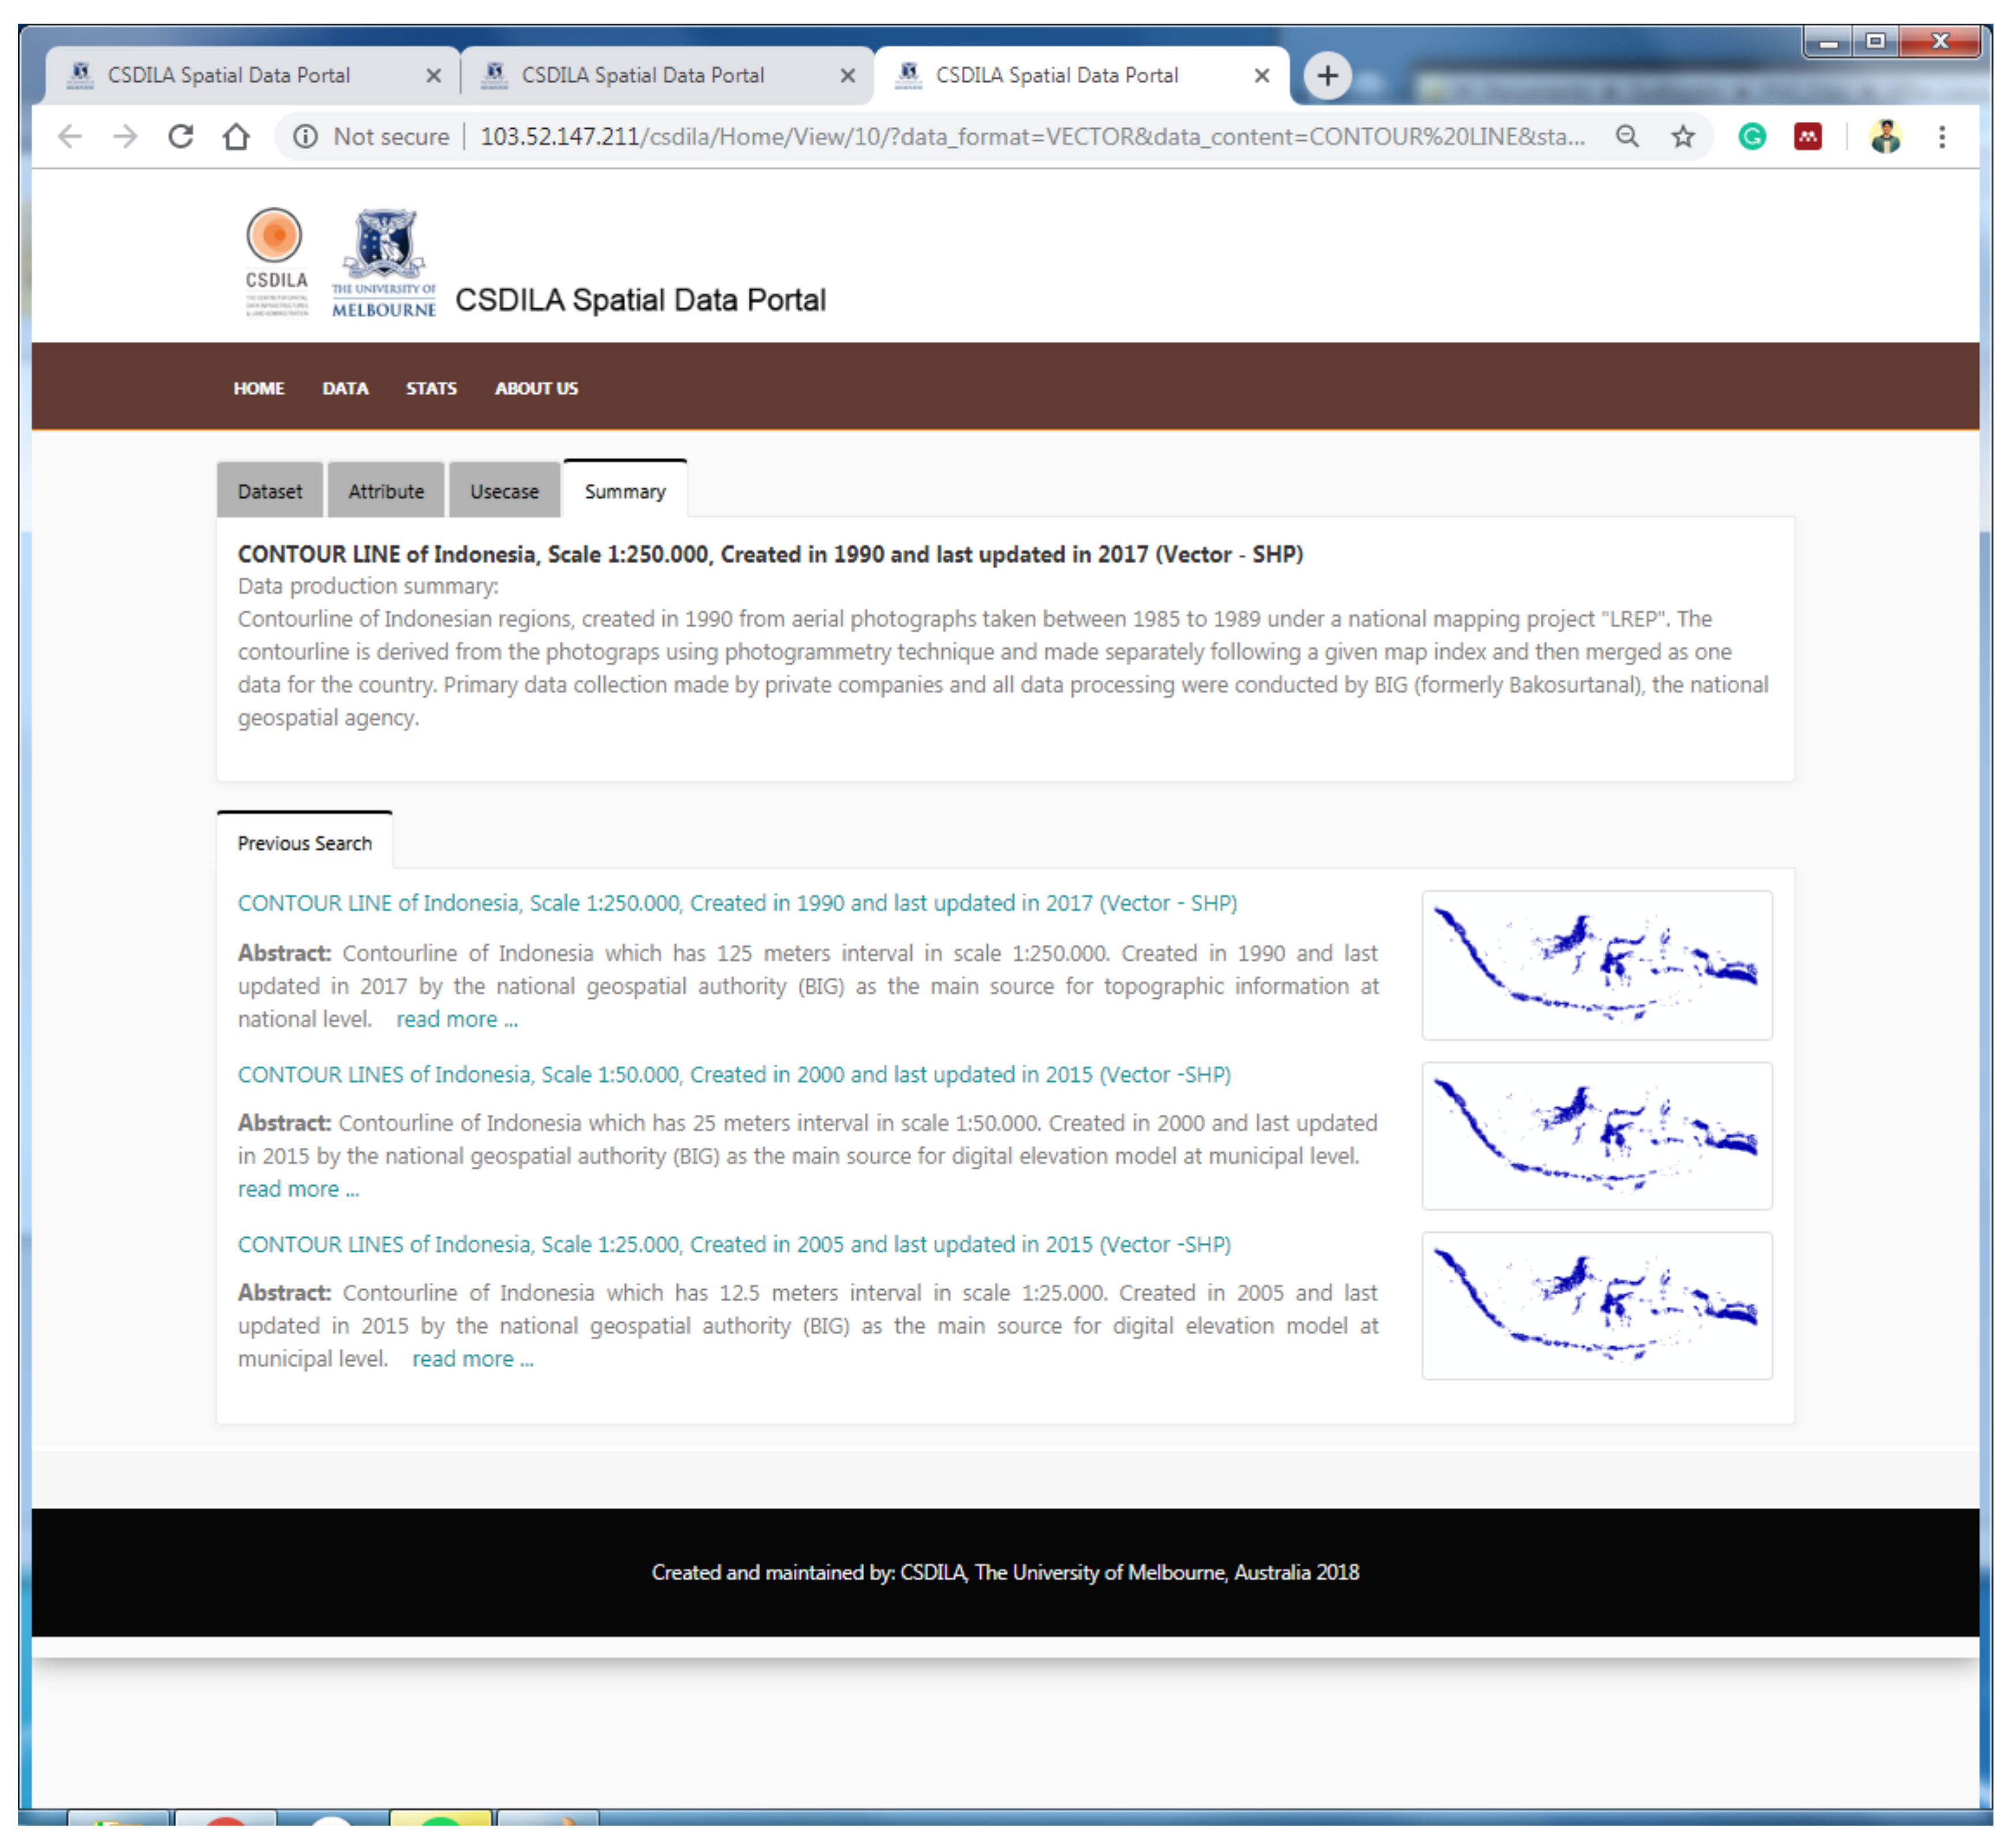
2.2.6. Summary Metadata Page
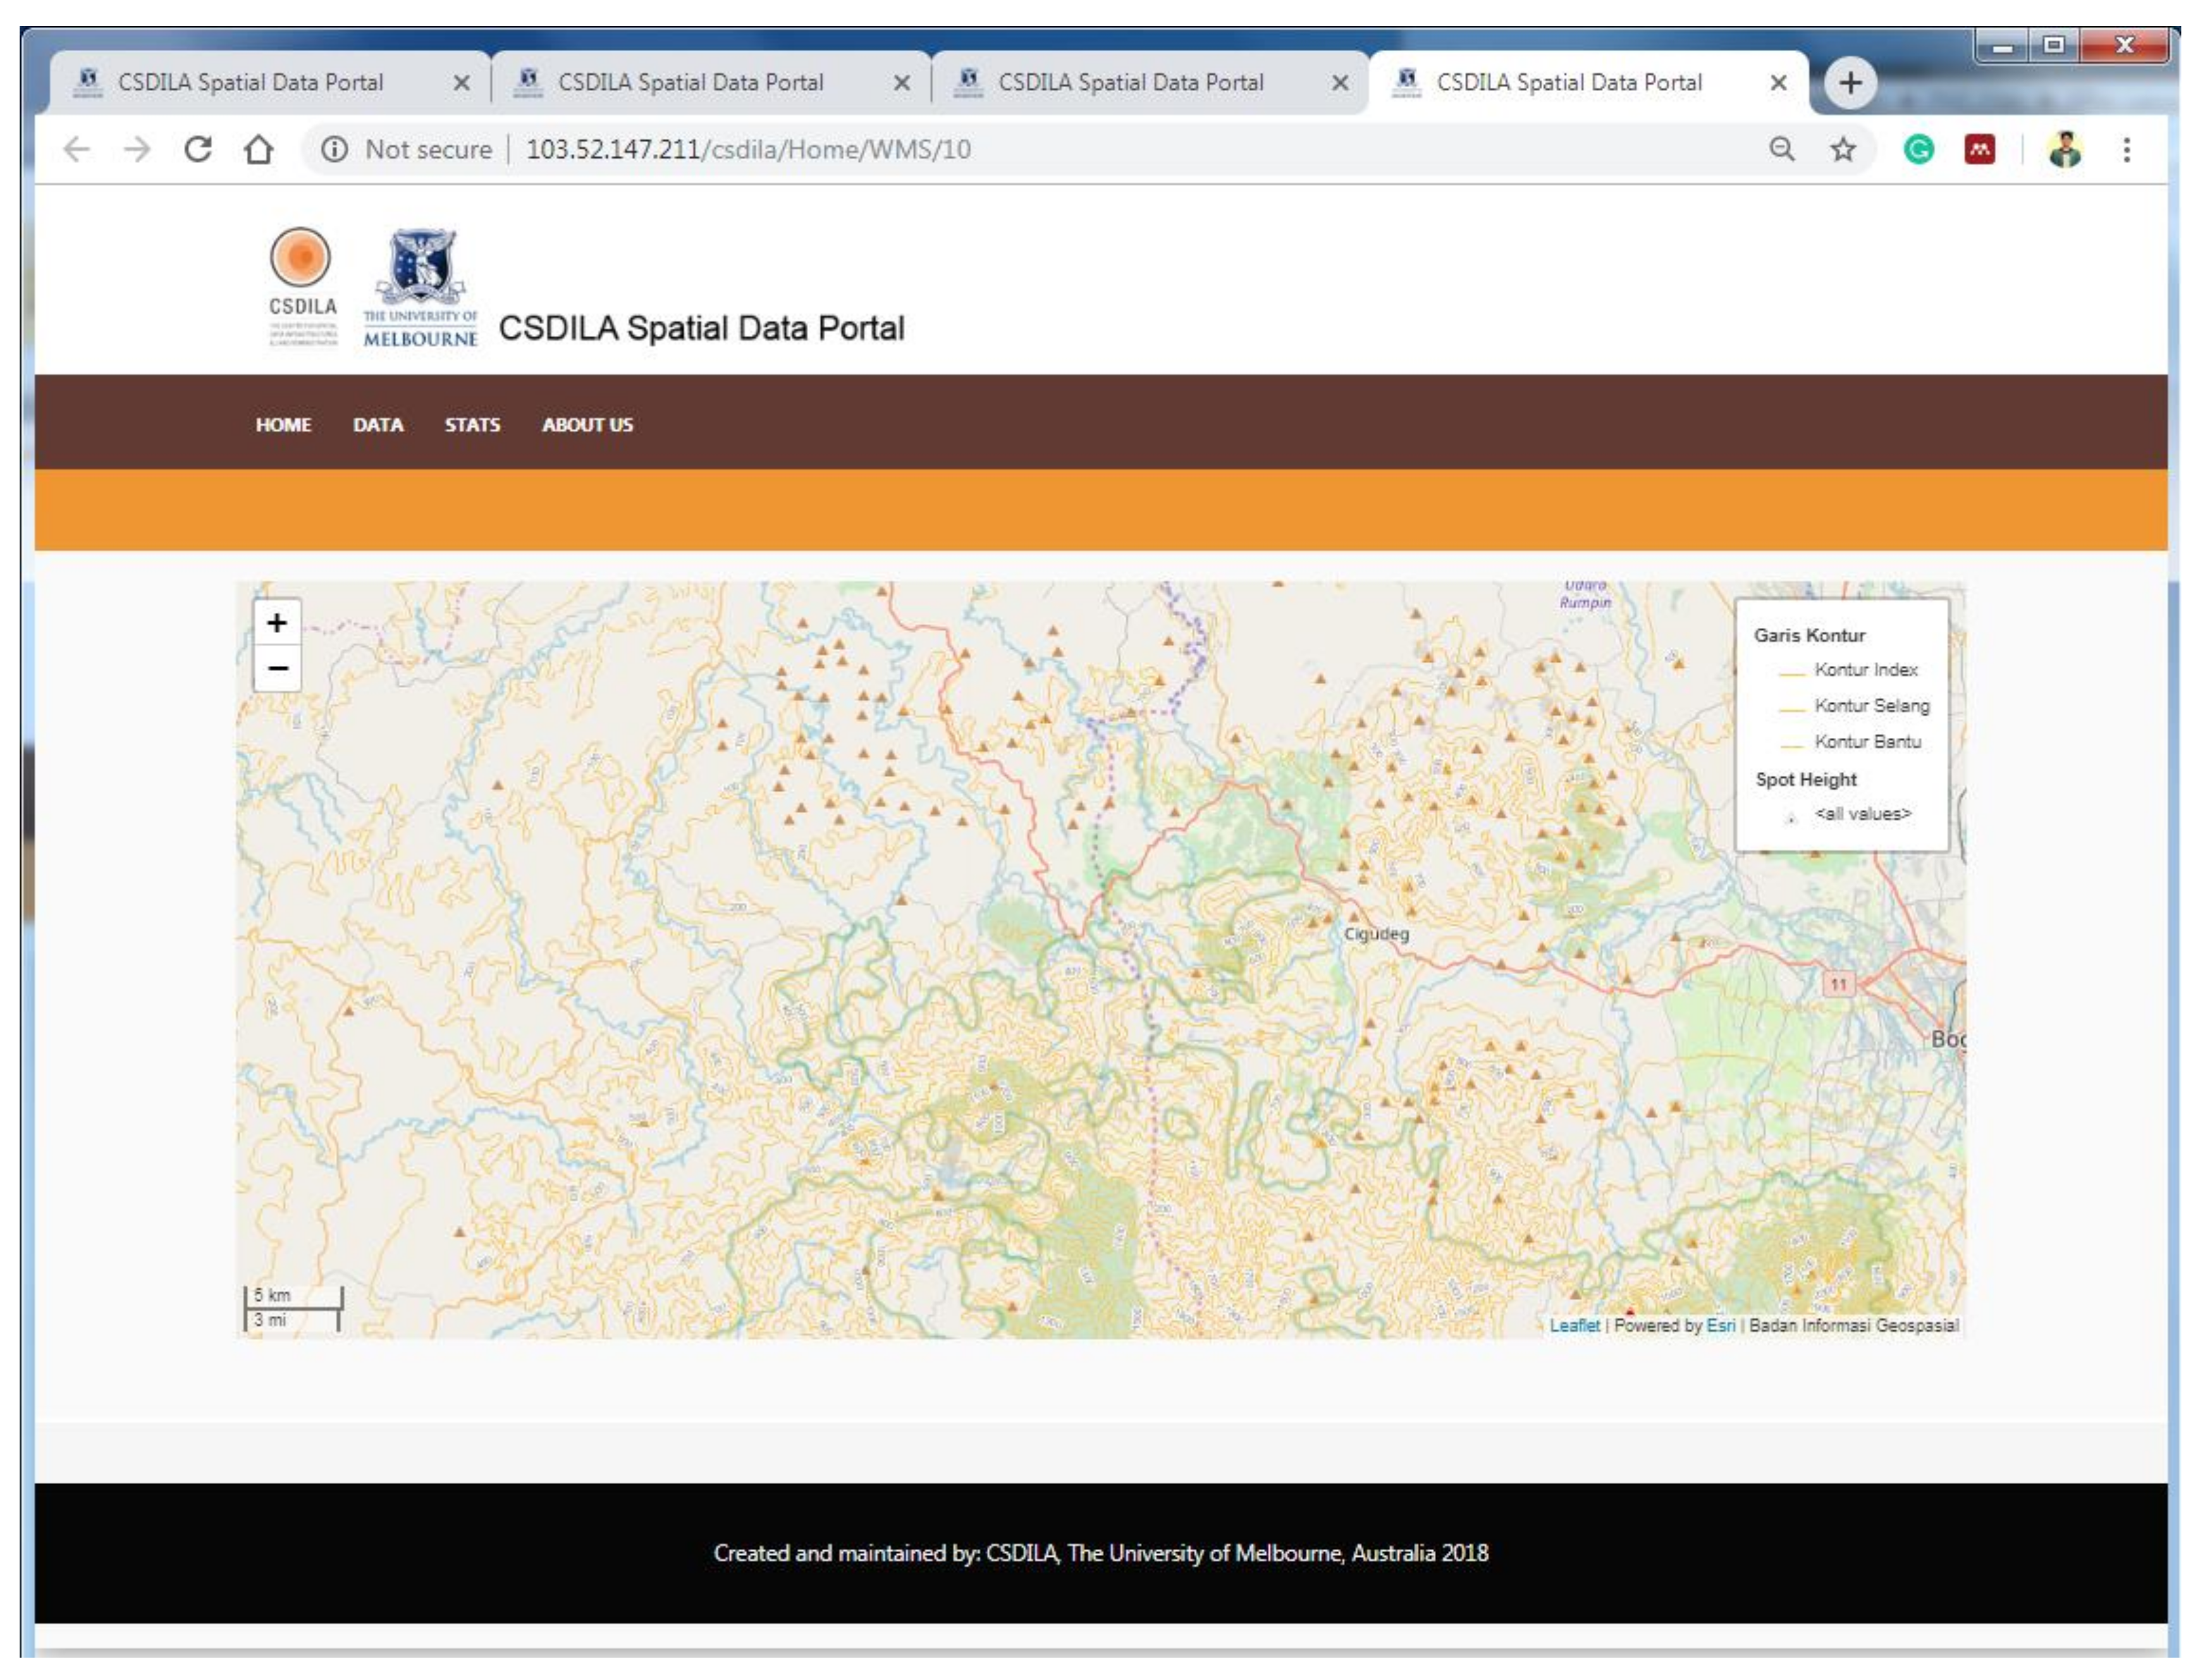
2.2.7. Web Map Service Page
2.3. Evaluating
- Effectiveness. The extent to which spatial data users successfully discover and select spatial data.
- Efficiency. The resource (time) spent by spatial data users to successfully discover and choose spatial data.
- User satisfaction. Emotions, feelings and experiences of spatial data users during the data discovery and selection processes.
3. Results and Interpretation
3.1. Effectiveness
3.1.1. Effectiveness in Spatial Data Discovery
“It’s good, the searching is easy and straightforward, with some options of searching. I can see the results are relevant.”
“The titles in the result page (are) really helpful to quickly find the most relevant data.”
“The titles in the result list. They give me more information than any other portal I’ve used before.”
“The information (used) in the filters in (the) homepage are important.”
“The search was done in no time (because) it can be easily filtered based on user interest and the results (titles) are quite clear and consistent.”
“(The) titles are very helpful since they contain all the required information (what, where, when, who).”
3.1.2. Effectiveness in Spatial Data Selection
“Information presented in the metadata page (is) important and relevant, but some key information for a specific type of data, e.g., interval for contour data, should be presented in the table (view).”
“All and all, the information presented in metadata is clear and necessary.”
“Usecase gives me an idea what dataset might be suitable and what other people said about it.”
“I am confident with the information to make a decision to use the data or not.”
“But I need the reference to the original data source (such as USGS or other institution) to make sure that the data is legit and comes from a valid source.”
“If I only have the metadata information, I am not confident to make a decision and I definitely need to look (at) the data.”
“This authoritative information (publisher and license) is important for the validity of the data.”
“I know that the data is produced and published by a valid organisation, so there is no reason I cannot make a decision whether to use or not the data for my project.”
“But I also need to check the data once it’s downloaded to make sure that the data would be fit to this project.”
“If I only have the metadata information, I am not confident to make a decision and I definitely need to look (at) the data.”
“The information in this page (web map) is somehow more important to me because no matter the quality of the metadata, I (would) need to check the data.”
“This (webmap service) is a must, because I don’t have to download and check the data to play (with) and look at the data. It saves time because I don’t have to download a lot of data and contact a lot of persons to know about the content of the data.”
“It (web map service) gives me a complete sense of the data. For example, if I need a parcel data, and if I can have a look into that specific area without buying or downloading it first, I would be very happy, and I think it (i.e., the web map service) should be a metadata element.”
“I am okay with the information in the metadata and the presentation, but I might have to look on other information from other source(s) as additional information.”
“Usecase and rating help me to have peace of mind about the fitness of the data for my purpose.”
“The usecase is important. If I, let’s say, find out that the data had been used by figures or organisations that are reliable, then it will give me the confidence to use the data. It enhances the quality in a sense of reliability.”
“It’s complementary, but it (i.e., usecase) is important because it gives me objective reviews based on user actual experience, (whilst) the information in the metadata page presents the facts about spatial data. I will consider both (categories of) information to make a decision.”
“I like the rating and number of downloads (because it may suggest that) the higher the rating and number of downloads might be, (the) more relevant or reliable (it might be).”
“The persons who give a rating and download the data can be from different backgrounds with different interests. It would be better and make more sense if the rating and download are presented in a graphics showing groups of users and numbers of download and uses for each group.”
“That would give users useful information about the possibility and availability of other data that might be required for their projects. It will save time and provide insights to users in (the) data searching process.”
“What if it’s rare data that only a few people know about?”
“What if it’s the only available data for that specific theme?”
“I think I might need additional information from other sources.”
3.2. Efficiency
3.2.1. Efficiency in Spatial Data Selection
“I can easily filter the search and the results (i.e., titles) are quite clear and consistent.”
“It’s good, the searching is easy and straightforward, with some options of searching (keywords, filters). I can see the results are relevant.”
“Titles contain all the required information (what, where, when, who) and the consistency is important.”
“The titles saved my time to get basic information about the data without the need to open the metadata page.”
3.2.2. Efficiency in Spatial Data Selection
“I’m quite impressed with the website, as its clear and informative, straightforward, and the information is very useful and enough for me to make a decision whether to use or not the data.”
“I think the system is easy to use. The information is understandable.”
“I think the information is useful to know about the data, but I didn’t know that the titles (in the result list) can be clicked to find metadata. I think you should give a clear instruction on the result page.”
“I didn’t notice about that (the web map service) at the first place, so it requires a sign or instructions to make users notice it in the first place.”
“I don’t know this (contour type: index contour, additional contour). For me, contour line is just one, contour.”
“I don’t know this dataset type.”
“I think it is good to have it (the web map service) because it will save my time to download and check the data (also the money if it’s not free) to check whether the data is valuable for my work or not.”
“Web map service is a must, because I don’t have to download and check the data and can play and have a look at the data and save time since I don’t have to download a lot of data and contact a lot of persons to know about the content of the data.”
3.3. User Satisfaction and Expectations
“This is a good way of (presenting metadata), based on my previous experience with metadata with other software like ArcGIS, Mapinfo and other types of (systems). This approach gives (a) more comprehensive way of presenting metadata.”
3.4. Usability Problems
4. Discussion
5. Conclusions
Author Contributions
Funding
Institutional Review Board Statement
Informed Consent Statement
Acknowledgments
Conflicts of Interest
References
- Comber, A.J.; Fisher, P.F.; Wadsworth, R.A. User-focused metadata for spatial data, geographical information and data quality assessments. In Proceedings of the 10th AGILE International Conference on Geographic Information Science, Aalborg, Denmark, 8–11 May 2007; pp. 1–13. Available online: http://citeseerx.ist.psu.edu/viewdoc/download?doi=10.1.1.84.7278&rep=rep1&type=pdf (accessed on 7 June 2021).
- Goodchild, M. Spatial Accuracy 2.0. 2008. Available online: http://www.geog.ucsb.edu/~good/papers/453.pdf (accessed on 7 June 2021).
- Goodchild, M.F. Beyond metadata: Towards user-centric description of data quality michael f. goodchild 1. Quality. 2007, pp. 1–11. Available online: http://citeseerx.ist.psu.edu/viewdoc/download?doi=10.1.1.162.1404&rep=rep1&type=pdf (accessed on 7 June 2021).
- Han, H.; Giles, C.L.; Manavoglu, E.; Zha, H.; Zhang, Z.; Fox, E.A. Automatic document metadata extraction using support vector machines. In Proceedings of the 2003 Joint Conference on Digital Libraries, Houston, TX, USA, 27–31 May 2003; IEEE: Piscataway, NJ, USA, 2004; pp. 37–48. [Google Scholar]
- Norlund, P. Automatic and Semi-Automatic Methods for Metadata Creation and Maintenance: Long Term Implemen-Tation of the INSPIRE Directive, (August). 2010. Available online: http://www.diva-portal.org/smash/record.jsf?pid=diva2:383048 (accessed on 7 June 2021).
- Kalantari, M.; Rajabifard, A.; Olfat, H.; Pettit, C.; Keshtiarast, A. Automatic spatial metadata systems—The case of Australian urban research infrastructure network. Cartogr. Geogr. Inf. Sci. 2016, 44, 327–337. [Google Scholar] [CrossRef]
- Kalantari, M.; Rajabifard, A.; Olfat, H.; Williamson, I. Geospatial Metadata 2.0—An approach for Volunteered Geographic Information. Comput. Environ. Urban Syst. 2014, 48, 35–48. [Google Scholar] [CrossRef]
- Olfat, H.; Kalantari, M.; Rajabifard, A.; Senot, H.; Williamson, I. Spatial metadata automation: A key to spatially enabling platform. Int. J. Spat. Data Infrastruct. Res. 2012, 7, 173–195. [Google Scholar] [CrossRef]
- Olfat, H.; Kalantari, M.; Rajabifard, A.; Senot, H.; Williamson, I.P. A GML-based approach to automate spatial metadata updating. Int. J. Geogr. Inf. Sci. 2013, 27, 231–250. [Google Scholar] [CrossRef]
- Ahonen-Rainio, P. Visualisation of Geospatial Metadata for Selecting Geographic Datasets; Helsinki University of Technology: Espoo, Finland, 2005. [Google Scholar]
- Ahonen-Rainio, P.; Kraak, M.-J. Deciding on Fitness for Use: Evaluating the Utility of Sample Maps as an Element of Geospatial Metadata. Cartogr. Geogr. Inf. Sci. 2005, 32, 101–112. [Google Scholar] [CrossRef]
- Arenas, H.; Harbelot, B.; Cruz, C. A Semantic Web Approach for Geodata Discovery; Lecture Notes in Computer Science (Including Subseries Lecture Notes in Artificial Intelligence and Lecture Notes in Bioinformatics); HAL: Hong Kong, China, 2014; Volume 8697, pp. 117–126. [Google Scholar]
- Athanasiou, S.; Georgomanolis, N.; Patroumpas, K.; Alexakis, M.; Stratiotis, T. TripleGeo-CSW: A middleware for exposing geospatial catalogue services on the semantic web. In Proceedings of the CEUR Workshop Proceedings, Brussels, Belgium, 28–29 September 2015; Volume 1330, pp. 229–236. [Google Scholar]
- Boin, A.; Hunter, G. What Communicates Quality to the Spatial Data Consumer? Qual. Aspects Spat. Data Min. 2008, 34, 285–296. [Google Scholar] [CrossRef]
- Devillers, R.; Gervais, M.; Bédard, Y.; Jeansoulin, R. Spatial data quality: From metadata to quality indicators and contextual end—User manual. In Proceedings of the OEEPE/ISPRS Joint Workshop on Spatial Data Quality Management, Istanbul, Turkey, 21–22 March 2002; pp. 44–45. [Google Scholar] [CrossRef]
- Devillers, R.; Bedard, Y.; Jeansoulin, R.; Moulin, B. Towards spatial data quality information analysis tools for experts assessing the fitness for use of spatial data. Int. J. Geogr. Inf. Sci. 2007, 21, 261–282. [Google Scholar] [CrossRef]
- Fugazza, C.; Pepe, M.; Oggioni, A.; Tagliolato, P.; Carrara, P. Streamlining geospatial metadata in the Semantic Web. IOP Conf. Ser. Earth Environ. Sci. 2016, 34, 012009. [Google Scholar] [CrossRef]
- Patroumpas, K.; Georgomanolis, N.; Stratiotis, T.; Alexakis, M.; Athanasiou, S. Exposing INSPIRE on the Semantic Web. J. Web Semant. 2015, 35, 53–62. [Google Scholar] [CrossRef]
- Patroumpas, K.; Alexakis, M.; Giannopoulos, G.; Athanasiou, S. TripleGeo: An ETL tool for transforming geospatial data into RDF triples. In Proceedings of the CEUR Workshop Proceedings, Athens, Greece, 28 March 2014; pp. 275–278. [Google Scholar]
- Ivánová, I.; Morales, J.; De By, R.A.; Beshe, T.S.; Gebresilassie, M.A. Searching for spatial data resources by fitness for use. J. Spat. Sci. 2013, 58, 15–28. [Google Scholar] [CrossRef]
- Limbach, T.; Reiterer, H.; Klein, P.; Müller, F. Visualising metadata: LevelTable vs. GranularityTable in the SuperTable/scatterplot framework. In Human–Computer Interaction: Theory and Practice (Part II); CRC Press: Boca Raton, FL, USA, 2003; Volume 2, pp. 1106–1110. [Google Scholar]
- Lacasta, J.; Nogueras-Iso, J.; Bejar, R.; Muro-Medrano, P.; Zarazaga-Soria, F.; Miguel, J.L. A Web Ontology Service to facilitate interoperability within a Spatial Data Infrastructure: Applicability to discovery. Data Knowl. Eng. 2007, 63, 947–971. [Google Scholar] [CrossRef]
- Kalantari, M.; Syahrudin, S.; Rajabifard, A.; Subagyo, H.; Hubbard, H. Spatial Metadata Usability Evaluation. ISPRS Int. J. Geo-Inf. 2020, 9, 463. [Google Scholar] [CrossRef]
- Kalantari, M.; Syahrudin, S.; Rajabifard, A.; Hubbard, H. A Proposal for a User-Oriented Spatial Metadata Profile. ISPRS Int. J. Geo-Inf. 2021, 10, 376. [Google Scholar] [CrossRef]
- Caulton, D.A. Relaxing the homogeneity assumption in usability testing. Behav. Inf. Technol. 2001, 20, 1–7. [Google Scholar] [CrossRef]


| User Interface | Metadata Records |
|---|---|
|
|
|
|
|
|
|
|
| |
| |
| |
|
Publisher’s Note: MDPI stays neutral with regard to jurisdictional claims in published maps and institutional affiliations. |
© 2021 by the authors. Licensee MDPI, Basel, Switzerland. This article is an open access article distributed under the terms and conditions of the Creative Commons Attribution (CC BY) license (https://creativecommons.org/licenses/by/4.0/).
Share and Cite
Kalantari, M.; Syahrudin, S.; Rajabifard, A.; Hubbard, H. Synchronising Spatial Metadata Records and Interfaces to Improve the Usability of Metadata Systems. ISPRS Int. J. Geo-Inf. 2021, 10, 393. https://0-doi-org.brum.beds.ac.uk/10.3390/ijgi10060393
Kalantari M, Syahrudin S, Rajabifard A, Hubbard H. Synchronising Spatial Metadata Records and Interfaces to Improve the Usability of Metadata Systems. ISPRS International Journal of Geo-Information. 2021; 10(6):393. https://0-doi-org.brum.beds.ac.uk/10.3390/ijgi10060393
Chicago/Turabian StyleKalantari, Mohsen, Syahrudin Syahrudin, Abbas Rajabifard, and Hannah Hubbard. 2021. "Synchronising Spatial Metadata Records and Interfaces to Improve the Usability of Metadata Systems" ISPRS International Journal of Geo-Information 10, no. 6: 393. https://0-doi-org.brum.beds.ac.uk/10.3390/ijgi10060393