1. Introduction
COVID-19 is a novel coronavirus that spreads rapidly from person to person. The COVID-19 pandemic is still raging around the world. It has seriously threatened people’s health and life, and impeded the development of society and the economy. At the beginning of 2020, the pandemic broke out in Wuhan. The large population and developed public transportation in Wuhan, as well as intensive intra- and inter-city human mobility, exacerbated the spread of the pandemic. Due to the insufficient knowledge about COVID-19 and inadequate capacity for medical treatment in the early days of the outbreaks, cross-infection was obvious in Wuhan during that period. Confirmed cases rose sharply, and the health system was broken down. The pandemic was not effectively controlled until a series of measures such as a city lockdown and community closures were implemented. We all knew that population mobility would further spread the virus, but we did not know who could spread it and how it works. Moreover, there had already been a certain number of infections in the early outbreak of the pandemic in Wuhan, and it was hard to specifically map the distribution of cases and the tracks of disease transmission, resulting in a weak effect of big data in the analysis of personal mobility trajectory. Therefore, we needed to find another way to analyze the relationship between population mobility and the transmission risk of COVID-19.
Considering the complicated situation in Wuhan at that time, we proposed a statistical method to find areas of high infection risk. This method could be used to target high risk areas in the emergent events of public health. The basic assumptions of this method are as follows: ① population mobility would further spread the virus, ② people who had ever gone to the South China Seafood Wholesale Market, where COVID-19 was found at the early stage of the pandemic may spread the coronavirus, ③ people may be exposed to cross-infection at hospitals. This means we can find high infection risk areas by finding where the people who are most closely connected with South China Seafood Wholesale Market and general hospitals are. This work is of great importance from the perspective of the prevention and control of the pandemic. Identifying high-risk areas as soon as possible, formulating well-directed prevention and control measures for COVID-19, and timely evaluating the effects of relevant measures are the macro basis for effectively interrupting the spread of the COVID-19 pandemic. On the other hand, this work is also quite necessary from an academic point of view. Although there are many studies in the literature on analyzing the impacts that human mobility has on the dispersal of infectious diseases at the macro-geographic scale, there are relatively fewer studies about exploring the relationships between population distribution, people’s travel models, and the spatial pattern of infection within cities [
1,
2].
Financially supported by Wuhan government, to fully make use of big data in prevention and control of the pandemic, we explored the relationships between human mobility and the disease transmission by using big data. The first task of this study is to identify the areas with high risk of disease transmission and analyze the impacts that different populations had on the disease transmission based on the data of human mobility. This can assist in the design of targeted control measures at the macro scale. The second task is the follow-up assessment of prevention and control measures for the pandemic, which contributes to promptly identify loopholes in the measures and improve them. The third task is to investigate the application of big data of human mobility in the research about the pandemic, providing technological support for the prevention and control of the pandemic on a regular basis.
In this paper, we mainly use mobile phone signaling data from Unicom (a mobile phone company) users and location-based data from Baidu users to analyze the mobilities of different groups of people and how they affect the transmission risks of COVID-19 during the early days of the outbreak. To be more specific, we first investigated the travel patterns of the daily visiting population and nearby commuters of the South China Seafood Wholesale Market in Wuhan. Then, we explored how population aggregation in general hospitals affected the spread of COVID-19 at the early stage. Finally, we qualitatively and quantitatively evaluated the effects of the Wuhan lockdown so as to provide the first-hand “Wuhan experience” to other countries and regions. There are four problems that tended to be discussed in this paper, which are also the main innovations of this work: How did the infection risk spread from the South China Seafood Wholesale Market to the entire Wuhan in the early days of the outbreak? How did the mobilities of the residents, the non-commuters, the commuters, and the people seeking medical services in Wuhan affect the transmission of the epidemic? How did the Wuhan lockdown affect the spread of the disease outside and within the city? Why did infections vary in different cities at the early stage?
The rest of this paper is organized as follows.
Section 2 reviews recent studies on the relationship between human mobility and the dispersal of infectious diseases.
Section 3 introduces the study area, datasets, and methodology of this research. Following that,
Section 4 analyzes how the mobilities of the residents, the non-commuters, the commuters, and the people seeking medical services in Wuhan influenced the spread of infection in order to explore the risk of exposure to infection in the South China Seafood Wholesale Market in Wuhan and the cluster infection risk in general hospitals.
Section 5 evaluates the effects of the Wuhan lockdown from the aims of preventing the spread of the epidemic outside and inside the city, and
Section 6 summarizes the findings, limitations, and future steps of this research.
2. Literary Review
The large-scaled transmission of the epidemic depends on people’s travel behaviors and inter-contact [
1]. With the rapid globalization and development of transportation systems, one-way and two-way population movement, and the migration of people between areas accelerate the spread of epidemics. In recent years, intensive global trade flows and increasing volumes of tourism have caused swift dissemination of infectious diseases beyond geographic bounds, which even become epidemics around the globe, such as Lassa fever [
3], SARS virus [
4], Chikungunya virus [
5], MERS-CoV [
2,
6], Ebola virus [
7,
8], Zika virus [
9], Influenza H1N1 [
10,
11], Dengue virus [
12], et al. Human mobility tightly connects with global public health security, which emphasizes the importance and urgency of exploring the patterns of people’s travel behaviors and their interactions with the spread of infectious diseases. Watts analyzed the relationships between the transmission of Guinea worm and human mobility in urban and rural areas and found that the transmission of the disease relates to the populations who travel between urban and rural areas. Women and children are significant infectious sources. Once they come in contact with polluted water, they would take pathogen to other areas by social connection [
13]. Charaudeau evaluated how commuters’ behaviors affected the spread of 25 types of influenza in France, and pointed out that the main paths of disease transmission during its early stages connect with the structure of the commuting network. In the areas with intensive commuting connections, the morbidity of the diseases is higher than other areas. This feature is affected by travel patterns of commuters of different ages: students’ commuting behaviors have a stronger driving force on the spread of epidemics than the other commuters since students are more susceptible [
14]. Viboud used the Mantel test to verify the correlation between transmission of epidemics and commuting volumes [
15]. Hay says that the influence that infectious diseases have on populations varies with their income levels. People with lower-middle and low income levels suffer from negative and more serious impacts of the spread of infectious diseases [
16]. Some scholars have found that improving disease surveillance capability, controlling sources and vectors of diseases, developing laboratory research ability, and promoting vaccination interventions are important to mitigate further transmission of epidemics [
17,
18].
In recent years, the number of smartphone users has gradually increased in the world [
19]. The location-based services of smartphones make the studies of population movement patterns in fine scale become possible, and also support studies on the relationships between human mobility and epidemic dissemination. Based on mobile phone signaling data, Wesolowski analyzed population mobility patterns and their effects on the spread of the Ebola virus, Dengue virus, rubella, and some other epidemics [
20,
21,
22]. Under the context of the outbreak of the COVID-19, many scholars show relevant research results based on big data produced by signaling and location-based services of smartphones, which have played crucial roles in the control of epidemics. President Xi investigated the works of the prevention and control of COVID-19 in Beijing on 2 March 2020. He said that we should make full use of artificial intelligence, digital big data, and other novel technologies to conduct epidemiological and traceability investigations as well as to improve the accuracy and efficiency of screening in order to figure out where the virus came from and where it spread. The Ministry of Industry and Information Technology of China cooperates with mobile phone companies and internet companies, locating users’ coordinates based on their premises and tracing the movement of infected patients, which is beneficial to the implementation of emergency responses, such as quarantine and timely medical treatment. Based on users’ location data, combined with the inquiry system for confirmed patients on the same vehicles and the real-time update system for the epidemic data on Wechat, 360, and other online platforms, Baidu, Tencent and other internet companies produced population migration maps during the 2020 Spring Festival. These maps were used to explore the characteristics of people who travel in and out of cities, especially outflows from the key areas, and provide real-time data and services support to the epidemic control. Peng points out that the emergency response and management systems of public health events in the information age should respond to problems from all directions and at multiple levels, and he established an analysis framework composed of information about epidemic, medical, political, public, and media situations [
23]. Xu studied the spatial distribution of people who traveled from Wuhan before the Spring Festival in 2020 and found that it is similar with that in previous years [
24]. Zhou investigated the correlation between the volume of migration population and the disease morbidity based on the characteristics of the size and distribution of the outflow population from Wuhan [
25]. Zhao utilized big data to trace back the trend and transmission coefficient of the spread of COVID-19. Zhoa’s study says that at the early stage of the outbreak of COVID-19 (before 24 January 2020), people who departed from Wuhan were the main threat to the dissemination of the disease in other cities, and then the local mutual infection appears. The study proves that the Chinese government makes great and positive contributions to prevent the further dispersal of the infection within the nation and around the world [
26]. Li’s findings show that human mobility accelerates the transmission of the epidemic. For every one standard deviation increase in population mobility, the number of confirmed cases will increase by 12.8% standard deviation [
27]. Tian combined the reported cases with data for people’s travel behaviors and public health interventions and evaluated how a series of Wuhan lockdown measures affected the transmission and control of COVID-19. The findings point out that the Wuhan lockdown slowed the spread of the epidemic to other areas by an estimated 2.91 days, delaying the epidemic growth in other cities in China [
28]. Karamer used real-time population mobile data and the travel history of a part of COVID-19 patients to explore the impact of the infected population’s travels between cities and the effect of transmission control measures. The results show that the Wuhan lockdown achieved great restriction on the dispersal of infection during the early days of the outbreak, but that this restriction decreases as the spread of the epidemic expanded [
29]. However, due to the limits of data collection of smartphones’ location-based services, it is impossible to trace actual transmission route or simulate contacts between individuals.
Aside from the above-mentioned topics, researchers also do much work in other fields. Moraci discusses the vulnerability of the city and urban systems under the influence of the COVID-19 pandemic. Various urban resilience indicators from European experiences, such as community vulnerabilities, healthcare system capacity, and emergency response capabilities, need to be considered in the urban planning system. More strategies and possible tools focusing on supporting mobility resilience are vital for the post-pandemic era [
30]. Campisi found that travel habits have been greatly changed under the city shock of the COVID-19 pandemic. The sustainable urban mobility modes are facing the challenge of the pandemic. Micro-mobility plays a more important role in daily travel in the European city [
31]. Dettori found that the COVID-19 mortality rate is not just related to the healthcare system but is also affected by the regional environment, especially the atmospheric pollution [
32]. Ceylan predicates the epidemiological trend of COVID-19’s prevalence by ARIMA time series models in the most affected European countries. The models show a great understanding of the trends of pandemic outbreaks, which help health departments to reallocate resources to strengthen the surveillance system in those countries [
33].
3. Study Area, Datasets, and Methodology
3.1. Study Area
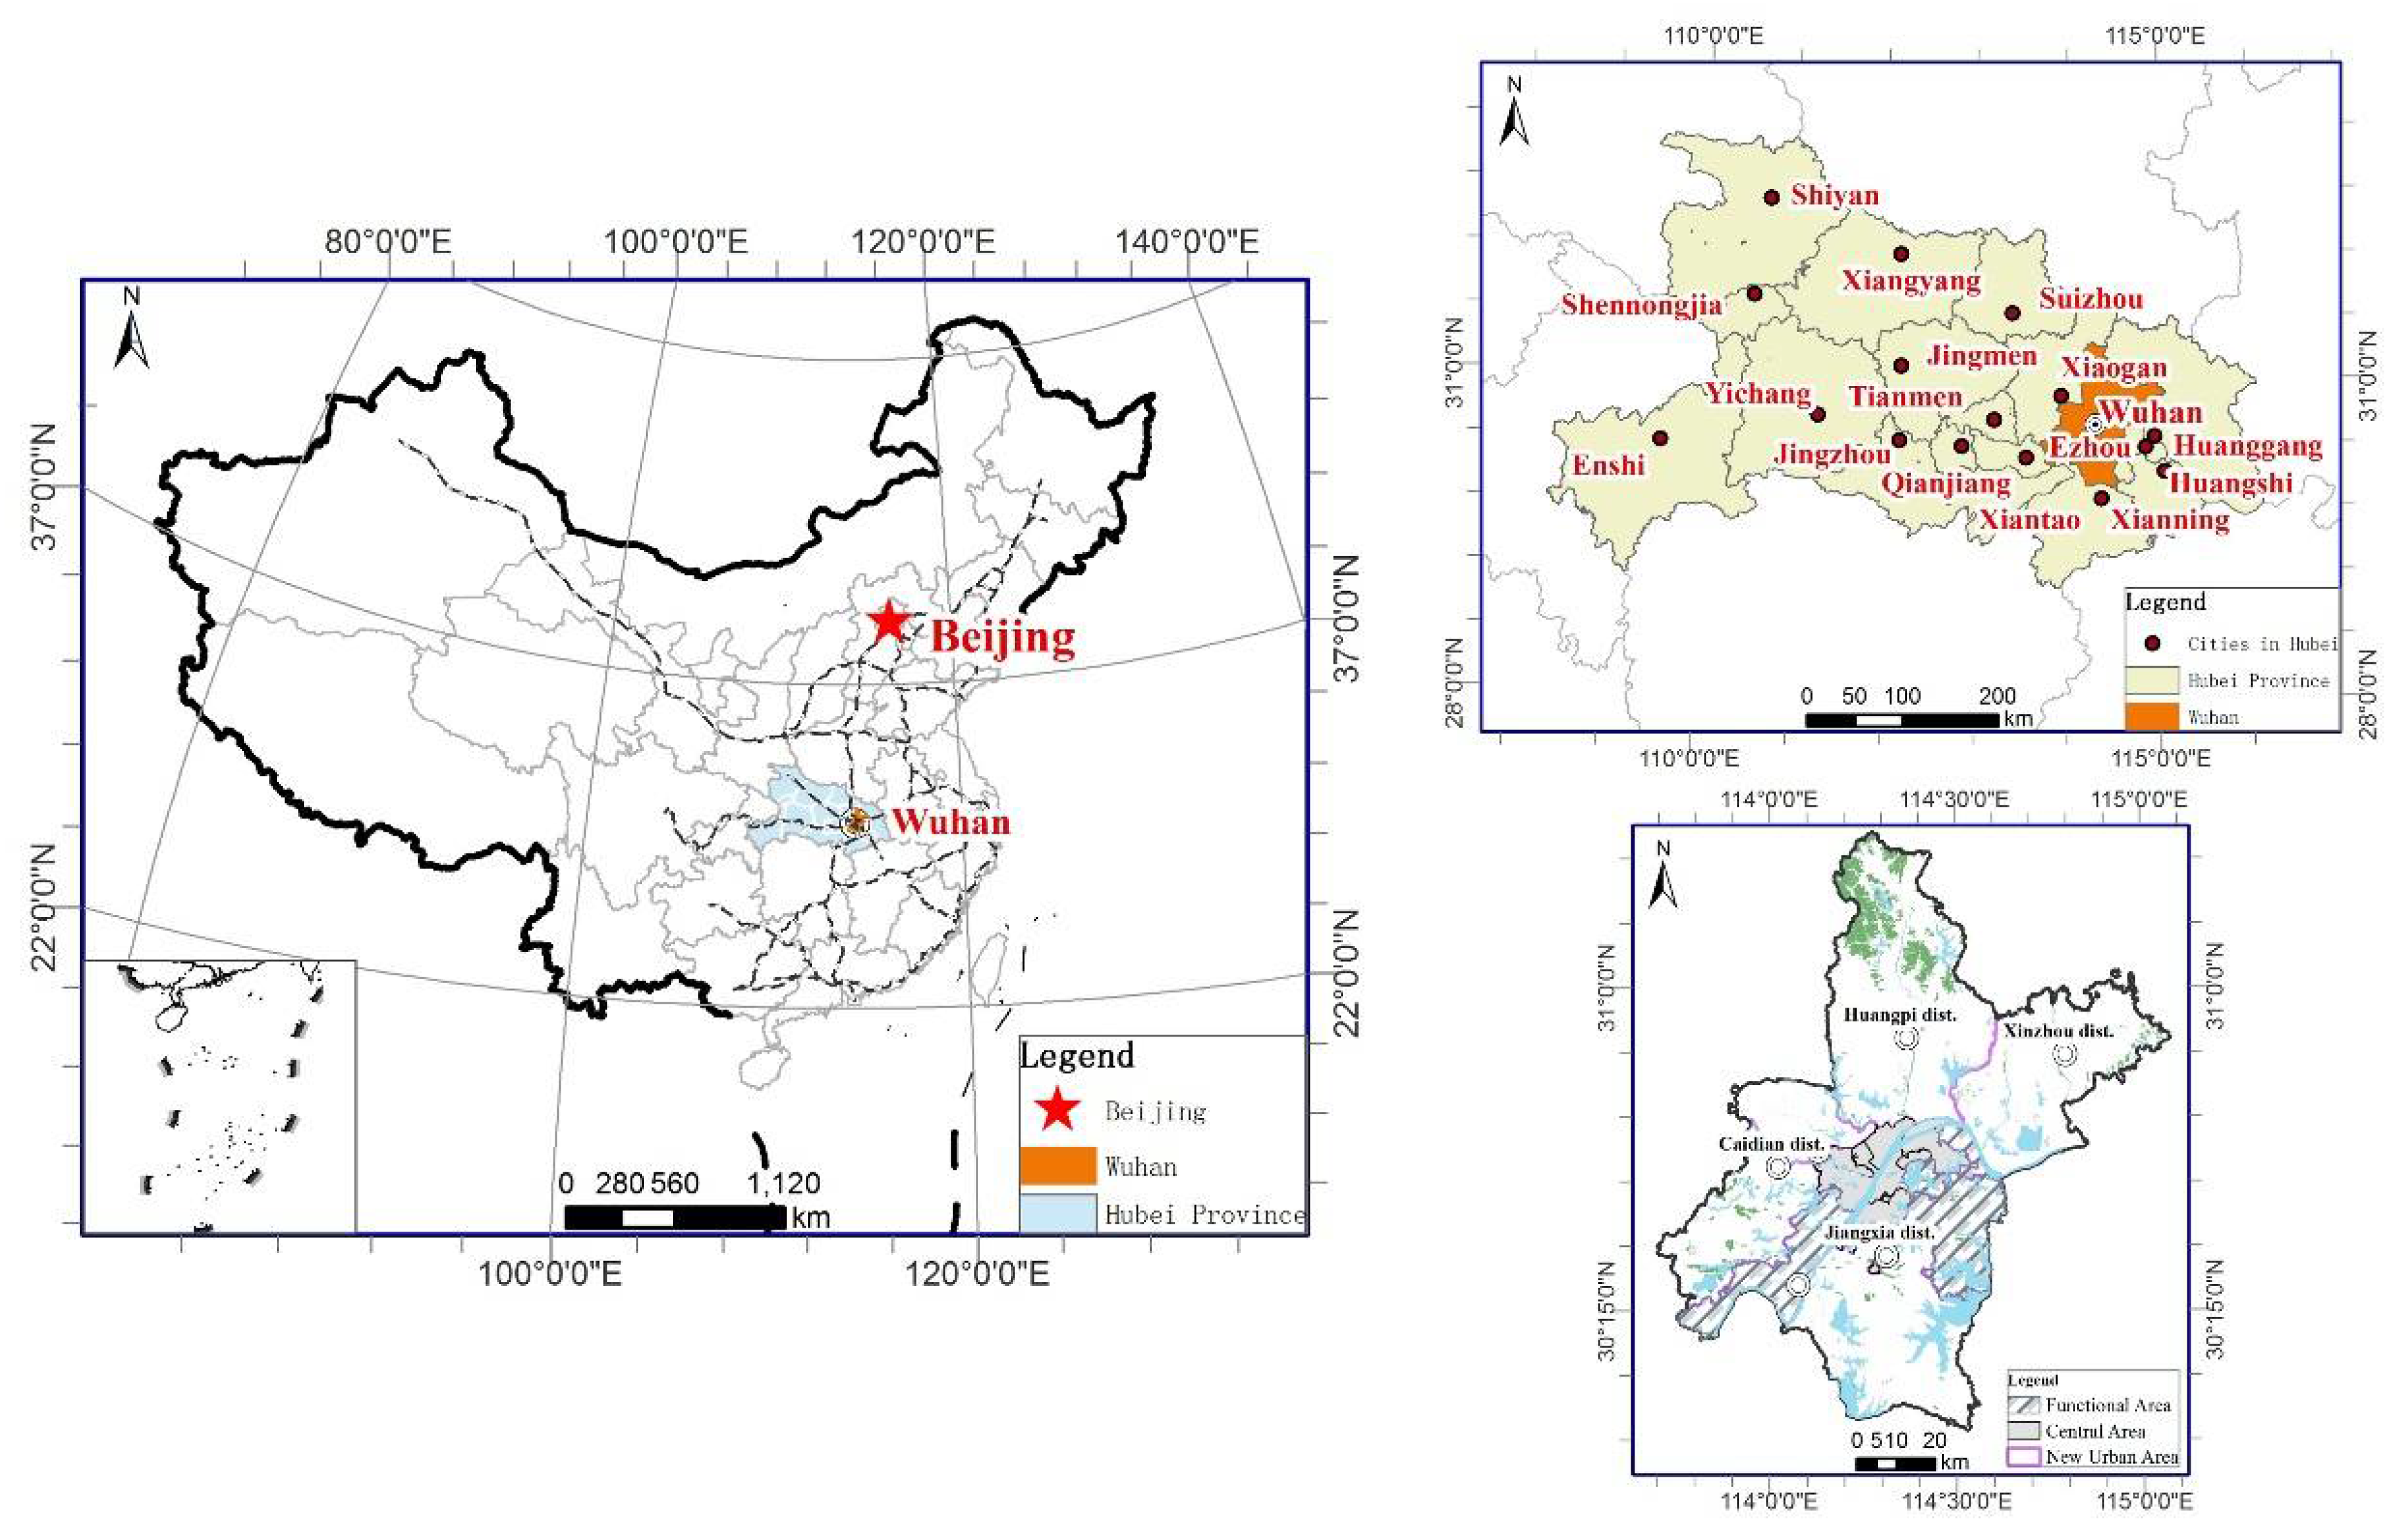
Wuhan, located in the heart of China, is the only megalopolis in the middle region of China and an important transportation hub, which is called “the city connected with nine provinces”. Wuhan consists of 15 administrative districts, which are divided into 3 categories according to their economic development and roles in urban development: the central urban areas, functional areas, and new urban areas. From the perspective of geography, these administrative districts in Wuhan are spatially separated by the Yangtze river and the Han river into three parts, including Wuchang, Hankou, and Hanyang, called “three towns in Wuhan”. The location of Wuhan is shown in
Figure 1.
3.2. The South China Seafood Wholesale Market in Wuhan
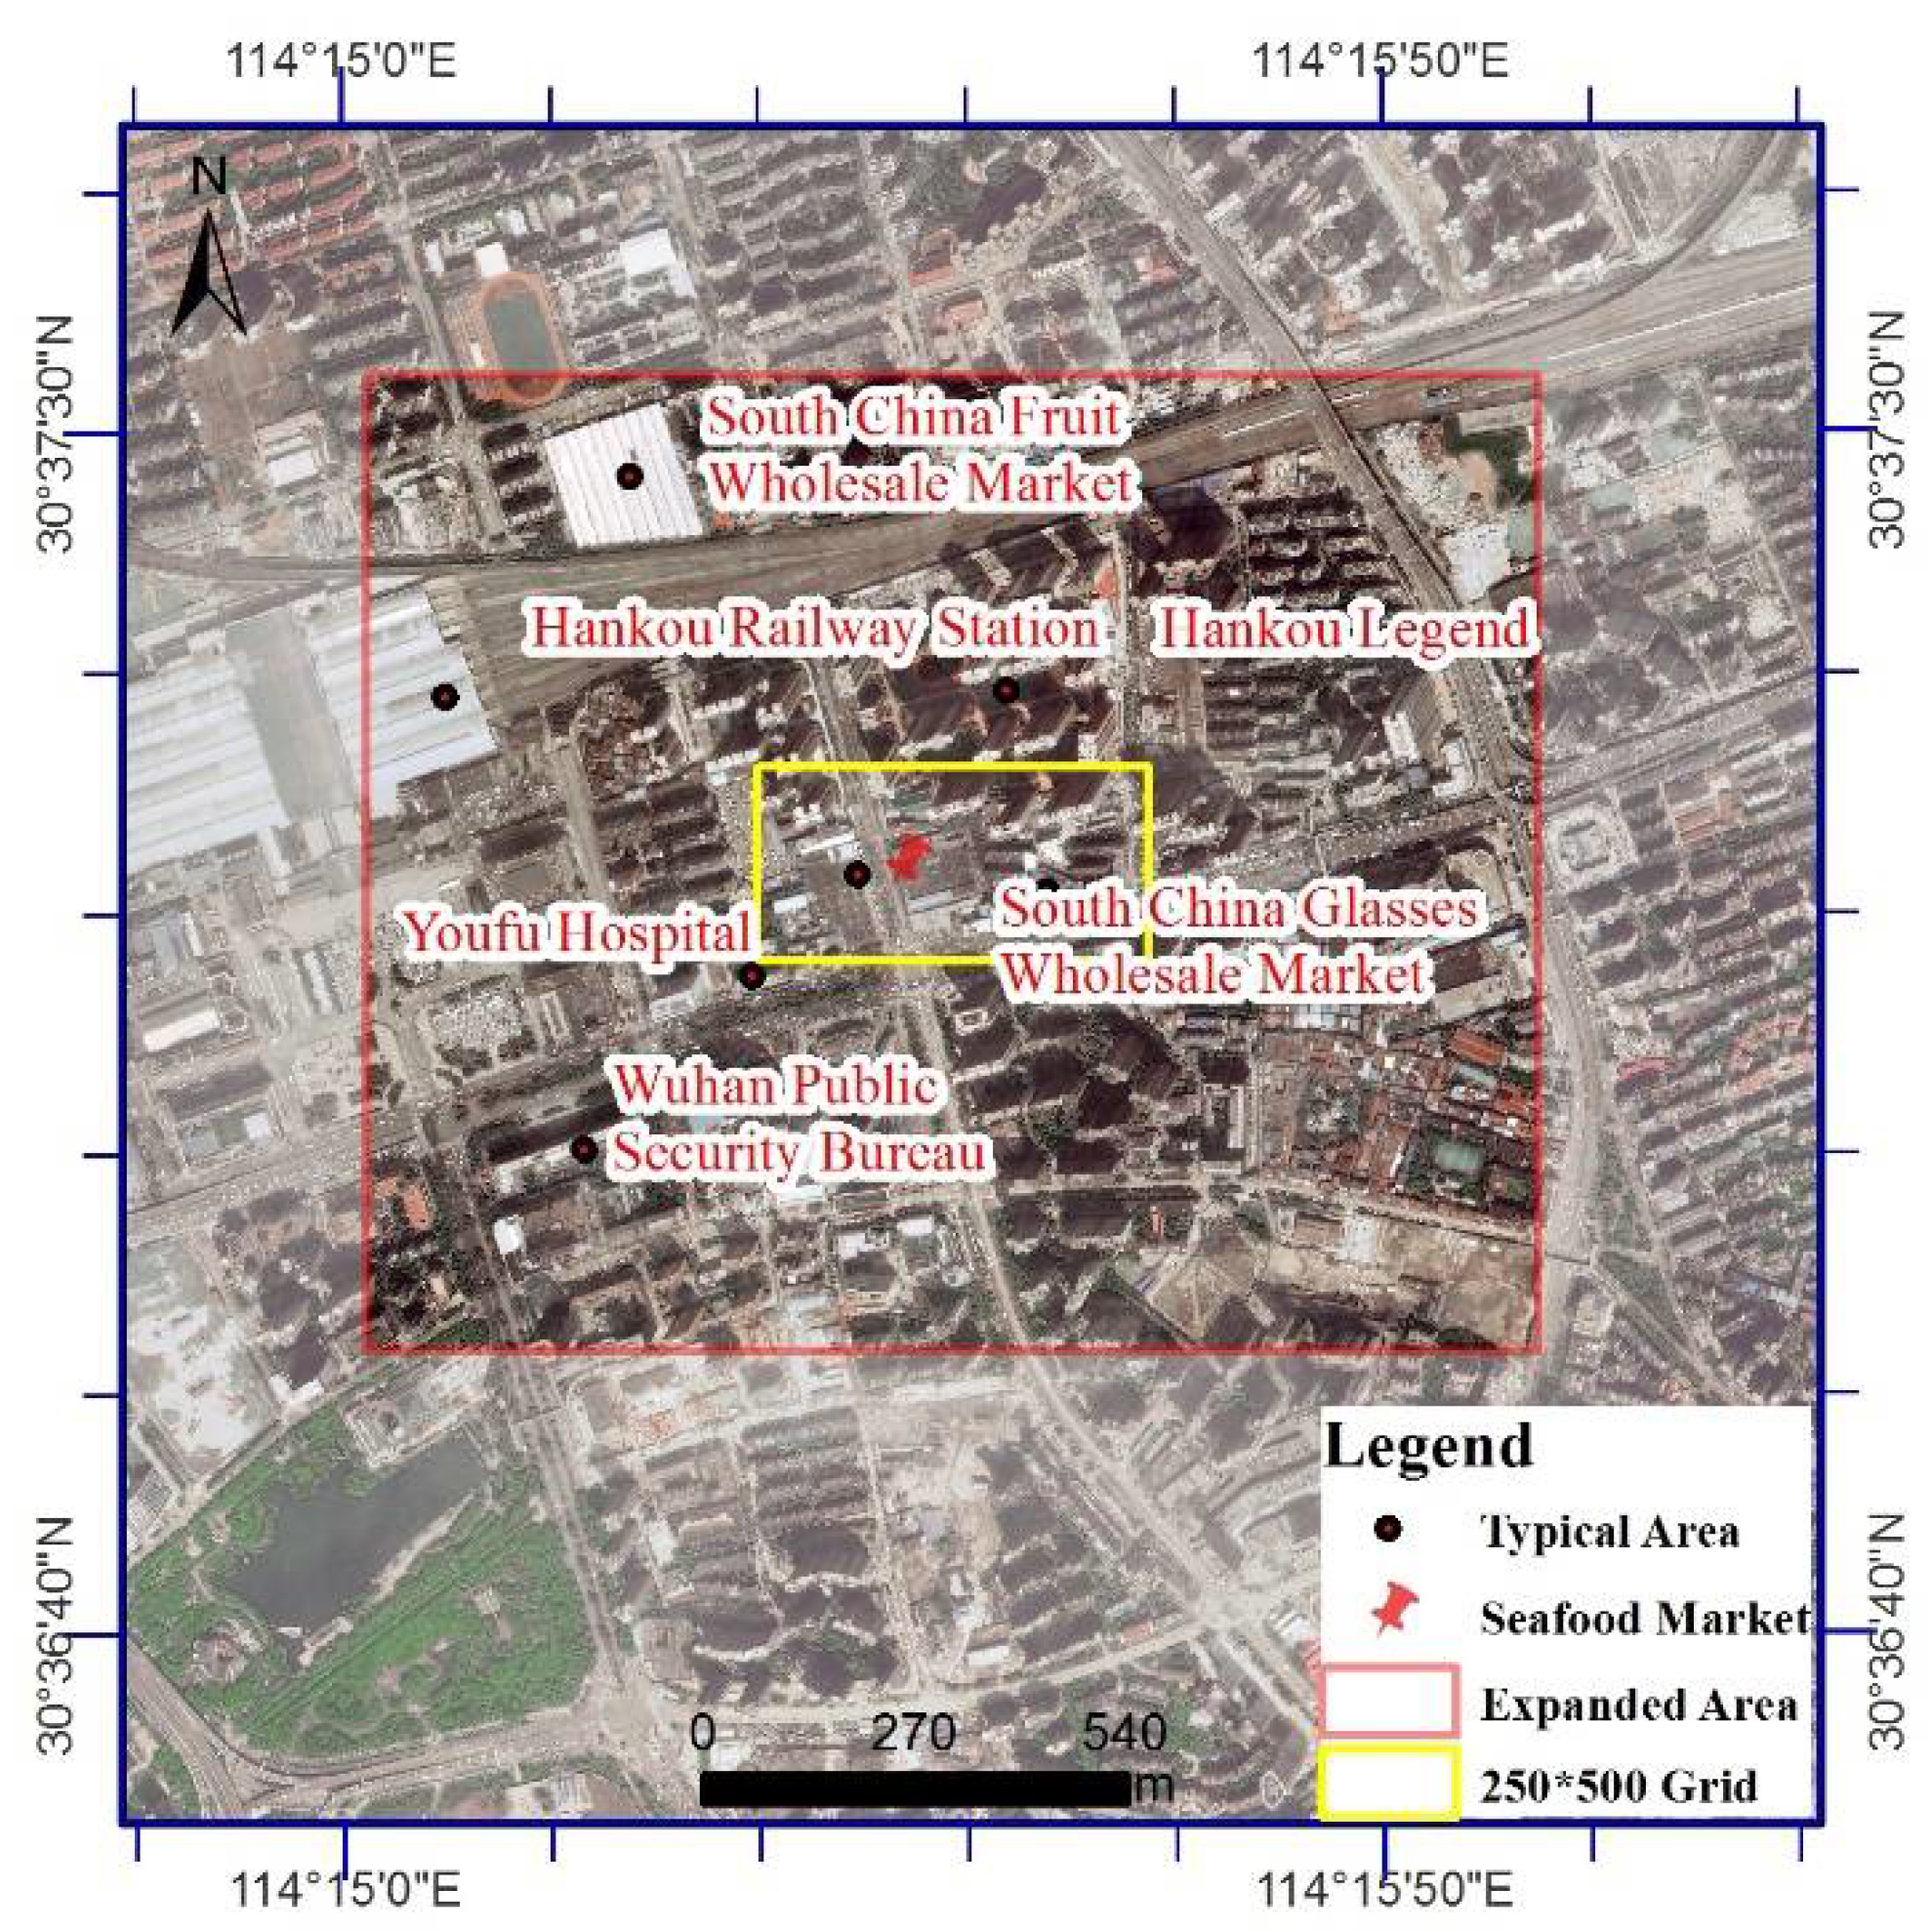
The South China Seafood Wholesale Market in Wuhan, the biggest seafood wholesale market in the middle of China, integrating the businesses of seafood, ice fresh food, aquatic products, dry goods, etc., is located in the Jianghan District. In December 2019, when several patients infected with COVID-19 appeared around the market, the market apparently became a site of high transmission risk. Due to the restriction of users’ location accuracy and confidentiality regulations, the resolution of the data used in this research is 250 m × 250 m. The entire seafood wholesale market covers two grid units. Because few commuters travel from and to these two grids according to the big data analysis results, it is hard to reveal the nearby commuters’ behaviors. In addition, the surrounding residential neighborhoods and companies’ living quarters also have higher transmission risks, and thus we expanded the study area of the wholesale market by 500 m to analyze the nearby commuters’ travel patterns and their potential impacts on the spread of the epidemic. The expanded study area covers the Hankou Legend neighborhood, the Wuhan Public Security Bureau, as well as other neighborhoods, schools, companies, institutes, commercial centers, and hospitals. The study area is shown in
Figure 2. The yellow part in the figure represents the grid where the market is located, and the red part shows the expanded area.
3.3. General Hospitals in Wuhan
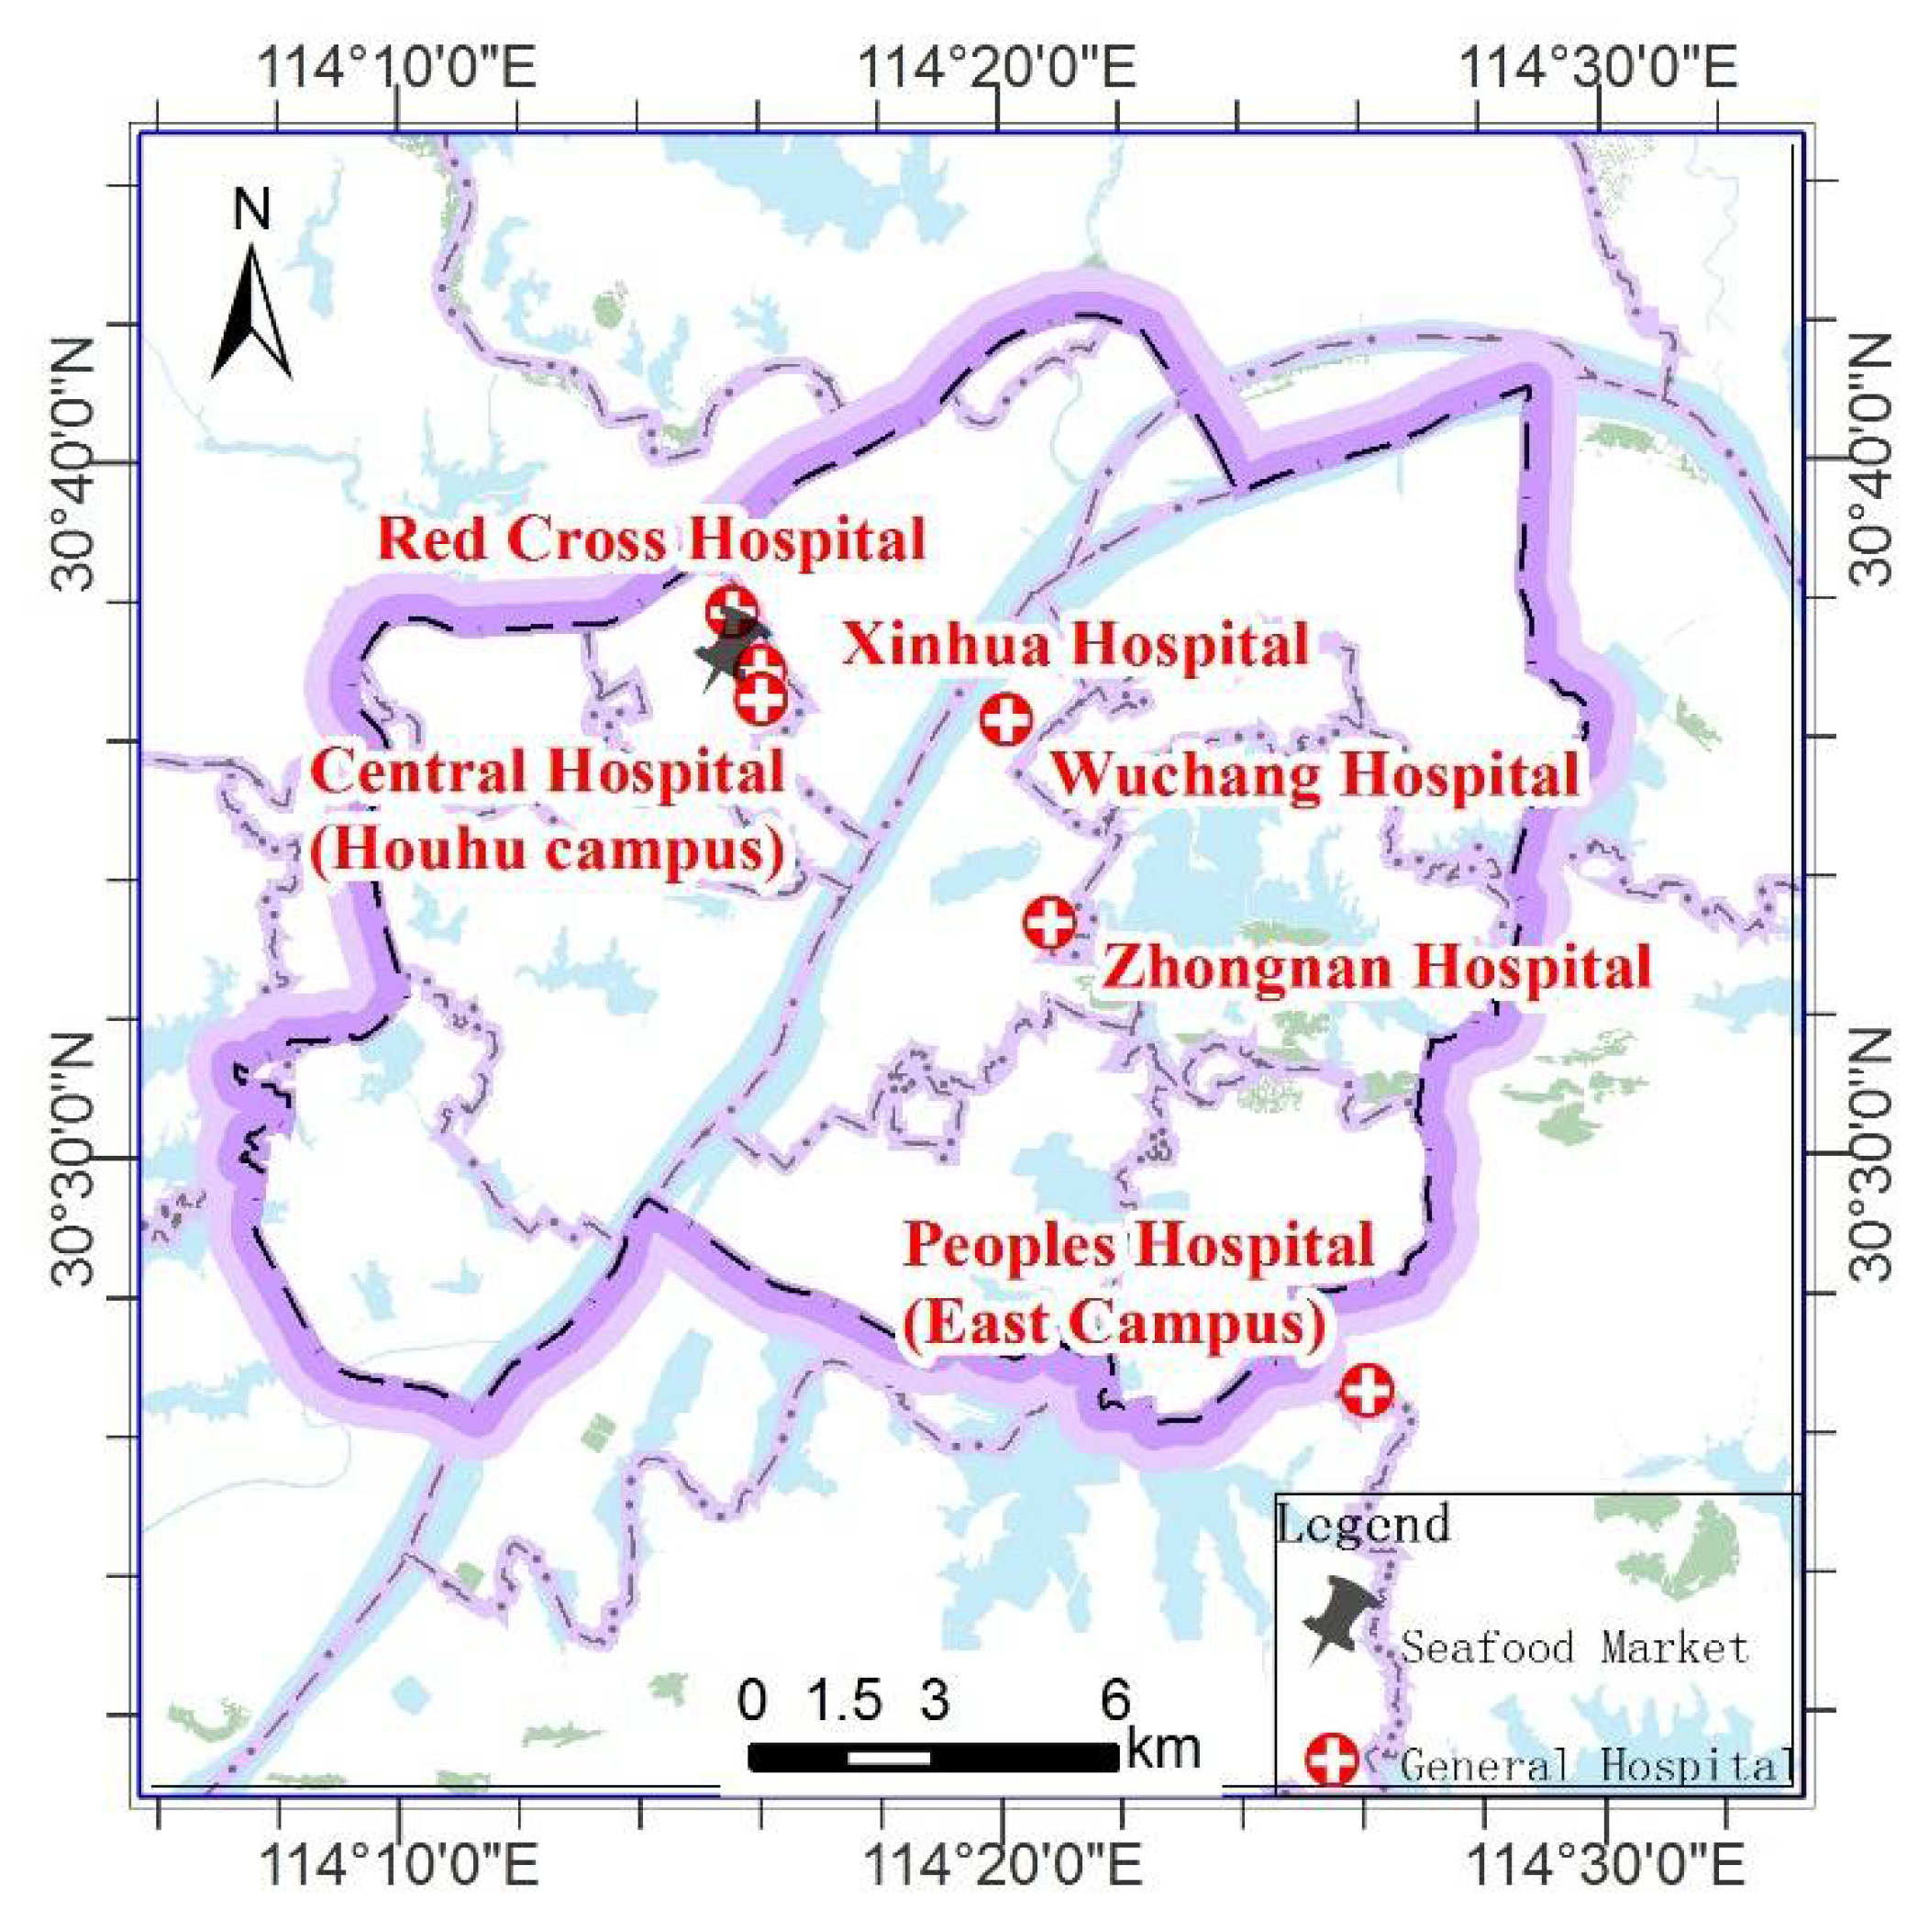
There are a total of 974 medical and health institutions (not include village clinics) in Wuhan. In this paper, we took hospitals which received COVID-19 patients at the earliest time as subjects, including Tongji Hospital, Union Hospital, Central Hospital (Houhu campus), Red Cross Hospital, Xinhua Hospital, Wuhan University Central South Hospital, People’s Hospital, and Wuchang Hospital. The distribution of these general hospitals is shown in
Figure 3.
3.4. Datasets and Methodology
This paper used mobile phone signaling data from Unicom users and location-based data from Baidu users from 2019 to 2020, as well as the case reports of patients infected with COVID-19.
3.4.1. Unicom Users’ Phone Signaling Data
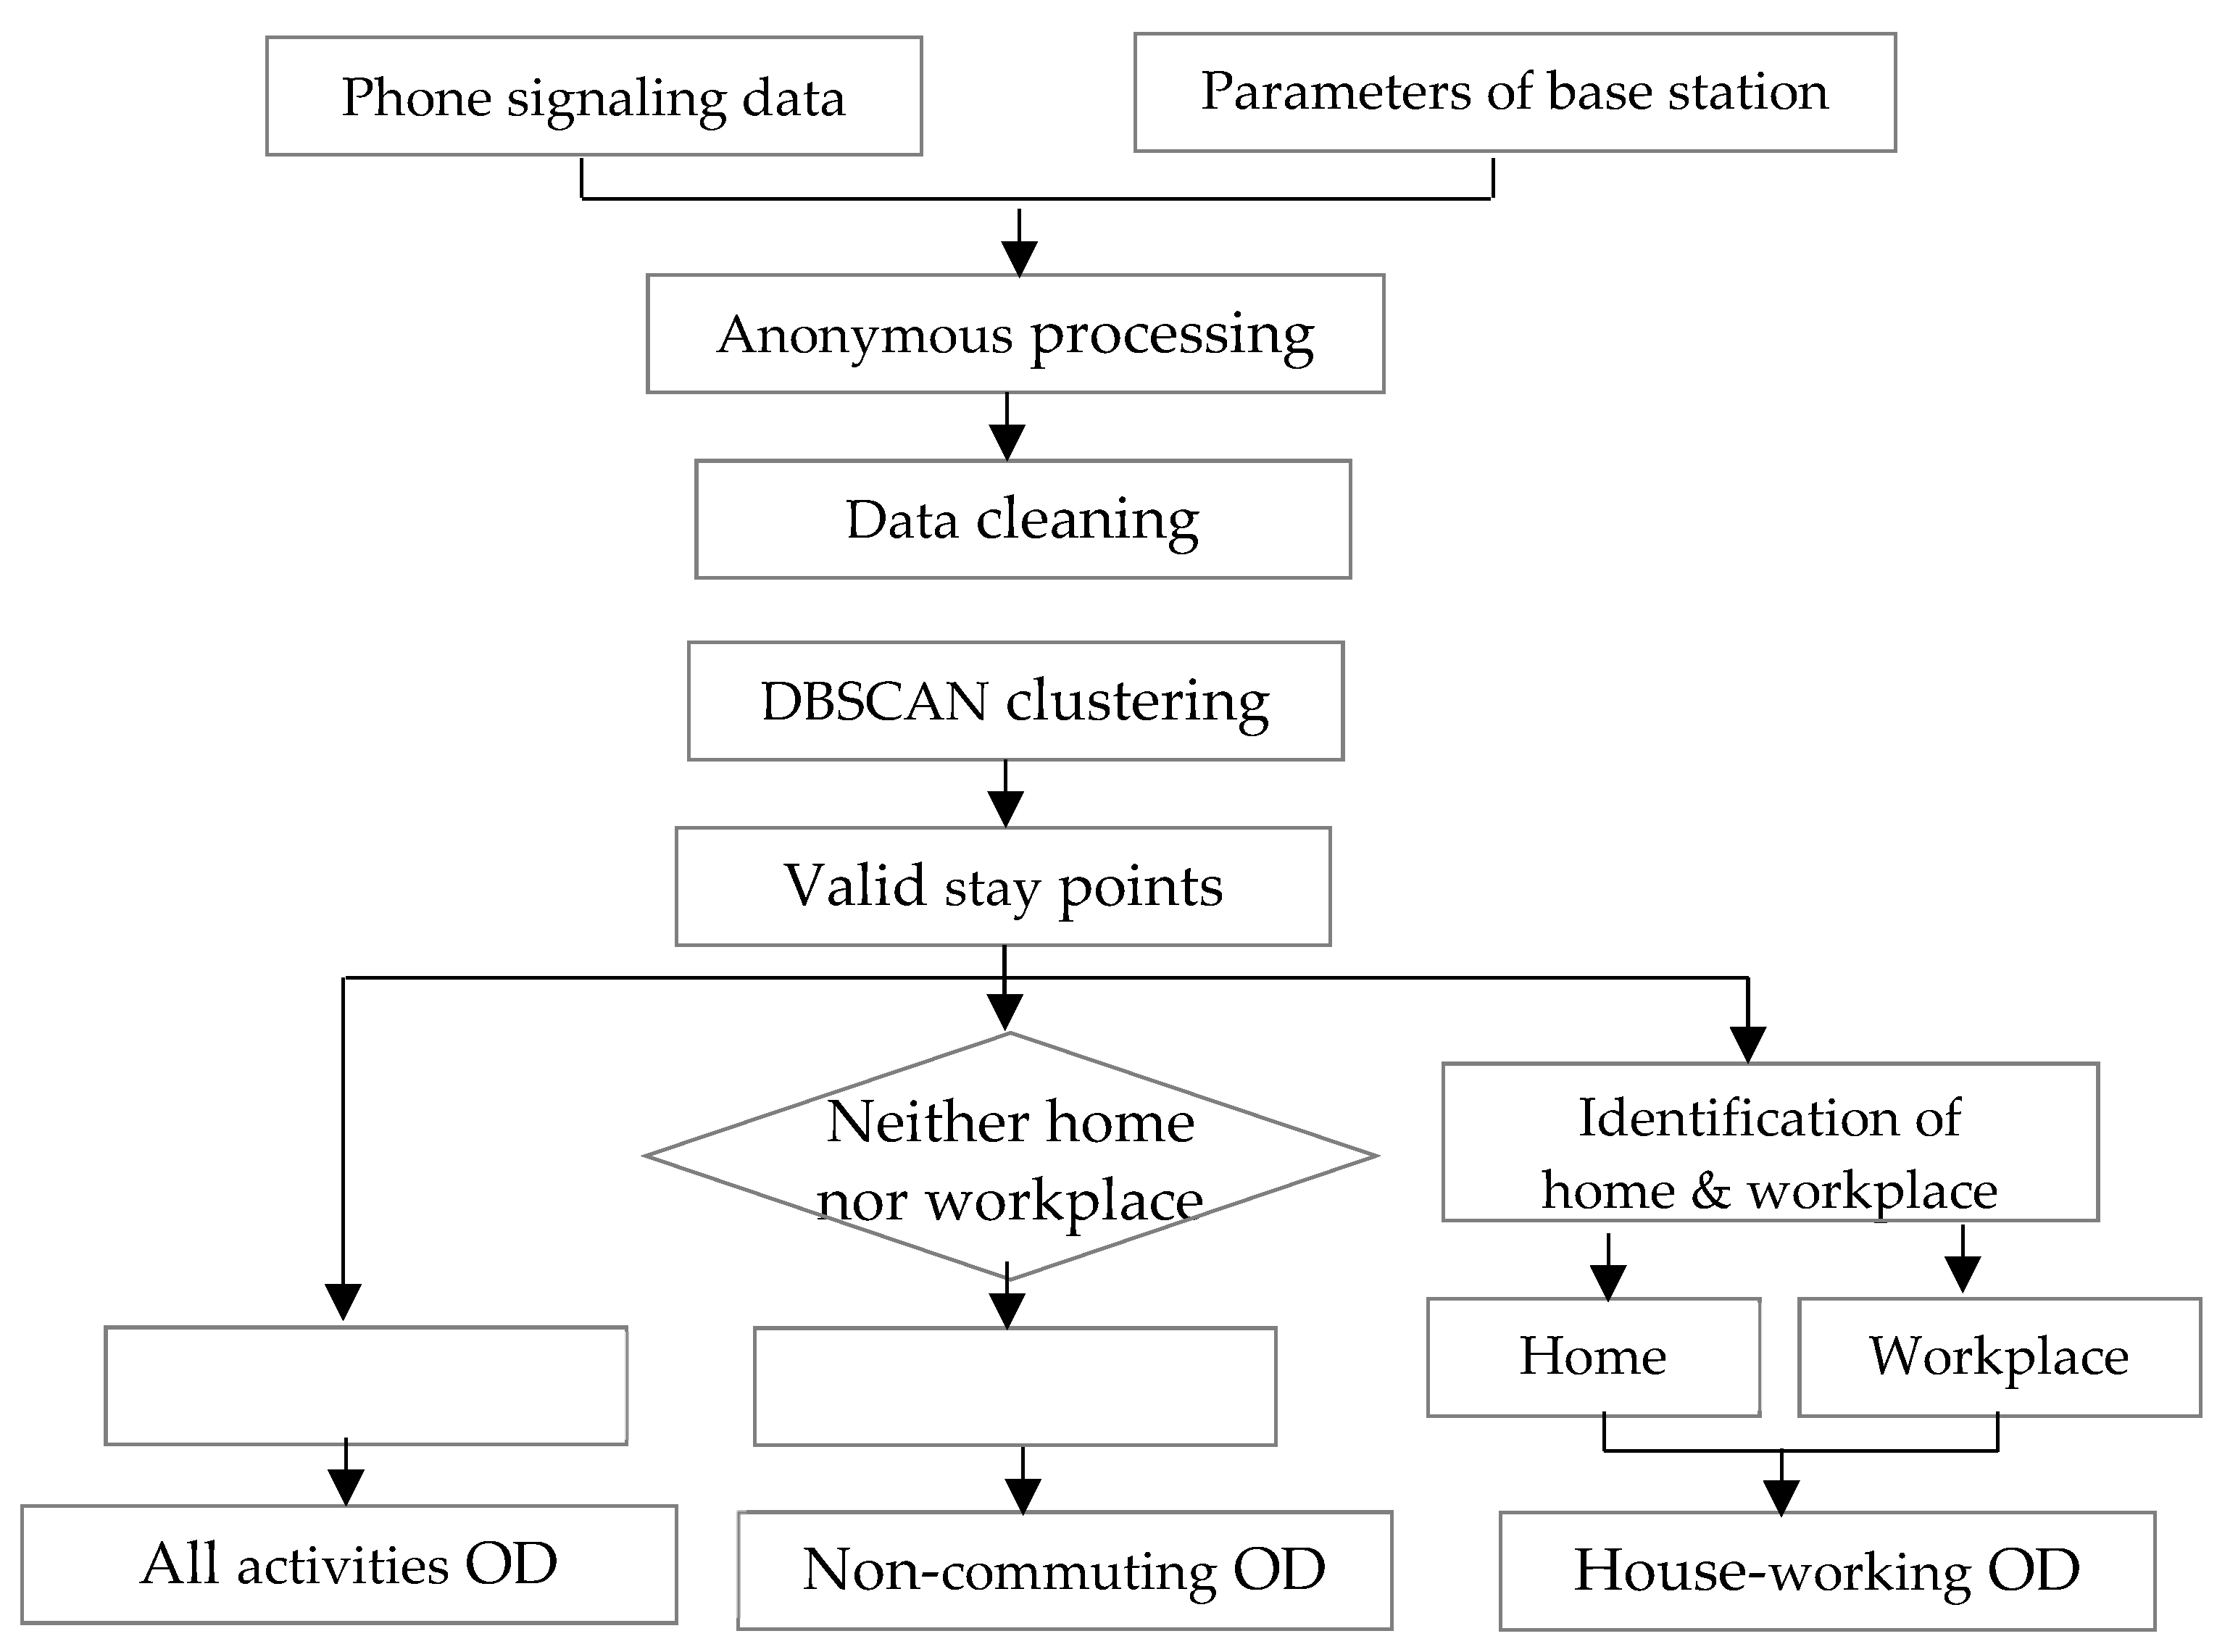
The data processing method of Unicom phone signaling data is shown in
Figure 4. Cell phone signaling data records events and the time when users connect with base stations. For example, when a user opens or closes his phone, text messages, or calls, the connected base station would record the user’s geographic position. If a user frequently uses his cell phone during a short time, it would lead to a large amount of records for the neighboring locations. To improve the efficiency of data processing, first, geographic positioning points need to be clustered. The most common clustering method is the DBSCAN algorithm. If a user stays in a point for more than 30 min, this point is a valid stay point for this user. Based on this process, we respectively extracted the pairs of origin and destination for all users, commuters, and those who were in recreation. All of the pairs of Origins and Destinations (OD) were clustered in grids of 250 m × 250 m.
(1) We connected all stay points of the same user in chronological order as the daily travel chain, and obtained all of the user’s activities’ OD.
(2) After accumulating the time that a user stays in each place from 9 p.m. to 8 a.m. the next day in a month, and ranking the time spent in each place in descending order, we identified the place where the user stayed the longest time and more than 10 work days in this month as his residence. Similarly, for each user who is between the ages of 16 to 64, we summed up his stay time in each place from 9 a.m. to 5 p.m. per day in a month and selected the place where the user stays the longest time and more than 10 work days as his workplace. Then, we connected the residence and workplace of the same user as his commuting OD.
(3) Likewise, we identified the travel chain of each user’s recreation activities by linking the stay points which were not his residence or workplace. Then, we connected all stay points of the same user in chronological order as the recreation OD, which is also called the non-commuting OD.
3.4.2. Baidu Users’ Location-Based Data
Baidu users’ location-based data consist of migration data for people who traveled from Wuhan to other cities during the Spring Festival in 2019 as well as Baidu heat maps in Wuhan during the Spring Festival in 2020. To be more specific, we used the volumes of people who traveled outside Wuhan each day from 23 January to 5 February 2019 to estimate daily outflows from Wuhan before the Spring Festival in 2020. Then, based on this estimation, we calculated the decreased volume of outflows from Wuhan during the two days after the Wuhan lockdown (from 23 January to 24 January 2020). We also evaluated the effects of the Wuhan lockdown by analyzing the change of population distribution during different periods within Wuhan using Baidu heat maps.
The rules of migration data identification are as follows. We first cleaned users’ location data obtained from Baidu series products, then we clustered the location data to obtain users’ valid staying points. If the user’s location transfers from administrative district A to administrative district B and the user stays in B longer than 4 h, then we defined this travel as a valid migration. All the migration data was summarized at the administrative district scale. It is necessary to mention that the migration data represents the count of actual equipment but not the expansion count.
As to the Baidu heat data, it shows the population distribution within a certain area. The regions with high heat indices have more people, while regions with low heat indices have relatively less people. The resolution of the Baidu heat map is 250 m × 250 m grid.
3.4.3. The Confirmed Case Report of COVID-19
The data for confirmed cases of COVID-19 is provided by the national, Hubei province, and Wuhan Hygiene and Health Committees, as well as the news publicized on the internet. The time of the data for the cumulatively confirmed cases of provinces and cities in China used in this research is 6 February 2020, which is the 14th day (a circle of quarantine) after the Wuhan lockdown. The time period for the cumulatively confirmed cases in Wuhan is from 1 January to 8 April 2020.
3.4.4. Clustering Analysis
Based on the confirmed cumulative cases and outflows from Wuhan to other regions, 371 cities were summarized by the K-means clustering algorithm. The Calinski–Harabasz criterion was used to assess the quality of classification. The sorting results show five credible groups from both the perspectives of confirmed cases and population outflows. The average value of each variable is shown in
Table 1. The between-group sum of squares is 7.37, which is a measure of the variation between cluster means. The within-group sum of squares is 1.404, which measures the variation between observations within the cluster. Two indices represent that the five groups show significant differentiation between groups while there is much less difference within each group.
3.4.5. Correlation Analysis
To quantify the relationship between the human mobility and the transmission risk of the infection, we used Tableau to calculate the correlations between the volumes of outflows from Wuhan to other regions before the Spring Festival and the cumulatively confirmed cases of these regions. The calculation is shown as below:
where the
refers to the migration population who travels from Wuhan to another city
i (
i = 1, 2, …,
n),
is the confirmed cumulative cases in that city
i (
i = 1, 2, …,
n), and
n is the total number of units. For the analysis of the national situation, we took 33 provinces (includes Hong Kong and Macau, but not including Hubei province) and 371 major cities (not including cities in Hubei province) as the study objects. For the analysis of the situation within Hubei province, we took 16 cities (not including Wuhan) as the study objects.
According to the results of the linear regression model, the cumulative cases in all 371 cities shows significant relationship with the population inflows from Wuhan (R2 = 0.585, p < 0.001). For each 1% increase of population inflows, the number of confirmed cases is predicted to increase 5.98%.
4. Human Mobility and Transmission Risk of the Epidemic in Wuhan during Early Days
4.1. The Overview of the COVID-19 Development in Wuhan
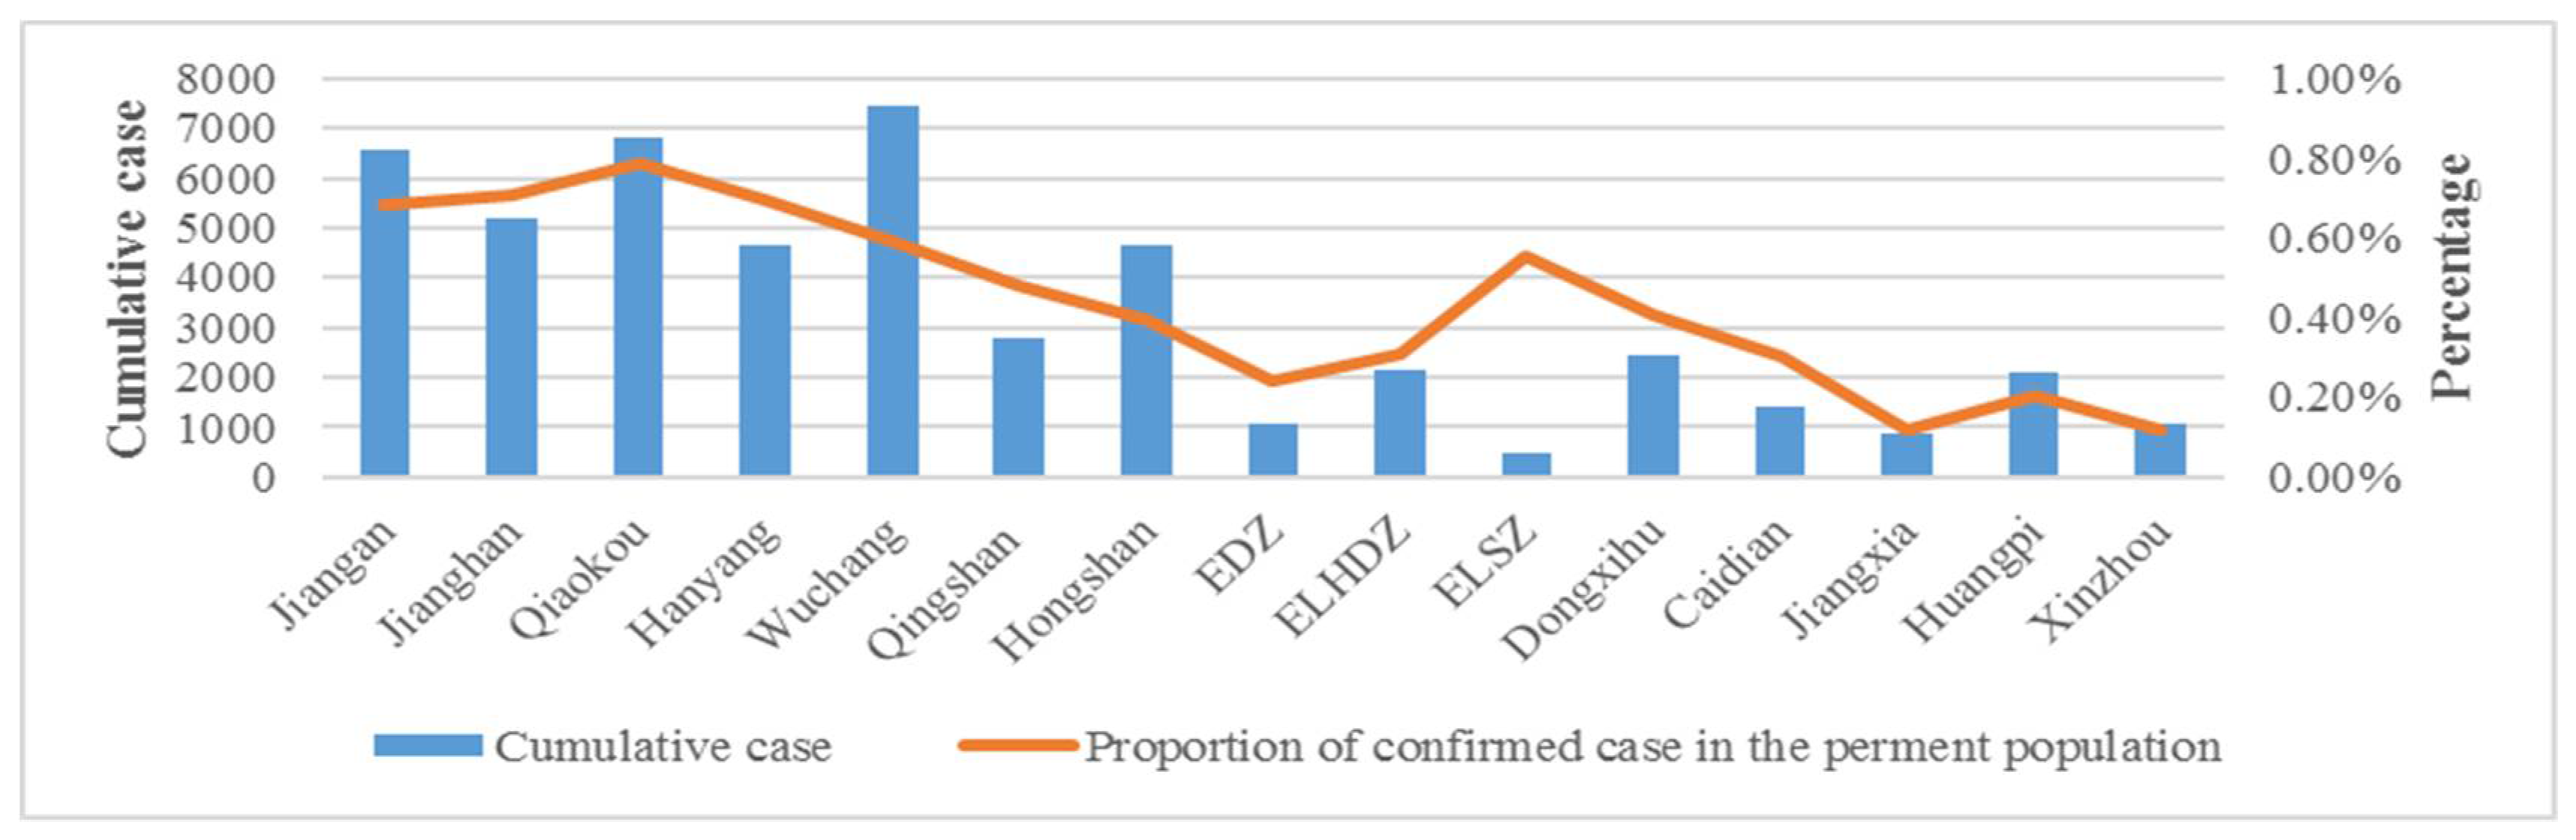
On 8 December 2019, the first case of unidentified pneumonia appeared in Wuhan. On 23 January 2020, the Wuhan lockdown indicated the beginning of an unprecedented epidemic prevention and control campaign. According to the amount of new and cumulative cases of COVID-19 in Wuhan, the epidemic had gone through a smooth contingency period (from 1 December 2019 to 20 January 2020), a rapid increasing period (from 21 January to 4 February 2020), a high incidence period (from 5 February to 18 February 2020), a fluctuated decreasing period (from 19 February to 5 March 2020), and a controlled period (after 6 March 2020). The amount of confirmed cases of COVID-19 in Wuhan is shown in
Figure 5. EDZ, ELHDZ, and ELSZ are abbreviations for Economic Development Zone, East Lake High-Tech Development Zone, and East Lake Scenic Zone, respectively.
Being different from the other regions, the fight with the epidemic in Wuhan was an “encounter war”, which means that people did not realize it when the spread of the epidemic began. Thus, the characteristics of population mobility in the initial phase of the outbreak can be considered statistically consistent with the normal period, so the data of human mobility during the same time in 2019 can be used to reflect the characteristics of population mobility in the initial phase of the outbreak.
4.2. The Analysis of the Exposed Risk of COVID-19 around the South China Seafood Wholesale Market during the Early Days
According to the purpose of visit, we divided the activities of visiting populations to the market into two categories: shopping and commuting, both of which may lead to very different situations of transmission risk of the epidemic. Therefore, based on Unicom users’ phone signaling data in June 2019, we analyzed the distributions of people (including and not including the commuters) who traveled to the market in Wuhan in usual days to investigate the potential risk of exposure to infection around the market at the early outbreak.
4.2.1. The Spatial Analysis of Exposed Risk of Visitors to the South China Seafood Wholesale Market
Taking the two grids where the market is located as the study area, we used all Unicom users’ activities OD on 12 June and 15 June in 2019 and non-commuting activities OD in June 2019 to reveal the spatial coverage of commercial activities of the market and their influence on the transmission of infection.
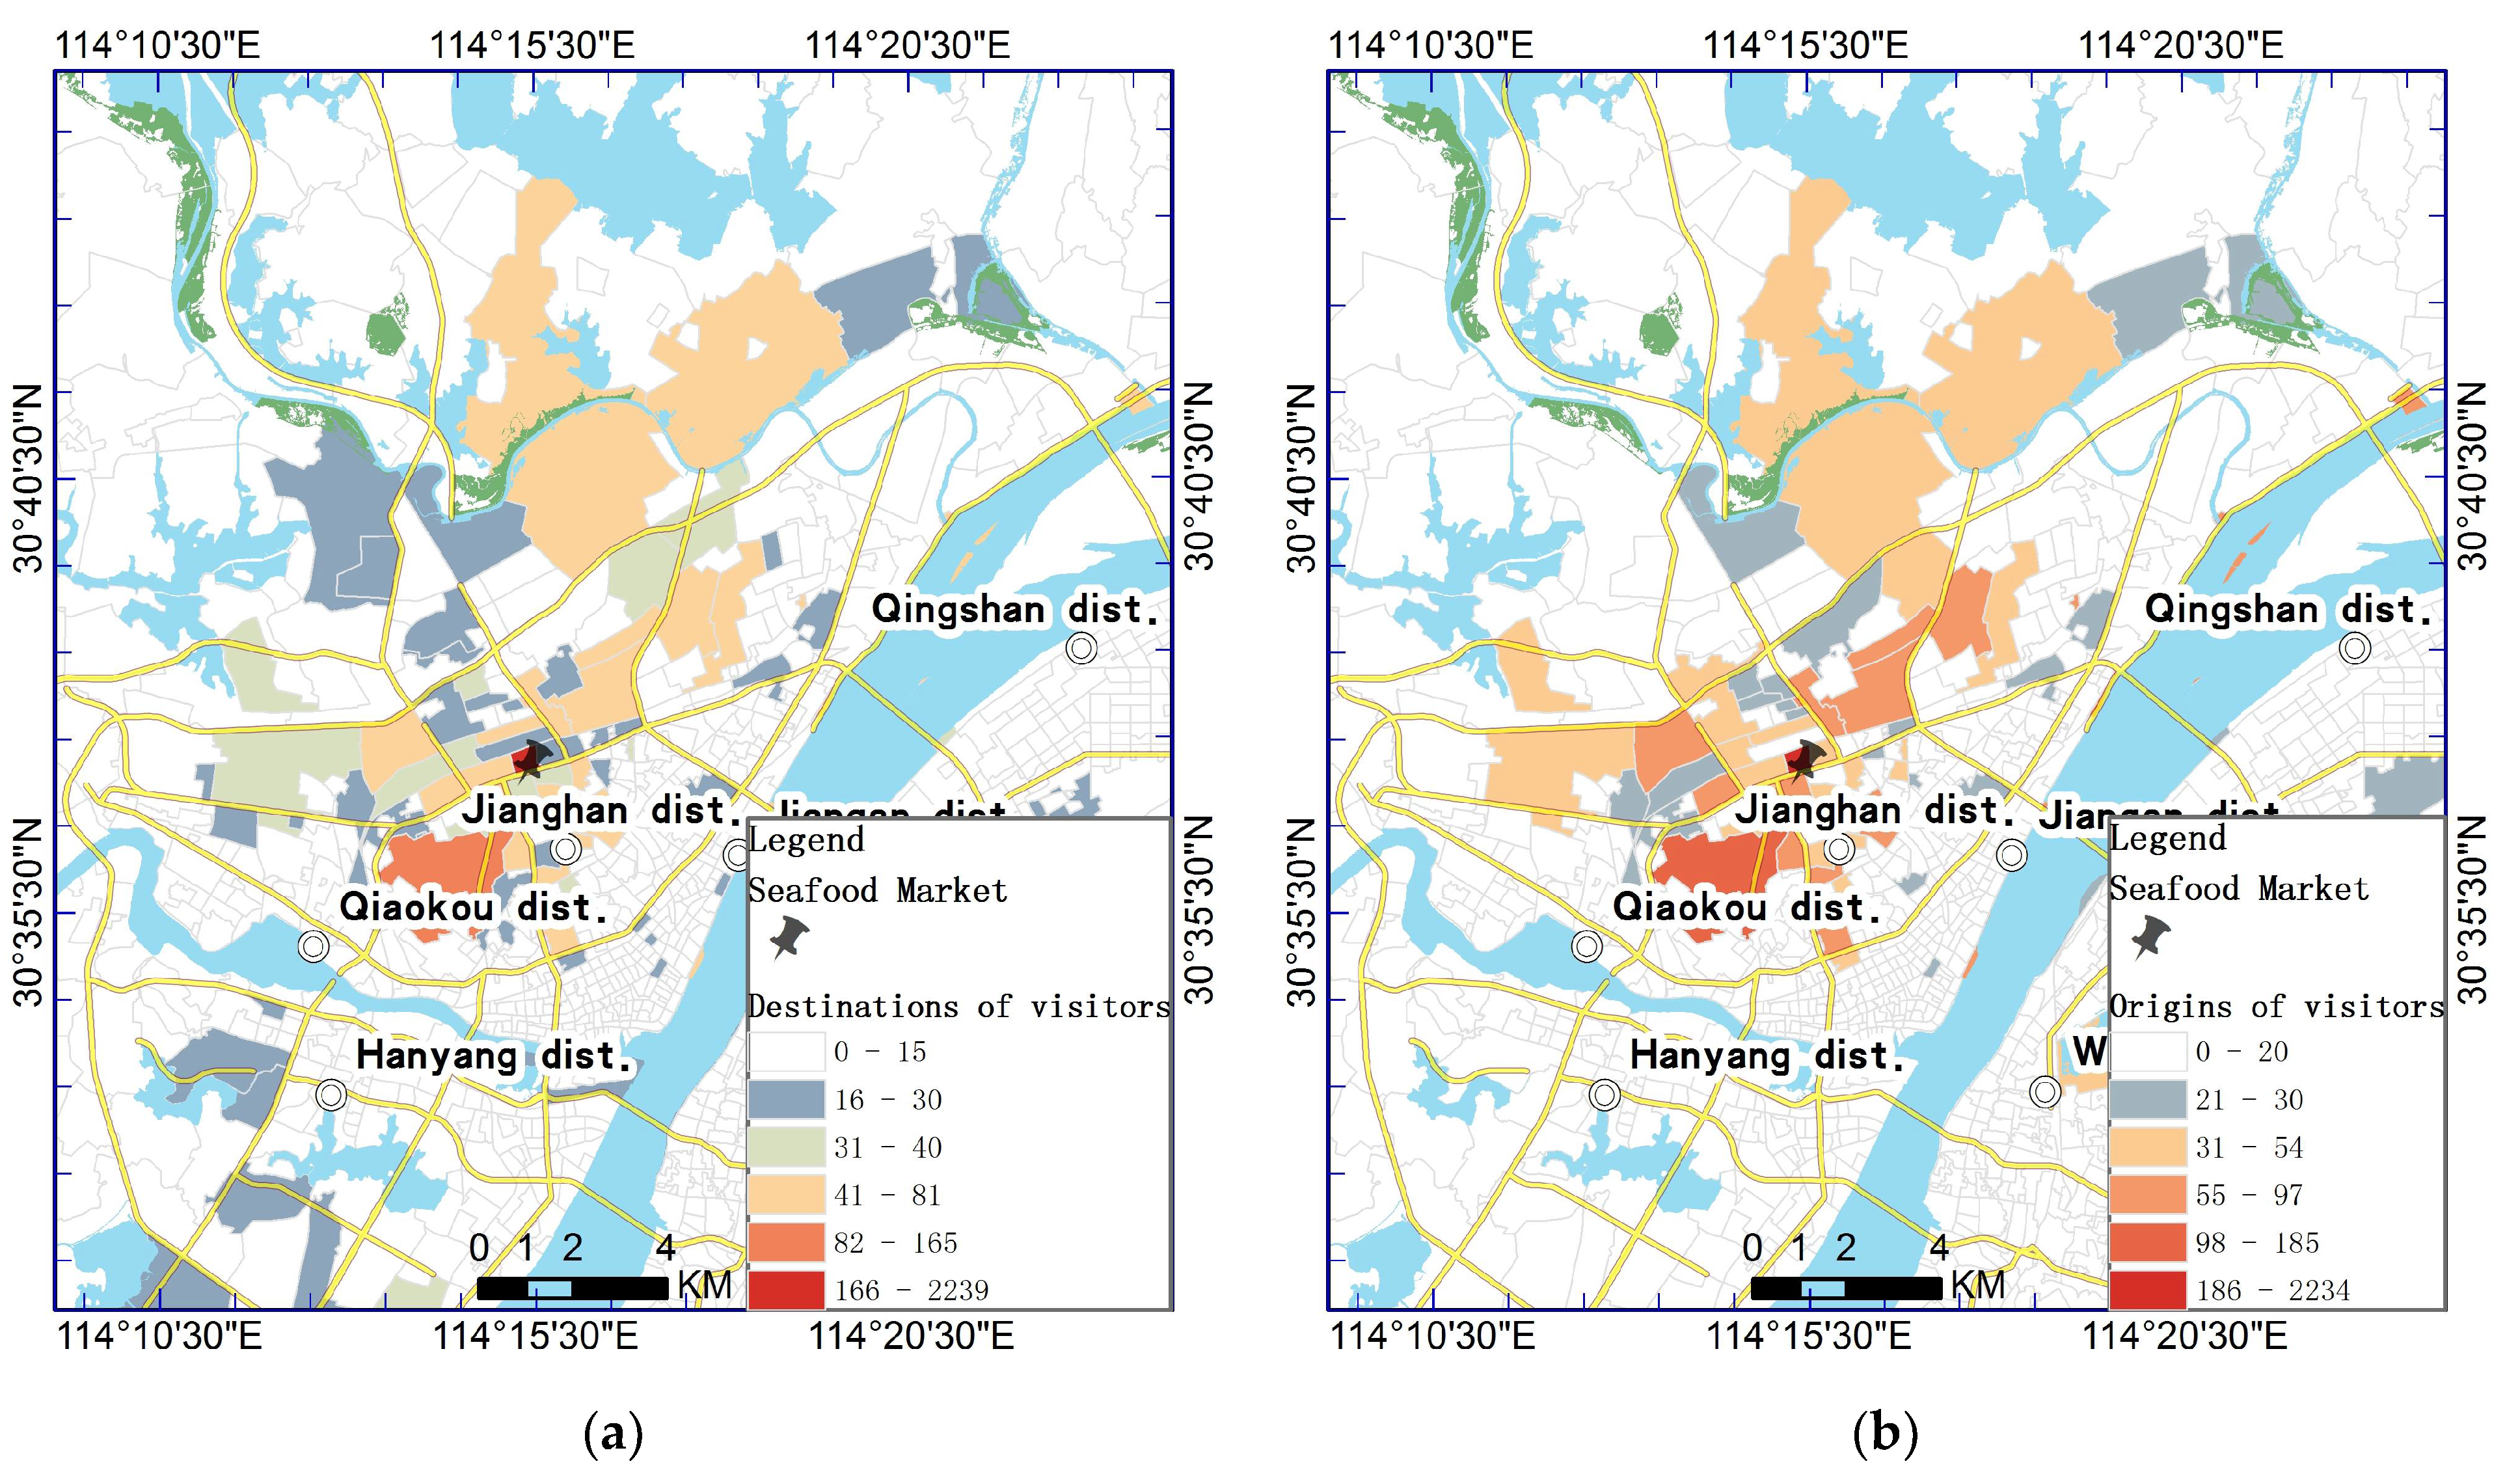
As to the activity purpose of visitors, we visualized the destinations of the people who traveled from the market and the origins of the people who traveled to the market at the community scale so as to identify areas with high risk of infection. As
Figure 6 shows, potential areas with high infection risk are concentrated in Hankou, especially densely distributed within a 3 to 4 km distance to the market. The Chenjiadun communities, which are just one road away from the market, had the highest infection risk. In addition, a part of areas with relatively high risk are scattered in Wuchang and Hanyang.
As to non-working purpose visitors, they can be classified into two categories: one is the people who reside nearby the market but travel to other places (called T1), and the other is those who reside in other areas but come to the market (called T2). As shown in
Table 2, the cumulative number of T1 visitors of the market for non-working purposes is 24,812 in June 2019, with a daily average of 827 individuals travelling from the market to other areas in Wuhan. In particular, 19,761 individuals travel from the market to the main urban areas and make up 79.6% of its visitors. Most of these visitors go to Hankou (59.7%). A total of 3702 individuals travel from the market to the new urban areas and make up 14.9% of the T1 visitors. The individuals who move to the functional urban areas occupy the least. The cumulative number of T2 visitors of the market for non-working purposes is 27,751, with a daily average 925 individuals travelling from other areas in Wuhan to the market. In particular, 20,494 individuals come from the main urban areas and make up 73.8% of these visitors, followed by the individuals coming from the new urban areas who make up 14.9% of the T2 visitors. The individuals from the functional urban areas occupy the least, with only 6.6%. Among the individuals from the main urban areas, 52.8% of them are from Hankou, taking the highest percentage.
As
Figure 7 shows, due to the geographic separation caused by the Yangtze River and Han River, T1 visitors of the market are mainly concentrated in Hankou and a part of the areas in Wuchang, showing no significant clustering in Hanyang. In particular, the communities with expansive populations of visitors, such as the Airport community, Shiqiao community, and Qushuilou community, are concentrated in Hankou. T1 and T2 visitors have similar spatial patterns of distribution. These two groups of people are mainly concentrated in the areas surrounding the market in Hankou. However, different from T1 visitors, T2 visitors do not show remarkable clustering in Wuchang and Hanyang.
4.2.2. The Transmission Risk Related to the Commuters Nearby the South China Seafood Wholesale Market
Taking the region where the market outreach 500 m as the study area in this section, we further analyzed how the commuters’ behaviors near the market affected the surrounding potential transmission risk.
As
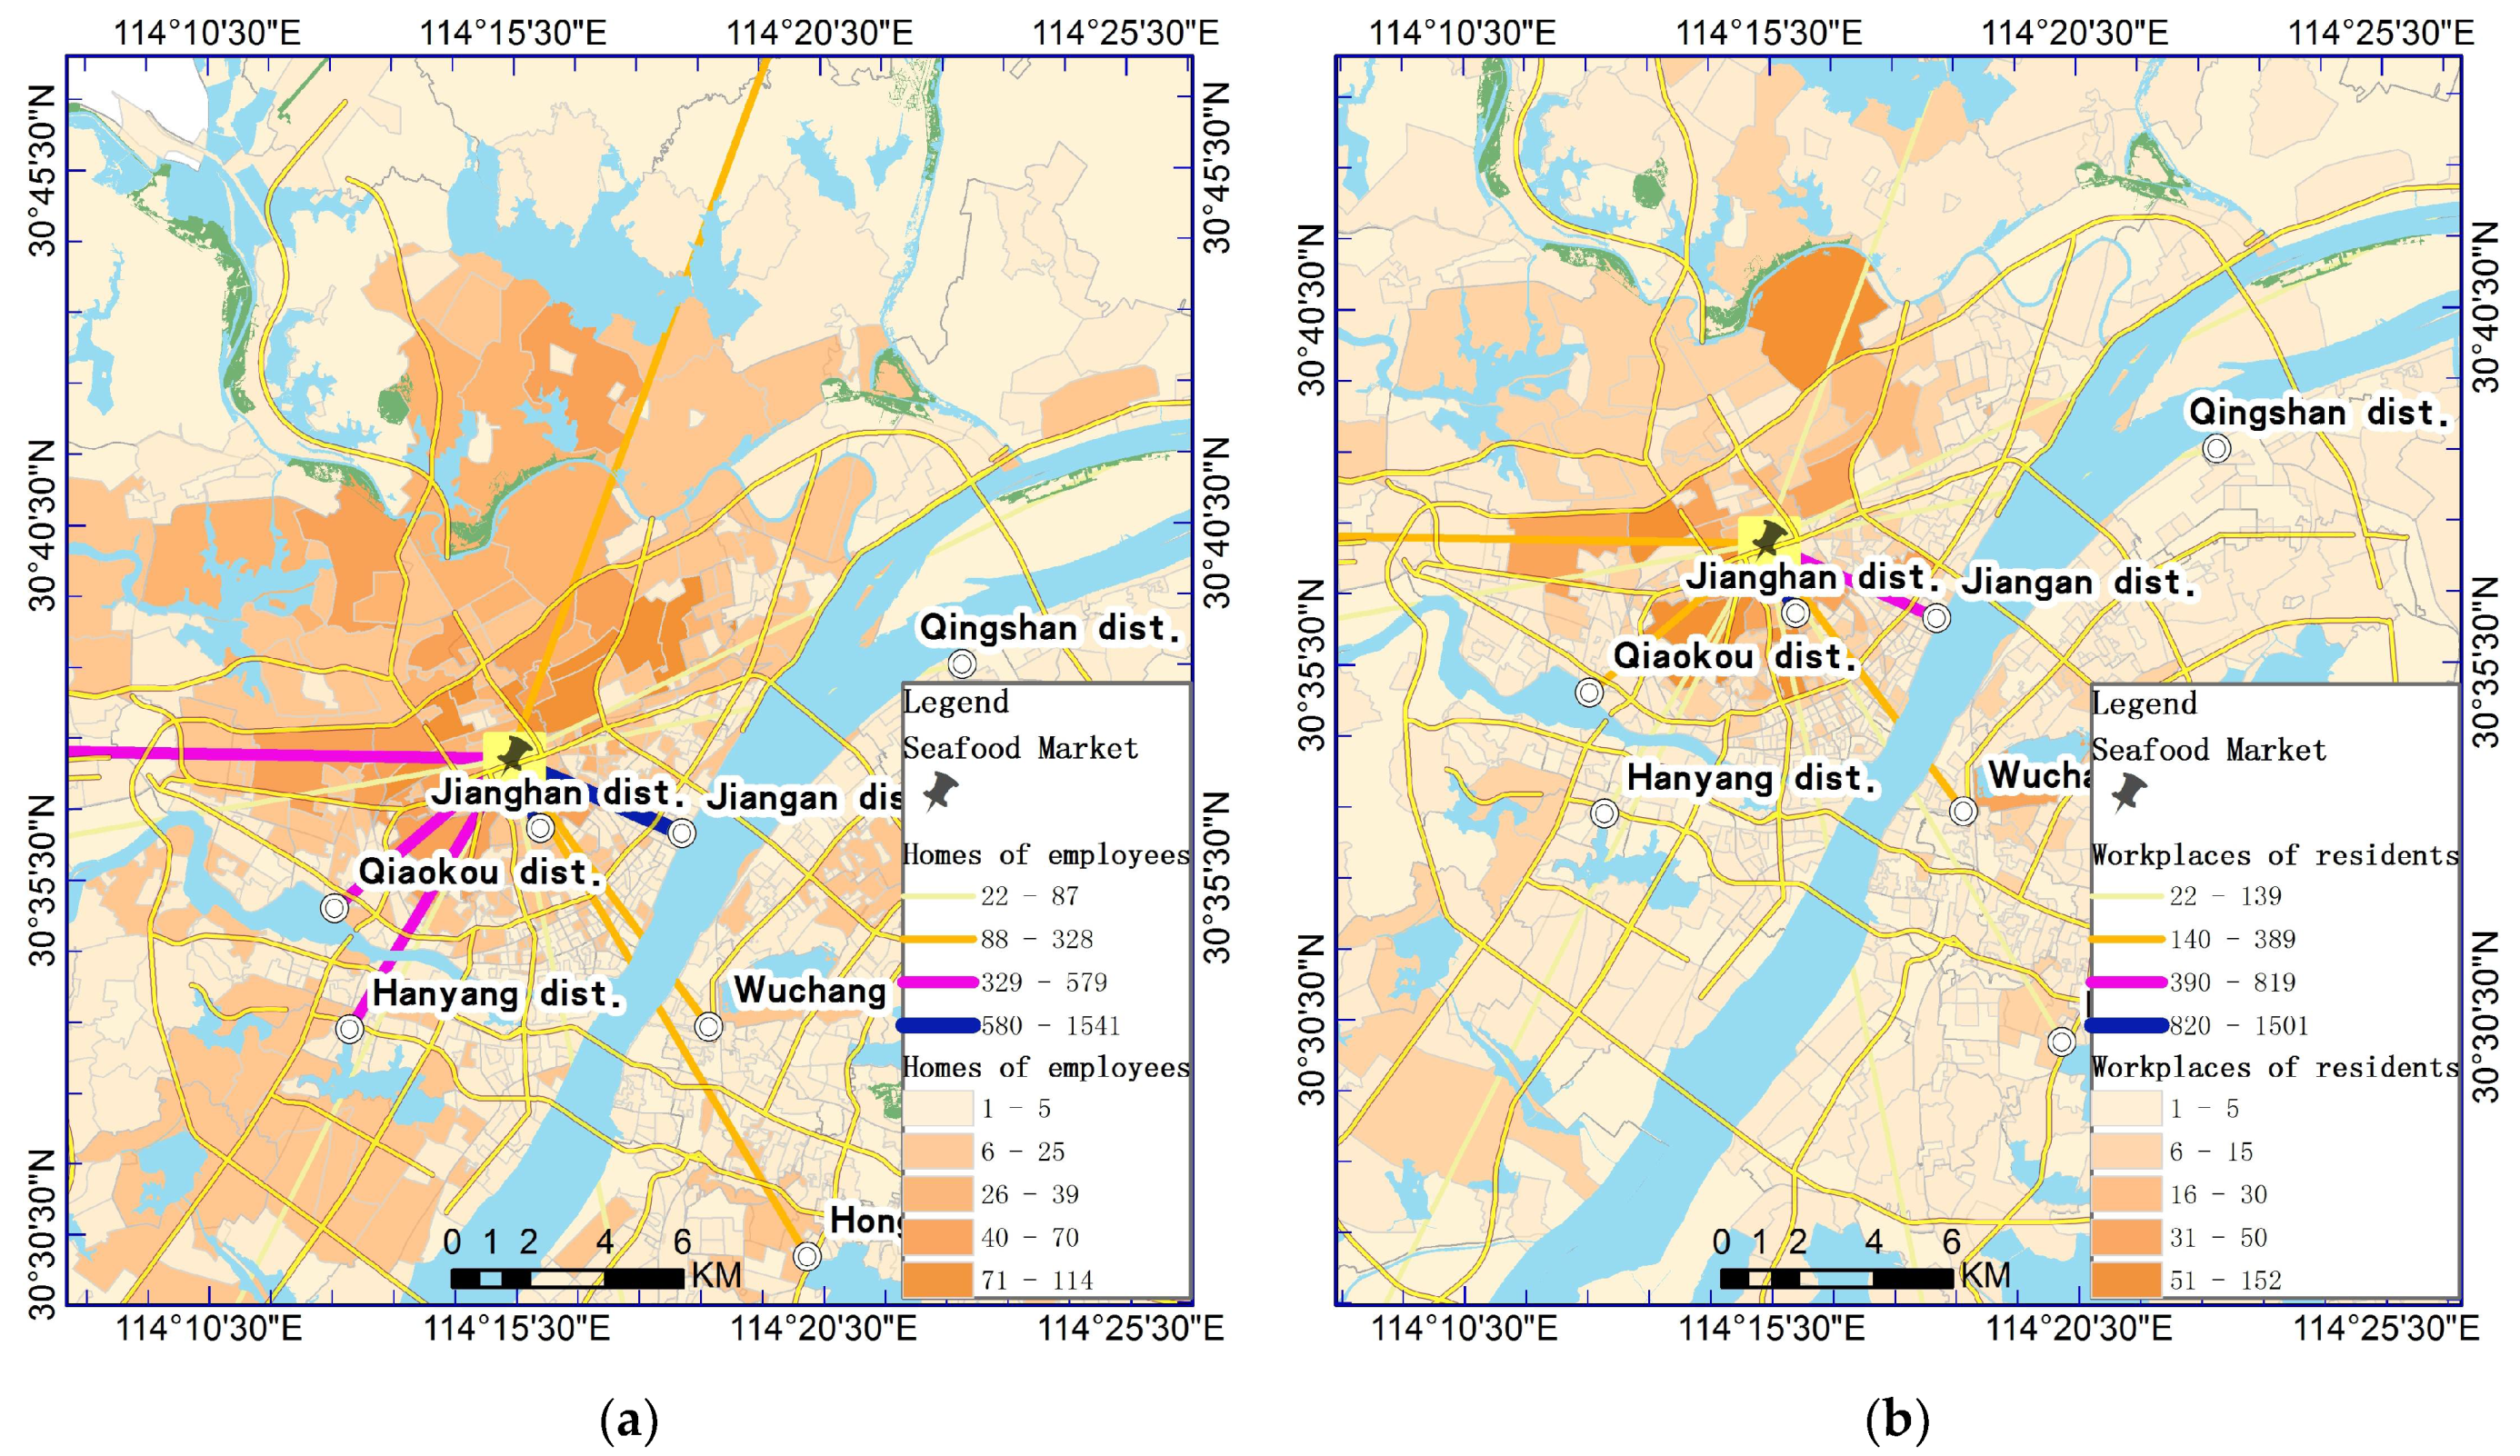
Figure 8 and
Table 3 show, the employed people nearby the market mainly come from the central urban areas and make up 79.8% of the total nearby employees, especially tightly connected with Jianghan, Jiangan, and Qiaokou districts. Of the nearby employees, 60% come from Hankou, concentrated in Hanxing, Huaqiao, Tazihu, and Houhu street. The residents near the market mainly go to work in the central urban areas and make up 82.3% of the total nearby residents. A total of 66.9% of the nearby residents work in the Jiangan and Qiaokou districts, mainly working in Wansong, Changqing, Hanxing, and Tangjiadun street. The workplaces of the residents near the market tend to be close to the center of Wuhan, while the houses of the employed people near the market are located near the northern part of Wuhan.
To sum up, from the exposure risk of visitors to the market, areas with a high infection risk within the city are concentrated in Hankou and densely distributed within a 3 to 4 km distance to the market. A part of the areas with high infection risk are escatterd in Wuchang and Hanyang. Hankou is the main area for the mobilities of workers and residents near the market, taking 61.1% and 66.9% of the total nearby workers, respectively, and for the mobilities of residents who have remarkable characteristics of cross-regional and cross-river travels. The above analysis reveals that the influence areas of the market cover the three towns in Wuhan, which is different from the early understanding that “Hankou is the center of the epidemic”, and the risk of infection has largely spread in three towns during the early stage of the outbreak.
4.3. Risk Analysis of Cluster Infection in General Hospitals
During early days of the outbreak, due to the insufficient capacity of elimination, protection and treatment at the early stage of the epidemic, many hospitals are contaminated by novel coronavirus. With the rapid rise of patients, general hospitals became important cluster infection areas. In this section, we firstly processed the Unicom’s cell phone signaling data from 1 June to 30 2019 for the visitors of non-working purposes and selected seven general hospitals which were first to receive the COVID-19 patients in the early stage of the epidemic. Then we distinguished visitors and finally obtained the distribution of patients in regular hours. It is worth mentioning that Union Hospital and Tongji Hospital are so close to each other that they are located in the same 250 m grid, so they are studied as a whole.
As shown in
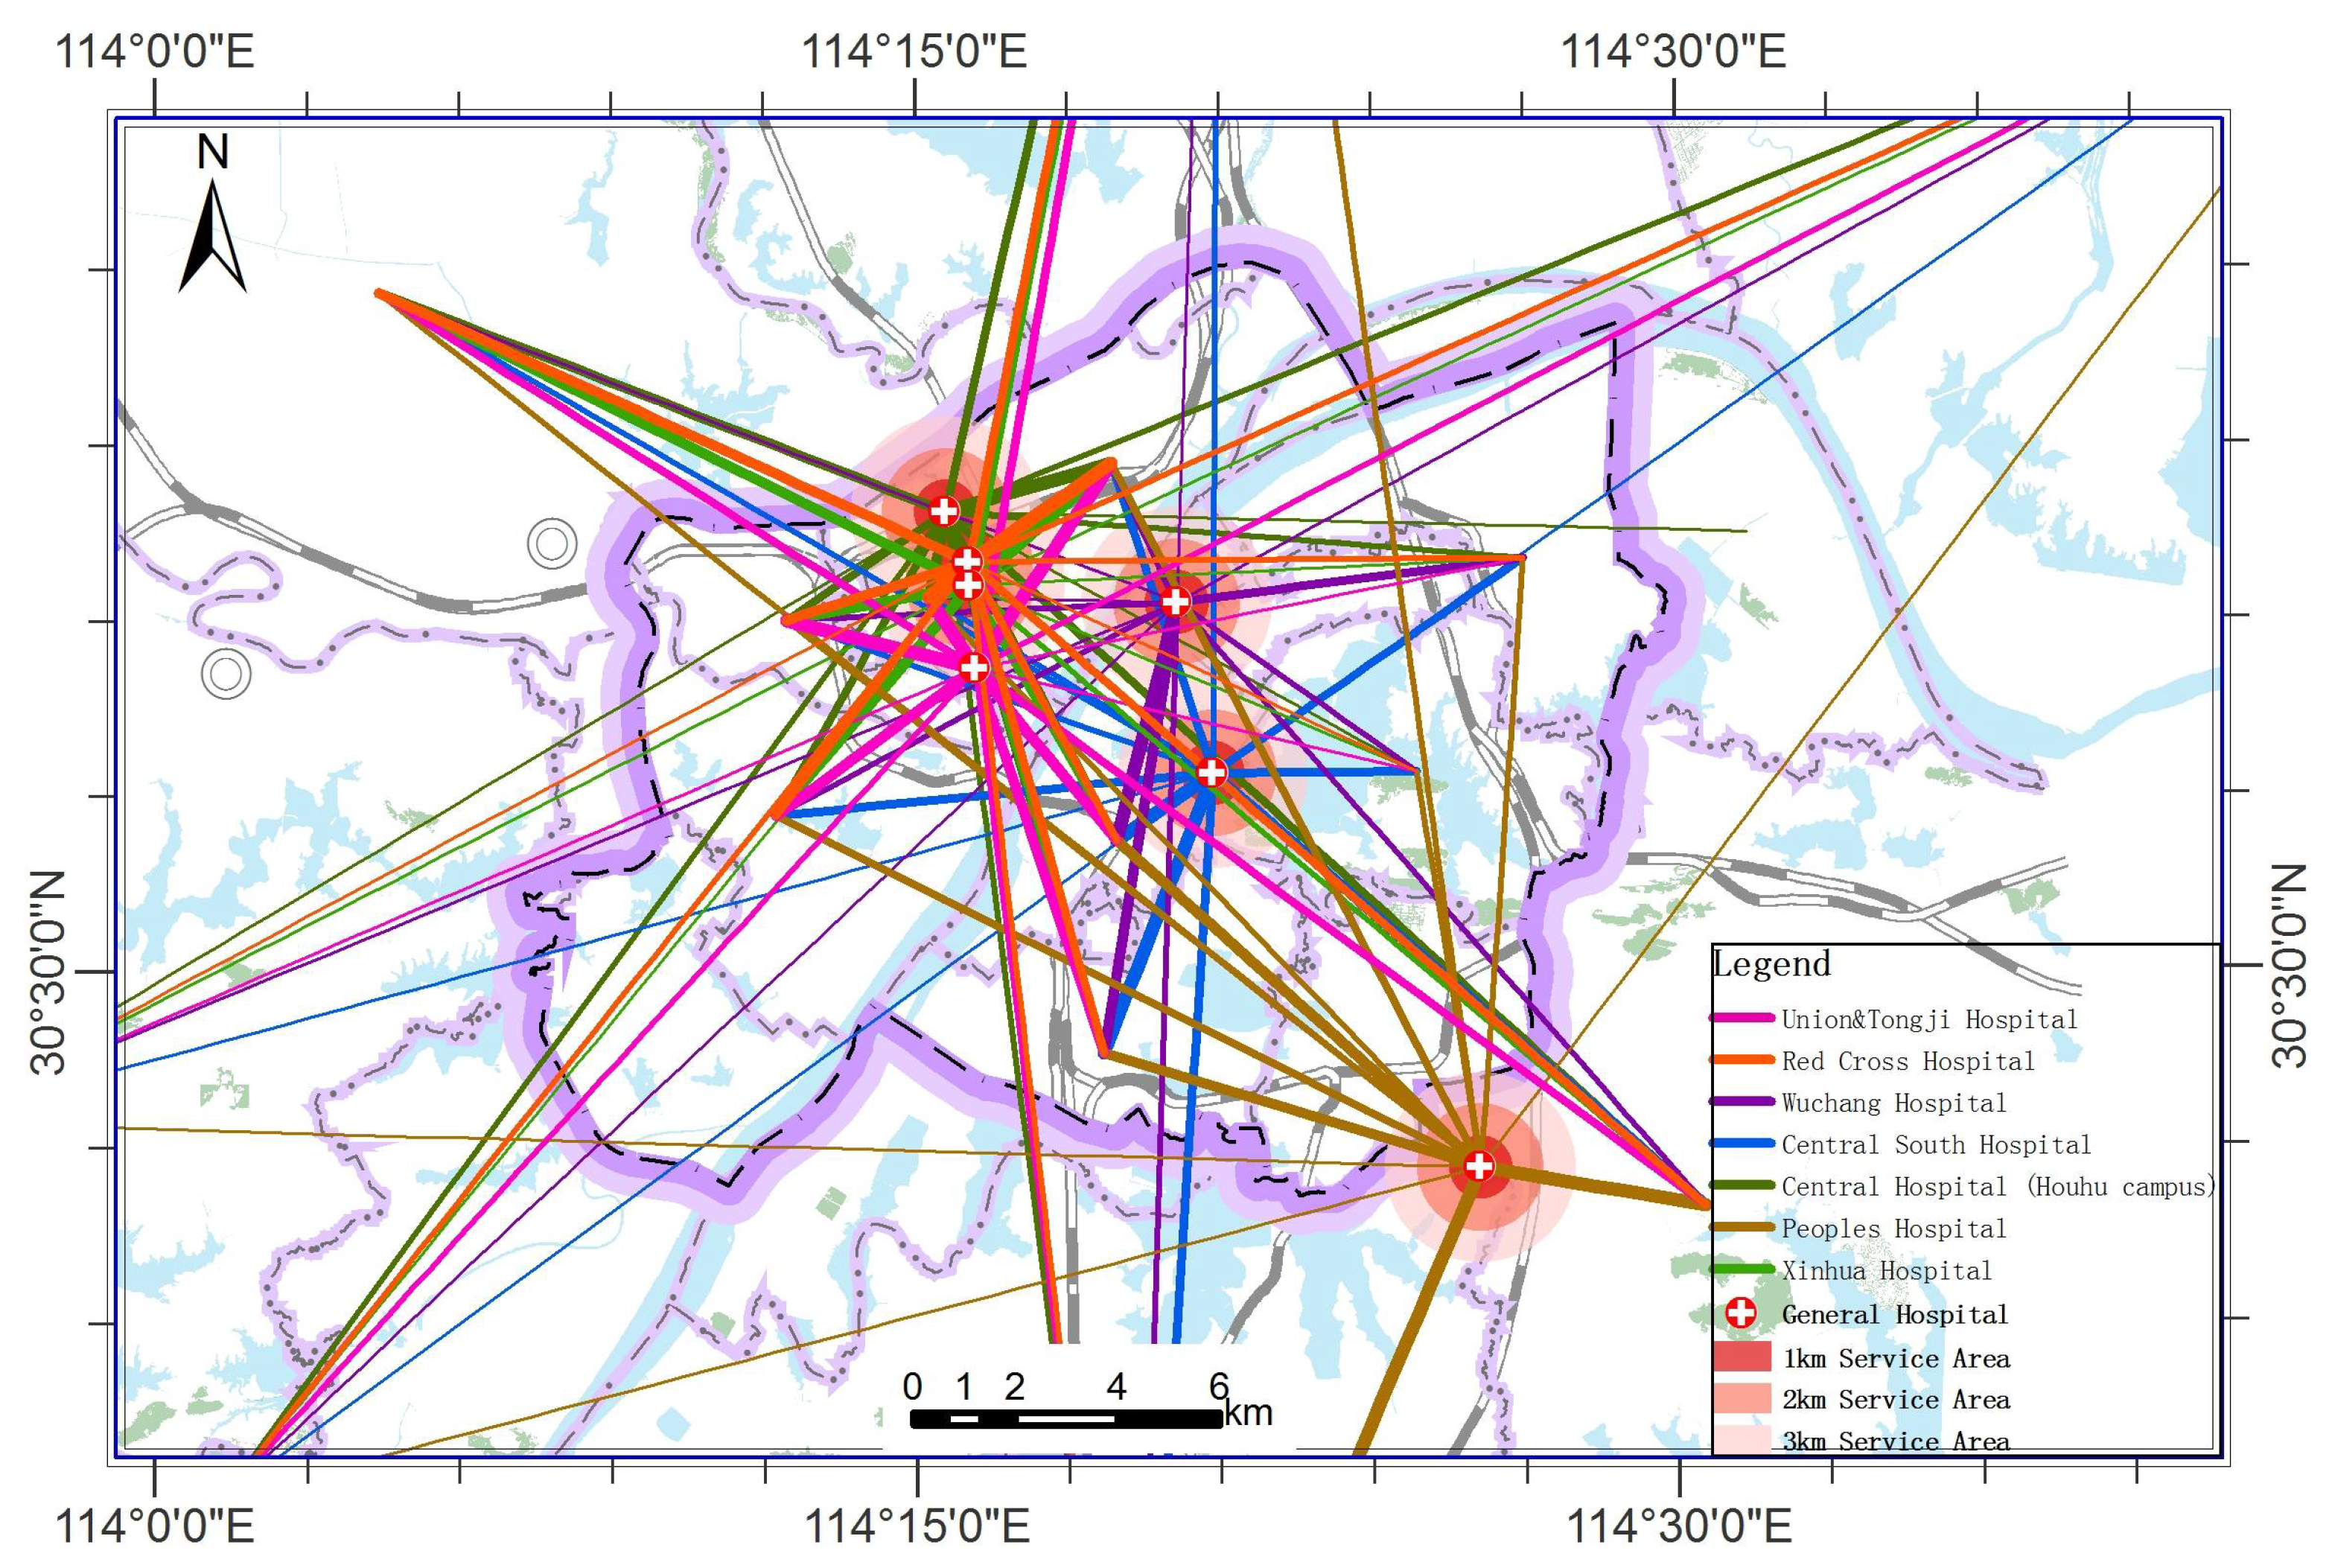
Figure 9 and
Table 4, these 7 general hospitals have significant cross-regional and cross-river services phenomenon in regular hours. As to Union Hospital and Tongji Hospital, which are “Super Top Three Grade A” general hospitals, the general proportion of cross-river travels for medical treatment is nearly 25%, and Hankou, Wuchang and Hanyang account for 47.1%, 16.3% and 10.6% respectively. The medical population inside Wuhan mainly comes from Jiangan and Jianghan district, accounting for 17.8% and 15.1% respectively. Houhu campus of Wuhan Central Hospital is one of the hospitals closest to the South China Seafood Wholesale Market, 1.6 km away as the crow flies. It is also the “worst-hit area” with the highest concentration of suspected patients and the highest number of infected medical staff in the initial stage of the epidemic. From the perspective of the distribution of the population seeking for medical services in three towns, the medical population mainly comes from Hankou accounting for 59.2% of the total medical population, while the medical population in Wuchang and Hanyang only accounts for 8.8% and 4.4%, respectively.
To sum up, during the regular time, service areas of the general hospitals in Wuhan greatly exceed the traditional service areas within a 1 km service radius, and almost reach the average proportion of over 20% across rivers and about 70% across districts. Before the Wuhan lockdown, since a large number of COVID-19-infected patients were coming to the above-mentioned hospitals, these hospitals were infected, and patients with other diseases who go to these hospitals across districts and rivers were infected unconsciously. As a result, three towns have a considerable infection base at the early stage.
5. The Evaluation of the Wuhan Lockdown
Wuhan is the hub of China’s transportation system and one of the biggest centers of population migration in China. Based on the estimation from Baidu migration data in 2019, there are an average of 0.37 million people migrating between Wuhan and other cities in China in a usual day, with an average of 0.44 million people each day before the Spring Festival. Among these people, 0.14 million people migrate from Wuhan to cities outside of Hubei province, and these people mainly go to Beijing, Shanghai, Guangzhou, Shenzhen, and other developed cities, as well as some cities in Henan and Hunan which are adjacent to Hubei province. An average of 0.29 million people migrate within Hubei province, with 48.3% of them going to eight cities adjacent to Wuhan.
To reduce the negative effects that human mobility may have on the control of the spread of the epidemic, Wuhan was shut down on 23 January 2020. The intra-city public transportation systems in Wuhan stopped, including bus, subway, boat, and inter-city bus. Airports and train stations in Wuhan also closed passageways from Wuhan. We evaluated the effects of the Wuhan lockdown from the perspectives of the external export and inter-city spread of the infection in this section.
5.1. External Export of the COVID-19
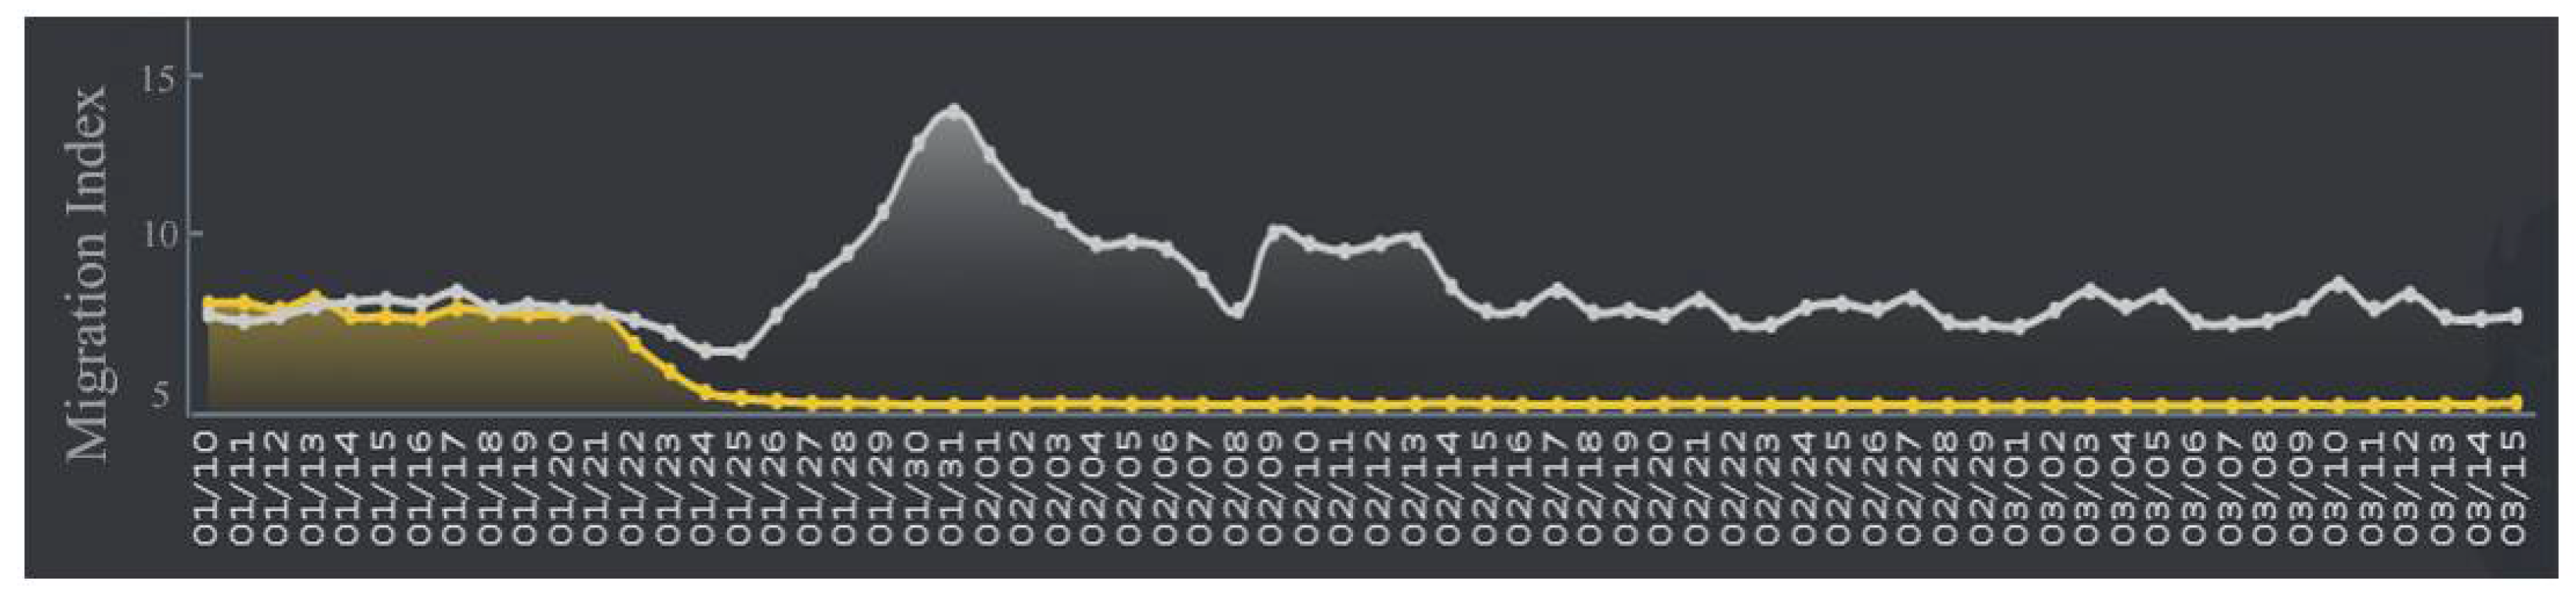
As
Figure 10 shows, compared with the situation in 2019, the migration population during the Spring Festival in 2020 sharply decreased after 24 January 2020.
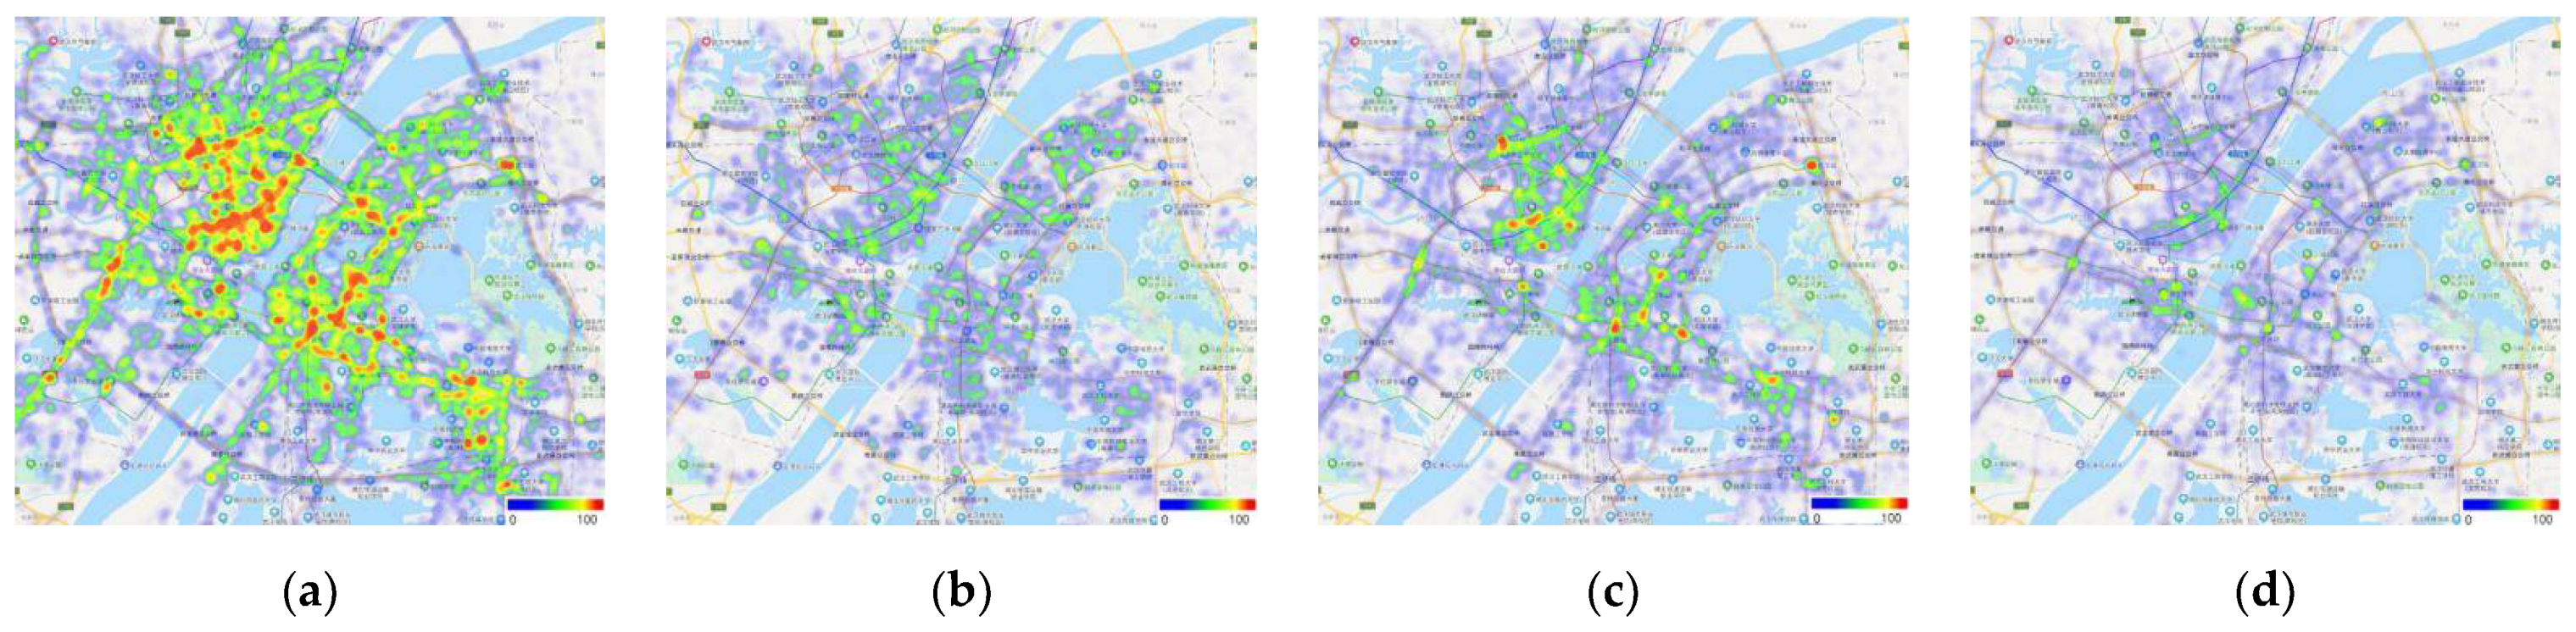
Heat maps of the central urban areas in Wuhan of the same time (before and after the Spring Festival) in 2019 and 2020 are shown in
Figure 11. The population heat value before the Spring Festival in 2020 is significantly higher than that in 2019. After the Wuhan lockdown, the population heat value is also higher than that in 2019. The reason for this phenomenon is that, on one hand, permanent residents increased in the last year, and on the other hand, many people were forced to stay in Wuhan because of the Wuhan lockdown.
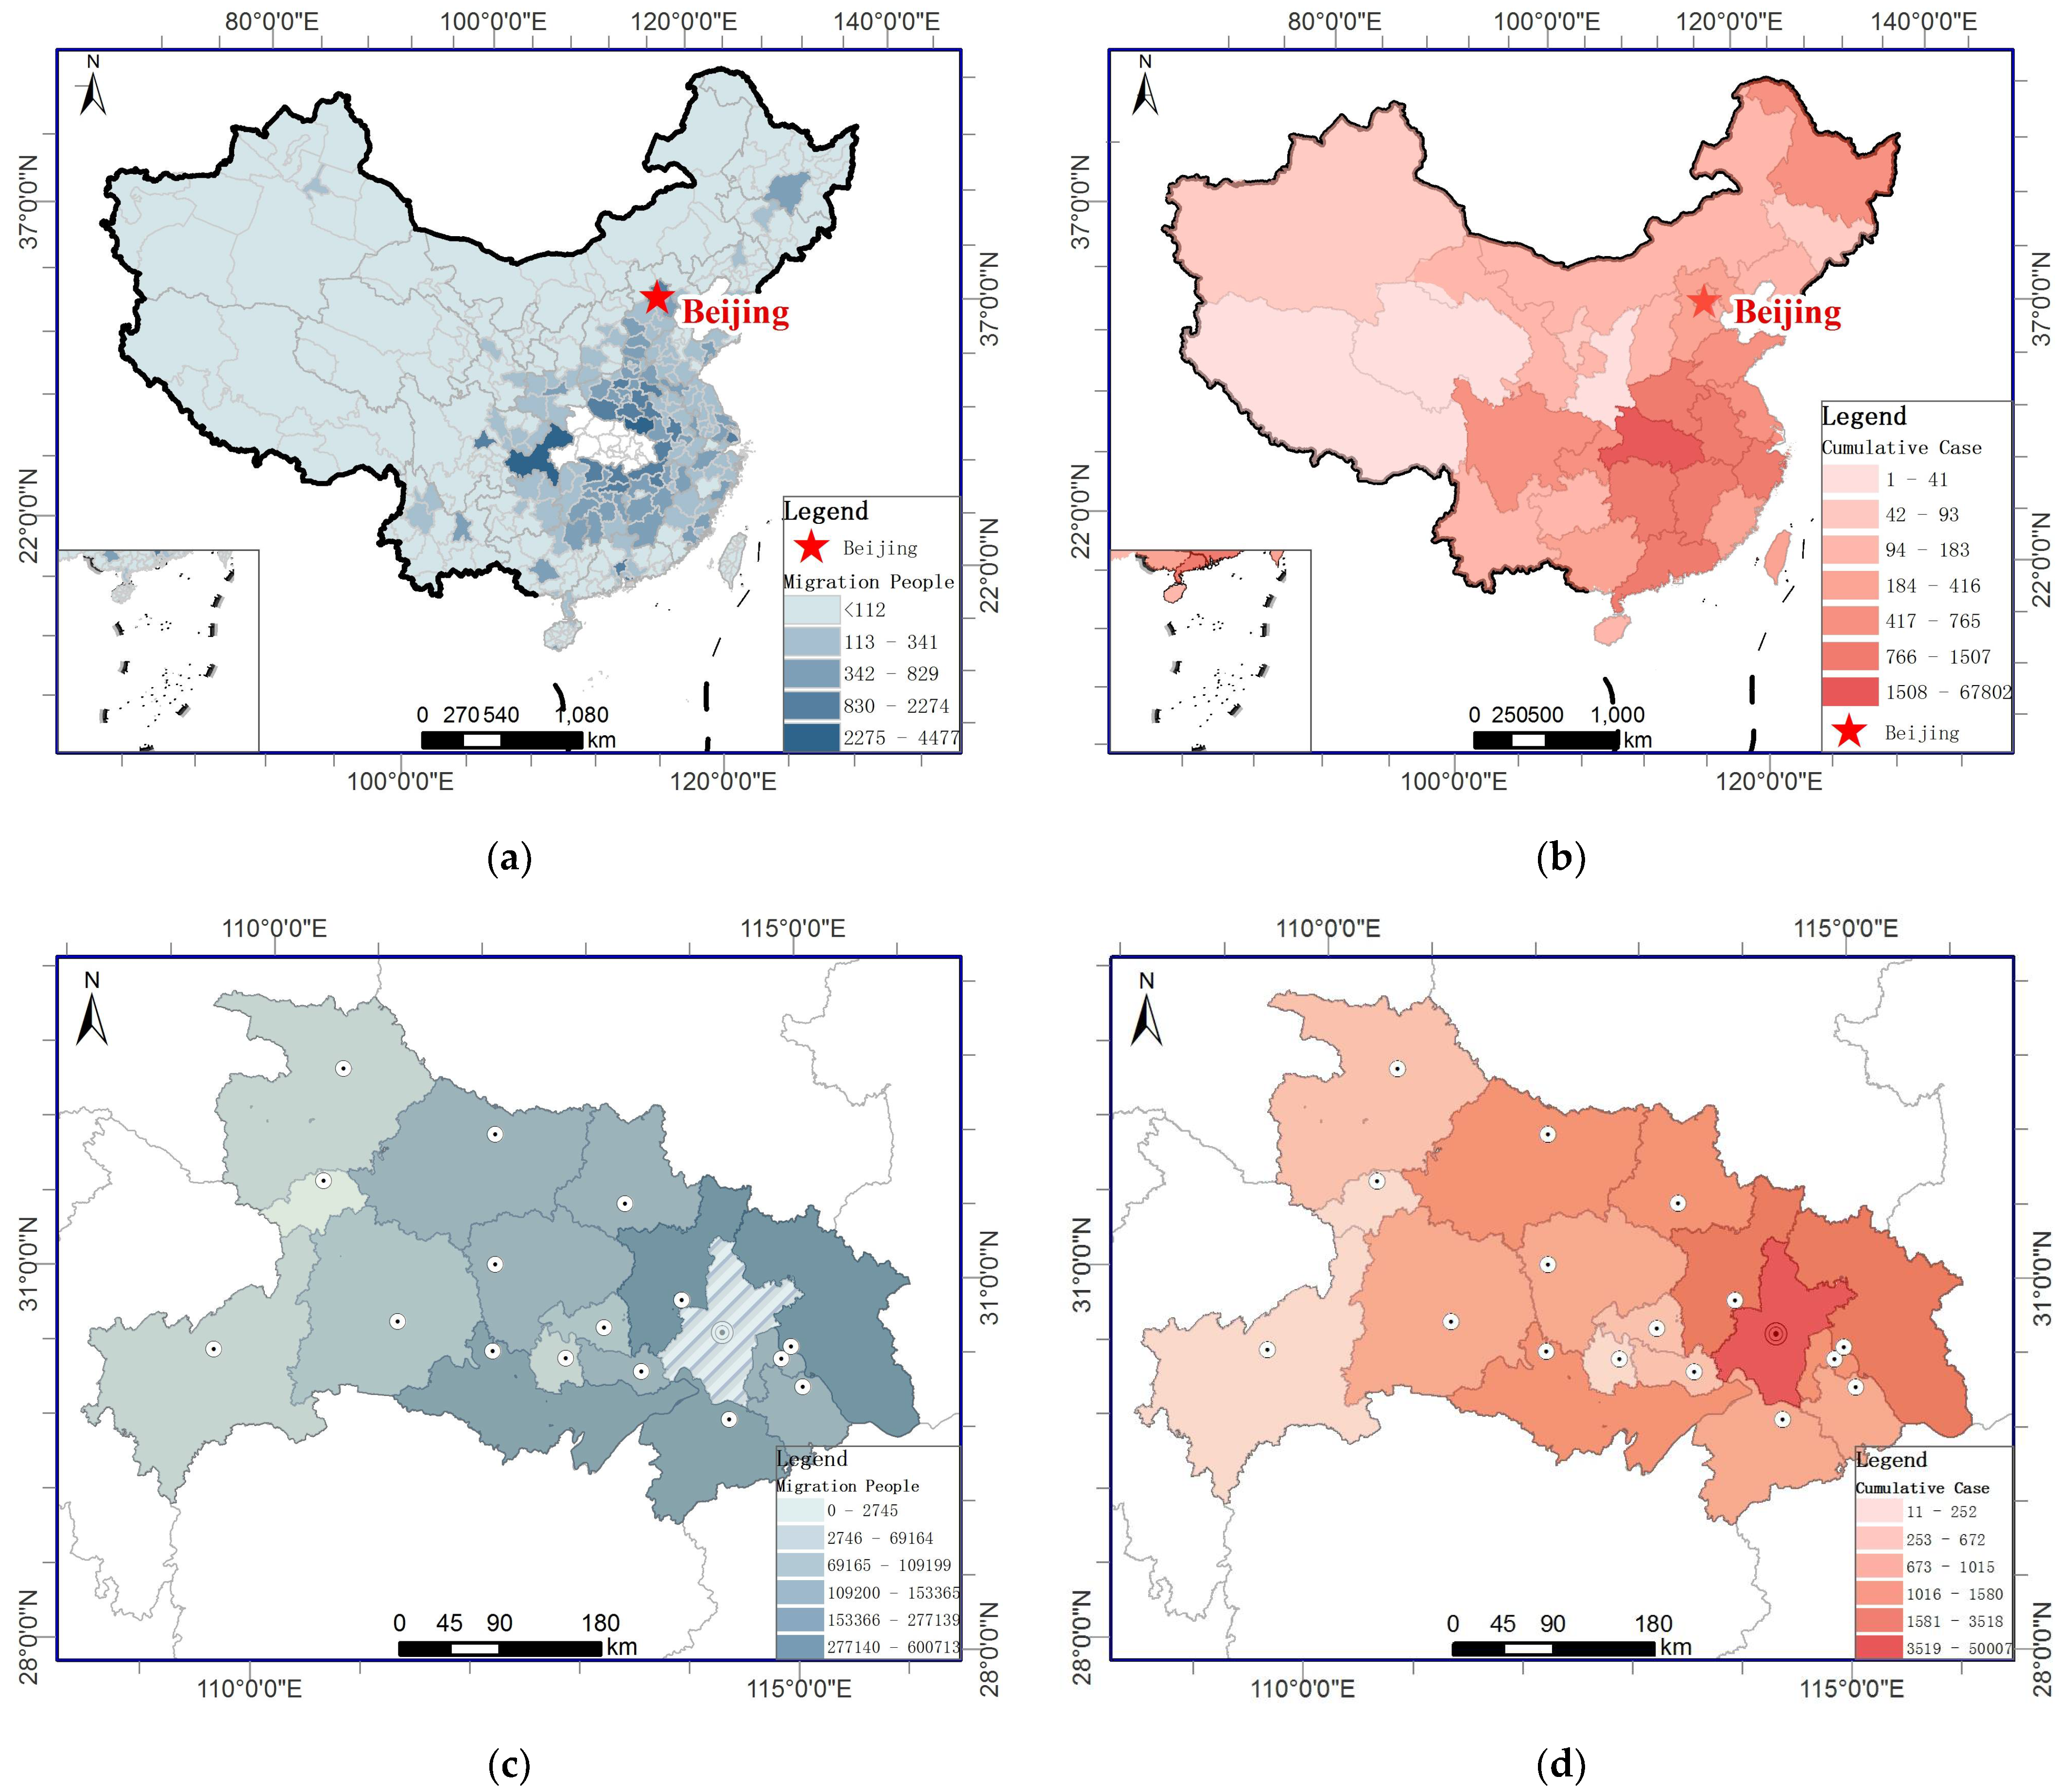
Distributions of outflows from Wuhan and the confirmed cases are demonstrated in
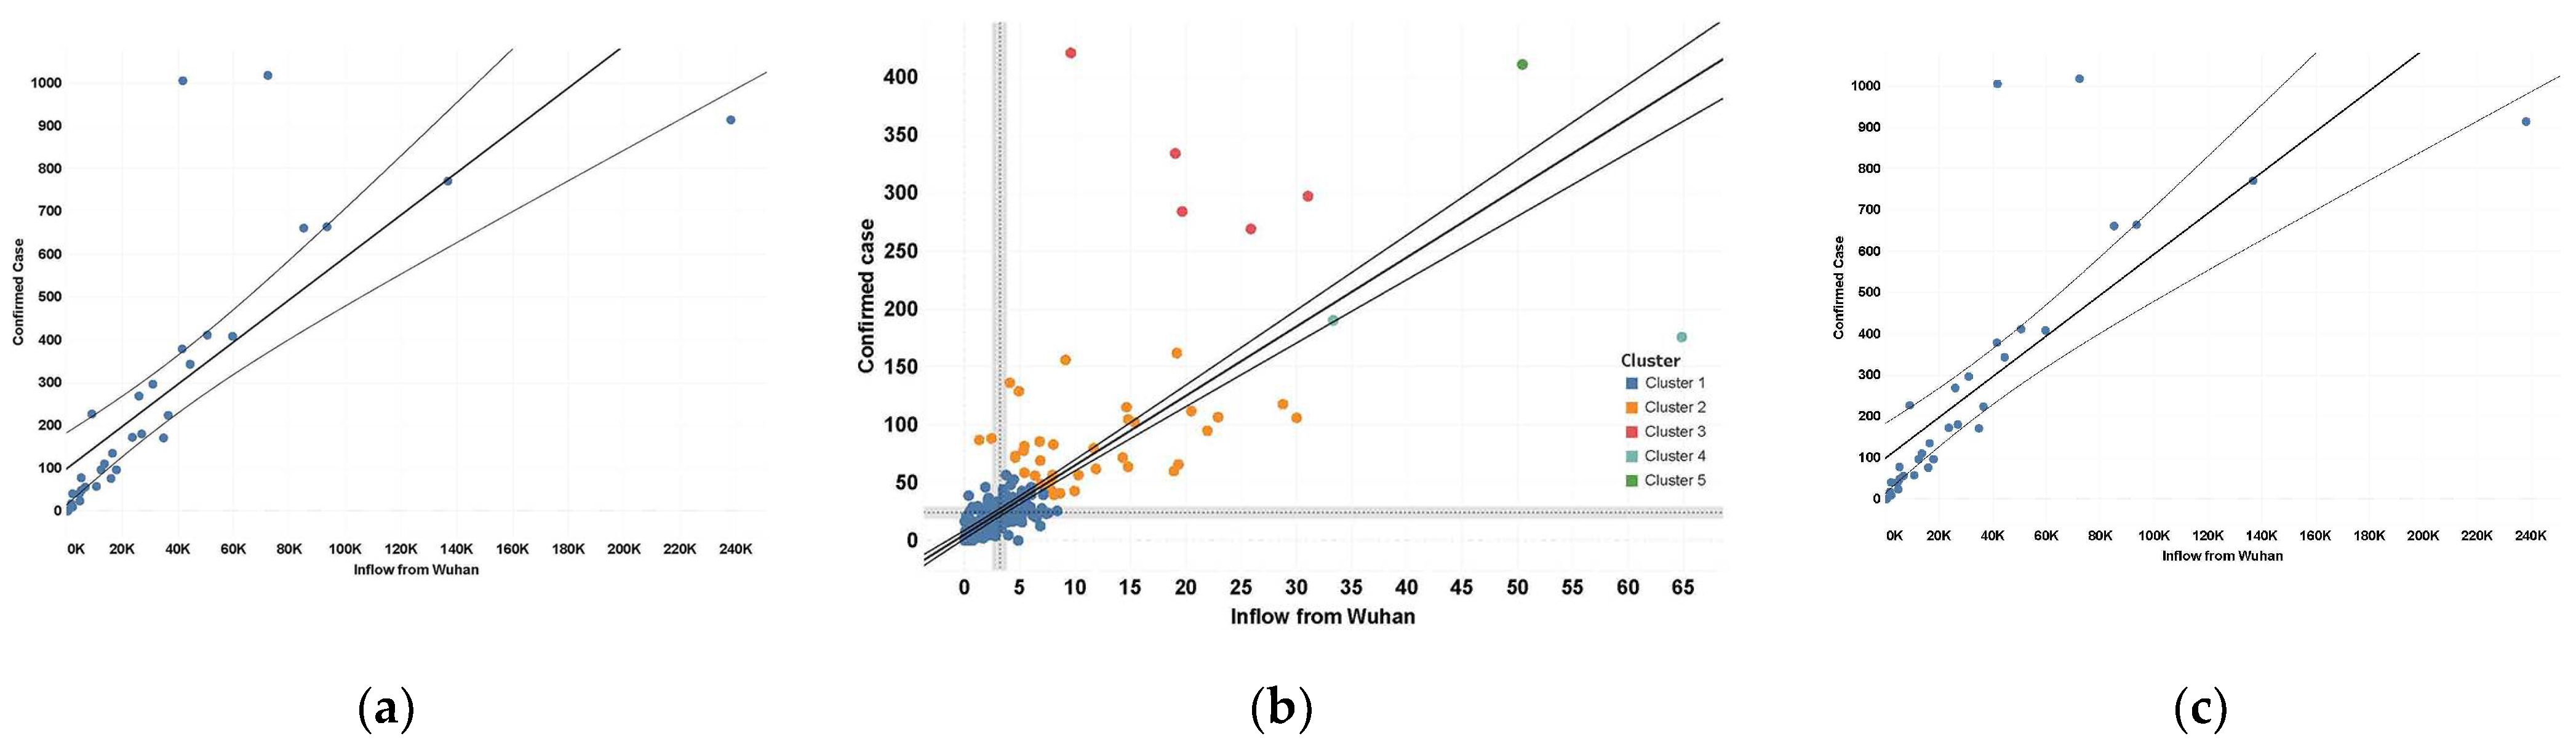
Figure 12. The results of the correlation analysis show that the amount of people who travelled from Wuhan to other areas just before the Spring Festival remarkably correlates with the local confirmed cases, as shown in
Figure 13. The R square of confirmed cases and inflows from Wuhan of 33 provinces in China is 0.6, the R square of the 371 cities outside Hubei province is 0.7, and that of the 16 cities inside Hubei province is 0.8.
The results of the clustering analysis show that there are different patterns in the external export. Cluster 1 covers 325 cities with the least population outflows from Wuhan and least confirmed cases. Cities around Wuhan are classified into cluster 2 with higher outflows from Wuhan but fewer confirmed cases, especially compared to those cities in cluster 3. These cities are closely connected with Wuhan, but self-driving is the main transportation mode. Therefore, the external export risk in these cities is relatively lower. Cluster 3 represents the most developed cities in China, involving Beijing, Shanghai, Guangzhou, and Shenzhen. Outflows from Wuhan to these cities are twice as many as cluster 2, but the number of confirmed cases is almost four times larger. These cities have large populations and population flows, and it is really difficult to track and control all of the people who come from Wuhan. Cluster 4 covers Xinyang and Changsha, which are major labour export cities in middle China. These cities are also closely connected with Wuhan. Their governments take strict control measures for people coming from Wuhan, and they have relatively lower confirmed cases compared with the outflows from Wuhan. Chongqing is the city in cluster 5 with the most outflows from Wuhan and confirmed cases. One reason for this is that there are many Chongqing people working in Wuhan. Another reason is that many people who come back to Chongqing generally transfer in Wuhan and that greatly increases the infection risk.
Based on the Baidu migration data in 2019, we calculated the reduced outflows from Wuhan to other areas after the Wuhan lockdown to evaluate the effects of this policy on the control of the spread of the epidemic. From 24 January to 25 in 2020, the number of people flowing out from Wuhan decreased by about 0.58 million compared to the same period in 2019. In particular, the population traveling from Wuhan to other cities in Hubei province reduced by 0.44 million, while the population traveling from Wuhan to other cities outside Hubei province reduced by 141 thousand. Compared with the flowing volume of the two weeks before the Spring Festival in 2019, the total migration outflow decreased by 14.5% during the same time in 2020. The outflows from Wuhan to inside and outside Hubei province decreased by 15.3% and 12.5%, respectively, compared to 2019. From 25 January to 30 January in 2020, the total migration outflow decreased by 1.14 million compared to 2019, with outflow inside Hubei province reduced by 765 thousand and outside Hubei province reduced by 0.44 million.
For the developed cities like Beijing, Shanghai, Guangzhou, and Shenzhen, during the two days before the Spring Festival, the flow of people from Wuhan to these cities decreased by 13 thousand in 2020 compared to 2019, and decreased by 67 thousand during the first six days of the Spring Festival in 2020 compared to 2019. As for cities in Hubei province, people moving from Wuhan to these cities decreased by 0.28 million on 23 January in 2020 and by 0.15 million on 24 January in 2020 compared to 2019, and by 0.77 million during the first six days of the Spring Festival in 2020 compared to the same period in 2019 with a daily average 0.13 million individuals reduced.
To sum up, if Wuhan delayed or did not implement the Wuhan lockdown, it would have brought serious negative effects to the control of the epidemic in China. The Wuhan lockdown effectively reduced the outflows from Wuhan and brought down the risk of infection. It is worthy to mention that less population outflows from Wuhan do not mean less confirmed cases, and that more population outflows from Wuhan do not mean more confirmed cases, too. The external export risk also relates to the transportation mode and governmental policy.
5.2. Intra-City Spread of the COVID-19
Due to the relatively large amount of the infectious people before the Wuhan lockdown, the number of confirmed cases did not immediately go down as a result of the Wuhan lockdown. We used data from the Baidu heat map, confirmed cases, and medical facilities to evaluate the effects of a series of control measures inside Wuhan.
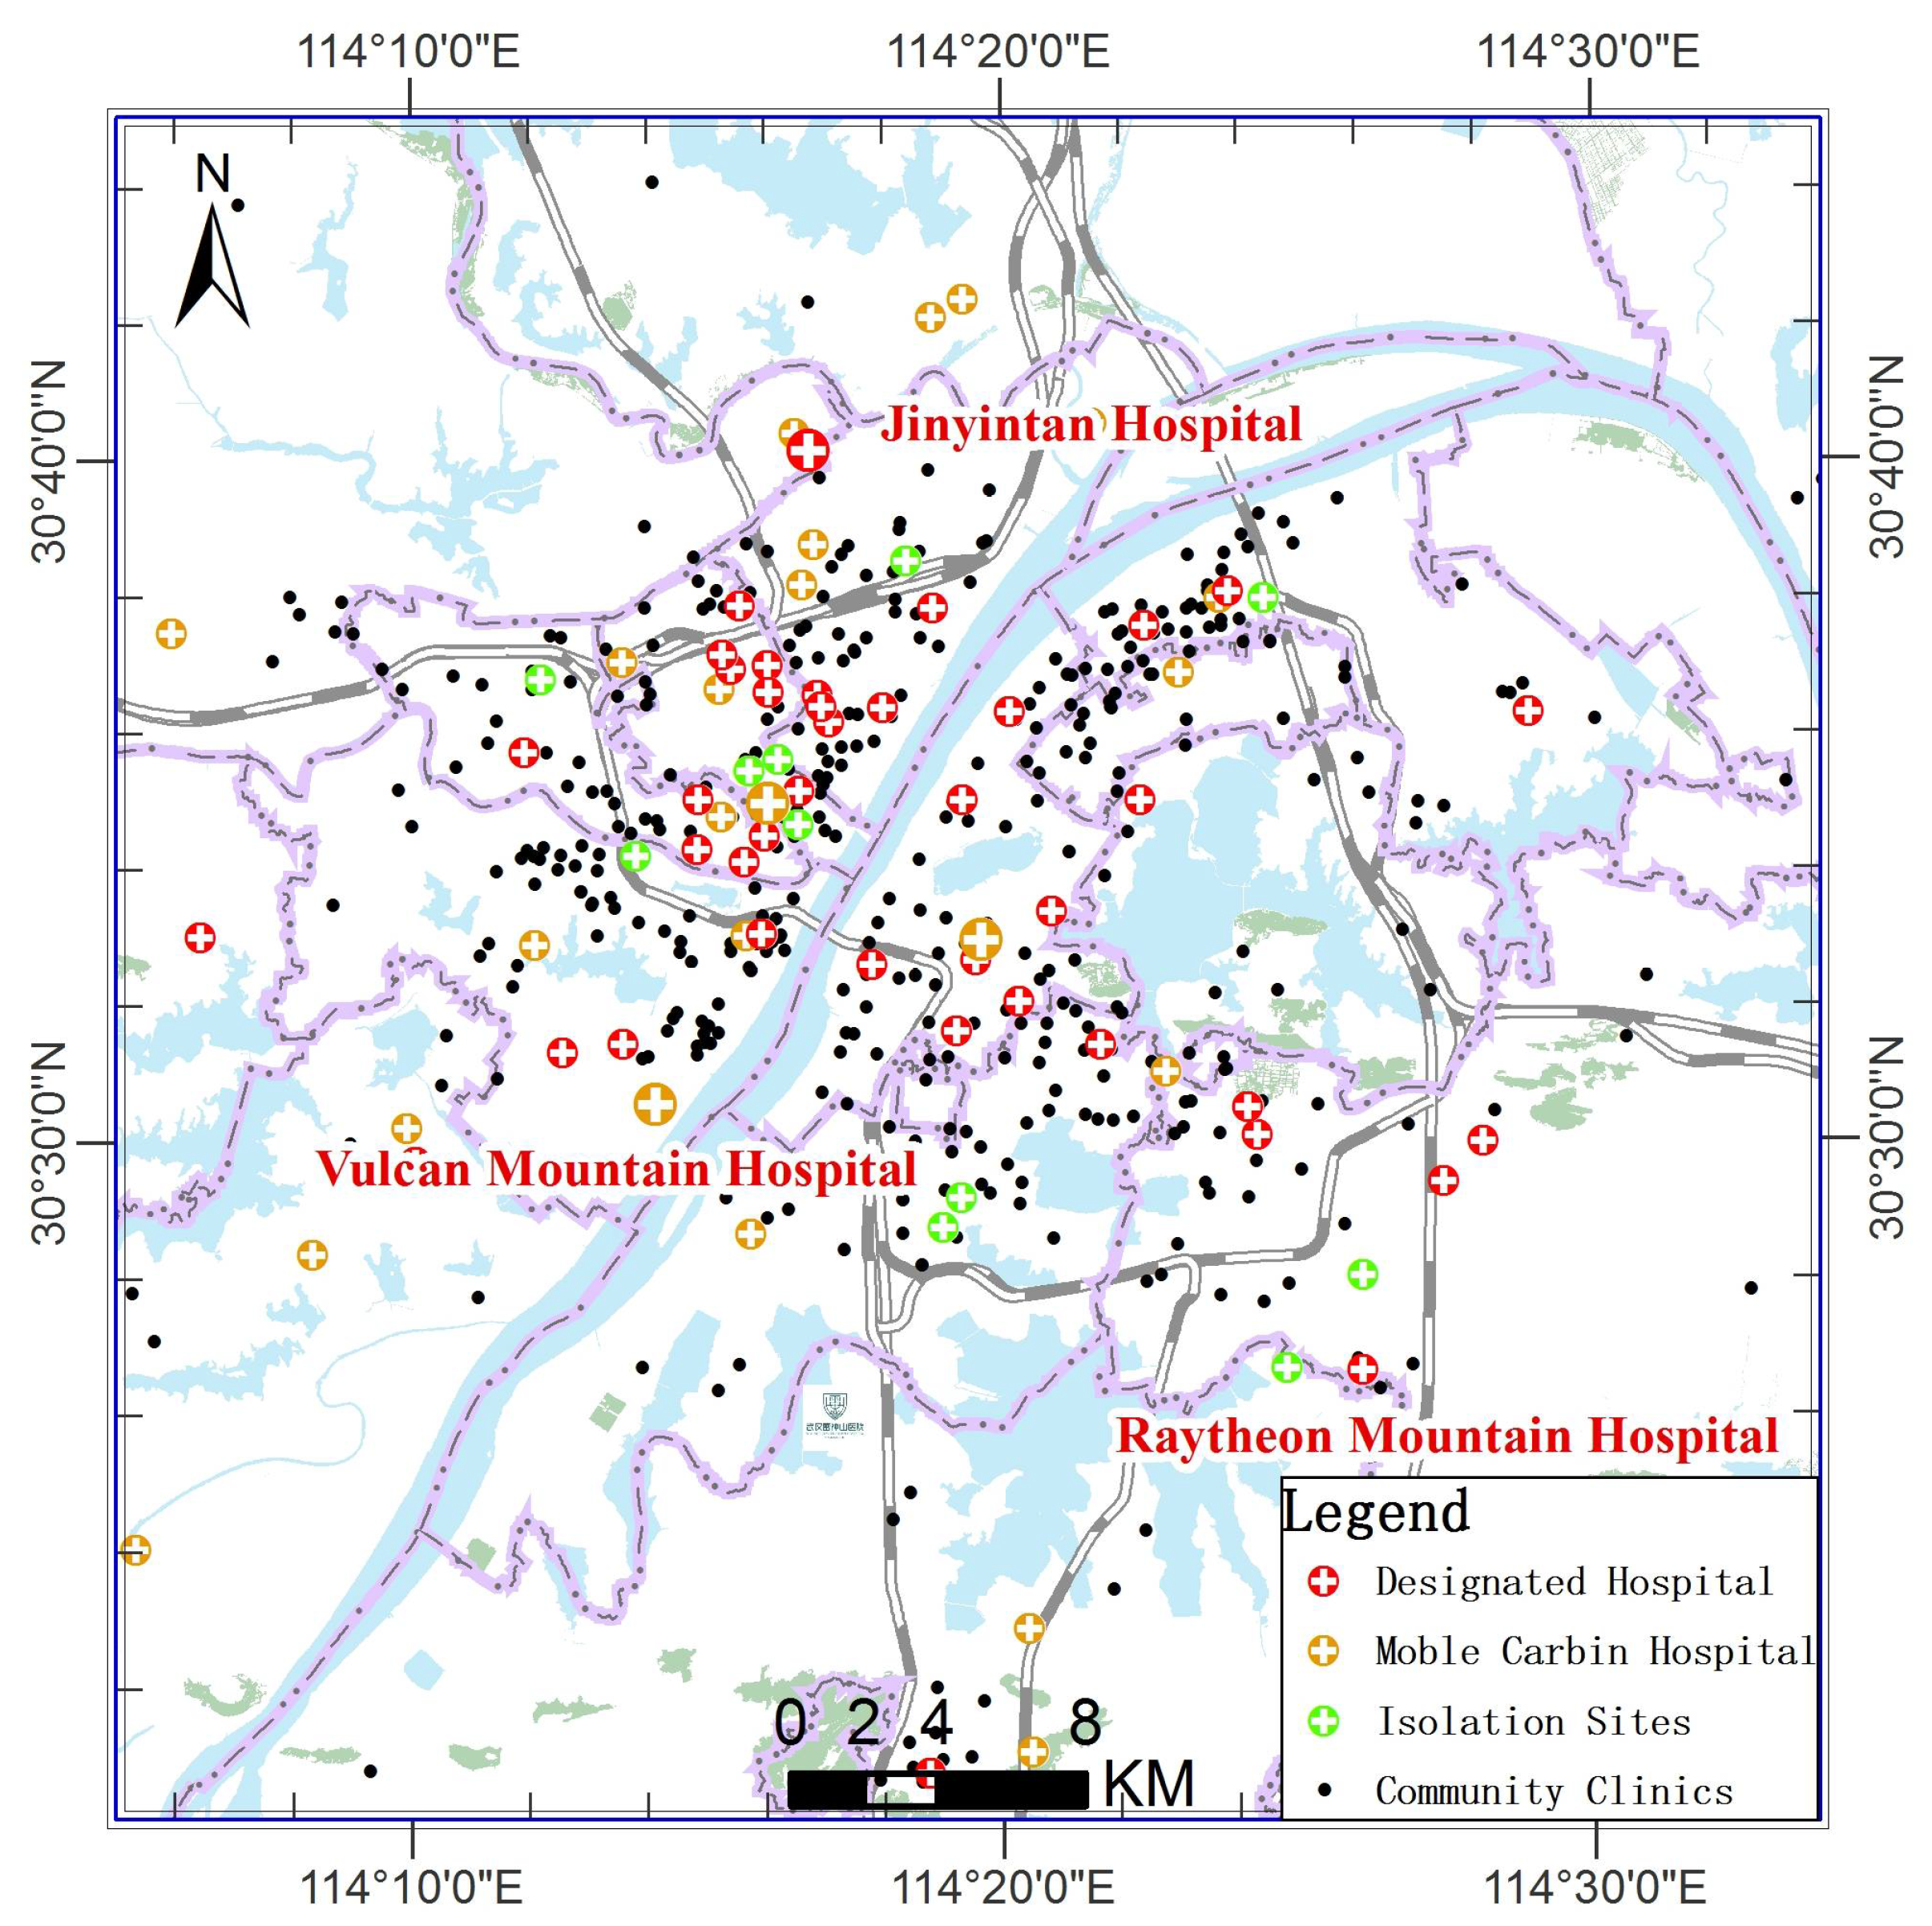
On 23 January 2020, Wuhan designated seven secondary public hospitals to specifically receive COVID-19 patients, providing a total of 3907 beds, which to some extent alleviated the pressure of seeking medical treatment for citizens. On 23 January and 25 January 2020, Wuhan decided to build the Vulcan Mountain Hospital and the Raytheon Mountain Hospital according to the model of the Beijing Xiaotangshan Hospital, providing a total of 2500 beds. Since 3 February, Wuhan urgently rebuilt several large public places such as the Hongshan Gymnasium, the Wuhan living room, and the Wuhan International Convention and Exhibition Center as mobile cabin hospitals and recruited hotels and universities as centralized isolation treatment points. By 29 February, Wuhan had 48 designated hospitals, 16 makeshift hospitals, and many isolation treatment sites, totaling more than 66,000 beds to treat patients and surpassing the development speed of the epidemic and realizing that "beds wait for the patients". At the same time, the nation and other provinces sent medical teams to support Hubei province. By 5 March, more than 42,000 people in 31 medical teams had been sent to support Hubei province, effectively ensuring the medical treatment capacity. The distribution of major medical facilities in Wuhan is shown in
Figure 14.
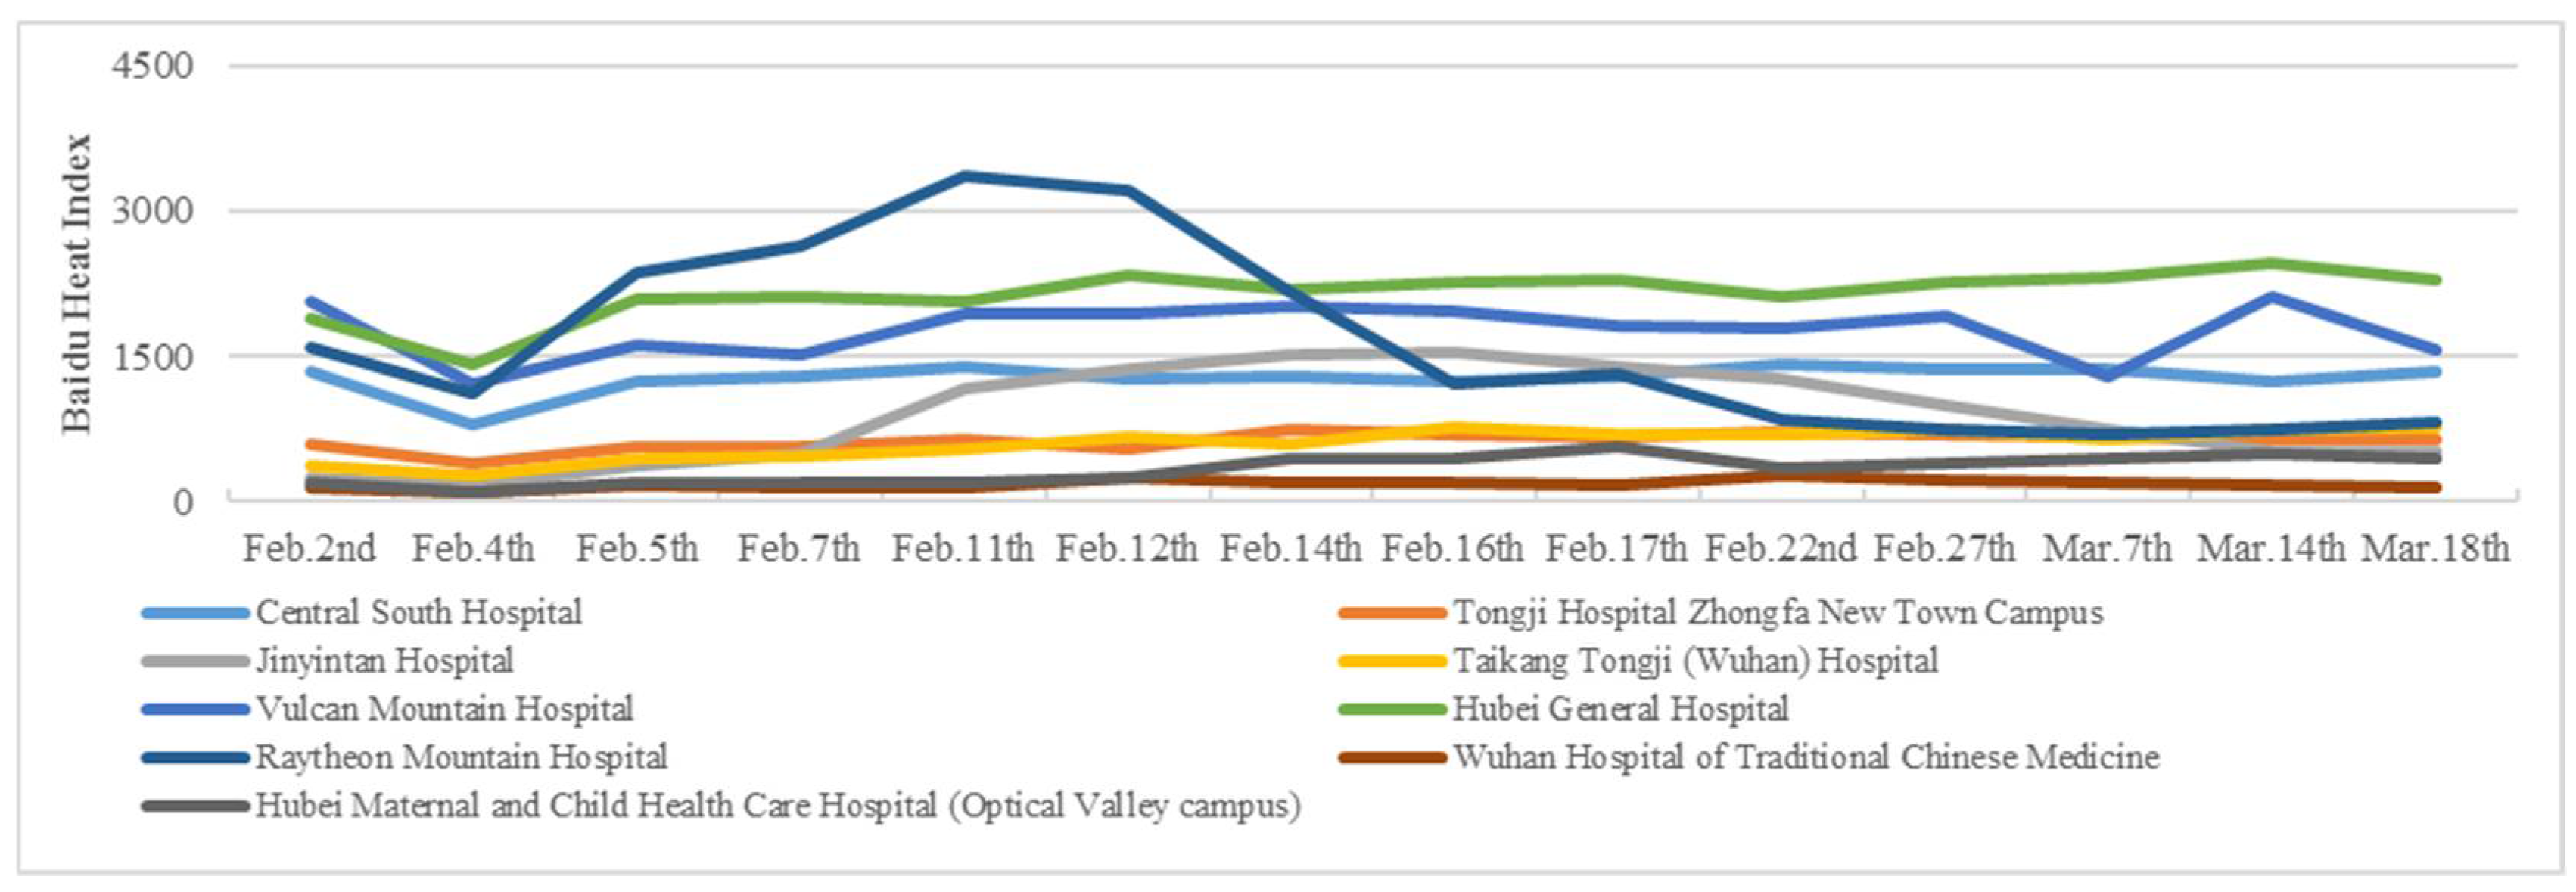
The changes of the population heat values in the designated COVID-19 hospitals are shown in
Figure 15. The population thermal change of the Vulcan Mountain Hospital, the Raytheon Mountain Hospital, the Jinyintan Hospital, and other specialized hospitals are obvious, which is obviously higher in February and gradually decreased after March. Some general hospitals, such as the Central South Hospital, the Tongji Hospital, the Zhongfa New Town Campus, and the People’s Hospital, continued receiving and treating newly confirmed patients during the whole epidemic period. As a result, the population heat value changes of these hospitals are not obvious. After the Hubei Maternal and Child Health Care Hospital (Optical Valley campus) increased its number of beds, the population heat increased significantly as well.
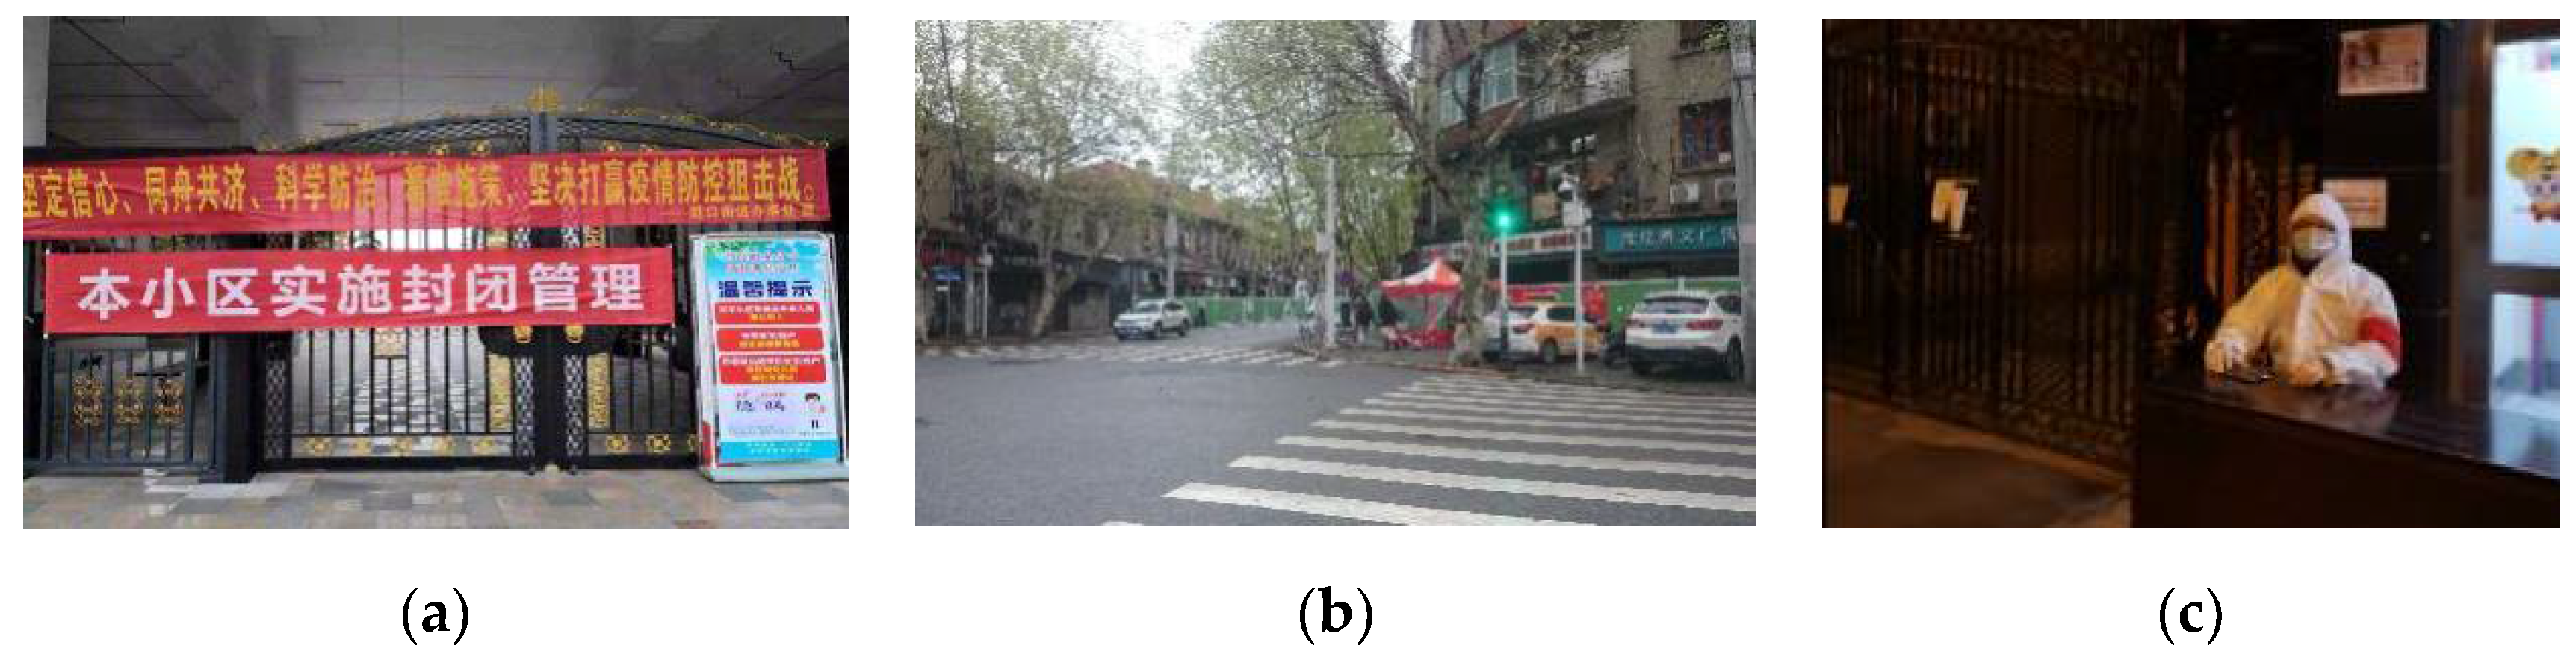
To completely eliminate the source of infection, Wuhan carried out closed management of all neighborhoods, especially for physical isolation of open neighborhoods in old town. Meanwhile, the government mobilized the staffs of the whole city’s authorities and enterprises to go to communities (villages), screening suspected patients for fever who occupy their homes, and providing life necessities to citizens. By 9 March, the city had more than 44,500 communists taking part in the works of communities (villages) to guard the communities (villages) on the first line of defense. The epidemic prevention in these communities is shown in
Figure 16.
To sum up, in terms of external export, Wuhan blocked the external traffic immediately after the Wuhan lockdown, which directly reduces the population outflow before the Spring Festival and plays a key role in the prevention and control of the epidemic in China. As for the internal spread, the outbreak continues within three towns after the closure of the city. Subsequently, a series of policies were introduced and implemented, which effectively controlled the population flows within the city, expanded the capacity of medical treatment, and gradually controlled the spread of the epidemic. These successful experiences also prove that only by reducing population agglomeration and migration, strengthening medical treatment capacity, and other measures can we effectively control the spread of the epidemic. These findings also provide an important reference for the prevention and control of the epidemic in other countries and regions.
6. Conclusions and Discussions
This paper used cell phone signaling data to analyze the effects that human mobility on the spread of the COVID-19 pandemic in Wuhan. We also evaluated the significance of the serial measures and policies responding to the pandemic, which are meaningful in the response to similar public health emergencies and the prevention and control of other epidemics. The statistical method proposed in this work can be used to evaluate influence regions of supermarkets, hospitals, shopping malls, and other public services where people are highly concentrated. This method can also be used to find high risk areas in emergency events of public health, which is of great importance since there are still many known or unknown epidemics around world.
There are many interesting and important findings which support the fight against COVID-19 in Wuhan and other cities. Firstly, people in Wuhan had insufficient and even wrong knowledge about the disease at the early stage. The risk of the disease infection had spread within three towns of Wuhan at that time when the public had the wrong perception of “Hankou is the center of the infection”. People also underestimated the cross-regional and cross-river medical services of general hospitals, as well as the effects of public transportation and human mobility on the spread of the pandemic. Secondly, wholesale markets and other commercial centers with frequent visitors were the areas with high risk of infection. Different groups of population influence the expansion of the high-risk areas to different extents. Commuters mainly affect the spread of the pandemic in their neighboring areas, while people who engage in daily business activities spread the risk across the city and even across the country. This was confirmed by the outbreak of the pandemic in Beijing’s Xinfadi Market in June 2020. Thirdly, the Wuhan lockdown effectively blocked the population outflow from Wuhan and greatly reduced the external spread risk. However, this measure has limited effect on preventing the spread of the pandemic within the city. Effective measures should be taken to reduce population aggregation and movement, strengthen disinfection capability, and improve the capacity for medical treatment. Wuhan improved its prevention and control measures, and these measures led to a final success in the fight against the pandemic in return. This also provides precious experience to the control of the pandemic in other regions and countries. Fourthly, external export risk not only related to outflows from Wuhan, but also related to transportation mode and governmental policy.
This study also has several limitations. Firstly, since there were a large number of community and family clusters of infection at the early stage in Wuhan, it is impossible to replay the transmission process of epidemic. Thus, this study mainly analyzes the statistical characteristics of population mobility and the possible transmission risks of COVID-19 around Wuhan. Secondly, limited by big data positioning accuracy, data timeliness, and confidentiality laws, the study area covers South China Glasses Wholesale Market and other large wholesale markets, which brings certain limitations and interferences to the analysis results. Thirdly, we did not analyze the effects that people distribution pattern and travel mode had on transmission risk. For example, if people living in high infection risk areas migrate to other cities during the Spring Festival travel rush by train, this would have different transmission risk compared with driving themselves. Moreover, we will carry out future study from the following aspect. Because it is difficult to obtain the number of confirmed cases at the residential district or community scale, we will use data from an epidemiological survey to validate our results. Since this study mainly reflects group rule, we will do more work on individual travel trajectory and make full use of big data at the micro scale. Theoretically, we can find the No. 0 patient if the global epidemiological survey is combined with the global mobile signaling data analysis, and, of course, this is a political issue rather than an academic issue.
Wuhan is in the center of the epidemic. With the great support of whole nation, as well as the desperately working frontline medical staffs and the common stock of Wuhan’s people, we finally won the “Wuhan defense”, which lasted for more than two months. Wuhan gradually returned to normal after the reopening on 8 April 2020. We have been monthly monitoring inter-city migration and inner-city population mobility since January 2020. By September 2020, the inter-city migration and inner-city population flow returned to 62% and 90% of those in 2019. By December 2020, residential and working population in Wuhan returned to 97% and 92% of those in 2019. We have come out of the dark hour and ushered in a bright spring day. Wuhan has been restarted, and the economy, society, and life are returning to normal.


