Article

Coupling Fuzzy Multi-Criteria Decision-Making and Clustering Algorithm for MSW Landfill Site Selection (Case Study: Lanzhou, China)

1
College of Earth and Environment Sciences, Lanzhou University, Lanzhou 730000, China
2
The Key Laboratory of Western China’s Environmental Systems, Ministry of Education (MOE), Lanzhou 730000, China
*
Author to whom correspondence should be addressed.
ISPRS Int. J. Geo-Inf. 2021, 10(6), 403; https://0-doi-org.brum.beds.ac.uk/10.3390/ijgi10060403
Submission received: 7 May 2021 / Revised: 5 June 2021 / Accepted: 9 June 2021 / Published: 11 June 2021

Abstract

:
The siting of Municipal Solid Waste (MSW) landfills is a complex decision process. Existing siting methods utilize expert scores to determine criteria weights, however, they ignore the uncertainty of data and criterion weights and the efficacy of results. In this study, a coupled fuzzy Multi-Criteria Decision-Making (MCDM) approach was employed to site landfills in Lanzhou, a semi-arid valley basin city in China, to enhance the spatial decision-making process. Primarily, 21 criteria were identified in five groups through the Delphi method at 30 m resolution, then criteria weights were obtained by DEMATEL and ANP, and the optimal fuzzy membership function was determined for each evaluation criterion. Combined with GIS spatial analysis and the clustering algorithm, candidate sites that satisfied the landfill conditions were identified, and the spatial distribution characteristics were analyzed. These sites were subsequently ranked utilizing the MOORA, WASPAS, COPRAS, and TOPSIS methods to verify the reliability of the results by conducting sensitivity analysis. This study is different from the previous research that applied the MCDM approach in that fuzzy MCDM for weighting criteria is more reliable compared to the other common methods.

1. Introduction

Rapid urbanization and population growth have posed serious challenges to the sustainable development of cities, which have also led to environmental pollution and a dramatic increase in the generation of waste [1]. Over the last decade, global Municipal Solid Waste (MSW) generation has increased from 0.68 billion tons per year (0.64 kg of MSW per person per day) to 1.3 billion tons per year (1.2 kg per person per day), which is likely to reach 2.2 billion tons per year by 2025 [2]. MSW is a critical issue with the potential to have severe negative impacts on the environment and public health [3]. Therefore, the disposal of immense volumes of MSW has become a matter of great concern for urban planners and environmental managers on a global scale [4].
Although China has experimented with waste classification and harmless treatment policies in Shanghai and other developed cities since 2018, landfill remains the most essential and efficacious means for disposing of most MSW for the majority of economically underdeveloped areas [5]. It was revealed that improper landfills can have long-lasting damaging impacts and cause potential harm to the surrounding ambient soil, groundwater, and atmosphere [6]. Thus, the selection of suitable sites for landfills is considered a complex and urgent task in Municipal Solid Waste Management (MSWM) [7].
Numerous Multi-Criteria Decision-Making (MCDM) methods have been developed to support decision-making in MSWM, including AHP [2,8], Analytic Network Process [9], Fuzzy logic [10], Ordered Weighted Average (OWA) [11], Weighted Linear Combination [12], and Technique for Order of Preference by Similarity to Ideal Solution (TOPSIS) [13]. Different methods have their own advantages and disadvantages. As AHP is user-friendly, it transforms complex decision systems into simple hierarchies and paired systems, whereas GIS is a computer-based decision support system with the capacity to manage, analyze and display geospatial reference data [3,14,15]. Therefore, GIS-AHP is extensively employed in potential landfill site selection [16]. Demesouka et al. (2013) [17] evaluated the suitability of potential MSW landfill sites in Northeastern Greece by applying GIS combined with AHP and compromise programming methods. Spigolon et al. (2018) [18] used an AHP approach in a GIS environment for the siting of sanitary landfills and the optimization of the transportation of municipal solid waste in São Paulo, Brazil. However, they need to consider the correlations between multiple criteria, and the establishment of a large number of paired matrices to calculate weights may cause confusion [19]. Further, the considerable reliance on expert opinion leads to strong uncertainty and subjectivity in the weight [20].
To resolve the above issues, an effective approach was proposed to understand the internal relationships of criteria that lead to structuring complex criteria in the form of cause-and-effect groups [21]. Decision-Making Trial and Evaluation Laboratory (DEMATEL) can employ weighted directed figures and matrices to analyze causal relationships between criteria in complex systems, reflecting the overall impacts of different criteria [22]. It has been widely utilized in environmental research and other fields [23]. ANP views mutual dependencies and feedback relationships between decision elements (e.g., criteria, sub-criteria, and optimal alternatives) as network structures, and effectively determines the relative importance of evaluation criteria through the construction of a super matrix [24]. There is no need to compare the evaluation criteria in pairs, and the weight depends on the mutual effects between different criteria, which can reduce the subjective impact of expert scoring to a certain extent [24]. Fuzzy logic formulated fuzzy function for each criterion in GIS [25], it can make up for the theoretical defects of ANP inheriting AHP, such as rank inversion problem, priority derivation method, and comparison scale [26,27]. Eghtesadifard et al. (2020) [28] drew on DEMATEL-ANP and triangular fuzzy membership function to superposition 13 evaluation criteria layers to determine the optimal municipal solid waste landfill site. Isalou et al. (2013) [29] determined environmental, social, economic, and general acceptance criteria, and ANP and triangular fuzzy membership functions were adopted for site selection. However, the evaluation criteria of the above studies are not comprehensive, ignoring the influence of hydrological factors on site selection. Moreover, choosing the same membership function cannot accurately express the fuzzy logic of discrete and continuous data, which limits the accuracy of site selection results. This study identified 21 criteria in five groups through the Delphi method at 30 m resolution and proposed to integrate DEMATEL-ANP and GIS technology in different fuzzy logic environments to resolve the landfill site selection problem while ensuring the certainty of the optimal decision.
Further, three density-based clustering methods were used to identify and analyze candidate sites. Compared with the K-Means method, the density-based clustering analysis does not require prior knowledge of the number of clusters to be formed, the shape of the clusters is not limited, and noise points can be identified [28]. In addition, in terms of selecting the optimal site for waste disposal, a variety of MCDM methods have been utilized, including TOPSIS, fuzzy TOPSIS, and PROMETHEE [30]. Mohammadi et al. (2021) [31] employed the PROMETHEE method to selected zones located in the high classes as the best locations for waste disposal. There may be suboptimal solutions depending only on one method to get the ranking result, which is not convincing [32]. Therefore, we categorized the criteria as positive and negative, and the site selection results were ranked by COmplex PRoportional ASsessment (COPRAS), Weighted Aggregated Sum Product Assessment (WASPAS), Multi-Objective Optimization by Ratio Analysis (MOORA), and TOPSIS methods. When four methods have a high consistency with each other and the efficacy of criterion weights and results are proved, so that avoid the risk of recognizing a sub-optimal solution when only depending on one approach.
Lanzhou is a typical semi-arid valley basin city, where water resources are scarce, environmental pollution is serious, and the contrasts between anthropogenic activities and the land are extremely poignant [33]. The degradation of the ecological environment and the overdevelopment of land have become the key issues to be urgently resolved during the construction of Lanzhou [34]. Unlike humid coastal regions, the study area is characterized by complex terrain and a fragile ecological environment [35,36]. Therefore, it is critical to select suitable landfill sites for Lanzhou based on regional characteristics. The overall objective of this study was not only to identify the most suitable site for MSW landfill by employing a decision support framework based on MCDM, but also to promote MSWM and sustainable urban development in response to regional characteristics, environmental management, and land-use planning of the study area. Specific objectives included: (a) Proposing a new flexible, practical, and comprehensive model (fuzzy MCDM and clustering algorithm) to identify suitable landfills that minimize the negative impacts of MSW on the environment. (b) Identifying the criteria applicable to the site selection of semi-arid river valley basin-type urban landfills via a comprehensive consideration of hydrogeological, morphological, environmental, climatic, and socioeconomic constraints. (c) Establishing the interdependencies between the variables and their dependency networks, and formulating a fuzzy function for each criterion. (d) Employing the clustering algorithm to determine MSW landfill sites that conformed to the China National Standard (CNS) of environmental management and land use planning. (e) Verifying the stability of the optimal decision plan according to ranking and sensitivity analysis.
This study is categorized into six main sections. In Section 1, the research background, research significance, goals, and scientific problems to be solved are introduced. In Section 2, the overview of the study area and the data sources are presented. In Section 3, the proposed methodology, including Delphi, fuzzy DEMATEL-ANP, GIS, clustering algorithm, MOORA, WASPAS, COPRAS, and TOPSIS are described. Section 4 presents and discusses the results. Section 5 puts forward discussions about the results of the problem and the privileges of the study. Finally, Section 6 provides the concluding remarks and suggestions for further research.

2. Study Area and Data Sources
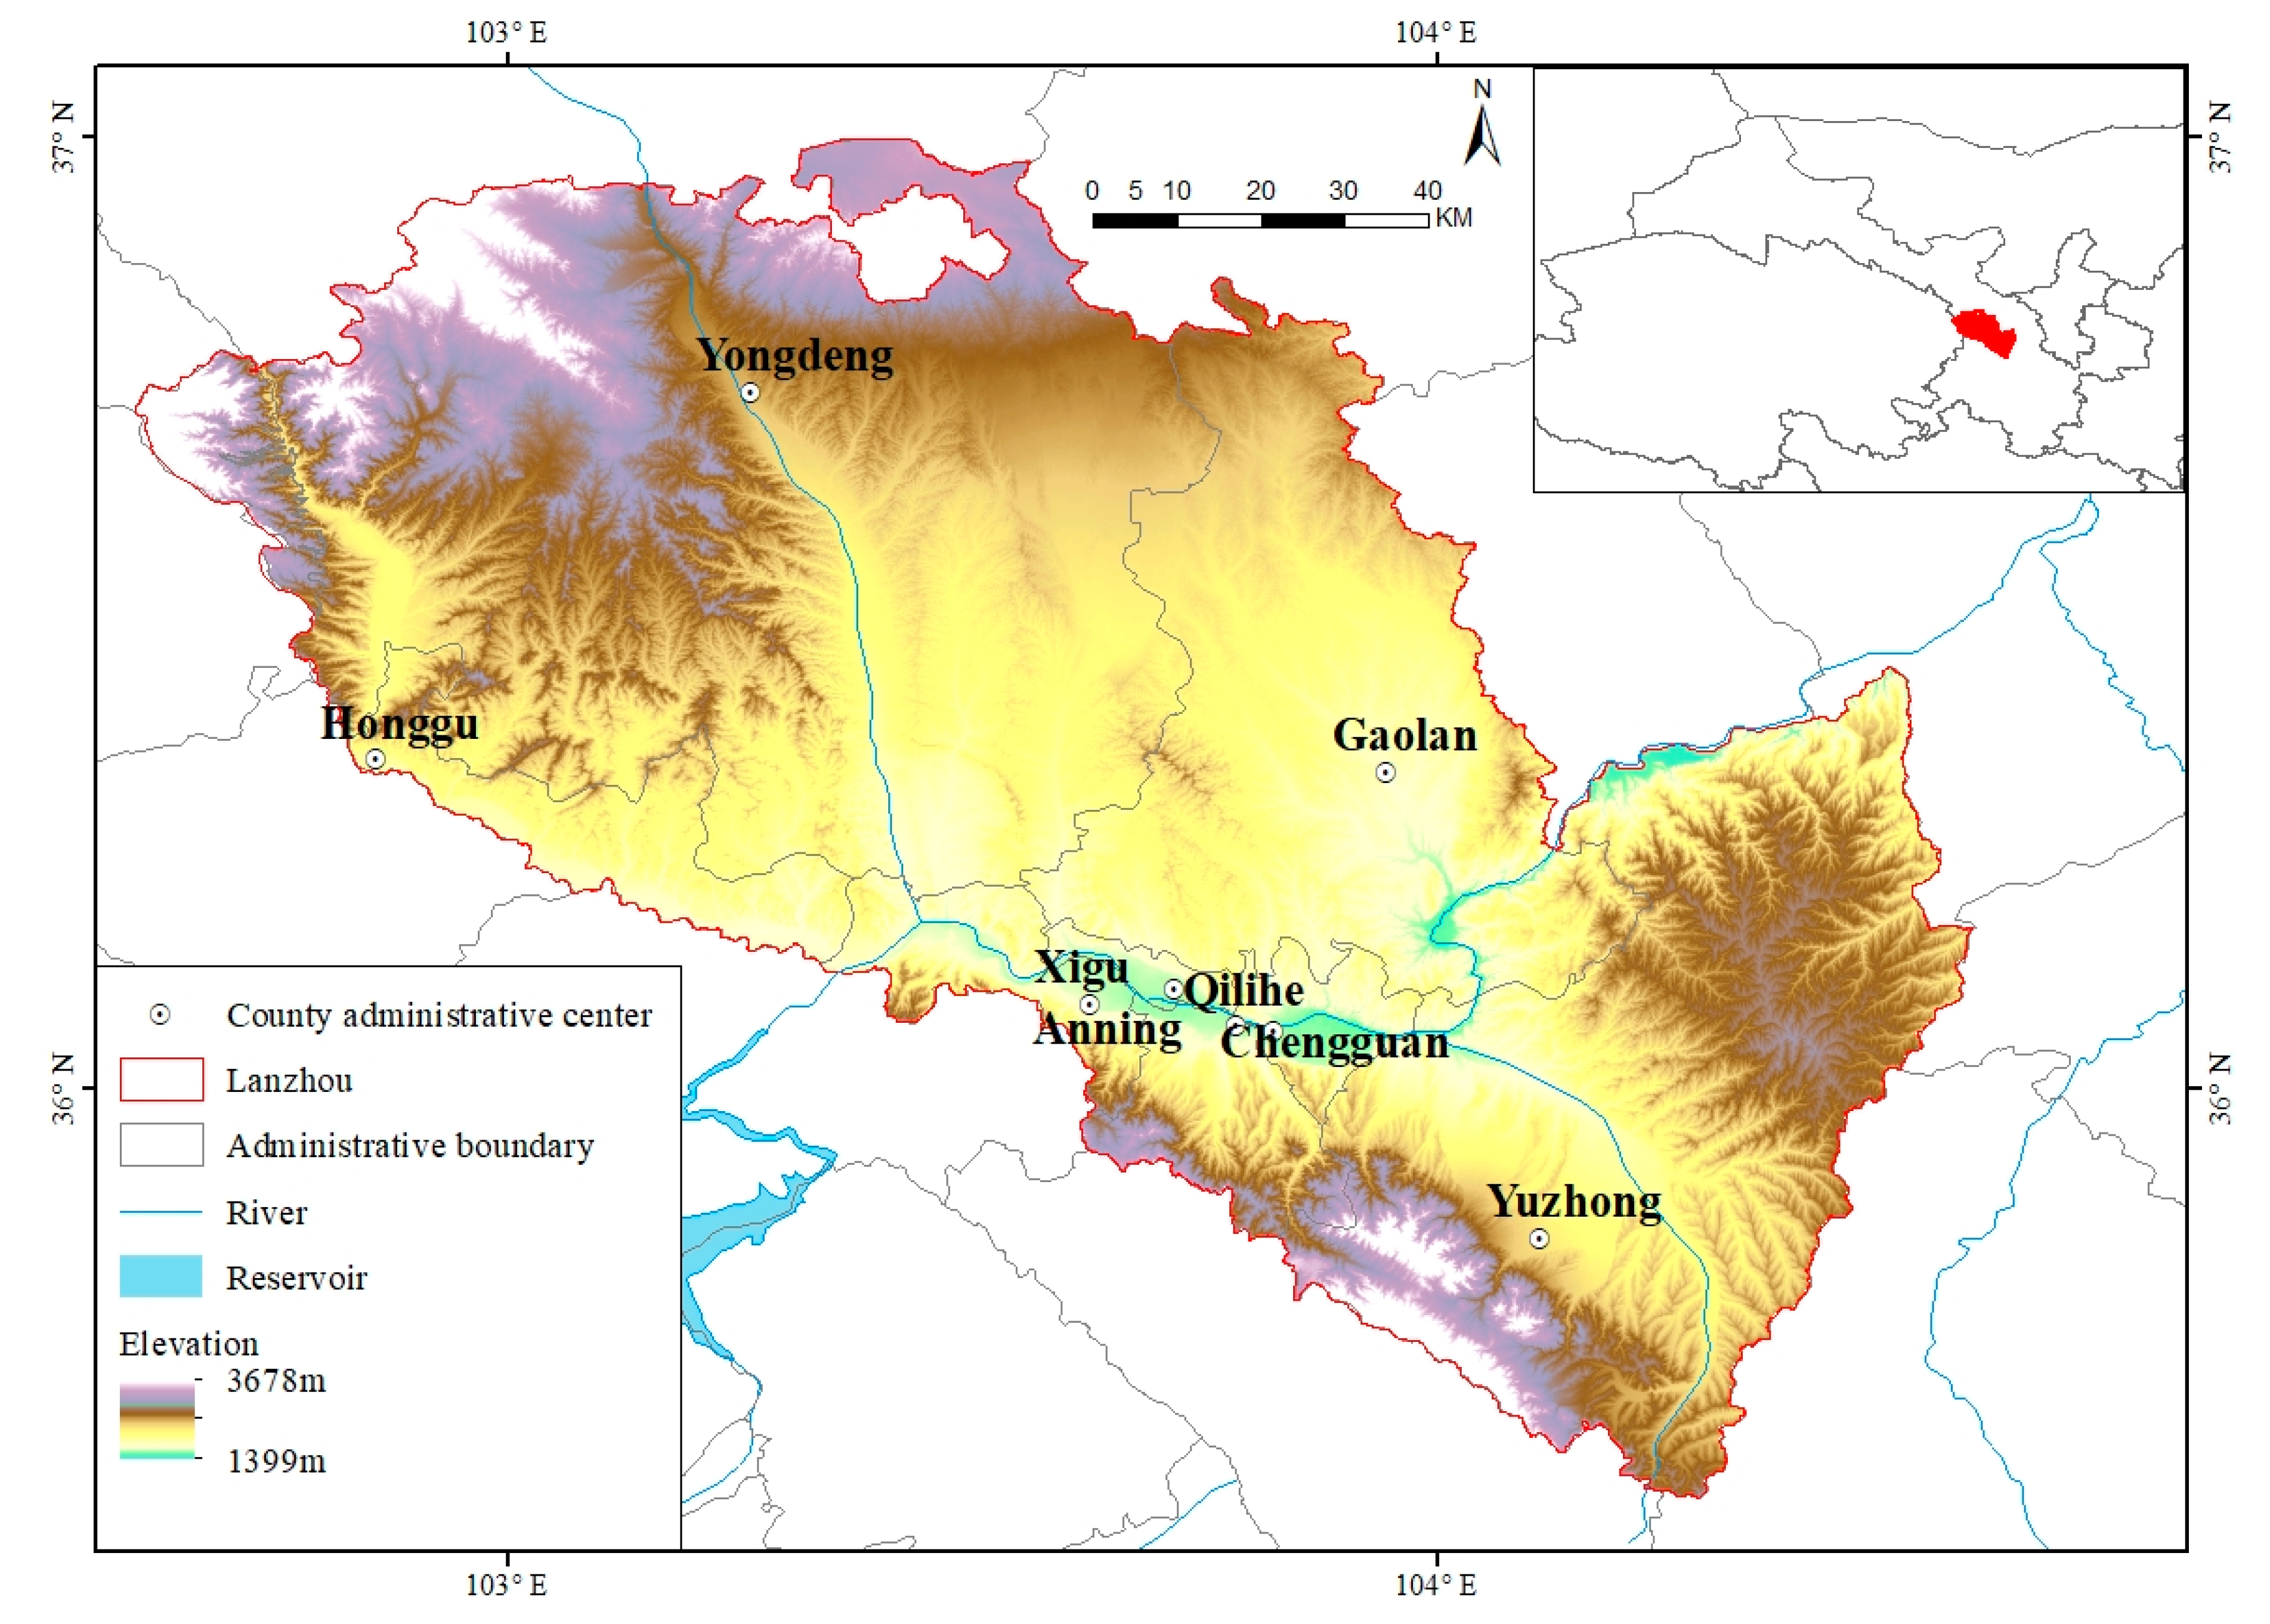
2.1. Study Area

Lanzhou (Figure 1) (103°40′ E, 36°03′ N) is located in the central part of Gansu Province, China. It is one of the typical river valley basin-type cities in a semi-arid area [37]. The terrain of the study area is high in the southwest and low in the northeast, with an average altitude of 1520 m. The Yellow River flows from southwest to northeast across the entire territory and traverses the mountains, forming a beaded valley with alternate canyons and basins, which runs ~35 km from east to west and 2 km to 8 km from north to south [38]. The landforms are complex and diverse, with a staggered distribution of mountains, plateaus, plains, and river valleys. Due to the uplift of the Qinghai-Tibet Plateau since the new century, a temperate continental climate has been formed, with an average annual temperature of ~10.3 °C and precipitation of ~327 mm [39].
As of July 2020, the city has jurisdiction over five districts and three counties, with an approximate area of 1.31 × 10⁴ km2 and a population of over 4.13 × 10⁶ people. According to statistics from the Gansu Environmental Statistics Bulletin (GESB, 2009), 7.30 × 10⁵ tons of domestic waste are generated annually in the four suburban districts of Lanzhou city, with 3.30 × 10⁵ tons (45.7%) from Chengguan, 1.26 × 10⁵ tons (17.3%) from Qilihe, 1.43 × 10⁵ tons (19.6%) from Xigu, and 1.27 × 10⁵ tons (17.4%) from Anning, as a rate of 5% to 8% per year. The output of domestic waste is 3000 tons in the urban area every day; however, only 2100 tons can be effectively disposed of, with a disposal rate of 70% (http://sthj.gansu.gov.cn/, accessed on 20 December 2019). The remaining waste is spread across the surrounding areas of the city, which seriously restricts the development of Lanzhou. Figure 2 illustrates the framework proposed in this study.

2.2. Data Sources

The data used in this study are mainly divided into vector data (point, polygon, polygon) and raster data, which are large in quantity and time-consuming in preprocessing. Vector data focused on recording the properties of criterion, while raster data focused on representing the spatial distribution of the criterion. According to the data sources, the data were obtained from open-source geographic information-sharing platforms, online websites, and government agencies. The open-source geographic information sharing platform included the Resource and Environmental Science and Data Center, Chinese Academy of Sciences and National Catalogue Service for Geographic Information.
Online websites included the official of MODIS, USGS Earth Explorer, and Gaode Maps. Government agencies included the Gansu Water Resources Department, Gansu Bureau of Geology and Mineral Hydrogeology Engineering Geological Exploration Institute, Gansu Earthquake Agency, and Portal website of Gansu Forestry and Grass Bureau. All of the criterion data sets used in this study, as well as their formats and sources, are described in Table A1 in Appendix A.

3. Methods

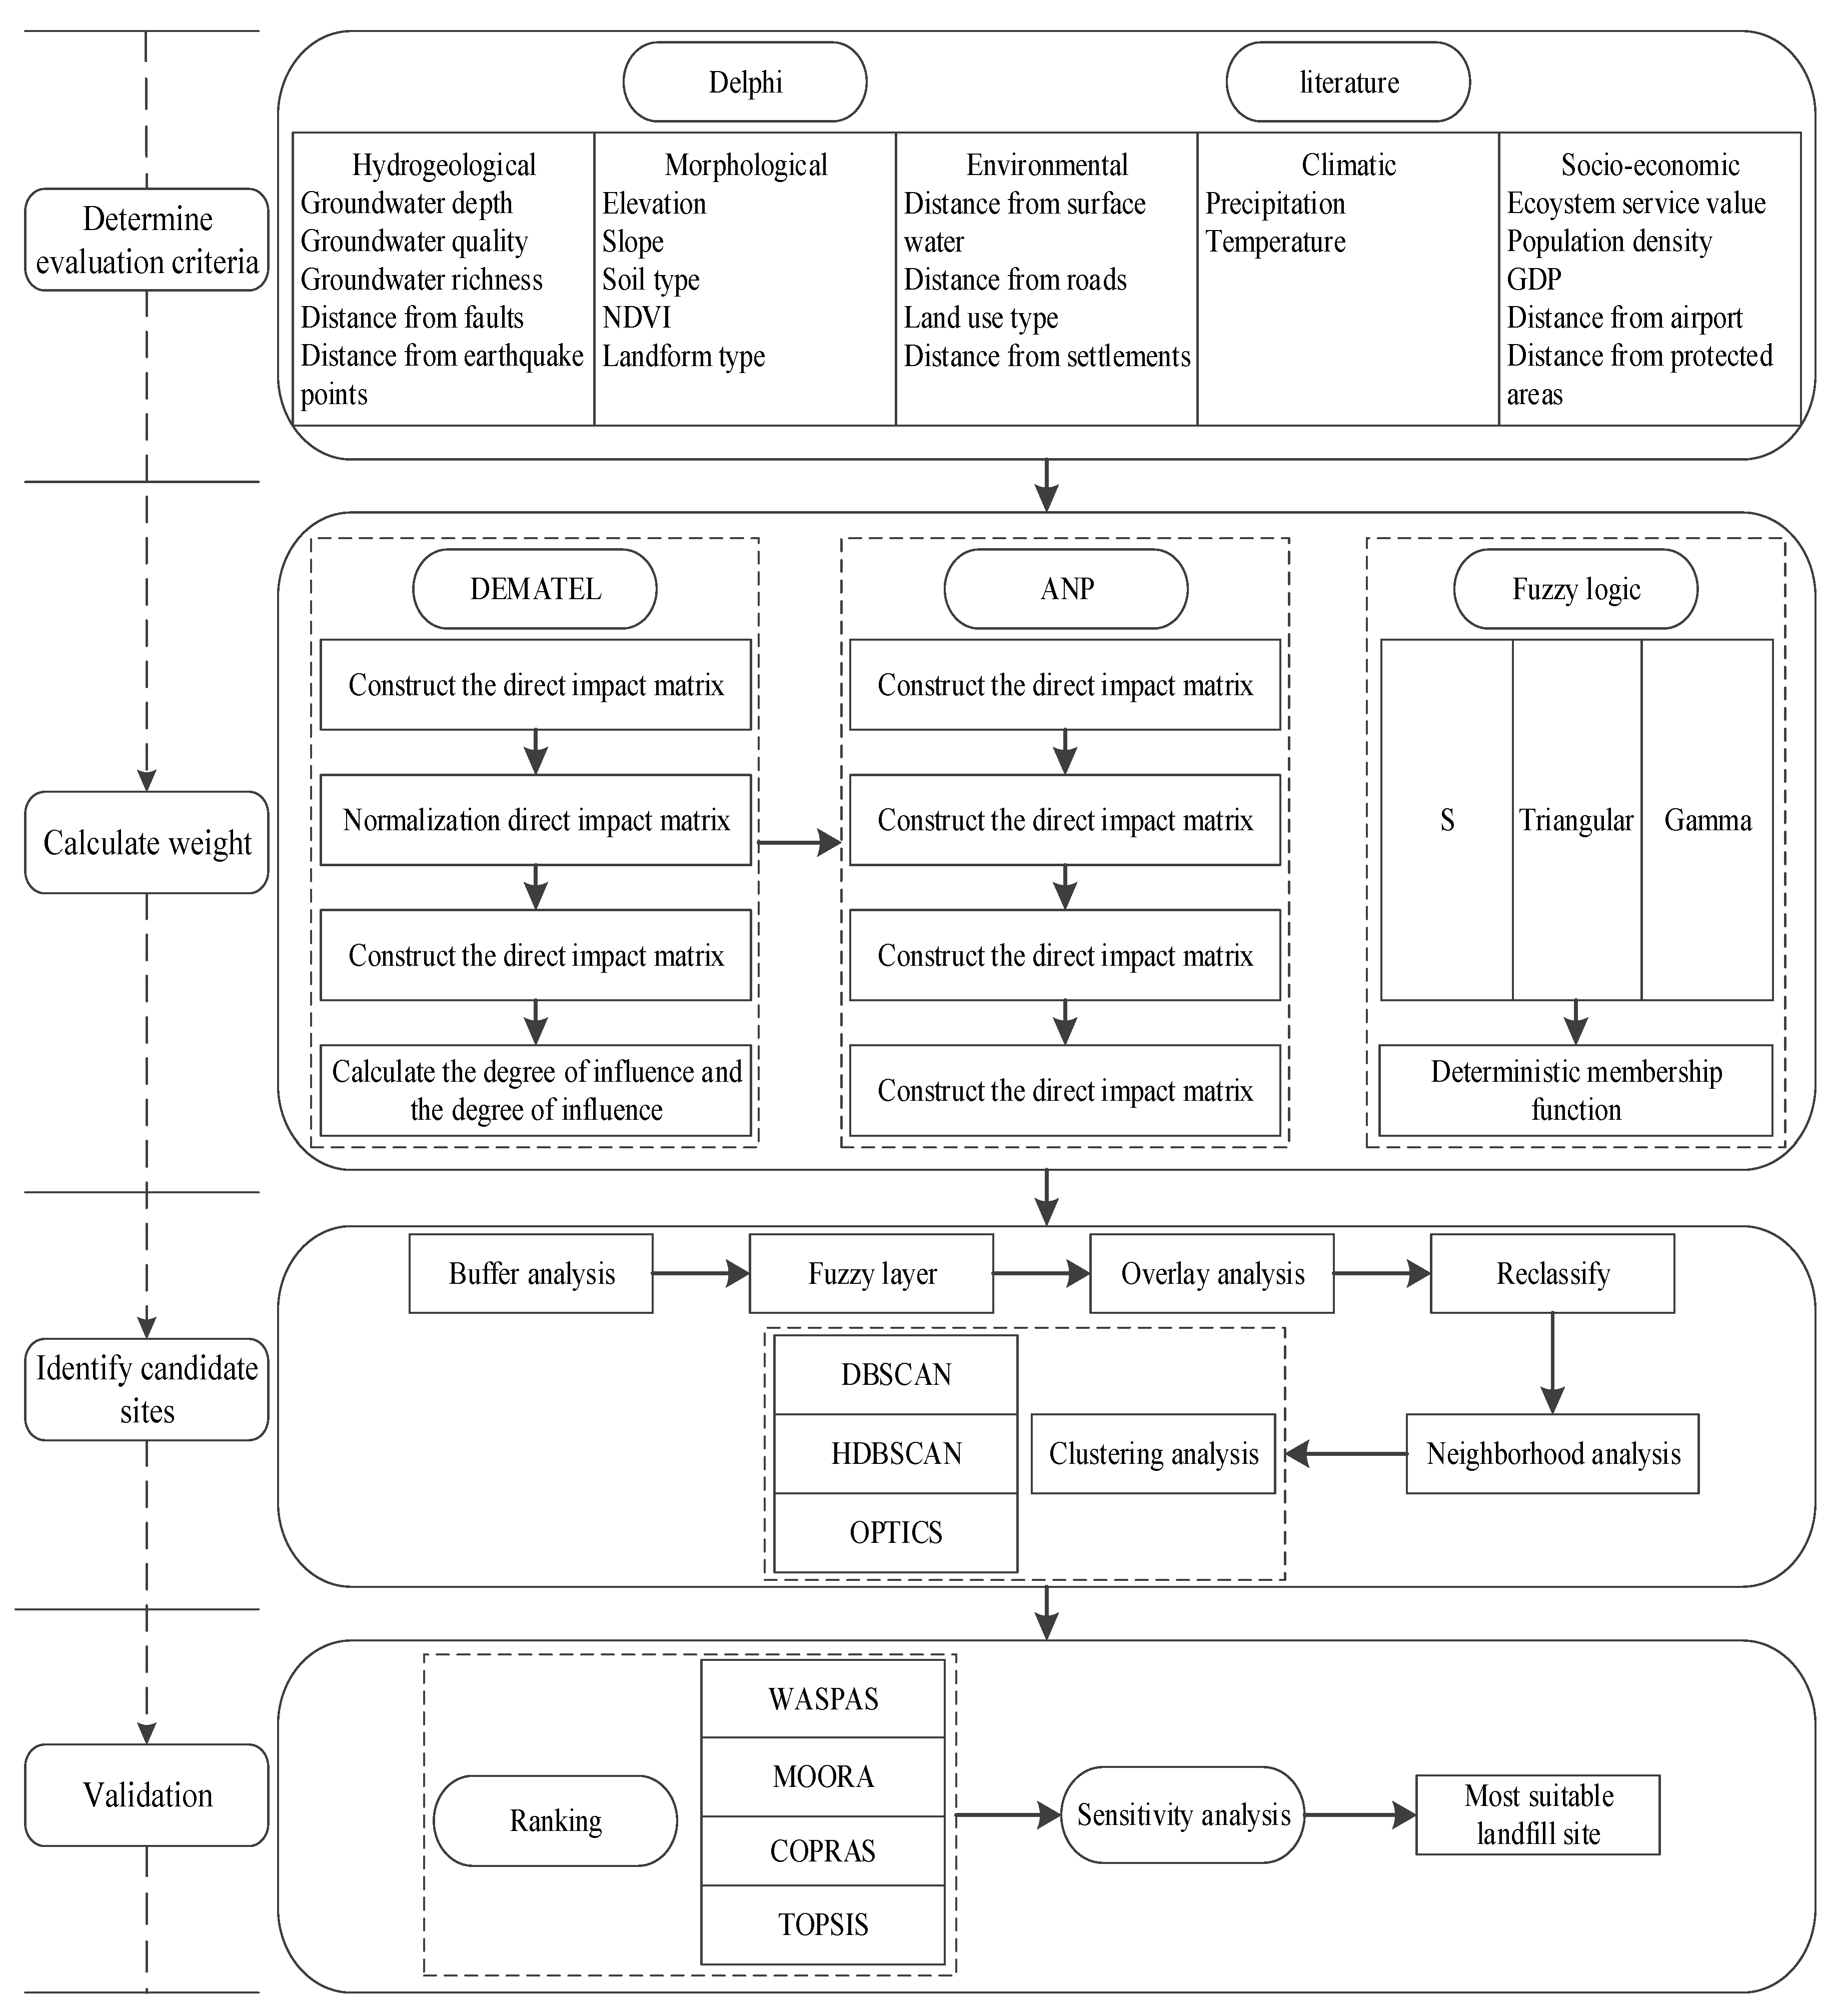
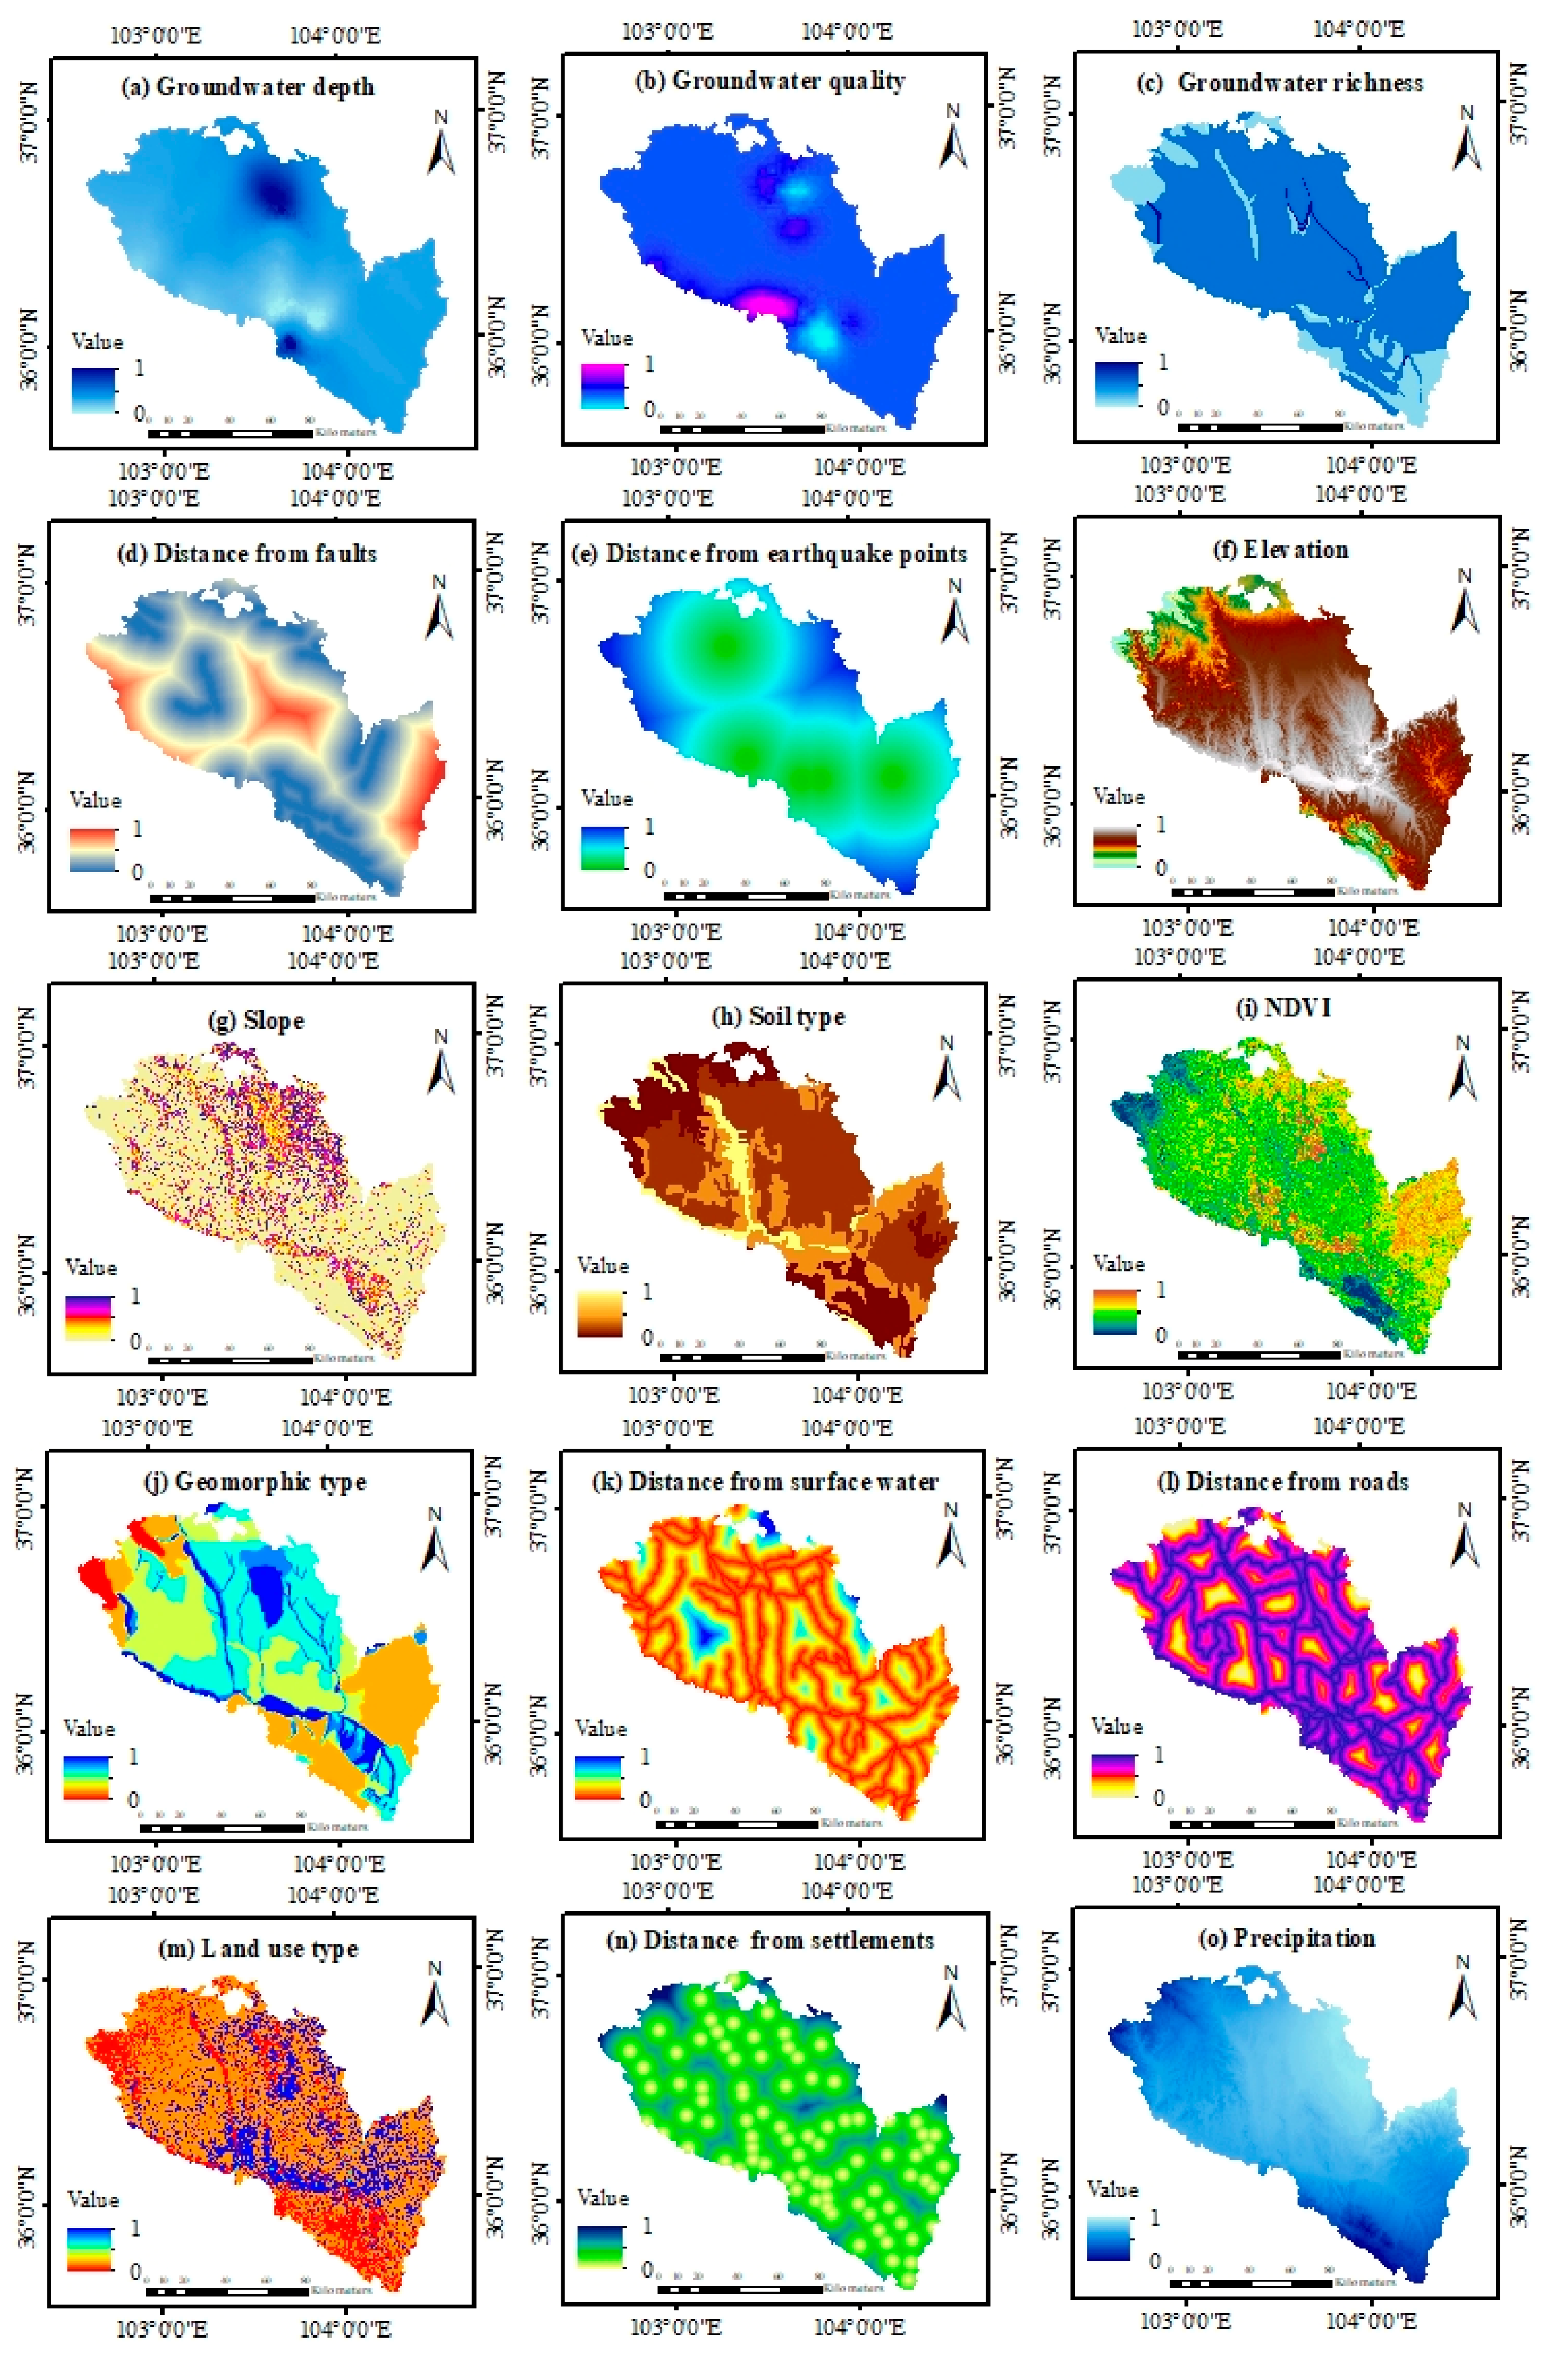
3.1. Identification of Evaluation Criteria

The CNS has set strict standards for the evaluation criteria of landfill site selection and construction. The specific CNS for reference include: “Standard for Pollution Control on the Landfill Site of Domestic Waste” (GB16889-2008), “Technical Specifications for Sanitary Landfill of Domestic Waste” (GB50869-2013), “Standard for Pollution on the Storage and Disposal Site for General Industrial Solid Waste” (GB18599-2001), “Water Pollution Prevention Law of the People’s Republic of China”, “Regulations of the People’s Republic of China on Nature Reserves, “Technical Regulations for Investigation of Land Use Status”, and “Urban and Rural Planning Law of the People’s Republic of China”. All CNS are available at the National Standard Full Text Open System.
Delphi is an improved expert scoring method, which utilizes the questionnaire to continuously iterate four times anonymously to investigate the scientific evaluation of multi-domain experts on decision-making problems [40]. The expert group consists of 30 MSW experts, including academic researchers and professors in waste, environmental, municipal management, land-use planning, and geology, with an average of 12 years of practical or teaching experience in waste management. Combined with the CNS and Delphi method, 21 sub-criteria (C1, C2, C3, ..., C21) were identified and were categorized into five dimensions (B1, B2, B3, B4, and B5).
Furthermore, hydrogeological aspects were also considered to avoid potential groundwater contamination in semi-arid valley basins caused by the leakage of landfill leachate, while ensuring the safety of construction and operation [41]. Morphological aspects were taken into account to reduce construction costs and increase stability during construction [10]. Environmental aspects were taken into consideration to minimize the impacts on neighboring residents, and land/water resources [42]. Climatic issues were reviewed to reduce potential threats and damage to the surrounding environment posed by various pollutants released from the landfill through leachate or waste gas [43]. Socioeconomic impacts were considered to prevent the landfill from adversely affecting surrounding ecological reserves and regional economic development [8]. Further detailed information on the criteria selection is contained in Table A2 in Appendix B. The interval from 0 to 1 was adopted for normalization, where the larger the value, the better the suitability (Figure 3).

3.2. Fuzzy DEMATEL-ANP

This study aimed to integrate the DEMATEL-ANP method to establish a network structure to clarify the interdependent relationship between criteria and determine their relative weights. DEMATEL has the following advantages: (1) Distinguishing the attributes of criteria (positive and negative). (2) The prominence of the criteria can be determined. (3) The relationship between criteria can be quantified (direct and indirect influences). (4) A large number of samples are not required [44]. ANP was introduced to modify the AHP process, which finds the best possible solution for complex decision-making issues in the model of an ordered network structure [45]. Considering the mechanisms of dependency and feedback between the criteria makes the decision-making model closer to the actual situation. To reduce the uncertainty of data and expert ratings, ANP can utilize the causal relationship determined by DEMATEL to calculate weights [46].

3.2.1. Construction of Direct Influence Matrix

According to the expert opinion obtained by the Delphi method, a numerical scale of 0–4 is adopted to indicate the degree of direct influence between criteria. Where “no influence” is 0, “low influence” is 1, “medium influence” is 2, “high influence” is 3, and “very high influence” is 4. A pairwise comparison judgment matrix is constructed, respectively. Experts ( E = 1 , 2 , E ) judged the criteria in order to derive a square matrixis A E expressed in Equation (1). Subsequently, Equation (1) indicates the average direct impact matrix, according to the equation, calculating the average value of the numerical scale for each matrix.
A E = [ a 11 E a 12 E a 1 n E a 21 E a 22 E a 2 n E a n 1 E a n 2 E a n n E ]       A - = [ a - 11 a - 12 a - 1 n a - 21 a - 22 a - 2 n a - n 1 a - n 2 a - n n ]

3.2.2. Normalization Directly Influences the Matrix

To unify the numerical scale into a comparable range, Equations (2) and (3) are employed to obtain the normalized direct relation matrix, whose value is between 0 and 1.
Z = m i n [ 1 m a x i ( j = 1 n | a i j | ) , 1 m a x j ( i = 1 n | a i j | ) ]
A α = Z A -

3.2.3. Deriving the Comprehensive Influence Matrix

The comprehensive influence matrix represents the superposition of direct and indirect influences between criteria. T B (criterion) (Equation (5)) and T C (sub-criterion) (Equation (6)) are calculated using Equation (4), where I is the identity matrix.
T C = [ t i j C ] n × n = A α ( I A α ) 1
T B = [ t 11 B t 12 B t 1 m B t 21 B t 22 B t 2 m B t m 1 B t m 2 B t m m B ]
B 1 B 2 B m C 11 C 1 n 1 C 21 C 2 n 2 C m 1 C m n m T C =   B 1 C 11 B 2 C 21 B m C m 1 [ T 11 C T 12 C T m 1 C T 21 C T 22 C T m 2 C T 1 m C T 2 m C T m m C ]

3.2.4. Computing and Being Influences of the Matrix

Based on the comprehensive influence matrix, the row vectors are summed to obtain the influence of the criterionon other criteria (influence). The column vectors are summed to obtain the influence of the other criteria on the criterion i (being influence). Further, the values of R B and C B denote the influence and being influence of the criteria, whereas the values of R C and C C denote the influence and being influence of the sub-criteria (Equations (7) and (8)).
R B = [ r i ] n × 1 = [ j = 1 n t i j B ] n × 1         C B = [ c j ] 1 × n = [ i = 1 n t i j B ] 1 × n
R C = [ r i ] n × 1 = [ j = 1 n t i j C ] n × 1         C C = [ c j ] 1 × n = [ i = 1 n t i j C ] 1 × n

3.2.5. Establishing the Network Structure

ANP establishes the network structure with assistance from the comprehensive influence matrix and constructs the super matrix to allocate the weight for the criteria. To distinguish the difference between the criteria, Equation (9) is employed to calculate the centrality M and causation N . The network structure is based on coordinate values ( M , N ) to express the interdependence and feedback influences between criteria, and its comprehensive threshold is set as the average value of the matrix and medium numerical scale.
M i = R i + C i         N i = R i C i

3.2.6. Normalization of Comprehensive Influence Matrix

Based on the comprehensive influence matrix, the criterion normalized comprehensive influence matrix T α B = [ t i α i j B ] m × m (Equations (10 and (11)) was calculated by the row vector of criterion divided by the sum of the row vector of its corresponding row. The sum of the numerical scales for each row vector is 1: j = 1 m t α i j B = 1 . Similarly, the normalized comprehensive influence matrix of the sub-criterion is obtained by the same method (Equation (12)).
T B = [ t 11 B t 12 B t 1 m B t 21 B t 22 B t 2 m B t m 1 B t m 2 B t m m B ] b 1 = j = 1 m t 1 j B b 2 = j = 1 m t 2 j B b m = j = 1 m t m j B
T α B = [ t 11 B b 1 t 12 B b 1 t 1 m B b 1 t 21 B b 2 t 22 B b 2 t 2 m B b 2 t m 1 B b m t m 2 B b m t m m B b m ] = [ t α 11 B t α 12 B t α 1 m B t α 21 B t α 22 B t α 2 m B t α m 1 B t α m 2 B t α m m B ]
B 1 B 2 B m C 11 C 1 n 1 C 21 C 2 n 2 C m 1 C m n m T α C =   B 1 C 11 C 1 n 1 B 2 C 21 C 2 n 1 B m C m 1 C m n 1 [ T α 11 C T α 21 C T α m 1 C T α 12 C T α 22 C T α m 2 C T α 1 m C T α 2 m C T α m m C ]

3.2.7. Construct and Solve the Limit Super Matrix

The weighted super matrix W C (Equation (13)) is expressed by multiplying the normalized comprehensive influence matrix of the criterion of transpose and the sub-criterion of transpose. The weighted super matrix is limited until it converges to calculate the final weight vector (Equation (14)).
W c = ( T α B ) T × ( T α C ) T = [ t α 11 B × t α 11 C t α 21 B × t α 21 C t α m 1 B × t α m 1 C t α 12 B × t α 12 C t α 22 B × t α 22 C t α m 2 B × t α m 2 C t α 1 m B × t α 1 m C t α 2 m B × t α 2 m C t α m m B × t α m m C ]
l i m k ( W c ) k

3.2.8. Fuzzy Logic

The mapping and analysis of criteria attribute based on fuzzy logic, trapezoidal, interval, S-shape, Triangular shape, and Gamma shape are commonly employed fuzzy membership functions to determine fuzzy information in fuzzy logic [47,48,49]. According to the existing research, we have determined the appropriate membership function for each criterion to improve the accuracy of the results and optimize the uncertainty of the evaluation criteria (Table 1) [50,51,52].

3.3. GIS Modeling

3.3.1. Spatial Analysis

In this study, based on the unified projection coordinate system, all data are converted to raster format and resampled for 30 m. Modeling is carried out with the help of spatial analysis tools in ArcGIS software to obtain reasonable results of landfill site selection. Buffer zones are established for faults, earthquake points, surface water, settlements, roads, protected areas, and airports in accordance with the CNS for waste landfill sites, and the regional characteristics of the valley basins in the semi-arid area of Lanzhou. The weights and fuzzy layers calculated by DEMATEL-FANP are integrated, and the weighted overlay of layers and smooth the neighborhood are implemented to obtain the landfill site selection results.

3.3.2. Cluster Analysis

Compared with the K-Means method, the density-based clustering analysis does not require prior knowledge of the number of clusters to be formed, the shape of the clusters is not limited, and noise points can be identified.
I. Density-Based Spatial Clustering of Applications with Noise (DBSCAN)
The input parameters are the neighborhood radius (ε) and the minimum number of entities (MinPts). The data set is divided into core, boundary, and noise points. A random point is selected from the data set as the seed for traversal. When the density of any two points is reachable or direct, it is classified into the same cluster. The number of entities in the same cluster must be greater than MinPts; when it is less, they are classified as noise points [53].
II. Hierarchical Density-Based Spatial Clustering of Applications with Noise (HDBSCAN)
The input parameter is MinPts, ε changes with the point density change, automatic clustering can be implemented without parameter adjustment. On the basis of DBSCAN and in combination with the hierarchical clustering algorithm, the concept of “Mutual Reachability Distance” was introduced [54].
MRD k ( A , B ) = max { C o r e k ( A ) , C o r e k ( B ) , d ( A , B ) }
where A, B are two core points; C o r e k ( A ) is the distance between A and the K-th adjacent point; C o r e k ( B ) is the distance between B and the K-th adjacent point; d ( A , B ) is the Euclidean distance between A and B.
III. Ordering Points to Identify the Clustering Structure (OPTICS)
The input parameters were ε, MinPts, and sensitivity. The value of clustering sensitivity is 0–100. The higher the sensitivity, the smaller the clustering interval is. And introduced the “accessible distance” [55].
RD ( P , Q ) = max { C o r e ( P ) , d ( P , Q ) }
where, P, Q are the two core points, the core distance of P, and the Euclidean distance between P and Q.

3.4. Ranking Solution

3.4.1. WASPAS (Weighted Aggregated Sum Product Assessment)

Step 1 Construct a decision matrix X = [ x i j ] , where x i j is the response of alternative item i to criterion j.
Step 2 Normalize the decision matrix based on the maximum and minimum method (Equation (17)) [56].
r i j + = x i j m a x i ( x i j )     for   positive   criteria   r i j = m i n i ( x i j ) x i j   for   negative   criteria
Step 3 Weight normalized decision matrix (Equation (18)), w is the weight of criterion j.
Step 4 Calculate the relative importance of alternatives by utilizing the weighted sum model (WSM) and weighted product model (WPM) [57], where n is the number of alternatives.
S W S M = j n w j r i j         S W P M = j = 1 n ( r i j ) w j
Step 5 Calculate the scores of each alternative according to Equation (19) and arrange them in descending order.
Q i = λ S W S M + ( 1 λ ) S W P M λ [ 0 , 1 ]

3.4.2. MOORA (Multi-Objective Optimization by Ratio Analysis)

Step 1 Construct a decision matrix X = [ x i j ] , where x i j is the response of alternative item i to criterion j.
Step 2 Normalize the decision matrix based on the vector method (Equation (20)), where m is the number of alternatives.
r i j = x i j j = 1 m x i j 2
Step 3 Weight normalized decision matrix (Equation (21)), w is the weight of criterion j.
V i j = w j r i j
Step 4 Calculate the relative importance of alternatives by utilizing the ratio of the system (Equation (22)) [58], where n is the number of criteria.
S i + = j = 1 g V i j   for   positive   criteria   S i = j = g + 1 n V i j   for   negative   criteria
Step 5 Calculate the scores of each alternative according to Equation (23) and arrange them in descending order.
Q i = j = 1 g V i j j = g + 1 n V i j

3.4.3. COPRAS (COmplex PRoportional ASsessment)

Step 1 Construct a decision matrix X = [ x i j ] , where x   i j is the response of alternative item i to criterion j.
Step 2 Normalize the decision matrix based on the summation method (Equation (24)), where m is the number of alternatives.
r i j = x i j i = 1 m x i j
Step 3 Weight normalized decision matrix (Equation (25)), w is the weight of criterion j.
V i j = w j r i j
Step 4 Calculate the relative importance of alternatives by utilizing the complex scale evaluation index (Equation (26)) [59], where n is the number of criteria.
S i + = j = 1 g V i j   for   positive   criteria   S i = j = g + 1 n V i j   for   negative   criteria
Step 5 Calculate the scores of each alternative according to Equation (27) and arrange them in descending order. The higher the score, the higher the priority.
Q i = S i + + i = 1 m S i S i i = 1 m 1 S i         U i = Q i Q max × 100

3.4.4. TOPSIS (Technique for Order of Preference by Similarity to Ideal Solution)

Step 1 Construct a decision matrix   X = [ x i j ] , where x i j is the response of alternative item i to criterion j.
Step 2 Normalize the decision matrix based on the minimum-maximum method (Equation (28)), where m is the number of alternatives.
r i j + = x i j m i n j ( x i j ) m a x j ( x i j ) m i n j ( x i j )   for   positive   criteria   r i j = m a x j ( x i j ) x i j m a x j ( x i j ) m i n j ( x i j )   for   negative   criteria
Step 3 Weight normalized decision matrix (Equation (29)), w is the weight of criterion j.
V i j = w j r i j         V j + = { m a x j ( V i j ) }         V j = { m i n j ( V i j ) }
Step 4 Calculate the relative importance of alternatives by utilizing the distance index (Equation (30)) [60], where n is the number of criteria.
S i + = j = 1 n ( V i j V j + ) 2         S i = j = 1 n ( V i j V j ) 2
Step 5 Calculate the scores of each alternative according to Equation (31), and arrange them in descending order.
Q i = S i S i + + S i

4. Results

4.1. Determining the Weight

The comprehensive influence matrix of the criterion and sub-criterion (Table A3 and Table A4 fin Appendix B) are derived by calculating the mean value of the direct and the normalized direct impact matrix. Ultimately, a statistical analysis was performed on the criteria (Table 2). It can be seen from the table that in the criteria, the environmental criterion shows the highest M value (2.5949) and the highest N value (0.7060). The climatic criterion M value (1.1510) is the lowest, and the hydrogeological criterion N value (−0.8155) is the lowest. In the sub-criteria, soil type, landform type, land use type, distance from settlements, population density, GDP, and distance from airports are the being affected criteria, while the others are affected criteria. The M value (6.5923) of distance from surface water was the highest, and the N value (0.6806) of groundwater quality was the highest. The M value (1.2955) of temperature was the lowest, and the N value (−0.9090) of NDVI was the lowest. Furthermore, the weight of temperature (0.0142) and precipitation (0.0214) was lowest, due to the dry climate, low annual precipitation, and lower leachate pollution generated by landfills in the semi-arid region of Northwest China, which is significantly different from that in humid regions. The weights of land use type (0.0531) and ecological service value (0.0641) were relatively high, which was due to the scarcity of land in river valleys and basins. In particular, urban expansion leads to the development and utilization of farmland, forestland, water, and other ecological land that is close to central urban areas. Lanzhou is one of the cities with the most serious geological disasters in China. It is located in the Qilian Mountain earthquake belt, where the abundance of historical landslides, debris flows, and earthquakes should not be underestimated. Considering the geological structure and development of the study area, the weights of faults and earthquake points are 0.0582 and 0.0398, respectively. Water areas, settlements, and protected areas are constraints that are strictly stipulated by the CNS; thus, the relative weight value is also high.

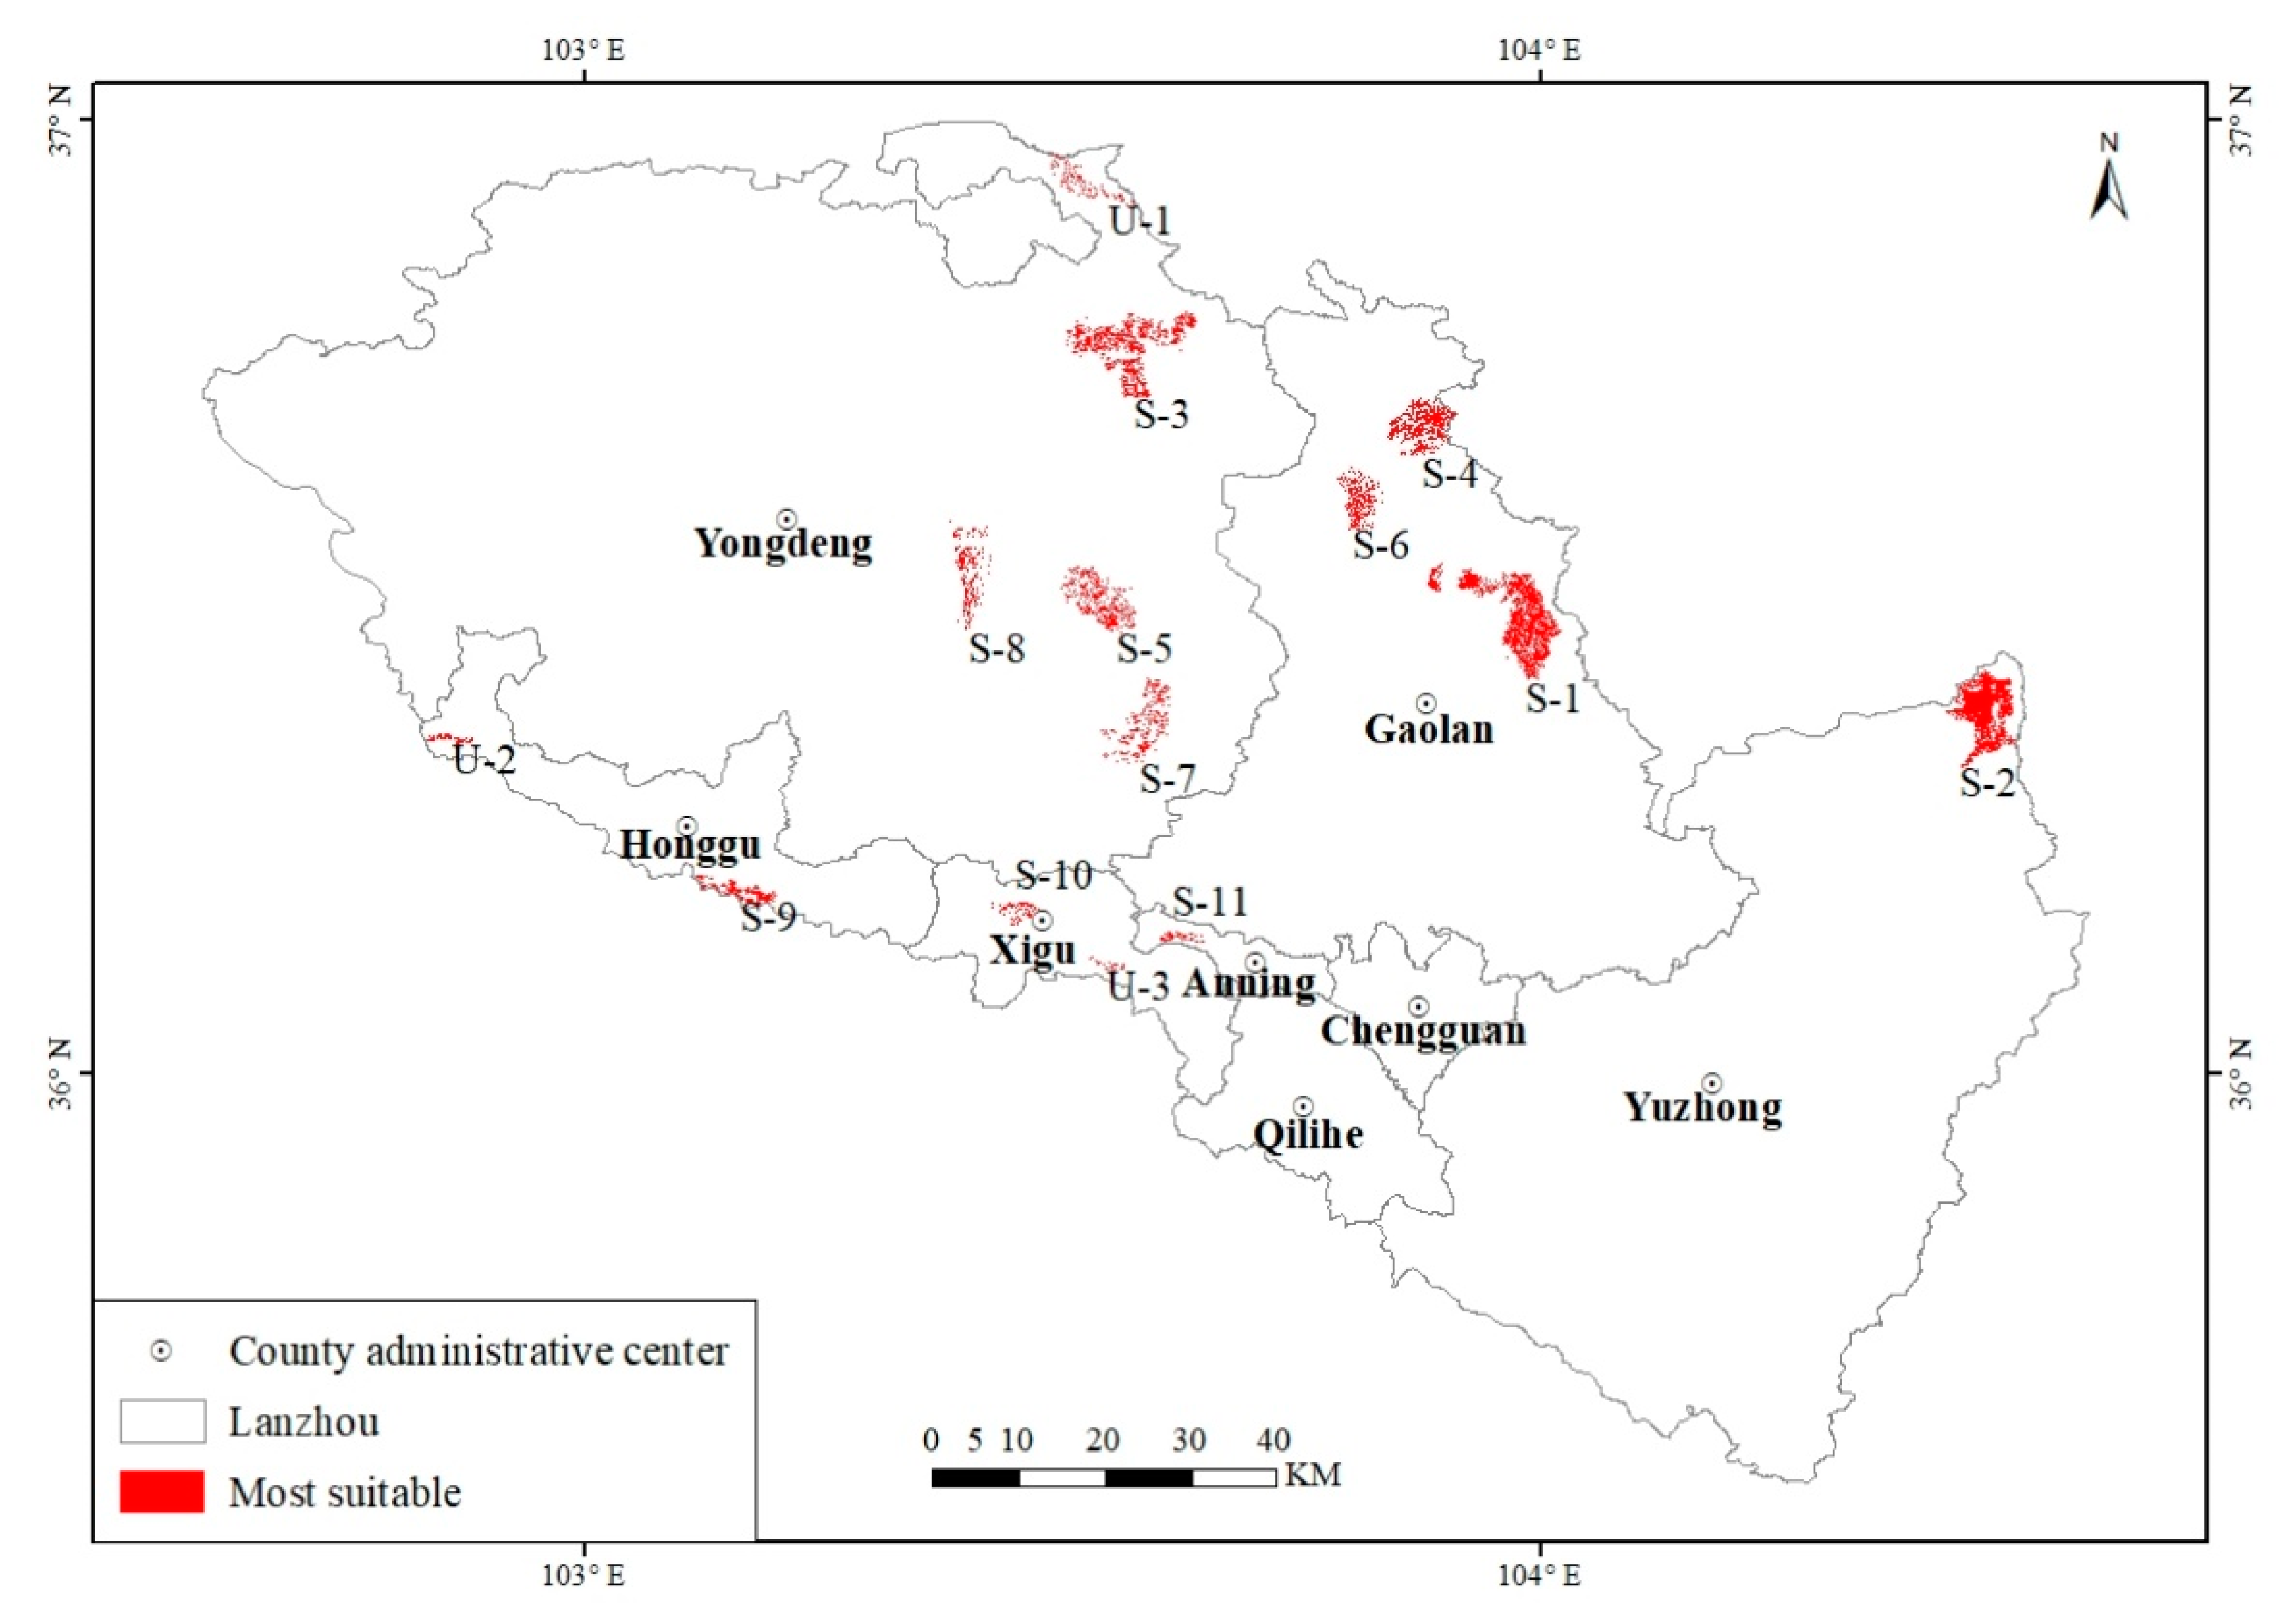
4.2. Identifying the Landfill Site

The suitability map is generated by overlaying the fuzzy normalized layer of all criteria and assigning weights for each criterion. Subsequently, the results are divided into five categories: “most suitable, more suitable, suitable, less suitable, and unsuitable”. Its area and proportions were “6288 km2 (0.48), 3275 km2 (0.25), 2358 km2 (0.18), 917 km2 (0.07), and 262 km2 (0.02)”, respectively. Simultaneously, non-constructible areas are eliminated according to the CNS, including mainly rivers, protected areas, central urban areas, airports, and so on.
The “most suitable” category in the results was selected, and 140,103 data points were extracted for density-based cluster analysis to intuitively display the spatial distribution characteristics of candidate sites (Figs. C.1 in Appendix C). The DBSCAN method has the fastest calculation speed, where following many experiments and comparisons, it selects the ε of 1600 m and the MinPts of 1000 for cluster analysis, and obtains 15 clusters, and 1 is the noise point. Overall, the U-3 candidate sites located ~1700 m southeast of Liangjiawan in the Xigu District had the smallest density and area, and were closest to the Yellow River among all candidate sites; thus, they were classified as noise points. As a method to merge as many entities as possible, HDBSCAN is data-driven and can directly reflect the aggregation of the data itself. 1000 MinPts were taken to obtain 15 clusters, and 1 was the noise point. As can be seen from the results, a small part of the U-3 candidate sites located ~1700 m southeast of Liangjiawan in the Xigu District were divided into noise points, while the rest were grouped together with S-11, and the value of probability 1 was the highest in the membership probability distribution presented. OPTICS overcomes the shortcoming that low-density clusters within a neighborhood radius contains high-density clusters. Meanwhile, it is not completely data-driven and has obvious advantages for the analysis of spatial distribution characteristics. The ε was set to 1600 m, MinPts to 1000, and cluster sensitivity to 10, after which a total of 13 classes of clusters were obtained, and the 1 was the noise point, including U-1, U-2, and U-3. Eleven candidate sites were identified by integrating the three clustering algorithms (Figure 4). It can be seen that the sites are primarily distributed across Yongdeng, Gaolan, and Yuzhong Counties, with a lower distribution in central urban areas and smaller areas. The major reasons are that counties contain more unused land, are close to central urban areas, and transportation is convenient. Conversely, in central urban areas, there are mass settlements, the land is limited, and water resources are scarce.
The daily MSW capacities of the candidate sites were calculated according to the “Construction Standard of MSW Landfill Disposal Engineering Project” (Table 3, Table A5 in Appendix D). There were four candidate landfills (S-3, S-5, S-7, and S-8) in Yongdeng, three candidate sites (S-1, S-2, and S-6) in Gaolan, and one candidate site (S-2) in Yuzhong, each of which could accommodate more than 1200 tons/day of MSW. One of the most suitable candidate landfill sites in Honggu (S-9) had a capacity of 500 to 1200 tons/day of MSW. The candidate sites in Xigu and Anning were S-10 and S-11, both of which could accommodate 200 to 500 tons/day of MSW. Qilihe and Chengguan had no optimal sites.

4.3. Validation

The 11 candidate sites identified by cluster analysis were satisfactory from the perspective of hydrogeological, morphological, environmental, climatic, and socio-economic factors, as they were all based on criteria analysis. However, to ensure that the candidate sites conformed to the CNS and the urban planning measures of the study area, it was necessary to evaluate them relatively. We conducted field visits and selected four methods: WASPAS, MOORA, COPRAS, and TOPSIS to determine the final ranking of the candidate sites by according to expert opinions and regional characteristics. As can be seen from Table 4, the ranking results of WASPAS and COPRAS were the same, as were MOORA and TOPSIS, whereas the four methods were slightly different for S-5, S-7, S-8, and S-10. The correlation coefficient of WASPAS-COPRAS and MOORA-TOPSIS was 1, and for WASPAS-MOORA, WASPAS-TOPSIS, COPRAS-MOORA, and COPRAS-TOPSIS was 0.94. As such, it was confirmed that there was a high degree of consistency between the ranking results of the candidate sites, with S-1 being the most suitable.
In this study, sensitivity analysis charts were established for 13 scenarios with different weights to reflect the influences of changes in criterion weights on the final results and ranking stability (Figure A2 in Appendix E). Spearman’s correlation coefficient was employed to analyze four ranking methods in the scenario simulation with different weights (Table 5). As can be seen from the Figure, the ranking of scenarios 4, 6, and 7 changed among the four ranking methods, which was due to their low correlation coefficients between and the original weighting scenario 1. The ranking order of the other 10 scenarios remained unchanged, which indicated the stability of the site selection results and the reliability of the method. Furthermore, the criteria for ranking the first, second, and third sites were all decisive and evenly distributed. Their relative importance was balanced, although the scores of candidate sites varied under different scenarios.

5. Discussion

By discussing the features of this study and those of the closely related research [21,25,28], the reliability of the MCDM model to find suitable landfills for each geographical area is verified. The case study of the current paper is related to a typical semi-arid valley basin city landfill site selection problem in which more than 21 criteria such as hydrogeological, morphological, environmental, climatic, and socioeconomic are considered. A novel integrative decision-making algorithm is proposed, the DEMATEL-ANP, GIS, and Density clustering, with the fuzzy environment. The candidate landfill sites for MSW were identified by recognizing these criteria and their internal relationships. Finally, a comprehensive analysis of optimal landfill sites is provided from the perspective of landfill capacity and visibility perspectives by site visiting and assessing the site’s conditions. Eghtesadifard et al. (2020) [28] suggested the DEMATEL-ANP, GIS, and K-Means model to identify six candidate sites, however, their methodology is limited to a trigonometric fuzzy membership function. Different evaluation criteria are suitable for corresponding fuzzy membership functions to reflect its fuzzy logic relationship. Rahimi et al. (2020) [30] determined an optimal site by considering only ten site selection factors in northwest Iran. The influencing factors are not considered comprehensively. Moreover, in the most of previous studies, after selecting landfills by GIS software, the classification of candidate sites was made by K-means techniques, noise points cannot be identified, and the number of candidate sites needs to be set artificially, which greatly reduces the scientific of the results. Density- based clustering algorithm can overcome these shortcomings and can be applied to classify the candidate sites, which can be a new approach in waste management.

6. Conclusions

This study identified and assessed the most suitable landfill sites in Lanzhou and conducted a field investigation to avoid the “NIMBY effect”. In doing so, the 11 selected candidate sites have a low effect on the health of the population, rivers, protected areas, etc., which will enhance the acceptance of the government. For this study, we initially established a standard evaluation system of semi-arid valley basin municipal waste landfill site selection. This was a coupled flexible and novel comprehensive framework for reducing the uncertainty of data and criterion weights and verifying the efficacy of criterion weights and results.
The fuzzy DEMATEL-ANP method proved to be more preferable to ANP as it could deal with all types of dependencies systematically. The simple ANP method directly constructed the network relations between the input criteria according to a scale of 1–9, which had the subjective disadvantage of AHP. Selecting different membership functions for evaluation criteria is helpful to express its fuzzy logic relationship. This integration framework allowed for complex issues to be explored and fed back to decision-makers.
The three density-based clustering algorithms were utilized to identify 11 candidate sites for landfills, analyze their spatial distribution characteristics, and calculate the relative MSW capacities according to the area. The high consistency of the four sorting methods of MOORA, WASPAS, COPRAS, and TOPSIS fulfilled a comprehensive ranking of candidate sites. According to the ranking results and the opinions of experts, the optimal candidates are S1 (103°58′40″ E, 36°29′14″ N) and S2 (104°27′50″ E, 36°22′56″ N), ranking 1 and 2, which are located in the east of Gaolan and the northeast of Yuzhong in Lanzhou. Sensitivity analysis enabled scenario simulation with different weights set by multiple criteria, which can effectively guide planners to consider the uncertainty of weights in the decision-making evaluation process to obtain more satisfactory solutions. The findings revealed that the highest weights were assigned to the environmental criterion (0.2398) and the distance from the surface water criterion (0.0758).
Although the coupled model proposed in this study achieved better results in the landfill site, there remain some deficiencies due to limitations in data collection and research methods. Firstly, since the ANP stems directly from the AHP, it also inherits theoretical weaknesses of the assumptions of the AHP, including rank reversal problem, priorities derivation method, and comparison scale. In this study, the Fuzzy membership function was employed to overcome the above problems, but it cannot be fundamentally solved. Secondly, the ANP method is still unable to avoid the subjective problem of expert scoring. Deep learning algorithms can utilize existing conforming landfills for supervised or unsupervised classification to eliminate uncertainties in site selection. Thirdly, due to the study area is located in the ecologically fragile semi-arid area, there are obvious differences in hydrology, temperature, and topography from humid areas. The evaluation criteria and approaches that adapt to the semi-arid area are mainly selected, especially the fuzzy membership function of each evaluation criterion. Therefore, the evaluation approach is suitable for MSW landfill site selection in a semi-arid area. It is necessary to adjust the influencing factors and fuzzy membership function when selecting landfill sites in humid areas. Ultimately, the classification of MSW is not complete, and industrial solid waste is still divided as MSW for landfill disposal, which has an impact on the site selection. The site selection of industrial solid waste landfill provides a new idea for MSW.

Author Contributions

Conceptualization, Jiamin Liu; methodology, Jiamin Liu; software, Jiamin Liu; validation, Jiamin Liu, Yueshi Li and Bin Xiao; formal analysis, Jiamin Liu; investigation, Jiamin Liu; resources, Jiamin Liu; data curation, Jiamin Liu; writing—original draft preparation, Jiamin Liu; writing—review and editing, Jizong Jiao, Yueshi Li and Bin Xiao; visualization, Jiamin Liu; supervision, Jizong Jiao, Yueshi Li and Bin Xiao; project administration, Jiamin Liu; funding acquisition, Jizong Jiao. All authors have read and agreed to the published version of the manuscript.

Funding

This research was funded by the National Key R&D Program of China, grant number 2018YFC1903700.

Institutional Review Board Statement

Not applicable.

Informed Consent Statement

Not applicable.

Data Availability Statement

The data presented in this study are available in Appendix A.

Acknowledgments

The presented research work is supported by the National Key R&D Program of China.

Conflicts of Interest

The authors declare no conflict of interest.

Appendix A

Table A1. Data Format and Sources.
DatasetFormatData Source
Groundwater depth, Groundwater qualityVector (Point)Gansu Groundwater Report (Gansu Water Resources Department) (http://slt.gansu.gov.cn/, accessed on 15 November 2019)
Groundwater richnessVector (Polygon)“Gansu Hydrogeological Map”
(Gansu Bureau of Geology and Mineral Hydrogeology engineering Geological Exploration Institute) (http://www.gssgy.com/, accessed on 15 November 2019)
FaultsVector (Polyline)“Gansu Hydrogeological Map”
(Gansu Bureau of Geology and Mineral Hydrogeology engineering Geological Exploration Institute)
(http://www.gssgy.com/, accessed on 15 November 2019)
Earthquake pointsVector (Point)“China Historical Earthquake Catalog”
(Gansu Earthquake Agency) (http://www.gsdzj.gov.cn/, accessed on 15 November 2019)
30 m SRTM ElevationRasterUSGS Earth Explorer (https://earthexplorer.usgs.gov/, accessed on 26 December 2019)
Landform typeRaster“Landscape Atlas of the People’s Republic of China (1:1 million)”
Resource and Environmental Science and Data Center, Chinese Academy of Sciences
(http://www.resdc.cn/, accessed on 26 December 2019)
NDVIRasterMODIS (https://modis.gsfc.nasa.gov/, accessed on 20 December 2020)
Soil typeRaster“The Soil Atlas of the People’s Republic of China (1: 1 million)”
Resource and Environmental Science and Data Center, Chinese Academy of Sciences (http://www.resdc.cn/, accessed on 20 December 2020)
surface waterVector (Polyline)National Catalogue Service for Geographic Information (https://webmap.cn/, accessed on 20 December 2020)
30 m Land use typeRasterResource and Environmental Science and Data Center, Chinese Academy of Sciences (http://www.resdc.cn/, accessed on 15 November 2020)
Settlements Vector (Point)National Catalogue Service for Geographic Information (https://webmap.cn/, accessed on 14 December 2020)
RoadsVector (Polygon)National Catalogue Service for Geographic Information (https://webmap.cn/, accessed on 13 December 2020))
PrecipitationRasterResource and Environmental Science and Data Center, Chinese Academy of Sciences (http://www.resdc.cn/, accessed on 2 November 2019)
TemperatureRasterResource and Environmental Science and Data Center, Chinese Academy of Sciences (http://www.resdc.cn/, accessed on 14 November 2020)
Ecological function reservesVector (Polygon)Portal website of Gansu Forestry and Grass Bureau and its administrative departments (http://lycy.gansu.gov.cn/, accessed on 25 December 2019)
Population densityRasterResource and Environmental Science and Data Center, Chinese Academy of Sciences (http://www.resdc.cn/, accessed on 28 December 2019)
GDPRasterResource and Environmental Science and Data Center, Chinese Academy of Sciences (http://www.resdc.cn/, accessed on 28 December 2019)
AirportsVector (Point)Crawled POI data
Official website of Gold Maps (https://lbs.amap.com/, accessed on 14 December 2020)
Ecosystem service valueRasterResource and Environmental Science and Data Center, Chinese Academy of Sciences (http://www.resdc.cn/, accessed on 14 December 2020)

Appendix B

Table A2. Attributes, conditions to be met, and types of evaluation criterion.
CriteriaSub-CriteriaAttributeRankConditions to Be MetType
Hydrogeological B1Groundwater depth C1<51The landfill should develop at locations with sufficient groundwater depth [24]positive
5–202
20–503
50–704
>705
Groundwater quality C2I1The landfill should be located in areas with poor water quality [61]negative
II2
III3
IV4
V5
Groundwater richness C3>10001The landfill should be located in an area with low groundwater richness [62]positive
600–10002
300–6003
100–3004
<1005
Distance from faults C4<11The landfill avoided in areas with active geological structures or other underground terrain [63]negative
3–12
5–33
6–54
>65
Distance from earthquake points C5<51The landfill should be located far away from the earthquake point to reduce the possibility of natural disasters [63]negative
15–52
25–153
30–254
>305
Morphological B2Elevation C6>20001The landfill should not be located in high-altitude areas [64]positive
1750–20002
1500–17503
1250–15004
1000–12505
Slope C7>601The landfill should be located in a low slope area [7]positive
40–602
20–403
10–204
<105
Soil type C8Aquatic soil, leached soil, anthropogenic soil1The landfill should be located in areas with sandy soil [65]negative
Semi–aqueous soil, rock soil, calcareous soil, primordial soil, semi–leached soil2
Arid soil3
Alpine soil, desert soil4
Saline soil5
NDVI C9>0.81The landfill should be located in an area with low vegetation coverage [66]positive
0.5–0.82
0.3–0.53
0.2–0.34
<0.25
Landform type C10Medium and large rolling mountains1The landfill should be located in the plain area [67]negative
Small rolling mountain2
hills3
Terraces4
Plains5
Environmental B3Distance from surface water C11<0.51The landfill should not be located near ambient surface water such as ponds, lakes, rivers, and streams to avoid their contamination [68]negative
1–0.52
1.5–13
2–1.54
>25
Distance from roads C12>31In view of the high transportation costs, the landfill should not be too far away from the road network [7]positive
<0.52
2–33
0.5–14
1–25
Land use type C13Water, snow, farmland, forestland1The landfill should be located in unused areas such as bare land [46]negative
Wetland2
Shrubland3
Grassland4
Bare land5
Distance from settlements C14<0.51The landfill should not be located near residential areas [69]negative
1–0.52
1.5–13
2–1.54
>25
Climatic B4Precipitation C15>3001The landfill should be located in arid areas [70]positive
250–3002
200–2503
180–2004
<1805
Temperature C16<3|>101The landfill should be located in a mild area [71]negative
2–42
4–63
6–84
8–105
Socio-economic B5Ecosystem service value C17>15,0001The landfill should be as cheap as possible, and the value of ecosystem services represents the value of land use [72]negative
10,000–15,0002
5000–10,0003
3000–50004
<30005
Population density C18>3001The landfill should be located in areas with low population density [73]positive
200–3002
150–2003
100–1504
<1005
GDP C19>10001The landfill should be located in areas with low GDP [74]negative
<3002
600–3003
800–6004
1000–8005
Distance from airports C20<31The landfill is a potential risk to aviation safety because they attract flocks of birds. Therefore, landfills should not be located near airports [69]negative
6–32
9–63
12–94
>125
Distance from protected areas C21<11The landfill should be located in close proximity to natural reserves [64]positive
4–12
7–43
10–74
>105
Table A3. The total influence matrix of the criteria.
B1B2B3B4B5
C1C2C3C4C5C6C7C8C9C10C11C12C13C14C15C16C17C18C19C20C21
C10.15130.06150.24850.12420.04660.21780.22520.10580.26840.22500.30490.09750.12880.13120.05480.01830.25380.12200.11590.08840.2503
C20.07630.05260.06490.07160.17180.05660.09500.16500.05850.08660.07790.07000.20490.21890.01610.00540.06740.19000.18080.06050.0776
C30.13990.15870.11280.21260.06030.20780.20810.20940.23310.20640.25580.09530.14030.14880.04880.01630.13220.12660.09810.09370.1278
C40.22300.03930.10490.07960.05220.19800.10150.18860.12090.12160.14410.10720.09330.23000.02700.00900.22300.12880.11600.18590.2321
C50.09540.03160.06160.04820.03330.04280.27790.15560.07970.07230.10020.09700.09130.08010.01690.00560.18310.11430.06950.15410.0703
C60.11370.03860.10900.09720.04710.08390.09350.17570.20050.10240.23490.08900.09560.20040.03370.01120.20540.10920.10610.08150.2129
C70.11270.06550.09830.11270.06550.09830.12090.07860.22410.10110.26550.18470.21320.12570.03610.01200.22100.19600.09150.06800.1312
C80.08720.06700.08030.06760.06660.05200.07810.04350.08170.17900.08220.16880.21240.15100.02900.00970.05810.28110.18110.14990.0899
C90.07960.03950.08770.06880.02820.05640.06350.05020.06730.06480.19630.07570.06330.07550.12580.04190.17130.07860.07720.15470.1777
C100.18230.04640.07550.06780.05010.06710.07820.04280.17950.07150.09900.06760.15810.17880.13900.04630.07760.04520.03980.04590.0733
C110.26040.07970.34850.34820.06170.25760.24310.14020.16560.13060.20210.09430.22210.15920.03290.01100.16580.11350.09010.09680.1557
C120.21660.04370.19550.08290.15500.09150.23700.07680.22410.09650.14070.08250.08140.18750.03560.01190.12270.08060.05760.07070.0973
C130.11570.15540.19970.21550.17120.10700.12920.10560.08910.09070.21370.07280.09420.21810.02000.00670.10160.08430.06700.07430.0869
C140.24660.03630.10440.17920.16110.19990.23710.09150.14410.19890.14330.19170.09580.12560.03810.01270.14300.08840.06630.07720.1186
C150.04730.12510.03970.02270.04390.02230.04850.03130.04630.06360.03320.17060.04070.05870.01220.33740.02850.03440.03010.01890.0258
C160.04430.01000.03010.01670.02280.01760.03500.01330.04480.12980.02660.12780.02660.04070.01940.00650.02230.01400.01080.01300.0190
C170.23890.06060.14470.10360.06000.09830.12100.17540.13600.22890.24810.18790.14200.14950.04100.01370.11100.21780.22660.07960.2373
C180.06910.14910.07230.07080.06640.05620.06880.05310.06290.07330.08390.05150.18700.21010.01510.00510.06330.06780.18710.04760.1753
C190.07280.03360.06610.06330.04760.05170.06030.03560.06870.16450.07760.04610.16360.18500.02590.00860.05800.04700.05430.04140.1573
C200.05910.02550.04130.03700.04250.03860.06030.02460.04790.04100.04090.14730.04050.16930.00990.00330.03650.13740.03460.02120.0435
C210.11030.06450.21550.10750.04600.09090.09840.08050.20600.11930.24250.08270.12470.14250.03150.01050.19960.20390.31360.17520.1369
Table A4. The total influence matrix of the criteria (TB).
B1B2B3B4B5
B10.11000.32470.05290.01510.0151
B20.38510.13650.18500.05290.0529
B30.47570.30580.18930.33980.3398
B40.22650.09010.17750.05070.0507
B50.13590.08740.33980.09710.0971

Appendix C

Figure A1. A comparison of values of the candidate sites in each cluster for the DBSCAN, HDBSCAN, and OPTICS.
Ijgi 10 00403 g0a1

Appendix D

Table A5. “Construction Standard of MSW Landfill Disposal Engineering Project”. The landfill is divided into four levels according to the area of the landfill. The smaller the area, the higher the level, and the lower the amount of MSW to be disposed.
LandfillIIIIIIIV
Area (Km2)>125–122–51–2
Amount of MSW (tons/day)>1200500–1200200–500<200

Appendix E

Figure A2. The left figure shows a comparison of the values of WASPAS for the candidate sites in each scenario. The right figure shows a comparison of the values of MOORA for the candidate sites in each scenario.
Ijgi 10 00403 g0a2

References

  1. Soltani, A.; Hewage, K.; Reza, B.; Sadiq, R. Multiple stakeholders in multi-criteria decision-making in the context of Municipal Solid Waste Management: A review. Waste Manag. 2015, 35, 318–328. [Google Scholar] [CrossRef] [PubMed]
  2. Kamdar, I.; Ali, S.; Bennui, A.; Techato, K.; Jutidamrongphan, W. Municipal solid waste landfill siting using an integrated GIS-AHP approach: A case study from Songkhla, Thailand. Resour. Conserv. Recycl. 2019, 149, 220–235. [Google Scholar] [CrossRef]
  3. Khan, M.M.-U.-H.; Vaezi, M.; Kumar, A. Optimal siting of solid waste-to-value-added facilities through a GIS-based assessment. Sci. Total Environ. 2018, 610, 1065–1075. [Google Scholar] [CrossRef]
  4. Hanine, M.; Boutkhoum, O.; Tikniouine, A.; Agouti, T. Comparison of fuzzy AHP and fuzzy TODIM methods for landfill location selection. Springerplus 2016, 5. [Google Scholar] [CrossRef] [PubMed] [Green Version]
  5. Zhang, T.; Shi, J.; Qian, X.; Ai, Y. Temperature and Gas Pressure Monitoring and Leachate Pumping Tests in a Newly Filled MSW Layer of a Landfill. Int. J. Environ. Res. 2019, 13, 1–19. [Google Scholar] [CrossRef]
  6. Krcmar, D.; Tenodi, S.; Grba, N.; Kerkez, D.; Watson, M.; Roncevic, S.; Dalmacija, B. Preremedial assessment of themunicipal landfill pollution impact on soil and shallow groundwater in Subotica, Serbia. Sci. Total Environ. 2018, 615, 1341–1354. [Google Scholar] [CrossRef]
  7. Chabuk, A.; Al-Ansari, N.; Hussain, H.M.; Knutsson, S.; Pusch, R. Landfill site selection using geographic information system and analytical hierarchy process: A case study Al-Hillah Qadhaa, Babylon, Iraq. Waste Manag. Res. 2016, 34, 427–437. [Google Scholar] [CrossRef]
  8. Asefi, H.; Zhang, Y.; Lim, S.; Maghrebi, M.; Shahparvari, S. A multi-criteria decision support framework for municipal solid waste landfill siting: A case study of New South Wales (Australia). Environ. Monit. Assess. 2020, 192. [Google Scholar] [CrossRef]
  9. Bahrani, S.; Ebadi, T.; Ehsani, H.; Yousefi, H.; Maknoon, R. Modeling landfill site selection by multi-criteria decision making and fuzzy functions in GIS, case study: Shabestar, Iran. Environ. Earth Sci. 2016, 75. [Google Scholar] [CrossRef]
  10. Chamchali, M.M.; Ghazifard, A. The use of fuzzy logic spatial modeling via GIS for landfill site selection (case study: Rudbar-Iran). Environ. Earth Sci. 2019, 78. [Google Scholar] [CrossRef]
  11. Gbanie, S.P.; Tengbe, P.B.; Momoh, J.S.; Medo, J.; Kabba, V.T.S. Modelling landfill location using Geographic Information Systems (GIS) and Multi-Criteria Decision Analysis (MCDA): Case study Bo, Southern Sierra Leone. Appl. Geogr. 2013, 36, 3–12. [Google Scholar] [CrossRef]
  12. Gorsevski, P.V.; Donevska, K.R.; Mitrovski, C.D.; Frizado, J.P. Integrating multi-criteria evaluation techniques with geographic information systems for landfill site selection: A case study using ordered weighted average. Waste Manag. 2012, 32, 287–296. [Google Scholar] [CrossRef] [PubMed]
  13. Beskese, A.; Demir, H.H.; Ozcan, H.K.; Okten, H.E. Landfill site selection using fuzzy AHP and fuzzy TOPSIS: A case study for Istanbul. Environ. Earth Sci. 2015, 73, 3513–3521. [Google Scholar] [CrossRef]
  14. Wu, Y.; He, F.; Zhou, J.; Wu, C.; Liu, F.; Tao, Y.; Xu, C. Optimal site selection for distributed wind power coupled hydrogen storage project using a geographical information system based multi-criteria decision-making approach: A case in China. J. Clean. Prod. 2021, 299. [Google Scholar] [CrossRef]
  15. Torkayesh, A.E.; Zolfani, S.H.; Kahvand, M.; Khazaelpour, P. Landfill location selection for healthcare waste of urban areas using hybrid BWM-grey MARCOS model based on GIS. Sustain. Cities Soc. 2021, 67. [Google Scholar] [CrossRef]
  16. Mahmood, K.; Batool, S.A.; Chaudhary, M.N.; Ul-Haq, Z. Ranking criteria for assessment of municipal solid waste dumping sites. Arch. Environ. Prot. 2017, 43, 95–105. [Google Scholar] [CrossRef]
  17. Demesouka, O.E.; Vavatsikos, A.P.; Anagnostopoulos, K.P. Suitability analysis for siting MSW landfills and its multicriteria spatial decision support system: Method, implementation and case study. Waste Manag. 2013, 33, 1190–1206. [Google Scholar] [CrossRef]
  18. Spigolon, L.M.G.; Giannotti, M.; Larocca, A.P.; Russo, M.A.T.; Souza, N.D. Landfill siting based on optimisation, multiple decision analysis, and geographic information system analyses. Waste Manag. Res. 2018, 36, 606–615. [Google Scholar] [CrossRef] [PubMed]
  19. Aksoy, E.; San, B.T. Geographical information systems (GIS) and Multi-Criteria Decision Analysis (MCDA) integration for sustainable landfill site selection considering dynamic data source. Bull. Eng. Geol. Environ. 2019, 78, 779–791. [Google Scholar] [CrossRef]
  20. Hossaini, N.; Reza, B.; Akhtar, S.; Sadiq, R.; Hewage, K. AHP based life cycle sustainability assessment (LCSA) framework: A case study of six storey wood frame and concrete frame buildings in Vancouver. J. Environ. Plan. Manag. 2015, 58, 1217–1241. [Google Scholar] [CrossRef]
  21. Daneshfar, M.A.; Ardjmand, M. A new approach in the optimal site selection of landfills for drilling cuttings from petroleum and gas fields. Chemosphere 2021, 270, 129402. [Google Scholar] [CrossRef]
  22. Liu, H.; Long, H.; Li, X. Identification of critical factors in construction and demolition waste recycling by the grey-DEMATEL approach: A Chinese perspective. Environ. Sci. Pollut. Res. 2020, 27, 8507–8525. [Google Scholar] [CrossRef] [PubMed]
  23. Feyz, S.; Khanmohammadi, M.; Abedinzadeh, N.; Aalipour, M. Multi-criteria decision analysis FANP based on GIS for siting municipal solid waste incineration power plant in the north of Iran. Sust. Cities Soc. 2019, 47, 12. [Google Scholar] [CrossRef]
  24. Rezaeisabzevar, Y.; Bazargan, A.; Zohourian, B. Landfill site selection using multi criteria decision making: Influential factors for comparing locations. J. Environ. Sci. 2020, 93, 170–184. [Google Scholar] [CrossRef] [PubMed]
  25. Karimi, H.; Amiri, S.; Huang, J.; Karimi, A. Integrating GIS and multi-criteria decision analysis for landfill site selection, case study: Javanrood County in Iran. Int. J. Environ. Sci. Technol. 2019, 16, 7305–7318. [Google Scholar] [CrossRef]
  26. Ziemba, P.; Watrobski, J. Selected Issues of Rank Reversal Problem in ANP Method. In Proceedings of the Selected Issues in Experimental Economics, Miedzyzdroje, Poland, 30 November–1 December 2016; Nermend, K., Latuszynska, M., Eds.; pp. 203–225. [Google Scholar] [CrossRef]
  27. Forman, E.H.; Selly, M.A. The Analytic Hierarchy Process and Expert Choice. World Sci. Book Chapters 2001, 43–125. [Google Scholar] [CrossRef]
  28. Eghtesadifard, M.; Afkhami, P.; Bazyar, A. An integrated approach to the selection of municipal solid waste landfills through GIS, K-Means and multi-criteria decision analysis. Environ. Res. 2020, 185. [Google Scholar] [CrossRef]
  29. Isalou, A.A.; Zamani, V.; Shahmoradi, B.; Alizadeh, H. Landfill site selection using integrated fuzzy logic and analytic network process (F-ANP). Environ. Earth Sci. 2013, 68, 1745–1755. [Google Scholar] [CrossRef]
  30. Rahimi, S.; Hafezalkotob, A.; Monavari, S.M.; Hafezalkotob, A.; Rahimi, R. Sustainable landfill site selection for municipal solid waste based on a hybrid decision-making approach: Fuzzy group BWM-MULTIMOORA-GIS. J. Clean. Prod. 2020, 248. [Google Scholar] [CrossRef]
  31. Mohammadi Seif Abad, P.; Pazira, E.; Masih Abadi, M.H.; Abdinezhad, P. Application AHP-PROMETHEE Technic for Landfill Site Selection on Based Assessment of Aquifers Vulnerability to Pollution. Iran. J. Sci. Technol. Trans. Civ. Eng. 2021. [Google Scholar] [CrossRef]
  32. Hariz, H.A.; Donmez, C.C.; Sennaroglu, B. Siting of a central healthcare waste incinerator using GIS-based Multi Criteria Decision Analysis. J. Clean. Prod. 2017, 166, 1031–1042. [Google Scholar] [CrossRef] [Green Version]
  33. Li, J.; Wang, Z.; Chen, L.; Lian, L.; Li, Y.; Zhao, L.; Zhou, S.; Mao, X.; Huang, T.; Gao, H.; et al. WRF-Chem simulations of ozone pollution and control strategy in petrochemical industrialized and heavily polluted Lanzhou City, Northwestern China. Sci. Total Environ. 2020, 737, 139835. [Google Scholar] [CrossRef]
  34. Jiang, Y.; Yuan, L.; Wen, H.; Zhang, Q.; Liu, L.; Wu, Y. Distribution, Composition, Sources, and Potential Ecological Risks of PAHs in the Sediments of the Lanzhou Reach of the Yellow River, China. Bull. Environ. Contam. Toxicol. 2020, 105, 613–619. [Google Scholar] [CrossRef]
  35. Liu, Y.; Hao, S.; Zhao, X.; Li, X.; Qiao, X.; Dionysiou, D.D.; Zheng, B. Distribution characteristics and health risk assessment of volatile organic compounds in the groundwater of Lanzhou City, China. Environ. Geochem. Health 2020, 42, 3609–3622. [Google Scholar] [CrossRef] [PubMed]
  36. Yang, X.; Jia, Y.; Zhang, D.; Zhang, X.; Zhang, H.; Hou, Y. Research on the anti-interference capability of the tourism environment system for the core stakeholders of semi-arid valley-type cities: Analysis based on the multi-scenario and time series diversity perspectives. Environ. Sci. Pollut. Res. 2020, 27, 40020–40040. [Google Scholar] [CrossRef]
  37. Zhao, S.; Yu, Y.; Du, Z.; Yin, D.; Yang, J.; Dong, L.; Li, P. Size-resolved carbonaceous aerosols at near surface level and the hilltop in a typical valley city, China. Atmos. Pollut. Res. 2020, 11, 129–140. [Google Scholar] [CrossRef]
  38. Juang, C.H.; Dijkstra, T.; Wasowski, J.; Meng, X. Loess geohazards research in China: Advances and challenges for mega engineering projects. Eng. Geol. 2019, 251, 1–10. [Google Scholar] [CrossRef]
  39. He, S.; Wang, X.; Dong, J.; Wei, B.; Duan, H.; Jiao, J.; Xie, Y. Three-Dimensional Urban Expansion Analysis of Valley-Type Cities: A Case Study of Chengguan District, Lanzhou, China. Sustainability 2019, 11, 5663. [Google Scholar] [CrossRef] [Green Version]
  40. Ahmed, F.; Ahmad, G.; Brand, T.; Zeeb, H. Key indicators for appraising adolescent sexual and reproductive health in South Asia: International expert consensus exercise using the Delphi technique. Glob. Health Action 2020, 13. [Google Scholar] [CrossRef]
  41. Karakus, C.B.; Demiroglu, D.; Coban, A.; Ulutas, A. Evaluation of GIS-based multi-criteria decision-making methods for sanitary landfill site selection: The case of Sivas city, Turkey. J. Mater. Cycles Waste Manag. 2020, 22, 254–272. [Google Scholar] [CrossRef]
  42. Ozkan, B.; Ozceylan, E.; Saricicek, I. GIS-based MCDM modeling for landfill site suitability analysis: A comprehensive review of the literature. Environ. Sci. Pollut. Res. 2019, 26, 30711–30730. [Google Scholar] [CrossRef] [PubMed]
  43. Lima, R.M.; Santos, A.H.M.; Pereira, C.R.S.; Flauzino, B.K.; Pereira, A.C.O.S.; Nogueira, F.J.H.; Valverde, J.A.R. Spatially distributed potential of landfill biogas production and electric power generation in Brazil. Waste Manag. 2018, 74, 323–334. [Google Scholar] [CrossRef] [PubMed]
  44. Asefi, H.; Zhang, Y.; Lim, S.; Maghrebi, M. An integrated approach to suitability assessment of municipal solid waste landfills in New South Wales, Australia. Australas. J. Environ. Manag. 2020, 27, 63–83. [Google Scholar] [CrossRef]
  45. Chang, B.; Chang, C.-W.; Wu, C.-H. Fuzzy DEMATEL method for developing supplier selection criteria. Expert Syst. Appl. 2011, 38, 1850–1858. [Google Scholar] [CrossRef]
  46. Afzali, A.; Sabri, S.; Rashid, M.; Samani, J.M.V.; Ludin, A.N.M. Inter-Municipal Landfill Site Selection Using Analytic Network Process. Water Resour. Manag. 2014, 28, 2179–2194. [Google Scholar] [CrossRef]
  47. Motlagh, Z.K.; Sayadi, M.H. Siting MSW landfills using MCE methodology in GIS environment (Case study: Birjand plain, Iran). Waste Manag. 2015, 46, 322–337. [Google Scholar] [CrossRef]
  48. Barakat, A.; Hilali, A.; El Baghdadi, M.; Touhami, F. Landfill site selection with GIS-based multi-criteria evaluation technique. A case study in Beni Mellal-Khouribga Region, Morocco. Environ. Earth Sci. 2017, 76. [Google Scholar] [CrossRef]
  49. Kumar, P. Optimal policies for inventory model with shortages, time-varying holding and ordering costs in trapezoidal fuzzy environment. Indep. J. Manag. Prod. 2021, 12, 557–574. [Google Scholar] [CrossRef]
  50. Kumar, K.; Chen, S.-M. Multiattribute decision making based on interval-valued intuitionistic fuzzy values, score function of connection numbers, and the set pair analysis theory. Inf. Sci. 2021, 551, 100–112. [Google Scholar] [CrossRef]
  51. Saleh, S.K.; Aliani, H.; Amoushahi, S. Application of modeling based on fuzzy logic with multi-criteria method in determining appropriate municipal landfill sites (case study: Kerman City). Arab. J. Geosci. 2020, 13. [Google Scholar] [CrossRef]
  52. Sener, E.; Sener, S. Landfill site selection using integrated fuzzy logic and analytic hierarchy process (AHP in lake basins. Arab. J. Geosci. 2020, 13. [Google Scholar] [CrossRef]
  53. Zarin, R.; Azmat, M.; Naqvi, S.R.; Saddique, Q.; Ullah, S. Landfill site selection by integrating fuzzy logic, AHP, and WLC method based on multi-criteria decision analysis. Environ. Sci. Pollut. Res. 2021. [Google Scholar] [CrossRef]
  54. Gui, Z.; Peng, D.; Wu, H.; Long, X. MSGC: Multi-scale grid clustering by fusing analytical granularity and visual cognition for detecting hierarchical spatial patterns. Future Gener. Comput. Syst. Int. J. Escience 2020, 112, 1038–1056. [Google Scholar] [CrossRef]
  55. Hu, S.; He, Z.; Wu, L.; Yin, L.; Xu, Y.; Cui, H. A framework for extracting urban functional regions based on multiprototype word embeddings using points-of-interest data. Comput. Environ. Urban Syst. 2020, 80. [Google Scholar] [CrossRef]
  56. Breunig, M.M.; Kriegel, H.-P.; Sander, J. Fast Hierarchical Clustering Based on Compressed Data and OPTICS. Lect. Notes Comput. Sci. 2000, 1910, 232–242. [Google Scholar]
  57. Zavadskas, E.K.; Turskis, Z.; Antucheviciene, J.; Zakarevicius, A. Optimization of Weighted Aggregated Sum Product Assessment. Elektron. Ir Elektrotechnika 2012, 122, 3–6. [Google Scholar] [CrossRef]
  58. Brauers, W.K.M.; Zavadskas, E.K. The MOORA method and its application to privatization in a transition economy. Control Cybern. 2006, 35, 445–469. [Google Scholar]
  59. Pamucar, D.; Bozanic, D.; Lukovac, V.; Komazec, N. Normalized Weighted Geometric Bonferroni Mean Operator of Interval Rough Numbers—Application in Interval Rough Dematel-Copras Model. Facta Univ. Ser. Mech. Eng. 2018, 16, 171–191. [Google Scholar] [CrossRef]
  60. Rashid, T.; Beg, I.; Husnine, S.M. Robot selection by using generalized interval-valued fuzzy numbers with TOPSIS. Appl. Soft Comput. 2014, 21, 462–468. [Google Scholar] [CrossRef]
  61. Przydatek, G.; Kanownik, W. Impact of small municipal solid waste landfill on groundwater quality. Environ. Monit. Assess. 2019, 191. [Google Scholar] [CrossRef] [Green Version]
  62. Sener, S.; Sener, E.; Karaguzel, R. Solid waste disposal site selection with GIS and AHP methodology: A case study in Senirkent-Uluborlu (Isparta) Basin, Turkey. Environ. Monit. Assess. 2011, 173, 533–554. [Google Scholar] [CrossRef]
  63. Eskandari, M.; Homaee, M.; Mahmodi, S. An integrated multi criteria approach for landfill siting in a conflicting environmental, economical and socio-cultural area. Waste Manag. 2012, 32, 1528–1538. [Google Scholar] [CrossRef]
  64. Sener, S.; Sener, E.; Nas, B.; Karaguzel, R. Combining AHP with GIS for landfill site selection: A case study in the Lake Beysehir catchment area (Konya, Turkey). Waste Manag. 2010, 30, 2037–2046. [Google Scholar] [CrossRef] [PubMed]
  65. Soroudi, M.; Omrani, G.; Moataar, F.; Jozi, S.A. Modelling an Integrated Fuzzy Logic and Multi-Criteria Approach for Land Capability Assessment for Optimized Municipal Solid Waste Landfill Siting Yeast. Pol. J. Environ. Stud. 2018, 27, 313–323. [Google Scholar] [CrossRef]
  66. Kara, C.; Doratli, N. Application of GIS/AHP in siting sanitary landfill: A case study in Northern Cyprus. Waste Manag. Res. 2012, 30, 966–980. [Google Scholar] [CrossRef] [PubMed]
  67. Sureshkumar, M.; Sivakumar, R.; Nagarajan, M. Selection of Alternative Landfill site in Kanchipuram, India by Using Gis and Multicriteria Decision Analysis. Appl. Ecol. Environ. Res. 2017, 15, 627–636. [Google Scholar] [CrossRef]
  68. Uyan, M. MSW landfill site selection by combining AHP with GIS for Konya, Turkey. Environ. Earth Sci. 2014, 71, 1629–1639. [Google Scholar] [CrossRef]
  69. Wang, G.; Qin, L.; Li, G.; Chen, L. Landfill site selection using spatial information technologies and AHP: A case study in Beijing, China. J. Environ. Manag. 2009, 90, 2414–2421. [Google Scholar] [CrossRef]
  70. Augusto, P.A.; Castelo-Grande, T.; Merchan, L.; Estevez, A.M.; Quintero, X.; Barbosa, D. Landfill leachate treatment by sorption in magnetic particles: Preliminary study. Sci. Total Environ. 2019, 648, 636–668. [Google Scholar] [CrossRef]
  71. Aksoy, E.; San, B.T. Using MCDA and GIS for Landfill Site Selection: Central Districts of Antalya Province. In Proceedings of the XXIII Isprs Congress, Commission Ii, Prague, Czech Republic, 12–19 July 2016; Halounova, L., Li, S., Safar, V., Tomkova, M., Rapant, P., Brazdil, K., Shi, W., Anton, F., Liu, Y., Stein, A., et al., Eds.; Volume 41, pp. 151–157. [Google Scholar]
  72. Alavi, N.; Goudarzi, G.; Babaei, A.A.; Jaafarzadeh, N.; Hosseinzadeh, M. Municipal solid waste landfill site selection with geographic information systems and analytical hierarchy process: A case study in Mahshahr County, Iran. Waste Manag. Res. 2013, 31, 98–105. [Google Scholar] [CrossRef]
  73. Farahbakhsh, A.; Forghani, M.A. Sustainable location and route planning with GIS for waste sorting centers, case study: Kerman, Iran. Waste Manag. Res. 2019, 37, 287–300. [Google Scholar] [CrossRef] [PubMed]
  74. Aracil, C.; Haro, P.; Fuentes-Cano, D.; Gomez-Barea, A. Implementation of waste-to-energy options in landfill-dominated countries: Economic evaluation and GHG impact. Waste Manag. 2018, 76, 443–456. [Google Scholar] [CrossRef] [PubMed]
Figure 1. Elevation of the study region. Lanzhou includes five districts (Honggu, Xigu, Anning, Qilihe, and Chengguan), and three counties (Yongdeng, Gaolan, and Yuzhong).
Ijgi 10 00403 g001
Figure 2. Flowchart of the proposed methodology, including four main steps: determine evaluation criteria, calculate weight, identify candidate sites, and validation.
Ijgi 10 00403 g002
Figure 3. 21 Criteria included (a) groundwater depth, (b) groundwater quality, (c) groundwater richness, (d) distance from faults, (e) distance from earthquake points, (f) elevation, (g) slope, (h) soil type, (i) NDVI, (j) landform type, (k) distance from surface water, (l) distance from roads, (m) land use type, (n) distance from settlements, (o) precipitation, (p) temperature, (q) ecosystem service value, (r) population density, (s) GDP, (t) distance from airports, (u) distance from protected areas.
Ijgi 10 00403 g003aIjgi 10 00403 g003b
Figure 4. Site selection of MSW landfills in Lanzhou. The red areas were the most suitable landfill sites, with a total of 11 candidate sites selected.
Ijgi 10 00403 g004
Table 1. M(R + C), N(R − C) and weights for criterion and sub-criterion.
Criterion(R + C)(R − C)Sub-Criterion(R + C)(R − C)Weight
Hydrogeological B11.85113269−0.81553398Groundwater depth C16.105927530.372946370.0710
Groundwater quality C23.448702360.680601810.0416
Groundwater richness C35.579129300.486380540.0642
Distance from faults C44.923643580.528146450.0582
Distance from earthquake points C53.380805340.381080870.0398
Morphological B21.75674218−0.13214671Elevation C64.553695930.329103530.0530
Slope C75.472458000.112328910.0616
Soil type C84.258698700.173049750.0432
NDVI C94.59700315−0.909001320.0380
Landform type C104.39911408−0.735930010.0380
Environmental B32.594929880.70604099Distance from surface water C116.592282840.165690810.0758
Distance from roads C124.695657000.079778610.0523
Land use type C135.04036583−0.199662980.0531
Distance from settlements C145.88668717−0.486825370.0586
Climatic B41.151024810.0399137Precipitation C152.093999720.467216540.0214
Temperature C161.295498290.086570560.0142
Socio-economic B51.312837110.2017260Ecosystem service value C175.670306780.380129550.0641
Population density C184.31250111−0.640843100.0382
GDP C193.74464030−0.686760100.0325
Distance from airports C202.90147204−0.696254770.0234
Distance from protected areas C215.504919680.112253350.0579
Table 2. Fuzzy membership function.
Fuzzy Membership FunctionFigureFormula
S-shapeS-shape
(increasing)
Ijgi 10 00403 i001 μ i = { 0 x i a 2 ( x i a b a ) 2 a < x i < b 1 x i b
S-shape
(general)
Ijgi 10 00403 i002 μ i = { 0 x i a   2 ( x i a m a ) 2 a < x i m 2 ( x i b b m ) 2 m < x i < b 0 x i b
S-shape
(decreasing)
Ijgi 10 00403 i003 μ i = { 1 x i a 2 ( x i b b a ) 2 a < x i < b 0 x i b
S-shape
(individual)
Ijgi 10 00403 i004 μ i = { 2 ( x i a a ) 2 x i a 2 ( x i b b a ) 2 a < x i < b 0 x i b
Triangular shapeTriangular shape
(general)
Ijgi 10 00403 i005 μ i = { 0 x i a   x i a m a a < x i m b x i b m m < x i < b 0 x i b
Gamma shapeGamma shape
(increasing)
Ijgi 10 00403 i006 μ i = { 0 x i a b x i b a a < x i < b 1 x i b
Table 3. Candidate site latitude, longitude, area, and MSW disposal capacity. S-1 and S-2 had the highest MSW disposal capacities, S-4, S-6, and S-10 had the lowest MSW disposal capacities.
Country/
District
Candidate SiteLongitudeLatitudeArea (Km2)Amount of MSW
(Tons/Day)
YongdengS-3103°31′25″ E36°47′43″ N40.3>1200
S-5103°33′12″ E36°30′37″ N29.9>1200
S-7103°37′14″ E36°20′52″ N28.2>1200
S-8103°25′47″ E36°33′12″ N27.6>1200
GaolanS-1103°58′40″ E36°29′14″ N41.4>1200
S-4103°53′15″ E36°39′55″ N27.7>1200
S-6103°48′19″ E36°32′35″ N15.3>1200
YuzhongS-2104°27′50″ E36°22′56″ N35.5>1200
HongguS-9103°12′11″ E36°10′58″ N9.8500–1200
XiguS-10103°27′46″ E36°11′14″ N3.7200–500
AnningS-11103°37′05″ E36°08′37″ N2.6200–500
Table 4. Ranking of candidate sites through WASPAS, MOORA, COPRAS, and TOPSIS.
S-1S-2S-3S-4S-5S-6S-7S-8S-9S-10S-11
WASPASQi0.8020.7950.5280.7550.6020.6700.5940.5690.7350.5530.486
Rank1210365794811
MOORAQi0.2560.2430.0990.2170.1330.1520.1310.1180.1890.1170.058
Rank1210375684911
COPRASQi0.2190.2030.1110.1850.1390.1510.1380.1210.1700.1260.102
Rank1210365794811
TOPSISQi0.4260.4320.2400.4080.2890.3210.2990.2660.3730.2650.213
Rank1210375684911
Table 5. Weighting scenarios and Spearman’s correlation coefficient values of WASPAS, MOORA, COPRAS, and TOPSIS.
ScenarioScenario DescriptionSpearman’s Correlation Coefficient
WASPASMOORACOPRASTOPSIS
1original weight 1111
2The weight of the first-ranking is substituted with the second-ranking1111
3The weight of the first-ranking is substituted with the third-ranking1111
4The weight of the first-ranking is substituted with the fourth-ranking0.94280.88570.94280.8857
5The weight of the second-ranking is substituted with the third-ranking1111
6The weight of the second-ranking is substituted with the fourth-ranking0.94280.94280.94280.9428
7Omitting the first-ranking criterion0.88570.94280.88570.9428
8Omitting the second-ranking criterion1111
9Omitting the third-ranking criterion1111
10Increasing the first-ranking weight by 5%1111
11Decreasing the first-ranking weight by 5%1111
12Increasing the second-ranking weight by 5%1111
13Decreasing the second-ranking weight by 5%1111
Publisher’s Note: MDPI stays neutral with regard to jurisdictional claims in published maps and institutional affiliations.

